Embed Size (px)
Citation preview

The Practice of CloudSystem Administration
Volume 2

This page intentionally left blank

The Practice of CloudSystem Administration
Designing and OperatingLarge Distributed Systems
Volume 2
Thomas A. LimoncelliStrata R. Chalup
Christina J. Hogan
Upper Saddle River, NJ • Boston • Indianapolis • San Francisco
New York • Toronto • Montreal • London • Munich • Paris • Madrid
Capetown • Sydney • Tokyo • Singapore • Mexico City

Many of the designations used by manufacturers and sellers to distinguish their products are claimedas trademarks. Where those designations appear in this book, and the publisher was aware of a trade-mark claim, the designations have been printed with initial capital letters or in all capitals.
The authors and publisher have taken care in the preparation of this book, but make no expressedor implied warranty of any kind and assume no responsibility for errors or omissions. No liability isassumed for incidental or consequential damages in connection with or arising out of the use of theinformation or programs contained herein.
For information about buying this title in bulk quantities, or for special sales opportunities (which mayinclude electronic versions; custom cover designs; and content particular to your business, traininggoals, marketing focus, or branding interests), please contact our corporate sales department at [email protected] or (800) 382-3419.
For government sales inquiries, please contact [email protected].
For questions about sales outside the United States, please contact [email protected].
Visit us on the Web: informit.com/aw
Library of Congress Cataloging-in-Publication DataLimoncelli, Tom.
The practice of cloud system administration : designing and operating large distributed systems /Thomas A. Limoncelli, Strata R. Chalup, Christina J. Hogan.
volumes cmIncludes bibliographical references and index.ISBN-13: 978-0-321-94318-7 (volume 2 : paperback)ISBN-10: 0-321-94318-X (volume 2 : paperback)
1. Computer networks—Management. 2. Computer systems. 3. Cloud computing. 4. Electronic dataprocessing—Distributed processing. I. Chalup, Strata R. II. Hogan, Christina J. III. Title.
TK5105.5.L529 2015004.67’82068—dc23 2014024033
Copyright © 2015 Thomas A. Limoncelli, Virtual.NET Inc., Christina J. Lear née Hogan
All rights reserved. Printed in the United States of America. This publication is protected by copyright,and permission must be obtained from the publisher prior to any prohibited reproduction, storage in aretrieval system, or transmission in any form or by any means, electronic, mechanical, photocopying,recording, or likewise. To obtain permission to use material from this work, please submit a writtenrequest to Pearson Education, Inc., Permissions Department, One Lake Street, Upper Saddle River, NewJersey 07458, or you may fax your request to (201) 236-3290.
ISBN-13: 978-0-321-94318-7ISBN-10: 0-321-94318-XText printed in the United States on recycled paper at RR Donnelley in Crawfordsville, Indiana.First printing, September 2014

Contents at a Glance
Contents vii
Preface xxiii
About the Authors xxix
Introduction 1
Part I Design: Building It 7Chapter 1 Designing in a Distributed World 9Chapter 2 Designing for Operations 31Chapter 3 Selecting a Service Platform 51Chapter 4 Application Architectures 69Chapter 5 Design Patterns for Scaling 95Chapter 6 Design Patterns for Resiliency 119
Part II Operations: Running It 145Chapter 7 Operations in a Distributed World 147Chapter 8 DevOps Culture 171Chapter 9 Service Delivery: The Build Phase 195Chapter 10 Service Delivery: The Deployment Phase 211Chapter 11 Upgrading Live Services 225Chapter 12 Automation 243Chapter 13 Design Documents 275Chapter 14 Oncall 285Chapter 15 Disaster Preparedness 307Chapter 16 Monitoring Fundamentals 331
v

vi Contents at a Glance
Chapter 17 Monitoring Architecture and Practice 345Chapter 18 Capacity Planning 365Chapter 19 Creating KPIs 387Chapter 20 Operational Excellence 401Epilogue 417
Part III Appendices 419
Appendix A Assessments 421
Appendix B The Origins and Future of Distributed Computingand Clouds 451
Appendix C Scaling Terminology and Concepts 475
Appendix D Templates and Examples 481
Appendix E Recommended Reading 487
Bibliography 491
Index 499

Contents
Preface xxiii
About the Authors xxix
Introduction 1
Part I Design: Building It 7
1 Designing in a Distributed World 9
1.1 Visibility at Scale 10
1.2 The Importance of Simplicity 11
1.3 Composition 12
1.3.1 Load Balancer with Multiple Backend Replicas 12
1.3.2 Server with Multiple Backends 14
1.3.3 Server Tree 16
1.4 Distributed State 17
1.5 The CAP Principle 21
1.5.1 Consistency 21
1.5.2 Availability 21
1.5.3 Partition Tolerance 22
1.6 Loosely Coupled Systems 24
1.7 Speed 26
1.8 Summary 29
Exercises 30
vii

viii Contents
2 Designing for Operations 31
2.1 Operational Requirements 31
2.1.1 Configuration 33
2.1.2 Startup and Shutdown 34
2.1.3 Queue Draining 35
2.1.4 Software Upgrades 36
2.1.5 Backups and Restores 36
2.1.6 Redundancy 37
2.1.7 Replicated Databases 37
2.1.8 Hot Swaps 38
2.1.9 Toggles for Individual Features 39
2.1.10 Graceful Degradation 39
2.1.11 Access Controls and Rate Limits 40
2.1.12 Data Import Controls 41
2.1.13 Monitoring 42
2.1.14 Auditing 42
2.1.15 Debug Instrumentation 43
2.1.16 Exception Collection 43
2.1.17 Documentation for Operations 44
2.2 Implementing Design for Operations 45
2.2.1 Build Features in from the Beginning 45
2.2.2 Request Features as They Are Identified 46
2.2.3 Write the Features Yourself 47
2.2.4 Work with a Third-Party Vendor 48
2.3 Improving the Model 48
2.4 Summary 49
Exercises 50
3 Selecting a Service Platform 51
3.1 Level of Service Abstraction 52
3.1.1 Infrastructure as a Service 52
3.1.2 Platform as a Service 54
3.1.3 Software as a Service 55
3.2 Type of Machine 56
3.2.1 Physical Machines 57
3.2.2 Virtual Machines 57
3.2.3 Containers 60

Contents ix
3.3 Level of Resource Sharing 62
3.3.1 Compliance 63
3.3.2 Privacy 63
3.3.3 Cost 63
3.3.4 Control 64
3.4 Colocation 65
3.5 Selection Strategies 66
3.6 Summary 68
Exercises 68
4 Application Architectures 69
4.1 Single-Machine Web Server 70
4.2 Three-Tier Web Service 71
4.2.1 Load Balancer Types 72
4.2.2 Load Balancing Methods 74
4.2.3 Load Balancing with Shared State 75
4.2.4 User Identity 76
4.2.5 Scaling 76
4.3 Four-Tier Web Service 77
4.3.1 Frontends 78
4.3.2 Application Servers 79
4.3.3 Configuration Options 80
4.4 Reverse Proxy Service 80
4.5 Cloud-Scale Service 80
4.5.1 Global Load Balancer 81
4.5.2 Global Load Balancing Methods 82
4.5.3 Global Load Balancing with User-Specific Data 82
4.5.4 Internal Backbone 83
4.6 Message Bus Architectures 85
4.6.1 Message Bus Designs 86
4.6.2 Message Bus Reliability 87
4.6.3 Example 1: Link-Shortening Site 87
4.6.4 Example 2: Employee Human Resources Data Updates 89
4.7 Service-Oriented Architecture 90
4.7.1 Flexibility 91
4.7.2 Support 91
4.7.3 Best Practices 91
x Contents
4.8 Summary 92
Exercises 93
5 Design Patterns for Scaling 95
5.1 General Strategy 96
5.1.1 Identify Bottlenecks 96
5.1.2 Reengineer Components 97
5.1.3 Measure Results 97
5.1.4 Be Proactive 97
5.2 Scaling Up 98
5.3 The AKF Scaling Cube 99
5.3.1 x: Horizontal Duplication 99
5.3.2 y: Functional or Service Splits 101
5.3.3 z: Lookup-Oriented Split 102
5.3.4 Combinations 104
5.4 Caching 104
5.4.1 Cache Effectiveness 105
5.4.2 Cache Placement 106
5.4.3 Cache Persistence 106
5.4.4 Cache Replacement Algorithms 107
5.4.5 Cache Entry Invalidation 108
5.4.6 Cache Size 109
5.5 Data Sharding 110
5.6 Threading 112
5.7 Queueing 113
5.7.1 Benefits 113
5.7.2 Variations 113
5.8 Content Delivery Networks 114
5.9 Summary 116
Exercises 116
6 Design Patterns for Resiliency 119
6.1 Software Resiliency Beats Hardware Reliability 120
6.2 Everything Malfunctions Eventually 121
6.2.1 MTBF in Distributed Systems 121
6.2.2 The Traditional Approach 122
6.2.3 The Distributed Computing Approach 123

Contents xi
6.3 Resiliency through Spare Capacity 124
6.3.1 How Much Spare Capacity 125
6.3.2 Load Sharing versus Hot Spares 126
6.4 Failure Domains 126
6.5 Software Failures 128
6.5.1 Software Crashes 128
6.5.2 Software Hangs 129
6.5.3 Query of Death 130
6.6 Physical Failures 131
6.6.1 Parts and Components 131
6.6.2 Machines 134
6.6.3 Load Balancers 134
6.6.4 Racks 136
6.6.5 Datacenters 137
6.7 Overload Failures 138
6.7.1 Traffic Surges 138
6.7.2 DoS and DDoS Attacks 140
6.7.3 Scraping Attacks 140
6.8 Human Error 141
6.9 Summary 142
Exercises 143
Part II Operations: Running It 145
7 Operations in a Distributed World 147
7.1 Distributed Systems Operations 148
7.1.1 SRE versus Traditional Enterprise IT 148
7.1.2 Change versus Stability 149
7.1.3 Defining SRE 151
7.1.4 Operations at Scale 152
7.2 Service Life Cycle 155
7.2.1 Service Launches 156
7.2.2 Service Decommissioning 160
7.3 Organizing Strategy for Operational Teams 160
7.3.1 Team Member Day Types 162
7.3.2 Other Strategies 165

xii Contents
7.4 Virtual Office 166
7.4.1 Communication Mechanisms 166
7.4.2 Communication Policies 167
7.5 Summary 167
Exercises 168
8 DevOps Culture 171
8.1 What Is DevOps? 172
8.1.1 The Traditional Approach 173
8.1.2 The DevOps Approach 175
8.2 The Three Ways of DevOps 176
8.2.1 The First Way: Workflow 176
8.2.2 The Second Way: Improve Feedback 177
8.2.3 The Third Way: Continual Experimentation andLearning 178
8.2.4 Small Batches Are Better 178
8.2.5 Adopting the Strategies 179
8.3 History of DevOps 180
8.3.1 Evolution 180
8.3.2 Site Reliability Engineering 181
8.4 DevOps Values and Principles 181
8.4.1 Relationships 182
8.4.2 Integration 182
8.4.3 Automation 182
8.4.4 Continuous Improvement 183
8.4.5 Common Nontechnical DevOps Practices 183
8.4.6 Common Technical DevOps Practices 184
8.4.7 Release Engineering DevOps Practices 186
8.5 Converting to DevOps 186
8.5.1 Getting Started 187
8.5.2 DevOps at the Business Level 187
8.6 Agile and Continuous Delivery 188
8.6.1 What Is Agile? 188
8.6.2 What Is Continuous Delivery? 189
8.7 Summary 192
Exercises 193
Contents xiii
9 Service Delivery: The Build Phase 195
9.1 Service Delivery Strategies 197
9.1.1 Pattern: Modern DevOps Methodology 197
9.1.2 Anti-pattern: Waterfall Methodology 199
9.2 The Virtuous Cycle of Quality 200
9.3 Build-Phase Steps 202
9.3.1 Develop 202
9.3.2 Commit 202
9.3.3 Build 203
9.3.4 Package 204
9.3.5 Register 204
9.4 Build Console 205
9.5 Continuous Integration 205
9.6 Packages as Handoff Interface 207
9.7 Summary 208
Exercises 209
10 Service Delivery: The Deployment Phase 211
10.1 Deployment-Phase Steps 211
10.1.1 Promotion 212
10.1.2 Installation 212
10.1.3 Configuration 213
10.2 Testing and Approval 214
10.2.1 Testing 215
10.2.2 Approval 216
10.3 Operations Console 217
10.4 Infrastructure Automation Strategies 217
10.4.1 Preparing Physical Machines 217
10.4.2 Preparing Virtual Machines 218
10.4.3 Installing OS and Services 219
10.5 Continuous Delivery 221
10.6 Infrastructure as Code 221
10.7 Other Platform Services 222
10.8 Summary 222
Exercises 223

xiv Contents
11 Upgrading Live Services 225
11.1 Taking the Service Down for Upgrading 225
11.2 Rolling Upgrades 226
11.3 Canary 227
11.4 Phased Roll-outs 229
11.5 Proportional Shedding 230
11.6 Blue-Green Deployment 230
11.7 Toggling Features 230
11.8 Live Schema Changes 234
11.9 Live Code Changes 236
11.10 Continuous Deployment 236
11.11 Dealing with Failed Code Pushes 239
11.12 Release Atomicity 240
11.13 Summary 241
Exercises 241
12 Automation 243
12.1 Approaches to Automation 244
12.1.1 The Left-Over Principle 245
12.1.2 The Compensatory Principle 246
12.1.3 The Complementarity Principle 247
12.1.4 Automation for System Administration 248
12.1.5 Lessons Learned 249
12.2 Tool Building versus Automation 250
12.2.1 Example: Auto Manufacturing 251
12.2.2 Example: Machine Configuration 251
12.2.3 Example: Account Creation 251
12.2.4 Tools Are Good, But Automation Is Better 252
12.3 Goals of Automation 252
12.4 Creating Automation 255
12.4.1 Making Time to Automate 256
12.4.2 Reducing Toil 257
12.4.3 Determining What to Automate First 257
12.5 How to Automate 258
12.6 Language Tools 258
12.6.1 Shell Scripting Languages 259
12.6.2 Scripting Languages 259

Contents xv
12.6.3 Compiled Languages 260
12.6.4 Configuration Management Languages 260
12.7 Software Engineering Tools and Techniques 262
12.7.1 Issue Tracking Systems 263
12.7.2 Version Control Systems 265
12.7.3 Software Packaging 266
12.7.4 Style Guides 266
12.7.5 Test-Driven Development 267
12.7.6 Code Reviews 268
12.7.7 Writing Just Enough Code 269
12.8 Multitenant Systems 270
12.9 Summary 271
Exercises 272
13 Design Documents 275
13.1 Design Documents Overview 275
13.1.1 Documenting Changes and Rationale 276
13.1.2 Documentation as a Repository of PastDecisions 276
13.2 Design Document Anatomy 277
13.3 Template 279
13.4 Document Archive 279
13.5 Review Workflows 280
13.5.1 Reviewers and Approvers 281
13.5.2 Achieving Sign-off 281
13.6 Adopting Design Documents 282
13.7 Summary 283
Exercises 284
14 Oncall 285
14.1 Designing Oncall 285
14.1.1 Start with the SLA 286
14.1.2 Oncall Roster 287
14.1.3 Onduty 288
14.1.4 Oncall Schedule Design 288
14.1.5 The Oncall Calendar 290
14.1.6 Oncall Frequency 291

xvi Contents
14.1.7 Types of Notifications 292
14.1.8 After-Hours Maintenance Coordination 294
14.2 Being Oncall 294
14.2.1 Pre-shift Responsibilities 294
14.2.2 Regular Oncall Responsibilities 294
14.2.3 Alert Responsibilities 295
14.2.4 Observe, Orient, Decide, Act (OODA) 296
14.2.5 Oncall Playbook 297
14.2.6 Third-Party Escalation 298
14.2.7 End-of-Shift Responsibilities 299
14.3 Between Oncall Shifts 299
14.3.1 Long-Term Fixes 299
14.3.2 Postmortems 300
14.4 Periodic Review of Alerts 302
14.5 Being Paged Too Much 304
14.6 Summary 305
Exercises 306
15 Disaster Preparedness 307
15.1 Mindset 308
15.1.1 Antifragile Systems 308
15.1.2 Reducing Risk 309
15.2 Individual Training: Wheel of Misfortune 311
15.3 Team Training: Fire Drills 312
15.3.1 Service Testing 313
15.3.2 Random Testing 314
15.4 Training for Organizations: Game Day/DiRT 315
15.4.1 Getting Started 316
15.4.2 Increasing Scope 317
15.4.3 Implementation and Logistics 318
15.4.4 Experiencing a DiRT Test 320
15.5 Incident Command System 323
15.5.1 How It Works: Public Safety Arena 325
15.5.2 How It Works: IT Operations Arena 326
15.5.3 Incident Action Plan 326
15.5.4 Best Practices 327
15.5.5 ICS Example 328

Contents xvii
15.6 Summary 329
Exercises 330
16 Monitoring Fundamentals 331
16.1 Overview 332
16.1.1 Uses of Monitoring 333
16.1.2 Service Management 334
16.2 Consumers of Monitoring Information 334
16.3 What to Monitor 336
16.4 Retention 338
16.5 Meta-monitoring 339
16.6 Logs 340
16.6.1 Approach 341
16.6.2 Timestamps 341
16.7 Summary 342
Exercises 342
17 Monitoring Architecture and Practice 345
17.1 Sensing and Measurement 346
17.1.1 Blackbox versus Whitebox Monitoring 346
17.1.2 Direct versus Synthesized Measurements 347
17.1.3 Rate versus Capability Monitoring 348
17.1.4 Gauges versus Counters 348
17.2 Collection 350
17.2.1 Push versus Pull 350
17.2.2 Protocol Selection 351
17.2.3 Server Component versus Agent versus Poller 352
17.2.4 Central versus Regional Collectors 352
17.3 Analysis and Computation 353
17.4 Alerting and Escalation Manager 354
17.4.1 Alerting, Escalation, and Acknowledgments 355
17.4.2 Silence versus Inhibit 356
17.5 Visualization 358
17.5.1 Percentiles 359
17.5.2 Stack Ranking 360
17.5.3 Histograms 361
17.6 Storage 362

xviii Contents
17.7 Configuration 362
17.8 Summary 363
Exercises 364
18 Capacity Planning 365
18.1 Standard Capacity Planning 366
18.1.1 Current Usage 368
18.1.2 Normal Growth 369
18.1.3 Planned Growth 369
18.1.4 Headroom 370
18.1.5 Resiliency 370
18.1.6 Timetable 371
18.2 Advanced Capacity Planning 371
18.2.1 Identifying Your Primary Resources 372
18.2.2 Knowing Your Capacity Limits 372
18.2.3 Identifying Your Core Drivers 373
18.2.4 Measuring Engagement 374
18.2.5 Analyzing the Data 375
18.2.6 Monitoring the Key Indicators 380
18.2.7 Delegating Capacity Planning 381
18.3 Resource Regression 381
18.4 Launching New Services 382
18.5 Reduce Provisioning Time 384
18.6 Summary 385
Exercises 386
19 Creating KPIs 387
19.1 What Is a KPI? 388
19.2 Creating KPIs 389
19.2.1 Step 1: Envision the Ideal 390
19.2.2 Step 2: Quantify Distance to the Ideal 390
19.2.3 Step 3: Imagine How Behavior Will Change 390
19.2.4 Step 4: Revise and Select 391
19.2.5 Step 5: Deploy the KPI 392
19.3 Example KPI: Machine Allocation 393
19.3.1 The First Pass 393

Contents xix
19.3.2 The Second Pass 394
19.3.3 Evaluating the KPI 396
19.4 Case Study: Error Budget 396
19.4.1 Conflicting Goals 396
19.4.2 A Unified Goal 397
19.4.3 Everyone Benefits 398
19.5 Summary 399
Exercises 399
20 Operational Excellence 401
20.1 What Does Operational Excellence Look Like? 401
20.2 How to Measure Greatness 402
20.3 Assessment Methodology 403
20.3.1 Operational Responsibilities 403
20.3.2 Assessment Levels 405
20.3.3 Assessment Questions and Look-For’s 407
20.4 Service Assessments 407
20.4.1 Identifying What to Assess 408
20.4.2 Assessing Each Service 408
20.4.3 Comparing Results across Services 409
20.4.4 Acting on the Results 410
20.4.5 Assessment and Project Planning Frequencies 410
20.5 Organizational Assessments 411
20.6 Levels of Improvement 412
20.7 Getting Started 413
20.8 Summary 414
Exercises 415
Epilogue 416
Part III Appendices 419
A Assessments 421
A.1 Regular Tasks (RT) 423
A.2 Emergency Response (ER) 426
A.3 Monitoring and Metrics (MM) 428

xx Contents
A.4 Capacity Planning (CP) 431
A.5 Change Management (CM) 433
A.6 New Product Introduction and Removal (NPI/NPR) 435
A.7 Service Deployment and Decommissioning (SDD) 437
A.8 Performance and Efficiency (PE) 439
A.9 Service Delivery: The Build Phase 442
A.10 Service Delivery: The Deployment Phase 444
A.11 Toil Reduction 446
A.12 Disaster Preparedness 448
B The Origins and Future of Distributed Computing and Clouds 451
B.1 The Pre-Web Era (1985–1994) 452
Availability Requirements 452
Technology 453
Scaling 454
High Availability 454
Costs 454
B.2 The First Web Era: The Bubble (1995–2000) 455
Availability Requirements 455
Technology 455
Scaling 456
High Availability 457
Costs 459
B.3 The Dot-Bomb Era (2000–2003) 459
Availability Requirements 460
Technology 460
High Availability 461
Scaling 462
Costs 464
B.4 The Second Web Era (2003–2010) 465
Availability Requirements 465
Technology 465
High Availability 466
Scaling 467
Costs 468
Contents xxi
B.5 The Cloud Computing Era (2010–present) 469
Availability Requirements 469
Costs 469
Scaling and High Availability 471
Technology 472
B.6 Conclusion 472
Exercises 473
C Scaling Terminology and Concepts 475
C.1 Constant, Linear, and Exponential Scaling 475
C.2 Big O Notation 476
C.3 Limitations of Big O Notation 478
D Templates and Examples 481
D.1 Design Document Template 481
D.2 Design Document Example 482
D.3 Sample Postmortem Template 484
E Recommended Reading 487
Bibliography 491
Index 499

This page intentionally left blank
Preface
Which of the following statements are true?
1. The most reliable systems are built using cheap, unreliable components.2. The techniques that Google uses to scale to billions of users follow the same
patterns you can use to scale a system that handles hundreds of users.3. The more risky a procedure is, the more you should do it.4. Some of themost important software features are the ones that users never see.5. You should pick random machines and power them off.6. The code for every feature Facebook will announce in the next six months is
probably in your browser already.7. Updating software multiple times a day requires little human effort.8. Being oncall doesn’t have to be a stressful, painful experience.9. You shouldn’t monitor whether machines are up.
10. Operations and management can be conducted using the scientific principlesof experimentation and evidence.
11. Google has rehearsed what it would do in case of a zombie attack.
All of these statements are true. By the time you finish reading this book, you’llknow why.
This is a book about building and running cloud-based services on a largescale: internet-based services for millions or billions of users. That said, every daymore and more enterprises are adopting these techniques. Therefore, this is a bookfor everyone.
The intended audience is system administrators and their managers. We donot assume a background in computer science, but we do assume experience withUNIX/Linux system administration, networking, and operating system concepts.
Our focus is on building and operating the services that make up the cloud,not a guide to using cloud-based services.
xxiii

xxiv Preface
Cloud services must be available, fast, and secure. At cloud scale, this is aunique engineering feat. Therefore cloud-scale services are engineered differentlythan your typical enterprise service. Being available is important because theInternet is open 24 × 7 and has users in every time zone. Being fast is importantbecause users are frustrated by slow services, so slow services lose out to fasterrivals. Being secure is important because, as caretakers of other people’s data, weare duty-bound (and legally responsible) to protect people’s data.
These requirements are intermixed. If a site is not secure, by definition, itcannot be made reliable. If a site is not fast, it is not sufficiently available. If a siteis down, by definition, it is not fast.
The most visible cloud-scale services are web sites. However, there is ahuge ecosystem of invisible internet-accessible services that are not accessed witha browser. For example, smartphone apps use API calls to access cloud-basedservices.
For the remainder of this book we will tend to use the term “distributed com-puting” rather than “cloud computing.” Cloud computing is a marketing term thatmeans different things to different people.Distributed computing describes an archi-tecture where applications and services are provided using many machines ratherthan one.
This is a book of fundamental principles and practices that are timeless.Therefore we don’t make recommendations about which specific products or tech-nologies to use. We could provide a comparison of the top five most popular webservers or NoSQL databases or continuous build systems. If we did, then this bookwould be out of date the moment it is published. Instead, we discuss the quali-ties one should look for when selecting such things. We provide a model to workfrom. This approach is intended to prepare you for a long career where technologychanges over time but you are always prepared. We will, of course, illustrate ourpoints with specific technologies and products, but not as an endorsement of thoseproducts and services.
This book is, at times, idealistic. This is deliberate.We set out to give the readera vision of how things can be, what to strive for. We are here to raise the bar.
About This BookThe book is structured in two parts, Design and Operations.
Part I captures our thinking on the design of large, complex, cloud-based dis-tributed computing systems. After the Introduction, we tackle each element ofdesign from the bottom layers to the top. We cover distributed systems from thepoint of view of a system administrator, not a computer scientist. To operate asystem, one must be able to understand its internals.

Preface xxv
Part II describes how to run such systems. The first chapters cover the mostfundamental issues. Later chapters delve into more esoteric technical activities,then high-level planning and strategy that tie together all of the above.
At the end is extra material including an assessment system for operationsteams, a highly biased history of distributed computing, templates for formsmentioned in the text, recommended reading, and other reference material.
We’re excited to present a new feature of our book series: our operationalassessment system. This system consists of a series of assessments you can useto evaluate your operations and find areas of improvement. The assessment ques-tions and “Look For” recommendations are found in Appendix A. Chapter 20 isthe instruction manual.
AcknowledgmentsThis bookwouldn’t have been possible without the help and feedback we receivedfrom our community and people all over the world. The DevOps community wasgenerous in its assistance.
First, we’d like to thank our spouses and families: Christine Polk, MikeChalup, and Eliot and Joanna Lear. Your love and patience make all this possible.
If we have seen further, it is by standing on the shoulders of giants. Certainchapters relied heavily on support and advice from particular people: John Looneyand Cian Synnott (Chapter 1); Marty Abbott and Michael Fisher (Chapter 5);Damon Edwards, Alex Honor, and Jez Humble (Chapters 9 and 10); John Allspaw(Chapter 12); Brent Chapman (Chapter 15); Caskey Dickson and Theo Schlossna-gle (Chapters 16 and 17); Arun Kejariwal and Bruce Yan (Chapter 18); BenjaminTreynor Sloss (Chapter 19); and Geoff Halprin (Chapter 20 and Appendix A).
Thanks to Gene Kim for the “strategic” inspiration and encouragement.Dozens of people helped us—some by supplying anecdotes, some by review-
ing parts of or the entire book. The only fair way to thank them all is alphabeticallyand to apologize in advance to anyone we left out: Thomas Baden, George Beech,Raymond Blum, Kyle Brandt, Mark Burgess, Nick Craver, Geoff Dalgas, RobertP. J. Day, Patrick Debois, Bill Duane, Paul Evans, David Fullerton, TomGeller, PeterGrace, Elizabeth Hamon Reid, JimHickstein, Zachary Hueras, Matt Jones, JenniferJoy, Jimmy Kaplowitz, Daniel V. Klein, Steven Levine, Cory Lueninghoener, ShaneMadden, Jim Maurer, Stephen McHenry, Dinah McNutt, Scott Hazen Mueller,Steve Murawski, Mohit Muthanna, Lenny Rachitsky, Amy Rich, Adele Shakal,Bart Silverstrim, Josh Simon, Joel Spolsky, Desiree Sylvester, Win Treese, ToddUnderwood, Nicole Forsgren Velasquez, and Dave Zwieback.
Last but not least, thanks to everyone from Addison-Wesley. In particular,thanks to Debra Williams Cauley, for guiding us to Addison-Wesley and steering

xxvi Preface
us the entire way; Michael Thurston, for editing our earliest drafts and reshapingthem to be much, much better; Kim Boedigheimer, who coordinated and assistedus calmly even when we were panicking; Lori Hughes, our LaTeX wizard; JulieNahil, our production manager; Jill Hobbs, our copyeditor; and John Fuller andMark Taub, for putting up with all our special requests!
Part I Design: Building It
Chapter 1: Designing in a Distributed WorldOverview of how distributed systems are designed.
Chapter 2: Designing for OperationsFeatures software should have to enable smooth operations.
Chapter 3: Selecting a Service PlatformPhysical and virtual machines, private and public clouds.
Chapter 4: Application ArchitecturesBuilding blocks for creating web and other applications.
Chapter 5: Design Patterns for ScalingBuilding blocks for growing a service.
Chapter 6: Design Patterns for ResiliencyBuilding blocks for creating systems that survive failure.
Part II Operations: Running It
Chapter 7: Operations in a Distributed WorldOverview of how distributed systems are run.
Chapter 8: DevOps CultureIntroduction to DevOps culture, its history and practices.
Chapter 9: Service Delivery: The Build PhaseHow a service gets built and prepared for production.
Chapter 10: Service Delivery: The Deployment PhaseHow a service is tested, approved, and put into production.
Chapter 11: Upgrading Live ServicesHow to upgrade services without downtime.
Chapter 12: AutomationCreating tools and automating operational work.
Chapter 13: Design DocumentsCommunicating designs and intentions in writing.
Chapter 14: OncallHandling exceptions.
Chapter 15: Disaster PreparednessMaking systems stronger through planning and practice.
Preface xxvii
Chapter 16: Monitoring FundamentalsMonitoring terminology and strategy.
Chapter 17: Monitoring Architecture and PracticeThe components and practice of monitoring.
Chapter 18: Capacity PlanningPlanning for and providing additional resources before we need them.
Chapter 19: Creating KPIsDriving behavior scientifically through measurement and reflection.
Chapter 20: Operational ExcellenceStrategies for constant improvement.
EpilogueSome final thoughts.
Part III Appendices
Appendix A: AssessmentsAppendix B: The Origins and Future of Distributed Computing and CloudsAppendix C: Scaling Terminology and ConceptsAppendix D: Templates and ExamplesAppendix E: Recommended ReadingBibliographyIndex

This page intentionally left blank

About the Authors
Thomas A. Limoncelli is an internationally recognized author, speaker, andsystem administrator. During his seven years at Google NYC, he was an SRE forprojects such as Blog Search, Ganeti, and various internal enterprise IT services. Henow works as an SRE at Stack Exchange, Inc., home of ServerFault.com and Stack-Overflow.com. His first paid system administration job was as a student at DrewUniversity in 1987, and he has since worked at small and large companies, includ-ing AT&T/Lucent Bell Labs. His best-known books include Time Management forSystem Administrators (O’Reilly) and The Practice of System and Network Adminis-tration, Second Edition (Addison-Wesley). His hobbies include grassroots activism,for which his work has been recognized at state and national levels. He lives inNew Jersey.
Strata R. Chalup has been leading and managing complex IT projects for manyyears, serving in roles ranging from project manager to director of operations.Strata has authored numerous articles on management and working with teamsand has applied her management skills on various volunteer boards, includingBayLISA and SAGE. She started administering VAX Ultrix and Unisys UNIX in1983 atMIT in Boston, and spent the dot-com years in Silicon Valley building inter-net services for clients like iPlanet and Palm. In 2007, she joined Tom and Christinato create the second edition of The Practice of System and Network Administration(Addison-Wesley). Her hobbies includeworkingwith new technologies, includingArduino and various 2D CAD/CAM devices, as well as being a master gardener.She lives in Santa Clara County, California.
Christina J. Hogan has twenty years of experience in system administrationand network engineering, from Silicon Valley to Italy and Switzerland. She hasgained experience in small startups, mid-sized tech companies, and large globalcorporations. She worked as a security consultant for many years and her cus-tomers included eBay, Silicon Graphics, and SystemExperts. In 2005 she and Tom
xxix

xxx About the Authors
shared the SAGE Outstanding Achievement Award for their book The Practice ofSystem and Network Administration (Addison-Wesley). She has a bachelor’s degreein mathematics, a master’s degree in computer science, a doctorate in aeronauticalengineering, and a diploma in law. She also worked for six years as an aero-dynamicist in a Formula 1 racing team and represented Ireland in the 1988 ChessOlympiad. She lives in Switzerland.

Introduction
The goal of this book is to help you build and run the best cloud-scale servicepossible. What is the ideal environment that we seek to create?
Business ObjectivesSimply stated, the end result of our ideal environment is that business objectivesare met. That may sound a little boring but actually it is quite exciting to workwhere the entire company is focused and working together on the same goals.
To achieve this, we must understand the business objectives and work back-ward to arrive at the system we should build.
Meeting business objectivesmeans knowingwhat those objectives are, havinga plan to achieve them, and working through the roadblocks along the way.
Well-defined business objectives are measurable, and such measurements canbe collected in an automated fashion. A dashboard is automatically generated soeveryone is aware of progress. This transparency enhances trust.
Here are some sample business objectives:
• Sell our products via a web site• Provide service 99.99 percent of the time• Process x million purchases per month, growing 10 percent monthly• Introduce new features twice a week• Fix major bugs within 24 hours
In our ideal environment, business and technical teams meet their objectives andproject goals predictably and reliably. Because of this, both types of teams trustthat other teams will meet their future objectives. As a result, teams can planbetter. They canmakemore aggressive plans because there is confidence that exter-nal dependencies will not fail. This permits even more aggressive planning. Suchan approach creates an upward spiral that accelerates progress throughout thecompany, benefiting everyone.
1
2 Introduction
Ideal System ArchitectureThe ideal service is built on a solid architecture. It meets the requirements of theservice today and provides an obvious path for growth as the system becomesmore popular and receives more traffic. The system is resilient to failure. Ratherthan being surprised by failures and treating them as exceptions, the architectureaccepts that hardware and software failures are a part of the physics of informationtechnology (IT). As a result, the architecture includes redundancy and resiliencyfeatures that work around failures. Components fail but the system survives.
Each subsystem that makes up our service is itself a service. All subsys-tems are programmable via an application programming interface (API). Thus,the entire system is an ecosystem of interconnected subservices. This is called aservice-oriented architecture (SOA). Because all these systems communicate overthe same underlying protocol, there is uniformity in how they are managed.Because each subservice is loosely coupled to the others, all of these services canbe independently scaled, upgraded, or replaced.
The geometry of the infrastructure is described electronically. This electronicdescription is read by IT automation systems, which then build the productionenvironment without human intervention. Because of this automation, the entireinfrastructure can be re-created elsewhere. Software engineers use the automationto make micro-versions of the environment for their personal use. Quality and testengineers use the automation to create environments for system tests.
This “infrastructure as code” can be achieved whether we use physicalmachines or virtual machines, and whether they are in datacenters we run or arehosted by a cloud provider.With virtualmachines there is an obviousAPI availablefor spinning up a new machine. However, even with physical machines, the entireflow from bare metal to working system can be automated. In our ideal world theautomation makes it possible to create environments using combinations of phys-ical and virtual machines. Developers may build the environment out of virtualmachines. The production environment might consist of a mixture of physical andvirtualmachines. The temporary and unexpected need for additional capacitymayrequire extending the production environment into one or more cloud providersfor some period of time.
Ideal Release ProcessOur ideal environment has a smooth flow of code fromdevelopment to operations.
Traditionally (not in our ideal environment) the sequence looks like this:
1. Developers check code into a repository.2. Test engineers put the code through a number of tests.
Introduction 3
3. If all the tests pass, the a release engineer builds the packages that will be usedto deploy the software. Most of the files come from the source code repos-itory, but some files may be needed from other sources such as a graphicsdepartment or documentation writers.
4. A test environment is created; without an “infrastructure as code” model, thismay take weeks.
5. The packages are deployed into a test environment.6. Test engineers perform further tests, focusing on the interaction between
subsystems.7. If all these tests succeed, the code is put into production.8. System administrators upgrade systems while looking for failures.9. If there are failures, the software is rolled back.
Doing these steps manually incurs a lot of risk, owing to the assumptions that theright people are available, that the steps are done the same way every time, thatnobody makes mistakes, and that all the tasks are completed in time.
Mistakes, bugs, and errors happen, of course—and as a result defects arepassed down the line to the next stage. When a mistake is discovered the flow ofprogress is reversed as the team members who were responsible for the previousstage are told to fix their problem. This means progress is halted and time is lost.
A typical response to a risky process is to do it as rarely as possible. Thusthere is a temptation to do as few releases as possible. The result is “mega-releases”launched only a few times a year.
However, by batching up so many changes at once, we actually create morerisk. How can we be sure thousands of changes, released simultaneously, willall work on the first try? We can’t. Therefore we become even more recalcitranttoward and fearful of making changes. Soon change becomes nearly impossibleand innovation comes to a halt.
Not so in our ideal environment.In our ideal environment, we find automation that eliminates all manual steps
in the software build, test, release, and deployment processes. The automationaccurately and consistently performs tests that prevent defects from being passedto the next step. As a consequence, the flow of progress is in one direction: forward.
Rather than mega-releases, our ideal environment creates micro-releases. Wereduce risk by doing many deployments, each with a few small changes. In fact,we might do 100 deployments per day.
1. When the developers check in code, a system detects this fact and triggers aseries of automated tests. These tests verify basic code functionality.
2. If these tests pass, the process of building the packages is kicked off and runsin a completely automated fashion.

4 Introduction
3. The successful creation of new packages triggers the creation of a test envi-ronment. Building a test environment used to be a long week of connectingcables and installing machines. But with infrastructure as code, the entireenvironment is created quickly with no human intervention.
4. When the test environment is complete, a series of automated tests are run.5. On successful completion the new packages are rolled out to production. The
roll-out is also automated but orderly and cautious.6. Certain systems are upgraded first and the system watches for failures. Since
the test environment was built with the same automation that built theproduction environment, there should be very few differences.
7. Seeing no failures, the new packages are rolled out to more and more systemsuntil the entire production environment is upgraded.
In our ideal environment all problems are caught before they reach production.That is, roll-out is not a form of testing. Failure during a roll-out to production isessentially eliminated. However, if a failure does happen, it would be considereda serious issue warranting pausing new releases from going into production untila root causes analysis is completed. Tests are added to detect and prevent futureoccurrences of this failure. Thus, the system gets stronger over time.
Because of this automation, the traditional roles of release engineering, qual-ity assurance, and deployment are practically unrecognizable from their roles at atraditional company. Hours of laborious manual toil are eliminated, leaving moretime for improving the packaging system, improving the software quality, andrefining the deployment process. In other words, people spend more time makingimprovements in how work is done rather than doing work itself.
A similar process is used for third-party software. Not all systems are home-grown or come with source code. Deploying third-party services and productsfollows a similar pattern of release, testing, deployment. However, because theseproducts and services are developed externally, they require a slightly differentprocess. New releases are likely to occur less frequently and we have less controlover what is in each new release. The kind of testing these components require isusually related to features, compatibility, and integration.
Ideal OperationsOnce the code is in production, operational objectives take precedence. The soft-ware is instrumented so that it can be monitored. Data is collected about how longit takes to process transactions from external users as well as from internal APIs.Other indicators such as memory usage are also monitored. This data is collectedso that operational decisions can be made based on data, not guesses, luck, or

Introduction 5
hope. The data is stored for many years so it may be used to predict the futurecapacity needs.
Measurements are used to detect internal problems while they are small, longbefore they result in a user-visible outage. We fix problems before they becomeoutages. An actual outage is rare and would be investigated with great diligence.When problems are detected there is a process in place to make sure they areidentified, worked on, and resolved quickly.
An automated system detects problems and alerts whoever is oncall. Ouroncall schedule is a rotation constructed so that each shift typically receives a man-ageable number of alerts. At any given time one person is the primary oncall personand is first to receive any alerts. If that individual does not respond in time, a sec-ondary person is alerted. The oncall schedule is prepared far enough in advancethat people can plan vacations, recreational activities, and personal time.
There is a “playbook” of instructions on how to handle every alert that can begenerated. Each type of alert is documented with a technical description of whatis wrong, what the business impact is, and how to fix the issue. The playbook iscontinually improved. Whoever is oncall uses the playbook to fix the problem. Ifit proves insufficient, there is a well-defined escalation path, usually to the oncallperson for the related subsystem. Developers also participate in the oncall rotationso they understand the operational pain points of the system they are building.
All failures have a corresponding countermeasure, whether it is manually orautomatically activated. Countermeasures that are activated frequently are alwaysautomated. Our monitoring system detects overuse, as this may indicate a largerproblem. The monitoring system collects internal indicator data used by engineersto reduce the failure rate as well as improve the countermeasure.
The less frequently a countermeasure is activated, the less confident we arethat it will work the next time it is needed. Therefore infrequently activated coun-termeasures are periodically and automatically exercised by intentionally causingfailures. Just as we require school children to practice fire drills so that everyoneknows what to do in an emergency, so we practice fire drills with our operationalpractices. This way our team becomes experienced at implementing the counter-measures and is confident that they work. If a database failover process doesn’twork due to an unexpected dependency, it is better to learn this during a live drillon Monday at 10 rather than during an outage at 4 on a Sunday morning.Again, we reduce risk by increasing repetition rather than shying away from it. Thetechnical term for improving something through repetition is called “practice.”Westrongly believe that practice makes perfect.
Our ideal environment scales automatically. Asmore capacity is needed, addi-tional capacity comes from internal or external cloud providers. Our dashboardsindicate when re-architecting will be a better solution than simply allocating moreRAM, disk, or CPU.

6 Introduction
Scaling down is also automatic. When the system is overloaded or degraded,we never turn users away with a “503—Service Unavailable” error. Instead, thesystem automatically switches to algorithms that use less resources. Bandwidthfully utilized? Low-bandwidth versions of the service kick in, displaying fewergraphics or a more simplified user interface. Databases become corrupted? A read-only version of the service keeps most users satisfied.
Each feature of our service can be individually enabled or disabled. If a featureturns out to have negative consequences, such as security holes or unexpectedlybad performance, it can be disabledwithout deploying a different software release.
When a feature is revised, the new code does not eliminate the oldfunctionality. The new behavior can be disabled to reveal the old behavior. This isparticularly useful when rolling out a new user interface. If a release can produceboth the old and new user interface, it can be enabled on a per-user basis. Thisenables us to get feedback from “early access” users. On the official release date,the new feature is enabled for successively larger and larger groups. If performanceproblems are found, the feature can easily be reverted or switched off entirely.
In our ideal environment there is excellent operational hygiene. Like brush-ing our teeth, we regularly do the things that preserve good operational health.We maintain clear and updated documentation for how to handle every counter-measure, process, and alert. Overactive alerts are fine-tuned, not ignored. Openbug counts are kept to a minimum. Outages are followed by the publicationof a postmortem report with recommendations on how to improve the systemin the future. Any “quick fix” is followed by a root causes analysis and theimplementation of a long-term fix.
Most importantly, the developers and operations people do not think of them-selves as two distinct teams. They are simply specializations within one largeteam. Some people write more code than others; some people do more operationalprojects than others. All share responsibility for maintaining high uptime. To thatend, all members participate in the oncall (pager) rotation. Developers are mostmotivated to improve code that affects operations when they feel the pain of oper-ations, too. Operations must understand the development process if they are to beable to constructively collaborate.
Now you know our vision of an ideal environment. The remainder of this bookwill explain how to create and run it.

This page intentionally left blank

Chapter 1
Designing in a DistributedWorld
There are two ways of constructinga software design: One way is tomake it so simple that there areobviously no deficiencies and theother way is to make it socomplicated that there are noobvious deficiencies.
—C.A.R. Hoare, The 1980 ACMTuring Award Lecture
How does Google Search work? How does your Facebook Timeline stay updatedaround the clock? How does Amazon scan an ever-growing catalog of items to tellyou that people who bought this item also bought socks?
Is it magic? No, it’s distributed computing.This chapter is an overview of what is involved in designing services that use
distributed computing techniques. These are the techniques all large web sites useto achieve their size, scale, speed, and reliability.
Distributed computing is the art of building large systems that divide theworkover many machines. Contrast this with traditional computing systems where asingle computer runs software that provides a service, or client–server computingwhere many machines remotely access a centralized service. In distributed com-puting there are typically hundreds or thousands of machines working together toprovide a large service.
Distributed computing is different from traditional computing in many ways.Most of these differences are due to the sheer size of the system itself. Hundreds orthousands of computersmay be involved.Millions of usersmay be served. Billionsand sometimes trillions of queries may be processed.
9
10 Chapter 1 Designing in a Distributed World
..
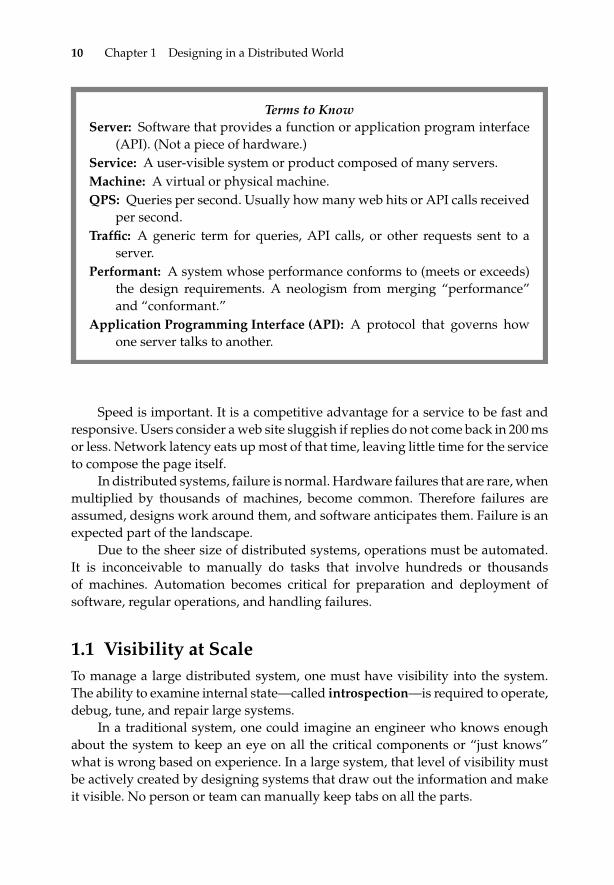
Terms to KnowServer: Software that provides a function or application program interface
(API). (Not a piece of hardware.)Service: A user-visible system or product composed of many servers.Machine: A virtual or physical machine.QPS: Queries per second. Usually howmany web hits or API calls received
per second.Traffic: A generic term for queries, API calls, or other requests sent to a
server.Performant: A system whose performance conforms to (meets or exceeds)
the design requirements. A neologism from merging “performance”and “conformant.”
Application Programming Interface (API): A protocol that governs howone server talks to another.
Speed is important. It is a competitive advantage for a service to be fast andresponsive. Users consider aweb site sluggish if replies do not come back in 200msor less. Network latency eats upmost of that time, leaving little time for the serviceto compose the page itself.
In distributed systems, failure is normal. Hardware failures that are rare, whenmultiplied by thousands of machines, become common. Therefore failures areassumed, designs work around them, and software anticipates them. Failure is anexpected part of the landscape.
Due to the sheer size of distributed systems, operations must be automated.It is inconceivable to manually do tasks that involve hundreds or thousandsof machines. Automation becomes critical for preparation and deployment ofsoftware, regular operations, and handling failures.
1.1 Visibility at ScaleTo manage a large distributed system, one must have visibility into the system.The ability to examine internal state—called introspection—is required to operate,debug, tune, and repair large systems.
In a traditional system, one could imagine an engineer who knows enoughabout the system to keep an eye on all the critical components or “just knows”what is wrong based on experience. In a large system, that level of visibility mustbe actively created by designing systems that draw out the information and makeit visible. No person or team can manually keep tabs on all the parts.

1.2 The Importance of Simplicity 11
Distributed systems, therefore, require components to generate copious logsthat detailwhat happened in the system. These logs are then aggregated to a centrallocation for collection, storage, and analysis. Systems may log information that isvery high level, such as whenever a user makes a purchase, for each web query,or for every API call. Systems may log low-level information as well, such as theparameters of every function call in a critical piece of code.
Systems should export metrics. They should count interesting events, such ashow many times a particular API was called, and make these counters accessible.
In many cases, special URLs can be used to view this internal state.For example, the Apache HTTP Web Server has a “server-status” page(http://www.example.com/server-status/).
In addition, components of distributed systems often appraise their ownhealth and make this information visible. For example, a component may havea URL that outputs whether the system is ready (OK) to receive new requests.Receiving as output anything other than the byte “O” followed by the byte “K”(including no response at all) indicates that the system does not want to receivenew requests. This information is used by load balancers to determine if theserver is healthy and ready to receive traffic. The server sends negative replieswhen the server is starting up and is still initializing, and when it is shuttingdown and is no longer accepting new requests but is processing any requeststhat are still in flight.
1.2 The Importance of SimplicityIt is important that a design remain as simple as possible while still being ableto meet the needs of the service. Systems grow and become more complexover time. Starting with a system that is already complex means starting at adisadvantage.
Providing competent operations requires holding a mental model of the sys-tem in one’s head. As we work we imagine the system operating and use thismental model to track how it works and to debug it when it doesn’t. The morecomplex the system, the more difficult it is to have an accurate mental model. Anoverly complex system results in a situation where no single person understandsit all at any one time.
In The Elements of Programming Style, Kernighan and Plauger (1978) wrote:
Debugging is twice as hard aswriting the code in the first place. Therefore, if youwritethe code as cleverly as possible, you are, by definition, not smart enough to debug it.
The same is true for distributed systems. Every minute spent simplifying a designpays off time and time again when the system is in operation.

12 Chapter 1 Designing in a Distributed World
1.3 CompositionDistributed systems are composed of many smaller systems. In this section, weexplore three fundamental composition patterns in detail:
• Load balancer with multiple backend replicas• Server with multiple backends• Server tree
1.3.1 Load Balancer with Multiple Backend ReplicasThe first composition pattern is the load balancer with multiple backend replicas.As depicted in Figure 1.1, requests are sent to the load balancer server. For eachrequest, it selects one backend and forwards the request there. The response comesback to the load balancer server, which in turn relays it to the original requester.
The backends are called replicas because they are all clones or replications ofeach other. A request sent to any replica should produce the same response.
The load balancer must always know which backends are alive and ready toaccept requests. Load balancers send health check queries dozens of times eachsecond and stop sending traffic to that backend if the health check fails. A healthcheck is a simple query that should execute quickly and return whether the systemshould receive traffic.
Picking which backend to send a query to can be simple or complex. Asimple method would be to alternate among the backends in a loop—a practicecalled round-robin. Some backends may be more powerful than others, however,
Figure 1.1: A load balancer with many replicas
1.3 Composition 13
and may be selected more often using a proportional round-robin scheme.More complex solutions include the least loaded scheme. In this approach, aload balancer tracks how loaded each backend is and always selects the leastloaded one.
Selecting the least loaded backend sounds reasonable but a naive implemen-tation can be a disaster. A backend may not show signs of being overloaded untillong after it has actually become overloaded. This problem arises because it can bedifficult to accurately measure how loaded a system is. If the load is a measure-ment of the number of connections recently sent to the server, this definition isblind to the fact that some connections may be long lasting while others may bequick. If the measurement is based on CPU utilization, this definition is blind toinput/output (I/O) overload. Often a trailing average of the last 5 minutes of loadis used. Trailing averages have a problem in that, as an average, they reflect thepast, not the present. As a consequence, a sharp, sudden increase in load will notbe reflected in the average for a while.
Imagine a load balancer with 10 backends. Each one is running at 80 percentload. A new backend is added. Because it is new, it has no load and, therefore,is the least loaded backend. A naive least loaded algorithm would send all trafficto this new backend; no traffic would be sent to the other 10 backends. All tooquickly, the new backend would become absolutely swamped. There is no way asingle backend could process the traffic previously handled by 10 backends. Theuse of trailing averages would mean the older backends would continue reportingartificially high loads for a fewminutes while the new backendwould be reportingan artificially low load.
With this scheme, the load balancer will believe that the new machine is lessloaded than all the other machines for quite some time. In such a situation themachine may become so overloaded that it would crash and reboot, or a systemadministrator trying to rectify the situation might reboot it. When it returns toservice, the cycle would start over again.
Such situations make the round-robin approach look pretty good. A less naiveleast loaded implementation would have some kind of control in place that wouldnever send more than a certain number of requests to the same machine in a row.This is called a slow start algorithm.
..
Trouble with a Naive Least Loaded Algorithm
Without slow start, load balancers have been known to cause many prob-lems. One famous example is what happened to the CNN.com web site onthe day of the September 11, 2001, terrorist attacks. So many people tried toaccessCNN.com that the backends became overloaded.One crashed, and thencrashed again after it came back up, because the naive least loaded algorithm

14 Chapter 1 Designing in a Distributed World
..
sent all traffic to it. When it was down, the other backends became overloadedand crashed. One at a time, each backend would get overloaded, crash, andbecome overloaded from again receiving all the traffic and crash again.
As a result the service was essentially unavailable as the system adminis-trators rushed to figure out what was going on. In their defense, the web wasnew enough that no one had experience with handling sudden traffic surgeslike the one encountered on September 11.
The solution CNN used was to halt all the backends and boot them atthe same time so they would all show zero load and receive equal amounts oftraffic.
The CNN team later discovered that a few days prior, a software upgradefor their load balancer had arrived but had not yet been installed. The upgradeadded a slow start mechanism.
1.3.2 Server with Multiple BackendsThe next composition pattern is a server with multiple backends. The serverreceives a request, sends queries to many backend servers, and composes the finalreply by combining those answers. This approach is typically used when the orig-inal query can easily be deconstructed into a number of independent queries thatcan be combined to form the final answer.
Figure 1.2a illustrates how a simple search engine processes a query with thehelp of multiple backends. The frontend receives the request. It relays the queryto many backend servers. The spell checker replies with information so the searchengine may suggest alternate spellings. The web and image search backends replywith a list of web sites and images related to the query. The advertisement server
Figure 1.2: This service is composed of a server and many backends.

1.3 Composition 15
replies with advertisements relevant to the query. Once the replies are received,the frontend uses this information to construct the HTML that makes up the searchresults page for the user, which is then sent as the reply.
Figure 1.2b illustrates the same architecture with replicated, load-balanced,backends. The same principle applies but the system is able to scale and survivefailures better.
This kind of composition has many advantages. The backends do their workin parallel. The reply does not have to wait for one backend process to completebefore the next begins. The system is loosely coupled. One backend can fail and thepage can still be constructed by filling in some default information or by leavingthat area blank.
This pattern also permits some rather sophisticated latencymanagement. Sup-pose this system is expected to return a result in 200ms or less. If one of thebackends is slow for some reason, the frontend doesn’t have towait for it. If it takes10ms to compose and send the resulting HTML, at 190ms the frontend can giveup on the slow backends and generate the page with the information it has. Theability to manage a latency time budget like that can be very powerful. For exam-ple, if the advertisement system is slow, search results can be displayed withoutany ads.
To be clear, the terms “frontend” and “backend” are a matter of perspective.The frontend sends requests to backends, which replywith a result. A server can beboth a frontend and a backend. In the previous example, the server is the backendto the web browser but a frontend to the spell check server.
There are many variations on this pattern. Each backend can be replicated forincreased capacity or resiliency. Caching may be done at various levels.
The term fan out refers to the fact that one query results in many new queries,one to each backend. The queries “fan out” to the individual backends and thereplies fan in as they are set up to the frontend and combined into the final result.
Any fan in situation is at risk of having congestion problems. Often smallqueries may result in large responses. Therefore a small amount of bandwidth isused to fan out but there may not be enough bandwidth to sustain the fan in. Thismay result in congested network links and overloaded servers. It is easy to engineerthe system to have the right amount of network and server capacity if the sizes ofthe queries and replies are consistent, or if there is an occasional large reply. Thedifficult situation is engineering the system when there are sudden, unpredictablebursts of large replies. Some network equipment is engineered specifically to dealwith this situation by dynamically provisioning more buffer space to such bursts.Likewise, the backends can rate-limit themselves to avoid creating the situation inthe first place. Lastly, the frontends can manage the congestion themselves by con-trolling the new queries they send out, by notifying the backends to slow down, orby implementing emergency measures to handle the flood better. The last optionis discussed in Chapter 5.

16 Chapter 1 Designing in a Distributed World
1.3.3 Server TreeThe other fundamental composition pattern is the server tree. As Figure 1.3 illus-trates, in this scheme a number of servers work cooperatively with one as the rootof the tree, parent servers below it, and leaf servers at the bottom of the tree. (Incomputer science, trees are drawn upside-down.) Typically this pattern is used toaccess a large dataset or corpus. The corpus is larger than any one machine canhold; thus each leaf stores one fraction or shard of the whole.
To query the entire dataset, the root receives the original query and forwards itto the parents. The parents forward the query to the leaf servers, which search theirparts of the corpus. Each leaf sends its findings to the parents, which sort and filterthe results before forwarding them up to the root. The root then takes the responsefrom all the parents, combines the results, and replies with the full answer.
Imagine you wanted to find out how many times George Washington wasmentioned in an encyclopedia. You could read each volume in sequence and arriveat the answer. Alternatively, you could give each volume to a different person andhave the various individuals search their volumes in parallel. The latter approachwould complete the task much faster.
Figure 1.3: A server tree

1.4 Distributed State 17
The primary benefit of this pattern is that it permits parallel searching of alarge corpus. Not only are the leaves searching their share of the corpus in parallel,but the sorting and ranking performed by the parents are also done in parallel.
For example, imagine a corpus of the text extracted from every book in theU.S. Library of Congress. This cannot fit in one computer, so instead the informa-tion is spread over hundreds or thousands of leaf machines. In addition to the leafmachines are the parents and the root. A search query would go to a root server,which in turn relays the query to all parents. Each parent repeats the query to allleaf nodes below it. Once the leaves have replied, the parent ranks and sorts theresults by relevancy.
For example, a leaf may reply that all the words of the query exist in the sameparagraph in one book, but for another book only some of the words exist (lessrelevant), or they exist but not in the same paragraph or page (even less relevant).If the query is for the best 50 answers, the parent can send the top 50 results to theroot and drop the rest. The root then receives results from each parent and selectsthe best 50 of those to construct the reply.
This scheme also permits developers to work within a latency budget. If fastanswers are more important than perfect answers, parents and roots do not haveto wait for slow replies if the latency deadline is near.
Many variations of this pattern are possible. Redundant serversmay existwitha load-balancing scheme to divide the work among them and route around failedservers. Expanding the number of leaf servers can give each leaf a smaller por-tion of the corpus to search, or each shard of corpus can be placed on multipleleaf servers to improve availability. Expanding the number of parents at each levelincreases the capacity to sort and rank results. There may be additional levels ofparent servers, making the tree taller. The additional levels permit a wider fan-out, which is important for an extremely large corpus. The parents may provide acaching function to relieve pressure on the leaf servers; in this case more levels ofparents may improve cache effectiveness. These techniques can also help mitigatecongestion problems related to fan-in, as discussed in the previous section.
1.4 Distributed StateLarge systems often store or process large amounts of state. State consists of data,such as a database, that is frequently updated. Contrast this with a corpus, whichis relatively static or is updated only periodically when a new edition is published.For example, a system that searches the U.S. Library of Congress may receive anew corpus each week. By comparison, an email system is in constant churn withnew data arriving constantly, current data being updated (email messages beingmarked as “read” or moved between folders), and data being deleted.

18 Chapter 1 Designing in a Distributed World
Distributed computing systems have many ways to deal with state. How-ever, they all involve some kind of replication and sharding, which brings aboutproblems of consistency, availability, and partitioning.
The easiest way to store state is to put it on one machine, as depicted inFigure 1.4. Unfortunately, that method reaches its limit quite quickly: an individ-ual machine can store only a limited amount of state and if the one machine dieswe lose access to 100 percent of the state. The machine has only a certain amountof processing power, which means the number of simultaneous reads and writesit can process is limited.
In distributed computing we store state by storing fractions or shards of thewhole on individual machines. This way the amount of state we can store is lim-ited only by the number of machines we can acquire. In addition, each shard isstored on multiple machines; thus a single machine failure does not lose accessto any state. Each replica can process a certain number of queries per second, sowe can design the system to process any number of simultaneous read and writerequests by increasing the number of replicas. This is illustrated in Figure 1.5,where N QPS are received and distributed among three shards, each replicatedthree ways. As a result, on average one ninth of all queries reach a particularreplica server.
Writes or requests that update state require all replicas to be updated. Whilethis update process is happening, it is possible that some clients will read fromstale replicas that have not yet been updated. Figure 1.6 illustrates how a write canbe confounded by reads to an out-of-date cache. This will be discussed further inthe next section.
In the most simple pattern, a root server receives requests to store or retrievestate. It determines which shard contains that part of the state and forwards therequest to the appropriate leaf server. The reply then flows up the tree. This lookssimilar to the server tree pattern described in the previous section but there are two
Figure 1.4: State kept in one location; not distributed computing

1.4 Distributed State 19
Figure 1.5: This distributed state is sharded and replicated.
Figure 1.6: State updates using cached data lead to an inconsistent view.

20 Chapter 1 Designing in a Distributed World
differences. First, queries go to a single leaf instead of all leaves. Second, requestscan be update (write) requests, not just read requests. Updates are more complexwhen a shard is stored on many replicas. When one shard is updated, all of thereplicas must be updated, too. This may be done by having the root update allleaves or by the leaves communicating updates among themselves.
A variation of that pattern is more appropriate when large amounts of dataare being transferred. In this case, the root replies with instructions on how to getthe data rather than the data itself. The requestor then requests the data from thesource directly.
For example, imagine a distributed file system with petabytes of data spreadout over thousands of machines. Each file is split into gigabyte-sized chunks. Eachchunk is stored onmultiplemachines for redundancy. This scheme also permits thecreation of files larger than those that would fit on one machine. A master servertracks the list of files and identifies where their chunks are. If you are familiar withthe UNIX file system, the master can be thought of as storing the inodes, or per-filelists of data blocks, and the other machine as storing the actual blocks of data. Filesystem operations go through a master server that uses the inode-like informationto determine which machines to involve in the operation.
Imagine that a large read request comes in. Themaster determines that the filehas a few terabytes stored on one machine and a few terabytes stored on anothermachine. It could request the data from each machine and relay it to the systemthat made the request, but the master would quickly become overloaded whilereceiving and relaying huge chunks of data. Instead, it replies with a list of whichmachines have the data, and the requestor contacts those machines directly for thedata. This way the master is not the middle man for those large data transfers. Thissituation is illustrated in Figure 1.7.
..
Figure 1.7: This master server delegates replies to other servers.

1.5 The CAP Principle 21
1.5 The CAP PrincipleCAP stands for consistency, availability, and partition resistance. The CAP Prin-ciple states that it is not possible to build a distributed system that guaranteesconsistency, availability, and resistance to partitioning. Any one or two can beachieved but not all three simultaneously. When using such systems you must beaware of which are guaranteed.
1.5.1 ConsistencyConsistency means that all nodes see the same data at the same time. If there aremultiple replicas and there is an update being processed, all users see the updatego live at the same time even if they are reading from different replicas. Systemsthat do not guarantee consistency may provide eventual consistency. For exam-ple, they may guarantee that any update will propagate to all replicas in a certainamount of time. Until that deadline is reached, some queries may receive the newdata while others will receive older, out-of-date answers.
Perfect consistency is not always important. Imagine a social network thatawards reputation points to users for positive actions. Your reputation point totalis displayed anywhere your name is shown. The reputation database is replicatedin the United States, Europe, andAsia. A user in Europe is awarded points and thatchangemight takeminutes to propagate to theUnited States andAsia replicas. Thismay be sufficient for such a system because an absolutely accurate reputation scoreis not essential. If a user in the United States and one in Asia were talking on thephoneasonewasawardedpoints, theotheruserwould see theupdate seconds laterand that would be okay. If the update took minutes due to network congestion orhours due to a network outage, the delay would still not be a terrible thing.
Now imagine a banking application built on this system. A person in theUnited States and another in Europe could coordinate their actions to withdrawmoney from the same account at the same time. The ATM that each person useswould query its nearest database replica, which would claim the money is avail-able andmay bewithdrawn. If the updates propagated slowly enough, both peoplewould have the cash before the bank realized the money was already gone.1
1.5.2 AvailabilityAvailability is a guarantee that every request receives a response about whetherit was successful or failed. In other words, it means that the system is up. For
1. The truth is that the global ATM system does not require database consistency. It can be defeated byleveraging network delays and outages. It is less expensive for banks to give out a limited amount ofmoney when the ATM network is down than to have an unhappy customer stranded without cash.Fraudulent transactions are dealt with after the fact. Daily withdrawal limits prevent major fraud.Assessing overage fees is easier than implementing a globally consistant database.

22 Chapter 1 Designing in a Distributed World
example, using many replicas to store data such that clients always have accessto at least one working replica guarantees availability.
The CAP Principle states that availability also guarantees that the system isable to report failure. For example, a system may detect that it is overloaded andreply to requests with an error code that means “try again later.” Being told thisimmediately is more favorable than having to wait minutes or hours before onegives up.
1.5.3 Partition TolerancePartition tolerance means the system continues to operate despite arbitrary mes-sage loss or failure of part of the system. The simplest example of partitiontolerance is when the system continues to operate even if the machines involvedin providing the service lose the ability to communicate with each other due to anetwork link going down (see Figure 1.8).
Returning to our example of replicas, if the system is read-only it is easy tomake the systempartition tolerant, as the replicas do not need to communicatewitheach other. But consider the example of replicas containing state that is updatedon one replica first, then copied to other replicas. If the replicas are unable to com-municate with each other, the system fails to be able to guarantee updates willpropagate within a certain amount of time, thus becoming a failed system.
Now consider a situation where two servers cooperate in a master–slave rela-tionship. Both maintain a complete copy of the state and the slave takes over themaster’s role if themaster fails, which is determined by a loss of heartbeat—that is,
Figure 1.8: Nodes partitioned from each other

1.5 The CAP Principle 23
a periodic health check between two servers often done via a dedicated network.If the heartbeat network between the two is partitioned, the slave will promoteitself to being the master, not knowing that the original master is up but unableto communicate on the heartbeat network. At this point there are two masters andthe system breaks. This situation is called split brain.
Some special cases of partitioning exist. Packet loss is considered a temporarypartitioning of the system as it applies to the CAP Principle. Another special caseis the complete network outage. Even the most partition-tolerant system is unableto work in that situation.
The CAP Principle says that any one or two of the attributes are achievable incombination, but not all three. In 2002, Gilbert and Lynch published a formal proofof the original conjecture, rendering it a theorem. One can think of this as the thirdattribute being sacrificed to achieve the other two.
The CAP Principle is illustrated by the triangle in Figure 1.9. Traditional rela-tional databases like Oracle, MySQL, and PostgreSQL are consistent and available(CA). They use transactions and other database techniques to assure that updatesare atomic; they propagate completely or not at all. Thus they guarantee all userswill see the same state at the same time. Newer storage systems such as Hbase,
Figure 1.9: The CAP Principle
24 Chapter 1 Designing in a Distributed World
Redis, and Bigtable focus on consistency and partition tolerance (CP). When par-titioned, they become read-only or refuse to respond to any requests rather thanbe inconsistent and permit some users to see old data while others see fresh data.Finally, systems such as Cassandra, Risk, and Dynamo focus on availability andpartition tolerance (AP). They emphasize always being able to serve requests evenif it means some clients receive outdated results. Such systems are often used inglobally distributed networks where each replica talks to the others by less reliablemedia such as the Internet.
SQL and other relational databases use the term ACID to describe their sideof the CAP triangle. ACID stands for Atomicity (transactions are “all or nothing”),Consistency (after each transaction the database is in a valid state), Isolation (con-current transactions give the same results as if they were executed serially), andDurability (a committed transaction’s data will not be lost in the event of a crashor other problem). Databases that provide weaker consistency models often referto themselves as NoSQL and describe themselves as BASE: Basically AvailableSoft-state services with Eventual consistency.
1.6 Loosely Coupled SystemsDistributed systems are expected to be highly available, to last a long time, and toevolve and change without disruption. Entire subsystems are often replaced whilethe system is up and running.
To achieve this a distributed system uses abstraction to build a loosely cou-pled system. Abstraction means that each component provides an interface thatis defined in a way that hides the implementation details. The system is looselycoupled if each component has little or no knowledge of the internals of the othercomponents. As a result a subsystem can be replaced by one that provides the sameabstract interface even if its implementation is completely different.
Take, for example, a spell check service. A good level of abstraction would beto take in text and return a description of which words are misspelled and a list ofpossible corrections for each one. A bad level of abstraction would simply provideaccess to a lexicon of words that the frontends could query for similar words. Thereason the latter is not a good abstraction is that if an entirely new way to checkspelling was invented, every frontend using the spell check service would needto be rewritten. Suppose this new version does not rely on a lexicon but insteadapplies an artificial intelligence technique called machine learning. With the goodabstraction, no frontend would need to change; it would simply send the samekind of request to the new server. Users of the bad abstraction would not be solucky.
For this and many other reasons, loosely coupled systems are easier to evolveand change over time.

1.6 Loosely Coupled Systems 25
Continuing our example, in preparation for the launch of the new spell checkservice both versions could be run in parallel. The load balancer that sits in frontof the spell check system could be programmed to send all requests to both theold and new systems. Results from the old system would be sent to the users, butresults from the new system would be collected and compared for quality control.At first the new systemmight not produce results that were as good, but over timeit would be enhanced until its results were quantifiably better. At that point thenew system would be put into production. To be cautious, perhaps only 1 percentof all queries would come through the new system—if no users complained, thenew system would take a larger fraction. Eventually all responses would comefrom the new system and the old system could be decommissioned.
Other systems require more precision and accuracy than a spell check system.For example, there may be requirements that the new system be bug-for-bug com-patible with the old system before it can offer new functionality. That is, the newsystem must reproduce not only the features but also the bugs from the old sys-tem. In this case the ability to send requests to both systems and compare resultsbecomes critical to the operational task of deploying it.
..
Case Study: Emulation before Improvements
When Tom was at Cibernet, he was involved in a project to replace an oldersystem. Because it was a financial system, the new system had to prove it wasbug-for-bug compatible before it could be deployed.
The old system was built on obsolete, pre-web technology and hadbecome so complex and calcified that it was impossible to add new features.The new system was built on newer, better technology and, being a cleanerdesign, was more easily able to accommodate new functionality. The systemswere run in parallel and results were compared.
At that point engineers found a bug in the old system. Currency conver-sion was being done in a way that was non-standard and the results wereslightly off. To make the results between the two systems comparable, thedevelopers reverse-engineered the bug and emulated it in the new system.
Now the results in the old and new systems matched down to the penny.With the company having gained confidence in the new system’s ability to bebug-for-bug compatible, it was activated as the primary system and the oldsystem was disabled.
At this point, new features and improvements could be made to the sys-tem. The first improvement, unsurprisingly, was to remove the code thatemulated the currency conversion bug.

26 Chapter 1 Designing in a Distributed World
1.7 SpeedSo far we have elaborated on many of the considerations involved in designinglarge distributed systems. For web and other interactive services, one item maybe the most important: speed. It takes time to get information, store information,compute and transform information, and transmit information. Nothing happensinstantly.
An interactive system requires fast response times. Users tend to perceive any-thing faster than 200 ms to be instant. They also prefer fast over slow. Studies havedocumented sharp drops in revenue when delays as little as 50 ms were artificiallyadded to web sites. Time is also important in batch and non-interactive systemswhere the total throughput must meet or exceed the incoming flow of work.
The general strategy for designing a system that is performant is to design asystem using our best estimates of how quickly it will be able to process a requestand then to build prototypes to test our assumptions. If we are wrong, we go backto step one; at least the next iterationwill be informed bywhat we have learned. Aswe build the system, we are able to remeasure and adjust the design if we discoverour estimates and prototypes have not guided us as well as we had hoped.
At the start of the design process we often create many designs, estimate howfast each will be, and eliminate the ones that are not fast enough. We do not auto-matically select the fastest design. The fastest design may be considerably moreexpensive than one that is sufficient.
How do we determine if a design is worth pursuing? Building a prototype isvery time consuming. Much can be deduced with some simple estimating exer-cises. Pick a few common transactions and break them down into smaller steps,and then estimate how long each step will take.
Two of the biggest consumers of time are disk access and network delays.Disk accesses are slow because they involve mechanical operations. To read a
block of data from adisk requires the read arm tomove to the right track; the plattermust then spin until the desired block is under the read head. This process typicallytakes 10 ms. Compare this to reading the same amount of information from RAM,which takes 0.002 ms, which is 5,000 times faster. The arm and platters (known asa spindle) can process only one request at a time. However, once the head is onthe right track, it can read many sequential blocks. Therefore reading two blocksis often nearly as fast as reading one block if the two blocks are adjacent. Solid-state drives (SSDs) do not have mechanical spinning platters and are much faster,though more expensive.
Network access is slow because it is limited by the speed of light. It takesapproximately 75 ms for a packet to get from California to the Netherlands. Abouthalf of that journey time is due to the speed of light. Additional delays may beattributable to processing time on each router, the electronics that convert from

1.7 Speed 27
wired to fiber-optic communication and back, the time it takes to assemble anddisassemble the packet on each end, and so on.
Two computers on the same network segment might seem as if they commu-nicate instantly, but that is not really the case. Here the time scale is so small thatother delays have a bigger factor. For example, when transmitting data over a localnetwork, the first byte arrives quickly but the program receiving the data usuallydoes not process it until the entire packet is received.
In many systems computation takes little time compared to the delays fromnetwork and disk operation. As a result you can often estimate how long a trans-action will take if you simply know the distance from the user to the datacenterand the number of disk seeks required. Your estimate will often be good enoughto throw away obviously bad designs.
To illustrate this, imagine you are building an email system that needs tobe able to retrieve a message from the message storage system and display itwithin 300 ms. We will use the time approximations listed in Figure 1.10 to help usengineer the solution.
..
Jeff Dean, a Google Fellow, has popularized this chart of common numbersto aid in architectural and scaling decisions. As you can see, there are manyorders of magnitude difference between certain options. These numbersimprove every year. Updates can be found online.
Action Typical TimeL1 cache reference 0.5 nsBranch mispredict 5 nsL2 cache reference 7 nsMutex lock/unlock 100 nsMain memory reference 100 nsCompress 1K bytes with Zippy 10,000 ns (0.01 ms)Send 2K bytes over 1 Gbps network 20,000 ns (0.02 ms)Read 1 MB sequentially from memory 250,000 ns (0.25 ms)Round trip within same datacenter 500,000 ns (0.5 ms)Read 1 MB from SSD 1,000,000 ns (3 ms)Disk seek 10,000,000 ns (10 ms)Read 1 MB sequentially from network 10,000,000 ns (10 ms)Read 1 MB sequentially from disk 30,000,000 ns (30 ms)Send packet from California to
Netherlands to California150,000,000 ns (150 ms)
Figure 1.10: Numbers every engineer should know

28 Chapter 1 Designing in a Distributed World
First we follow the transaction from beginning to end. The request comes froma web browser that may be on another continent. The request must be authenti-cated, the database index is consulted to determine where to get the message text,the message text is retrieved, and finally the response is formatted and transmittedback to the user.
Now let’s budget for the items we can’t control. To send a packet betweenCalifornia and Europe typically takes 75 ms, and until physics lets us change thespeed of light that won’t change. Our 300ms budget is reduced by 150ms since wehave to account for not only the time it takes for the request to be transmitted butalso the reply. That’s half our budget consumed by something we don’t control.
We talk with the team that operates our authentication system and theyrecommend budgeting 3 ms for authentication.
Formatting the data takes very little time—less than the slop in our otherestimates—so we can ignore it.
This leaves 147 ms for the message to be retrieved from storage. If a typicalindex lookup requires 3 disk seeks (10 ms each) and reads about 1 megabyte ofinformation (30 ms), that is 60 ms. Reading the message itself might require 4 diskseeks and reading about 2 megabytes of information (100 ms). The total is 160 ms,which is more than our 147 ms remaining budget.
..
How Did We Know That?
How did we know that it will take 3 disk seeks to read the index? It requiresknowledge of the inner workings of the UNIX file system: how files are lookedup in a directory to find an inode and how inodes are used to look up the datablocks. This is why understanding the internals of the operating system youuse is key to being able to design and operate distributed systems. The inter-nals of UNIX and UNIX-like operating systems are well documented, thusgiving them an advantage over other systems.
While disappointed that our design did not meet the design parameters, weare happy that disaster has been averted. Better to knownow than to find outwhenit is too late.
It seems like 60 ms for an index lookup is a long time. We could improve thatconsiderably. What if the index was held in RAM? Is this possible? Some quickcalculations estimate that the lookup tree would have to be 3 levels deep to fanout to enough machines to span this much data. To go up and down the tree is5 packets, or about 2.5 ms if they are all within the same datacenter. The new total(150 ms+3 ms+2.5 ms+100 ms = 255.5 ms) is less than our total 300ms budget.

1.8 Summary 29
We would repeat this process for other requests that are time sensitive. Forexample, we send email messages less frequently than we read them, so the timeto send an email message may not be considered time critical. In contrast, delet-ing a message happens almost as often reading messages. We might repeat thiscalculation for a few deletion methods to compare their efficiency.
One design might contact the server and delete the message from the stor-age system and the index. Another design might have the storage system simplymark the message as deleted in the index. This would be considerably faster butwould require a new element that would reap messages marked for deletion andoccasionally compact the index, removing any items marked as deleted.
Even faster response time can be achieved with an asynchronous design. Thatmeans the client sends requests to the server and quickly returns control to the userwithoutwaiting for the request to complete. The user perceives this systemas fastereven though the actual work is lagging. Asynchronous designs are more complexto implement. The server might queue the request rather than actually performingthe action. Another process reads requests from the queue and performs them inthe background. Alternatively, the client could simply send the request and checkfor the reply later, or allocate a thread or subprocess to wait for the reply.
All of these designs are viable but each offers different speed and complexity ofimplementation.With speed and cost estimates, backed byprototypes, the businessdecision of which to implement can be made.
1.8 SummaryDistributed computing is different from traditional computing in many ways. Thescale is larger; there are many machines, each doing specialized tasks. Services arereplicated to increase capacity. Hardware failure is not treated as an emergency orexception but as an expected part of the system. Thus the system works aroundfailure.
Large systems are built through composition of smaller parts. We discussedthree ways this composition is typically done: load balancer for many backendreplicas, frontend with many different backends, and a server tree.
The load balancer divides traffic among many duplicate systems. The front-end with many different backends uses different backends in parallel, with eachperforming different processes. The server tree uses a tree configuration, with eachtree level serving a different purpose.
Maintaining state in a distributed system is complex, whether it is a largedatabase of constantly updated information or a few key bits to which many sys-tems need constant access. The CAP Principle states that it is not possible to builda distributed system that guarantees consistency, availability, and resistance topartitioning simultaneously. At most two of the three can be achieved.

30 Chapter 1 Designing in a Distributed World
Systems are expected to evolve over time. Tomake this easier, the componentsare loosely coupled. Each embodies an abstraction of the service it provides, suchthat the internals can be replaced or improved without changing the abstraction.Thus, dependencies on the service do not need to change other than to benefit fromnew features.
Designing distributed systems requires an understanding of the time it takesvarious operations to run so that time-sensitive processes can be designed to meettheir latency budget.
Exercises1. What is distributed computing?2. Describe the three major composition patterns in distributed computing.3. What are the three patterns discussed for storing state?4. Sometimes a master server does not reply with an answer but instead replies
with where the answer can be found. What are the benefits of this method?5. Section 1.4 describes a distributed file system, including an example of how
reading terabytes of data would work. How would writing terabytes of datawork?
6. Explain the CAP Principle. (If you think the CAP Principle is awesome, read“The Part-Time Parliament” (Lamport & Marzullo 1998) and “Paxos MadeSimple” (Lamport 2001).)
7. What does it mean when a system is loosely coupled? What is the advantageof these systems?
8. Give examples of loosely and tightly coupled systems you have experiencewith. What makes them loosely or tightly coupled?
9. How do we estimate how fast a system will be able to process a request suchas retrieving an email message?
10. In Section 1.7 three design ideas are presented for how to process email dele-tion requests. Estimate how long the request will take for deleting an emailmessage for each of the three designs. First outline the steps each would take,then break each one into individual operations until estimates can be created.

This page intentionally left blank

Chapter 7
Operations in a DistributedWorld
The rate at which organizationslearn may soon become the onlysustainable source of competitiveadvantage.
—Peter Senge
Part I of this book discussed how to build distributed systems. Now we discusshow to run such systems.
The work done to keep a system running is called operations. More specifi-cally, operations is the work done to keep a system running in a way that meets orexceeds operating parameters specified by a service level agreement (SLA). Oper-ations includes all aspects of a service’s life cycle: from initial launch to the finaldecommissioning and everything in between.
Operational work tends to focus on availability, speed and performance, secu-rity, capacity planning, and software/hardware upgrades. The failure to do anyof these well results in a system that is unreliable. If a service is slow, users willassume it is broken. If a system is insecure, outsiders can take it down. With-out proper capacity planning, it will become overloaded and fail. Upgrades, donebadly, result in downtime. If upgrades aren’t done at all, bugs will go unfixed.Because all of these activities ultimately affect the reliability of the system, Googlecalls its operations team Site Reliability Engineering (SRE). Many companies havefollowed suit.
Operations is a team sport. Operations is not done by a single person butrather by a team of people working together. For that reason much of what wedescribe will be processes and policies that help youwork as a team, not as a groupof individuals. In some companies, processes seem to be bureaucratic mazes thatslow things down. As we describe here—and more important, in our professionalexperience—good processes are exactly what makes it possible to run very large
147

148 Chapter 7 Operations in a Distributed World
..
Terms to KnowInnovate: Doing (good) things we haven’t done before.Machine: A virtual or physical machine.Oncall: Being available as first responder to an outage or alert.Server: Software that provides a function or API. (Not a piece of hardware.)Service: A user-visible system or product composed of one or more servers.Soft launch: Launching a new service without publicly announcing it. This
way traffic grows slowly as word of mouth spreads, which gives opera-tions some cushion to fix problems or scale the system before too manypeople have seen it.
SRE: Site Reliability Engineer, the Google term for systems administratorswho maintain live services.
Stakeholders: People and organizations that are seen as having an interestin a project’s success.
computing systems. In other words, process is what makes it possible for teams todo the right thing, again and again.
This chapter starts with some operations management background, then dis-cusses the operations service life cycle, and ends with a discussion of typicaloperations work strategies. All of these topics will be expanded upon in thechapters that follow.
7.1 Distributed Systems OperationsTo understand distributed systems operations, one must first understand how it isdifferent from typical enterprise IT. Onemust also understand the source of tensionbetween operations and developers, and basic techniques for scaling operations.
7.1.1 SRE versus Traditional Enterprise ITSystem administration is a continuum. On one end is a typical IT department,responsible for traditional desktop and client–server computing infrastructure,often called enterprise IT. On the other end is an SRE or similar team responsi-ble for a distributed computing environment, often associated with web sites andother services.While thismay be a broad generalization, it serves to illustrate someimportant differences.
SRE is different from an enterprise IT department because SREs tend to befocused on providing a single service or awell-defined set of services. A traditionalenterprise IT department tends to have broad responsibility for desktop services,

7.1 Distributed Systems Operations 149
back-office services, and everything in between (“everything with a power plug”).SRE’s customers tend to be the product management of the service while IT cus-tomers are the end users themselves. This means SRE efforts are focused on a fewselect business metrics rather than being pulled in many directions by users, eachof whom has his or her own priorities.
Another difference is in the attitude toward uptime. SREs maintain servicesthat have demanding, 24 × 7 uptime requirements. This creates a focus on pre-venting problems rather than reacting to outages, and on performing complexbut non-intrusive maintenance procedures. IT tends to be granted flexibility withrespect to scheduling downtime and has SLAs that focus on how quickly servicecan be restored in the event of an outage. In the SRE view, downtime is some-thing to be avoided and service should not stop while services are undergoingmaintenance.
SREs tend to manage services that are constantly changing due to new soft-ware releases and additions to capacity. IT tends to run services that are upgradedrarely. Often IT services are built by external contractors who go away once thesystem is stable.
SREs maintain systems that are constantly being scaled to handle more trafficand larger workloads. Latency, or how fast a particular request takes to process,is managed as well as overall throughput. Efficiency becomes a concern becausea little waste per machine becomes a big waste when there are hundreds or thou-sands of machines. In IT, systems are often built for environments that expect amodest increase in workload per year. In this case a workable strategy is to buildthe system large enough to handle the projected workload for the next few years,when the system is expected to be replaced.
As a result of these requirements, systems in SRE tend to be bespoke systems,built on platforms that are home-grown or integrated from open source or otherthird-party components. They are not “off the shelf” or turn key systems. They areactively managed, while IT systems may be unchanged from their initial deliverystate. Because of these differences, distributed computing services are best man-aged by a separate team, with separate management, with bespoke operationaland management practices.
While there are many such differences, recently IT departments have begun tosee a demand for uptime and scalability similar to that seen in SRE environments.Therefore the management techniques from distributed computing are rapidlybeing adopted in the enterprise.
7.1.2 Change versus StabilityThere is a tension between the desire for stability and the desire for change. Oper-ations teams tend to favor stability; developers desire change. Consider how eachgroup is evaluated during end-of-the-year performance reviews. A developer ispraised for writing code that makes it into production. Changes that result in a

150 Chapter 7 Operations in a Distributed World
tangible difference to the service are rewarded above any other accomplishment.Therefore, developers want new releases pushed into production often. Opera-tions, in contrast, is rewarded for achieving compliance with SLAs, most of whichrelate to uptime. Therefore stability is the priority.
A system starts at a baseline of stability. A change is then made. All changeshave some kind of a destabilizing effect. Eventually the system becomes stableagain, usually through some kind of intervention. This is called the change-instability cycle.
All software roll-outs affect stability. A change may introduce bugs, which arefixed through workarounds and new software releases. A release that introducesno new bugs still creates a destabilizing effect due to the process of shifting work-loads away frommachines about to be upgraded. Non-software changes also havea destabilizing effect. A network change may make the local network less stablewhile the change propagates throughout the network.
Because of the tension between the operational desire for stability and thedeveloper desire for change, there must be mechanisms to reach a balance.
One strategy is to prioritize work that improves stability over work that addsnew features. For example, bug fixes would have a higher priority than featurerequests. With this approach, a major release introduces many new features, thenext few releases focus on fixing bugs, and then a newmajor release starts the cycleover again. If engineering management is pressured to focus on new features andneglect bug fixes, the result is a system that slowly destabilizes until it spins out ofcontrol.
Another strategy is to align the goals of developers and operational staff. Bothparties become responsible for SLA compliance as well as the velocity (rate ofchange) of the system. Both have a component of their annual review that is tiedto SLA compliance and both have a portion tied to the on-time delivery of newfeatures.
Organizations that have been the most successful at aligning goals like thishave restructured themselves so that developers and operations work as oneteam. This is the premise of the DevOps movement, which will be described inChapter 8.
Another strategy is to budget time for stability improvements and time fornew features. Software engineering organizations usually have a way to estimatethe size of a software request or the amount of time it is expected to take to com-plete. Each new release has a certain size or time budget; within that budget acertain amount of stability-improvement work is allocated. The case study at theend of Section 2.2.2 is an example of this approach. Similarly, this allocation can beachieved by assigning dedicated people to stability-related code changes.
The budget can also be based on an SLA. A certain amount of instability isexpected each month, which is considered a budget. Each roll-out uses some ofthe budget, as do instability-related bugs. Developers can maximize the number

7.1 Distributed Systems Operations 151
of roll-outs that can be done each month by dedicating effort to improve the codethat causes this instability. This creates a positive feedback loop. An example ofthis is Google’s Error Budgets, which are more fully explained in Section 19.4.
7.1.3 Defining SREThe core practices of SRE were refined for more than 10 years at Google beforebeing enumerated in public. In his keynote address at the first USENIX SREcon,Benjamin Treynor Sloss (2014), Vice President of Site Reliability Engineering atGoogle, listed them as follows:
Site Reliability Practices
1. Hire only coders.2. Have an SLA for your service.3. Measure and report performance against the SLA.4. Use Error Budgets and gate launches on them.5. Have a common staffing pool for SRE and Developers.6. Have excess Ops work overflow to the Dev team.7. Cap SRE operational load at 50 percent.8. Share 5 percent of Ops work with the Dev team.9. Oncall teams should have at least eight people at one location, or six people
at each of multiple locations.10. Aim for a maximum of two events per oncall shift.11. Do a postmortem for every event.12. Postmortems are blameless and focus on process and technology, not people.
The first principle for site reliability engineering is that SREs must be able to code.An SRE might not be a full-time software developer, but he or she should be ableto solve nontrivial problems by writing code. When asked to do 30 iterations ofa task, an SRE should do the first two, get bored, and automate the rest. An SREmust have enough software development experience to be able to communicatewith developers on their level and have an appreciation for what developers do,and for what computers can and can’t do.
When SREs and developers come from a common staffing pool, that meansthat projects are allocated a certain number of engineers; these engineers may bedevelopers or SREs. The end result is that each SRE neededmeans one fewer devel-oper in the team.Contrast this to the case atmost companieswhere systemadminis-trators anddevelopers are allocated from teamswith separate budgets. Rationally aprojectwants tomaximize the number of developers, since theywrite new features.The common staffing pool encourages the developers to create systems that can beoperated efficiently so as to minimize the number of SREs needed.
152 Chapter 7 Operations in a Distributed World
Another way to encourage developers to write code that minimizes opera-tional load is to require that excess operational work overflows to the developers.This practice discourages developers from taking shortcuts that create undue oper-ational load. The developers would share any such burden. Likewise, by requiringdevelopers to perform 5 percent of operational work, developers stay in tune withoperational realities.
Within the SRE team, capping the operational load at 50 percent limits theamount ofmanual labor done.Manual labor has a lower return on investment than,for example, writing code to replace the need for such labor. This is discussed inSection 12.4.2, “Reducing Toil.”
Many SRE practices relate to finding balance between the desire for changeand the need for stability. The most important of these is the Google SRE practicecalled Error Budgets, explained in detail in Section 19.4.
Central to the Error Budget is the SLA. All services must have an SLA, whichspecifies how reliable the system is going to be. The SLA becomes the standard bywhich all work is ultimately measured. SLAs are discussed in Chapter 16.
Any outage or other major SLA-related event should be followed by the cre-ation of a written postmortem that includes details of what happened, along withanalysis and suggestions for how to prevent such a situation in the future. Thisreport is shared within the company so that the entire organization can learn fromthe experience. Postmortems focus on the process and the technology, not find-ing who to blame. Postmortems are the topic of Section 14.3.2. The person who isoncall is responsible for responding to any SLA-related events and producing thepostmortem report.
Oncall is not just a way to react to problems, but rather a way to reduce futureproblems. It must be done in a way that is not unsustainably stressful for thoseoncall, and it drives behaviors that encourage long-term fixes and problem pre-vention. Oncall teams are made up of at least eight members at one location, orsix members at two locations. Teams of this size will be oncall often enough thattheir skills do not get stale, and their shifts can be short enough that each catchesno more than two outage events. As a result, each member has enough time to fol-low through on each event, performing the required long-term solution.Managingoncall this way is the topic of Chapter 14.
Other companies have adopted the SRE job title for their system administra-tors who maintain live production services. Each company applies a different setof practices to the role. These are the practices that define SRE at Google and arecore to its success.
7.1.4 Operations at ScaleOperations in distributed computing is operations at a large scale. Distributed com-puting involves hundreds and often thousands of computers working together. Asa result, operations is different than traditional computing administration.

7.1 Distributed Systems Operations 153
Manual processes do not scale. When tasks are manual, if there are twice asmany tasks, there is twice as much human effort required. A system that is scalingto thousands of machines, servers, or processes, therefore, becomes untenable ifa process involves manually manipulating things. In contrast, automation doesscale. Code written once can be used thousands of times. Processes that involvemany machines, processes, servers, or services should be automated. This ideaapplies to allocating machines, configuring operating systems, installing software,and watching for trouble. Automation is not a “nice to have” but a “must have.”(Automation is the subject of Chapter 12.)
When operations is automated, system administration is more like an assem-bly line than a craft. The job of the system administrator changes from being thepersonwho does thework to the personwhomaintains the robotics of an assemblyline. Mass production techniques become viable and we can borrow operationalpractices from manufacturing. For example, by collecting measurements fromevery stage of production, we can apply statistical analysis that helps us improvesystem throughput. Manufacturing techniques such as continuous improvementare the basis for the Three Ways of DevOps. (See Section 8.2.)
Three categories of things are not automated: things that should be automatedbut have not been yet, things that are not worth automating, and human processesthat can’t be automated.
Tasks That Are Not Yet AutomatedIt takes time to create, test, and deploy automation, so there will always be thingsthat are waiting to be automated. There is never enough time to automate every-thing, so we must prioritize and choose our methods wisely. (See Section 2.2.2 andSection 12.1.1.)
For processes that are not, or have not yet been, automated, creating proce-dural documentation, called a playbook, helps make the process repeatable andconsistent. A good playbook makes it easier to automate the process in the future.Often the most difficult part of automating something is simply describing theprocess accurately. If a playbook does that, the actual coding is relatively easy.
Tasks That Are Not Worth AutomatingSome things are not worth automating because they happen infrequently, they aretoo difficult to automate, or the process changes so often that automation is not pos-sible. Automation is an investment in time and effort and the return on investment(ROI) does not always make automation viable.
Nevertheless, there are some common cases that are worth automating. Oftenwhen those are automated, the more rare cases (edge cases) can be consolidated oreliminated. In many situations, the newly automated common case provides suchsuperior service that the edge-case customers will suddenly lose their need to beso unique.

154 Chapter 7 Operations in a Distributed World
..
Benefits of Automating the Common Case
At one company there were three ways that virtual machines were being pro-visioned. All three were manual processes, and customers often waited daysuntil a systemadministratorwas available to do the task.Aproject to automateprovisioning was stalled because of the complexity of handling all three vari-ations. Users of the two less common cases demanded that their provisioningprocess be different because they were (in their own eyes) unique and beau-tiful snowflakes. They had very serious justifications based on very serious(anecdotal) evidence and waved their hands vigorously to prove their point.To get the project moving, it was decided to automate just the most commoncase and promise the two edge cases would be added later.
This was much easier to implement than the original all-singing, all-dancing, provisioning system. With the initial automation, provisioning timewas reduced to a few minutes and could happen without system administra-tor involvement. Provisioning could even happen at night and on weekends.At that point an amazing thing happened. The other two cases suddenly dis-covered that their uniqueness had vanished! They adopted the automatedmethod. The system administrators never automated the two edge cases andthe provisioning system remained uncomplicated and easy to maintain.
Tasks That Cannot Be AutomatedSome tasks cannot be automated because they are human processes: maintainingyour relationshipwith a stakeholder,managing the bidding process tomake a largepurchase, evaluating new technology, or negotiating within a team to assemble anoncall schedule. While they cannot be eliminated through automation, they can bestreamlined:
• Many interactions with stakeholders can be eliminated through betterdocumentation. Stakeholders can be more self-sufficient if provided withintroductory documentation, user documentation, best practices recommen-dations, a style guide, and so on. If your service will be used by many otherservices or service teams, it becomes more important to have good documen-tation. Video instruction is also useful and does not require much effort if yousimply make a video recording of presentations you already give.
• Some interactions with stakeholders can be eliminated by making commonrequests self-service. Rather than meeting individually with customers tounderstand future capacity requirements, their forecasts can be collected via awebuser interface or anAPI. For example, if youprovide a service to hundreds

7.2 Service Life Cycle 155
of other teams, forecasting can be become a full-time job for a project manager;alternatively, it can be very little work with proper automation that integrateswith the company’s supply-chain management system.
• Evaluating new technology can be labor intensive, but if a common case isidentified, the end-to-end process can be turned into an assembly-line processand optimized. For example, if hard drives are purchased by the thousand, it iswise to add a newmodel to themix only periodically and only after a thoroughevaluation. The evaluation process should be standardized and automated,and results stored automatically for analysis.
• Automation can replace or accelerate team processes. Creating the oncallschedule can evolve into a chaotic mess of negotiations between team mem-bers battling to take time off during an important holiday. Automation turnsthis into a self-service system that permits people to list their availability andthat churns out an optimal schedule for the next few months. Thus, it solvesthe problem better and reduces stress.
• Meta-processes such as communication, status, and process tracking can befacilitated through online systems. As teams grow, just tracking the interac-tion and communication among all parties can become a burden. Automatingthat can eliminate hours of manual work for each person. For example, a web-based system that lets people see the status of their order as it works its waythrough approval processes eliminates the need for status reports, leavingpeople to deal with just exceptions and problems. If a process has many com-plex handoffs between teams, a system that provides a status dashboard andautomatically notifies teams when hand-offs happen can reduce the need forlegions of project managers.
• The best process optimization is elimination. A task that is eliminated does notneed to be performed or maintained, nor will it have bugs or security flaws.For example, if production machines run three different operating systems,narrowing that number down to two eliminates a lot of work. If you provide aservice to other service teams and require a lengthy approval process for eachnew team, itmay be better to streamline the approval process by automaticallyapproving certain kinds of users.
7.2 Service Life CycleOperations is responsible for the entire service life cycle: launch, maintenance(both regular and emergency), upgrades, and decommissioning. Each phasehas unique requirements, so you’ll need a strategy for managing each phasedifferently.

156 Chapter 7 Operations in a Distributed World
The stages of the life cycle are:
• Service Launch: Launching a service the first time. The service is brought tolife, initial customers use it, and problems that were not discovered prior tothe launch are discovered and remedied. (Section 7.2.1)
• Emergency Tasks: Handling exceptional or unexpected events. This includeshandling outages and, more importantly, detecting and fixing conditions thatprecipitate outages. (Chapter 14)
• Nonemergency Tasks: Performing all manual work required as part of thenormally functioning system. This may include periodic (weekly or monthly)maintenance tasks (for example, preparation for monthly billing events) aswell as processing requests from users (for example, requests to enable theservice for use by another internal service or team). (Section 7.3)
• Upgrades:Deploying new software releases and hardware platforms. The bet-ter we can do this, the more aggressively the company can try new things andinnovate. Each new software release is built and tested before deployment.Tests include system tests, done by developers, as well as user acceptancetests (UAT), done by operations. UAT might include tests to verify there areno performance regressions (unexpected declines in performance). Vulner-ability assessments are done to detect security issues. New hardware mustgo through a hardware qualification to test for compatibility, performanceregressions, and any changes in operational processes. (Section 10.2)
• Decommissioning: Turning off a service. It is the opposite of a service launch:removing the remaining users, turning off the service, removing references tothe service from any related service configurations, giving back any resources,archiving old data, and erasing or scrubbing data from any hardware beforeit is repurposed, sold, or disposed. (Section 7.2.2)
• Project Work: Performing tasks large enough to require the allocation ofdedicated resources and planning. While not directly part of the service lifecycle, along the way tasks will arise that are larger than others. Examplesinclude fixing a repeating but intermittent failure, working with stakehold-ers on roadmaps and plans for the product’s future, moving the service to anew datacenter, and scaling the service in new ways. (Section 7.3)
Most of the life-cycle stages listed here are covered in detail elsewhere in this book.Service launches and decommissioning are covered in detail next.
7.2.1 Service LaunchesNothing ismore embarrassing than the failed public launch of a new service. Oftenwe see a new service launch that is so successful that it receives too much traffic,becomes overloaded, and goes down. This is ironic but not funny.

7.2 Service Life Cycle 157
Each timewe launch a new service, we learn something new. If we launch newservices rarely, then remembering those lessons until the next launch is difficult.Therefore, if launches are rare, we should maintain a checklist of things to do andrecord the things you should remember to do next time. As the checklist growswith each launch, we become better at launching services.
If we launch new services frequently, then there are probably many peo-ple doing the launches. Some will be less experienced than others. In this casewe should maintain a checklist to share our experience. Every addition increasesour organizational memory, the collection of knowledge within our organization,thereby making the organization smarter.
A common problem is that other teamsmay not realize that planning a launchrequires effort. They may not allocate time for this effort and surprise operationsteamsat or near the launchdate. These teamsareunaware of all thepotential pitfallsand problems that the checklist is intended to prevent. For this reason the launchchecklist should be something mentioned frequently in documentation, socializedamong product managers, and made easy to access. The best-case scenario occurswhena service teamcomes to operationswishing to launch something andhas beenusing the checklist as a guide throughoutdevelopment. Such a teamhas “done theirhomework”; they have been working on the items in the checklist in parallel as theproductwas being developed. This does not happen by accident; the checklistmustbe available, be advertised, and become part of the company culture.
A simple strategy is to create a checklist of actions that need to be completedprior to launch. A more sophisticated strategy is for the checklist to be a seriesof questions that are audited by a Launch Readiness Engineer (LRE) or a LaunchCommittee.
Here is a sample launch readiness review checklist:
Sample Launch Readiness Review SurveyThe purpose of this document is to gather information to be evaluated by a Launch Readi-ness Engineer (LRE) when approving the launch of a new service. Please complete thesurvey prior to meeting with your LRE.
• General Launch Information:– What is the service name?– When is the launch date/time?– Is this a soft or hard launch?
• Architecture:– Describe the systemarchitecture. Link to architecture documents if possible.– How does the failover work in the event of single-machine, rack, and
datacenter failure?– How is the system designed to scale under normal conditions?

158 Chapter 7 Operations in a Distributed World
• Capacity:– What is the expected initial volume of users and QPS?– How was this number arrived at? (Link to load tests and reports.)– What is expected to happen if the initial volume is 2× expected? 5×? (Link
to emergency capacity documents.)– What is the expected external (internet) bandwidth usage?– What are the requirements for network and storage after 1, 3, and 12
months? (Link to confirmation documents from the network and storageteams capacity planner.)
• Dependencies:– Which systems does this depend on? (Link to dependency/data flow
diagram.)– Which RPC limits are in place with these dependencies? (Link to limits and
confirmation from external groups they can handle the traffic.)– What will happen if these RPC limits are exceeded ?– For each dependency, list the ticket number where this new service’s use
of the dependency (and QPS rate) was requested and positively acknowl-edged.
• Monitoring:– Are all subsystems monitored? Describe the monitoring strategy and doc-
ument what is monitored.– Does a dashboard exist for all major subsystems?– Do metrics dashboards exist? Are they in business, not technical, terms?– Was the number of “false alarm” alerts in the last month less than x?– Is the number of alerts received in a typical week less than x?
• Documentation:– Does a playbook exist and include entries for all operational tasks and
alerts?– Have an LRE review each entry for accuracy and completeness.– Is the number of open documentation-related bugs less than x?
• Oncall:– Is the oncall schedule complete for the next n months?– Is the oncall schedule arranged such that each shift is likely to get fewer
than x alerts?• Disaster Preparedness:
– What is the plan in case first-day usage is 10 times greater than expected?– Do backups work and have restores been tested?
• Operational Hygiene:– Are “spammy alerts” adjusted or corrected in a timely manner?

7.2 Service Life Cycle 159
– Are bugs filed to raise visibility of issues—evenminor annoyances or issueswith commonly known workarounds?
– Do stability-related bugs take priority over new features?– Is a system in place to assure that the number of open bugs is kept low?
• Approvals:– Has marketing approved all logos, verbiage, and URL formats?– Has the security team audited and approved the service?– Has a privacy audit been completed and all issues remediated?
Because a launch is complex,withmanymoving parts, we recommend that a singleperson (the launch lead) take a leadership or coordinator role. If the developerand operations teams are very separate, one person from each might be selected torepresent each team.
The launch lead thenworks through the checklist, delegatingwork, filing bugsfor any omissions, and tracking all issues until launch is approved and executed.The launch lead may also be responsible for coordinating post-launch problemresolution.
..
Case Study: Self-Service Launches at Google
Google launches somany services that it needed away tomake the launch pro-cess streamlined and able to be initiated independently by a team. In additionto providing APIs and portals for the technical parts, the Launch ReadinessReview (LRR) made the launch process itself self-service.
The LRR included a checklist and instructions on how to achieve eachitem. An SRE engineer was assigned to shepherd the team through the processand hold them to some very high standards.
Some checklist items were technical—for example, making sure that theGoogle load balancing system was used properly. Other items were caution-ary, to prevent a launch team from repeating other teams’ past mistakes. Forexample, one team had a failed launch because it received 10 times moreusers than expected. There was no plan for how to handle this situation. TheLRR checklist required teams to create a plan to handle this situation anddemonstrate that it had been tested ahead of time.
Other checklist items were business related. Marketing, legal, and otherdepartments were required to sign off on the launch. Each department hadits own checklist. The SRE team made the service visible externally only afterverifying that all of those sign-offs were complete.

160 Chapter 7 Operations in a Distributed World
7.2.2 Service DecommissioningDecommissioning (or just “decomm”), or turning off a service, involves threemajorphases: removal of users, deallocation of resources, and disposal of resources.
Removing users is often a product management task. Usually it involves mak-ing the users aware that they must move. Sometimes it is a technical issue ofmoving them to another service. User data may need to be moved or archived.
Resource deallocation can cover many aspects. There may be DNS entries tobe removed,machines to power off, database connections to be disabled, and so on.Usually there are complex dependencies involved. Often nothing can begin untilthe last user is off the service; certain resources cannot be deallocated before others,and so on. For example, typically a DNS entry is not removed until the machine isno longer in use. Network connections must remain in place if deallocating otherservices depends on network connectivity.
Resource disposal includes securely erasing disks and other media and dis-posing of all hardware. The hardware may be repurposed, sold, or scrapped.
If decommissioning is done incorrectly or items are missed, resources willremain allocated. A checklist, that is added to over time, will help assure decom-missioning is done completely and the tasks are done in the right order.
7.3 Organizing Strategy for Operational TeamsAn operational team needs to get work done. Therefore teams need a strategy thatassures that all incoming work is received, scheduled, and completed. Broadlyspeaking, there are three sources of operational work and these work items fallinto three categories. To understand how to best organize a team, first you mustunderstand these sources and categories.
The three sources of work are life-cycle management, interacting with stake-holders, and process improvement and automation. Life-cycle management is theoperational work involved in running the service. Interacting with stakeholdersrefers to both maintaining the relationship with people who use and depend onthe service, and prioritizing and fulfilling their requests. Process improvement andautomation is work inspired by the business desire for continuous improvement.
No matter the source, this work tends to fall into one of these three broadcategories:
• Emergency Issues:Outages, and issues that indicate a pending outage that canbe prevented, and emergency requests from other teams. Usually initiated byan alert sent by the monitoring system via SMS or pager. (Chapter 14)

7.3 Organizing Strategy for Operational Teams 161
• Normal Requests: Process work (repeatable processes that have not yet beenautomated), non-urgent trouble reports, informational questions, and initialconsulting that results in larger projects. Usually initiated by a request ticketsystem. (Section 14.1.3)
• Project Work: Small and large projects that evolve the system. Managed withwhatever project management style the team selects. (Section 12.4.2)
To assure that all sources and categories of work receive attention, we recommendthis simple organizing principle: people should always be working on projects,with exceptions made to assure that emergency issues receive immediate attentionand non-project customer requests are triaged and worked in a timely manner.
More specifically, at any given moment, the highest priority for one person onthe team should be responding to emergencies, the highest priority for one otherperson on the team should be responding to normal requests, and the rest of theteam should be focused on project work.
This is counter to the way operations teams often work: everyone runningfrom emergency to emergency with no time for project work. If there is no effortdedicated to improving the situation, the team will simply run from emergency toemergency until they are burned out.
Major improvements come from project work. Project work requires concen-tration and focus. If you are constantly being interrupted with emergency issuesand requests, you will not be able to get projects done. If an entire team is focusedon emergencies and requests, nobody is working on projects.
It can be tempting to organize an operations team into three subteams, eachfocusing on one source of work or one category of work. Either of these approacheswill create silos of responsibility. Process improvement is best done by the peopleinvolved in the process, not by observers.
To implement our recommended strategy, all members of the team focus onproject work as their main priority. However, team members take turns beingresponsible for emergency issues as they arise. This responsibility is called oncall.Likewise, team members take turns being responsible for normal requests fromother teams. This responsibility is called ticket duty.
It is common that oncall duty and ticket duty are scheduled in a rotation.For example, a team of eight people may use an eight-week cycle. Each person isassigned a week where he or she is on call: expected to respond to alerts, spendingany remaining time on projects. Each person is also assigned a different weekwhere he or she is on ticket duty: expected to focus on triaging and respondingto request tickets first, working on other projects only if there is remaining time.This gives team members six weeks out of the cycle that can be focused on projectwork.
162 Chapter 7 Operations in a Distributed World
Limiting each rotation to a specific personmakes for smoother handoffs to thenext shift. In such a case, there are two people doing the handoff rather than a largeoperations team meeting. If more than 25 percent of a team needs to be dedicatedto ticket duty and oncall, there is a serious problem with firefighting and a lack ofautomation.
The team manager should be part of the operational rotation. This practiceensures the manager is aware of the operational load and firefighting that goeson. It also ensures that nontechnical managers don’t accidentally get hired into theoperations organization.
Teams may combine oncall and ticket duty into one position if the amount ofwork in those categories is sufficiently small. Some teams may need to designatemultiple people to fill each role.
Project work is best done in small teams. Solo projects can damage a team bymaking members feel disconnected or by permitting individuals to work withoutconstructive feedback. Designs are better with at least some peer review. Withoutfeedback, members may end up working on projects they feel are important buthave marginal benefit. Conversely, large teams often get stalled by lack of consen-sus. In their case, focusing on shipping quickly overcomesmany of these problems.It helps by making progress visible to the project members, the wider team, andmanagement. Course corrections are easier to make when feedback is frequent.
The Agile methodology, discussed in Section 8.6, is an effective way toorganize project work.
..
Meta-work
There is also meta-work: meetings, status reports, company functions. Thesegenerally eat into project time and should be minimized. For advice, seeChapter 11, “Eliminating Time Wasters,” in the book Time Management forSystem Administrators by Limoncelli (2005).
7.3.1 Team Member Day TypesNow that we have established an organizing principle for the team’s work, eachteam member can organize his or her work based on what kind of day it is: aproject-focused day, an oncall day, or a ticket duty day.
Project-Focused DaysMost days should be project days for operational staff. Specifically, most daysshould be spent developing software that automates or optimizes aspects of theteam’s responsibilities. Non-software projects include shepherding a new launchor working with stakeholders on requirements for future releases.

7.3 Organizing Strategy for Operational Teams 163
Organizing the work of a team through a single bug tracking system has thebenefit of reducing time spent checking different systems for status. Bug trackingsystems provide an easy way for people to prioritize and track their work. On atypical project day the staff member starts by checking the bug tracking system toreview the bugs assigned to him or her, or possibly to review unassigned issues ofhigher priority the team member might need to take on.
Software development in operations tends to mirror the Agile methodology:rather than making large, sudden changes, many small projects evolve the systemover time. Chapter 12 will discuss automation and software engineering topics inmore detail.
Projects that do not involve software development may involve technicalwork. Moving a service to a new datacenter is highly technical work that cannotbe automated because it happens infrequently.
Operations staff tend not to physically touch hardware not just because of theheavy use of virtualmachines, but also because even physical machines are locatedin datacenters that are located far away. Datacenter technicians act as remotehands, applying physical changes when needed.
Oncall DaysOncall days are spent working on projects until an alert is received, usually bySMS, text message, or pager.
Once an alert is received, the issue is worked until it is resolved. Often thereare multiple solutions to a problem, usually including one that will fix the problemquickly but temporarily and others that are long-term fixes. Generally the quickfix is employed because returning the service to normal operating parameters isparamount.
Once the alert is resolved, a number of other tasks should always be done. Thealert should be categorized and annotated in some form of electronic alert jour-nal so that trends may be discovered. If a quick fix was employed, a bug shouldbe filed requesting a longer-term fix. The oncall person may take some time toupdate the playbook entry for this alert, thereby building organizational mem-ory. If there was a user-visible outage or an SLA violation, a postmortem reportshould be written. An investigation should be conducted to ascertain the rootcause of the problem. Writing a postmortem report, filing bugs, and root causesidentification are all ways that we raise the visibility of issues so that they getattention. Otherwise, we will continually muddle through ad hoc workaroundsand nothing will ever get better. Postmortem reports (possibly redacted for tech-nical content) can be shared with the user community to build confidence in theservice.
The benefit of having a specific person assigned to oncall duty at any giventime is that it enables the rest of the team to remain focused on projectwork. Studieshave found that the key to software developer productivity is to have long periods

164 Chapter 7 Operations in a Distributed World
of uninterrupted time. That said, if a major crisis appears, the oncall person willpull people away from their projects to assist.
If oncall shifts are too long, the oncall person will be overloaded with follow-up work. If the shifts are too close together, there will not be time to complete thefollow-up work. Many great ideas for new projects and improvements are firstimagined while servicing alerts. Between oncall shifts people should have enoughtime to pursue such projects.
Chapter 14 will discuss oncall in greater detail.
Ticket Duty DaysTicket duty days are spent working on requests from customers. Here the cus-tomers are the internal users of the service, such as other service teams that useyour service’s API. These are not tickets from external users. Those items shouldbe handled by customer support representatives.
While oncall is expected to have very fast reaction time, tickets generally havean expected response time measured in days.
Typical tickets may consist of questions about the service, which can lead tosome consulting on how to use the service. They may also be requests for activa-tion of a service, reports of problems or difficulties people are experiencing, and soforth. Sometimes tickets are created by automated systems. For example, a moni-toring system may detect a situation that is not so urgent that it needs immediateresponse and may open a ticket instead.
Some long-running tickets left from the previous shift may need follow-up.Often there is a policy that if we are waiting for a reply from the customer, everythree days the customer will be politely “poked” to make sure the issue is not for-gotten. If the customer is waiting for follow-up from us, there may be a policy thaturgent tickets will have a status update posted daily, with longer stretches of timefor other priorities.
If a ticket will not be completed by the end of a shift, its status should beincluded in the shift report so that the next person can pick up where the previousperson left off.
By dedicating a person to ticket duty, that individual can be more focusedwhile responding to tickets. All tickets can be triaged and prioritized. There ismoretime to categorize tickets so that trends can be spotted. Efficiencies can be realizedby batching up similar tickets to be done in a row.More importantly, by dedicatinga person to tickets, that individual should have time to go deeper into each ticket:to update documentation and playbooks along the way, to deep-dive into bugsrather than find superficial workarounds, to fix complex broken processes. Ticketduty should not be a chore, but rather should be part of the strategy to reduce theoverall work faced by the team.
Every operations team should have a goal of eliminating the need for peopleto open ticketswith them, similar to how there should always be a goal to automate
7.3 Organizing Strategy for Operational Teams 165
manual processes. A ticket requesting information is an indication that documen-tation should be improved. It is best to respond to the question by adding therequested information to the service’s FAQ or other user documentation and thendirecting the user to that document. Requests for service activation, allocations, orconfiguration changes indicate an opportunity to create a web-based portal or APItomake such requests obsolete. Any ticket created by an automated system shouldhave a corresponding playbook entry that explains how to process it, with a linkto the bug ID requesting that the automation be improved to eliminate the need toopen such tickets.
At the end of oncall and ticket duty shifts, it is common for the person to emailout a shift report to the entire team. This report should mention any trends noticedand any advice or status information to be passed on to the next person. The oncallend-of-shift report should also include a log ofwhich alertswere received andwhatwas done in response.
When you are oncall or doing ticket duty, that is your main project. Otherproject work that is accomplished, if any, is a bonus. Management should notexpect other projects to get done, nor should people be penalized for having theproper focus. When people end their oncall or ticket duty time, they should notcomplain that they weren’t able to get any project work done; their project, so tospeak, was ticket duty.
7.3.2 Other StrategiesThere are many other ways to organize the work of a team. The team can rotatethough projects focused on a particular goal or subsystem, it can focus on reducingtoil, or special days can be set aside for reducing technical debt.
Focus or ThemeOne can pick a category of issues to focus on for a month or two, changing themesperiodically or when the current theme is complete. For example, at the start of atheme, a number of security-related issues can be selected and everyone committo focusing on them until they are complete. Once these items are complete, thenext theme begins. Some common themes include monitoring, a particular serviceor subservice, or automating a particular task.
If the team cohesion was low, this can help everyone feel as if they are work-ing as a team again. It can also enhance productivity: if everyone has familiarizedthemselves with the same part of the code base, everyone can do a better job ofhelping each other.
Introducing a theme can also provide a certain amount of motivation. If theteam is looking forward to the next theme (because it is more interesting, novel, orfun), they will be motivated to meet the goals of the current theme so they can startthe next one.

166 Chapter 7 Operations in a Distributed World
Toil ReductionToil is manual work that is particularly exhausting. If a team calculates the numberof hours spent on toil versus normal project work, that ratio should be as low aspossible. Management may set a threshold such that if it goes above 50 percent,the team pauses all new features and works to solve the big problems that are thesource of so much toil. (See Section 12.4.2.)
Fix-It DaysAday (or series of days) can be set aside to reduce technical debt. Technical debt isthe accumulation of small unfinished amounts of work. By themselves, these bitsand pieces are not urgent, but the accumulation of them starts to become a problem.For example, a Documentation Fix-It Day would involve everyone stopping allother work to focus on bugs related to documentation that needs to be improved.Alternatively, a Fix-It Week might be declared to focus on bringing all monitoringconfigurations up to a particular standard.
Often teams turn fix-its into a game. For example, at the start a list of tasks (orbugs) is published. Prizes are given out to the people who resolve the most bugs.If done company-wide, teams may receive T-shirts for participating and/or prizesfor completing the most tasks.
7.4 Virtual OfficeManyoperations teamswork fromhome rather than an office. Sincework is virtual,with remote hands touching hardwarewhen needed, we canwork from anywhere.Therefore, it is common to work from anywhere. When necessary, the team meetsin chat rooms or other virtual meeting spaces rather than physical meeting rooms.When teams work this way, communicationmust be more intentional because youdon’t just happen to see each other in the office.
It is good to have a policy that anyone who is not working from the officetakes responsibility for staying in touch with the team. They should clearly andperiodically communicate their status. In turn, the entire team should take respon-sibility formaking sure remoteworkers do not feel isolated. Everyone should knowwhat their team members are working on and take the time to include everyone indiscussions. There are many tools that can help achieve this.
7.4.1 Communication MechanismsChat rooms are commonly used for staying in touch throughout the day. Chatroom transcripts should be stored and accessible so people can read what theymay have missed. There are many chat room “bots” (software robots that join the

7.5 Summary 167
chat room and provide services) that can provide transcription services, pass mes-sages to offline members, announce when oncall shifts change, and broadcast anyalerts generated by the monitoring system. Some bots provide entertainment: AtGoogle, a bot keeps track of who has received the most virtual high-fives. At StackExchange, a bot notices if anyone types the phrase “not my fault” and respondsby selecting a random person from the room and announcing this person has beenrandomly designated to be blamed.
Higher-bandwidth communication systems include voice and video systemsas well as screen sharing applications. The higher the bandwidth, the better thefidelity of communication that can be achieved. Text-chat is not good at conveyingemotions, while voice and video can. Always switch to higher-fidelity communi-cation systems when conveying emotions is more important, especially when anintense or heated debate starts.
The communication medium with the highest fidelity is the in-person meet-ing. Virtual teams greatly benefit from periodic in-person meetings. Everyonetravels to the same place for a few days of meetings that focus on long-termplanning, team building, and other issues that cannot be solved online.
7.4.2 Communication PoliciesMany teams establish a communication agreement that clarifies which methodswill be used in which situations. For example, a common agreement is that chatrooms will be the primary communication channel but only for ephemeral discus-sions. If a decision is made in the chat room or an announcement needs to bemade,it will be broadcast via email. Email is for information that needs to carry acrossoncall shifts or day boundaries. Announcements with lasting effects, such as majorpolicies or design decisions, need to be recorded in the team wiki or other docu-ment system (and the creation of said document needs to be announced via email).Establishing this chat–email–document paradigm can go a long way in reducingcommunication problems.
7.5 SummaryOperations is different from typical enterprise IT because it is focused on a par-ticular service or group of services and because it has more demanding uptimerequirements.
There is a tension between the operations team’s desire for stability and thedevelopers’ desire to get new code into production. There are many ways to reacha balance. Most ways involve aligning goals by sharing responsibility for bothuptime and velocity of new features.

168 Chapter 7 Operations in a Distributed World
Operations in distributed computing is done at a large scale. Processes thathave to be done manually do not scale. Constant process improvement andautomation are essential.
Operations is responsible for the life cycle of a service: launch, maintenance,upgrades, and decommissioning. Maintenance tasks include emergency and non-emergency response. In addition, related projects maintain and evolve the service.
Launches, decommissioning of services, and other tasks that are done infre-quently require an attention to detail that is best assured by use of checklists.Checklists ensure that lessons learned in the past are carried forward.
Themost productive use of time for operational staff is time spent automatingand optimizing processes. This should be their primary responsibility. In addition,two other kinds of work require attention. Emergency tasks need fast response.Nonemergency requests need to be managed such that they are prioritized andworked in a timely manner. To make sure all these things happen, at any giventime one person on the operations team should be focused on responding to emer-gencies; another should be assigned to prioritizing andworking on nonemergencyrequests. When team members take turns addressing these responsibilities, theyreceive the dedicated resources required to assure they happen correctly by sharingthe responsibility across the team. People also avoid burning out.
Operations teams generally work far from the actual machines that run theirservices. Since they operate the service remotely, they can work from anywherethere is a network connection. Therefore teams often work from different places,collaborating and communicating in a chat room or other virtual office. Many toolsare available to enable this type of organizational structure. In such an environ-ment, it becomes important to change the communication medium based on thetype of communication required. Chat rooms are sufficient for general commu-nication but voice and video are more appropriate for more intense discussions.Email is more appropriate when a record of the communication is required, or if itis important to reach people who are not currently online.
Exercises1. What is operations? What are its major areas of responsibilities?2. Howdoes operations in distributed computing differ from traditional desktop
support or enterprise client–server support?3. Describe the service life cycle as it relates to a service you have experience
with.4. Section 7.1.2 discusses the change-instability cycle. Draw a series of graphs
where the x-axis is time and the y-axis is the measure of stability. Each graphshould represent two months of project time.

Exercises 169
Each Monday, a major software release that introduces instability (9 bugs) isrolled out. On Tuesday through Friday, the team has an opportunity to roll outa “bug-fix” release, each of which fixes three bugs. Graph these scenarios:
(a) No bug-fix releases(b) Two bug-fix releases after every major release(c) Three bug-fix releases after every major release(d) Four bug-fix releases after every major release(e) No bug-fix release after odd releases, five bug-fix releases after even
releases
5. What do you observe about the graphs from Exercise 4?6. For a service you provide or have experience with, who are the stakeholders?
Which interactions did you or your team have with them?7. What are some of the ways operations work can be organized? How does this
compare to how your current team is organized?8. For a service you are involved with, give examples of work whose source is
life-cycle management, interacting with stakeholders, and process improve-ment and automation.
9. For a service you are involved with, give examples of emergency issues,normal requests, and project work.

This page intentionally left blank

This page intentionally left blank

Index
A-B testing, 232–233AAA (authentication, authorization, and
accounting), 222Abbott, M., 99–100Abstracted administration in
DevOps, 185Abstraction in loosely coupled
systems, 24Abts, D., 137Access Control List (ACL) mechanisms
description, 40Google, 41
Access controls in design for operations,40–41
Account creation automation example,251–252
Accuracy, automation for, 253ACID databases, 24Acknowledgments for alert messages,
355–356ACL (Access Control List) mechanisms
description, 40Google, 41
Active-active pairs, 126Active users, 366Adaptive Replacement Cache (ARC)
algorithm, 107Adopting design documents, 282–283Advertising systems in second web
era, 465After-hours oncall maintenance
coordination, 294Agents in collections, 352Aggregators, 352Agile Alliance, 189
Agile Manifesto, 189Agile techniques, 180
continuous delivery, 188–189feature requests, 264
AKF Scaling Cube, 99combinations, 104functional and service splits,
101–102horizontal duplication, 99–101lookup-oriented splits, 102–104
Alerts, 163, 285alerting and escalation systems, 345,
354–357monitoring, 333oncall for. See Oncallrules, 353thresholds, 49
Alexander, Christopher, 69Allen, Woody, 285Allspaw, John
automation, 249disaster preparedness tests, 318–320outage factors, 302postmortems, 301
Alternatives in design documents, 278Amazon
design process, 276Game Day, 318Simple Queue Service, 85
Amazon Elastic Compute Cloud(Amazon EC2), 472
Amazon Web Services (AWS), 59Analysis
in capacity planning, 375–376causal, 301–302
499
500 Index
Analysis (continued)crash reports, 129in monitoring, 345, 353–354
Ancillary resources in capacityplanning, 372
Andreessen, Marc, 181Anomaly detection, 354“Antifragile Organization” article,
315, 320Antifragile systems, 308–310Apache systems
Hadoop, 132, 467Mesos, 34web server forking, 114Zookeeper, 231, 363
API (Application ProgrammingInterface)
defined, 10logs, 340
Applicability in dot-bomb era,463–464
Application architectures, 69cloud-scale service, 80–85exercises, 93four-tier web service, 77–80message bus, 85–90reverse proxy service, 80service-oriented, 90–92single-machine web servers, 70–71summary, 92–93three-tier web service, 71–77
Application debug logs, 340Application logs, 340Application Programming Interface
(API)defined, 10logs, 340
Application servers in four-tier webservice, 79
Approvalscode, 47–48deployment phase, 214, 216–217design documents, 277, 281service launches, 159
Arbitrary groups, segmentationby, 104
ARC (Adaptive Replacement Cache)algorithm, 107
Architecture factors in service launches,157
Archivesdesign documents, 279–280email, 277
Art of Scalability, Scalable WebArchitecture, Processes, andOrganizations for the ModernEnterprise, 100
Artifactsartifact-scripted database changes,
185defined, 196
Assessments, 421–422Capacity Planning, 431–432Change Management, 433–434Disaster Preparedness, 448–450Emergency Response, 426–428levels, 405–407methodology, 403–407Monitoring and Metrics, 428–430New Product Introduction and
Removal, 435–436operational excellence, 405–407organizational, 411–412Performance and Efficiency, 439–441questions, 407Regular Tasks, 423–425Service Delivery: The Build Phase,
442–443Service Delivery: The Deployment
Phase, 444–445Service Deployment and
Decommissioning, 437–438services, 407–410Toil Reduction, 446–447
Asynchronous design, 29Atlassian Bamboo tool, 205Atomicity
ACID term, 24release, 240–241
Attack surface area, 79Auditing operations design, 42–43Augmentation files, 41–42Authentication, authorization, and
accounting (AAA), 222Authentication in deployment phase,
222Authors in design documents, 277, 282Auto manufacturing automation
example, 251
Index 501
Automation, 243–244approaches, 244–245baking, 219benefits, 154code amount, 269–270code reviews, 268–269compensatory principle, 246–247complementarity principle, 247–248continuous delivery, 190crash data collection and analysis,
129creating, 255–258DevOps, 182, 185–186exercises, 272–273goals, 252–254hidden costs, 250infrastructure strategies, 217–220issue tracking systems, 263–265language tools, 258–262left-over principle, 245–246lessons learned, 249–250multitenant systems, 270–271prioritizing, 257–258repair life cycle, 254–255software engineering tools and
techniques, 262–270software packaging, 266software restarts and escalation,
128–129steps, 258style guides, 266–267, 270summary, 271–272system administration, 248–249tasks, 153–155test-driven development, 267–268toil reduction, 257vs. tool building, 250–252version control systems, 265–266
AvailabilityCAP Principle, 21–22monitoring, 336
Availability and partition tolerance(AP), 24
Availability requirementscloud computing era, 469dot-bomb era, 460first web era, 455pre-web era, 452–453second web era, 465
Averages in monitoring, 358AWS (Amazon Web Services), 59
Backend replicas, load balancers with,12–13
Backendsmultiple, 14–15server stability, 336
Background in design documents,277–278
Background processes for containers, 61Backups in design for operations, 36Baked images for OS installation,
219–220Banned query lists, 130Bare metal clouds, 68Barroso, L. A.
canary requests, 131cost comparisons, 464disk drive failures, 133, 338
BASE (Basically Available Soft-stateservices) databases, 24
Baseboard Management Controller(BMC), 218
Basecamp application, 55bash (Bourne Again Shell), 259Batch size in DevOps, 178–179Bathtub failure curve, 133Beck, K., 189Behaviors in KPIs, 390–391Behr, K., 172Bellovin, S. M., 79Benchmarks in service platform
selection, 53Bernstein, Leonard, 487Berra, Yogi, 331Bibliography, 491–497Bidirectional learning in code review
systems, 269Big O notation, 476–479Bigtable storage system, 24Bimodal patterns in histograms, 361BIOS settings in deployment phase,
218Blackbox monitoring, 346–347Blacklists, 40–42Blade servers, 217–218“Blameless Postmortems and a Just
Culture” article, 301

502 Index
Blog Search, upgrading, 226Blue-green deployment, 230BMC (Baseboard Management
Controller), 218Botnets, 140Bots in virtual offices, 166–167Bottlenecks
automation for, 257DevOps, 179identifying, 96
Bourne Again Shell (bash), 259Bowen, H. K., 172Boyd, John, 296BSD UNIX, 460Buckets in histograms, 361Buffer thrashing, 71Bugs
code review systems, 269vs. feature requests, 263flag flips for, 232lead time, 201monitoring, 336new releases, 178priority for, 150unused code, 270
Buildsassessments, 442–443build console, 205build step, 203–204commit step, 202–203continuous deployment, 237continuous integration, 205–207develop step, 202DevOps, 185–186exercises, 209overview, 195–196package step, 204packages as handoff interface, 207–208register step, 204service delivery strategies, 197–200steps overview, 202–204summary, 208–209version-controlled, 191virtuous cycle of quality, 200–201waterfall methodology, 199
“Built to Win: Deep Inside Obama’sCampaign Tech” article, 307
Business impact in alert messages, 355Business listings in Google Maps, 42
c-SOX requirements, 43Cache hit ratio, 105, 109Cache hits, 104Cache misses, 104Caches, 104–105
effectiveness, 105persistence, 106placement, 106replacement algorithms, 107size, 108–110
Calendar documents for oncallschedules, 290–291
Canary process for upgrading services,227–228
Canary requests, 131Candea, G., 35CAP Principle, 21–24Capability Maturity Model (CMM),
405–407Capability monitoring, 348Capacity factors in service launches, 158Capacity models, 374Capacity planning (CP), 365
advanced, 371–381assessments, 431–432capacity limits, 366, 372–373core drivers, 373–374current usage, 368–369data analysis, 375–380delegating, 381engagement measuring, 374–375exercises, 386headroom, 370key indicators, 380–381launching new services, 382–384monitoring, 335normal growth, 369operational responsibility, 404planned growth, 369–370primary resources, 372provisioning time, 384–385resiliency, 370–371resource regression, 381–382standard, 366–371summary, 385–386timetables, 371
Cart size monitoring, 336Cascade load balancing, 74Cassandra system, 24
Index 503
Causal analysis, 301–302CCA (contributing conditions analysis),
301CDNs (content delivery networks),
114–116Central collectors, 352–353Certificate management, 79CFEngine system
configuration management, 261deployment phase, 213
Chalup, S. R., 204Change
documenting, 276limits, 41vs. stability, 149–151success rate, 201version control systems, 265
Change-instability cycles, 150Change Management (CM)
assessments, 433–434operational responsibility, 404
Channels in message bus architectures,86
Chaos Gorilla, 315Chaos Monkey, 315Chapman, Brent, 323Chat room bots for alerts, 293Chat rooms for virtual offices, 166–167Checklists
oncall pre-shift responsibilities, 294service launches, 157, 159
Chef software framework, 213Cheswick, W. R., 79“Choose Your Own Adventure” talk, 173Chubby system, 231, 314Churchill, Winston, 119Classification systems for oncall, 292Clos networking, 137Cloud computing era (2010-present),
469–472Cloud-scale service, 80–81
global load balancing methods, 82,83–85
internal backbones, 83–84points of presence, 83–85
CM (configuration management)languages, 260–262
CMDB (Configuration ManagementDatabase), 222
CMM (Capability Maturity Model),405–407
CNN.com web site, 13–14Code
approval process, 47–48automated reviews, 268–269lead time, 201live changes, 236sufficient amount, 269–270
Code latency in DevOps, 178–179Code pushes
description, 225, 226failed, 239–240
Code review system (CRS), 268–269Cognitive systems engineering (CSE)
approach, 248Cold caches, 106Cold storage factor in service platform
selection, 54Collaboration in DevOps, 183Collection systems, 345
central vs. regional collectors,352–353
monitoring, 349–353protocol selection, 351push and pull, 350–351server component vs. agents vs.
pollers, 352Colocation
CDNs, 114service platform selection, 65–66
Command-line flags, 231Comments in style guides, 267Commit step in build phase, 202–203Commodity servers, 463Communication
emergency plans, 317–318postmortems, 302virtual offices, 166–167
Compensation in oncall schedules, 290Compensatory automation principle,
244, 246–247Compiled languages, 260Complementarity principle, 244, 247–248Compliance in platform selection, 63Comprehensiveness in continuous
deployment, 237Computation, monitoring, 353–354Confidence in service delivery, 200

504 Index
Configurationautomating, 254deployment phase, 213–214in designing for operations, 33–34DevOps, 185four-tier web service, 80monitoring, 345–346, 362–363
Configuration management (CM)languages, 260–262
Configuration Management Database(CMDB), 222
Configuration management strategy inOS installation, 219
Configuration packages, 220Conflicting goals, 396–397Congestion problems, 15Consistency
ACID term, 24CAP Principle, 21
Consistency and partition tolerance(CP), 24
Constant scaling, 475–476Containers, 60–62Content delivery networks (CDNs),
114–116Content distribution servers, 83Continuous builds in DevOps, 186Continuous Delivery, 223Continuous delivery (CD)
deployment phase, 221DevOps, 189–192practices, 191principles, 190–191
Continuous deploymentDevOps, 186upgrading live services, 236–239
Continuous improvement techniqueDevOps, 153, 183service delivery, 201
Continuous integration (CI) in buildphase, 205–207
Continuous tests, 186Contract questions for hosting
providers, 64–65Contributing conditions analysis (CCA),
301Control in platform selection, 64Convergent orchestration, 213–214Cookies, 76–78
Coordination for oncall schedules, 290Core drivers
capacity planning, 373–374defined, 366
Coredumps, 129Corporate emergency communications
plans, 317–318Corpus, 16–17Correlation coefficient, 367Correlation in capacity planning,
375–378Costs
caches, 105cloud computing era, 469–470dot-bomb era, 464–465first web era, 459platform selection, 63–64pre-web era, 454second web era, 468–469service platform selection, 66–67TCO, 172
Counters in monitoring, 348–350, 358CPU core sharing, 59Crash-only software, 35Crashes
automated data collection andanalysis, 129
software, 128–129Craver, Nick, 430CRS (code review system), 268–269CSE (cognitive systems engineering)
approach, 248Current usage in capacity planning,
368–369Customer functionality, segmentation
by, 103Customers in DevOps, 177Cycle time, 196
Daemons for containers, 61Daily oncall schedules, 289Dark launches, 233, 383–384Dashboards for alerts, 293Data analysis in capacity planning,
375–380Data import controls, 41–42Data scaling in dot-bomb era, 463Data sharding, 110–112Database-driven dynamic content, 70

Index 505
Database views in live schemachanges, 234
Datacenter failures, 137–138Dates in design documents, 277, 282Dawkins, Richard, 475DDoS (distributed denial-of-service)
attacks, 140Deallocation of resources, 160Dean, Jeff
canary requests, 131scaling information, 27
Debois, Patrick, 180Debug instrumentation, 43Decommissioning services, 404
assessments, 437–438description, 156overview, 160
Dedicated wide area networkconnections, 83
Default policies, 40Defense in depth, 119Defined level in CMM, 406–407Degradation, graceful, 39–40, 119Delays in continuous deployment,
238Delegating capacity planning, 381Delegations of authority in Incident
Command System, 324Deming, W. Edwards, 172Denial-of-service (DoS) attacks, 140Dependencies
containers, 60–61service launches, 158
Deployment and deployment phase,195, 197, 211
approvals, 216–217assessments, 444–445configuration step, 213–214continuous delivery, 221defined, 196DevOps, 185exercises, 223frequency in service delivery, 201infrastructure as code, 221–222infrastructure automation strategies,
217–220installation step, 212–213installing OS and services, 219–220KPIs, 392–393
operations console, 217physical machines, 217–218platform services, 222promotion step, 212summary, 222–223testing, 215–216virtual machines, 218
Descriptions of outages, 301Descriptive failure domains, 127Design documents, 275
adopting, 282–283anatomy, 277–278archive, 279–280changes and rationale, 276exercises, 284overview, 275–276past decisions, 276–277review workflows, 280–282summary, 283templates, 279, 282, 481–484
Design for operations, 31access controls and rate limits,
40–41auditing, 42–43backups and restores, 36configuration, 33–34data import controls, 41–42debug instrumentation, 43documentation, 43–44exception collection, 43–44exercises, 50features, 45–48graceful degradation, 39–40hot swaps, 38–39implementing, 45–48improving models, 48–49monitoring, 42operational requirements, 31–32queue draining, 35–36redundancy, 37replicated databases, 37–38software upgrades, 36startup and shutdown, 34–35summary, 49–50third-party vendors, 48toggles for features, 39
Design patterns for resiliency. SeeResiliency
Design patterns for scaling. See Scaling

506 Index
Detailsdesign documents, 278postmortems, 302
Develop step in build phase, 202Developers for oncall, 287DevOps, 171–172
Agile, 188–189approach, 175–176automation, 182, 185–186batch size, 178–179build phase, 197–198business level, 187–188continuous delivery, 189–192continuous improvement, 183converting to, 186–188description, 172–173exercises, 193experimentation and learning,
178feedback, 177–178history, 180–181integration, 182nontechnical practices, 183–184recommended reading, 487relationships, 182release engineering practices, 186SRE, 181starting, 187strategy adoption, 179–180summary, 192vs. traditional approach, 173–175values and principles, 181–186workflow, 176–177
DevOps Cafe Podcast, 180, 200DevOps culture, 171“DevOps Days” conferences, 180Diagnostics, monitoring, 337Dickson, C., 345Dickson model, 334diff tool, 33Differentiated services, 233Direct measurements, 347–348Direct orchestration, 213–214DiRT (Disaster Recovery Testing), 316,
318, 320–323Disaster preparedness, 307, 448–450
antifragile systems, 308–309DiRT tests, 320–323exercises, 330
fire drills, 312–313implementation and logistics, 318–320incident Command System, 323–329mindset, 308–310random testing, 314–315risk reduction, 309–311scope, 317–318service launches, 158service testing, 313–314starting, 316–317summary, 329–330training for individuals, 311–312training for organizations, 315–317
Disaster Recovery Testing (DiRT), 316,318, 320–323
Disksaccess time, 26caches, 106–107failures, 132–133
Distributed computing and cloudscloud computing era, 469–472conclusion, 472–473dot-bomb era, 459–465exercises, 473first web era, 455–459origins overview, 451–452pre-web era, 452–455second web era, 465–469
Distributed computing overview, 9–10CAP Principle, 21–24distributed state, 17–20exercises, 30load balancer with multiple backend
replicas, 12–13loosely coupled systems, 24–25server trees, 16–17servers with multiple backends, 14–15simplicity importance, 11speed issues, 26–29summary, 29–30visibility at scale, 10–11
Distributed denial-of-service (DDoS)attacks, 140
Distributed state, 17–20Distributed version control systems
(DVCSs), 265Diurnal cycles, 332Diurnal usage patterns, 359Diversity, monitoring, 334

Index 507
DNSdeployment phase, 222round robin, 72–73
Docker system, 61, 219Documentation
design documents. See Designdocuments
design for operations, 43–44service launches, 158stakeholder interactions, 154
Doerr, John, 389Domains, failure, 126–128Domain-specific languages (DSLs), 244DoS (denial-of-service) attacks, 140Dot-bomb era (2000–2003), 459–465Downsampling, monitoring, 339Downtime
containers, 61pre-web era, 453in upgrading live services, 225
Drain tool, 254Draining process, 112Drains, queue, 35–36“DRAM Errors in the Wild: A
Large-Scale Field Study” article, 134DSLs (domain-specific languages), 244Dual load balancers, 76Durability in ACID term, 24DVCSs (distributed version control
systems), 265Dynamic content with web servers, 70Dynamic resource allocation, 138Dynamic roll backs, 232Dynamo system, 24
“Each Necessary, But Only JointlySufficient” article, 302
ECC (error-correcting code) memory,131–132
Edge cases, 153Edwards, Damon
DevOps benefits, 172-173DevOps Cafe podcast, 180, 188, 200
Effectiveness of caches, 10580/20 rule for operational features, 47Elements of Programming Style, 11Eliminating tasks, 155EMA (exponential moving average),
367, 379
Emailalerts, 292–293archives, 277
Embedded knowledge in DevOps,177–178, 187
Emergency hotfixes, 240Emergency issues, 160Emergency Response (ER), 403, 426–428Emergency tasks, 156Employee human resources data
updates example, 89–90Empowering users, automation for, 253Emptying queues, 35Encryption in four-tier web service, 79End-of-shift oncall responsibilities, 299End-to-end process in service delivery,
200Engagement
defined, 366measuring, 374–375
Enterprise Integration Practices: Designing,Building, and Deploying MessagingSolutions, 87
Environment-related files, 220Ephemeral computing, 67Ephemeral machines, 58Erlang language, 236Error Budgets, 152
case study, 396–399DevOps, 184
Error-correcting code (ECC) memory,131–132
Escalationalert messages, 345, 354–357automated, 128–129monitoring, 333third-party, 298
Etsy blog, 256EU Data Protection Directive
platform selection factor, 63requirements, 43
Eventual consistency, 21Exception collection, 43–44Exceptional situations. See OncallExecution in service delivery, 201Executive summaries in design
documents, 277, 282Expand/contract technique, 234–235Experimentation in DevOps, 178

508 Index
Expertise of cloud providers factor inservice platform selection, 66
Explicit oncall handoffs, 299Exponential moving average (EMA),
367, 379Exponential scaling, 476
Face-to-face discussions in DevOps, 187Facebook
chat dark launch, 384recommended reading, 488
Factorial scaling, 477Fail closed actions, 40Fail open actions, 40Failed code pushes, 239–240Failed RAM chips, 123Failure condition in alert messages, 354“Failure Trends in a Large Disk Drive
Population,” 133, 338Failures, 10, 120. See also Resiliency
overload, 138–141physical. See Physical failures
Fair queueing, 113Fan in, 15Fan out, 15Farley, D., 190, 223“Fault Injection in Production,” 320Feature requests vs. bugs, 263Features in design for operations, 46
building, 45toggles, 39, 230–232writing, 47–48
Federal Emergency ManagementAdministration (FEMA) web site,324
Feedbackdesign for operations, 47–48DevOps, 177–178, 186–187
Feeding from queues, 113Felderman, B., 137FEMA (Federal Emergency Management
Administration) web site, 324Files, environment-related, 220Finance monitoring, 336Fire drills, 312–313First web era: bubble (1995-2000),
455–459Fisher, M., 99–100Fitts, P., 246
Fitts’s list, 246Fix-it days, 166FIXME comments in style guides, 267Flag flipping, 39, 230–232Flexibility in service-oriented
architectures, 91Flows
build phase, 197defined, 196
Focus in operational teams, 165–166Follow-up oncall work, 296Forecasting in capacity planning,
378–380Formal workflows, 280Four-tier web service, 77–78
application servers, 79configuration options, 80encryption and certificate
management, 79frontends, 78–79security, 79
Fox, A., 35FreeBSD containers, 60Frequency
deployment, 201measurement, 333oncall, 291–292
Frontends in four-tier web service, 78–79Frying images, 219–220Fulghum, P., 188, 215Functional splits in AKF Scaling Cube,
101–102Future capacity planning, 49
Gallagher, S., 307Game Day exercises
Amazon, 318DevOps, 184disaster preparedness, 315, 318–320
“Gamedays on the Obama Campaign”article, 320
Ganapathi, A., 141Ganeti system, 240, 254Gatekeeper tool, 233Gates, 196Gauges in monitoring, 348–350Geographic diversity factor in service
platform selection, 54Geolocation in cloud-scale service, 81

Index 509
GFS (Google File System), 466Gibson, William, 402Gilbert, S., 23Global load balancing (GLB), 82–83,
83–85Go Continuous Delivery tool, 205Goals
automation, 252–254conflicting, 396–397design documents, 277, 282unified, 397–398
GoogleACLs, 41AdSense, 465AppEngine, 54Blog Search upgrading, 226bots, 167Chubby system, 231, 314Disaster Recovery Testing, 316, 318graceful degradation of apps, 40message bus architectures, 86oncall, 291outages, 119postmortem reports, 301recommended reading, 488self-service launches at, 159SRE model, 181timestamps, 341–342
“Google DiRT: The View from SomeoneBeing Tested” article, 320–323
Google Error Budget KPI, 396–399Google File System (GFS), 466Google Maps
load balancing, 83–84local business listings, 42
Google Omega system, 34“Google Throws Open Doors to Its
Top-Secret Data Center” article, 320Graceful degradation, 39–40, 119Graphical user interfaces (GUIs) for
configuration, 34Graphs, monitoring, 358Greatness, measuring, 402–403Gruver, G., 188, 215“Guided Tour through Data-center
Networking” article, 137“Guideline for Postmortem
Communication” blog post, 302GUIs (graphical user interfaces) for
configuration, 34
Hadoop system, 132, 467Handoff interface, packages as, 207–208Handoffs, oncall, 299Hangs, software, 129–130Hardware components
dot-bomb era, 460load balancers, 136resiliency, 120–121
Hardware output factor in serviceplatform selection, 67–68
Hardware qualification, 156Hardware virtual machines (HVMs), 58Hash functions, 110Hash prefix, segmentation by, 103Hbase storage system, 23–24Head of line blocking, 112Headroom in capacity planning, 370Health checks
deployment phase, 213queries, 12
Heartbeat requests, 129Help
oncall. See Oncallscaling, 252
Hidden costs of automation, 250Hierarchy, segmentation by, 104High availability
cloud computing era, 471dot-bomb era, 461–462first web era, 457–458pre-web era, 454second web era, 466–467
High-level design, 278High-speed network counters, 349Histograms, 361–362“Hit” logs, 340Hits, cache, 104Hoare, C. A. R., 9Hogan, C., 204Hohpe, G., 87Home computers in dot-bomb era, 460Horizontal duplication in AKF Scaling
Cube, 99–101Hosting providers, contract questions
for, 64–65Hot-pluggable devices, 38–39Hot spares vs. load sharing, 126Hot-swappable devices, 38–39Hotfixes, 240

510 Index
“How Google Sets Goals: OKRs” video,389
HTTP (Hyper-Text Transfer Protocol)load balancing, 75overview, 69
Hudson tool, 205Human error, 141–142Human processes, automating, 154Human resources data updates example,
89–90Humble, J.
continuous delivery, 190, 223DevOps Cafe Podcast, 188, 200
HVMs (hardware virtual machines), 58Hybrid load balancing strategy, 75Hyper-Text Transfer Protocol (HTTP)
load balancing, 75overview, 69
IaaS (Infrastructure as a Service), 51–54IAPs (Incident Action Plans), 326–327Ideals for KPIs, 390Image method of OS installation,
219–220Impact focus for feature requests, 46Implementation of disaster
preparedness, 318–320Import controls, 41–42Improvement levels in operational
excellence, 412–413Improving models in design for
operations, 48–49In-house service provider factor in
service platform selection, 67Incident Action Plans (IAPs), 326–327“Incident Command for IT: What We
Can Learn from the FireDepartment” talk, 323
Incident Command System, 323–324best practices, 327–328example use, 328–329Incident Action Plan, 326–327IT operations arena, 326public safety arena, 325
Incident Commanders, 324–325, 328Index lookup speed, 28Individual training for disaster
preparedness, 311–312Informal review workflows, 280
Infrastructureautomation strategies, 217–220DevOps, 185service platform selection, 67
Infrastructure as a Service (IaaS), 51–54Infrastructure as code, 221–222Inhibiting alert messages, 356–357Initial level in CMM, 405Innovating, 148Input/output (I/O)
overload, 13virtual environments, 58–59
Installationin deployment phase, 212–213OS and services, 219–220
Integration in DevOps, 182Intel OKR system, 389Intentional delays in continuous
deployment, 238Intermodal shipping, 62Internal backbones in cloud-scale
service, 83–85Internet Protocol (IP) addresses
deployment phase, 222load balancers, 72–73restrictions on, 40
Introducing new features, flag flips for,232
Introspection, 10Invalidation of cache entry, 108Involvement in DevOps, 183IP (Internet Protocol) addresses
deployment phase, 222load balancers, 72–73restrictions on, 40
Isolation in ACID term, 24ISPs for cloud-scale service, 83Issues
naming standards, 264tracking systems, 263–265
IT operations arena in IncidentCommand System, 326
ITIL recommended reading, 488
j-SOX requirements, 43Jacob, Adam, 173Jails
containers, 60processes, 55
Index 511
Java counters, 350JCS (joint cognitive system), 248Jenkins CI tool, 205Job satisfaction in service delivery, 201Joint cognitive system (JCS), 248JSON transmitted over HTTP, 351
Kamp, P.-H., 478–479Kartar, J., 183Keeven, T., 99Kejariwal, A., 371Kernighan, B., 11Key indicators in capacity planning,
380–381Key performance indicators (KPIs),
387–388creating, 389–390Error Budget case study, 396–399evaluating, 396exercises, 399–400machine allocation example,
393–396monitoring example, 336–337overview, 388–389summary, 399
Keywords in alerts, 304Kim, Gene, 171–172Klau, Rick, 389Kotler, Philip, 365KPIs. See Key performance indicators
(KPIs)Krishnan, Kripa, 319–320
Labor laws, 43Lame-duck mode, 35“LAMP” acronym, 461Language tools for automation, 258–262Latency
cloud computing era, 471cloud-scale service, 81–82code, 178–179monitoring, 334, 336service platform selection, 54SRE vs. traditional enterprise IT, 149
Latency load balancing, 74Latency Monkey, 315Launch leads, 159Launch Readiness Engineers (LREs),
157–158
Launch Readiness Reviews (LRRs), 159Launches
dark, 233services, 156–160, 382–384
Layer 3 and 4 load balancers, 73Layer 7 load balancers, 73Lead times in service delivery, 201Leaf servers, 17“Lean Manufacturing,” 172Learning DevOps, 178Least Frequently Used (LFU) algorithm,
107Least Loaded (LL) algorithm, 13
load balancing, 74problems, 13–14
Least Loaded with Slow Start loadbalancing, 74
Least Recently Used (LRU) algorithm,107
Lee, J. D., 249Left-over automation principle, 244–246Legacy system backups and restores, 36Lessons learned in automation, 249–250Level of service abstraction in service
platform selection, 52–56Levels of improvement in operational
excellence, 412–413Levy, Steven, 320LFU (Least Frequently Used) algorithm,
107Limoncelli, T. A.
DiRT tests, 320meta-work, 162packages, 204test event planning, 319time management, 256
Linear scaling, 476–477Link-shortening site example, 87–89Linking tickets to subsystems, 263–264Linux in dot-bomb era, 460–461Live code changes, 236Live restores, 36Live schema changes, 234–236Live service upgrades. See Upgrading
live servicesLoad balancers
failures, 134–136first web era, 456with multiple backend replicas, 12–13

512 Index
Load balancers (continued)with shared state, 75three-tier web service, 72–74
Load sharing vs. hot spares, 126Load shedding, 139Load testing, 215Local business listings in Google Maps,
42Local labor laws, 43Logarithmic scaling, 476Logistics in disaster preparedness,
318–320Logistics team in Incident Command
System, 326Loglinear scaling, 476–477Logs, 11, 340
approach, 341design documents, 282timestamps, 341–342
Long-term analysis, 354Long-term fixes
oncall, 299–300vs. quick, 295–296
Longitudinal hardware failure study,133–134
Look-for’s, 407Lookup-oriented splits in AKF Scaling
Cube, 102–104Loosely coupled systems, 24–25Lower-latency services in cloud
computing era, 469LREs (Launch Readiness Engineers),
157–158LRRs (Launch Readiness Reviews), 159LRU (Least Recently Used) algorithm,
107Lynch, N., 23
MACD (moving averageconvergence/divergence) metric,367, 378–379
MACD signal line, 367Machine Learning service, 55Machines
automated configuration example, 251defined, 10failures, 134KPI example, 393–396
Madrigal, A. C., 316Main threads, 112
Maintenance alert messages, 356Major bug resolution monitoring, 336Major outages, 307Malfunctions, 121
defined, 120distributed computing approach, 123MTBF, 121–122traditional approach, 122–123
Managed level in CMM, 406–407Management support in design
documents, 282Manual scaling, 153Manual stop lists, 238Many-to-many communication in
message bus architectures, 85–86Many-to-one communication in message
bus architectures, 85–86MapReduce system, 466–467Master-master pairs, 126Master of Disaster (MoD) in Wheel of
Misfortune game, 311–312Master servers, 20Master-slave split-brain relationship, 22Math terms, 367“Mature Role for Automation” blog
post, 249MAUs (monthly active users), 366, 373McHenry, Stephen, 234McHenry Technique, 234–235McKinley, D., 256McLean, Malcom, 62MCollective service, 86MD5 algorithm, 110Mean time between failures (MTBF),
120–122, 125Mean time to repair (MTTR), 125Mean time to restore service in service
delivery, 201Measurements, 332
engagement, 374–375frequency, 333greatness, 402–403monitoring. SeeMonitoringscaling, 97
Medians, monitoring, 359Memory
caches, 104–106ECC, 131–132failures, 123, 131–132

Index 513
virtual machines, 59web servers, 71
Mesos system, 34Message bus architectures, 85–86
designs, 86employee human resources data
updates example, 89–90link-shortening site example, 87–89reliability, 87
Messages, alert. See AlertsMeta-monitoring, 339–340Meta-processes, automating, 155Meta-work, 162Metrics, 11, 332Mindset in disaster preparedness,
308–310Minimum monitor problem, 337–338Misses, cache, 104“Model for Types and Levels of Human
Interaction with Automation”article, 248
Monitoring, 331–332alerting and escalation management,
354–357analysis and computation,
353–354assessments, 428–430blackbox vs. whitebox, 346–347collections, 350–353components, 345–346configuration, 362–363consumers, 334–336design for operations, 42exercises, 342–343, 364histograms, 361–362key indicators, 336–337, 380–381logs, 340–342meta-monitoring, 339–340overview, 332–333percentiles, 359protocol selection, 351push vs. pull, 350–351retention, 338–339sensing and measurement, 345–350service launches, 158stack ranking, 360storage, 362summary, 342, 363–364system integration, 250
uses, 333visualization, 358–362
Monitoring and Metrics (MM), 404,428–430
Monthly active users (MAUs), 366, 373Moving average
convergence/divergence (MACD)metric, 367, 378–379
Moving averagescapacity planning, 377defined, 367
MTBF (mean time between failures),120–122, 125
MTTR (mean time to repair), 125Multiple backend replicas, load
balancers with, 12–13Multiple backends, servers with, 14–15Multiple data stores in three-tier web
service, 77Multitenant systems, automation,
270–271Multithreaded code, 112
N + 1 configurations, 458N + 2 configurations, 458–459N + M redundancy, 124–125“NAK” (negatively acknowledge) alerts,
355Naming standards, 264Native URLs, 115Natural disasters factor in service
platform selection, 53Nearest load balancing, 81Nearest by other metric load balancing,
81Nearest with limits load balancing, 81Negatively acknowledge (“NAK”)
alerts, 355Netflix
disaster preparedness, 315virtual machines, 59
Netflix Aminator framework, 219Netflix Simian Army, 315Networks
access speed, 26–27counters, 349interface failures, 133protocols, 489
New feature reviews in DevOps, 183

514 Index
New Product Introduction and Removal(NPI/NPR)
assessments, 435–436operational responsibility, 404
New services, launching, 382–384Nielsen, Jerri, 225Non-blocking bandwidth, 137Non-functional requirements term, 32Non-goals in design documents, 277Nonemergency tasks, 156Nontechnical DevOps practices, 183–184Normal growth in capacity planning, 369Normal requests, 161NoSQL databases, 24Notification types in oncall, 292–293
Objectives in Incident CommandSystem, 324
Observe, Orient, Decide, Act (OODA)loop, 296–297
O’Dell’s Axiom, 95OKR system, 389On-premises, externally run services
factor in service platformselection, 67
Oncall, 285after-hours maintenance coordination,
294alert responsibilities, 295–296alert reviews, 302–304benefits, 152calendar, 290–291, 355continuous deployment, 238defined, 148designing, 285–286DevOps, 183end-of-shift responsibilities, 299excessive paging, 304–305exercises, 306frequency, 291–292long-term fixes, 299–300notification types, 292–293onduty, 288OODA, 296–297operational rotation, 161–162overview, 163–164playbooks, 297–298postmortems, 300–302pre-shift responsibilities, 294
regular responsibilities, 294–295rosters, 287schedule design, 288–290service launches, 158SLAs, 286–287summary, 305–306third-party escalation, 298
Onduty, 288One percent testing, 233One-to-many communication in
message bus architectures, 85–86One-way pagers, 293OODA (Observe, Orient, Decide, Act)
loop, 296–297Open source projects in dot-bomb era,
460OpenStack system, 240Operating system installation, 219–220Operational excellence, 401
assessment levels, 405–407assessment methodology, 403–407assessment questions and look-for’s,
407exercises, 415greatness measurement, 402–403improvement levels, 412–413organizational assessments, 411–412overview, 401–402service assessments, 407–410starting, 413–414summary, 414
Operational Health, monitoring, 335Operational hygiene in service launches,
158–159Operational requirements in designing
for operations, 31–32Operational responsibilities (OR),
403–404Operational teams, 160–162
fix-it days, 166focus, 165–166in Incident Command System, 326oncall days, 163–164organizing strategies, 160–166project-focused days, 162–163ticket duty days, 164–165toil reduction, 166
Operations, 147–148change vs. stability, 149–151

Index 515
design for. See Design for operationsexercises, 168–169organizing strategies for operational
teams, 160–166at scale, 152–155service life cycle, 155–160SRE overview, 151–152SRE vs. traditional enterprise IT,
148–149summary, 167–168virtual offices, 166–167
Operations console in deploymentphase, 217
Operator errors, 171Oppenheimer, D. L., 141, 171Opportunity costs in service platform
selection, 66–67Optimizing level in CMM, 406Orders of magnitude, 478Organizational assessments in
operational excellence, 411–412Organizational divisions, segmentation
by, 103Organizational memory, 157Organizational training for disaster
preparedness, 315–317OS installation, 219–220Outages
code review systems, 269defined, 120disasters. See Disaster preparedness
Overflow capacity factor in serviceplatform selection, 67
Overload failuresDoS and DDoS attacks, 139load shedding, 139scraping attacks, 140–141traffic surges, 138–139
Oversubscribed systemsdefined, 53spare capacity, 125
PaaS (Platform as a Service), 51, 54–55Packages
build phase, 204configuration, 220continuous delivery, 190deployment phase, 213distributing, 266
as handoff interface, 207–208pinning, 212registering, 206
Pager storms, 356Pagers for alerts, 293, 304–305Panics, 128Parasuraman, R., 248Paravirtualization (PV), 58–59Parity bits, 131–132Partition tolerance in CAP Principle,
22–24Parts and components failures, 131–134Past decisions, documenting, 276–277Patch lead time in service delivery, 201Patterson, D. A., 141PCI DSS requirements, 43Percentiles in monitoring, 359Performance
caches, 105testing, 215
Performance and Efficiency (PE)assessments, 439–441operational responsibility, 404
Performance regressions, 156, 215Performant systems, 10Perl language, 259–260, 262Persistence in caches, 106Perspective in monitoring, 333Phased roll-outs, 229Phoenix Project, 172Physical failures, 131
datacenters, 137–138load balancers, 134–136machines, 134parts and components, 131–134racks, 136–137
Physical machinesdeployment phase, 217–218failures, 134service platform selection, 57
Pie charts, 358Pinheiro, E.
drive failures, 133, 338memory errors, 134
Pinning packages, 212PKI (public key infrastructure), 40Planned growth in capacity planning,
369–370Planning in disaster preparedness,
318–319
516 Index
Planning team in Incident CommandSystem, 326
Platform as a Service (PaaS), 51, 54–55Platform selection. See Service platform
selectionPlauger, P., 11Playbooks
oncall, 297–298process, 153
Pods, 137Points of presence (POPs), 83–85Pollers, 352Post-crash recovery, 35Postmortems, 152
communication, 302DevOps, 184oncall, 291, 300–302purpose, 300–301reports, 301–302templates, 484–485
Power failures, 34, 133Power of 2 mapping process, 110–111Practical Approach to Large-Scale Agile
Development: How HP TransformedHP LaserJet FutureSmart Firmware,188
Practice of System and NetworkAdministration, 132, 204
Pre-checks, 141Pre-shift oncall responsibilities, 294Pre-submit checks in build phase,
202–203Pre-submit tests, 267Pre-web era (1985-1994), 452–455Prefork processing module, 114Premature optimization, 96Prescriptive failure domains, 127Primary resources
capacity planning, 372defined, 366
Prioritizingautomation, 257–258feature requests, 46for stability, 150
Privacy in platform selection, 63Private cloud factor in platform
selection, 62Private sandbox environments, 197Proactive scaling solutions, 97–98
Problems to solve in DevOps, 187Process watchers, 128Processes
automation benefits, 253containers, 60instead of threads, 114
Proctors for Game Day, 318Product Management (PM) monitoring,
336Production candidates, 216Production health in continuous
deployment, 237Project-focused days, 162–163Project planning frequencies, 410Project work, 161–162Promotion step in deployment phase,
212Propellerheads, 451Proportional shedding, 230Protocols
collections, 351network, 489
Prototyping, 258Provider comparisons in service
platform selection, 53Provisional end-of-shift reports, 299Provisioning
in capacity planning, 384–385in DevOps, 185–186
Proxiesmonitoring, 352reverse proxy service, 80
Public cloud factor in platformselection, 62
Public Information Officers in IncidentCommand System, 325–326
Public key infrastructure (PKI), 40Public safety arena in Incident
Command System, 325Publishers in message bus architectures,
85Publishing postmortems, 302PubSub2 system, 86Pull monitoring, 350–351Puppet systems
configuration management, 261deployment phase, 213multitenant, 271
Push conflicts in continuousdeployment, 238

Index 517
Push monitoring, 350–351“Pushing Millions of Lines of Code Five
Days a Week” presentation, 233PV (paravirtualization), 58–59Python language
libraries, 55overview, 259–261
QPS (queries per second)defined, 10limiting, 40–41
Quadratic scaling, 476Quality Assurance monitoring, 335Quality assurance (QA) engineers, 199Quality measurements, 402Queries in HTTP, 69Queries of death, 130–131Queries per second (QPS)
defined, 10limiting, 40–41
Queues, 113benefits, 113draining, 35–36issue tracking systems, 263messages, 86variations, 113–114
Quick fixes vs. long-term, 295–296
RabbitMQ service, 86Rachitsky, L., 302Rack diversity, 136Racks
failures, 136locality, 137
RAID systems, 132RAM
for caching, 104–106failures, 123, 131–132
Random testing for disasterpreparedness, 314–315
Rapid development, 231–232Rate limits in design for operations,
40–41Rate monitoring, 348Rationale, documenting, 276Re-assimilate tool, 255Read-only replica support, 37Real-time analysis, 353Real user monitoring (RUM), 333
Reboots, 34Recommendations in postmortem
reports, 301Recommended reading, 487–489Recovery-Oriented Computing (ROC),
461Recovery tool, 255Redis storage system, 24, 106Reduced risk factor in service delivery,
200Reducing risk, 309–311Reducing toil, automation for, 257Redundancy
design for operations, 37file chunks, 20for resiliency, 124–125servers, 17
Reengineering components, 97Refactoring, 97Regional collectors, 352–353Registering packages, 204, 206Regression analysis, 375–376Regression lines, 376Regression tests for performance, 156,
215Regular meetings in DevOps, 187Regular oncall responsibilities, 294–295Regular software crashes, 128Regular Tasks (RT)
assessments, 423–425operational responsibility, 403
Regulating system integration, 250Relationships in DevOps, 182Release atomicity, 240–241Release candidates, 197Release engineering practice in DevOps,
186Release vehicle packaging in DevOps,
185Releases
defined, 196DevOps, 185
Reliabilityautomation for, 253message bus architectures, 87
Reliability zones in service platformselection, 53–54
Remote hands, 163Remote monitoring stations, 352

518 Index
Remote Procedure Call (RPC) protocol,41
Repair life cycle, 254–255Repeatability
automation for, 253continuous delivery, 190
Repeatable level in CMM, 405Replacement algorithms for caches, 107Replicas, 124
in design for operations, 37–38load balancers with, 12–13three-tier web service, 76updating, 18
Reports for postmortems, 301–302Repositories in build phase, 197Reproducibility in continuous
deployment, 237Requests in updating state, 18“Resilience Engineering: Learning to
Embrace Failure” article, 320Resiliency, 119–120
capacity planning, 370–371DevOps, 178exercises, 143failure domains, 126–128human error, 141–142malfunctions, 121–123overload failures, 138–141physical failures. See Physical failuressoftware failures, 128–131software vs. hardware, 120–121spare capacity for, 124–126summary, 142
Resolutionalert messages, 355monitoring, 334
Resource pools, 99Resource regression in capacity
planning, 381–382Resource sharing
service platform selection, 62–65virtual machines, 59
Resourcescontention, 59, 238deallocation, 160dynamic resource allocation, 138
Responsibilities for oncall, 294–296Restarts, automated, 128–129Restores in design for operations, 36
Retention monitoring, 338–339Reverse proxy service, 80Review workflows in design documents,
280–282Reviewers in design documents, 277, 281Revising KPIs, 391–392Revision numbers in design documents,
277, 282Rework time factor in service delivery,
201Rich, Amy, 51Richard, Dylan, 320Risk reduction, 309–311Risk system, 24Risk taking in DevOps, 178Rituals in DevOps, 178Robbins, Jesse
communication benefits, 186DiRT tests, 320test planning, 319–320
ROC (Recovery-Oriented Computing),461
Roll back, 239Roll forward, 239Rolling upgrades, 226Roosevelt, Franklin D., 275Roosevelt, Theodore, 307Root cause analysis, 301–302Root servers, 17Rossi, Chuck, 233Rosters, oncall, 287Round-robin for backends, 12Round robin (RR) load balancing, 72–74Royce, D. W. W., 175RPC (Remote Procedure Call) protocol,
41RSS feeds of build status, 205Rubin, A. D., 79Ruby language, 259–260RUM (real user monitoring), 333“Run run run dead” problem, 462
SaaS (Software as a Service), 51, 55–56Safeguards, automation for, 253Safety for automation, 249Salesforce.com, 55–56Sample launch readiness review survey,
157–158Sandbox environments, 197

Index 519
Satellites in cloud-scale service, 83Scalability Rules: 50 Principles for Scaling
Web Sites, 100Scale
operations at, 152–155visibility at, 10–11
Scaling, 95, 475AKF Scaling Cube, 99–104automation for, 252Big O notation, 476–479caching, 104–110cloud computing era, 471constant, linear, and exponential,
475–476content delivery networks, 114–116data sharding, 110–112database access, 37dot-bomb era, 462–463exercises, 116–117first web era, 456–457general strategy, 96–98monitoring, 350PaaS services, 54pre-web era, 454queueing, 113–114recommended reading, 489in resiliency, 135scaling out, 99–101scaling up, 98–99second web era, 467–468small-scale computing systems, 470summary, 116threading, 112–113three-tier web service, 76
Schedulescontinuous deployment, 238oncall, 288–291
Schema changes, 234–236Schlossnagle, Theo, 31, 172Schroeder, B., 134Scope in disaster preparedness, 317–318Scraping attacks, 140–141Scripting languages, 259–260SDLC (Software Development Life
Cycle), 184–185SeaLand company, 62Second web era (2003-2010), 465–469Secondary resources in capacity
planning, 372
Security in four-tier web service, 79See, K. A., 249Segments in lookup-oriented splits,
102–103Selenium WebDriver project, 215Self-service launches at Google, 159Self-service requests, 154Send to Repairs tool, 255Senge, Peter, 147Sensing and measurement systems,
345–350Server trees, 16–17, 80ServerFault.com, 102Servers
collections, 352defined, 10with multiple backends, 14–15
Service assessments, operationalexcellence, 407–410
Service deliveryassessments, 442–445build phase. See Buildsdeployment phase. See Deployment
and deployment phaseflow, 196
Service Deployment andDecommissioning (SDD), 404,437–438
Service latency in cloud computing era,471
Service level agreements (SLAs)Error Budgets, 152
load shedding, 139monitoring, 334oncall, 286–287
Service Level Indicators (SLIs), 334Service Level Objectives (SLOs), 334Service Level Targets (SLTs), 334Service life cycle, 155
decommissioning services, 160stages, 156–160
Service management monitoring, 334Service-oriented architecture (SOA),
90–91best practices, 91–92flexibility, 91support, 91
Service platform selection, 51–52colocation, 65–66containers, 60–61

520 Index
Service platform selection (continued)exercises, 68level of service abstraction, 52–56machine overview, 56physical machines, 57resource sharing levels, 62–65strategies, 66–68summary, 68virtual machines, 57–60
Service splits in AKF Scaling Cube,101–102
Service testing in disaster preparedness,313–314
Servicesassessing, 407–410decommissioning, 160defined, 10installing, 219–220restart, 34
SRE vs. traditional enterprise IT, 148–149Session IDs, 767-day actives (7DA), 373Sharding, 110–112Shards, 16, 18–19Shared oncall responsibilities, 183Shared pools, 138Shared state in load balancing, 75Shaw, George Bernard, 387Shedding, proportional, 230Shell scripting languages, 259Sheridan, T. B., 248“Shewhart cycle,” 172Shifts, oncall, 164–165, 291–292Shipping containers, 62Short-lived machines, 58Short-term analysis, 353Shutdown in design for operations,
34–35Sign-off for design documents, 281–282Signal line crossover, 367Silencing alert messages, 356–357Silos, 174Simian Army, 315Simple Network Management Protocol
(SNMP), 351Simple Queue Service (SQS), 86Simplicity
importance, 11review workflows, 280
Singapore MAS requirements, 43
Single-machine web servers, 70–71Site Reliability Engineering (SRE),
147–148DevOps, 181overview, 151–152vs. traditional enterprise IT, 148–149
Site reliability practices, 151–152Size
batches, 178–179caches, 108–110
SLAs (service level agreements)Error Budgets, 152load shedding, 139monitoring, 334oncall, 286–287
SLIs (Service Level Indicators), 334SLOs (Service Level Objectives), 334Sloss, Benjamin Treynor
Google Error Budget, 396site reliability practices, 151
Slow start algorithm, 13SLTs (Service Level Targets), 334Small-scale computing systems, scaling,
470SMART (Specific, Measurable,
Achievable, Relevant, andTime-phrased) criteria, 388
Smart phone apps for alerts, 293Smoke tests, 192SMS messages for alerts, 293SNMP (Simple Network Management
Protocol), 351SOA (service-oriented architecture),
90–91best practices, 91–92flexibility, 91support, 91
Soft launches, 148, 382Software as a Service (SaaS), 51, 55–56Software Development Life Cycle
(SDLC), 184–185Software engineering tools and
techniques in automation, 262–263code reviews, 268–269issue tracking systems, 263–265packages, 266style guides, 266–267, 270sufficient code, 269–270test-driven development, 267–268version control systems, 265–266

Index 521
Software engineers (SWEs), 199Software failures, 128
crashes, 128–129hangs, 129–130queries of death, 130–131
Software load balancers, 136Software packages. See PackagesSoftware resiliency, 120–121Software upgrades in design for
operations, 36Solaris containers, 60Solid-state drives (SSDs)
failures, 132speed, 26
Source control systems, 206SOX requirements, 43Spafford, G., 172Spare capacity, 124–125
load sharing vs. hot spares, 126need for, 125–126
Spear, S., 172Special constraints in design documents,
278Special notations in style guides, 267Specific, Measurable, Achievable,
Relevant, and Time-phrased(SMART) criteria, 388
Speedimportance, 10issues, 26–29
Spell check services, abstraction in, 24Spindles, 26Split brain, 23Split days oncall schedules, 289Spolsky, J., 121Sprints, 189SQS (Simple Queue Service), 86SRE (Site Reliability Engineering),
147–148DevOps, 181overview, 151–152vs. traditional enterprise IT, 148–149
SSDs (solid-state drives)failures, 132speed, 26
Stability vs. change, 149–151Stack Exchange, 167Stack ranking, 360Stakeholders, 148
Standard capacity planning, 366–368Standardized shipping containers, 62Startup in design for operations, 34–35States, distributed, 17–20Static content on web servers, 70Status of design documents, 277, 282Steal time, 59Stickiness in load balancing, 75Storage systems, monitoring, 345, 362Stranded capacity, 57Stranded resources in containers, 61Style guides
automation, 266–267, 270code review systems, 269
Sub-linear scaling, 477Subscribers in message bus
architectures, 86Subsystems, linking tickets to, 263–264Suggested resolution in alert messages,
355Summarization, monitoring, 339Super-linear scaling, 477Survivable systems, 120SWEs (software engineers), 199Synthesized measurements, 347–348System administration, automating,
248–249, 253System logs, 340System testing
in build phase, 203vs. canarying, 228–229overview, 215
T-bird database system, 103Tags in repositories, 208Taking down services for upgrading,
225–226Targeting in system integration, 250Tasks
assessments, 423–425automating, 153–155
TCO (total cost of ownership), 172TDD (test-driven development), 267–268Team managers in operational rotation,
162TeamCity tool, 205Teams, 160–162
automating processes, 155fix-it days, 166focus, 165–166

522 Index
Teams (continued)in Incident Command System, 326oncall days, 163–164organizing strategies, 160–166project-focused days, 162–163ticket duty days, 164–165toil reduction, 166virtual offices, 166–167
Technical debt, 166Technical practices in DevOps, 184–185Technology
cloud computing era, 472dot-bomb era, 460–461first web era, 455–456pre-web era, 453–454second web era, 465–466
Telles, Marcel, 401Templates
design documents, 279, 282, 481–484postmortem, 484–485
Terminology for Incident CommandSystem, 324
Test-driven development (TDD),267–268
Testsvs. canarying, 228–229continuous deployment, 237deployment phase, 215–216DevOps, 186disaster preparedness. See Disaster
preparednessearly and fast, 195environments, 197flag flips for, 232–233
Text-chat, 167Text files for configuration, 33Text messages for alerts, 293Theme for operational teams, 165–166Theory, recommended reading for, 488Thialfi system, 86“Things You Should Never Do” essay,
121Third-party vendors
design for operations, 48oncall escalation, 298
30-day actives (30DA), 373Thompson, Ken, 245Threading, 112–113Three-tier web service, 71–72
load balancer methods, 74
load balancer types, 72–73load balancing with shared state,
75scaling, 76–77user identity, 76
Ticket dutydescription, 161–162ticket duty days, 164–165
Time Management for SystemAdministrators, 162, 256
Time savings, automation for, 253Time series, 366Time to live (TTL) value for caches,
108Time zones in oncall schedules, 289Timed release dates, 232Timelines of events, 301Timestamps in logs, 341–342Timetables in capacity planning, 371Titles in design documents, 277, 282TODO comments in style guides, 267,
270Toggling features, 39, 230–233Toil
defined, 244reducing, 166, 257, 446–447
Tool building vs. automation, 250–252Torvalds, Linus, 276Total cost of ownership (TCO), 172Tracebacks, 129Tracking system integration, 250Traffic
defined, 10surges, 138–139
Trailing averages, 13Training
disaster preparedness, 311–312,315–317
oncall, 287Transit ISPs, 83Trends, monitoring, 333Triggers, 353Trustworthiness of automation, 249Tseitlin, A., 315, 320TTL (time to live) value for caches, 108Tufte, E. R., 362Tumblr Invisible Touch system, 218Twain, Mark, 243Twitter, 103Two-way pagers, 293

Index 523
UAT (User Acceptance Testing), 216Ubuntu Upstart system, 34Unaligned failure domains, 127Undersubscribed systems, 53Unified goals, 397–398Uninterrupted time, 164Uninterruptible power supply (UPS)
systems, 34Unit tests in build phase, 203UNIX, recommended reading, 489Unused code, bugs in, 270Updating state, 18Upgrades
Blog Search, 226overview, 156software, 36
Upgrading live services, 225–226blue-green deployment, 230canary process, 227–228continuous deployment, 236–239exercises, 241–242failed code pushes, 239–240live code changes, 236live schema changes, 234–236phased roll-outs, 229proportional shedding, 230release atomicity, 240–241rolling upgrades, 226–227summary, 241taking down services for, 225–226toggling features, 230–233
Uploading to CDNs, 115UPS (uninterruptible power supply)
systems, 34Uptime in SRE vs. traditional enterprise
IT, 149Urgent bug count, monitoring, 336Urgent bug resolution, monitoring, 336URLs for CDNs, 115U.S. Federal Emergency Management
Administration web site, 324User Acceptance Testing (UAT), 216User identity in three-tier web service,
76User satisfaction, monitoring, 336User-specific data, global load balancing
with, 82–83User stories, 189User wait time, automation for, 253
Utilization, segmentation by, 103Utilization Limit load balancing, 74
Vagrant framework, 219Value streams in DevOps, 176Varnish HTTP accelerator, 478VCSs (version control systems), 265–266Velocity in DevOps, 179Vendor lock-in, 56Vendors
design for operations, 48oncall escalations, 298
Version conflicts in containers, 60–61Version control systems (VCSs), 265–266Version-controlled builds, 191Vertical integration, 64Views in live schema changes, 234Virtual machine monitor (VMM), 58–59Virtual machines
benefits, 58deployment phase, 218disadvantages, 59–60IaaS, 52I/O, 58–59overview, 57service platform selection, 66
Virtual offices, 166–167Virtuous cycle of quality, 200–201Visibility at scale, 10–11Visual Display of Quantitative Information,
362Visualization, monitoring, 333, 358–362VMM (virtual machine monitor), 58–59Voice calls for alerts, 293Volatile data in OS installation, 219–220
Wait timeautomation for, 253service delivery, 201
WAN (wide area network) connections,83
Warmed caches, 106Watchdog timers, 130Waterfall methodology
overview, 173–175phases, 199
WAUs (weekly active users), 373“Weathering the Unexpected” article,
320

524 Index
Web “Hit” logs, 340“Web Search for a Planet: The Google
Cluster Architecture” article, 464Web servers, single-machine, 70–71Web services
four-tier, 77–80three-tier, 71–77
Weber, W.-D.drive errors, 133, 338memory errors, 134
Weekly active users (WAUs), 373Weekly oncall schedules, 288–289Weighted RR load balancing, 74Wheel of Misfortune game, 311–312“When the Nerds Go Marching in”
article, 316, 320Whitebox monitoring, 346–347Whitelists, 40–42“Why Do Internet Services Fail, and
What Can Be Done about It?”paper, 141, 171
Wickens, C. D., 248Wide area network (WAN) connections,
83
Wilde, Oscar, 345Willis, John, 180, 200Willy Wonka, 195Woolf, B., 87Worker threads, 112Workflows
design documents, 280–282DevOps, 176–177
Working from home, 166–167Writes in updating state, 18
X-axes in AKF Scaling Cube, 99–101X-Forwarded-For headers, 73
Y-axes in AKF Scaling Cube, 99,101–102
Yan, B., 371“You’re Doing It Wrong” article, 479Young, M., 188, 215
Z-axes in AKF Scaling Cube, 99, 102–104Zero line crossover, 367Zones, Solaris, 60ZooKeeper system, 231, 363

![Index [ptgmedia.pearsoncmg.com]ptgmedia.pearsoncmg.com/images/0201787911/index/gongindex.pdf · generateCertificate method 201, 225 generateCertificates method 201, 225 generateCertPath](https://img.pdfslide.us/doc/110x75/5f060d677e708231d4160d45/index-generatecertificate-method-201-225-generatecertificates-method-201-225.jpg)

![Index [ptgmedia.pearsoncmg.com]ptgmedia.pearsoncmg.com/images/1587201232/index/1587201232index.pdf · manual configuration, 338–344 specifications, 335 CiscoWorks Firewall MC,](https://img.pdfslide.us/doc/110x75/5ec4ea3f2d6ea64d964e08e6/index-manual-coniguration-338a344-specifications-335-ciscoworks-firewall.jpg)