Embed Size (px)
Citation preview
DRO Deakin Research Online, Deakin University’s Research Repository Deakin University CRICOS Provider Code: 00113B
The potential cost-effectiveness and equity impacts of restricting television advertising of unhealthy food and beverages to Australian children
Citation: Brown, Victoria, Ananthapavan, Jaithri, Veerman, Lennert, Sacks, Gary, Lal, Anita, Peeters, Anna, Backholer, Kathryn and Moodie, Marjory 2018, The potential cost-effectiveness and equity impacts of restricting television advertising of unhealthy food and beverages to Australian children, Nutrients, vol. 10, no. 5, article number: 622, pp. 1-14.
DOI: http://www.dx.doi.org/10.3390/nu10050622
© 2018, The Authors
Reproduced by Deakin University under the terms of the Creative Commons Attribution Licence
Downloaded from DRO: http://hdl.handle.net/10536/DRO/DU:30110444
nutrients
Article
The Potential Cost-Effectiveness and Equity Impactsof Restricting Television Advertising of UnhealthyFood and Beverages to Australian Children
Vicki Brown 1,2,* ID , Jaithri Ananthapavan 1,2 ID , Lennert Veerman 3,4, Gary Sacks 1 ID ,Anita Lal 1,2, Anna Peeters 1, Kathryn Backholer 1 and Marjory Moodie 1,2
1 Centre for Population Health Research, School of Health and Social Development,Global Obesity Centre (GLOBE), Deakin University, Geelong, VIC 3220, Australia;[email protected] (J.A.); [email protected] (G.S.);[email protected] (A.L.); [email protected] (A.P.);[email protected] (K.B.); [email protected] (M.M.)
2 Deakin Health Economics, Centre for Population Health Research, School of Health and SocialDevelopment, Deakin University, Geelong, VIC 3220, Australia
3 Cancer Research Division, Cancer Council NSW, Woolloomooloo, Sydney, NSW 2011, Australia;[email protected]
4 School of Medicine, Griffith University, Gold Coast, QLD 4222, Australia* Correspondence: [email protected]; Tel.: +61-39-244-6432
Received: 26 March 2018; Accepted: 11 May 2018; Published: 15 May 2018�����������������
Abstract: Television (TV) advertising of food and beverages high in fat, sugar and salt (HFSS)influences food preferences and consumption. Children from lower socioeconomic position (SEP)have higher exposure to TV advertising due to more time spent watching TV. This paper sought toestimate the cost-effectiveness of legislation to restrict HFSS TV advertising until 9:30 pm, and toexamine how health benefits and healthcare cost-savings differ by SEP. Cost-effectiveness modellingwas undertaken (i) at the population level, and (ii) by area-level SEP. A multi-state multiple-cohortlifetable model was used to estimate obesity-related health outcomes and healthcare cost-savingsover the lifetime of the 2010 Australian population. Incremental cost-effectiveness ratios (ICERs) werereported, with assumptions tested through sensitivity analyses. An intervention restricting HFSS TVadvertising would cost AUD5.9M (95% UI AUD5.8M–AUD7M), resulting in modelled reductions inenergy intake (mean 115 kJ/day) and body mass index (BMI) (mean 0.352 kg/m2). The interventionis likely to be cost-saving, with 1.4 times higher total cost-savings and 1.5 times higher health benefitsin the most disadvantaged socioeconomic group (17,512 HALYs saved (95% UI 10,372–25,155); totalcost-savings AUD126.3M (95% UI AUD58.7M–196.9M) over the lifetime) compared to the leastdisadvantaged socioeconomic group (11,321 HALYs saved (95% UI 6812–15,679); total cost-savingsAUD90.9M (95% UI AUD44.3M–136.3M)). Legislation to restrict HFSS TV advertising is likely to becost-effective, with greater health benefits and healthcare cost-savings for children with low SEP.
Keywords: economic evaluation; cost-effectiveness; obesity; pediatric
1. Introduction
Childhood obesity is a significant public health issue worldwide [1]. Obesity in childhood is a riskfactor for overweight and obesity in adulthood [2], resulting in both short-term and long-term negativehealth effects and highlighting the importance of obesity prevention for children and adolescents.Childhood and adolescent overweight and obesity also have a socioeconomic gradient. Youth with alow socioeconomic position (SEP) are at a greater risk of overweight and obesity compared to youth
Nutrients 2018, 10, 622; doi:10.3390/nu10050622 www.mdpi.com/journal/nutrients
Nutrients 2018, 10, 622 2 of 14
with a higher SEP [3]. Population obesity prevention interventions that reduce these inequities areincreasingly being recognised as a critical component of successful obesity prevention efforts [4].
A diet high in fat, salt and sugar (HFSS) is a key modifiable risk factor for childhood obesityand diet-related non-communicable diseases. In 2010, the World Health Organization (WHO)concluded that television (TV) advertising influences children’s food preferences, purchase requestsand consumption patterns and published a set of recommendations on food marketing to children(of which TV advertising is one component) [5].
Evidence also suggests there is a socioeconomic gradient in TV viewing patterns [6–8]. Australianchildren with a lower SEP are more likely to watch TV and for longer periods of time compared tothose with a higher SEP [6,7]. This means that children with a lower SEP are likely to be exposed togreater levels of HFSS TV advertising compared to children with a higher SEP. Restricting HFSS TVadvertising therefore has the potential to not only reduce obesity prevalence among youth, but alsoreduce socioeconomic inequities in obesity prevalence.
Several countries have introduced regulatory schemes to reduce or restrict HFSS advertising.Statutory regulations have resulted in bans on TV advertising to children in countries or jurisdictionssuch as Quebec, Sweden and Norway [9]. Commercial broadcasters in Australia must meet legislatedbroadcasting standards, and the Australian Communications and Media Authority’s (ACMA) ChildrenTelevision Standards (CTS) currently restrict the broadcasting of advertising during so-called ‘P’(pre-school) programs [10]. The food industry introduced two self-regulatory, voluntary codes aimedat reducing exposure of children to marketing, managed by the Australian Food and Grocery Council(AFGC) [11].
The effectiveness of combinations of government and self-regulation in reducing the exposure ofchildren to HFSS TV advertising is however limited [12]. Critics of Australia’s self-regulated schemesnote the relatively weak commitments that form the initiatives, along with the lack of sanctions forbreaches of the codes [13]. Much of the TV content that Australian children aged 0–14 years watched in2016 was not specifically categorised as children’s content, with 20% of the top 30 programs classifiedas reality programs, 7% light entertainment and 20% movies [14]. A report by the Australian NationalPreventive Health Agency (ANPHA) in 2012 [15] found that while advertising of non-core foodsduring children’s classified (‘C’) programs is low, rates of HFSS advertising during children’s peakfree-to-air (FTA) viewing times is up to 6.5 advertisements per hour. Many Australian children aretherefore exposed to advertising of HFSS foods whilst watching shows not specifically classifiedfor children.
Despite the strong program logic that links exposure to HFSS TV advertising to increased HFSSconsumption and obesity, establishment of the effectiveness of its restriction is challenging [16]. Realworld evidence from jurisdictions that have implemented bans on HFSS advertising has shownpromising results on intermediate outcomes, including a reduction in expenditure on HFSS foodsfollowing a ban on TV advertising in Quebec [17] and a reduction in HFSS drink expenditure followinga move to self-regulation and co-regulation in the UK [18]. Rigorous estimation of effectivenessfrom an obesity prevention perspective is however complicated by the environmental-type natureof the intervention, the potential role of confounding factors and the time lag between the change inexposure and change in body mass index (BMI) being longer than many study timeframes. A relativelysmall number of studies have quantified the obesity-related effects of reducing children’s exposure toHFSS TV advertising using burden of disease or cost-effectiveness approaches and “best available”evidence [19–23]. The key limitation of these modelling studies has been the reliance on individualstudies for the estimation of effect of TV advertising restrictions on BMI [24–27]. This has resultedin the modelled effect size varying, from −0.03 kg/m2 [23] to −1 kg/m2 [19,20] (SupplementaryInformation 1).
This paper aims to strengthen the evidence base on the potential cost-effectiveness of legislationto restrict HFSS TV advertising from an obesity prevention perspective, by (i) undertaking analysesusing a synthesis of the evidence; (ii) accounting for differences in benefits and costs by SEP; and
Nutrients 2018, 10, 622 3 of 14
(iii) exploring thresholds for minimum BMI effect required to achieve cost-effectiveness. This willprovide important information on the potential population level impact of the intervention, plus newinformation on the intervention’s potential to reduce health inequities across socioeconomic groups.
2. Materials and Methods
2.1. Current Practice
Australian legislation currently prohibits TV advertising during ‘P’ classified programs [10].TV networks must screen at least 260 h of Children’s (‘C’) programs per year in ‘C’ time bands(7 am–8:30 am and 4 pm–8:30 pm weekdays, 7 am–8:30 pm weekends and school holidays). ‘C’programs must not contain advertisements of more than 5 min in total per 30 min and content mustnot mislead or deceive children, put undue pressure on purchases or contain promotions by popularchildren’s characters immediately before, during or after a ‘C’ or ‘P’ period [10].
2.2. The Intervention
The proposed intervention was defined as legislation to implement time-based restrictionsof unhealthy food and beverage marketing to children under 16 years of age on FTA TV until9:30 pm [28,29]. Peak TV viewing periods for Australian children are from 8 am–9 am and7 pm–8 pm [30], and therefore legislation would reduce exposure to HFSS advertising. It should benoted that older adolescents and adults may also benefit from reduced exposure to HFSS advertising,however modelling has been undertaken in line with current policy recommendations (focusing onbenefits for children under 16 years) [26,27]. Whilst children aged under five years may also be exposedto less HFSS TV advertising as a result of the intervention, this was considered less likely given theirrelatively young age and higher likelihood of watching ‘P’ programs. The intervention effect estimationwas therefore limited to children aged between five and 15 years. We assumed that baseline viewingin the intervention population occurs during the time period of the proposed intervention on FTA TV,and tested assumptions around viewing patterns on FTA vs. non-FTA TV in sensitivity analyses.
2.3. Assessment of Benefit
A scoping review of the literature was conducted to inform the evidence of effect. Searcheswere conducted by one author (VB), using the Scopus and EBSCOHost academic databases. “Goldstandard” evidence to inform modelling would consist of BMI effect estimates from reduced exposureto HFSS TV advertising from high-quality randomised controlled trials (RCTs) conducted in naturalsettings [19,23]. A search was conducted for such evidence (Supplementary Information 2), with norelevant studies identified in the literature.
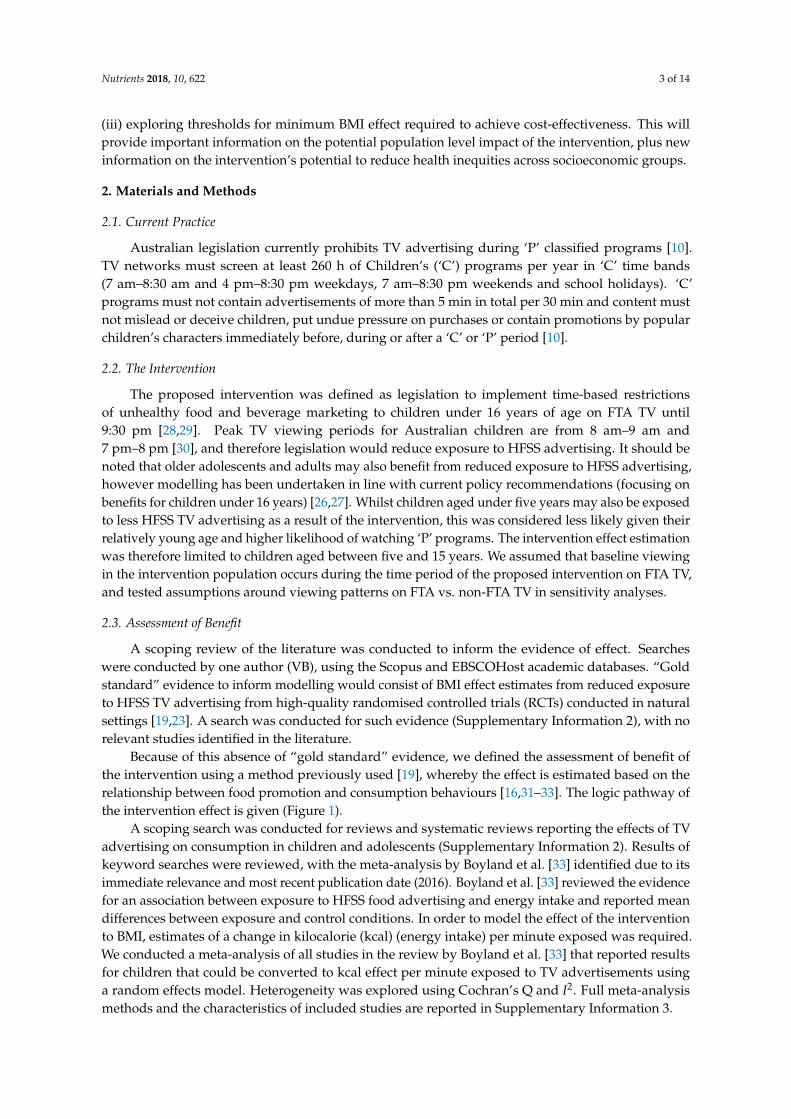
Because of this absence of “gold standard” evidence, we defined the assessment of benefit ofthe intervention using a method previously used [19], whereby the effect is estimated based on therelationship between food promotion and consumption behaviours [16,31–33]. The logic pathway ofthe intervention effect is given (Figure 1).
A scoping search was conducted for reviews and systematic reviews reporting the effects of TVadvertising on consumption in children and adolescents (Supplementary Information 2). Results ofkeyword searches were reviewed, with the meta-analysis by Boyland et al. [33] identified due to itsimmediate relevance and most recent publication date (2016). Boyland et al. [33] reviewed the evidencefor an association between exposure to HFSS food advertising and energy intake and reported meandifferences between exposure and control conditions. In order to model the effect of the interventionto BMI, estimates of a change in kilocalorie (kcal) (energy intake) per minute exposed was required.We conducted a meta-analysis of all studies in the review by Boyland et al. [33] that reported resultsfor children that could be converted to kcal effect per minute exposed to TV advertisements usinga random effects model. Heterogeneity was explored using Cochran’s Q and I2. Full meta-analysismethods and the characteristics of included studies are reported in Supplementary Information 3.
Nutrients 2018, 10, 622 4 of 14
Nutrients 2018, 10, x FOR PEER REVIEW 4 of 13
Figure 1. Logic pathway for modelling the effect of the intervention. BMI= body mass index. HFSS =
high in fat, salt and sugar. Hrs = hours. Kcal = kilocalorie. Mins = minutes. TV = television.
Studies included in the meta‐analysis reported effects from acute exposure in controlled settings.
Consumption under experimental conditions may not necessarily reflect consumption in natural
settings, due to factors such as scrutiny, context and differences in time horizons and choice sets [34].
However, limited evidence on the external validity of such study findings exists. We therefore
applied a crude adjustment factor for translation of experimental effects to the real‐world, assuming
that 50% of the effect would be maintained under non‐experimental conditions (Table 1).
Compensatory intake effect at mealtimes was also included, given evidence suggesting that children
may compensate for snacks between meals by consuming less at mealtimes [35]. We therefore
reduced the effect estimate, to conservatively estimate overall impact of exposure to HFSS TV
advertisements on energy intake in children by assuming increased energy intake was a product of
snacking between meals (Table 1). The derived estimate of effect was multiplied by estimates of time
per day spent watching HFSS TV ads by age and SEP (Table 1, Supplementary information 4). The
change in mean energy intake as a result of the intervention was then converted to change in mean
BMI using the validated equations by Hall et al. [36], with assumptions tested in sensitivity analyses.
2.4. Assessment of Costs
Fixed costs were estimated as the cost of passing legislation [37] (Table 1). Ongoing costs
comprised the salary costs of two administration and compliance officers [21], including salary on‐
costs [38–40]. Potential loss of revenue to TV networks resulting from reduced advertising was tested
in sensitivity analysis. From a societal perspective, the base case assumed that potential loss of
revenue for the food and advertising industries would be compensated by revenue for the
advertisement of other products or consumer expenditure on other goods and services. Data on
healthcare costs were obtained from the Australian Institute of Health and Welfare (AIHW) for 2001
[41], and inflated to 2010 Australian dollar prices using the Health Price Index [42].
2.5. Cost‐Effectiveness Modelling
Cost‐effectiveness modelling was undertaken from a limited societal perspective, with the time
horizon for estimating costs, cost‐savings and health benefits being rest‐of‐life or 100 years for the
2010 Australian population. Costs, cost‐savings and health benefits were discounted at 3% and were
presented as 2010 values.
Modelling was undertaken as (i) a whole population analysis, and (ii) an analysis by area‐level
SEP, using the Socio‐Economic Indexes for Areas (SEIFA) IRSD quintiles 1 (most disadvantaged) and
5 (least disadvantaged) [43]. A proportional multi‐state, multiple cohort life table model was used to
estimate obesity‐related health outcomes and healthcare cost‐savings. The model used data from the
Australian Health Survey 2011–2012 [44] and disease epidemiology from the Global Burden of
Figure 1. Logic pathway for modelling the effect of the intervention. BMI = body mass index.HFSS = high in fat, salt and sugar. Hrs = hours. Kcal = kilocalorie. Mins = minutes. TV = television.
Studies included in the meta-analysis reported effects from acute exposure in controlled settings.Consumption under experimental conditions may not necessarily reflect consumption in naturalsettings, due to factors such as scrutiny, context and differences in time horizons and choice sets [34].However, limited evidence on the external validity of such study findings exists. We therefore applieda crude adjustment factor for translation of experimental effects to the real-world, assuming that 50%of the effect would be maintained under non-experimental conditions (Table 1). Compensatory intakeeffect at mealtimes was also included, given evidence suggesting that children may compensate forsnacks between meals by consuming less at mealtimes [35]. We therefore reduced the effect estimate,to conservatively estimate overall impact of exposure to HFSS TV advertisements on energy intakein children by assuming increased energy intake was a product of snacking between meals (Table 1).The derived estimate of effect was multiplied by estimates of time per day spent watching HFSS TVads by age and SEP (Table 1, Supplementary Information 4). The change in mean energy intake as aresult of the intervention was then converted to change in mean BMI using the validated equations byHall et al. [36], with assumptions tested in sensitivity analyses.
2.4. Assessment of Costs
Fixed costs were estimated as the cost of passing legislation [37] (Table 1). Ongoing costscomprised the salary costs of two administration and compliance officers [21], including salaryon-costs [38–40]. Potential loss of revenue to TV networks resulting from reduced advertising wastested in sensitivity analysis. From a societal perspective, the base case assumed that potentialloss of revenue for the food and advertising industries would be compensated by revenue for theadvertisement of other products or consumer expenditure on other goods and services. Data onhealthcare costs were obtained from the Australian Institute of Health and Welfare (AIHW) for2001 [41], and inflated to 2010 Australian dollar prices using the Health Price Index [42].
2.5. Cost-Effectiveness Modelling
Cost-effectiveness modelling was undertaken from a limited societal perspective, with the timehorizon for estimating costs, cost-savings and health benefits being rest-of-life or 100 years for the2010 Australian population. Costs, cost-savings and health benefits were discounted at 3% and werepresented as 2010 values.
Modelling was undertaken as (i) a whole population analysis, and (ii) an analysis by area-levelSEP, using the Socio-Economic Indexes for Areas (SEIFA) IRSD quintiles 1 (most disadvantaged) and5 (least disadvantaged) [43]. A proportional multi-state, multiple cohort life table model was used
Nutrients 2018, 10, 622 5 of 14
to estimate obesity-related health outcomes and healthcare cost-savings. The model used data fromthe Australian Health Survey 2011–2012 [44] and disease epidemiology from the Global Burden ofDisease study [45]. Modelling by SEP group incorporated SEIFA quintile specific data, includingdisease incidence, mortality rate, BMI distribution and population number [37]. Potential impactfractions estimated the proportional reduction in disease incidence that would occur through reducedexposure to a risk factor as a result of an intervention. Disease-specific life tables estimated mortalityand morbidity for nine obesity-related diseases (ischaemic heart disease, hypertensive heart disease,ischemic stroke, diabetes, colorectal cancer, kidney cancer, breast cancer, endometrial cancer andosteoarthritis). Interventions were compared against a “no intervention” comparator, where thedistribution of BMI in the 2010 reference year Australian population remained unchanged [46].
All modelling was undertaken in Microsoft Excel 2016. Uncertainty analysis around key inputparameters was estimated using Monte Carlo simulation (2000 iterations) using the Excel add-inErsatz (version 1.35) [47] to estimate 95% uncertainty intervals (95% UI). Quality of life in children wasincorporated using values from the literature [48]. Cohort-based modelling allowed disease-relatedbenefits which are not present in childhood to be estimated due to lingering BMI effects. It wasassumed that the BMI effect as a result of the intervention at age 15 years was maintained intoadulthood, allowing the estimation of health benefits and healthcare cost-savings over the lifetime.Incremental cost-effectiveness ratios (ICERs) were calculated by dividing the difference in the netcost of the intervention by the difference in the net health benefit. ICER results were presented on acost-effectiveness plane. The AUD50,000 per health adjusted life year (HALY) threshold was used todetermine cost-effectiveness, as per Australian benchmarks [49].
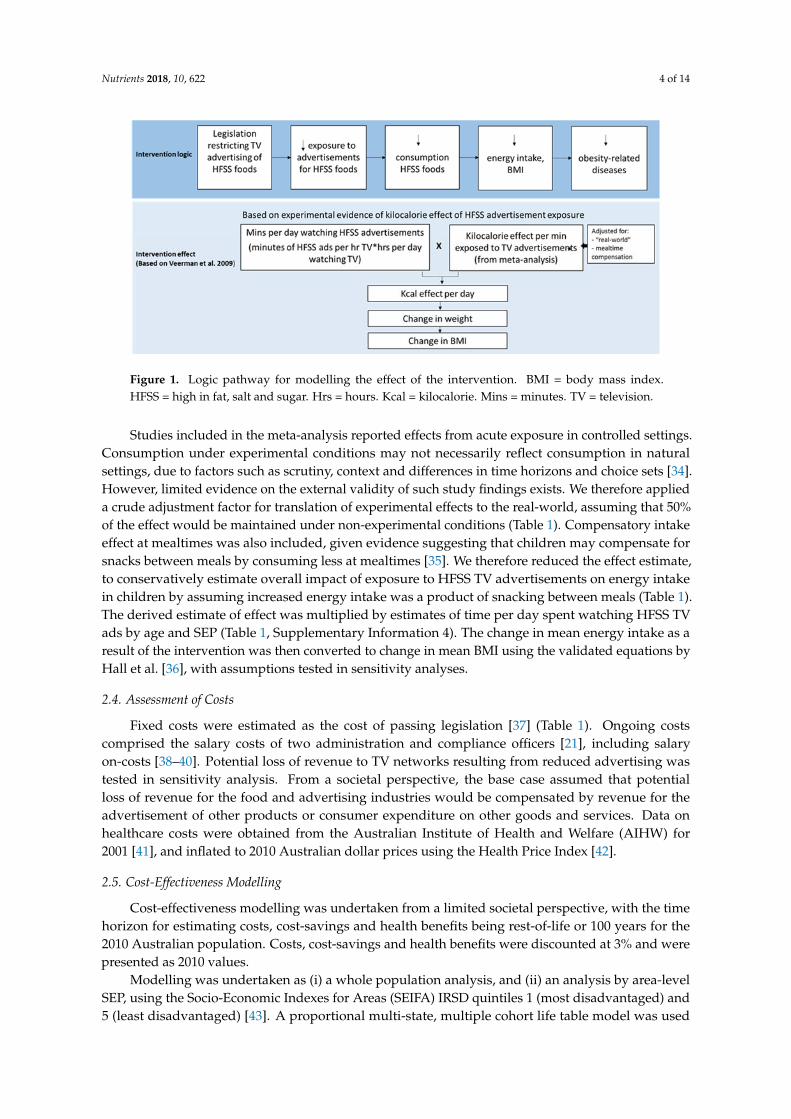
Table 1. Key model variables.
Parameters Mean Values and 95% UI Data Source and Assumptions
Intervention effect estimate
Mean minutes per daywatching TV, by age andSEIFA IRSD quintile
See SupplementaryInformation 3
Sampled from a normal distribution, from Governmentsources [44]. Adjusted for time spent using TV screensfor other uses [50].
Number of advertisementsper hour for HFSS foodsduring children’s peakviewing times
3.4 (95% UI 1.9–5.2)
Sampled from a pert distribution, minimum 1.5maximum 6.5 from a 2012 Australian review ofoutcomes for studies that reported non-core TVadvertising during children’s peak viewing times(based on television audience patterns, generallyweekday evenings and weekend mornings) [15]. Mostlikely 3.1 taken from Australian study 2017 [13].
TV advertisement length(seconds) 29.9 (95% UI 19.2–40.9)
Sampled from pert distribution, minimum 15, mostlikely 30, maximum 45. Based on logical reasoning andpublished estimates [20].
Reduction factor forapplication of experimentaleffect to real-world setting
0.50 (95% UI 0.16–0.85) Sampled from a pert distribution, minimum 0.00, mostlikely 0.50, maximum 1.00. Based on assumption.
Mealtime compensationeffect for snacking 0.37 (95% UI 0.22–0.61) Sampled from a pert distribution, minimum 0.20, most
likely 0.30, maximum 0.80 compensation index [35].
Kcal effect per minute of TVad exposure per day 38 (95% UI 15.5–60.6)
Sampled from a normal distribution (mean 37.94,95% UI 15.6–60.3), see Supplementary Information 2.After base-case reduction factor for application ofexperimental effect to real-world setting and mealtimecompensation are applied, the kcal effect per minute ofTV ad exposure per day is estimated as 12(95% UI 3–27).
Nutrients 2018, 10, 622 6 of 14
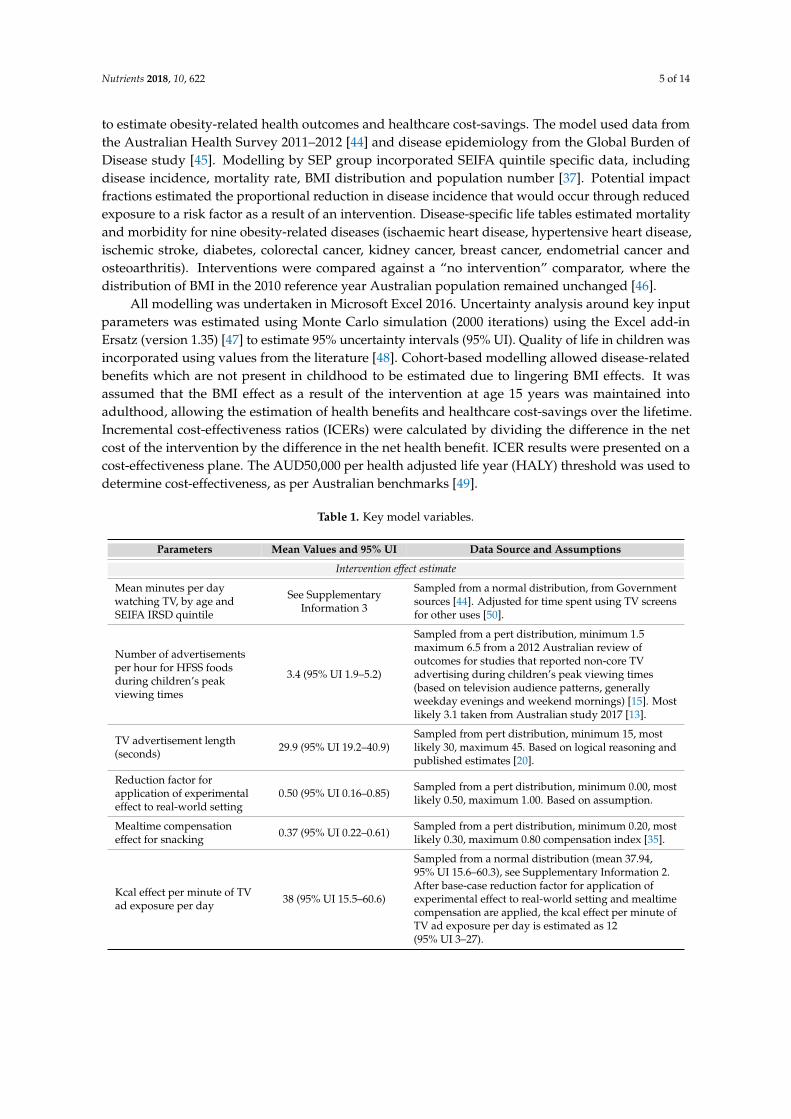
Table 1. Cont.
Parameters Mean Values and 95% UI Data Source and Assumptions
Intervention cost estimate
Cost of legislation (includingRIS process)
AUD1,089,650 (95% UIAUD940,351–1,240,624) Sampled from a gamma distribution [37].
Weekly wage of personnelfor legislation administration
AUD1242 (95% UIAUD1127–1358)
Sampled from a gamma distribution (mean 1240.90,se 58.90) Administrative and Support Services, fulltimeadult [38].
Labour on-costs, 14%salary cost
AUD174 (95% UIAUD155–195)
Sampled from a pert distribution (+/−10%), fromGovernment sources [39].
Annual leave loading, 17.5%weekly salary cost, 4 weeksper annum
AUD870 (95% UIAUD773–975)
Sampled from a pert distribution (+/−10%), fromGovernment sources [40].
Sensitivity analysis, worst case analysis
Assumed loss of networkrevenue, year one ofintervention
2.5% (95% UI 0.4–5.1)Sampled from a pert distribution (minimum 0, mostlikely 2%, maximum 7%), based on 2010 networkadvertising revenue of AUD3.9B [51–53].
Kcal effect per minute of TVad exposure per day 27.6 (95% UI 19.3–35.8) Sampled from a normal distribution (mean 27.6,
95% UI 19.5–35.7), see Supplementary Information 2.
Reduction factor forapplication of experimentaleffect to real-world setting
0.67 (95% UI 0.30–0.95) Sampled from a pert distribution, minimum 0.00, mostlikely 0.75, maximum 1.00. Based on assumption.
Proportion of time spentwatching paid or streamedTV services (assumed noadvertisements)
0.22 (95% UI 0.20–0.24)Sampled from a pert distribution, minimum 0.2, mostlikely 0.22, maximum 0.24 (+/−10%) from publishedestimate [54].
95% UI = 95% uncertainty interval; ABS = Australian Bureau of Statistics; AUD = Australian dollars; B = billion;BMI = body mass index; Kcal = kilocalories; RIS = regulatory impact statement; se = standard error;SEIFA = Socioeconomic Indexes for Areas Index of Relative Socioeconomic Disadvantage; TV = television.
2.6. Sensitivity Analyses
The base case assumes no loss of advertising revenue for broadcasters, given the likelihood ofnew advertising contracts to fill existing advertising periods. The effect of this assumption was testedin sensitivity analyses, assuming a short-term (one year) loss of revenue before networks recoup thesecosts through new advertising contracts (Table 1) (Supplementary Information 5).
Multi-variate sensitivity analysis was undertaken by varying key input parameters in a“worst-case” analysis (Table 1). Worst-case analysis incorporated network loss of revenue, a smallereffect estimate derived from the meta-analysis (Supplementary Information 5) and greater adjustmentfor translation of effect from experimental to real-world settings. Worst-case analysis also varied theassumption that all TV viewing occurred on FTA TV. Pay TV and streamed services have gainedpopularity amongst Australian TV viewing audiences, although limited data exists on the proportionof children’s viewing time using these services. A recent report by Deloitte Australia [54] citedthat 22% of total viewing time is now via paid or streamed services, although this was based on anon-representative survey of people aged over 14 years. In lieu of more rigorous data, the worst-caseanalysis adjusted the mean minutes spent watching TV per day to assume that 22% of total viewingtime was on streamed services with no exposure to HFSS advertising (for example, services like Netflix).
2.7. Threshold Analysis
Given the relative uncertainty around the evidence of effect, a threshold analysis was undertakento determine the minimum effect size required to return a mean ICER less than the AUD50,000 perHALY threshold [49]. Analysis was undertaken using base case intervention costs, and additionallyincorporating loss of short-term revenue to TV networks (Table 1).
Nutrients 2018, 10, 622 7 of 14
2.8. Implementation Considerations
The broader impacts of an intervention that may not necessarily be captured within an economicevaluation should also be considered in order to take into account the wide range of factors importantto decision-makers when setting priorities [55]. Cost-effectiveness results are discussed alongsideimplementation considerations, which qualitatively assess the strength of evidence, feasibility,acceptability and sustainability of the proposed intervention.
3. Results
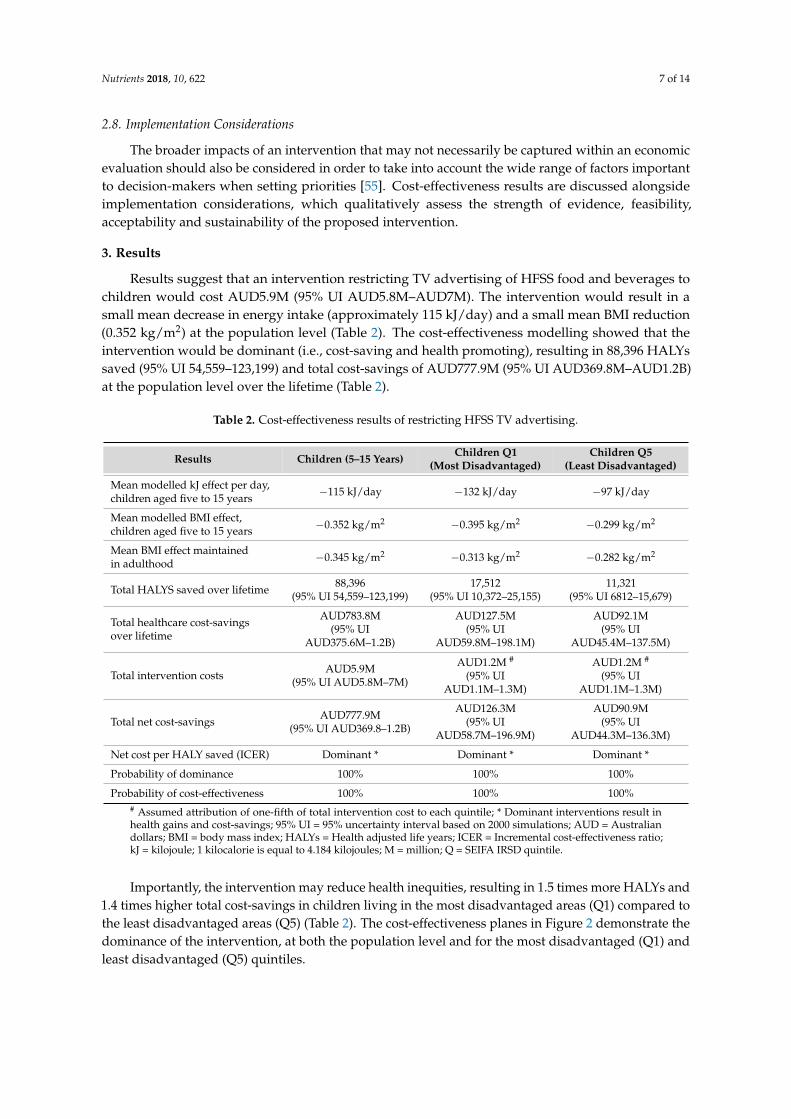
Results suggest that an intervention restricting TV advertising of HFSS food and beverages tochildren would cost AUD5.9M (95% UI AUD5.8M–AUD7M). The intervention would result in asmall mean decrease in energy intake (approximately 115 kJ/day) and a small mean BMI reduction(0.352 kg/m2) at the population level (Table 2). The cost-effectiveness modelling showed that theintervention would be dominant (i.e., cost-saving and health promoting), resulting in 88,396 HALYssaved (95% UI 54,559–123,199) and total cost-savings of AUD777.9M (95% UI AUD369.8M–AUD1.2B)at the population level over the lifetime (Table 2).
Table 2. Cost-effectiveness results of restricting HFSS TV advertising.
Results Children (5–15 Years) Children Q1(Most Disadvantaged)
Children Q5(Least Disadvantaged)
Mean modelled kJ effect per day,children aged five to 15 years −115 kJ/day −132 kJ/day −97 kJ/day
Mean modelled BMI effect,children aged five to 15 years −0.352 kg/m2 −0.395 kg/m2 −0.299 kg/m2
Mean BMI effect maintainedin adulthood −0.345 kg/m2 −0.313 kg/m2 −0.282 kg/m2
Total HALYS saved over lifetime 88,396(95% UI 54,559–123,199)
17,512(95% UI 10,372–25,155)
11,321(95% UI 6812–15,679)
Total healthcare cost-savingsover lifetime
AUD783.8M(95% UI
AUD375.6M–1.2B)
AUD127.5M(95% UI
AUD59.8M–198.1M)
AUD92.1M(95% UI
AUD45.4M–137.5M)
Total intervention costs AUD5.9M(95% UI AUD5.8M–7M)
AUD1.2M #
(95% UIAUD1.1M–1.3M)
AUD1.2M #
(95% UIAUD1.1M–1.3M)
Total net cost-savings AUD777.9M(95% UI AUD369.8–1.2B)
AUD126.3M(95% UI
AUD58.7M–196.9M)
AUD90.9M(95% UI
AUD44.3M–136.3M)
Net cost per HALY saved (ICER) Dominant * Dominant * Dominant *
Probability of dominance 100% 100% 100%
Probability of cost-effectiveness 100% 100% 100%# Assumed attribution of one-fifth of total intervention cost to each quintile; * Dominant interventions result inhealth gains and cost-savings; 95% UI = 95% uncertainty interval based on 2000 simulations; AUD = Australiandollars; BMI = body mass index; HALYs = Health adjusted life years; ICER = Incremental cost-effectiveness ratio;kJ = kilojoule; 1 kilocalorie is equal to 4.184 kilojoules; M = million; Q = SEIFA IRSD quintile.
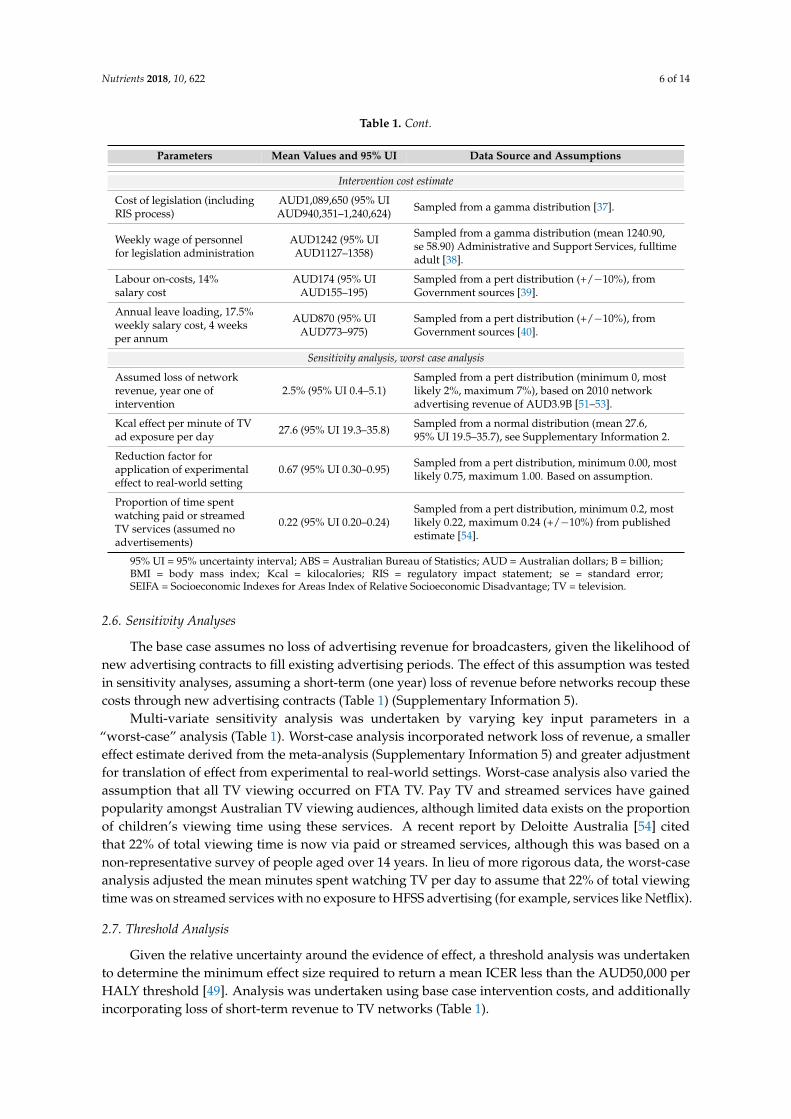
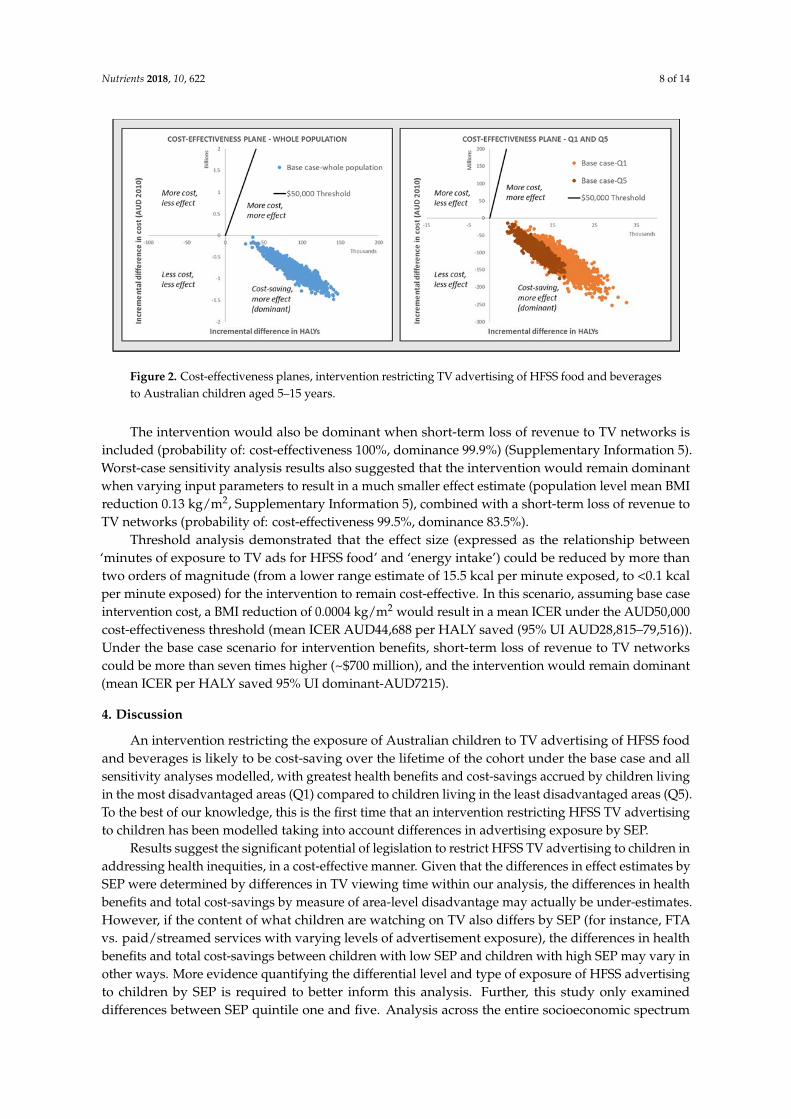
Importantly, the intervention may reduce health inequities, resulting in 1.5 times more HALYs and1.4 times higher total cost-savings in children living in the most disadvantaged areas (Q1) compared tothe least disadvantaged areas (Q5) (Table 2). The cost-effectiveness planes in Figure 2 demonstrate thedominance of the intervention, at both the population level and for the most disadvantaged (Q1) andleast disadvantaged (Q5) quintiles.
Nutrients 2018, 10, 622 8 of 14
Nutrients 2018, 10, x FOR PEER REVIEW 7 of 13
kg/m2) at the population level (Table 2). The cost‐effectiveness modelling showed that the
intervention would be dominant (i.e., cost‐saving and health promoting), resulting in 88,396 HALYs
saved (95% UI 54,559–123,199) and total cost‐savings of AUD777.9M (95% UI AUD369.8M–AUD1.2B)
at the population level over the lifetime (Table 2).
Importantly, the intervention may reduce health inequities, resulting in 1.5 times more HALYs
and 1.4 times higher total cost‐savings in children living in the most disadvantaged areas (Q1)
compared to the least disadvantaged areas (Q5) (Table 2). The cost‐effectiveness planes in Figure 2
demonstrate the dominance of the intervention, at both the population level and for the most
disadvantaged (Q1) and least disadvantaged (Q5) quintiles.
Table 2. Cost‐effectiveness results of restricting HFSS TV advertising.
Results Children (5–15 Years) Children Q1
(Most Disadvantaged)
Children Q5
(Least Disadvantaged)
Mean modelled kJ effect per day,
children aged five to 15 years −115 kJ/day −132 kJ/day −97 kJ/day
Mean modelled BMI effect, children
aged five to 15 years −0.352 kg/m2 −0.395 kg/m2 −0.299 kg/m2
Mean BMI effect maintained in
adulthood −0.345 kg/m2 −0.313 kg/m2 −0.282 kg/m2
Total HALYS saved over lifetime 88,396
(95% UI 54,559–123,199)
17,512
(95% UI 10,372–25,155)
11,321
(95% UI 6,812–15,679)
Total healthcare cost‐savings over
lifetime
AUD783.8M
(95% UI AUD375.6M–1.2B)
AUD127.5M
(95% UI AUD59.8M–198.1M)
AUD92.1M
(95% UI AUD45.4M–137.5M)
Total intervention costs AUD5.9M
(95% UI AUD5.8M–7M)
AUD1.2M #
(95% UI AUD1.1M–1.3M)
AUD1.2M #
(95% UI AUD1.1M–1.3M)
Total net cost‐savings AUD777.9M
(95% UI AUD369.8–1.2B)
AUD126.3M
(95% UI AUD58.7M–196.9M)
AUD90.9M
(95% UI AUD44.3M–136.3M)
Net cost per HALY saved (ICER) Dominant * Dominant * Dominant *
Probability of dominance 100% 100% 100%
Probability of cost‐effectiveness 100% 100% 100%
# Assumed attribution of one‐fifth of total intervention cost to each quintile; * Dominant interventions
result in health gains and cost‐savings; 95% UI = 95% uncertainty interval based on 2000 simulations;
AUD = Australian dollars; BMI = body mass index; HALYs = Health adjusted life years; ICER =
Incremental cost‐effectiveness ratio; kJ = kilojoule; 1 kilocalorie is equal to 4.184 kilojoules; M = million;
Q = SEIFA IRSD quintile.
Figure 2. Cost‐effectiveness planes, intervention restricting TV advertising of HFSS food and
beverages to Australian children aged 5–15 years.
The intervention would also be dominant when short‐term loss of revenue to TV networks is
included (probability of: cost‐effectiveness 100%, dominance 99.9%) (Supplementary information 5).
Worst‐case sensitivity analysis results also suggested that the intervention would remain dominant
when varying input parameters to result in a much smaller effect estimate (population level mean
Figure 2. Cost-effectiveness planes, intervention restricting TV advertising of HFSS food and beveragesto Australian children aged 5–15 years.
The intervention would also be dominant when short-term loss of revenue to TV networks isincluded (probability of: cost-effectiveness 100%, dominance 99.9%) (Supplementary Information 5).Worst-case sensitivity analysis results also suggested that the intervention would remain dominantwhen varying input parameters to result in a much smaller effect estimate (population level mean BMIreduction 0.13 kg/m2, Supplementary Information 5), combined with a short-term loss of revenue toTV networks (probability of: cost-effectiveness 99.5%, dominance 83.5%).
Threshold analysis demonstrated that the effect size (expressed as the relationship between‘minutes of exposure to TV ads for HFSS food’ and ‘energy intake’) could be reduced by more thantwo orders of magnitude (from a lower range estimate of 15.5 kcal per minute exposed, to <0.1 kcalper minute exposed) for the intervention to remain cost-effective. In this scenario, assuming base caseintervention cost, a BMI reduction of 0.0004 kg/m2 would result in a mean ICER under the AUD50,000cost-effectiveness threshold (mean ICER AUD44,688 per HALY saved (95% UI AUD28,815–79,516)).Under the base case scenario for intervention benefits, short-term loss of revenue to TV networkscould be more than seven times higher (~$700 million), and the intervention would remain dominant(mean ICER per HALY saved 95% UI dominant-AUD7215).
4. Discussion
An intervention restricting the exposure of Australian children to TV advertising of HFSS foodand beverages is likely to be cost-saving over the lifetime of the cohort under the base case and allsensitivity analyses modelled, with greatest health benefits and cost-savings accrued by children livingin the most disadvantaged areas (Q1) compared to children living in the least disadvantaged areas (Q5).To the best of our knowledge, this is the first time that an intervention restricting HFSS TV advertisingto children has been modelled taking into account differences in advertising exposure by SEP.
Results suggest the significant potential of legislation to restrict HFSS TV advertising to children inaddressing health inequities, in a cost-effective manner. Given that the differences in effect estimates bySEP were determined by differences in TV viewing time within our analysis, the differences in healthbenefits and total cost-savings by measure of area-level disadvantage may actually be under-estimates.However, if the content of what children are watching on TV also differs by SEP (for instance, FTAvs. paid/streamed services with varying levels of advertisement exposure), the differences in healthbenefits and total cost-savings between children with low SEP and children with high SEP may vary inother ways. More evidence quantifying the differential level and type of exposure of HFSS advertisingto children by SEP is required to better inform this analysis. Further, this study only examineddifferences between SEP quintile one and five. Analysis across the entire socioeconomic spectrum
Nutrients 2018, 10, 622 9 of 14
is required, in order to gain a complete understanding of the equity-related effects of legislation torestrict HFSS TV advertising across all socioeconomic groups.
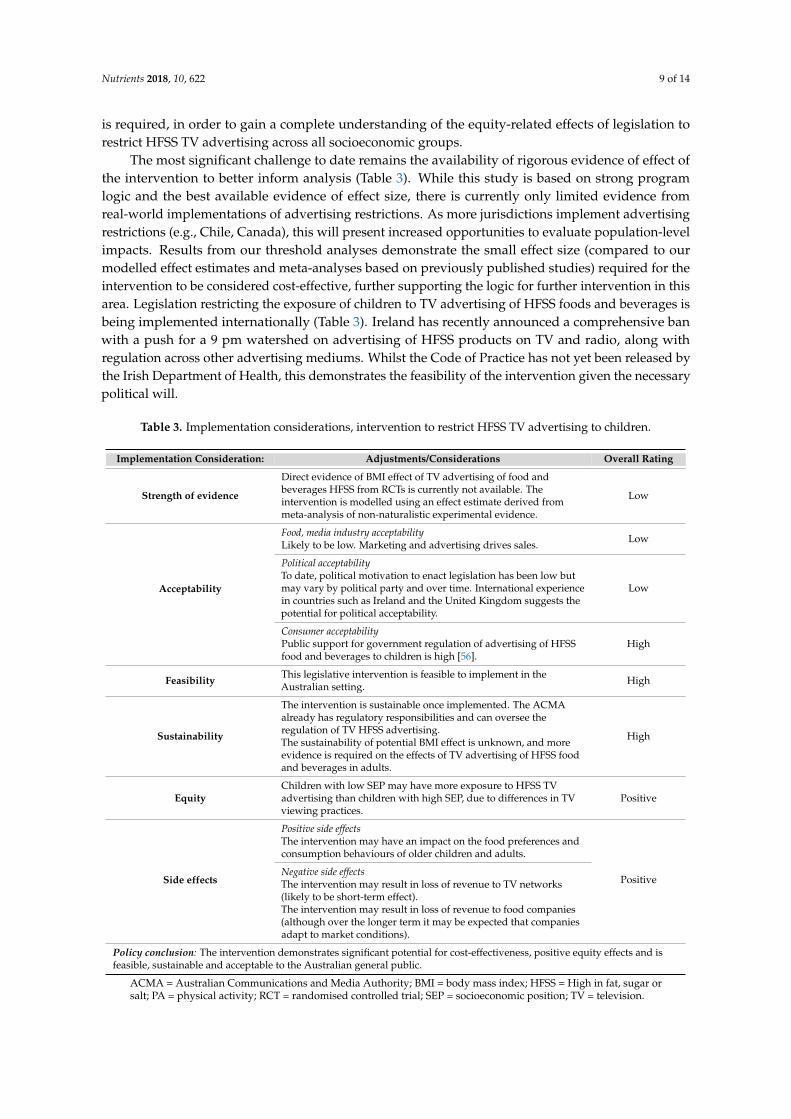
The most significant challenge to date remains the availability of rigorous evidence of effect ofthe intervention to better inform analysis (Table 3). While this study is based on strong programlogic and the best available evidence of effect size, there is currently only limited evidence fromreal-world implementations of advertising restrictions. As more jurisdictions implement advertisingrestrictions (e.g., Chile, Canada), this will present increased opportunities to evaluate population-levelimpacts. Results from our threshold analyses demonstrate the small effect size (compared to ourmodelled effect estimates and meta-analyses based on previously published studies) required for theintervention to be considered cost-effective, further supporting the logic for further intervention in thisarea. Legislation restricting the exposure of children to TV advertising of HFSS foods and beverages isbeing implemented internationally (Table 3). Ireland has recently announced a comprehensive banwith a push for a 9 pm watershed on advertising of HFSS products on TV and radio, along withregulation across other advertising mediums. Whilst the Code of Practice has not yet been released bythe Irish Department of Health, this demonstrates the feasibility of the intervention given the necessarypolitical will.
Table 3. Implementation considerations, intervention to restrict HFSS TV advertising to children.
Implementation Consideration: Adjustments/Considerations Overall Rating
Strength of evidence
Direct evidence of BMI effect of TV advertising of food andbeverages HFSS from RCTs is currently not available. Theintervention is modelled using an effect estimate derived frommeta-analysis of non-naturalistic experimental evidence.
Low
Acceptability
Food, media industry acceptabilityLikely to be low. Marketing and advertising drives sales. Low
Political acceptabilityTo date, political motivation to enact legislation has been low butmay vary by political party and over time. International experiencein countries such as Ireland and the United Kingdom suggests thepotential for political acceptability.
Low
Consumer acceptabilityPublic support for government regulation of advertising of HFSSfood and beverages to children is high [56].
High
Feasibility This legislative intervention is feasible to implement in theAustralian setting. High
Sustainability
The intervention is sustainable once implemented. The ACMAalready has regulatory responsibilities and can oversee theregulation of TV HFSS advertising.The sustainability of potential BMI effect is unknown, and moreevidence is required on the effects of TV advertising of HFSS foodand beverages in adults.
High
EquityChildren with low SEP may have more exposure to HFSS TVadvertising than children with high SEP, due to differences in TVviewing practices.
Positive
Side effects
Positive side effectsThe intervention may have an impact on the food preferences andconsumption behaviours of older children and adults.
PositiveNegative side effectsThe intervention may result in loss of revenue to TV networks(likely to be short-term effect).The intervention may result in loss of revenue to food companies(although over the longer term it may be expected that companiesadapt to market conditions).
Policy conclusion: The intervention demonstrates significant potential for cost-effectiveness, positive equity effects and isfeasible, sustainable and acceptable to the Australian general public.
ACMA = Australian Communications and Media Authority; BMI = body mass index; HFSS = High in fat, sugar orsalt; PA = physical activity; RCT = randomised controlled trial; SEP = socioeconomic position; TV = television.
Nutrients 2018, 10, 622 10 of 14
Our cost-effectiveness results are in keeping with previously published findings in Australia [21],The United States [23] and internationally [22], that interventions to restrict TV advertising of HFSSfood and beverages are considered cost-effective (Supplementary Information 1). Whilst results arenot directly comparable due to methodological differences, there is now a growing body of evidencethat the societal benefits of an intervention restricting the exposure of children to HFSS TV advertisingoutweigh the potential costs of legislation. In addition, our paper provides new evidence on thepotential for cost-effectiveness of the intervention when incorporating what we consider to be realisticshort-term loss of revenue to TV networks. In 2007, ACMA cited concerns regarding the impact ofrestricting food and beverage advertising to children on the production of children’s TV programsby networks [57]. The inclusion of network costs, whilst relatively uncertain given the commercialsensitivity of trying to estimate loss of revenue for a hypothetical intervention, goes some way towardsaddressing this issue. Our analyses including loss of advertising revenue to networks demonstratesthat the intervention remains cost-effective even when incorporating these costs (SupplementaryInformation 5), suggesting the potential for cost-effective government reimbursement if required.
By limiting the intervention population to children aged five to 15 years, we may haveunder-estimated the cost-effectiveness of the intervention at the population level. Studies havesuggested that HFSS TV advertising may also have an effect on food-related behaviours and attitudesin older adolescents and adults, however at this time the evidence is inconclusive [33] and therefore wehave not included potential health benefits and cost-savings accruing to older adolescents and adultsas a result of the intervention into our analyses. Whilst this likely under-estimates cost-effectiveness,more evidence is required in order to capture the full public health benefits of legislation to reduceexposure to HFSS TV advertising across the entire child and adult population.
Limitations of our study include the assumption of maintenance of BMI effect into adulthood andthe modelled effect estimate used for base case and sensitivity analyses, taken from meta-analysis of asmall number of studies conducted in highly controlled experimental conditions. We have tried tocompensate for this suspected bias by adjusting the effect estimate for a more plausible translation to areal-world setting, and for compensatory meal behaviours of children who snack. Adjustments weremade using best-available evidence and logic pathways, however a more rigorous understanding ofthe effects of TV advertising on the consumption of HFSS food and beverages in children is clearly anarea for significant future research.
It is likely that the food industry would oppose the introduction of more stringent TV advertisinglegislation, and this is recognised as a potential barrier to the implementation of this public healthpolicy [58]. Whilst our analysis took a limited societal perspective, we have not included loss of revenueto the food industry as a result of the intervention. We have instead assumed that any loss of foodindustry revenue from a reduction in demand for HFSS food and beverages would be compensated inincreased demand for non-discretionary foods or other items, and therefore doesn’t result in a lossto society. However, this is yet to be rigorously and definitively tested. In addition to its effect onconsumption, advertising is also designed to influence market share within a category, and the impactof advertising restrictions on individual companies is not analysed in this paper.
Finally, television advertising is only one medium used for marketing of HFSS food andbeverages, and although traditional TV viewing is still the most dominant promotional channel,it may be waning [16]. Changes to technology have led to the development and implementationof comprehensive approaches to marketing focused on brand and relationship development,including advertising across mediums, sponsorship, product placement, brand mascots and celebrityendorsement, sales promotion, labelling and point-of-purchase displays [5]. This analysis did not takeinto account potential shifts in advertising from TV to other media in response to the intervention.Ideally this intervention would be combined with more comprehensive marketing restrictions acrossmultiple forms of media, as well as form part of a broader obesity prevention strategy across healthand non-health sectors (for example, fiscal, built environment, education interventions) [28,29]. Resultsfrom this study form part of a broader body of work into obesity prevention priority-setting in
Nutrients 2018, 10, 622 11 of 14
Australia, using standardised methods [37,46,59] and designed to better inform obesity preventionpolicy. Other interventions found to be cost-saving to date include sugar-sweetened beverage (SSB)taxation [37] and reformulation or package size caps of SSBs [46].
5. Conclusions
This study indicates the significant potential of legislation restricting TV advertising of HFSS foodand beverages to Australian children as a cost-effective intervention, with greatest benefits for themost socioeconomically disadvantaged. All modelled scenarios and sensitivity analyses resulted indominance (i.e., an intervention that is both cost-saving and improves long term health outcomes). Ouranalysis by measure of area-level socioeconomic disadvantage demonstrates greater health benefitsand total cost-savings in those living in the most disadvantaged socioeconomic areas compared to thoseliving in the least disadvantaged areas. Furthermore, results from our threshold analysis demonstratethe very small population level effect size required for the intervention to be considered cost-effective.
Supplementary Materials: The following are available online at http://www.mdpi.com/2072-6643/10/5/622/s1,Supplementary Information 1: Summary of Published Findings on the Health Benefits of Restricting TVAdvertising of HFSS Food and Beverages to Children, Supplementary Information 2: Scoping Search Strategy,Supplementary Information 3: Estimate of Effect, Meta-Analysis Results, Supplementary Information 4:Mean Minutes Spent Watching TV per Day, by Age and Quintile, Supplementary Information 5: SensitivityAnalysis Results.
Author Contributions: V.B. designed the study and conducted the meta-analysis. J.L.V. and A.L. contributed tomodel development. All authors reviewed model parameters and inputs. All authors reviewed input parametersfor economic modelling. V.B. conducted modelling, and wrote first draft of the paper. All authors providedcomments on the paper.
Acknowledgments: Brown: Ananthapavan, Veerman, Sacks, Lal, Peeters and Moodie are researchers with theNational Health and Medical Research Council (NHMRC) funded Centre for Research Excellence in ObesityPolicy and Food Systems (grant no. 1041020). A.P. is supported by a NHMRC Career Development Fellowship.G.S. is the recipient of an Australian Research Council Discovery Early Career Researcher Award (DE160100307).The authors acknowledge the work of Ana Maria Mantilla Herrera and Jan Barendregt in model development.
Conflicts of Interest: The authors declare no conflict of interest.
References
1. World Health Organisation. Report of the Commission on Ending Childhood Obesity; WHO: Geneva,Switzerland, 2016.
2. Stettler, N.; Iotova, V. Early growth patterns and long-term obesity risk. Curr. Opin. Clin. Nutr. Metab. Care2010, 13, 294–299. [CrossRef] [PubMed]
3. Gebremariam, M.; Lien, N.; Nianogo, R.; Arah, O. Mediators of socioeconomic differences in adiposityamong youth: A systematic review. Obes. Rev. 2017, 18, 880–898. [CrossRef] [PubMed]
4. Peeters, A.; Backholer, K. Reducing socioeconomic inequalities in obesity: The role of population prevention.Lancet Diabetes Endocrinol. 2015, 3, 838–840. [CrossRef]
5. World Health Organisation. Set of Recommendations on the Marketing of Foods and Non-Alcoholic Beverages toChildren; WHO: Geneva, Switzerland, 2010.
6. Bittman, M.; Sipthorp, M. Turned on, Tuned in or Dropped Out? Young Children’s Use of Television and Transmissionof Social Advantage; Australian Institute of Family Studies: Canberra, Australia, 2011.
7. Mullan, K. Growing Up in Australia: The Longitudinal Study of Australian Children Annual Statistical Report 2013;Time Use and Children’s Social and Emotional Wellbeing and Temperament; Australian Institute of FamilyStudies: Canberra, Australia, 2013.
8. Cameron, A.J.; Spence, A.C.; Laws, R.; Hesketh, K.D.; Lioret, S.; Campbell, K.J. A Review of the Relationshipbetween Socioeconomic Position and the Early-Life Predictors of Obesity. Curr. Obes. Rep. 2015, 4, 350–362.[CrossRef] [PubMed]
Nutrients 2018, 10, 622 12 of 14
9. Chambers, S.A.; Freeman, R.; Anderson, A.S.; MacGillivray, S. Reducing the volume, exposure and negativeimpacts of advertising for foods high in fat, sugar and salt to children: A systematic review of the evidencefrom statutory and self-regulatory actions and educational measures. Prev. Med. 2015, 75, 32–43. [CrossRef][PubMed]
10. Australian Government. Children’s Television Standards 2009; Australian Communications and MediaAuthority: Canberra, Australia, 2009.
11. Australian Food & Grocery Council. Advertising to Children: AFGC; n.d. Available online: http://www.afgc.org.au/our-expertise/health-nutrition-and-scientific-affairs/advertising-to-children/ (accessed on24 April 2017).
12. Galbraith-Emami, S.; Lobstein, T. The impact of initiatives to limit the advertising of food and beverageproducts to children: A systematic review. Obes. Rev. 2013, 14, 960–974. [CrossRef] [PubMed]
13. Watson, W.L.; Lau, V.; Wellard, L.; Hughes, C.; Chapman, K. Advertising to children initiatives have notreduced unhealthy food advertising on Australian television. J. Public Health 2017, 4, 787–792. [CrossRef][PubMed]
14. The Australian Communications and Media Authority. Children’s Television Viewing and Multi-ScreenBehaviour; Analysis of 2006-16 OzTAM Audience Data and 2017 Survey of Parents, Carers and Guardians;ACMA: Canberra, Australia, 2017.
15. Smithers, L.G.; Lynch, J.W.; Merlin, T. Television Marketing of Unhealthy Food and Beverages to Children inAustralia: A Review of Published Evidence from 2009; Final Report; Australian National Preventive HealthAgency: Canberra, Australia, 2012.
16. Cairns, G.; Angus, K.; Hastings, G.; Caraher, M. Systematic reviews of the evidence on the nature, extentand effects of food marketing to children. A retrospective summary. Appetite 2013, 62, 209–215. [CrossRef][PubMed]
17. Dhar, T.; Baylis, K. Fast-food consumption and the ban on advertising targeting children: The Quebecexperience. J. Mark. Res. 2011, 48, 799–813. [CrossRef]
18. Silva, A.; Higgins, L.M.; Hussein, M. An Evaluation of the Effect of Child-Directed Television FoodAdvertising Regulation in the United Kingdom. Can. J. Agric. Econ. Revue Can. D’agroecon. 2015, 63,583–600. [CrossRef]
19. Veerman, J.L.; Van Beeck, E.F.; Barendregt, J.J.; Mackenbach, J.P. By how much would limiting TV foodadvertising reduce childhood obesity? Eur. J. Public Health 2009, 19, 365–369. [CrossRef] [PubMed]
20. Goris, J.M.; Petersen, S.; Stamatakis, E.; Veerman, J.L. Television food advertising and the prevalence ofchildhood overweight and obesity: A multicountry comparison. Public Health Nutr. 2010, 13, 1003–1012.[CrossRef] [PubMed]
21. Magnus, A.; Haby, M.; Carter, R.; Swinburn, B. The cost-effectiveness of removing television advertisingof high-fat and/or high-sugar food and beverages to Australian children. Int. J. Obes. 2009, 33, 1094–1102.[CrossRef] [PubMed]
22. Cecchini, M.; Sassi, F.; Lauer, J.A.; Lee, Y.Y.; Guajardo-Barron, V.; Chisholm, D. Tackling of unhealthy diets,physical inactivity, and obesity: Health effects and cost-effectiveness. Lancet 2010, 376, 1775–1784. [CrossRef]
23. Sonneville, K.R.; Long, M.W.; Ward, Z.J.; Resch, S.C.; Wang, Y.C.; Pomeranz, J.L.; Moodie, M.L.; Carter, R.;Sacks, G.; Swinburn, B.A.; et al. BMI and healthcare cost impact of eliminating tax subsidy for advertisingunhealthy food to youth. Am. J. Prev. Med. 2015, 49, 124–134. [CrossRef] [PubMed]
24. Chou, S.-Y.; Rashad, I.; Grossman, M. Fast-food restaurant advertising on television and its influence onchildhood obesity. J. Law Econ. 2008, 51, 599–618. [CrossRef]
25. Robinson, T.N. Reducing children’s television viewing to prevent obesity: A randomized controlled trial.JAMA 1999, 282, 1561–1567. [CrossRef] [PubMed]
26. Gorn, G.J.; Goldberg, M.E. Behavioral evidence of the effects of televised food messages on children.J. Consum. Res. 1982, 9, 200–205. [CrossRef]
27. Bolton, R.N. Modeling the impact of television food advertising on children’s diets. Curr. Issues Res. Advert.1983, 6, 173–199.
28. Obesity Policy Coalition and the Global Obesity Centre. Tipping the Scales, Australian Obesity PreventionConsensus; Obesity Policy Coalition and the Global Obesity Centre: Melbourne, Australia, 2017.
Nutrients 2018, 10, 622 13 of 14
29. The Australian Prevention Partnership Centre Deakin University and Informas. Policies for TacklingObesity and Creating Healthier Food Environments; TAPPC: Ultimo, Australia; Deakin University: Geelong,Australia, 2017.
30. Australian Communications and Media Authority. Children’s Television Viewing, Research Overview; ACMA:Melbourne, Australia, 2015.
31. Boyland, E.J.; Whalen, R. Food advertising to children and its effects on diet: Review of recent prevalenceand impact data. Pediatr. Diabetes 2015, 16, 331–337. [CrossRef] [PubMed]
32. Sadeghirad, B.; Duhaney, T.; Motaghipisheh, S.; Campbell, N.; Johnston, B. Influence of unhealthy food andbeverage marketing on children’s dietary intake and preference: A systematic review and meta-analysis ofrandomized trials. Obes. Rev. 2016, 17, 945–959. [CrossRef] [PubMed]
33. Boyland, E.J.; Nolan, S.; Kelly, B.; Tudur-Smith, C.; Jones, A.; Halford, J.C.; Robinson, E. Advertising as a cueto consume: A systematic review and meta-analysis of the effects of acute exposure to unhealthy food andnonalcoholic beverage advertising on intake in children and adults. Am. J. Clin. Nutr. 2016, 103, 519–533.[CrossRef] [PubMed]
34. Lusk, J.L.; Roosen, J.; Shogren, J.F. (Eds.) The Oxford Handbook of the Economics of Food Consumption and Policy;Oxford University Press: Oxford, UK, 2011.
35. Cecil, J.E.; Palmer, C.N.; Wrieden, W.; Murrie, I.; Bolton-Smith, C.; Watt, P.; Wallis, D.J.; Hetherington, M.M.Energy intakes of children after preloads: Adjustment, not compensation. Am. J. Clin. Nutr. 2005, 82, 302–308.[CrossRef] [PubMed]
36. Hall, K.D.; Butte, N.F.; Swinburn, B.A.; Chow, C.C. Dynamics of childhood growth and obesity: Developmentand validation of a quantitative mathematical model. Lancet Diabetes Endocrinol. 2013, 1, 97–105. [CrossRef]
37. Lal, A.; Mantilla-Herrera, A.M.; Veerman, L.; Backholer, K.; Sacks, G.; Moodie, M.; Siahpush, M.; Carter, R.;Peeters, A. Modelled health benefits of a sugar-sweetened beverage tax across different socioeconomicgroups in Australia: A cost-effectiveness and equity analysis. PLoS Med. 2017, 14, e1002326. [CrossRef][PubMed]
38. Australian Bureau of Statistics. 6302.0-Average Weekly Earnings, Australia, May 2010; ABS: Canberra, Australia,2010. Available online: http://www.abs.gov.au/AUSSTATS/[email protected]/DetailsPage/6302.0May%202010?OpenDocument (accessed on 22 May 2017).
39. Australian Bureau of Statistics. 6348.0-Labour Costs, Australia, 2010-11; ABS: Canberra, Australia,2012. Available online: http://www.abs.gov.au/AUSSTATS/[email protected]/DetailsPage/6348.02010-11?OpenDocument (accessed on 22 May 2017).
40. Fair Work Ombudsman. Payment for Annual Leave; Australian Government: Canberra, Australia, 2017.Available online: https://www.fairwork.gov.au/leave/annual-leave/payment-for-annual-leave (accessedon 22 May 2017).
41. Australian Institute of Health and Welfare. Health System Expenditure on Disease and Injury in Australia,2000-01; AIHW: Canberra, Australia, 2004.
42. Australian Institute of Health and Welfare. Health Expenditure 2012-13; AIHW: Canberra, Australia, 2014.43. Australian Bureau of Statistics. Socio-Economic Indexes for Areas; ABS: Canberra, Australia, 2017. Available
online: http://www.abs.gov.au/websitedbs/censushome.nsf/home/seifa (accessed on 11 July 2017).44. Australian Bureau of Statistics. 4324.0.55.002-Microdata: Australian Health Survey: Nutrition and Physical
Activity, 2011-12; ABS: Canberra, Australia, 2013. Available online: http://www.abs.gov.au/AUSSTATS/[email protected]/Lookup/4324.0.55.002Main+Features12011-12 (accessed on 8 June 2017).
45. Murray, C.J.; Abraham, J.; Ali, M.K.; Alvarado, M.; Atkinson, C.; Baddour, L.M.; Bartels, D.H.; Benjamin, E.J.;Bhalla, K.; Birbeck, G. The state of US health, 1990–2010: Burden of diseases, injuries, and risk factors. JAMA2013, 310, 591–606. [CrossRef] [PubMed]
46. Crino, M.; Herrera, A.M.M.; Ananthapavan, J.; Wu, J.H.; Neal, B.; Lee, Y.Y.; Zheng, M.; Lal, A.; Sacks, G.Modelled Cost-Effectiveness of a Package Size Cap and a Kilojoule Reduction Intervention to Reduce EnergyIntake from Sugar-Sweetened Beverages in Australia. Nutrients 2017, 9, 983. [CrossRef] [PubMed]
47. EpiGear International. Ersatz; EpiGear International: Brisbane, Australia, 2016. Available online: http://www.epigear.com/index_files/ersatz.html (accessed on 29 May 2017).
48. Chen, G.; Ratcliffe, J.; Olds, T.; Magarey, A.; Jones, M.; Leslie, E. BMI, health behaviors, and quality of life inchildren and adolescents: A school-based study. Pediatrics 2014, 133, 133. [CrossRef] [PubMed]
Nutrients 2018, 10, 622 14 of 14
49. George, B.; Harris, A.; Mitchell, A. Cost-effectiveness analysis and the consistency of decision making.Pharmacoeconomics 2001, 19, 1103–1109. [CrossRef] [PubMed]
50. OzTAM. Australian Multi-Screen Report; Quarter 03 2016; OzTAM: Australia, 2016. Availableonline: http://www.oztam.com.au/documents/Other/Australian%20Multi%20Screen%20Report%20Q2%202016%20FINAL.pdf (accessed on 14 May 2018).
51. FreeTV Australia. Advertising Revenue for Commercial Television Networks, January to June 2010.FreeTV Australia, 2010. Available online: http://www.freetv.com.au/media/News-Media_Release/PR14_Advertising_revenue_for_commercial_television_networks_-_Jan-Jun_2010.pdf (accessed on 20 July 2017).
52. FreeTV Australia. Advertising Revenue for Commercial Television Networks, July to December 2010. FreeTVAustralia, 2011. Available online: http://www.freetv.com.au/Media/News-Media_Release/Revenue_figures_July_Dec_2010.pdf (accessed on 20 July 2017).
53. Adnews. Where’s the Money Going? Exclusive ad Spend Trends Report; Adnews: Australia, 2016. Availableonline: http://www.adnews.com.au/news/where-s-the-money-going-exclusive-ad-spend-trends-report(accessed on 14 May 2018).
54. Deloitte Australia. Media Consumer Survey 2016, Australian Media and Digital Preferences; Deloitte Australia:Sydney, Australia, 2016.
55. Vos, T.; Carter, R.; Barendregt, J.; Mihalopoulos, C.; Veerman, L.; Magnus, A. Assessing Cost-Effectiveness inPrevention; ACE Prevention Final Report; University of Queensland and Deakin University: Melbourne,Australia, 2010.
56. Parents’ Voice. Junk Food Marketing 2017. Available online: https://parentsvoice.org.au/our-work/junk-food-marketing/ (accessed on 10 November 2017).
57. Australian Communications and Media Authority. Children’s Television Standards Review; ACMA: Canberra,Australia, 2007.
58. Mialon, M.; Swinburn, B.; Allender, S.; Sacks, G. Systematic examination of publicly-available informationreveals the diverse and extensive corporate political activity of the food industry in Australia.BMC Public Health 2016, 16, 283. [CrossRef] [PubMed]
59. Brown, V.; Moodie, M.; Cobiac, L.; Herrera, A.M.; Carter, R. Obesity-related health impacts of fuel excisetaxation-an evidence review and cost-effectiveness study. BMC Public Health 2017, 17, 359. [CrossRef][PubMed]
© 2018 by the authors. Licensee MDPI, Basel, Switzerland. This article is an open accessarticle distributed under the terms and conditions of the Creative Commons Attribution(CC BY) license (http://creativecommons.org/licenses/by/4.0/).