Embed Size (px)
Citation preview

Equity Impacts of Dollar Store Vaccine Distribution*
Judith A. Chevalier,Yale School of Management and NBER
Jason L. Schwartz, Yale School of Public Health
Yihua Su, Yale School of Public Health
Kevin R. Williams, Yale School of Management and NBER
April 2, 2021
Abstract
We use geospatial data to examine the unprecedented national program currentlyunderway in the United States to distribute and administer vaccines against COVID-19. We quantify the impact of the proposed federal partnership with the companyDollar General to serve as vaccination sites and compare vaccine access with DollarGeneral to the current Federal Retail Pharmacy Partnership Program. Although dollarstores have been viewed with skepticism and controversy in the policy sector, we showthat, relative to the locations of the current federal program, Dollar General stores aredisproportionately likely to be located in Census tracts with high social vulnerability;using these stores as vaccination sites would greatly decrease the distance to vaccinesfor both low-income and minority households. We consider a hypothetical alternativepartnership with Dollar Tree and show that adding these stores to the vaccinationprogram would be similarly valuable, but impact different geographic areas than theDollar General partnership. Adding Dollar General to the current pharmacy partnersgreatly surpasses the goal set by the Biden administration of having 90% of the popu-lation within 5 miles of a vaccine site. We discuss the potential benefits of leveragingthese partnerships for other vaccinations, including against influenza.
*Authors are listed alphabetically and contributed equally. The authors thank the Tobin Center at YaleUniversity for funding.
1
arX
iv:2
104.
0129
5v1
[ec
on.G
N]
3 A
pr 2
021

1 Introduction
An unprecedented national program to distribute and administer vaccines against COVID-
19 has been underway in the United States since December 2020. The complex storage
and handling requirements of several vaccines authorized by the U.S. Food and Drug Ad-
ministration (FDA), as well as the limited vaccine supply available in the initial months of
the vaccination campaign, led public health officials to create dedicated vaccination sites
largely outside of the clinical settings where individuals typically receive medical care.
These locations—a mix of federal-, state-, and locally-run sites of widely varying size and
located in diverse settings—are intended to facilitate the rapid administration of available
vaccine doses while being attentive to the goal of promoting equity in vaccine delivery
(Bibbins-Domingo, Petersen, and Havlir, 2021). To address this latter objective, health of-
ficials have pursued strategies to enhance vaccine access and availability in communities
that have been disproportionately affected by COVID-19 and its most severe outcomes,
including low-income and minority communities that have long encountered barriers to
the receipt of necessary health care services, including vaccination.
In March 2021, the director of the U.S. Centers for Disease Control and Prevention
(CDC) and the company Dollar General confirmed reports that they were exploring a
partnership through which COVID-19 vaccines would be administered in Dollar Gen-
eral locations (Dollar General Stores, 2021; Boomey, 2021). This potential partnership
is particularly noteworthy because the growth of the two national dollar store chains,
Dollar General and Dollar Tree, has generated considerable skepticism and controversy
in the policy sector. For example, citing arguments that the growth of dollar stores in
lower-income areas contribute to food insecurity, numerous localities have passed ordi-
nances restricting the growth of these chains (Meyersohn, 2019; Pandey, 2019). Despite
this controversial context, if an agreement were to be reached, this partnership would
augment the federal government’s existing partnership with retail pharmacies. Although
such a partnership would likely not ultimately involve all 16,805 Dollar General locations,
a partnership with the chain has the potential to greatly increase the scope of the current
Federal Retail Pharmacy Partnership Program.
2

Under the current scheme for distributing COVID-19 vaccines in the United States,
the federal government controls all vaccine allocation. On a weekly basis, nearly all
available doses are allocated to state governments or directly to participants in the Federal
Retail Pharmacy Partnership Program.1 The CDC describes the Federal Retail Pharmacy
Program for COVID-19 Vaccination as "a collaboration between the federal government,
states and territories, and 21 national pharmacy partners and independent pharmacy
networks to increase access to COVID-19 vaccination across the United States" (Centers for
Disease Control and Prevention, 2021a). The program is intended to work in parallel with
vaccination sites established and supported at the state level (and using state-allocated
vaccine doses), thereby advancing the federal government’s objective of ensuring broad
vaccine access. The program is being implemented and expanded incrementally based
on available vaccine supply and as needs are identified in particular communities, with
select retail pharmacy locations providing COVID-19 vaccine to individuals eligible for
vaccine based on state prioritization guidelines.
This type of partnership between the federal government and retail pharmacies is
novel, but it reflects the expanding role of pharmacies in providing clinical services to
patients in recent years, including the administration of recommended vaccines (Cassel,
2018). For COVID-19 vaccination, the pharmacy partner locations are seen as particularly
valuable toward reducing the distance required for Americans to reach their nearest
vaccination site. To this end, the Biden administration has announced its goal of having a
vaccination site located within 5 miles of 90% of American adults by April 19, 2021 (The
White House, 2021).
In this paper, we use geospatial data to examine the proximity of U.S. households to
their closest federal pharmacy program partner and quantify differences in access based
on geographic data. We show that, relative to the locations of current federal pharmacy
partner stores, Dollar General stores are disproportionately likely to be located in Census
tracts with high social vulnerability, as measured using the Center for Disease Control’s
Social Vulnerability Index 2018 Database US (SVI), accessed March 17, 2021 (Centers
1A small number are reserved for direct federal vaccination efforts, such as those coordinated by theDepartment of Defense or Department of Veterans Affairs, as we describe in more detail elsewhere in thispaper.
3

for Disease Control and Prevention, Agency for Toxic Substances and Disease Registry,
2021). As low household income is an important component of social vulnerability, we
further show that adding Dollar General as a partner would dramatically improve the
fraction of low-income households that live less than a mile from their closest vaccination
program partner, particularly in the South and Southeast, compared to the current retail
pharmacy program. Thus, the Dollar General partnership would have the effect of greatly
expanding vaccine access for these groups. We also show that adding Dollar General as
a partner disproportionately improves access for Black individuals and for Hispanic and
Latino people. For individuals at all income levels, full utilization of existing pharmacy
partner sites would approach the proximity target (90% within 5 miles) set by the Biden
administration; adding Dollar General to the vaccination program would greatly surpass
that goal.
Because of the strong results identified with the proposed partnership with Dollar
General, we also examine a hypothetical partnership with Dollar Tree—the other major
dollar store chain in the United States. We show that Dollar Tree stores are even more
concentrated in locations with high social vulnerability than are Dollar General stores. For
some states, adding Dollar Tree stores to the Federal Retail Pharmacy Partnership Program
would provide a markedly better reduction in the proximity of low-income households
to their closest federal vaccination partner site than would adding Dollar General to the
program. However, for some states, the reverse is true.
Finally, we recognize that the Federal Retail Pharmacy Partnership Program is only
one channel of vaccine access. For a subset of states (20), we gather all active vaccination
locations in that state, as listed on that state’s COVID-19 response website. We consider
the superset of sites from the federal pharmacy program and sites set up by the states. Sev-
eral states include mass vaccination locations, federal pharmacy partners, and federally
qualified health centers in their directories. We show that adding state-listed vaccination
sites to our baseline analysis of the federal pharmacy program increases the share of low-
income households within 1 mile or 5 miles of a vaccine site. However, we show that
adding Dollar General stores nonetheless provides a substantial proximity improvement
for low-income households in many states.
4

Our paper proceeds as follows. Section 2 discusses our data and methodology. In
Section 3, we profile the major dollar store chains and document their recent growth. In
Section 4, we describe the retail pharmacy program and quantify the characteristics of
Census tracts in which retail pharmacy partners are located. In Section 5, we quantify
the impacts of adding dollar stores to the federal vaccine program on vaccine access. In
Section 6, we undertake a partial analysis of state vaccine locations. Section 7 concludes.
2 Data and Methodology
Our purpose is to assess the characteristics of partners in the Federal Retail Pharmacy Part-
nership Program and Dollar Stores and quantify their proximity to populations identified
as high social vulnerability. We are especially interested in low-income populations.
We bring together data from several sources. First, we obtain a list by state of federal
retail pharmacy partner chains from the Centers for Disease Control (Centers for Disease
Control and Prevention, 2021a). As described by the CDC, the program is comprised
of "21 national pharmacy partners and independent pharmacy networks." In providing
a list of pharmacy partners for each state, the separation of the pharmacy efforts and
state efforts is emphasized. The CDC notes, "This list is specific to the Federal Retail
Pharmacy Program; some states have engaged additional pharmacies directly to assist
with vaccination efforts".
For each pharmacy partner, in each state, we match these chains by name to the
Historical Business Information Files from ReferenceUSA (Infogroup, 2005-2021), accessed
March 14, 2021. We were unable to match the pharmacy network CPESN, a partner in
eleven states, and MHCN, a partner in four states. From ReferenceUSA, we obtain the
universe of locations of these federal partners.
It is important to note that not all pharmacy locations for a given chain (and state) are
necessarily providing vaccines. Moreover, some locations may be providing vaccinations
intermittently. This is because the supply of vaccine has been constrained overall, but also
because some retailers—due to freezer constraints, for example—can only offer a subset
of the vaccines. Thus, some chains only offer vaccinations when specific vaccines are
5

available. We nonetheless include all of the outlets of these chains because the number of
locations offering vaccinations is expected to increase as vaccine supply grows. In March
2021, representatives of these chains explicitly noted that more of their outlets will provide
vaccines as supply increases, a plan confirmed by the Biden administration (Barker, 2021;
Robbins and Weiland, 2021; The White House, 2021).
We further supplement our analysis using vaccine locations found on state COVID
response websites. State vaccine sites are dynamic; we use active vaccine sites as of
the week of March 22rd, 2021. Therefore, our analysis does not necessarily reflect the
complete buildout of state capacity, although we do include in our analysis announced
locations that did not have appointments available at the time of data collection. Some
states also list pharmacies found through the federal partnership program; our analysis is
unaffected by potential duplicates as we select the closest vaccination site to each Census
tract. Additionally, these files may allow us to incorporate Federally Qualified Health
Centers and locations that we cannot match using the ReferenceUSA data.
We obtain vaccine locations for 21 states that either post a file containing all locations
or present users with an interactive map of locations.2 Figure 5 contains a list of the states
and the corresponding websites we used for data collection.
In order to examine the implications of a partnership with Dollar General and a
hypothetical partnership with the other large dollar store chain, Dollar Tree, we download
all of their locations from ReferenceUSA. For all retail dollar store and pharmaceutical
outlets, we remove a small number of outlets that are listed in ReferenceUSA from analysis
if they appear to be a headquarters, a distribution center, or other non-retail location of
the company.
Our goal is to examine the social vulnerability metrics for the Census tracts containing
these outlets and measure distances from the these retail outlets to households. We use
the latitudes and longitudes of the retail outlets provided by ReferenceUSA and map
these to Census data on households. Throughout this analysis, we will use Census data
2We collect data for AL, AR, CT, GA, IL, KS, MD, ME, MO, MS, ND, NJ, NV, OH, OK, PA, SC, WA,WI, and WV. First, we download either the PDF, HTML, or JSON found on from each state’s COVID-19response website. We then process the files and extract the addresses. We then geocode each site usinghttps://geocode.localfocus.nl/. Our analysis includes "success" and "doubt" matches, and excludes "failed"matches.
6

at the Census tract level. There are approximately 74 thousand Census tracts in the US,
created by the Census Bureau with a target population of 4,000 per tract. Some tracts
were unavailable for processing, leaving us with 73,088 Census tracts. As is common
in the literature, we will assume that all households live at the geographic centroid of
the Census tract and calculate the great circle distance from the Census tract centroids to
each of the retail outlets in our database. We use the minimum-calculated distance for
each Census tract to a vaccine location for our analysis. Because vaccine eligibility is set
by individual states and allocations are at the state level, we calculate distances to the
closest same-state retail location; we assume that people located near a state border will
not obtain the vaccine at an out-of-state location. 3
We also characterize the Census tracts within which the retail outlets are located.4 To
do this, we match each Census tract not only to the Census data provided directly by the
Census, but to the tract-level data on the Social Vulnerability Index 2018 Database US (SVI)
provided by the CDC. SVI is a composite of Census data used to identify communities
that may require the greatest support during, or following, a disaster; it has been widely
adopted by federal and state health officials during COVID-19 as a tool to inform the design
of vaccination efforts and to assess their performance with respect to equity (Centers for
Disease Control and Prevention, Agency for Toxic Substances and Disease Registry, 2021;
Hughes, 2021). We are able to match 72,173 SVI tracts to the Census data.
In our examination of the current composition of the pharmacy partner program, we
find 26,246 retail pharmacy outlets that belong to chains that are designated as pharmacy
partners in the state in which the outlet is located. Only a subset of these outlets are
currently administering vaccinations, but some of these chains will significantly expand
the number of outlets within the chain administering vaccinations as vaccine supply in-
creases. In matching to Census data, we summarize in Table 1 the proximity of various
segments of the population to the closest within-state outlet of the Federal Retail Phar-
macy Partner Program. We examine income groups, racial groups, and Hispanic/Latino
3We make an exception for North Dakota, for which we have not found retail outlets of any federalpharmacy partner that was listed as a partner for North Dakota on the CDC website.
4We use the 2019 American Community Survey 5-Year Data (2009-2019), Census Bureau Geocoder, andTIGER/Line Shapefiles downloaded fromhttps://www.baruch.cuny.edu/confluence/display/geoportal/US+Census+Population+Centroids
7

Table 1: Characteristics of U.S. Pharmacy Partner Program
Population Type Area Share Share Share<1 mile <2 miles < 5 miles
All adults U.S. 48.3 72.7 86.3All adults CONUS 48.7 73.0 86.4Households < $35K U.S. 48.4 71.1 83.3Households > $100K U.S. 49.3 73.9 87.8Black Population U.S. 53.6 81.8 93.2White Population U.S. 44.3 68.6 83.8AAPI Population U.S. 65.6 90.3 97.5Other Population U.S. 58.5 80.7 90.4Hispanic Population U.S. 44.9 70.0 84.6non-Hispanic Population U.S. 61.2 84.2 93.7
Notes: Summary statistics for federal U.S. pharmacy partner program. Tableentries denote the share of the population type within the denoted proximityto an in-state pharmacy partner. "CONUS" denotes continental US.
ethnicity.5
Table 1 shows that these pharmacy partners (if all outlets were providing vaccine) are
nearly sufficient to meet the Biden administration’s promise that 90 percent of Americans
will be within 5 miles of a vaccine site by April 19, 2021. As this chart includes only the
federal pharmacy program vaccine sites (and we were unable to match a small number
of pharmacies), providing vaccines at all of these sites would almost surely be sufficient
to achieve this pledge. Nonetheless, the administration pledge is not the only way to
measure access. In particular, the table shows that the fraction of households within 1,
2, or 5 miles of a federal pharmacy partner is smaller for low-income households than
for high-income households. This is concerning because low-income households are least
likely to have access to transportation infrastructure, internet access to book a distant
appointment, etc. That the majority of these households are more than a mile from the
closest pharmacy partner could indeed create a barrier to vaccination. The table also shows
5To characterize race, we divide the total population into one of four racial groups: white (for whichwe use the Census categorization "White alone"), Black (for which we use the Census categorization "Blackor African American", AAPI (for which we add the Census categorizations of Asian American, NativeHawaiian and Pacific Islander), and other races for which we include all other races. We also characterizethe population as "Hispanic" or "non-Hispanic", including the Census categorizations of Hispanic or Latinoand including Hispanic or Latino people of all races.
8
a large disparity in proximity between Hispanic and non-Hispanic people. This disparity
in proximity is particularly concerning as COVID-19 vaccination rates for Hispanic people
have been shown to be low. (Ndugga, Pham, Hill, Artiga, Alam, and Parker, 2021) An
important caveat to our analysis is that we consider the universe of outlets in Federal
Retail Pharmacy Program chains. As discussed earlier, not all chain pharmacy locations
have been used to distribute vaccines. Adding or removing locations can increase or
reduce disparities in vaccine access.
We obtain addresses for 10,439 vaccination sites on state websites, corresponding to
8,455 unique geographic coordinates. The mean and median number of locations per state
is 403 and 275, respectively. There are a few outliers. The West Virginia file contains only
23 locations because it lists only state-coordinated vaccine clinics. Missouri and Ohio list
over 1,300 locations.6
3 Dollar Store Chains in the United States
The major dollar store chains have expanded dramatically in the United States over the
last fifteen years. As Table 2 demonstrates, the number of outlets of the major dollar store
chains have more than doubled since 2005. As demonstrated by the 2019 and 2021 store
counts, substantial growth in stores, particularly Dollar General, continued even during
the COVID-19 pandemic.
While dollar stores blanket the continental US, the coverage of the two major chains
is particularly dense in the Southeast area of the country. Even a cursory inspection of
their prevalence by state demonstrates that they are particularly numerous in several of
the poorest states in the United States. As Figure 1 shows, Dollar General is most dense
per capita in Alabama, Arkansas, and Mississippi, with nearly 20 stores per 100 thousand
population. There is also substantial density also in Kentucky, Louisiana, Oklahoma,
South Carolina, Tennessee, and West Virginia. The other major dollar store chain, Dollar
Tree, while similar in terms of overall store counts, is substantially more dispersed geo-
6The website https://covidvaccine.mo.gov/map/ shows 1,639 vaccination websites, accessed 3/31/2021.The website https://coronavirus.ohio.gov/wps/portal/gov/covid-19/dashboards/covid-19-vaccine/covid-19-vaccine-provider-dashboard lists 1,332, accessed 3/31/2021.
9

Table 2: Summary statistics for U.S. Dollar Stores, selected years
No.Year Chain Stores
2005 Dollar General 7,086Family Dollar 5,406Dollar Tree 2,654
2012 Dollar General 9,617Family Dollar 7,257Dollar Tree 4,160
2019 Dollar General 15,317Dollar Tree/Family Dollar 14,495
2021 Dollar General 16,805Dollar Tree/Family Dollar 15,629
Notes: Number of outlets of Dollar Tree and Family Dollar byyear. Dollar Tree and Family Dollar merged in 2015. Some storesowned by Dollar Tree are still branded Family Dollar in 2021.Data from RefUSA.
graphically. As shown in Figure 1, it is most dense in Louisiana, New Mexico, and West
Virginia, with nine to ten stores per 100 thousand population. The state-by-state data
underpinning the figure is in Figure 6 in the Appendix.
As noted above, the rapid expansion of dollar stores in the United States has been
controversial. One recent report from the Institute for Local Self-Reliance refers to dollar
store chains as "an invasive species in America’s left behind places" (Donahue and Mitchell
(2018)). In particular, recent research examines linkages between the variety of food sold
at dollar stores and the prevalence of dollar stores and obesity, although some research
has questioned whether there is a causal link from dollar stores to obesity directly (Allcott,
Diamond, Dubé, Handbury, Rahkovsky, and Schnell, 2019). While a causal link has not
been established, some authors have argued that the influx of dollar stores cause the
exit of traditional supermarkets and grocery stores, creating food deserts, and numerous
localities have instituted regulations to curb dollar store growth.
Whether the growth of dollar stores has negative impacts is beyond the scope of this
10

Figure 1: Dollar General and Dollar Tree Locations; Stores per 100K Population
AK ME
WI VT NH
WA ID MT ND MN IL MI NY MA
OR NV WY SD IA IN OH PA NJ CT RI
CA UT CO NE MO KY WV VA MD DE
AZ NM KS AR TN NC SC DC
OK LA MS AL GA 010
20
Legend
DollGen
DollTree
HI TX FL
Stores per 100K populationDollar General and Dollar Tree
Notes: Depiction of Dollar General and Dollar Tree stores per 100 thousand population by state.Dollar General is represented by the black bar on the left and Dollar Tree by the white bar on theright. Raw data are shown in Figure 6 in the Appendix.
research. However, our hypothesis is that the criticisms of dollar stores derive precisely
from their potential advantage in a vaccine distribution program. If dollar stores are
more prevalent in locations proximate to low-income households than are other types of
retailers, then they are uniquely suited to improving vaccine access.
4 The Retail Pharmacy Program and Vaccine Access
Since the inception of the COVID-19 vaccination program in December 2020, all vaccine
doses available in the United States have been procured and distributed through the
11
federal government (Department of Health and Human Services, 2021). Each week,
manufacturers of FDA-authorized vaccines—three, as of April 2021—report the number
of doses available for distribution. Federal health officials reserve a portion of those doses
for federal vaccination efforts, such as the Department of Defense, the Department of
Veterans Affairs, and the Bureau of Prisons, as well as a small emergency reserve. Doses
are then allocated through two principal channels. 7 Most are directed to states, on a pro
rata basis according to their share of the U.S. adult population. Based on those weekly
allocations, state health officials place orders for quantities of vaccine doses (and vaccine
types) to be delivered to specific vaccination sites organized by local health systems, local
health departments, or other organizations working in partnership with that state.
Additional doses are directed to the Federal Retail Pharmacy Program. Currently,
doses are allocated to pharmacy partners in each CDC jurisdiction—the states, territories,
and large cities that have relationships with CDC—on the basis of population, thereby
bringing additional vaccine availability to states indirectly. The retail pharmacy partners
serving a given jurisdiction determine which of their retail locations will receive vaccine
doses; the CDC’s description of the program states that pharmacy partners make those
determination based on factors including "including equitable access, demand, supply,
and market saturation" (Centers for Disease Control and Prevention, 2021b).
The Federal Retail Pharmacy Program was created to ensure wide access to vaccines,
complementing and expanding upon state-supported vaccination sites. Throughout the
design and implementation of the vaccination effort to date, health officials have em-
phasized that the success of the program would be judged not simply on the number of
doses administered, the percent of the population vaccinated, or the reduction in cases
or severe outcomes following widespread vaccination, but also on the degree to which
vaccine administration occurs equitably within and among communities.
To inform this work on vaccine access and to evaluate its success, federal and state
health officials have utilized the Social Vulnerability Index (SVI). Created by the Centers
7In the initial months of the vaccination program, doses were also directly sent by the federal governmentto a program that administered vaccines to residents and staff of long-term care facilities. That effort, thePharmacy Partnership for Long-Term Care Program, involved three pharmacy partners—CVS, Walgreens,and Managed Health Care Associates—all of whom are among the participants in the current retail pharmacyprogram (Centers for Disease Control and Prevention, 2021b).
12
for Disease Control’s Agency for Toxic Substances and Disease Registry (CDC-ATSDR)
in 2011 and updated every two years, the measure is intended to capture "the degree
to which a community exhibits certain social conditions, including high poverty, low
percentage of vehicle access, or crowded households may affect that community’s ability
to prevent human suffering and financial loss in the event of disaster. These factors
describe a community’s social vulnerability."(Centers for Disease Control and Prevention,
Agency for Toxic Substances and Disease Registry/ Geospatial Research, Analysis, and
Services Program, 2018).
The SVI is calculated by the CDC using Census data at the Census tract level. For each
Census tract, the overall SVI index (called RPL-THEMES) "ranks the tract on 15 social
factors, including unemployment, minority status, and disability...."(Centers for Disease
Control and Prevention, Agency for Toxic Substances and Disease Registry/ Geospatial
Research, Analysis, and Services Program, 2018). The SVI index for a Census tract is a
measure from zero to one which reports the fraction of Census tracts that have an overall
social vulnerability less than the Census tract at issue.
The stated intent of the SVI is to assist health officials in identifying those communities
that may—as a result of these characteristics—require additional support during a public
health emergency or other hazardous event. It has been used by states and private entities
to calibrate disaster response prior to the COVID-19 pandemic (Flanagan, Hallisey, Adams,
and Lavery, 2018) and SVI measures have been shown to be correlated with worse COVID-
19 outcomes (Karaye and Horney, 2020). During the ongoing vaccination program, CDC
and states have released data evaluation patterns between vaccination coverage and social
vulnerability as measured via SVI (Hughes, 2021).
We examine the distribution of SVI measures of Census tracts in which federal phar-
macy partners are located. We compare these to the distribution of SVI measures for
Dollar General Stores. For further comparison, we also compare these to the distribution
of SVI measures for the other major dollar store chain, Dollar Tree/Family Dollar.
For the pharmacy partners and Dollar General stores in tracts with SVI designations,
we look at the distribution by decile of SVI. The numerical value of SVI for Census tract
i is the fraction of all Census tracts which are less vulnerable than tract i. Thus, higher
13

value of SVI is more vulnerable, and one tenth of all Census tracts are assigned to each
SVI decile bin. In the figure, we show the fraction of all federal pharmacy partner outlets
located in each decile bin of SVI, the fraction of all Dollar General stores located in each
decile bin of SVI, and the fraction of all Dollar Tree stores located in each decile bin of SVI.
The roughly 26 thousand pharmacy partners that we have mapped are nearly evenly
distributed across the SVI deciles. However, the highest SVI decile, composed of the
Census tracts estimated to have the highest social vulnerability, contain the smallest
fraction of the federal pharmacy partner locations. The figure for Dollar General illustrates
why it could be a valuable federal partner in reaching vulnerable communities. Dollar
General stores are noticeably underrepresented in the lowest SVI Census tracts.
5 Evidence on the Addition of Dollar Stores to Vaccine Ac-
cess
The Social Vulnerability Index has several distinct components. An important component
is household income. It is well-established that seasonal flu vaccination rates increase
with income (Linn, Guralnik, and Patel, 2010); lower-income households face numer-
ous barriers to vaccination such as access to scheduling technologies and transportation
(Schmid, Rauber, Betsch, Lidolt, and Denker, 2017; Press, Huisingh-Scheetz, and Arora,
2021). Vaccine take-up will likely improve with greater proximity to a vaccination site, es-
pecially a vaccination site within walking distance. Thus, we examine here the proximity
to retail pharmacy outlets of low-income households. Following the Census, we consider
low-income households to be households with less than $35 thousand in annual income.
We consider the proximity of the current federal pharmacy partners to these households,
as well as the proximity that would occur if all Dollar General locations were added as
vaccine locations.
As Figure 3 demonstrates, in the continental United States, 48.9 percent of low-income
households reside within one mile of an outlet of one of the current pharmacy partner
chains. This would represent an overestimate of access from this program because, as
14

Figure 2: Distribution of stores by Census tract SVI
010
20
1 2 3 4 5 6 7 8 910 1 2 3 4 5 6 7 8 910 1 2 3 4 5 6 7 8 910SVI decile SVI decile SVI decile
Pharmacy Dollar General Dollar TreePe
rcen
t of s
tore
type
in S
VI d
ecile
Notes: Distribution of Pharmacy partners, Dollar General, and Dollar Tree Stores by social vul-nerability index (SVI) deciles, continental United States. The figure shows the share of currentpharmacy partners, Dollar General stores, and Dollar Tree stores by SVI decile. For example, ifan outlet of a chain is located in a Census tract for which 95 percent of all Census tracts are lessvulnerable using the full SVI index, the outlet will be counted to be in the top SVI decile in thegraph.
discussed above, not all outlets of these chains are or will supply vaccines. This climbs
to 60.5 percent if the vaccine were offered at all Dollar General outlets. For comparison,
the right panel of Figure 3 provides comparable statistics for high-income households
with incomes greater than $100 thousand. A slightly higher fraction of high-income
households are close to a federal pharmacy site than are low-income households, 49.5
percent. However, as might be expected by the high average SVI index of dollar store
15
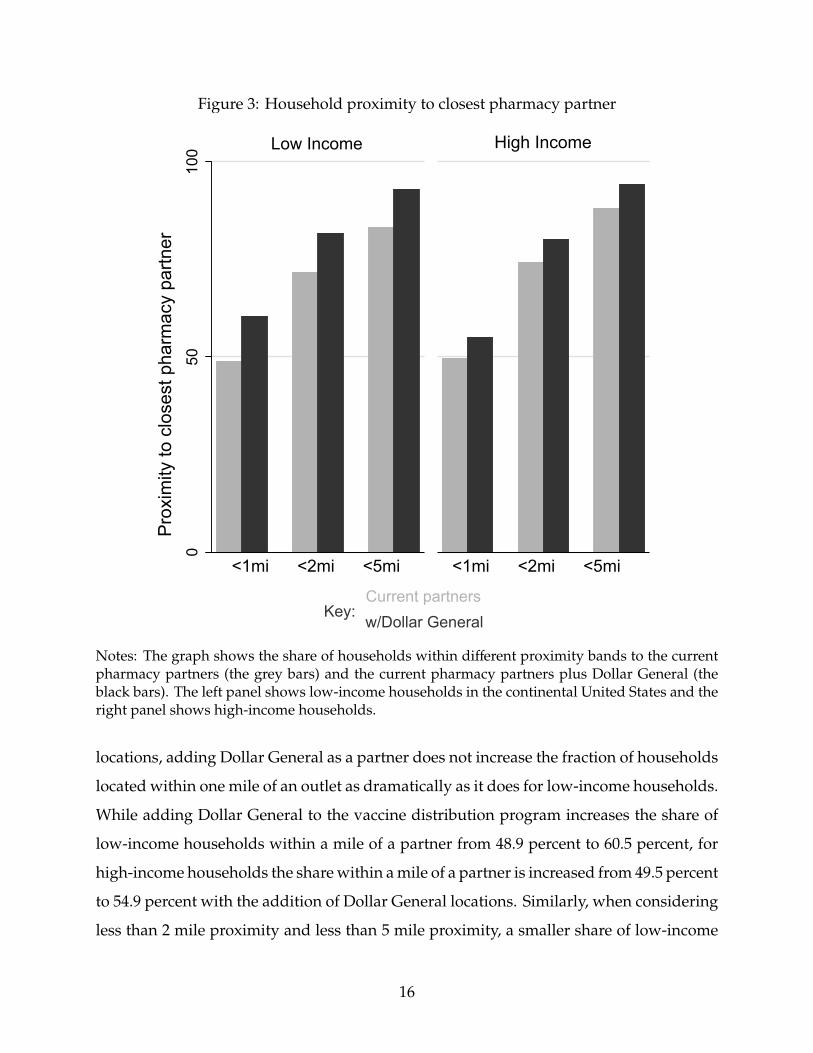
Figure 3: Household proximity to closest pharmacy partner
050
100
<1mi <2mi <5mi <1mi <2mi <5mi
Current partnersw/Dollar General
Low Income High IncomePr
oxim
ity to
clo
sest
pha
rmac
y pa
rtner
Key:
Notes: The graph shows the share of households within different proximity bands to the currentpharmacy partners (the grey bars) and the current pharmacy partners plus Dollar General (theblack bars). The left panel shows low-income households in the continental United States and theright panel shows high-income households.
locations, adding Dollar General as a partner does not increase the fraction of households
located within one mile of an outlet as dramatically as it does for low-income households.
While adding Dollar General to the vaccine distribution program increases the share of
low-income households within a mile of a partner from 48.9 percent to 60.5 percent, for
high-income households the share within a mile of a partner is increased from 49.5 percent
to 54.9 percent with the addition of Dollar General locations. Similarly, when considering
less than 2 mile proximity and less than 5 mile proximity, a smaller share of low-income
16

households have proximity to pharmacy partners than do high-income households for
each cutoff. Adding Dollar General reverses this, and a larger fraction of low-income
households are within 2 or 5 miles of a partner when Dollar General is added to the
program.
Currently, we estimate that 86.3 percent of U.S. adults live within 5 miles of an outlet
of one of the federal pharmacy partner chains. Adding Dollar General would raise that to
94.3 percent of U.S. adults living within 5 miles of at least one outlet of a pharmacy partner
chain or Dollar General. This accounting does not include state and local vaccination sites,
suggesting that there are multiple routes to achieving the Biden administration’s goal of
90 percent of adults residing within 5 miles of a vaccination site.
While the overall continental U.S. pattern illustrates the substantial proximity im-
provements of adding Dollar General as a pharmacy partner, the overall data masks
considerable cross-state heterogeneity. Figure 4 focuses on the less than one mile distance.
The figure shows, for each state, the share of low-income households located less than
one mile from a federal pharmacy partner. On the left of each bar pair for each state, the
current pharmacy partner is shown and on the right the impact of adding Dollar General is
illustrated. In some states, such as Alaska and Hawaii, there are no Dollar General stores
and thus the figure shows no improvement (the two bars are of equal height). However,
in some states, particularly in the South and Midwest, the hypothetical addition of Dollar
General to the pharmacy program dramatically increases the share of low-income house-
holds less than one mile from a pharmacy partner. The raw data are included in Figure 7
in the Appendix.
Racial and ethic disparities in COVID-19 vaccine distribution have been identified.
White and Asian individuals have been vaccinated at a rate greater than or equal to their
share of the population, share of cases, and share of deaths. In contrast, Black and Hispanic
individuals had, as of the end of March, been undervaccinated relative to their prevalence
in the population and to their share of COVID-19 cases and share of deaths (Ndugga,
Pham, Hill, Artiga, Alam, and Parker, 2021). Improving proximity of vaccine providers
to these groups may help ameliorate such disparities. To explore this, we measure the
impact of adding Dollar General to the Federal Retail Pharmacy Partnership Program on
17
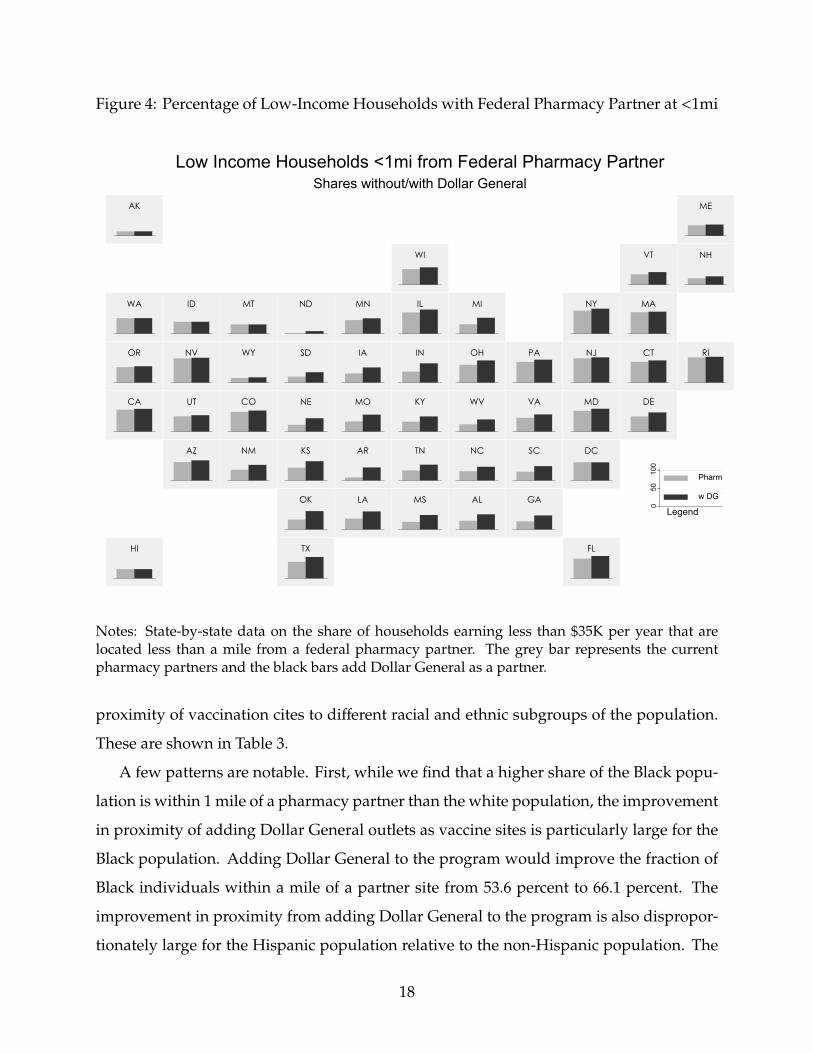
Figure 4: Percentage of Low-Income Households with Federal Pharmacy Partner at <1mi
AK ME
WI VT NH
WA ID MT ND MN IL MI NY MA
OR NV WY SD IA IN OH PA NJ CT RI
CA UT CO NE MO KY WV VA MD DE
AZ NM KS AR TN NC SC DC
OK LA MS AL GA
050
100
Legend
Pharm
w DG
HI TX FL
Shares without/with Dollar GeneralLow Income Households <1mi from Federal Pharmacy Partner
Notes: State-by-state data on the share of households earning less than $35K per year that arelocated less than a mile from a federal pharmacy partner. The grey bar represents the currentpharmacy partners and the black bars add Dollar General as a partner.
proximity of vaccination cites to different racial and ethnic subgroups of the population.
These are shown in Table 3.
A few patterns are notable. First, while we find that a higher share of the Black popu-
lation is within 1 mile of a pharmacy partner than the white population, the improvement
in proximity of adding Dollar General outlets as vaccine sites is particularly large for the
Black population. Adding Dollar General to the program would improve the fraction of
Black individuals within a mile of a partner site from 53.6 percent to 66.1 percent. The
improvement in proximity from adding Dollar General to the program is also dispropor-
tionately large for the Hispanic population relative to the non-Hispanic population. The
18

Table 3: Impacts of adding Dollar General vaccine sites
Current partners w Dollar GeneralPopulation Share Share Share Sharetype <1 mile < 5 miles <1 mile < 5 miles
All adults 48.3 86.3 56.3 94.3Black Population 53.6 93.2 66.1 98.0White Population 44.3 83.8 52.3 93.3AAPI Population 65.9 97.5 68.5 98.4Other Population 58.5 90.4 65.0 94.7Hispanic Population 44.9 84.6 53.4 93.7Non-Hispanic Population 61.2 93.7 68.0 97.0
Summary statistics for Federal Retail Pharmacy Partner Program. Table entries denotethe share of the total U.S. population type within the denoted proximity to an in-statepharmacy partner.
share of Hispanic people less than a mile from a partner site is 44.9 percent without Dollar
General and 53.4 percent with Dollar General.
We have seen that the overall data for the impacts of adding Dollar General to the
program is particularly large for Black individuals and Hispanic people. For Black indi-
viduals, the overall data again masks substantial heterogeneity across states. As shown in
Figure 5, the improvement to proximity for Black Americans is particularly pronounced
throughout the Southeast and Midwest. Arkansas is one of the starkest examples. There,
the federal pharmacy program outlets are within a mile of only 10.0 percent of blacks and
11.2 percent of whites. However, the addition of Dollar General improves one-mile prox-
imity to 32.3 percent of whites and 53.6 percent of Black individuals. The benefit to black
Americans of adding Dollar General is large in several Midwestern states. For example,
in Michigan, 28.2 percent of the white population is within one mile of a federal pharmacy
partner and 33.6 percent of the black population. Adding Dollar General raises this to
37.5 percent of the white population and 60.2 percent of the Black population. The raw
data underlying Figure 5 is given in the Appendix. A similar data table for the Hispanic
population is also given in the Appendix (Figure 9).
Dollar General and the CDC have confirmed that a vaccine partnership between them
is being discussed. However, given the high-SVI locations of Dollar Tree, it could be
19

Figure 5: Percentage of Low-Income Households with Federal Pharmacy Partner at <1mi
AK ME
WI VT NH
WA ID MT ND MN IL MI NY MA
OR NV WY SD IA IN OH PA NJ CT RI
CA UT CO NE MO KY WV VA MD DE
AZ NM KS AR TN NC SC DC
OK LA MS AL GA
050
100
Legend
Pharm
w DG
HI TX FL
Shares without/with Dollar GeneralBlack Population <1mi from Federal Pharmacy Partner
Notes: State-by-state data on the share of households earning less than $35K per year that arelocated less than a mile from a federal pharmacy partner. The grey bar represents the currentpharmacy partners and the black bars add Dollar General as a partner.
that Dollar Tree as a vaccine partner would provide even better proximity to vaccines
for low-income households than Dollar General.8 We examine this question by again
measuring the proximity of low-income households to current pharmacy partners and to
Dollar Tree. We found that 60.5 percent of low-income households in the continental U.S.
are less than one mile from current pharmacy partners plus Dollar General while 61.56
percent of low-income households are less than one mile from current pharmacy partners
plus Dollar Tree. Thus, Dollar Tree would provide slightly higher within one mile access
8Of course, there may be other characteristics of Dollar Tree that make them less suitable or even totallyunsuitable for the program, such as available space, etc.
20

to low-income households. Interestingly, this finding is not true for wider distance bands.
More low-income households are within 2 or 5 miles from the current pharmacies plus
Dollar General than are within 2 or 5 miles from the current pharmacies plus Dollar Tree.
The overall findings again mask some cross-state heterogeneity. As Figure 6 shows, the
share of low-income households within a mile of a pharmacy partner plus hypothetical
dollar store partner is, in many states, similar whether the dollar store partner is Dollar
General or Dollar Tree. Dollar Tree’s locations are particularly attractive relative to Dollar
General in the West.
Figure 6: Percentage of Low-Income Households with Federal Pharmacy Partner at <1mi
AK ME
WI VT NH
WA ID MT ND MN IL MI NY MA
OR NV WY SD IA IN OH PA NJ CT RI
CA UT CO NE MO KY WV VA MD DE
AZ NM KS AR TN NC SC DC
OK LA MS AL GA
050
100
Legend
w/DG
w/DT
HI TX FL
Low Income Households <1mi from Federal Pharmacy PartnerPlus Dollar General/Dollar Tree
Notes: State-by-state data on the share of households earning less than $35K per year that arelocated less than a mile from a federal pharmacy partner or dollar store. The black bars representsthe current pharmacy partners plus Dollar General while the white bars represent the currentpharmacy partners plus Dollar Tree.
21

6 State Allocations and State Vaccination Sites
Our findings that dollar stores vaccine sites would substantially expand vaccine proximity
for low-income households, particularly in the South and Southeastern United States.
Thus far, our analysis has examined only chains that are partners in the Federal Retail
Pharmacy Partnership Program. However, as discussed above, while some vaccine doses
are allocated to this program, doses are also allocated to states to supply the vaccination
sites that states support. If state vaccination sites have been established in low-income
areas, it is possible that dollar stores and the sites chosen by states for vaccinations are
redundant in increasing proximity to low-income residents.
To do this, we scraped the COVID vaccine websites of 21 states to find the full listing of
vaccination sites in the state. These listings typically included federal pharmacy partners
and Federally Qualified Health Centers. However, they typically included only sites that
were actively providing vaccinations when we scraped the site. We used these listings
to construct, for these 21 states, a superset of vaccine sites. These included the federal
retail partners that we had identified plus the sites listed in the state website. Obviously,
sometimes a site was listed in both places. When a retail chain in the pharmacy program
had not yet started using a particular outlet for vaccines, it would appear on our federal
retail partner list but not on the state list. A state hospital or mass vaccination site would
appear on the state list but not our federal partner list. Our superset of sites includes all
of the sites on the state site plus all outlets of federal retail pharmacy partners. Having
constructed that set, we recalculated the distance of households to their closest within-state
vaccination site, again the Census methodology described above.
We find that state vaccination sites do not add substantially to our measures of prox-
imity to low-income households in some states, but do in others. For example, we find
that only 9.1 percent of low-income households were within a mile of the federal phar-
macy partners in Arkansas. Adding in the state sites raises the fraction of low-income
households within a mile of a vaccine site to 32 percent. In states for which the state
sites do not meaningfully improve proximity, we hypothesize that either the state is using
pop-up clinics not listed on the state site and/or the state relies heavily on mass vacci-
22
nation sites that have large capacity but do not substantially improve proximity. While
the state sites substantially improve proximity to low-income households, we find that in
many cases, particularly in the South, the state sites are not redundant with the proximity
benefits of adding dollar stores. Not considering state sites, the combination of federal
pharmacy partners and Dollar General outlets raised the fraction of Arkansas low-income
households within a mile of a vaccine site from 9.1 percent without Dollar General to 40
percent with Dollar General. The Federal pharmacy plus state sites are within a mile of
32 percent of low-income households. Adding Dollar General would still improve this
share substantially, to 48 percent.
Table 4 shows the share of low-income households within a mile of a federal pharmacy
partner, the share within a mile of a federal pharmacy partner and/or state site, and the
share within a mile of a federal pharmacy partner, state site, and/or Dollar General. The
figure shows that Dollar General provides substantial improvement in access, particularly
in the South, even when taking state vaccine sites into account. The table also shows the
share of low-income households within five miles of a vaccine site using these same
metrics.
7 Discussion and Conclusions
In the four months since its launch, the U.S. COVID-19 vaccination program has rapidly
transitioned from having one authorized vaccine, extremely scarce doses available, and
narrow vaccine prioritization guidelines to three authorized vaccines, tens of millions of
doses available weekly, and open eligibility in many U.S. states. As this effort transitions
to a new phase throughout the spring and summer, considerable work remains delivering
vaccines to those yet to be vaccinated, for whom navigating vaccine appointment regis-
tration systems, identifying available vaccine sites, arranging for transportation, or other
access barriers may have thus far been insurmountable obstacles.
Evidence to date suggests that vaccination efforts —nationally, at the state level, and in
cities—have performed considerably less well with respect to meeting their equity goals
as they have regarding those measuring the speed and pace of vaccine administration
23

Table 4: Characteristics of federal pharmacy and state vaccine sites
<1 mile <1 mile <1 mile <5 miles <5 miles <5 milesState pharm. pharm. + pharm. + pharm. pharm. + pharm. +
state state + state state+DG DG
Alaska 13.79 37.97 37.97 39.41 58.66 58.66Alabama 26.79 36.36 51.98 69.6 76.98 93.58Arkansas 9.12 32.04 48.43 50.24 73.89 87.63Connecticut 64.68 73.21 75.54 97.33 98.01 98.72Georgia 25.21 32.81 47.56 77.91 84.29 95.97Illinois 66.15 71.27 77.89 89.33 90.7 96.38Kansas 39.9 50.12 62.27 73.46 83.9 90.47Maryland 64.53 72.11 76.02 92.97 94.41 97.34Maine 32.45 33.56 35.75 62.3 65.12 73.89Missouri 31.21 58.61 65.48 73.94 85.49 92.37Mississippi 23.14 39.16 50.86 58.56 68.81 87.16North Dakota 0 50.81 51.4 14.64 72.6 74.11New Jersey 75.75 79.4 82.08 98.71 99.12 99.73Nevada 75.25 78.24 80.22 91.74 92.31 93.16Ohio 55.62 67.24 75.3 90.22 92.29 97.29Oklahoma 30.52 43.29 62.87 72.36 78.41 92.85Pennsylvania 64.49 70.31 74.69 90.59 92.86 97.76South Carolina 27.38 32.87 47.58 76.56 79.02 94.13Washington 48.27 56.07 56.18 83.96 88.75 88.85West Virginia 22.45 23.1 37.63 68.4 70.11 87.03
Notes: Share of low-income households less than one mile/5 miles from pharmacy partners, phar-macy partners plus state vaccine sites, and pharmacy partners plus state vaccine sites plus DollarGeneral. Data from RefUSA and state vaccine sites.
(Hughes, 2021). These reports also indicate that the need for enhanced efforts to ensure
broad access to vaccines—and correspondingly high vaccine uptake—in low-income and
high-SVI communities remains particularly acute. Even if vaccines were to be made
available in some traditional clinical settings later in 2021, centrally-located, vaccination-
specific sites in communities will most likely remain an important component of the
COVID-19 response for months to come. This is particularly true given the possibility
that emerging viral variants or waning immunity, two areas being monitored by health
officials, may require subsequent cycles of mass vaccination that would require elements
of the large-scale vaccination infrastructure and capacity currently in place and actively
being expanded upon (Del Rio and Malani, 2021).
24

We show that adding dollar stores as vaccination sites, as has been recently discussed
by the Biden administration, would offer considerable proximity benefits, particularly
for low-income households and Black Americans in several regions of the continental
U.S., if such a program were added to the existing retail pharmacy partnership. These
benefits would be seen even if all available pharmacy partner locations were to serve as
vaccination sites. Benefits from the addition of Dollar General stores, the specific partner
in discussions with federal officials regarding a potential partnership, would be enhanced
in many locations by the inclusion of Dollar Tree, the other major dollar store chain.
The use of dollar stores as vaccination sites would require a number of implementa-
tion and logistical challenges to be addressed, particularly because they currently lack
the facilities and employees trained to administer vaccines present at federal pharmacy
partner locations. But recent discussions about a potential dollar store partnership by
federal health officials suggest that they believe those challenges to be solvable, offset
by potential advantages including not only the well-positioned locations of these stores
but also their familiarity to local residents, available indoor and outdoor space, parking
lots (in many locations), and other attributes. Some of the $7.5 billion for COVID-19
vaccination provided in the recently signed American Rescue Plan could be used for the
vaccine-related equipment and personnel needed for dollar stores to serve as vaccination
sites.
If implemented successfully, the administration of vaccines at dollar stores would
not only provide the proximity benefits considered invaluable to the equitable rollout
of COVID-19 vaccines, but it could suggest additional opportunities beyond the current
pandemic. Annual influenza vaccination similarly relies on rapidly delivering vaccines to
tens of millions of Americans in a compressed period, often through the use of temporary
large-scale vaccination clinics outside of traditional health care settings. Reported rates
of influenza vaccine administration are lower among low-income older adults, the age
group—as with COVID-19—at the greatest risk of severe disease-related outcomes (Artiga,
Michaud, Kates, and Orgera, 2020).
Enhancing proximity to vaccination sites is by no means sufficient to ensuring access,
equity, and high rates of COVID-19 vaccination among low-income and minority com-
25

munities or the overall population. But it is an important component of approaches to
reduce barriers to vaccination, alongside efforts to build support and enthusiasm for the
vaccines and address sources of vaccine hesitancy. The potential addition of dollar stores
as vaccination sites—in tandem with the federal pharmacy program and state-supported
locations—is a promising approach toward strengthening COVID-19 vaccination pro-
grams and increasing their ability to reach all eligible populations in the months ahead.
26

8 References
Allcott, H., R. Diamond, J.-P. Dube, J. Handbury, I. Rahkovsky, andM. Schnell (2019):“Food deserts and the causes of nutritional inequality,” The Quarterly Journal ofEconomics, 134(4), 1793–1844.
Artiga, S., J. Michaud, J. Kates, and K. Orgera (2020): “Racial disparities in fluvaccination: implications for COVID-19 vaccination efforts,” Kaiser Family Foundation,September, 15.
Barker, A. (2021): “Walmart exec says supply-demand dynamic of vaccine rollout couldsoon shift,” .
Bibbins-Domingo, K., M. Petersen, and D. Havlir (2021): “Taking Vaccine to Where theVirus Is—Equity and Effectiveness in Coronavirus Vaccinations,” in JAMA HealthForum, vol. 2, pp. e210213–e210213. American Medical Association.
Boomey, N. (2021): “CDC, Dollar General exploring partnership to speed up COVID-19vaccine rollout,” USA Today.
Cassel, C. K. (2018): “Can retail clinics transform health care?,” Jama, 319(18), 1855–1856.
Centers for Disease Control and Prevention (2021a): “Pharmacies Participating in theFederal Retail Pharmacy Program,” .
(2021b): “Understanding the Pharmacy Partnership for Long-Term CareProgram,” .
Centers for Disease Control and Prevention, Agency for Toxic Substances andDisease Registry (2021): “CDC Social Vulnerability Index,” .
Centers for Disease Control and Prevention, Agency for Toxic Substances andDisease Registry/ Geospatial Research, Analysis, and Services Program (2018):“CDC SVI Documentation 2018,” .
Del Rio, C., and P. Malani (2021): “COVID-19 in 2021—Continuing Uncertainty,” JAMA.
Department of Health and Human Services (2021): “COVID-19 Vaccine Distribution:The Process,” .
Dollar General Stores (2021): “Ongoing Efforts for COVID 19,” .
Donahue, M., and S. Mitchell (2018): “Dollar stores are targeting struggling urbanneighborhoods and small towns. One community is showing how to fight back,”Institute for Local Self-Reliance.
Flanagan, B. E., E. J. Hallisey, E. Adams, and A. Lavery (2018): “Measuring communityvulnerability to natural and anthropogenic hazards: the Centers for Disease Controland Prevention’s Social Vulnerability Index,” Journal of environmental health, 80(10), 34.
27

Hughes, M. M. (2021): “County-Level COVID-19 Vaccination Coverage and SocialVulnerability—United States, December 14, 2020–March 1, 2021,” MMWR. Morbidityand Mortality Weekly Report, 70.
Infogroup (2005-2021): “ReferenceUSA Business Historical Data Files,” .
Karaye, I. M., and J. A. Horney (2020): “The impact of social vulnerability on COVID-19in the US: an analysis of spatially varying relationships,” American journal of preventivemedicine, 59(3), 317–325.
Linn, S. T., J. M. Guralnik, and K. V. Patel (2010): “Disparities in influenza vaccinecoverage in the United States, 2008,” Journal of the American Geriatrics Society, 58(7),1333–1340.
Meyersohn, N. (2019): “Dollar stores are everywhere. That is a problem for poorAmericans,” CNN Business.
Ndugga, N., O. Pham, L. Hill, S. Artiga, R. Alam, and N. Parker (2021): “Kaiser FamilyFoundation:Latest Data on COVID-19 Vaccinations March 31 2021,” .
Pandey, E. (2019): “Cities lead the backlash against dollar stores,” Axios.
Press, V. G., M. Huisingh-Scheetz, and V. M. Arora (2021): “Inequities in TechnologyContribute to Disparities in COVID-19 Vaccine Distribution,” in JAMA Health Forum,vol. 2, pp. e210264–e210264. American Medical Association.
Robbins, R., and N. Weiland (2021): “A U.S. program aiming to channel a huge numberof vaccines through pharmacies will start soon,” .
Schmid, P., D. Rauber, C. Betsch, G. Lidolt, andM.-L. Denker (2017): “Barriers ofinfluenza vaccination intention and behavior–a systematic review of influenza vaccinehesitancy, 2005–2016,” PloS one, 12(1), e0170550.
TheWhite House (2021): “Fact Sheet: President Biden Announces 90% of the Adult U.S.Population will be Eligible for Vaccination and 90% will have a Vaccination Site Within5 Miles of Home by April 19,” .
28

9 Appendix
Table 5: State-Coordinated Vaccine Locations
State Website
Alabama https://bamatracker.com/providers
Alaska https://anchoragecovidvaccine.org/providers/
Arkansas https://www.healthy.arkansas.gov/programs-services/topics/covid-19-map-of-1-a-pharmacy-locations
Connecticut https://www.211ct.org/search?page=1&location=Connecticut&taxonomy_code=11172&service_area=connecticut
Georgia http://www. dph.georgia.gov/locations/covid-vaccination-site
Illinois https://coronavirus.illinois.gov/s/vaccination-location
Kansas https://kdhe.maps.arcgis.com/apps/instant/nearby/index.html?appid=2cf619afb6c74320a26855840a8ca3e3
Maine https://www.maine.gov/covid19/vaccines/vaccination-sites
Maryland https://maryland.maps.arcgis.com/apps/instant/nearby/index.html?appid=0dbfb100676346ed9758be319ab3f40c&find=
Mississippi https://msdh.ms.gov/msdhsite/_static/14,0,420,976.html#providerMap
Missouri https://covidvaccine.mo.gov/map/Approved-Vaccinators.pdf
North Dakota https://app.powerbigov.us/view?r=eyJrIjoiNmY1ZWFiMzktYzMzNC00ZTQxLTkxZTAtNWRiMzkyYzYzMjk0IiwidCI6
IjJkZWEwNDY0LWRhNTEtNGE4OC1iYWUyLWIzZGI5NGJjMGM1NCJ9
Nevada https://www.immunizenevada.org/covid-19-vaccine-locator
New Jersey https://newjersey.github.io/vaccine-locations/NJ-COVID-19-Vaccine-Locations.pdf
Ohio https://coronavirus.ohio.gov/wps/portal/gov/covid-19/dashboards/covid-19-vaccine/covid-19-vaccine-provider-dashboard
Oklahoma https://vaccinate.oklahoma.gov/en-US/vaccine-centers/
Pennsylvania https://padoh.maps.arcgis.com/home/item.html?id=d169e1d2ae454bec928d046156dd7186
South Carolina https://sc-dhec.maps.arcgis.com/apps/instant/nearby/index.html?appid=514e64ead13e4f508147dad8f483da38
Washington https://www.doh.wa.gov/YouandYourFamily/Immunization/VaccineLocations#
West Virginia https://dhhr.wv.gov/News/2021/Pages/COVID-19-Vaccination-Clinics-March-2-7,-2021.aspx
Wisconsin https://dhsgis.wi.gov/server/rest/services/DHS_COVID19/COVID19_Vaccine_Provider_Sites/MapServer/0/query?
where=1%3D1&text=&objectIds=&time=&geometry=&geometryType=esriGeometryEnvelope&inSR=&
spatialRel=esriSpatialRelIntersects&relationParam=&outFields=*&returnGeometry=false&returnTrueCurves=false
&maxAllowableOffset=&geometryPrecision=&outSR=&returnIdsOnly=false&returnCountOnly=false&orderByFields=&
groupByFieldsForStatistics=&outStatistics=&returnZ=false&returnM=false&gdbVersion=&returnDistinctValues=false&
resultOffset=&resultRecordCount=&queryByDistance=&returnExtentsOnly=false&datumTransformation=&
parameterValues=&rangeValues=&f=pjson
Notes: Websites used to gather state-coordinated vaccine locations.
29

Table 6: Summary Statistics for U.S. Dollar Stores, Selected Years
Dollar Dollar Dollar General Dollar TreeGeneral Tree per 100K per100K
Alabama 791 317 16.26 6.52Alaska 0 0 0 0Arizona 123 306 1.77 4.4Arkansas 463 198 15.48 6.62California 229 781 .58 1.99Colorado 56 234 1.01 4.23Connecticut 69 126 1.93 3.52Delaware 48 65 5.06 6.85District of Columbia 0 6 0 .88Florida 927 1160 4.5 5.63Georgia 944 719 9.17 6.98Hawaii 0 0 0 0Idaho 0 95 0 5.63Illinois 587 547 4.58 4.27Indiana 596 371 8.98 5.59Iowa 276 110 8.81 3.51Kansas 250 121 8.59 4.16Kentucky 596 346 13.42 7.79Louisiana 586 453 12.57 9.71Maine 59 103 4.43 7.73Maryland 138 237 2.3 3.95Massachusetts 54 250 .79 3.66Michigan 588 648 5.91 6.51Minnesota 170 190 3.08 3.44Mississippi 549 249 18.37 8.33Missouri 564 302 9.26 4.96Montana 0 40 0 3.84Nebraska 130 70 6.83 3.68Nevada 21 113 .72 3.87New Hampshire 40 71 2.98 5.28New Jersey 156 317 1.76 3.57New Mexico 106 190 5.07 9.08New York 499 662 2.54 3.37North Carolina 896 743 8.82 7.32North Dakota 44 36 5.85 4.79Ohio 887 552 7.62 4.74Oklahoma 472 241 12.05 6.15Oregon 60 100 1.47 2.45Pennsylvania 806 654 6.3 5.11Rhode Island 21 73 1.99 6.91South Carolina 575 396 11.6 7.99South Dakota 60 42 6.94 4.86Tennessee 832 403 12.51 6.06Texas 1591 1732 5.71 6.21Utah 11 126 .36 4.14Vermont 38 24 6.08 3.84Virginia 441 459 5.24 5.46Washington 3 140 .04 1.92West Virginia 240 191 13.12 10.44Wisconsin 210 275 3.63 4.76Wyoming 3 45 .52 7.73
Notes: Number of dollar stores and stores per 100 thousand population, by state. Datafrom RefUSA.
30

Table 7: Vaccine Access—Low-Income Households
<1 mile <1 mile <1 mileState pharmacy pharmacy plus pharmacy plus
DG DT
AK 13.79 13.79 13.79AL 26.79 46.9 41.11AR 9.12 40.72 35.31AZ 57.43 62.87 68.73CA 68.07 70.54 75.08CO 61.29 65.38 69.58CT 64.68 69.05 69.3DC 56.56 56.56 67.3DE 47.17 59.53 63.72FL 61.17 69.83 70.23GA 25.21 43.6 44.73HI 28.99 28.99 28.99IA 28.51 47.28 41.84ID 36.7 36.7 44.84IL 66.15 75.04 73.2IN 34.25 59.97 57.58KS 39.9 60.15 53.04KY 30.54 46.91 41.38LA 33.85 56.07 59.33MA 67.16 68.61 75.03MD 64.53 70.91 73.05ME 32.45 34.65 37.41MI 29.44 49.28 60.31MN 42.34 47.67 50.43MO 31.21 52.68 50.61MS 23.14 44.85 40.4MT 28.58 28.58 31.65NC 28.7 42.44 42.97ND 0 7.6 23.82NE 20.42 41.46 45.31NH 19.72 25.96 31.73NJ 75.75 79.11 81.37NM 32.91 48.43 55.49NV 75.25 77.24 80.29NY 71.69 77.85 79.62OH 55.62 69.18 68.72OK 30.52 57.38 52.22OR 48.51 51.17 52.67PA 64.49 71.52 68.89PR 35.41 35.41 35.41RI 78.53 80.53 82.48SC 27.38 44.97 40.21SD 18.73 32.22 28.89TN 31.18 49.18 44.69TX 51.61 66.81 68.41US 48.39 59.58 60.65UT 47.28 51 62.43VA 42.92 53.26 57.26VT 32.4 39.16 33.42WA 48.27 48.38 51.62WI 48.81 54.4 58.52WV 22.45 37.47 33.71WY 14.21 16.23 35.24
Notes: Share of low-income households less than one mile frompharmacy partners, pharmacy partners plus Dollar General, andpharmacy partners plus Dollar Tree/Family Dollar. Data from Re-fUSA.
31
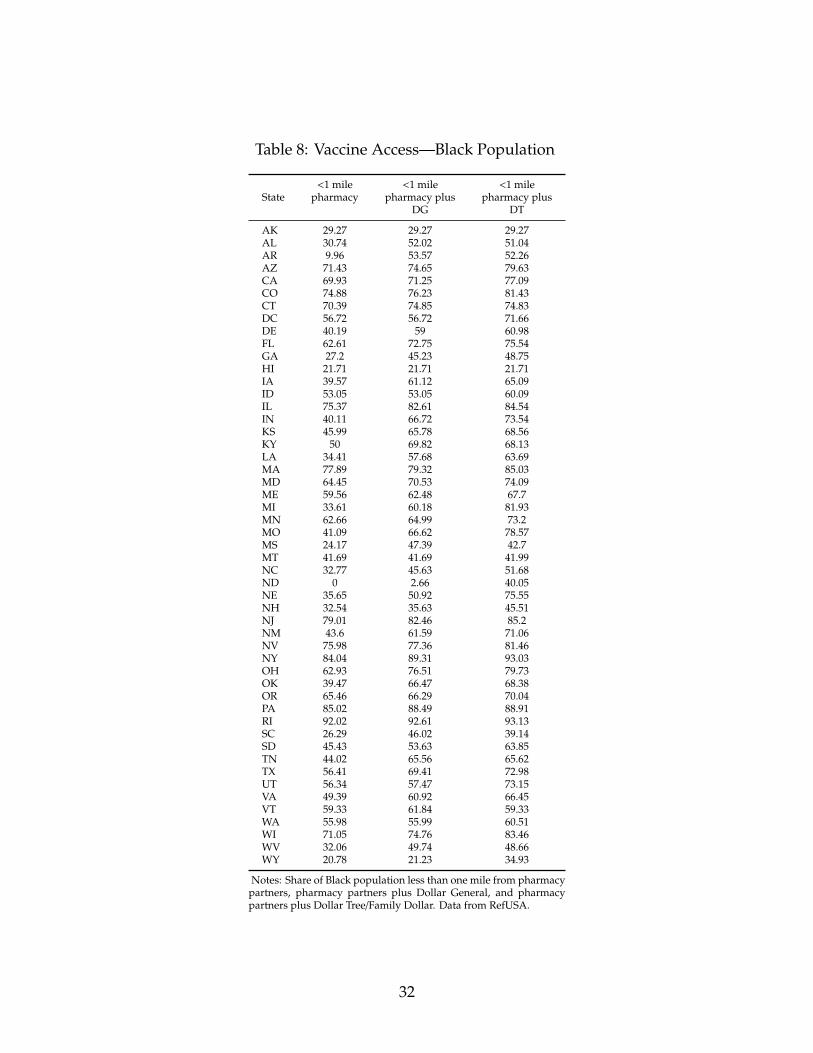
Table 8: Vaccine Access—Black Population
<1 mile <1 mile <1 mileState pharmacy pharmacy plus pharmacy plus
DG DT
AK 29.27 29.27 29.27AL 30.74 52.02 51.04AR 9.96 53.57 52.26AZ 71.43 74.65 79.63CA 69.93 71.25 77.09CO 74.88 76.23 81.43CT 70.39 74.85 74.83DC 56.72 56.72 71.66DE 40.19 59 60.98FL 62.61 72.75 75.54GA 27.2 45.23 48.75HI 21.71 21.71 21.71IA 39.57 61.12 65.09ID 53.05 53.05 60.09IL 75.37 82.61 84.54IN 40.11 66.72 73.54KS 45.99 65.78 68.56KY 50 69.82 68.13LA 34.41 57.68 63.69MA 77.89 79.32 85.03MD 64.45 70.53 74.09ME 59.56 62.48 67.7MI 33.61 60.18 81.93MN 62.66 64.99 73.2MO 41.09 66.62 78.57MS 24.17 47.39 42.7MT 41.69 41.69 41.99NC 32.77 45.63 51.68ND 0 2.66 40.05NE 35.65 50.92 75.55NH 32.54 35.63 45.51NJ 79.01 82.46 85.2NM 43.6 61.59 71.06NV 75.98 77.36 81.46NY 84.04 89.31 93.03OH 62.93 76.51 79.73OK 39.47 66.47 68.38OR 65.46 66.29 70.04PA 85.02 88.49 88.91RI 92.02 92.61 93.13SC 26.29 46.02 39.14SD 45.43 53.63 63.85TN 44.02 65.56 65.62TX 56.41 69.41 72.98UT 56.34 57.47 73.15VA 49.39 60.92 66.45VT 59.33 61.84 59.33WA 55.98 55.99 60.51WI 71.05 74.76 83.46WV 32.06 49.74 48.66WY 20.78 21.23 34.93
Notes: Share of Black population less than one mile from pharmacypartners, pharmacy partners plus Dollar General, and pharmacypartners plus Dollar Tree/Family Dollar. Data from RefUSA.
32

Table 9: Vaccine Access—Hispanic Population
<1 mile <1 mile <1 mileState pharmacy pharmacy plus pharmacy plus
DG DT
AK 15.72 15.72 15.72AL 22.72 40.03 32.39AR 10.65 35.34 28.59AZ 59.54 62.15 64.04CA 67.22 68.43 71.09CO 61.99 63.59 66.34CT 44.88 49 48.99DC 63.99 63.99 73.04DE 35.53 44.95 48.58FL 52.56 60.93 59.62GA 24.05 38.49 36.72HI 24.27 24.27 24.27IA 27.36 42.72 37.47ID 35.99 35.99 43.4IL 59.5 66.92 64.04IN 29.62 48.57 42.41KS 40.97 54.72 48.1KY 28.78 44.76 38.88LA 31.53 49.66 50.29MA 52.73 54.14 58.55MD 53.94 58.54 59.61ME 31.15 34.47 36.94MI 29.05 42.58 48.34MN 39.77 43.32 45.76MO 31.26 47.97 43.53MS 19.23 36.8 31.39MT 30.5 30.5 33.27NC 26.64 37.6 37.35ND 0 5.18 29.43NE 26.76 44.69 42.88NH 11.57 17.83 21.88NJ 63.84 66.25 68.18NM 34.37 47.2 51.12NV 63.5 65.46 66.94NY 64.36 68.92 69.88OH 46.58 57.87 53.75OK 30.7 53.01 44.89OR 47.86 50.26 51.95PA 51.56 58.32 54.65RI 61.12 62.96 65.06SC 26.17 42.23 35.01SD 22.56 35.46 30.69TN 28.14 43.9 36.87TX 52.64 62.21 60.78UT 40.51 41.96 52.06VA 46.78 53.21 55.1VT 32.35 38.38 33.21WA 44.52 44.64 47.48WI 35.75 41.6 44.23WV 17.96 31.97 27.25WY 14.16 15.52 31.17
Notes: Share of Hispanic population less than one mile from phar-macy partners, pharmacy partners plus Dollar General, and phar-macy partners plus Dollar Tree/Family Dollar. Data from RefUSA.
33

Table 10: Vaccine Access—Alternative Partners and Distance
<1 mile <1 mile <1 mile <5 miles <5 miles <5 milesState pharmacy pharmacy plus pharmacy plus pharmacy pharmacy plus pharmacy plus
state DG state DG
AK 13.79 37.97 37.97 39.41 58.66 58.66AL 26.79 36.36 51.98 69.6 76.98 93.58AR 9.12 32.04 48.43 50.24 73.89 87.63CT 64.68 73.21 75.54 97.33 98.01 98.72GA 25.21 32.81 47.56 77.91 84.29 95.97IL 66.15 71.27 77.89 89.33 90.7 96.38KS 39.9 50.12 62.27 73.46 83.9 90.47MD 64.53 72.11 76.02 92.97 94.41 97.34ME 32.45 33.56 35.75 62.3 65.12 73.89MO 31.21 58.61 65.48 73.94 85.49 92.37MS 23.14 39.16 50.86 58.56 68.81 87.16ND 0 50.81 51.4 14.64 72.6 74.11NJ 75.75 79.4 82.08 98.71 99.12 99.73NV 75.25 78.24 80.22 91.74 92.31 93.16OH 55.62 67.24 75.3 90.22 92.29 97.29OK 30.52 43.29 62.87 72.36 78.41 92.85PA 64.49 70.31 74.69 90.59 92.86 97.76SC 27.38 32.87 47.58 76.56 79.02 94.13WA 48.27 56.07 56.18 83.96 88.75 88.85WV 22.45 23.1 37.63 68.4 70.11 87.03
Notes: Share of low-income households less than one mile/5 miles from pharmacy partners, pharmacy partners plusstate vaccine sites, and pharmacy partners plus state vaccine sites plus Dollar General.Data from RefUSA and statevaccine sites.
34