Embed Size (px)
Citation preview

TEXTO PARA DISCUSSÃO Nº 523
THE POST 1990 BRAZILIAN TRADELIBERALIZATION AND THE PERFORMANCE
OF LARGE MANUFACTURING FIRMS:PRODUCTIVITY, MARKET SHARE AND
PROFITS*
Donald A. Hay**
Rio de Janeiro, outubro de 1997
* Acknowledgements. In respect of the data used in this study, thanks are due to: theteam at IBGE with responsibility for the Pesquisa Industrial Anual , especially for givingaccess to the data for 1994; to Kepler Mauro de M. Magalhães, for rapid and efficientprogramming; to Maurício Mesquita Moreira of BNDES for making available his estimatesof dollar values of gross outputs and trade by sector since 1989; to Honório Kume forsupplying his estimates of nominal and effective protection by sector; and to Flavio BorgesBarros for excellent research assistance. In respect of the content of the research, theintellectual debts to the published works of Regis Bonelli and Honório Kume areconsiderable, and their encouragement and advice has been greatly appreciated. RobertoIglesias has contributed enormously with his detailed knowledge of data sources andBrazilian industry: without his help this research would certainly have taken much longerto complete. IPEA in Rio de Janeiro provided an excellent research environment,graciously arranged by the Director, Claudio Monteiro Considera. ANPEC provided agenerous grant to enable my stay in Brazil for a year to undertake this study.
** Bolsista da Anpec/PNPE na Direitoria de Pesquisa do IPEA.

O IPEA é uma fundação públicavinculada ao Ministério doPlanejamento e Orçamento, cujasfinalidades são: auxiliar o ministro naelaboração e no acompanhamento dapolítica econômica e prover atividadesde pesquisa econômica aplicada nasáreas fiscal, financeira, externa e dedesenvolvimento setorial.
PresidenteFernando Rezende
DiretoriaClaudio Monteiro ConsideraLuís Fernando TironiGustavo Maia GomesMariano de Matos MacedoLuiz Antonio de Souza CordeiroMurilo Lôbo
TEXTO PARA DISCUSSÃO tem o objetivo de divulgar resultadosde estudos desenvolvidos direta ou indiretamente pelo IPEA,bem como trabalhos considerados de relevância para disseminaçãopelo Instituto, para informar profissionais especializados ecolher sugestões.
ISSN 1415-4765
SERVIÇO EDITORIAL
Rio de Janeiro – RJAv. Presidente Antônio Carlos, 51 – 14º andar – CEP 20020-010Telefax: (021) 220-5533E-mail: [email protected]
Brasília – DFSBS Q. 1 Bl. J, Ed. BNDES – 10º andar – CEP 70076-900Telefax: (061) 315-5314E-mail: [email protected]
© IPEA, 1998É permitida a reprodução deste texto, desde que obrigatoriamente citada a fonte.Reproduções para fins comerciais são rigorosamente proibidas.

SUMÁRIO
ABSTRACT
1 - INTRODUCTION...................................................................................1
2 - TRADE LIBERALIZATION AND INDUSTRIAL POLICY.......................3
2.1 - Tariffs and Non-Tariff Barriers Prior to 1988......................................32.2 - The New Industrial Policy 1988..........................................................42.3 - Trade Liberalization: The Programme After 1990..............................42.4 - Studies of the Impact of Trade Liberalization ....................................6
3 - AN ILLUSTRATIVE MODEL .................................................................8
3.1 - Market Share .....................................................................................93.2 - Profits...............................................................................................103.3 - Endogenous Costs...........................................................................103.4 - The Effects of Trade Liberalization on Market Share, Profits and Efficiency.......................................................................12
4 - THE “PESQUISA INDUSTRIAL ANUAL” AND OTHER DATA SOURCES...............................................................................14
4.1 - Firm Data .........................................................................................144.2 - Measures of Protection ....................................................................154.3 - Market Size ......................................................................................16
5 - THE DETERMINANTS OF FIRM EFFICIENCY..................................16
6 - MARKET SHARE AND PROFITS.......................................................24
6.1 - Market Share ...................................................................................246.2 - Profits...............................................................................................28
7 - CONCLUSIONS..................................................................................31
BIBLIOGRAPHY ......................................................................................35

ABSTRACT
This paper analyses the effects of the 1990 Brazilian trade liberalization on thetotal factor productivity, market share and profits of a sample of 349 largemanufacturing firms. A panel data production function analysis for the period1986/94 indicates very large total factor productivity gains in the period to 1994,which were accompanied by large falls in market shares and profits. Theexplanation advanced is that the shock of trade liberalization to profits was sogreat that firms were stimulated to improve their efficiency dramatically.

THE POST 1990 BRAZILIAN TRADE LIBERALIZATION AND THE PERFORMANCE OF LARGE MANUFACTURING FIRMS:PRODUCTIVITY, MARKET SHARE AND PROFITS
1
1- INTRODUCTION
In the period since the mid 1980s Brazilian manufacturing firms certainly came toappreciate the irony of the traditional Chinese curse: “May you live in interestingtimes”. Much of the ‘interest’ stemmed from the vicissitudes of macroeconomicpolicy and performance in the period. [The key developments are summarized inTable 1: detailed discussion is available in Silva (1991), Silva and Velloso (1987),Oliveira et alii (1994) and Levy and Hahn (1996)]. There was a pronounced cyclein aggregate economic activity with a boom in the period 1984/87, followed by arecession which lasted for five years (with a slight reversal in 1989). The recessionincluded the policy induced slump of 1990, which extended into 1991/92. Arenewed period of expansion began in 1993. This cycle was even moreaccentuated in manufacturing activity. But the major preoccupation of policy wasinflation. From a fairly stable rate of 100% p.a. in the early 1980s, as measured bythe GDP deflator, inflation accelerated for most of the decade reaching a peak of2574% p.a. in 1990. Policy measures and recession reduced the rate somewhat in1991/92, but it accelerated again in 1993 and 1994, and was only finally broughtunder control by the Plano Real in 1994, falling to just under 10% by 1996. Thepolicy responses to the inflation included no less than five separate Plans between1986 and 1994, seeking to contain inflation with a mixture of price controls (orfreezes) and attempts to break indexation.
Table 1Macroeconomic performance and policy summary
YearGDP
% change
Industrialoutput
% change
GDPdeflator
% change
Stage of cycleMacroeconomic policies
1980 9.2 7.30 Recovery Growth with external debt1981 -4.3 -10.38 101 Recession Oil price plus high international
interest rates: measures torestrict domestic demand.
1982 0.8 -0.18 101 Recession Same continued1983 -2.9 -5.84 131 Recession IMF stabilization programme:
maxidevaluation1984 5.4 6.17 202 Recovery Growth -exportled1985 7.9 8.34 249 Recovery Growth -consumer led1986 7.5 11.30 149 Recovery Plano Cruzado1987 3.5 0.95 206 Recovery Plano Bresser1988 -0.1 -3.41 628 Recession1989 3.2 2.88 1304 ? Plano Verão1990 -4.4 -9.46 2574 Recession Collor emergency measures:
fear of hyperinflation1991 0.3 -2.36 423 Recession Plano Collor II1992 -0.8 -4.08 995 Recession Impeachment1993 4.2 8.08 2072 Recovery Why recovery?1994 5.7 7.74 2295 Recovery Plano Real
Source: A Economia Brasileira em Perspectiva 1996, Rio de Janeiro, IPEA, 1996: Parte 5 Estatísticas eIndicadores Econômicos: Séries Anuais: Tabelas 5 e 7, and studies citied in the Introduction.

THE POST 1990 BRAZILIAN TRADE LIBERALIZATION AND THE PERFORMANCE OF LARGE MANUFACTURING FIRMS:PRODUCTIVITY, MARKET SHARE AND PROFITS
2
As if macroeconomic instability was not sufficient to complicate the operations offirms and the lives of their managers, the period also witnessed a completetransformation in trade and industrial policies. Prior to 1990, the Brazilianeconomy was highly protected by a variety of tariff and non-tariff barriers to trade,and industrial policy was interventionist, with a variety of incentives, creditsubsidies and price controls. Some minor cracks began to appear in this edifice in1988, but after 1990 the whole structure was more or less demolished. Since theeffects of this policy change on the performance of large manufacturing firms isthe primary focus of the analysis in this paper, a more detailed discussion will bepresented in Section 2.
Anticipating the results of the analysis which follows, we may identify the maineffects of trade liberalization as a reduction of market shares in the domesticmarket, a sharp fall in profits, and a marked increase in the efficiency of largeBrazilian manufacturing firms. In other words, the shock of import competition(actual or potential) stimulated the firms to improve their efficiency. How theseelements link together is the subject of Section 3, in which we present anillustrative model based on the Cournot oligopoly model.
This theoretical discussion provides the framework for the empirical work whichfollows in Sections 5 and 6. In Section 5 we analyse the degree to which changesin sales productivity (that is, sales per worker) can be explained by changes in thelevel of protection across different sectors after 1990. This analysis also has tocontrol for the effects of the macroeconomic cycle on productivity. In Section 6we relate the market shares and profits of the firms to their efficiency, and to thedegree of protection of their markets. These analyses are based on the data of thePesquisa Industrial Anual (PIA), which is described in Section 4. This paneldata set comprises detailed accounting and cost information for 650 leadingindustrial firms in each year 1986/94, except for 1991.
The conclusion of the study is that trade liberalization had a profound effect onthese Brazilian firms. There is, of course, a large literature on the effects of tradeliberalization [see for example, Papageorgiou, Michaely and Choksi (1992)]; butfor comparative purposes, studies with similar panel data in other Latin Americaneconomies are of most interest [for examples: Tybout and Westbrook (1995) forMexico, Roberts and Tybout (1991) for Colombia and Bolivia, Tybout, Melo andCorbo (1991) for Chile, and Barrera (1995) for Colombia]. Although there aredifferences in both methodology and data used in these studies — for example, theauthors use panels relating to plants rather than firms, and in some cases are ableto track the process of exit and entry of plants — the impacts of tradeliberalization appear to be greater in the Brazilian case, as least in respect ofimpacts on the larger manufacturing firms that make up the PIA sample.
THE POST 1990 BRAZILIAN TRADE LIBERALIZATION AND THE PERFORMANCE OF LARGE MANUFACTURING FIRMS:PRODUCTIVITY, MARKET SHARE AND PROFITS
3
2 - TRADE LIBERALIZATION AND INDUSTRIAL POLICY
2.1 - Tariffs and Non-Tariff Barriers Prior to 1988
The pattern of protection in Brazilian manufacturing prior to 1988 has beencarefully analysed by Kume (1989). The set of protectionist measures hadaccumulated over the years, with the result that there were many measures whichwere simply redundant. The structure of tariffs had remained virtually unchangedsince the introduction of ad valorem tariffs in 1957. By 1988 there weregeneralized redundant tariffs in all sectors except for Pharmaceuticals, Clothing,Footwear and Other Manufacturing. That is, the tariff exceeded the differencebetween the world price and the domestic price, which is the implicit tariff. Forthe whole of Industry of Transformation the actual tariff was 56% while theimplicit tariff was only 16%. Moreover there were additional taxes on imports:IOF (on foreign exchange transactions), TMP (a hypothecated tax for investmentin port facilities), and AFRMM (a tax to provide subsidies for the domesticmerchant fleet). According to Kume these together added on average 28% to thecost of imports, and taken together with tariffs implied redundancy in every sectorof manufacturing.
However in practice the tariff structure was completely irrelevant. The samereforms in 1957 which had established the ad valorem tariffs had also created theComissão de Política Aduaneira (CPA), given discretionary powers to theCarteira de Comércio Exterior do Banco do Brasil (Cacex) to control the levelof imports (and the conditions under which goods might be imported), and hadactivated the Lei do Similar Nacional. This last introduced, as a criterion forjudging whether a particular import should be permitted, the question of whether asimilar product was already produced in Brazil. In the 1980s, these entitiesoperated a variety of non-tariff barriers. First, there was a list of 1300 productsthat in practice were not permitted to be imported — the so-called Anexo C.Second, all firms had to submit in advance annual plans for their imports. A thirdimplicit non-tariff barrier affected imports of capital goods: access to fiscalsubsidies and subsidized credit was made dependent on the domestic content of aninvestment project. Finally, by 1988 there were 42 Special Regimes whichaccounted for 70% of all imports, excluding oil. Within these Regimes the tariffswere either zero or greatly reduced, but were subject to the Lei do SimilarNacional. Under the law a product could only be imported with exemption orreduction in import taxes if it could be shown that a similar product was notavailable domestically. Given the high tariffs prior to 1990, the law effectivelyapplied to the great majority of imports. In the case of machinery and equipment,the association of domestic producers of machinery was consulted to determinethe existence of a similar product, which only served to strengthen theprotectionist nature of the measure. The products included in the Regimes eitherarose from international agreements, or were essential supplies to the domesticmarket, or were selected to give incentives to firms which planned to export asubstantial fraction of their output.
THE POST 1990 BRAZILIAN TRADE LIBERALIZATION AND THE PERFORMANCE OF LARGE MANUFACTURING FIRMS:PRODUCTIVITY, MARKET SHARE AND PROFITS
4
Pinheiro and Almeida (1994) analysed the sectoral distribution of nominal tariffs,effective protection and non-tariff barriers (as measured by the proportion ofgoods in a sector affected). They found that all three had the same relativestructure in 1980 and in 1988: consumer goods, especially durables, had thehighest levels of protection, with capital goods and intermediate goods lessprotected. In particular, they found that prior to 1988 high protection wasgenerally associated with: low capital/output ratios and low productivity, lowwages, low scale economies and low concentration. It was also associated with adominance of Brazilian firms in a sector.
2.2 - The New Industrial Policy 1988
The policies introduced in 1988 by the Sarney administration had limitedobjectives. One was the removal of redundancy in the tariff structure: new tariffswere established approximately at the differential between internal and externalprices.1 Two of the import taxes (IOF and TPM) were suppressed. However Kume(1989) shows that tariffs plus taxes continued to provide redundant protection invirtually all sectors. Implicit tariffs were respectively 21%, 21% and 3% in capital,intermediate and consumer goods sectors: the actual tariffs including taxes were50%, 31% and 50%. Exceptions to the general rule of redundancy were theFurniture, Rubber, Pharmaceuticals, Clothing and Footwear sectors: but non-tariffbarriers covered at least 80% of the products in all these sectors exceptPharmaceuticals. Some Special Regimes were also abolished, but Kume showsthat these covered only 15% of total imports (excluding crude oil). He concludesthat the reforms were nothing like as radical as originally envisaged, mainly due tostrong opposition from producer interest groups. However Pinheiro and Almeida(1994) identify some significant changes in the sectoral pattern of protection in1989 (as well as definite reductions in non-tariff barriers). There was relativelymore protection for high technology sectors, and decline in protection for the lowproductivity, low scale sectors that had previously enjoyed high protection.
2.3 - Trade Liberalization: The Programme After 1990
By contrast with the tidying up of tariffs in 1988/89, the programme of reformsintroduced by the Collor administration in 1990 constituted a major break with theprotectionism of the past, and a decision to pursue abertura comercial (tradeliberalization) as a long term strategy for Brazilian development. The reformscovered three areas. First, Anexo C, the list of 1300 products with importsprohibited, was abolished. Second, virtually all the Special Regimes wereabolished: the exceptions were drawback, the Zona Franca of Manaus, and theinformation technology sector. Third, a tariff reform programme was announced,with some immediate adjustments, and a four year programme of reductions to
1 This was by no means a straightforward exercise. For a description of some of the difficulties [seeTyler (1980) or Braga, Santiago and Ferro (1980)]. The estimates of the Comissão de PolíticaAduaneira in 1987 were never formally released.

THE POST 1990 BRAZILIAN TRADE LIBERALIZATION AND THE PERFORMANCE OF LARGE MANUFACTURING FIRMS:PRODUCTIVITY, MARKET SHARE AND PROFITS
5
bring all tariffs into the range 0%-40% by 1994 with a modal value of 20% (seeTable 2).
Table 2The tariff reform programme announced in June 1990: tariffs to
be introduced by 1994
Tariff Products
0% Orange juice, iron ore, cellulose, cement.5% Maize flour, rice.10% or 15% Products which utilize basic inputs with zero tariffs e.g. cellulose
0%, paper 10%, paper products 15%, cotton 0%, yarn 10%,clothes 15%. Most intermediate products.
20% Most manufactured products.30% Fine chemicals, wheat and derivatives, consumer electronics
(TV, sound, video).35% Cars, lorries, motorcycles.40% Information tecnology.
Horta, Piani and Kume (1991) show that the immediate adjustments in tariffsreflected a variety of objectives:
a) products previously in Anexo C. Despite the fact that tariffs were already at alevel sufficient to protect the domestic market, tariffs on electroelectronics andvehicles were raised to 85%, and on toys to 105% (in May 1990). The idea wasthat ‘repressed demand’ existed, and the additional tariffs provided additional‘security’.
b) textile products. At the end of June 1990, partial reductions in tariffs werebrought in immediately to counter a rapid rise in the price of clothing. Thisanticipated plans for restructuring the sector drawn up by the Programa SetorialIntegrado (PSI) as part of the industrial policy of the previous Administration.The difference was that no resources were forthcoming for the complementarymeasures aimed at restructuring.
c) in August 1990, there was a reduction in tariffs for agriculture machineryimports, as part of a series of measures for the agricultural sector.
d) tariffs for machinery and equipment not manufactured in Brazil were reducedimmediately to zero.
e) tariff reductions as a method of price control were also tried in some producersectors in 1990 — cement, aluminium, stainless steel, chemicals andpetrochemicals — on the suspicion that the monopolistic/oligopolistic structures

THE POST 1990 BRAZILIAN TRADE LIBERALIZATION AND THE PERFORMANCE OF LARGE MANUFACTURING FIRMS:PRODUCTIVITY, MARKET SHARE AND PROFITS
6
of these sectors were particularly conducive to price increases in an inflationaryperiod.
While these tariff changes were significant in themselves, Horta, Piani and Kume(1991) are probably correct to see their main impact as signalling in anunmistakable way that the long years of protectionism were coming to an end. Thefour year programme of tariff reductions was going to become a reality.
In fact the tariff reduction programme was completed in three years, with the foursteps being taken in February 91, January 92, October 92 and July 93. The twoinitial steps emphasized reductions in tariffs on capital and intermediate goods,with the main reductions in consumer goods coming later. By internationalstandards the tariff reductions were neither radical nor rapid, but together with theremoval of the apparatus of non-tariff barriers, they were sufficient to signal acomplete change of direction, and to shock the manufacturing sector into takingdefensive action. This was exactly what the proponents of the liberalization hadhoped would happen.
For completeness we should note two subsequent developments. The first was theadditional liberalizing measures associated with the Plano Real in the second halfof 1994. Reductions in tariffs and import taxes were used selectively to disciplinesectors which were thought to be increasing prices without justification. Moregenerally, in September 1994 the government anticipated the Mercosul externaltariff programmed for the beginning of the next year. The second developmentcame in 1995, with a resurgence of protectionist lobbies. In response thegovernment made use of the Mercosul list of exceptions to raise tariffs (in somecases to 70%) on cars, consumer electronics, consumer electricals, and ten textileproducts. There was even a reincidence of non-tariff barriers with a licensingarrangement for imports of toys.
2.4 - Studies of the Impact of Trade Liberalization
There has only been one detailed study of the impact of trade liberalization at theindustry level, that of Moreira and Correa (1996). Before turning to that, it isworth noting the annual studies by the Confederação Nacional da Indústria(CNI) based on a questionnaire survey addressed to industrial managers. In eachyear, starting in 1991, the respondents were asked to evaluate the effects of thetrade liberalization on their firm, and to indicate how they were planning to meetthe expected increases in import competition. These responses were then analysedin aggregate, and distinguishing between different sectors. The sequence of thestudies is interesting in that it tracks the increasing awareness of the effects oftrade liberalization, and therefore of the need to act effectively to confront theincreased competition. Initially, most concerns about increased competition camefrom the intermediate and capital goods sectors, which were the first to experiencesignificant tariff reductions, and regarded the rate of trade liberalization as rapid.By 1994 the consumer goods sectors were also beginning to feel the effects of
THE POST 1990 BRAZILIAN TRADE LIBERALIZATION AND THE PERFORMANCE OF LARGE MANUFACTURING FIRMS:PRODUCTIVITY, MARKET SHARE AND PROFITS
7
liberalization, but these were not judged to be strong until 1995. And despite theincreased competition, 90% of the respondents in 1994 still regarded tradeliberalization favourably — though the percentages were much lower in textiles,and somewhat lower in mechanical engineering and chemicals. In 1995 manymore respondents were concerned about the exchange rate than about the tariffreductions.
Responses to questions about reactions to trade liberalization suggest that theprimary instinct of Brazilian industry was to meet competition by increasingproductivity of existing plants, by improving product quality and by investment innew technologies. The weak competitive position of the capital goods sector wassignalled as early as 1992 with some firms in the relevant sectors reporting thatthey were abandoning investment plans. By 1994 they were also reporting plantclosures. By 1995 the phenomenon of abandonment of investment by some firmshad spread to other sectors. Even so, the vast majority of respondents remainedconfident of their ability to compete successfully, and reported that they hadalready achieved major gains in productivity and improvements in quality as aresult of measures they had taken.
Moreira and Correa (1996) analysed the impact of trade liberalization at thesectoral level.2 The study made estimates of the gross output of industrialproduction measured in dollars in 45 sectors in the period 1989/95, and of sectoralinternational trade flows. These estimates were then used to calculate indices ofimport penetration and of the share of exports in production. These showed ageneralized increase in import penetration in all sectors to levels last observed in1968/73, and in particular in machine tools, electronics, textiles (natural andartificial fibres), cars and lorries, tractors, and heavy electrical equipment. On theexport side, there was a general increase in the share of exports in all sectors withparticular emphasis in wood products, non ferrous metals, cellulose, orange juice,shoes, and iron and steel.
In a further analysis of the data, Moreira and Correa attempted to attribute thegrowth (or decline) in output in each sector to three elements — changes indomestic demand, changes in exports, and changes in imports. Gaining sectorswere drinks, cellulose and pharmaceuticals, with all three elements favourable togrowth. Major losses were registered by electronics/telecommunicationsequipment, synthetic fibres, iron and steel, and some textiles — though therelative weights of the three elements were different in each case. Broadlyspeaking, capital goods sectors lost out to imports, and intermediate goods sectorsdue to lower domestic demand. A key finding was that gains and losses in theperiod owed as much to the domestic economy as to the impact of tradeliberalization. The authors then looked for explanations of the revealedcomparative advantage (sectoral gains and losses) emerging after trade
2 The IBGE classification of industries used in the study — Nível Cem — is one developed for usein constructing input-output tables: it lies between the 2 — and 3 — digit classifications of theStandard Industrial Classification.

THE POST 1990 BRAZILIAN TRADE LIBERALIZATION AND THE PERFORMANCE OF LARGE MANUFACTURING FIRMS:PRODUCTIVITY, MARKET SHARE AND PROFITS
8
liberalization, in terms of standard theories of international specialization. Firstthey analysed factor intensity, finding that technology and resource intensivesectors lost out (but mainly due to domestic demand and exports rather thanimport competition). There were however no apparent relationships betweenrevealed comparative advantage and other indicators such as economies of scaleor R&D intensity.
One other study of the impact of trade liberalization by Fonseca (1996) is worthyof note here. In a careful econometric study of product quality in the Brazilian carindustry, he showed that a positive effect of increasing openness to trade was amarked improvement in the quality of cars produced and supplied to the Braziliandomestic market.
3 - AN ILLUSTRATIVE MODEL
In this section we explore the effect of trade liberalization on firms in imperfectlycompetitive industries to provide an analytic framework for the subsequentempirical work. The analysis is intended only to be illustrative,so we will use thesimplest model of oligopolistic competition, which is the Cournot model of anindustry producing a homogeneous good. Our assumption is that imports anddomestic production are perfect substitutes. Costs are assumed to vary betweenfirms, and are partly endogenous, determined by the efforts of the managers.
The inverse market demand curve is given by p = f(Q), where p is the marketprice, and Q is the total quantity put onto the market by all the firms that arepresent in the market at a given time (that is Q = Σi qi where qi are the outputs ofeach of the firms i = 1, 2, 3,...). Each firm has constant marginal costs, ci, andfixed costs, Fi. The profit of each firm is given by:
πi = (f(Q) − ci) qi − Fi (3.1)
The f.o.c. condition can be written as:
( )p c
p
s
Ei i
i
−= +1 λ (3.2)
which is the expression for the price cost margin. E is the elasticity of demand, si
is the market share of firm i. λi is the conjectural variation parameter, which is aconvenient means of indicating the degree of competition in the market. The
parameter can take on a range of values: λi = 1−s
si
i for full collusion, λi = 0 for Nash
Cournot competition, and λi < 0 for competitive behaviour. Summing 3.2 acrossall firms j yields:

THE POST 1990 BRAZILIAN TRADE LIBERALIZATION AND THE PERFORMANCE OF LARGE MANUFACTURING FIRMS:PRODUCTIVITY, MARKET SHARE AND PROFITS
9
pc
sj j
nE
=
−+ ∑
11 λ (3.3)
where cn
cj=∑
, the simple average of the costs of all the firms.
3.1 - Market Share
Substituting 3.3 in 3.2 gives an expression for the market share si of each firm:
sE E s
nE
c
cii i
j j i=+
−+
−+
∑1 1
11
λ λλ
(3.4)
Note that 11
−+ ∑ λ j s j
nE determines the mark up of price over the average costs of
firms: so it can be interpreted as an index of competition in the market.
However it is apparent that 3.4 is actually a system of j simultaneous equations,which can in principle be solved [see Hay and Liu (1997)] to give:
( )( ) ( ) ( )s
E c nE
cncc n
Ec
cnEi
i
i
i
i
ij
nj
j
j=+
−−
++
− + +− −
=∑1
1
11
11
1 11
1λ λ µ λ
λλ
(3.5)
where
( )µλ
λ≡
+=∑j
nj j
j
c
nc1 1
If all the λs are the same, this expression simplifies to:
sE E
nE
c
cii=
+−
+−
+
1 1
11
λ λλ
(3.6)
and for λ = 0
si
E EnE
c
ci= − −
11
(3.7)
For the collusive case, λ =−1 s
sj
j
, the expression for si is not defined, presumably
because in collusion all output should be produced by the most efficient firm.

THE POST 1990 BRAZILIAN TRADE LIBERALIZATION AND THE PERFORMANCE OF LARGE MANUFACTURING FIRMS:PRODUCTIVITY, MARKET SHARE AND PROFITS
10
The conclusion is that the market share is determined by the cost of the firmrelative to the average costs of all suppliers in the market. More efficient firmsnaturally have larger market share.
3.2 - Profits
Gross profits, ignoring Fi, are:
πi = (pi − ci) qi
which, if the λs are the same for all firms, is given by:
πλ λ
λi
iE c
nEnE
c
cQ=
+ −+ − −
+
1 1
11 1
12
(3.8)
Recalling that the expression for price is:
pc
nE
=−
+1
1 λ
and substituting gives:
πλ λi i
dQ
dp
c
nE
c= −+ −
+ −
1
11
1
2
(3.9)
Evidently πi is diminishing in ci: lower cost (more efficient) firms generate higherprofits.
3.3 - Endogenous Costs
Next we consider the case where costs are endogenous. Let the costs of each firmbe ci + c (ei) where ci depends on the physical and R&D capital stock of the firm,and c (ei) depends on the effort ei of the manager. We will assume3 thatc (ei) = − ei. Let the managerial utility function be β (πi) − ei
2 i.e. positive linear inthe share of profits and negative quadratic in effort. Writing it out in full gives:
β (p(Q) − ci − c (ei)) qi − ei2 (3.10)
3 Note that the linear assumption is not necessarily a good one in this model: one would expectdiminishing returns to effort. But the linear assumption greatly simplifies the mathematics of theillustrative model.
THE POST 1990 BRAZILIAN TRADE LIBERALIZATION AND THE PERFORMANCE OF LARGE MANUFACTURING FIRMS:PRODUCTIVITY, MARKET SHARE AND PROFITS
11
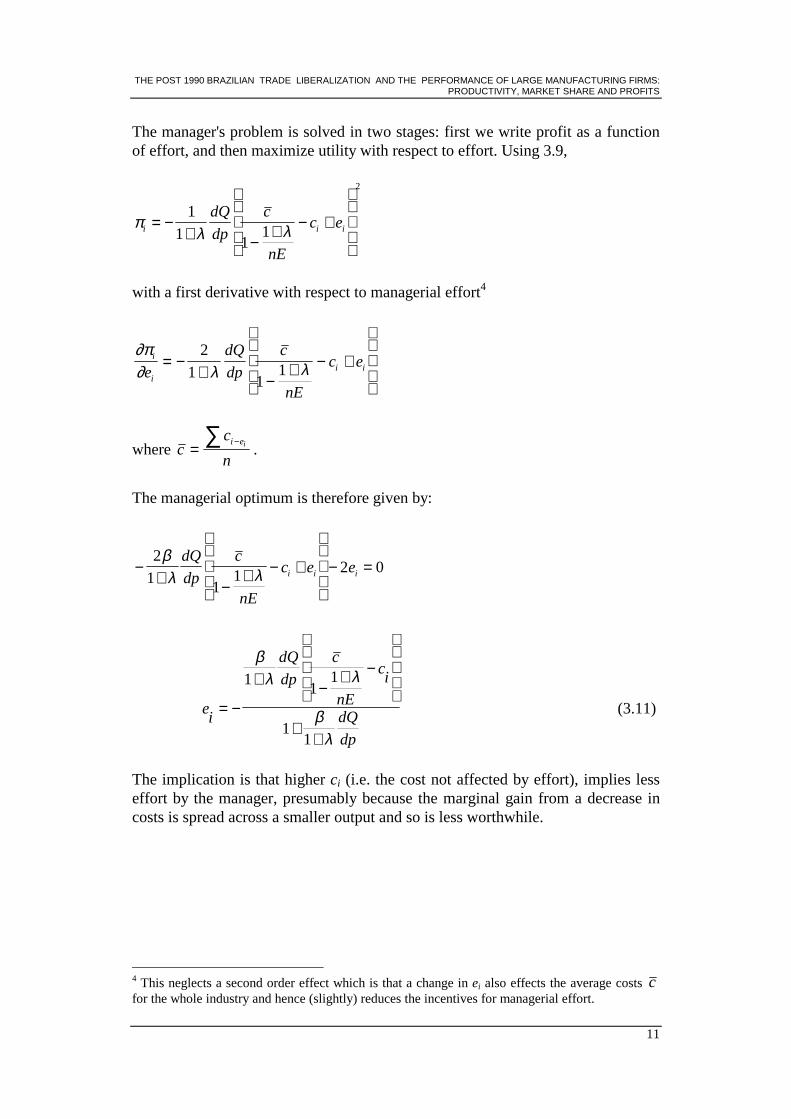
The manager's problem is solved in two stages: first we write profit as a functionof effort, and then maximize utility with respect to effort. Using 3.9,
πλ λi i i
dQ
dp
c
nE
c e= −+ −
+ − +
1
1 11
2
with a first derivative with respect to managerial effort4
∂π∂ λ λ
i
ii ie
dQ
dp
c
nE
c e= −+ −
+ − +
2
11
1
where cc
ni ei= −∑
.
The managerial optimum is therefore given by:
−+ −
+ − +
− =2
11
1 2 0βλ λ
dQ
dp
c
nE
c e ei i i
ei
dQ
dp
c
nE
ci
dQ
dp
= −
+ −+ −
++
βλ λ
βλ
11
1
11
(3.11)
The implication is that higher ci (i.e. the cost not affected by effort), implies lesseffort by the manager, presumably because the marginal gain from a decrease incosts is spread across a smaller output and so is less worthwhile.
4 This neglects a second order effect which is that a change in ei also effects the average costs cfor the whole industry and hence (slightly) reduces the incentives for managerial effort.

THE POST 1990 BRAZILIAN TRADE LIBERALIZATION AND THE PERFORMANCE OF LARGE MANUFACTURING FIRMS:PRODUCTIVITY, MARKET SHARE AND PROFITS
12
3.4 - The Effects of Trade Liberalization on Market Share, Profits and Efficiency
In principle, trade liberalization can have three separate effects on competition inthe market:
a) particularly in the case of removal of non tariff barriers, an effect is that importsuppliers can now compete in the domestic market. Even if the new suppliers areno more efficient on average than the domestic firms, they will be able to enterand establish a market share. In terms of the model, the number of competitors, n,increases;
b) alternatively we may assume no change in the number of firms, but thatchanges in tariffs and exchange rates have an impact on the costs of foreign firmssupplying the domestic market. Suppose there are j domestic firms and k foreignsuppliers, so average costs of total supply are:
cc c
j kj k=++∑∑
(3.12)
( )= + −σ σc cj k1 (3.13)
where σ =+j
j k.
Note that:
( )c ERck k= +1 τ * (3.14)
where ck* is the average costs of foreign suppliers in foreign currency, ER is the
exchange rate, and τ is the tariff. Evidently, the effect of a tariff reduction is toreduce c ; and
c) a third possible effect of trade liberalization is that implicit (or explicit)collusion may be broken. In particular, import suppliers may no longer be willingto accept price leadership from domestic firms, given that their ability to supplythe market is no longer constrained. This effect is modelled by a change in thevalue of λ.
In a companion paper to this one [Hay (1997)], we analyse the effects of marginalchanges in n, τ and λ on market share, profits and efficiency. The analysiscontains few surprises, at least in terms of market shares and profits. Marginalincreases in n, reductions in τ, and decreases in λ all reduce profits as intuitionwould suggest. The same holds for market share, with the exception of the effects

THE POST 1990 BRAZILIAN TRADE LIBERALIZATION AND THE PERFORMANCE OF LARGE MANUFACTURING FIRMS:PRODUCTIVITY, MARKET SHARE AND PROFITS
13
of decreases in λ. Ceteris paribus, a decrease in collusion increases the marketshare of the more efficient firms, and decreases that of the less efficient.
But the effect of these marginal changes is generally to reduce managerial effortand hence efficiency. This rather counterintuitive result has a straightforwardexplanation: if the marginal utility of profit to the manager is a constant (β), thenanything that reduces the profitability of the firm will also reduce the incentives toreduce costs. Suppose however that the effect of import competition on the profitsof incumbent firms is not marginal: that is there is a discrete change in the state ofcompetition in the market such that the incumbents lose out substantially in termsof market share and profits. Then it is no longer the case that the marginal utilityof profit will remain unaltered: instead one might expect it to increasesubstantially (as measured for example by the slope of the profits-utilityrelationship). In what follows, we explore this possibility informally, as a fullanalysis proves intractable. The general expression for profits (compare 3.8) is:
πλ λi i i
dQ
dp
c
nE
c e= −+ − + − +
1
1 11
2
Using p = c
nE1
1−
+ λ , and setting −+
=1
1 λ∂∂Q
pk (linear demand), gives:
πi = k (p − ci + ei)2
Proceeding as before, we derive:
( )( )e
ik p c
k pi=
−− −β
β
'
'1 1 (3.15)
where β’ is the marginal utility of profit to the firm.
Total differentiation yields:
( )( )( )
( )( )∆ ∆ ∆ek k c
k pp
k p c
k pi
i ii=
+ +
− −+
−
− −
β β
β ββ
' '
' '
'( ( ))1 1
1 1 1 12 2
Focussing first on the term in ∆p, we note that the coefficient is positive andincreasing in both β’ and ci. The interpretation is that if prices fall, all firms reducetheir effort, but high cost, high β’ firms reduce it the most. But that is offset by anincrease in effort, if ∆βi
' > 0; and the increase is greater the more efficient the firm
is initially, and the lower is the initial β’ . In the empirical analysis which follows

THE POST 1990 BRAZILIAN TRADE LIBERALIZATION AND THE PERFORMANCE OF LARGE MANUFACTURING FIRMS:PRODUCTIVITY, MARKET SHARE AND PROFITS
14
we assume that the shocks of trade liberalization and recession in Brazil in theearly 90s were such that the effects were quite definitely non-marginal, and hence∆β’ was positive and sufficiently large to offset the reduced incentive for effortfrom lower marginal profits.
4 - THE “PESQUISA INDUSTRIAL ANUAL” AND OTHER DATA SOURCES
4.1 - Firm Data
The basic source of information for the study is the excellent Pesquisa IndustrialAnual (PIA) of leading industrial firms in the Brazilian economy. The purposeand methodology of the survey are described in detail in a series of publications[IBGE (1994, 1995a, 1995b, 1996)]. The original data set includes nearly 500firms with information in every year of the survey. Firms were dropped from theanalysis for a number of reasons: a) in sectors5 which lacked complementary dataseries e.g. price indices (publishing and printing), measures of effective protection(soaps and perfume); b) in sectors with special non-market arrangements (e.g. oilrefining, alcohol); c) in some sectors involved in primary processing of rawmaterials e.g. wood products, cellulose, leather; and d) apparent data ‘errors’ inone or more years for a particular firm e.g. due to mergers, or changes inaccounting practices. The final sample for the analysis in the paper comprised 349firms, from which we drew two overlapping pooled samples. The first subsampleof 275 firms was all the firms in seven industry groups. The second samplecomprised 293 firms in 21 sectors. All the industry groups, and some of thesectors, contained sufficient observations to permit individual analysis.
The PIA contains a wealth of information about the firms. It combines accountingbalance sheet data with data on employment, sales and costs. For the purposes ofthe analysis in this paper we used only three variables: net sales, capital stock, andemployees involved in production.
a) net sales. Net sales, deflated by the average of the sectoral wholesale priceindex (FGV-IPA) for each year, was our measure of output. Obviously we wouldhave preferred to use an estimate of value added, but there are two problems withthe data. The first is that the inquiry includes a catch-all category: ‘Other costs andoutgoings (including purchases of raw materials)’, in which ‘costs’ and‘outgoings’ are distinguished. Unfortunately, this item under the heading‘outgoings’ is often extremely large, and deducting it sometimes gave a negativevalue added. The second problem is the valuation of changes in stocks of rawmaterials and work in progress, which is given simply as the change in value overthe year, which is not very informative in a period of high inflation. Evidently a
5 The Brazilian industrial classification of sectors is Nível Cem, designed specifically to facilitatethe construction of an input-output matrix. It corresponds (roughly) to the 3-digit ISIC. Industrygroups (Gêneros) are the next level of aggregation, corresponding to 2-digit ISIC.

THE POST 1990 BRAZILIAN TRADE LIBERALIZATION AND THE PERFORMANCE OF LARGE MANUFACTURING FIRMS:PRODUCTIVITY, MARKET SHARE AND PROFITS
15
proper measure of value added should be adjusted for these changes in real terms,which is not possible with the data as they are;
b) capital stock. Our measure of capital stock is drawn from the balance sheet.Fortunately, for these leading firms, stringent inflation accounting rules wereapplied over the period. The rules provided for indexation of values during theyear, including acquisition of new capital assets, disposals of assets, anddepreciation, so as to give an inflation adjusted value as of 31 December in eachyear. In principle then, these reported values, deflated by the same index as wasused in their construction, should give an indicator of the real assets of the firm;6
c) labour. The only measure of labour input available for firms in the PIA is theend-of-year workforce.7 There are no data on variations in the labour force overthe year, of quality e.g. educational level.
4.2 - Measures of Protection
Indices of nominal and effective protection at sector level were made available byHonório Kume. As explained in Section 2 above, before 1988 non-tariff barriersimplied that most tariffs were redundant, that is the tariffs exceeded thedifferential between internal and external prices. The 1988 tariff reform sought toremove this redundancy. On this basis, the 1989 nominal tariffs may be used as anapproximate index of the degree of protection in different sectors during thesecond half of the 1980s. From 1990, tariffs had a renewed economic significanceand, as already noted, they were progressively reduced under a plannedprogramme. For this period then, an appropriate measure of protection is given byKume's indices of effective protection, calculated on the basis of the 1985 input-output table. The changes in tariffs did not conform precisely to calendar years. Sowe have chosen the effective tariff measures that were in place for the greater partof a particular year:
1990 - September 89 to September 901991 - February 91 to January 921992 - January 92 to October 921993 - October 92 to July 93, and July 93 to December 94 (average of the two)1994 - July 93 to December 94.
6 However, two caveats are in order here. First, these values suggested that the average growth ofthe real capital stock in 1992/93 was very low, which does not accord with information onaggregate investment in manufacturing in this period. Second, the shock of trade liberalization after1990 certainly reduced the effective stock of capital, as productive units were partially orcompletely closed down. It is not clear how such partial or complete scrapping was accounted forby the firms. But it is quite likely that the post 1990 asset values exagerate the stock of capitalavailable to the firm.7 Note that this is only a problem for that part of the PIA which deals with firms. The PIA data forestablishments include monthly totals.
THE POST 1990 BRAZILIAN TRADE LIBERALIZATION AND THE PERFORMANCE OF LARGE MANUFACTURING FIRMS:PRODUCTIVITY, MARKET SHARE AND PROFITS
16
4.3 - Market Size
Estimates of gross output and trade flows in current dollar values, 1989/95, forsectors have been made by Moreira and Correa (1996). While the trade flows arebased directly on primary data, the measures of gross output have to be indirectestimates, in the absence of any industrial census after 1985. The basis of theirestimates was the data from the PIA for 1989, 1990 and 1992, extrapolated forother years by indices of physical output produced by IBGE [the PesquisaIndustrial Mensal - Produção Física (PIM-PF)]. Our measure of the market ineach sector is given by gross output plus imports. It would have been helpful toexclude exports, but the PIA data do not distinguish domestic and export sales byeach firm.
5 - THE DETERMINANTS OF FIRM EFFICIENCY
The illustrative model of Section 3 has shown that if the adverse shocksexperienced by a firm due to trade liberalization or a sudden recession are largeenough, it may make an effort to increase its efficiency. In this section we explorethe impacts of trade liberalization and recessionary shocks on the efficiency of thefirms in our data set in the period 1986/94. Although the theoretical model isdeveloped in terms of costs, it is more convenient empirically to work in terms ofproductive efficiency, following Nickell (1996). Evidently more efficient firmswill have lower costs.
The analysis contributes to a wider debate about productivity growth in Brazil[Bonelli (1996), Salm, Saboia and Carvalho (1996)].The key fact to be explainedis that labour productivity in the Brazilian manufacturing sector, which hadscarcely changed in the period 1985/90, suddenly began to grow at a rate of 7.35%p.a. in the period 1991/95 (see Figure 1). This period of productivity growthincluded two different phases. In the first, up to 1992, there was a deep recessionwith output falling, but employment falling even faster. In the second phase, after1992, productivity and output grew: but the former grew faster so employmentcontinued to fall, though at a lesser rate than in 1990/92. A further characteristicof labour productivity growth in the period 1985/95, which is emphasized byBonelli (1996), is that exactly the same pattern is present in different industrialsectors. He calculated productivity8 in seven sectors (metals, mechanicalengineering, electrical, transport equipment, chemicals, textiles and food), whichin 1985 produced jointly 70% of the value added in the industrial sector. Withsome variation, all seven sectors demonstrate the same behaviour. Using1985 =100 as the base, productivity in 1990 was a virtually the same level as in1985; but by 1995 it had grown to anything between 120 (transport equipment,textiles) and 180 (electrical), with a weighted average of 145.
8 Sectoral real output indices divided by an index of paid hours worked.

THE POST 1990 BRAZILIAN TRADE LIBERALIZATION AND THE PERFORMANCE OF LARGE MANUFACTURING FIRMS:PRODUCTIVITY, MARKET SHARE AND PROFITS
17
The debate between rival explanations of this phenomenon has been ablysummarized by Bonelli (1996):
a) an early study by Silva et alii (1993) looked at productivity change in 1990/92,and concluded that it could best be explained by the deep recession (picking up aparallel with the early 1980s). They further noted that there was no clear evidenceof change in firm behaviour with respect to efficiency — either investment in newtechnologies, or change in management techniques. Bonelli noted that thisconclusion was overtaken by events, since productivity continued to grow aftergrowth in output was resumed in 1992/95. However, that does not allow for thepossibility that the ‘shock’ of recession continued to have an effect on managerialbehaviour long after the recession had ended [see, for example, the discussion inNickell, Wadhwani and Wall (1992)].
b) Feijó and Carvalho (1994) argue that productivity growth in this period wasdue to technical progress and a managerial revolution, stimulated by the aberturacomercial and the general liberalization of the economy. In respect of technicalprogress, they point to a rapid growth in imports of capital goods, presumablyincorporating the best technologies, in the period after 1990. In respect ofmanagerial techniques, a subsequent study by Salm, Saboia and Carvalho (1996)did show strong rank correlations between productivity growth in 12 industrialsectors, and the degree of adoption of various managerial techniques as revealedin a survey of firms. Indeed, the authors argue that these results can explain howproductivity gains were achieved without an appreciable increase in the level ofinvestment.
c) Considera (1995) argued that substantial gains in productivity had come fromthe closing down of inefficient producers in the face of competitive pressures fromimports and from new foreign-owned producers in the Brazilian domestic market.He also suggested that ‘tercerization’ — the contracting out of industrial and otherservices — might have had substantial effects, though this would be difficult tomeasure accurately.
d) Amadeo and Gonzaga (1996), while giving due weight to managerialimprovements and tercerization, also suggested a role for imported inputs. If firmssubstitute imported inputs for components they previously supplied themselves,the relationship between value of output and value added changes. For example,more sectoral output could in fact represent less value added. The evidence forsubstitution of domestic production by imported parts is strong in some sectors(electronics, automobiles): but in the absence of industrial census information thechanges in the ratio of value added to value of output cannot be observed.
Our analysis is not able to address all these issues. The data do not permitexploration of the hypothesis of productivity gains via the closing down ofinefficient producers, as the PIA includes only leading firms. Nor can we examinethe hypothesis of tercerization/imported inputs as the only reliable indicator of

THE POST 1990 BRAZILIAN TRADE LIBERALIZATION AND THE PERFORMANCE OF LARGE MANUFACTURING FIRMS:PRODUCTIVITY, MARKET SHARE AND PROFITS
18
output is sales rather than value added. But we should be able to establish therelative importance of trade liberalization, and recession and recovery.
The basic empirical model is a Cobb-Douglas production function in log linearform:
yit − nit = γ (yit − 1 − nit − 1) + (1 − γ) α (kit − nit) + (1 − γ) (α + β − 1) nit
+ φ1 (protection) + φ2 (real exchange rate) + θi + θt + εit (5.1)
where yit is log real output, nit is log employment, kit is log capital stock, α and βare the exponents on capital and labour in the Cobb-Douglas production function,φ1 and φ2 are the coefficients on measures of protection and real exchange rates (tobe defined below), and θi and θt are firm and time fixed effects. θi captures allfirm specific factors affecting the level of productivity. θt captures time specificshocks common to all firms, for example the general level of activity in theeconomy. εit picks up all other shocks to firm productivity and is assumed to beserially uncorrelated. Note that returns to scale are indicated by (α + β − 1).Simple dynamics, reflecting lags in adjustment of outputs to inputs, are capturedby including the lagged dependent variable.
A number of econometric issues have to be considered.9 The first is that thecapital/labour ratio and the number of workers are certainly endogenous, andtherefore have to be instrumented. It is also likely that the lagged dependentvariable and the error term are correlated, so the former should be instrumented.For instruments we have utilized all available lagged values of the variables. Thesecond issue is whether to estimate the equation in levels or in first differences.The latter has the advantage that it eliminates the firm fixed effects, andconcentrates attention on the explanatory variables and the dynamics ofadjustment. However implementation proved difficult with the current data set.The absence of data for 1991 either implied losing a lot of data points asappropriate lagged values were not available, or required some procedure tointerpolate 1991 values. Moreover it proved difficult to obtain meaningful results:given the chaotic economic environment of Brazil in this period and thedifficulties of measuring variables accurately in a period of high inflation, it isperhaps unwise to expect economic rationality to show up in year on year changes.We therefore opted for estimations in levels with a full set of firm dummies.10
This has the advantage of obtaining direct estimates of the fixed factors associatedwith each firm, which can be interpreted as an index of their total factorproductivity, and are used subsequently in the analysis.
The productivity equation, in addition to year dummies, includes variables forprotection and the real exchange rate. As explained in the data section, for the
9 This is a preliminary version of the paper, and a number of issues of econometric testing remainto be addressed.10 Implemented with the PANEL programme in TSP.

THE POST 1990 BRAZILIAN TRADE LIBERALIZATION AND THE PERFORMANCE OF LARGE MANUFACTURING FIRMS:PRODUCTIVITY, MARKET SHARE AND PROFITS
19
years prior to 1990 we used the (log of) nominal protection in 1989 (PN)11 as aproxy for protection, on the grounds that the tariffs were set in that year toapproximate the differential between internal and external prices. From 1990onwards, we use the (log of the) effective protection rates (PE) calculated byKume. These pre-1990 and post-1990 variables have to be inserted separately inthe equation, as they are not directly comparable. The real exchange rate (ERR) iscalculated as the ratio of a general world price index for industrial goodsmultiplied by an index of the average exchange rates of a basket of currencies ofBrazil's major trading partners, to the domestic wholesale price index. An increasein the value of the index indicates a rise in competitiveness for Brazilian industry,a decrease indicates a fall in competitiveness. Taking 1990 = 100, the index had avalue of 82 in 1986, increased sharply to 107 in 1989, increased sharply again in1991/93 with a high of 125 in 1991, and then fell back in 1994 and 1995. Ourexpectation is that this index will be negatively correlated with efficiency. Adevaluation ‘protects’ domestic industry; a revaluation ‘exposes’ it to imports,requiring it to become more efficient. Note that in the empirical work, wedistinguish the effects of the real exchange rate before 1990 (ERR1), when importcontrols were in place, and after 1990 (ERR2), when imports were liberalized.
Results are tabulated in Tables 3-5: in Table 3 for pooled data, and Tables 4 and 5for some industry groups (Gêneros) and for some sectors. Considering first thepooled data equations, it is evident that the results differ very little between thetwo samples described in Section 3. So for discussion we focus on the secondsample (pooled data from the sectors). Looking first at the variables common toall specifications (A to D), we note that there is a generalized lag in adjustment,with apparently only two thirds of adjustment in the current year. The coefficienton the capital labour ratio is implausibly low — even adjusting for lags, it isgenerally less that 0.18. This probably reflects the poor measurement of thisvariable. The negative coefficient on labour suggests diminishing returns to scale,which may be partly a result of using pooled data.
In column A, year dummies are included in the equation. (Note that 1989 is thereference year, and 1992 is dropped because of the lack of 1991 data to providelagged values.) Assuming that the coefficient captures total factor productivity, astrong cyclical pattern emerges. Productivity was stable 1986/88, fell in 1989 andespecially in 1990, with a very strong recovery to 1993/94. The scale of the lattergains is impressive: the coefficients imply an increase of more than 58% in totalfactor productivity from the low of 1990 to the high of 1994. The empiricalchallenge is to distinguish in this pattern the effects of the economic cycle and theeffects of protection/real exchange rates. In column C, measures of protection andreal exchange rates are introduced: the year dummies are dropped as they arecollinear with ERR1 and ERR2. The coefficients on the (log) measures ofprotection (LPN and LPE) are negative, as expected, and significant. Note thatLPN is picking up both a time series effect and a cross section effect. The cross
11 Note that this is defined as ( 1 + τ) where τ is the tariff, in line with the theoretical model ofSection 3.

THE POST 1990 BRAZILIAN TRADE LIBERALIZATION AND THE PERFORMANCE OF LARGE MANUFACTURING FIRMS:PRODUCTIVITY, MARKET SHARE AND PROFITS
20
Table 3 no arquivo td0523t

Table 3 Sales per worker equations (pooled data)
Gêneros (resultados gerais) Setores (resultados gerais)
A B C D A B C D
LSANT (-1)* 0.27 0.38 0.38 0.28 LSANT (-1)* 0.28 0.39 0.39 0.295.76 7.99 8.03 5.91 6.38 9.01 9.00 6.55
LKNT* 0.08 0.13 0.16 0.07 LKNT* 0.06 0.09 0.11 0.053.36 7.14 7.9 3.16 3.34 5.05 5.25 3.02
LNT* -0.07 -0.06 -0.05 -0.06 LNT* -0.08 -0.10 -0.10 -0.08-1.86 -1.62 -1.4 -1.76 -2.44 -2.92 -2.74 -2.37
YR86 0.03 0.03 YR86 0.06 0.061.24 1.13 2.52 2.38
YR87 0.12 0.12 YR87 0.16 0.165.55 5.46 7.62 7.49
YR88 0.04 0.04 YR88 0.06 0.061.83 1.78 2.89 2.82
YR90 -0.16 -0.23 YR90 -0.08 -0.16-7.04 -6.02 -3.62 -4.26
YR93 0.16 0.06 YR93 0.20 0.095.08 1.39 6.97 2.29
YR94 0.32 0.21 YR94 0.38 0.279.65 4.7 11.00 5.91
LPN -0.69 -1.04 -0.45 LPN -0.77 -0.92 -0.48-6.87 -7.62 -3.44 -8.58 -7.65 -4.12
LPE -0.64 -0.64 -0.12 LPE -0.62 -0.64 -0.15-11.92 -11.88 -2.13 -11.46 -11.43 -2.75
LERR1 -0.12 LERR1 -0.21-2.15 -3.58
LERR2 -0.15 LERR2 -0.22-2.66 -3.76
Standard error 0.27 0.28 0.28 0.27 Standard error 0.30 0.32 0.32 0.30Adj.R2 0.88 0.86 0.86 0.88 Adj.R2 0.87 0.85 0.85 0.87F 3.81 3.27 3.33 3.83 F 3.20 2.80 2.83 3.23d.o.f. (274,1641) (274,1645) (274,1643) (274,1639) d.o.f. (292,1749) (292,1753) (292,1751) (292,1747)P-Value 0.0000 0.0000 0.0000 0.0000 P-Value 0.0000 0.0000 0.0000 0.0000Nob. 1925 1925 1925 1925 Nob. 2051 2051 2051 2051
*These variables are instrumented.

Table 4Sales per worker equations (gêneros)
Metalurgia(11)
Mecânica(12)
Material elétrico(13)
Material detransporte
(14)
Química(20)
Têxtil(24)
ProdutosAlimentares
(26)
A B A B A B A B A B A B A B
LSANT (-1)* 0.17 0.32 0.21 0.37 0.26 0.26 0.00 0.00 0.40 0.42 0.25 0.39 0.06 0.021.44 2.74 1.37 2.96 2.00 2.28 0.03 -0.05 4.49 4.52 2.28 3.76 0.52 0.12
LKNT* 0.08 0.17 0.13 -0.02 0.11 0.12 0.09 0.24 0.08 0.21 0.08 0.10 -0.01 0.141.89 4.55 1.33 -0.21 2.39 2.56 1.86 5.43 1.78 4.83 1.50 2.03 -0.16 2.13
LNT* -0.06 -0.03 0.09 0.10 0.13 0.09 -0.13 -0.12 -0.02 -0.08 0.01 -0.01 -0.07 -0.01-0.66 -0.37 0.68 0.79 1.11 0.75 -1.28 -1.13 -0.19 -0.76 0.16 -0.09 -0.74 -0.15
YR86 -0.11 0.44 -0.10 -0.07 0.05 0.18 -0.07-1.93 4.86 -1.33 -1.34 0.83 3.19 -1.07
YR87 0.01 0.32 0.10 0.05 0.06 0.34 -0.010.23 3.85 1.63 1.08 1.25 8.08 -0.15
YR88 0.07 0.09 -0.09 0.00 0.15 0.13 -0.021.61 1.37 -1.51 -0.13 3.18 2.79 -0.43
YR90 -0.12 -0.16 -0.25 -0.31 -0.18 0.06 -0.13-2.72 -1.63 -3.86 -7.13 -3.39 1.37 -2.25
YR93 0.12 0.29 0.59 -0.04 0.08 0.30 0.031.85 2.20 6.12 -0.63 1.07 4.87 0.36
YR94 0.32 0.43 0.68 0.07 0.27 0.53 0.245.10 3.57 5.37 0.97 3.54 8.23 2.12
LERR1 -0.20 -0.53 0.10 0.03 -0.25 -0.58 0.05-1.50 -2.45 0.64 0.23 -1.98 -4.69 0.35
LPE -1.14 -3.75 -4.60 -0.07 -0.16 -0.38 -0.17-5.23 -8.57 -9.64 -0.59 -1.88 -5.16 -0.53
LERR2 -0.14 -0.26 0.45 -0.02 -0.26 -0.50 0.04-1.07 -1.21 3.08 -0.21 -2.12 -4.14 0.31
Standard error 0.22 0.23 0.28 0.30 0.30 0.30 0.21 0.23 0.21 0.24 0.22 0.25 0.24 0.25Adj.R2 0.89 0.87 0.83 0.81 0.87 0.86 0.85 0.82 0.91 0.88 0.84 0.79 0.87 0.86F 3.52 2.88 3.04 2.49 3.67 3.51 6.38 6.09 3.90 3.31 3.86 2.66 3.85 3.63d.o.f. (51,302) (51,306) (27,158) (27,162) (32,188) (32,192) (40,236) (40,240) (32,188) (32,192) (45,266) (45,270) (35,206) (35,210)P-Value 0.0000 0.0000 0.0000 0.0000 0.0000 0.0000 0.0000 0.0000 0.0000 0.0000 0.0000 0.0000 0.0000 0.0000Nob. 364 364 196 196 231 231 287 287 231 231 322 322 252 252
*These variables are instrumented.

Table 5Sales per worker equations (setores)
Siderurgia510
Máquinas eEquipamentos
810
Motores e Peças1310
Fab. Papel1520
Fiaç. Tec. Fib. Nat.2210
Vestuário2310
Sapatos2420
A B A B A B A B A B A B A B
LSANT(-1)* 0.15 0.32 0.21 0.34 0.10 0.12 -0.07 0.09 0.20 0.09 0.59 0.45 -0.15 -0.170.86 1.91 1.37 2.38 1.13 1.44 -0.44 0.58 1.25 0.56 2.36 1.89 -0.78 -0.97
LKNT* 0.00 0.04 0.00 -0.14 0.13 0.15 0.00 0.03 -0.03 0.00 0.14 0.15 0.49 0.490.06 0.61 -0.04 -1.78 2.39 3.00 0.05 0.37 -0.44 -0.06 2.62 2.85 2.13 2.14
LNT* -0.29 -0.25 0.14 0.19 -0.29 -0.30 -0.32 -0.33 -0.20 -0.19 -0.07 -0.09 -0.13 -0.14-3.02 -2.53 1.14 1.54 -2.85 -3.02 -2.73 -2.31 -1.37 -1.20 -0.63 -0.76 -1.18 -1.50
YRR86 -0.11 0.39 -0.05 -0.03 0.08 -0.02 0.35-1.58 3.64 -0.89 -0.49 1.27 -0.21 2.91
YR87 -0.04 0.28 0.02 0.17 0.27 0.18 0.49-0.66 2.83 0.49 3.58 5.93 1.97 5.73
YR88 0.13 0.04 -0.02 -0.05 0.08 -0.08 0.411.65 0.47 -0.58 -0.77 1.36 -1.24 4.26
YR90 -0.14 -0.05 -0.35 -0.11 0.01 -0.03 0.02-1.71 -0.49 -7.58 -1.54 0.11 -0.42 0.12
YR93 0.23 0.35 -0.17 0.22 0.28 -0.02 0.302.07 3.07 2.13 1.55 2.97 -0.18 1.49
YR94 0.44 0.53 -0.09 0.53 0.57 0.21 0.494.26 4.22 -1.23 4.11 6.60 2.10 3.35
LERR1 -0.29 -0.42 -0.03 -0.21 -0.66 -0.24 -1.39-1.50 -1.61 -0.22 -1.35 -4.58 -1.19 -4.80
LPE -2.08 -3.80 -1.28 -3.50 -2.03 -0.48 -3.00-6.20 -6.71 -4.45 -5.31 -5.72 -2.66 -4.75
LERR2 -0.15 -0.13 0.00 -0.08 -0.53 -0.18 -1.20-0.79 -0.53 -0.01 -0.50 -3.82 -0.95 -4.01
Standard error 0.20 0.21 0.27 0.29 0.18 0.18 0.19 0.22 0.23 0.24 0.27 0.28 0.48 0.47Adj.R2 0.87 0.86 0.79 0.76 0.70 0.70 0.91 0.88 0.78 0.75 0.76 0.73 0.54 0.55F 3.81 2.83 3.27 2.59 6.19 6.21 5.22 4.49 3.68 3.88 2.18 2.19 2.28 2.50d.o.f. (18,104) (18,108) (21,122) (23,126) (27,158) (27,162) (14,80) (14,84) (22,128) (22,132) (18,104) (18,108) (26,152) (26,156)P-value 0.0000 0.0005 0.0000 0.0006 0.0000 0.0000 0.0000 0.0000 0.0000 0.0000 0.0075 0.0070 0.0010 0.0003Nob. 133 133 154 154 196 196 105 105 161 161 133 133 189 189
*These variables are instrumented.

Table 7
Market share equations (industry groups) Market share equations (sectors)
Equaç. Const. LEFF6 LPE LPERR2 R2 Equaç. Const. LEFF6 LPE LPERR2 R2
11 Metalurgia* 1 -13.50 1.09 4.29 0.30 510 Siderurgia* 1 -23.92 1.65 3.55 0.66-9.71 8.68 5.86 -12.40 12.17 4.06
2 -25.85 1.01 2.87 0.24 2 -38.31 1.60 3.22 0.63-6.19 7.77 3.90 -5.79 11.21 2.80
12 Mecânica* 1 -11.26 0.63 4.27 0.27 810 Máquinas e Equipamentos* 1 -11.26 0.63 4.27 0.27-8.92 5.43 4.03 -8.92 5.43 4.03
2 -15.48 0.49 1.35 0.15 2 -15.48 0.49 1.35 0.15-2.69 4.09 1.24 -2.69 4.09 1.24
13 Material Elétrico* 1 -12.63 0.87 10.99 0.21 1310 Motores e Peças* 1 -29.93 2.27 7.77 0.85-4.78 3.53 5.47 -26.93 23.79 14.94
2 -24.89 0.12 4.42 0.07 2 -44.20 2.09 3.69 0.64-3.19 0.62 3.13 -10.15 13.95 5.06
14 Material de Transporte* 1 -30.94 2.48 7.14 0.74 1520 Fab. de Papel 1 -14.86 1.01 4.13 0.60-20.65 18.67 9.72 -10.90 9.41 3.17
2 -44.36 2.30 3.45 0.61 2 -38.19 1.02 4.90 0.62-9.41 14.20 4.30 -5.70 9.83 3.80
20 Química* 1 -9.28 0.68 0.13 0.21 2210 Fiaç. Tec. Frib. Nat.* 1 -35.86 1.48 9.35 0.67-6.98 5.69 0.63 -7.36 10.25 11.63
2 -9.66 0.69 0.06 0.21 2 -50.44 1.12 7.26 0.40-6.62 5.72 0.31 -8.20 6.01 7.04
24 Têxtil* 1 -14.63 1.34 3.24 0.59 2310 Vestuário* 1 -14.99 1.30 2.59 0.35-11.86 9.85 15.32 -6.26 5.87 4.82
2 -29.92 1.26 3.37 0.57 2 -33.20 1.43 3.51 0.41-15.64 9.19 14.76 -7.36 6.61 5.76
26 Produtos Alimentares* 1 -13.14 1.16 0.62 0.50 2420 Sapatos* 1 -9.97 1.18 4.67 0.19-11.32 11.13 1.04 -4.96 4.52 3.73
2 -22.37 1.21 1.78 0.53 2 -50.77 1.34 8.23 0.38-6.86 12.00 3.13 -7.85 5.99 7.05

Table 9Profit equations (log linear)-Dependent variable LRPROF-
Sector 510 Siderurgia 810 Máquinas eEquipamentos
1310 Motores ePeças
1520 Fab.dePapel
2210 Fia.Tec.Fibras Naturais
2310 Vestuário 2420 Sapatos
C -38.62 -0.71 -11.86 1.38 -32.81 -2.67 -16.86 0.54 -16.46 -0.79 -23.71 -0.35 -9.24 -2.93-1.31 -1.57 -0.96 3.72 -4.17 -8.27 -1.60 1.96 -1.23 -1.60 -2.56 -0.67 -2.22 -4.32
LREFF 2.25 2.25 0.72 0.71 2.84 2.84 1.67 1.67 1.74 1.73 1.69 1.69 2.24 2.2312.14 12.11 5.17 5.07 20.65 19.90 15.68 15.62 8.13 8.11 7.50 7.49 7.69 7.71
LMEFF 3.16 1.62 3.20 1.47 1.57 2.75 1.351.29 1.06 3.78 1.60 1.09 2.41 1.64
PRE 1.19 0.78 0.38 0.57 1.15 -0.08 -0.721.34 1.14 1.40 1.87 3.56 -0.17 -1.15
LPE 4.16 1.24 2.18 2.31 3.18 0.46 -1.720.95 0.46 1.93 0.93 2.72 0.63 -0.94
PRE88 0.44 -0.05 -0.04 -0.29 0.36 -0.50 0.511.43 -0.20 -0.27 -1.40 1.35 -1.72 1.65
YR90 -0.26 -0.60 -0.41 -0.60 -0.31 -0.40 0.15-067 -1.97 -2.10 -2.28 -0.94 -1.14 0.40
YR92 -0.12 -0.58 -0.40 -0.64 -0.76 -1.13 -0.22-031 -1.93 -2.03 -2.50 -2.30 -3.18 -0.58
POST93 -0.05 -0.43 -0.43 -0.46 -1.02 -0.82 0.35-0.14 -1.59 -2.50 -2.08 -3.53 -2.65 1.06
N 145 145 143 143 214 214 118 118 177 177 147 147 188 188F 39.13 31.19 9.78 7.56 114.28 82.56 63.34 50.25 27.81 22.40 17.25 13.78 15.51 13.17R2 0.51 0.51 0.20 0.19 0.68 0.66 0.68 0.68 0.38 0.38 0.31 0.30 0.24 0.25
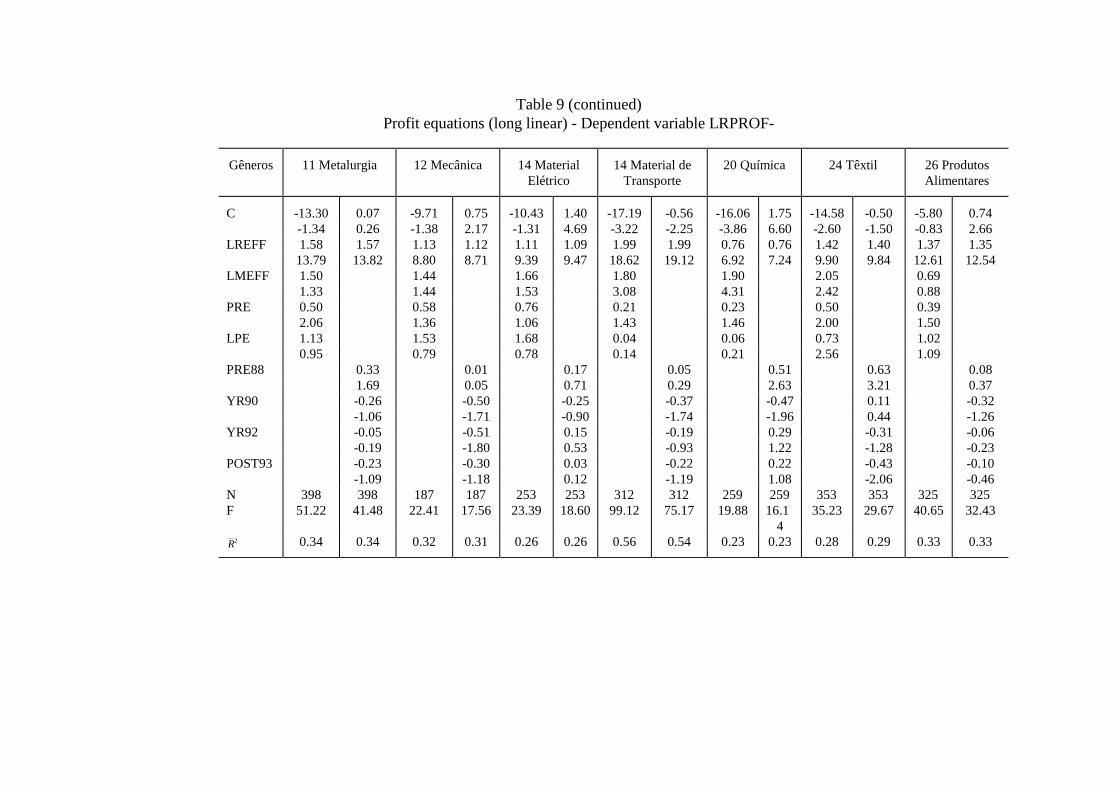
Table 9 (continued)Profit equations (long linear) - Dependent variable LRPROF-
Gêneros 11 Metalurgia 12 Mecânica 14 MaterialElétrico
14 Material deTransporte
20 Química 24 Têxtil 26 ProdutosAlimentares
C -13.30 0.07 -9.71 0.75 -10.43 1.40 -17.19 -0.56 -16.06 1.75 -14.58 -0.50 -5.80 0.74-1.34 0.26 -1.38 2.17 -1.31 4.69 -3.22 -2.25 -3.86 6.60 -2.60 -1.50 -0.83 2.66
LREFF 1.58 1.57 1.13 1.12 1.11 1.09 1.99 1.99 0.76 0.76 1.42 1.40 1.37 1.3513.79 13.82 8.80 8.71 9.39 9.47 18.62 19.12 6.92 7.24 9.90 9.84 12.61 12.54
LMEFF 1.50 1.44 1.66 1.80 1.90 2.05 0.691.33 1.44 1.53 3.08 4.31 2.42 0.88
PRE 0.50 0.58 0.76 0.21 0.23 0.50 0.392.06 1.36 1.06 1.43 1.46 2.00 1.50
LPE 1.13 1.53 1.68 0.04 0.06 0.73 1.020.95 0.79 0.78 0.14 0.21 2.56 1.09
PRE88 0.33 0.01 0.17 0.05 0.51 0.63 0.081.69 0.05 0.71 0.29 2.63 3.21 0.37
YR90 -0.26 -0.50 -0.25 -0.37 -0.47 0.11 -0.32-1.06 -1.71 -0.90 -1.74 -1.96 0.44 -1.26
YR92 -0.05 -0.51 0.15 -0.19 0.29 -0.31 -0.06-0.19 -1.80 0.53 -0.93 1.22 -1.28 -0.23
POST93 -0.23 -0.30 0.03 -0.22 0.22 -0.43 -0.10-1.09 -1.18 0.12 -1.19 1.08 -2.06 -0.46
N 398 398 187 187 253 253 312 312 259 259 353 353 325 325F 51.22 41.48 22.41 17.56 23.39 18.60 99.12 75.17 19.88 16.1
435.23 29.67 40.65 32.43
R2 0.34 0.34 0.32 0.31 0.26 0.26 0.56 0.54 0.23 0.23 0.28 0.29 0.33 0.33
THE POST 1990 BRAZILIAN TRADE LIBERALIZATION AND THE PERFORMANCE OF LARGE MANUFACTURING FIRMS:PRODUCTIVITY, MARKET SHARE AND PROFITS
21
section effect arises from the variation in non-tariff protection across sectors priorto 1990. The time series effect is the removal of non-tariff barriers in 1990:presumably this effect is the greater, the higher the pre 1990 protection. Theaverage value of nominal protection in 1988 was about 32%, and the coefficientimplies that a one percent reduction in protection was accompanied by a 0.9%increase in efficiency. Assuming nominal protection in 1989 to be a reasonableindicator of non-tariff barriers, the implication is that efficiency increased onaverage by 22% due to their removal in 1990. To take an admittedly extremeexample, the removal of the non-tariff barrier in the automobile industry, whichwas equivalent to a 65% nominal tariff, would have increased efficiency by 35%.The effects of reductions in protection after 1990 are only slightly smaller.According to Kume's calculations (1996), the average effective tariff fell from45.5% in 1990 to 19.9% in 1994. The coefficient on LPE suggests that this onaverage increased efficiency by about 11%. The results in column C also suggest aminor role for the real exchange rate: a ‘protective’ devaluation of 10% reducesefficiency by 2%. In column D, we attempt to evaluate the relative contributionsof the economic cycle and of protection to efficiency. There is no difference in theyear coefficients prior to 1990, but from 1990 onwards the coefficients are muchlower. The coefficients on PN, and especially on PE, are also much reduced.Unfortunately it is unlikely that these coefficients give an accurate indication ofthe separate effects: the removal of non-tariff barriers coincided precisely with thepolicy-induced recession of 1990, and the process of reducing effective tariffsafter 1990 coincided with the rapid recovery of economic activity. A comparisonwith the period 1981/95 is instructive, if not conclusive. The pattern of declineand growth in manufacturing activity in that period was not dissimilar to that of1990/94 (see Figure 1). In that period labour productivity increased by 5.2%. Ifthat experience can be extrapolated to 1990/94, it would suggest that of the 58%growth in total factor productivity, only five percentage points can be accountedfor by the cyclical effects, leaving some 53 percentage points to be explained bytrade liberalization and privatization/deregulation of the economy. Of these 53points, perhaps 22 were due to the abandonment of non-tariff barriers in 1990 and11 were due to the progressive reduction of effective tariffs over the period; theremaining 20 points may be attributable to the general liberalization of theeconomy, including privatization/deregulation in some sectors e.g. the steelindustry.
Tables 4 and 5 present results by industry groups (Gêneros) and by sectors, wherethe latter are more homogeneous than the former. In all cases the coefficients onthe year dummies show the same distinct pattern of stable efficiency levels in1986/88, a fall in 1989/90, and then efficiency gains to 1993/94. Two Industrieswarrant further comment. The first is mecânica [see also máquinas eequipamentos (810)], where the recovery in efficiency to 1994 only served torestore efficiency to the levels of 1986. The second is material de transportes[see also motores e peças (1310)], which is virtually exclusively the automobileindustry in this sample. Once again, efficiency was more or less the same at thebeginning and end of the period, but fell dramatically in the 1990 recession.

THE POST 1990 BRAZILIAN TRADE LIBERALIZATION AND THE PERFORMANCE OF LARGE MANUFACTURING FIRMS:PRODUCTIVITY, MARKET SHARE AND PROFITS
22
Table 4 no arquivo td0523t

THE POST 1990 BRAZILIAN TRADE LIBERALIZATION AND THE PERFORMANCE OF LARGE MANUFACTURING FIRMS:PRODUCTIVITY, MARKET SHARE AND PROFITS
23
Table 5 no arquivo td0523t

THE POST 1990 BRAZILIAN TRADE LIBERALIZATION AND THE PERFORMANCE OF LARGE MANUFACTURING FIRMS:PRODUCTIVITY, MARKET SHARE AND PROFITS
24
The alternative equations include the (logs of) ERR1, ERR2, and PE. (Note thatthese equations cannot include year dummies together with ERR1, ERR2 and PEbecause of collinearity: PN is excluded as it has only a single value in the period1986/89.) The real exchange rate is evidently more important in some sectors —química, têxtil , fibras naturais, and sapatos: perhaps these sectors are moresensitive than other sectors to movements in world prices. Effective protection hasthe expected negative sign, and is significant at least the 10% level in all industrygroups, with the exceptions of material de transportes and produtosalimentares. Some of the coefficients suggest very large efficiency effects fromtrade liberalization — especially mecânica, material elétrico, siderurgia, papel,fibras naturais and sapatos. For example, in material elétrico, the coefficient onPE suggests an 88% gain in efficiency since 1990 due to the reduction inprotection: in sapatos, a 50% gain. However, the previous caveat applies; at leastsome of these gains should be attributed to the recovery in output after the deeprecession of 1990/91.
To conclude, our results indicate very substantial efficiency losses associated withnon-tariff protection prior to 1990. Post 1990, there have been very largeefficiency gains arising jointly from the recovery after the 1990/91 recession, fromthe trade liberalization, and from liberalization of the economy in general. While itis not possible to distinguish these quantitatively, our equations and a comparisonwith 1981/85 suggest that the greater part of the gains should be attributed to tradeliberalization.
Our next task is to probe a little more deeply into the mechanisms which inducedfirms to improve their efficiency so dramatically, in response to the shocks ofrecession and import competition. Specifically we investigate the effects on themarket shares and profits of domestic firms.
6 - MARKET SHARE AND PROFITS
6.1 - Market Share
In Subsection 3.1, for the case where λ is the same for all firms, we showed thatthe market share of the firm is given by:
si
E E
nE
cic
=+
−+
−+
1 1
11
λ λλ
(6.1)
In principle, as discussed in Subsection 3.4, trade liberalization could affectmarket share by affecting n, λ and c . Our empirical work focusses on c ,assuming that changes in n and λ are small. In which case we can write theprevious equation, distinguishing different time periods, as:

THE POST 1990 BRAZILIAN TRADE LIBERALIZATION AND THE PERFORMANCE OF LARGE MANUFACTURING FIRMS:PRODUCTIVITY, MARKET SHARE AND PROFITS
25
sit
citct
= −ϕ ϕ1 2
and substituting from 3.13 and 3.14,
( )( )sit
cit
c ER cjt t t kt
= −+ − +
ϕ ϕσ σ τ1 2 1 1 *
(6.2)
To interpret, market share is decreasing in the firm's own costs, and increasingwith the average costs of domestic suppliers and of foreign suppliers in thedomestic market taking into account tariffs and the exchange rate.
6.2 is highly non-linear and in any case arises from a very particular model. So forempirical purposes, we specify a general (log linear) relationship between cit, cjt
and ( )1+ τ t tER ckt* . In the place of measures of cit and cjt , we use indices of firm
efficiency constructed from the production function analysis of the previoussection, noting that costs are inversely related to efficiency. So in place of cit, theefficiency measure is the firm fixed effect, θi, plus the time fixed effect, θt, plusthe efficiency effects of protection and the real exchange rate. In place of cjt ,
which is the average of the cit for domestic firms, we use an average of the firmefficiency measures. The costs of foreign suppliers can be proxied by (1 + τt) ERt
in the absence of information on ckt* . In practice things are not so straightforward.
First, as defined cit and c jt are collinear, and so are the corresponding efficiencymeasures, so only one can be included in the equation. We opt for the firmmeasure rather than the industry average measure as we are also interested in theeffects of its cross-section variation on market share. Second, (1 + τt) ERt enters intwo places: indirectly via its effect on firm efficiency and indirectly through itseffect on the cost of foreign suppliers. To exclude any possibility of collinearityover time between (1 + τt) ERt and the firm efficiency measure, we opted for adefinition which included only the firm fixed effect and the time fixed effect. Theempirical counterparts (in logs) are LEFF for the firm efficiency measure, LPE for(1 + τt), LERR2 for ERt and LPERR2 for (1 + τt) ERt. Our expectation is that (log)firm market share will be positively related to LEFF, and positively related toLPE, LERR2 and LPERR2. Note that the analysis captures a cross-section effect(more efficient domestic producers will have a higher market share), and a timeseries effect (changes in the relative costs of domestic and foreign suppliers).

THE POST 1990 BRAZILIAN TRADE LIBERALIZATION AND THE PERFORMANCE OF LARGE MANUFACTURING FIRMS:PRODUCTIVITY, MARKET SHARE AND PROFITS
26
Market shares are calculated as the ratio of firm sales to the estimates of marketsize of Moreira and Correa (1996) described in Section 4 before.12 The latter areonly available for 1989 onwards, so our analysis is for four years only, 1990 and1992/94. Some sectors had to be excluded for lack of market size data. Results forpooled data are given in Table 6 (note that sectoral dummies were included in allthese equations). As expected, protection has a big effect on market share: theseequations suggest that a 1% fall in protection directly decreased the market shareof domestic firms by 2.56%. Also as expected, more efficient firms have largermarket shares: the elasticity is 1.16. Note that this is capturing mainly a cross-section effect. But it also has a time-series aspect: from the previous section weknow that a 1% fall in protection stimulates domestic firm efficiency with anestimated elasticity of 0.64, which in turn increases market share by 0.74%. Thenet effect of a 1% decrease in protection is therefore of the order of a 1.8% loss inmarket share. Given Kume's estimate (1996) that on average protection fell by17% between 1990 and 1994, a 30% fall in market share is implied if theseelasticities are correct.13 These are implausibly large effects: the suspicion is thatthe equations are overestimating the impact of trade liberalization. Equations forindividual industry groups and sectors, in Table 7, compound the problem, sincemany of the elasticities of market share with respect to protection are even largerthan for the pooled sample.
Table 6Market share equation (pooled data)
A B C
C -13.67 -13.20 -13.17-8.64 -24.96 -24.91
LEFF 1.16 1.16 1.1622.58 22.64 22.64
LPE 2.56 - 2.5210.73 - 11.90
LERR2 0.11 - -0.34 - -
LPERR2 - 0.56 -- 11.96 -
N 1044 1044 1044
R2 0.73 0.73 0.73
F 104.11 108.40 108.21
Nota: Dummies setoriais são incluídas em todas as equações.
12 This is not an ideal measure of market share, given that the gross value of output calculated byMoreira and Correa(1996) is exactly that — output, not sales, and hence excluding changes instocks.13 Actual average import penetration was much less than this. See for example the estimates ofMoreira and Correa (1996), Table 2, of how import shares increased in different sectors 1990/95.Note however that our sample probably includes more firms from sectors in which importcompetition was above average in this period.

THE POST 1990 BRAZILIAN TRADE LIBERALIZATION AND THE PERFORMANCE OF LARGE MANUFACTURING FIRMS:PRODUCTIVITY, MARKET SHARE AND PROFITS
27
Table 7 no arquivo td0523t

THE POST 1990 BRAZILIAN TRADE LIBERALIZATION AND THE PERFORMANCE OF LARGE MANUFACTURING FIRMS:PRODUCTIVITY, MARKET SHARE AND PROFITS
28
Whatever may be the explanation, one thing seems certain — trade liberalizationhad a dramatic effect on the market share of domestic producers in this period.While no doubt quite a number of firms simply closed down under the impact ofimport competition, those who remained in the market had to make a major effortto reduce costs in order to mitigate their losses.
6.2 - Profits
In Subsection 3.2 we derived the expression for the profits of each firm
πλ λi i
dQ
dp
c
nE
c= −+ −
+ −
1
11
1
2
(6.3)
Assuming, as in the case of market share, that the effects of trade liberalization onthe number of competitors, n, and the degree of collusion, λ, are small, thisexpression can be written:
( )log logπ υ υit t itc c= / + / −1 22
Substituting from 3.13 and 3.14 gives:
( )( )( )log log *π υ υ σ υ σ τit jt t t kt itc ER c c= / + / + / − + −1 2 22 1 1
or
( ) ( )( )( )log log ( )*π υ υ σ υ σ τit jt t t kt jt itc ER c c c= / + / − + / − + + −1 2 22 1 1 1 (6.4)
i.e. firm i profits are a non-linear function of three variables: the average costs ofdomestic firms cjt , the average costs of foreign suppliers ( )1+ τ t t ktER c * , and the
efficiency of firm i relative to its domestic competitors ( )c cjt it− .
For empirical work we specify a general (log linear) relationship between logprofits (LRPROF), log average efficiency of domestic firms (LMEFF) in a sector,derived from the production function analysis, the log relative efficiency of firm i(LREFF) measured as the difference between firm efficiency and sectoral averageefficiency, and measures of protection (LPN prior to 1990, and LPE from 1990onwards). For comparison we also ran equations with relative efficiency (LREFF)only, the other variables being substituted by four time dummies (PRE88 for1986/88, YR90 for 1990, YR92 for 1992 and POST93 for 1993/94 — note thatthe coefficients on these dummies are relative to the base year of 1989).
THE POST 1990 BRAZILIAN TRADE LIBERALIZATION AND THE PERFORMANCE OF LARGE MANUFACTURING FIRMS:PRODUCTIVITY, MARKET SHARE AND PROFITS
29
The measure of profits is the closest approximation to the concept of gross profitswhich can be derived from the data of the PIA. From net sales are deductedidentifiable costs of production — wages and related labour costs, and costs ofinputs. As explained in Section 4 above, the precise nature of some other recordedexpenditures is unclear, so these were not deducted. Nor is any adjustment madefor changes in work in progress or in stocks of raw materials. Nominal profits aredeflated by the average of the sectoral price index (IPA) to give a measure of realprofits (RPROF).
The pooled data set (after deleting approximately 5% of the observations withnegative profits) gave 2087 observations over eight years. Sectoral dummies wereincluded in the equations to capture inter industry differences in capital intensity.The results are given in Table 8. In the specification with time dummies, thecollapse of profits in 1990 relative to 1986/88 is very evident: the difference incoefficients is equivalent to a 42% decline in average profits. Although profitsrecovered somewhat thereafter, the 1993/94 level was still 35% lower than in1986/88. In the specification which included the average efficiency of domesticfirms (LMEFF) and measures of protection (LPN and LPE),14 the signs of thecoefficients were as expected, and with the exception of LPE, significant. That is,firm profits were higher the greater the efficiency of the firm relative to itsdomestic competitors, the higher the average efficiency of domestic producers,and the higher the level of protection. The coefficients suggest that a 1%improvement in average efficiency generated a 1% increase in profits, and a 1%increase in PN (which is a proxy for non-tariff protection prior to 1990) increasedprofits by 0.7%. The puzzle is the weak performance of the effective protectionvariable from 1990 (LPE). There are two possible explanations: a) from theproduction function analysis we know that the average efficiency of domesticfirms has a negative relationship with LPE; it is possible therefore that LMEFF ispicking up all the effects of the decline in protection after 1990; b) the movementsin profits within the period 1990/94 were much smaller than in the precedingperiod.
The results for industry groups and sectors confirm the results of the pooledsample. The equations with time period dummies track some very large falls inprofits from 1986/88 to 1993/94: for example, in têxtil the decline is 65%, with aneven greater fall (79%) in fibras naturais. The alternative equations includeaverage domestic firm efficiency, a dummy (PRE89) for the period 1986/89 tocapture the effects of non-tariff barriers, and effective protection (LPE) for 1990onwards. In most cases the coefficients on relative efficiency and averagedomestic firm efficiency are larger than in the pooled equation, indicating thatefficiency gains by individual firms, or by all firms relative to foreign suppliers,generated expressive gains in terms of profits. As expected the PRE89 dummyreflects much higher profits in virtually all sectors in the period before trade
14 We experimented with variables in which the measures of protection were interacted with realexchange rates, or with real exchange rates and an index of international manufacturing costs.Neither procedure improved the results.

THE POST 1990 BRAZILIAN TRADE LIBERALIZATION AND THE PERFORMANCE OF LARGE MANUFACTURING FIRMS:PRODUCTIVITY, MARKET SHARE AND PROFITS
30
Table 8Profit equations (log linear)-POOLED DATA-
DEPENDENT VARIABLE LRPROF
C -7.65 C 0.06-18.08 0.33
LREFF 1.37 LREFF 1.3825.02 25.66
LMEFF 0.97 PRE88 0.2919.23 3.70
LPN 0.72 YR90 -0253.79 -2.63
LPE 0.05 YR92 -0.070.33 -0.78
POST93 -0.14-1.68
N 2087 N 2087F 244.37 F 39.36R2
0.32 R2 0.36
Nota : Dummies setoriais são incluídas em todas as equacões.
liberalization. The coefficient on protection after 1990 (LPE) is, in contrast withthe pooled data, generally positive and large though seldom statisticallysignificant.15
These results have two important implications for our study:
a) there is no doubt that the falls in profits arising from the recession in 1990/91,and from trade liberalization from 1990 onwards, were non-marginal. Theargument of Subsection 3.4 that firms made more effort because the marginalutility of profits increased dramatically is clearly plausible, though not of coursedemonstrated.
b) the fall in profit was mitigated, to some extent, by the improved efficiency ofdomestic producers. For example, if the estimated elasticities from the pooledequations are correct, a 1% fall in protection stimulated a 0.6% improvement inefficiency pushing up profits by about the same amount. The direct impact onprofits was -0.7% due to import competition. The net effect was a small decreasein profits of -0.1%. 15 One reason for the lack of significance may be that the equation does not control for the fall inprofits in 1990 provoked by the domestic recession, at a time when the effective protection ratewas highest.

THE POST 1990 BRAZILIAN TRADE LIBERALIZATION AND THE PERFORMANCE OF LARGE MANUFACTURING FIRMS:PRODUCTIVITY, MARKET SHARE AND PROFITS
31
7 - CONCLUSIONS‘Proponents of trade liberalization have based their arguments on the presumptionthat import competition stimulates domestic producers to improve their X-efficiency and to catch up technologically [Tybout (1991)]. There are howevermore sceptical opinions [see for example, Rodrik (1992)], and the issue remains tobe resolved by empirical studies. The experience of the post 1990 Brazilian tradeliberalization is potentially very interesting, as it enables us to study the impact ona relatively large and well developed, and highly protected, industrial structure.The analysis of this paper suggests that the optimism of enthusiasts for tradeliberalization is well founded. The leading Brazilian manufacturing firmsresponded to trade liberalization after 1990 with an impressive growth inproductivity, though some of that growth also represented the effects of generalliberalization of the economy and a recovery from the adverse effects of the policyinduced recession of 1990/91. This growth was in total factor productivity,indicating a key role for improvements in X-efficiency and technological catch up.The remaining puzzle is the nature of the behavioural response by the firms. Sincecompetition reduces profitability, why did the firms not respond by reducing theirefforts, and accepting the inevitable reduction in profits and market share? Theexplanation suggested here is that the shocks to profits were so large that themarginal utility of profit with respect to effort actually increased, stimulatinggreater efficiency. While this mechanism is not observable directly, we haveshown that the adverse shocks to profits were proportionately very large.
THE POST 1990 BRAZILIAN TRADE LIBERALIZATION AND THE PERFORMANCE OF LARGE MANUFACTURING FIRMS:PRODUCTIVITY, MARKET SHARE AND PROFITS
32
Table 9 no arquivo td0523t

THE POST 1990 BRAZILIAN TRADE LIBERALIZATION AND THE PERFORMANCE OF LARGE MANUFACTURING FIRMS:PRODUCTIVITY, MARKET SHARE AND PROFITS
33
Table 9 (cont.) no arquivo td0523t

THE POST 1990 BRAZILIAN TRADE LIBERALIZATION AND THE PERFORMANCE OF LARGE MANUFACTURING FIRMS:PRODUCTIVITY, MARKET SHARE AND PROFITS
34
Figure 1
Productivity in Manufacturing Industry (1980/95)
Data Sources: Real Output - Pesquisa Industrial Mensal - Produção Física (PIM-PF) IBGE. Labour - 1985/95 - Pesquisa Industrial Mensal - Dados Gerais (PIM-DG) IBGE.
- 1983/84 - Variações de Pesquisa Mensal de Emprego (PME) IBGE.- 1980/82 - Variações anuais do pessoal ocupado na Indústria - Anuário
Estatístico do IBGE.

THE POST 1990 BRAZILIAN TRADE LIBERALIZATION AND THE PERFORMANCE OF LARGE MANUFACTURING FIRMS:PRODUCTIVITY, MARKET SHARE AND PROFITS
35
BIBLIOGRAPHY
AMADEO, E. J., GONZAGA, G. Salário, produtividade e câmbio: umaanálise do custo unitário na indústria brasileira, 1985-1995. Rio de Janeiro:Departamento de Economia/PUC, 1996.
BARRERA, F. Trade liberalization and intra-industry heterogeneity:Colombia's manufacturing sector 1975-87. Oxford University, 1995(Doctoral Thesis).
BONELLI, R. Ensaios sobre política econômica e industrialização no Brasil.Rio de Janeiro: Senai/DN/Ditec/DPEA, Ciet, 1995.
______. Produtividade industrial nos anos 90: controvérsias e quase fatos. AEconomia Brasileira em Perspectiva — 1996. Rio de Janeiro: IPEA, 1996.
BRAGA, H. C., SANTIAGO, G. M. C., FERRO, L. C. M. Proteção efetiva noBrasil: uma estimativa a partir da comparação de preços. Rio de Janeiro:IPEA, 1980 (Série Estudos de Política Industrial e Comércio Exterior, 13).
CONSIDERA, C. M. Ideologia, globalização e emprego. Jornal do Economista,São Paulo, Corecon, n. 83, 1995.
FEIJÓ, C. A., CARVALHO, P. G. M. de. Sete teses equivocadas sobre o aumentoda produtividade industrial nos anos recentes. Boletim de Conjuntura, Rio deJaneiro: UFRJ/IEI, 1994 (Suplemento).
FONSECA, R. Trade liberalization and quality innovation in Brazilian autos.Rio de Janeiro: IPEA, 1996 (Texto para Discussão, 418).
HAY, D. A. The effects of import competition on firm performance inimperfectly competitive industries. Rio de Janeiro: IPEA, 1977, mimeo.
HAY, D. A., LIU, G. S. The efficiency of firms: what difference does competitionmake? Economic Journal, v. 106, p. 597-617, 1997.
HORTA, M. H., PIANI, G., KUME, H. A política cambial e comercial.Perspectivas da Economia Brasileira 1992. Rio de Janeiro: IPEA, p. 59-80,1991.
IBGE. Pesquisa industrial: empresas líderes do setor industrial: 1986,1987 e1988. Rio de Janeiro, 1994.
______. Pesquisa industrial: empresas líderes do setor industrial: 1989 e1990. Rio de Janeiro, 1995a.

THE POST 1990 BRAZILIAN TRADE LIBERALIZATION AND THE PERFORMANCE OF LARGE MANUFACTURING FIRMS:PRODUCTIVITY, MARKET SHARE AND PROFITS
36
______. Pesquisa industrial: empresas líderes do setor industrial - 1992. Riode Janeiro, 1995b.
______. Pesquisa industrial: empresas líderes do setor industrial - 1993. Riode Janeiro, 1996.
KUME, H. A reforma tarifária de 1988 e a nova política de importação. Riode Janeiro: Funcex, jul. 1989 (Texto para Discussão, 20).
______. A política de importação no Plano Real e a estrutura de proteçãoefetiva. Rio de Janeiro: IPEA, mai. 1996 (Texto para Discussão, 423).
LEVY, P. M., HAHN, L. M. D. A economia brasileira em transição: o período1993-96. A Economia Brasileira em Perspectiva — 1996. Rio de Janeiro:IPEA, p. 17-48, 1996.
MOREIRA, M. M., CORREA, P. G. Abertura comercial e indústria: o que sepode esperar e o que se vem obtendo. Rio de Janeiro: BNDES/AP/Depec,1996 (Texto para Discussão, 49).
NICKELL, S .J. Competition and corporate performance. Journal of PoliticalEconomy, v.104, p.724-746, 1996.
NICKELL, S., WADHWANI, S. B., WALL, M. Productivity growth in UKcompanies, 1975-86. European Economic Review, v. 36, p. 1.055-1.085,1992.
OLIVEIRA, A. B. S. et alii. Retrospectiva da economia brasileira. Perspectivasda Economia Brasileira — 1994. Rio de Janeiro: IPEA, 1994.
PAPAGEORGIOU, D., MICHAELY, M., CHOKSI, A. (eds.). Liberalizingforeign trade. Oxford University Press for the World Bank, 1992.
PINHEIRO, A. C., ALMEIDA, G. B. de. Padrões setoriais da proteção naeconomia brasileira. Rio de Janeiro: IPEA, out. 1994 (Texto para Discussão,355).
ROBERTS, M. J.,TYBOUT, J. R. Size rationalization and trade exposure indeveloping countries. In: BALDWIN, R. (ed.). Empirical studies ofcommercial policy. University of Chicago Press, 1991.
RODRIK, D. Closing the productivity gap: does trade liberalization really help?In: HELLEINER, G. K. (ed.). Trade policy, industrialization anddevelopment: new perspectives. Oxford: Clarendon Press, 1992.

THE POST 1990 BRAZILIAN TRADE LIBERALIZATION AND THE PERFORMANCE OF LARGE MANUFACTURING FIRMS:PRODUCTIVITY, MARKET SHARE AND PROFITS
37
SALM, C., SABOIA, J., CARVALHO, P. G. M. de. Produtividade na indústriabrasileira - uma contribuição ao debate. Rio de Janeiro: UFRJ, set. 1996(Texto para Discussão, 376).
SILVA, A. B. O de et alii. Retrospectiva da economia brasileira. Perspectivas daEconomia Brasileira — 1994. Rio de Janeiro: IPEA, 1993.
SILVA, J. C. F. Origens, evolução e estágio atual da crise econômica.Perspectivas da Economia Brasileira — 1992. Rio de Janeiro: IPEA, p. 5-19,1991.
SILVA, J. C. F., VELLOSO, R. C. Política econômica: retrospecto de umadécada, p. 7-19 e O plano cruzado, p. 21-38. Perspectivas da EconomiaBrasileira 1987. Rio de Janeiro: IPEA/INPES, 1987.
TYBOUT, J. R. Researching the trade-productivity link: new directions.World Bank, 1991 (Working Paper in Trade Policy, 638).
TYBOUT, J. R., MELO, J. de, CORBO, V. The effects of trade reforms on scaleand technical efficiency: new evidence from Chile. Journal of InternationalEconomics, v. 31, p. 231-250, 1991.
TYBOUT, J. R., WESTBROOK, M. D. Trade liberalization and the dimensionsof efficiency change in Mexican manufacturing industries. Journal ofInternational Economics, v. 39, p. 53-78, 1995.
TYLER, W. G. Recent effective tariff protection for Brazil. Rio de Janeiro:IPEA, 1980 (Texto para Discussão, 18).