Embed Size (px)
Citation preview

P a g e | 1
Center for the Study of Carbon Dioxide and Global Change © 2013, www.co2science.org.
Craig D. Idso, Ph.D.
Center for the Study of Carbon Dioxide and Global Change
21 October 2013
The Positive Externalities of Carbon Dioxide:
Estimating the Monetary Benefits of Rising Atmospheric
CO2 Concentrations on Global Food Production

P a g e | 2
Center for the Study of Carbon Dioxide and Global Change © 2013, www.co2science.org.
TABLE OF CONTENTS
ABSTRACT ................................................................................................................. 3
INTRODUCTION ........................................................................................................... 4
HOW RISING ATMOSPHERIC CO2 IS A BIOSPHERIC BENEFIT ................................................... 5
DATA ....................................................................................................................... 7
HISTORIC MONETARY BENEFIT CALCULATIONS AND RESULTS ................................................. 9
FUTURE MONETARY BENEFIT CALCULATIONS AND RESULTS ................................................. 12
FUTURE CO2 BENEFITS OR DAMAGES: WHICH IS MORE LIKELY TO OCCUR? ............................ 17
CONCLUSION ........................................................................................................... 23
REFERENCES ............................................................................................................ 24
ABOUT THE AUTHOR .................................................................................................. 29
ABOUT THE CENTER ................................................................................................... 30
On the Cover: Global population, CO2 emissions, and food production data over the period 1961-2010, normalized to a value of unity at 1961. A data value of 2, therefore, represents a value that is twice the amount reported in 1961. Each of these datasets has experienced rapid and interlinked growth over the past five decades, with rising global population leading to rising CO2 emissions, which emissions have benefited food production.
P a g e | 3
Center for the Study of Carbon Dioxide and Global Change © 2013, www.co2science.org.
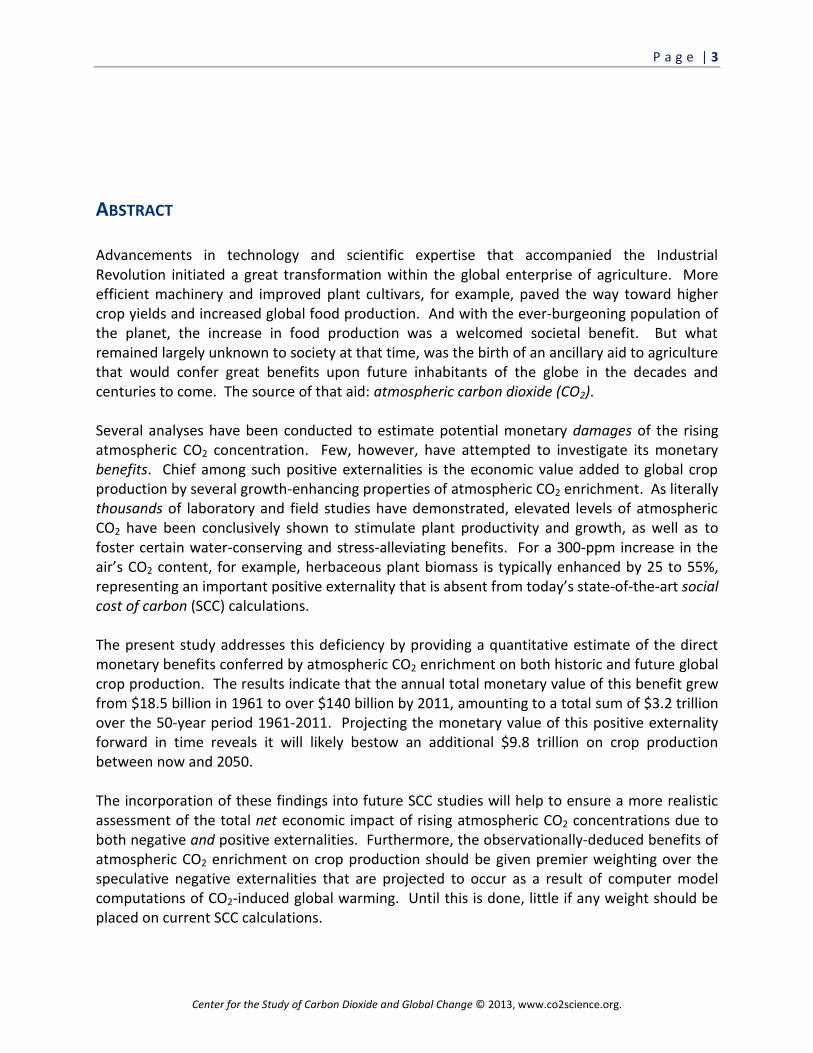
ABSTRACT Advancements in technology and scientific expertise that accompanied the Industrial Revolution initiated a great transformation within the global enterprise of agriculture. More efficient machinery and improved plant cultivars, for example, paved the way toward higher crop yields and increased global food production. And with the ever-burgeoning population of the planet, the increase in food production was a welcomed societal benefit. But what remained largely unknown to society at that time, was the birth of an ancillary aid to agriculture that would confer great benefits upon future inhabitants of the globe in the decades and centuries to come. The source of that aid: atmospheric carbon dioxide (CO2). Several analyses have been conducted to estimate potential monetary damages of the rising atmospheric CO2 concentration. Few, however, have attempted to investigate its monetary benefits. Chief among such positive externalities is the economic value added to global crop production by several growth-enhancing properties of atmospheric CO2 enrichment. As literally thousands of laboratory and field studies have demonstrated, elevated levels of atmospheric CO2 have been conclusively shown to stimulate plant productivity and growth, as well as to foster certain water-conserving and stress-alleviating benefits. For a 300-ppm increase in the air’s CO2 content, for example, herbaceous plant biomass is typically enhanced by 25 to 55%, representing an important positive externality that is absent from today’s state-of-the-art social cost of carbon (SCC) calculations. The present study addresses this deficiency by providing a quantitative estimate of the direct monetary benefits conferred by atmospheric CO2 enrichment on both historic and future global crop production. The results indicate that the annual total monetary value of this benefit grew from $18.5 billion in 1961 to over $140 billion by 2011, amounting to a total sum of $3.2 trillion over the 50-year period 1961-2011. Projecting the monetary value of this positive externality forward in time reveals it will likely bestow an additional $9.8 trillion on crop production between now and 2050. The incorporation of these findings into future SCC studies will help to ensure a more realistic assessment of the total net economic impact of rising atmospheric CO2 concentrations due to both negative and positive externalities. Furthermore, the observationally-deduced benefits of atmospheric CO2 enrichment on crop production should be given premier weighting over the speculative negative externalities that are projected to occur as a result of computer model computations of CO2-induced global warming. Until this is done, little if any weight should be placed on current SCC calculations.

P a g e | 4
Center for the Study of Carbon Dioxide and Global Change © 2013, www.co2science.org.
INTRODUCTION Advancements in technology and scientific expertise since the birth of the Industrial Revolution have led to vast improvements in agricultural yield and production values. More efficient machinery and improved plant cultivars, for example, paved the way toward higher crop yields and increased global food production. And with the ever-increasing population of the planet, the increase in food production was a welcome societal benefit. But what remained largely unknown to society at that time, was the birth of an ancillary aid to agriculture that would confer great benefits upon future inhabitants of the globe throughout the decades and centuries to come. And the source of that aid: atmospheric carbon dioxide (CO2). Ironically, however, the modern rise of the air’s CO2 content is currently viewed by many as a source of concern, not a benefit. Driven primarily by gaseous emissions produced from the burning of fossil fuels such as coal, gas and oil, the air’s CO2 content has risen steadily from a mean concentration of about 280 parts per million (ppm) at the onset of the Industrial Revolution in 1800 to a value of approximately 393 ppm today; and if current fuel consumption trends continue, the planet’s atmospheric CO2 concentration could reach upwards of 700 ppm by the end of this century. One of the more publicized potential consequences of this rise in the air’s CO2 content is the possibility of significant CO2-induced global warming, which according to proponents of this hypothesis constitutes the greatest environmental threat ever to be faced by the biosphere. Predicting many adverse consequences for human health, ecosystems and the economies of nations, its supporters contend that augmented atmospheric CO2 concentrations will alter important energy transfer processes in the Earth-ocean-atmosphere system, leading to warmer global temperatures, devastating heat waves, melting of substantial portions of the polar ice caps, rising sea levels, crop-decimating droughts, as well as a host of other climate- and extreme-weather-related maladies. Against this backdrop of projected negative externalities, economists and policy makers have sought to estimate the monetary damages of rising atmospheric CO2. Such calculations, termed the social cost of carbon (SCC), are often used in evaluating the CO2 impact of government rulemakings. They are also used as justification for fostering rules and regulations aimed at reducing CO2 emissions. In May of 2013, for example, eleven U.S. government agencies comprising the Interagency Working Group on Social Cost of Carbon collaborated to produce a technical document “to allow agencies to incorporate the social benefits of reducing carbon dioxide (CO2) emissions into cost-benefit analyses of regulatory actions that impact cumulative global emissions” (Interagency Working Group on Social Cost of Carbon, 2013). Absent (or severely underrated) in nearly all SCC analyses, however, is the recognition and incorporation of important CO2-induced benefits, such as improvements in human health and increases in crop production. With respect to human health, several studies have shown that
P a g e | 5
Center for the Study of Carbon Dioxide and Global Change © 2013, www.co2science.org.
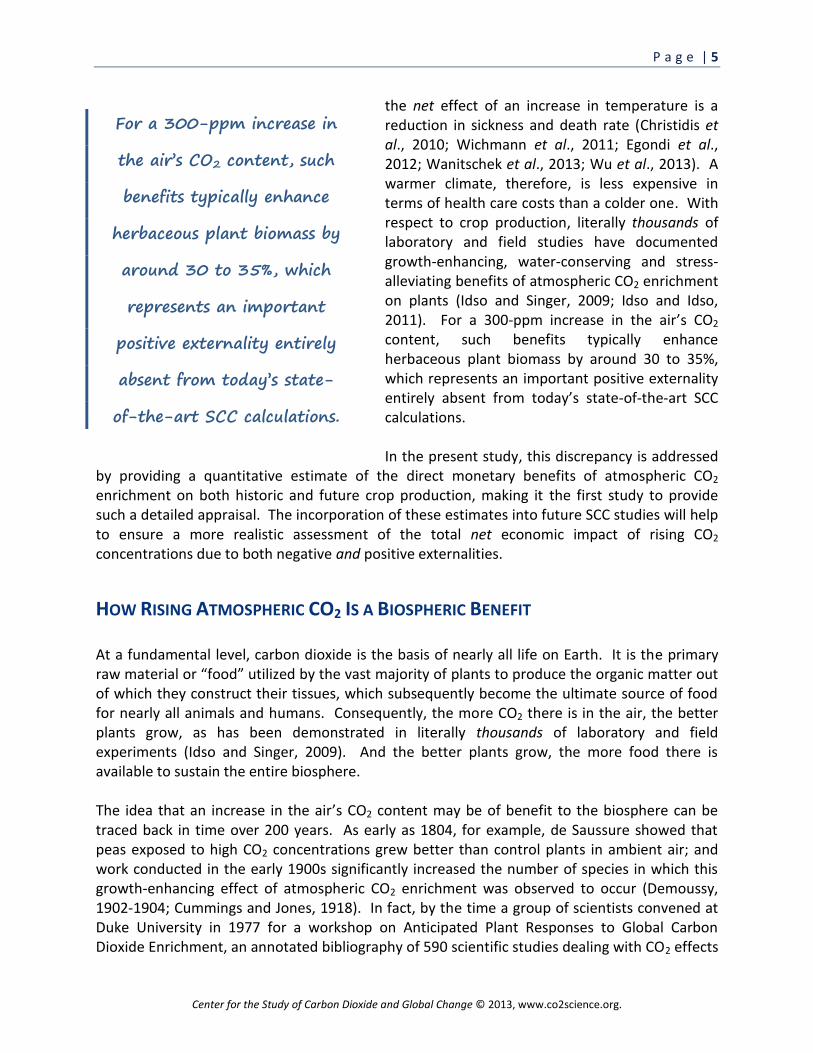
the net effect of an increase in temperature is a reduction in sickness and death rate (Christidis et al., 2010; Wichmann et al., 2011; Egondi et al., 2012; Wanitschek et al., 2013; Wu et al., 2013). A warmer climate, therefore, is less expensive in terms of health care costs than a colder one. With respect to crop production, literally thousands of laboratory and field studies have documented growth-enhancing, water-conserving and stress-alleviating benefits of atmospheric CO2 enrichment on plants (Idso and Singer, 2009; Idso and Idso, 2011). For a 300-ppm increase in the air’s CO2 content, such benefits typically enhance herbaceous plant biomass by around 30 to 35%, which represents an important positive externality entirely absent from today’s state-of-the-art SCC calculations. In the present study, this discrepancy is addressed
by providing a quantitative estimate of the direct monetary benefits of atmospheric CO2 enrichment on both historic and future crop production, making it the first study to provide such a detailed appraisal. The incorporation of these estimates into future SCC studies will help to ensure a more realistic assessment of the total net economic impact of rising CO2 concentrations due to both negative and positive externalities.
HOW RISING ATMOSPHERIC CO2 IS A BIOSPHERIC BENEFIT At a fundamental level, carbon dioxide is the basis of nearly all life on Earth. It is the primary raw material or “food” utilized by the vast majority of plants to produce the organic matter out of which they construct their tissues, which subsequently become the ultimate source of food for nearly all animals and humans. Consequently, the more CO2 there is in the air, the better plants grow, as has been demonstrated in literally thousands of laboratory and field experiments (Idso and Singer, 2009). And the better plants grow, the more food there is available to sustain the entire biosphere. The idea that an increase in the air’s CO2 content may be of benefit to the biosphere can be traced back in time over 200 years. As early as 1804, for example, de Saussure showed that peas exposed to high CO2 concentrations grew better than control plants in ambient air; and work conducted in the early 1900s significantly increased the number of species in which this growth-enhancing effect of atmospheric CO2 enrichment was observed to occur (Demoussy, 1902-1904; Cummings and Jones, 1918). In fact, by the time a group of scientists convened at Duke University in 1977 for a workshop on Anticipated Plant Responses to Global Carbon Dioxide Enrichment, an annotated bibliography of 590 scientific studies dealing with CO2 effects
For a 300-ppm increase in
the air’s CO2 content, such
benefits typically enhance
herbaceous plant biomass by
around 30 to 35%, which
represents an important
positive externality entirely
absent from today’s state-
of-the-art SCC calculations.

P a g e | 6
Center for the Study of Carbon Dioxide and Global Change © 2013, www.co2science.org.
on vegetation had been prepared (Strain, 1978). This body of research demonstrated that increased levels of atmospheric CO2 generally produce increases in plant photosynthesis, decreases in plant water loss by transpiration, increases in leaf area, and increases in plant branch and fruit numbers, to name but a few of the most commonly reported benefits. And five years later, at the International Conference on Rising Atmospheric Carbon Dioxide and Plant Productivity, it was concluded that a doubling of the air’s CO2 concentration would likely lead to a 50% increase in photosynthesis in C3 plants, a doubling of water use efficiency in both C3 and C4 plants, significant increases in biological nitrogen fixation in almost all biological systems, and an increase in the ability of plants to adapt to a variety of environmental stresses (Lemon, 1983). Numerous studies conducted on hundreds of different plant species testify to the very real and measurable growth-enhancing, water-saving, and stress-alleviating advantages that elevated atmospheric CO2 concentrations bestow upon Earth’s plants (Idso and Singer, 2009; Idso and Idso, 2011). In commenting on these and many other CO2-related benefits, Wittwer (1982) wrote that “the ‘green revolution’ has coincided with the period of recorded rapid increase in concentration of atmospheric carbon dioxide, and it seems likely that some credit for the improved [crop] yields should be laid at the door of the CO2 buildup.” Similarly, Allen et al. (1987) concluded that yields of soybeans may have been rising since at least 1800 “due to global carbon dioxide increases,” while more recently, Cunniff et al. (2008) hypothesized that the rise in atmospheric CO2 following deglaciation of the most recent planetary ice age, was the trigger that launched the global agricultural enterprise. In a test of this hypothesis, Cunniff et al. designed “a controlled environment experiment using five modern-day representatives of wild C4 crop progenitors, all ‘founder crops’ from a variety of independent centers,” which were grown individually in growth chambers maintained at atmospheric CO2 concentrations of 180, 280 and 380 ppm, characteristic of glacial, post-glacial and modern times, respectively. The results revealed that the 100-ppm increase in CO2 from glacial to postglacial levels (180 to 280 ppm) “caused a significant gain in vegetative biomass of up to 40%,” together with “a reduction in the transpiration rate via decreases in stomatal conductance of ~35%,” which led to “a 70% increase in water use efficiency, and a much greater productivity potential in water-limited conditions.” In discussing their results, the five researchers concluded that “these key physiological changes could have greatly enhanced the productivity of wild crop progenitors after deglaciation ... improving the productivity and survival of these wild C4 crop progenitors in early agricultural
And as the CO2
concentration of the air
continues to rise in the
future, this positive
externality of enhanced crop
production will benefit
society in the years, decades,
and even centuries to come.

P a g e | 7
Center for the Study of Carbon Dioxide and Global Change © 2013, www.co2science.org.
systems.” And in this regard, they note that “the lowered water requirements of C4 crop progenitors under increased CO2 would have been particularly beneficial in the arid climatic regions where these plants were domesticated.” For comparative purposes, they also included one C3 species in their study – Hordeum spontaneum K. Koch – and they report that it “showed a near-doubling in biomass compared with [the] 40% increase in the C4 species under growth treatments equivalent to the postglacial CO2 rise.” In light of these and other similar findings (Mayeux et al., 1997), it can be appreciated that the civilizations of the past, which could not have existed without agriculture, were largely made possible by the increase in the air’s CO2 content that accompanied deglaciation, and that the peoples of the Earth today are likewise indebted to this phenomenon, as well as the additional 110 ppm of CO2 the atmosphere has subsequently acquired. And as the CO2 concentration of the air continues to rise in the future, this positive externality of enhanced crop production will benefit society in the years, decades, and even centuries to come.
DATA In order to calculate the monetary benefit of rising atmospheric CO2 concentrations on historic crop production, a number of different data sets were required. From the United Nations’ Food and Agriculture Organization (FAO), annual global crop yield and production data were obtained, as well as the monetary value associated with that production (FAO, 2013). These data sources are published in the FAO’s statistical database FAOSTAT, which is available online at http://faostat.fao.org/site/567/default.aspx#ancor. For the world as a whole, FAOSTAT contains data on these agricultural parameters for over 160 different crops that have been grown and used by humanity since 1961. No data are available prior to that time, so the temporal scope of this analysis was limited to the 50-year time window of 1961-2011. In addition, because more than half of the crops in the database each account for less than 0.1% of the world’s total food production, it was deemed both prudent and adequate to further constrain this analysis to focus on only those crops that accounted for the top 95% of global food production. This was accomplished by taking the average 1961-2011 production contribution of the most important crop, adding to that the contribution of the second most important crop, and continuing in like manner until 95% of the world’s total food production was reached. The results of these procedures produced the list of 45 crops shown in Table 1.

P a g e | 8
Center for the Study of Carbon Dioxide and Global Change © 2013, www.co2science.org.
Table 1. The forty-five crops that supplied 95% of the total world food production over the period 1961-2011.
Crop % of Total Production Crop % of Total ProductionSugar cane 20.492 Rye 0.556
Wheat 10.072 Plantains 0.528
Maize 9.971 Yams 0.523
Rice, paddy 9.715 Groundnuts, with shell 0.518
Potatoes 6.154 Rapeseed 0.494
Sugar beet 5.335 Cucumbers and gherkins 0.492
Cassava 3.040 Mangoes, mangosteens, guavas 0.406
Barley 2.989 Sunflower seed 0.398
Vegetables fresh nes 2.901 Eggplants (aubergines) 0.340
Sweet potatoes 2.638 Beans, dry 0.331
Soybeans 2.349 Fruit Fresh Nes 0.321
Tomatoes 1.571 Carrots and turnips 0.320
Grapes 1.260 Other melons (inc.cantaloupes) 0.302
Sorghum 1.255 Chillies and peppers, green 0.274
Bananas 1.052 Tangerines, mandarins, clem. 0.264
Watermelons 0.950 Lettuce and chicory 0.262
Oranges 0.935 Pumpkins, squash and gourds 0.248
Cabbages and other brassicas 0.903 Pears 0.243
Apples 0.886 Olives 0.241
Coconuts 0.843 Pineapples 0.230
Oats 0.810 Fruit, tropical fresh nes 0.230
Onions, dry 0.731 Peas, dry 0.228
Millet 0.593
Sum of All Crops = 95.2%
Other data needed to conduct the analysis were annual global atmospheric CO2 values since 1961 and plant-specific CO2 growth response factors. The annual global CO2 data were obtained from the most recent United Nations Intergovernmental Panel on Climate Change report, Annex II: Climate System Scenario Tables - Final Draft Underlying Scientific-Technical Assessment (IPCC, 2013). The plant-specific CO2 growth response factors – which represent the percent growth enhancement expected for each crop listed in Table 1 in response to a known rise in atmospheric CO2 – were acquired from the online Plant Growth Database of CO2 Science (Center for the Study of Carbon Dioxide and Global Change, 2013). Located on the Internet at http://www.co2science.org/data/plant_growth/plantgrowth.php, the CO2 Science Plant Growth Database lists the results of thousands of CO2 enrichment experiments conducted on hundreds of different crops growing under varying environmental conditions over the past few decades. This database was used to calculate the mean crop growth response to a 300-ppm increase in atmospheric CO2 concentration for each crop listed in Table 1. For some crops, however, there were no CO2 enrichment data contained in the database; and in those cases the mean responses of similar plants, or groups of plants, were utilized. Also, there were some instances where the plant category in the FAO database represented more than one plant in the CO2 Science Plant Growth Database. For example, the designation Oranges represents a single FAO crop category in the FAO database, yet there were
P a g e | 9
Center for the Study of Carbon Dioxide and Global Change © 2013, www.co2science.org.
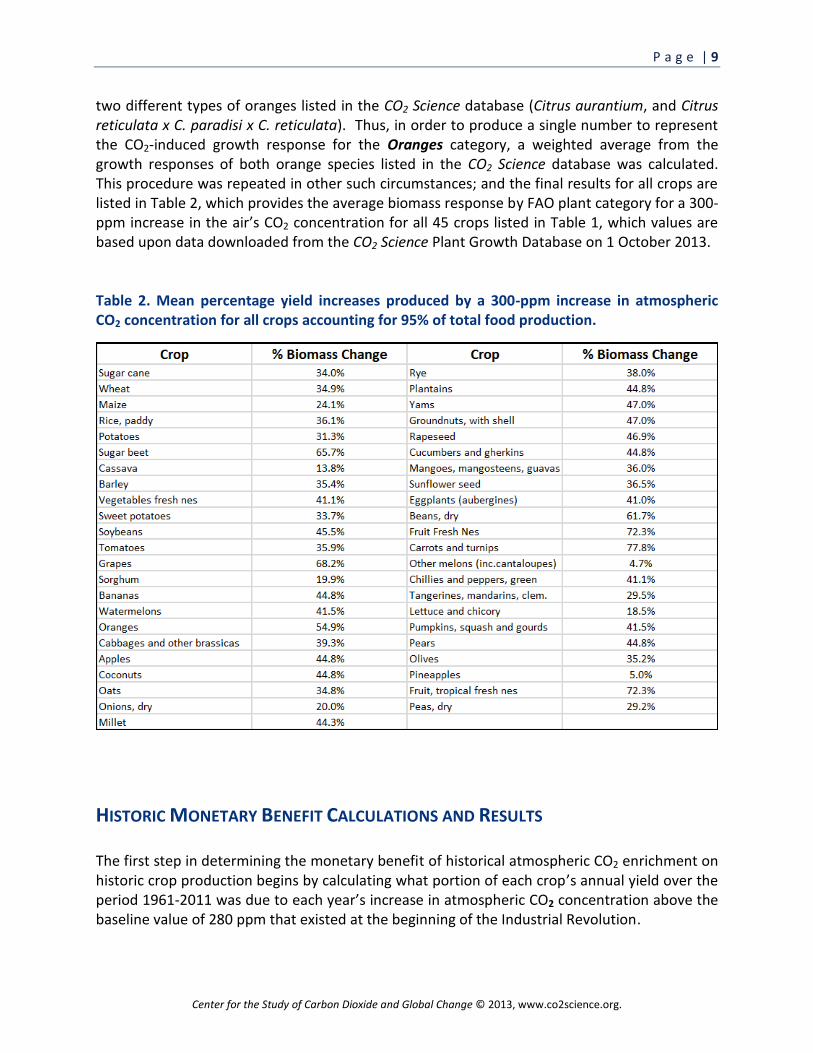
two different types of oranges listed in the CO2 Science database (Citrus aurantium, and Citrus reticulata x C. paradisi x C. reticulata). Thus, in order to produce a single number to represent the CO2-induced growth response for the Oranges category, a weighted average from the growth responses of both orange species listed in the CO2 Science database was calculated. This procedure was repeated in other such circumstances; and the final results for all crops are listed in Table 2, which provides the average biomass response by FAO plant category for a 300-ppm increase in the air’s CO2 concentration for all 45 crops listed in Table 1, which values are based upon data downloaded from the CO2 Science Plant Growth Database on 1 October 2013. Table 2. Mean percentage yield increases produced by a 300-ppm increase in atmospheric CO2 concentration for all crops accounting for 95% of total food production.
HISTORIC MONETARY BENEFIT CALCULATIONS AND RESULTS The first step in determining the monetary benefit of historical atmospheric CO2 enrichment on historic crop production begins by calculating what portion of each crop’s annual yield over the period 1961-2011 was due to each year’s increase in atmospheric CO2 concentration above the baseline value of 280 ppm that existed at the beginning of the Industrial Revolution.
P a g e | 10
Center for the Study of Carbon Dioxide and Global Change © 2013, www.co2science.org.
Illustrating this process for wheat, in 1961 the global yield of wheat from the FAOSTAT database was 10,889 hectograms per hectare (Hg/Ha), the atmospheric CO2 concentration was 317.4 ppm, representing an increase of 37.4 ppm above the 280-ppm baseline, while the CO2 growth response factor for wheat as listed in Table 2 is 34.9% for a 300-ppm increase in CO2. To determine the impact of the 37.4 ppm rise in atmospheric CO2 on 1961 wheat yields, the wheat-specific CO2 growth response factor of 34.9% per 300 ppm CO2 increase (mathematically written as 34.9%/300 ppm) is multiplied by the 37.4 ppm increase in CO2 that has occurred since the Industrial Revolution. The resultant value of 4.35% indicates the degree by which the 1961 yield was enhanced above the baseline yield value corresponding to an atmospheric CO2 concentration of 280 ppm. The 1961 yield is then divided by this relative increase (1.0435) to determine the baseline yield in Hg/Ha (10,889/1.0435 = 10,435). The resultant baseline yield amount of 10,435 Hg/Ha is subtracted from the 1961 yield total of 10,889 Hg/Ha, revealing that 454 Hg/Ha of the 1961 yield was due to the 37.4 ppm rise in CO2 since the start of the Industrial Revolution. Similar calculations are then made for each of the remaining years in the 50-year period, as well as for each of the 44 remaining crops accounting for 95% of global food production. The next step is to determine what percentage of the total annual yield of each crop in each year was due to CO2. This was accomplished by simply taking the results calculated in the previous step and dividing them by the corresponding total annual yields. For example, using the calculations for wheat from above, the 454 Hg/Ha yield due to CO2 in 1961 was divided by the total 10,889 Hg/Ha wheat yield for that year, revealing that 4.17% of the total wheat yield in 1961 was due to the historical rise in atmospheric CO2. Again, such percentage calculations were completed for all crops for each year in the 50-year period 1961-2011. Knowing the annual percentage influences of CO2 on all crop yields (production per Ha), the next step is to determine how that influence is manifested in total crop production value. This was accomplished by multiplying the CO2-induced yield percentage increases by the corresponding annual production of each crop, and by then multiplying these data by the gross production value (in constant 2004-2006 U.S. dollars) of each crop per metric ton, which data were obtained from the FAOSTAT database, the end result of which calculations becomes an estimate of the annual monetary benefit of atmospheric CO2 enrichment (above the baseline of 280 ppm) on crop production since 1961. And these monetary values are presented for each of the 45 crops under examination in Table 3.

P a g e | 11
Center for the Study of Carbon Dioxide and Global Change © 2013, www.co2science.org.
Table 3. The total monetary benefit of Earth’s rising atmospheric CO2 concentration on each of the forty-five crops listed in Table 1 for the 50-year period 1961-2011. Values are in constant 2004-2006 U.S. dollars.
As can be seen from Table 3, the financial benefit of Earth’s rising atmospheric CO2 concentration on global food production is enormous. Such benefits over the period 1961-2011 have amounted to at least $1 billion for each of the 45 crops examined; and for nine of the crops the monetary increase due to CO2 over this period is well over $100 billion. The largest of these benefits is noted for rice, wheat and grapes, which saw increases of $579 billion, $274 billion and $270 billion, respectively. Another interesting aspect of these calculations can be seen in Figure 1, which shows the annual total monetary value of the CO2 benefit for all 45 crops over the 50-year period from 1961-2011. As seen there, the annual value of the CO2 benefit has increased over time. Whereas it amounted to approximately $18.5 billion in 1961, by the end of the record it had grown to over $140 billion annually. And in summing these annual benefits across the entire 50-year time period, the total CO2-induced benefit on global food production since 1961 amounts to $3.2 trillion.

P a g e | 12
Center for the Study of Carbon Dioxide and Global Change © 2013, www.co2science.org.
y = 0.0000x80.7557
R² = 0.9988
$0
$20
$40
$60
$80
$100
$120
$140
$160
1950 1960 1970 1980 1990 2000 2010 2020
Bill
ion
s o
f U
.S. D
olla
rs
Year
Figure 1. The total annual monetary value of the direct CO2 benefit on crop production for all 45 crops studied over the 50-year period from 1961-2011.
FUTURE MONETARY BENEFIT CALCULATIONS AND RESULTS The method of estimating future monetary benefits of rising atmospheric CO2 concentrations on crop production were slightly different from those used in calculating the historic values of the previous section. In explaining these methods, sugar cane will serve as the example. First, the 1961-2011 historic yield data for sugar cane are plotted as the solid blue line in Figure 2. Next, that portion of each year’s annual yield that was due to rising carbon dioxide, as per calculations described in the prior section (the solid green line), was subtracted out. The resultant values are depicted as the solid red line in Figure 2. These yield values represent the net effect of everything else that tended to influence crop yield over that time period. Although many factors play a role in determining the magnitude of this latter effect, it is referred to here as the techno-intel effect, as it derives primarily from continuing advancements in agricultural technology and scientific research that expand our knowledge or intelligence base.

P a g e | 13
Center for the Study of Carbon Dioxide and Global Change © 2013, www.co2science.org.
0
100,000
200,000
300,000
400,000
500,000
600,000
700,000
800,000
1950 1960 1970 1980 1990 2000 2010 2020
Suga
r C
ane
Yie
ld (
Hg/
Ha)
Year
Total Yield
Techno-Intel Yield
CO2 Yield
Figure 2. Plot of the total yield of sugar cane over the period 1961-2011 (blue line), along with plots of that portion of the total yield attributed to advancements in agricultural technology and scientific research (the techno-intel effect, red line) and productivity increases from rising atmospheric CO2 concentrations (green line).
The difference between the techno-intel line and the observed yield line above it represents the annual yield contribution due to rising atmospheric CO2, which difference is also plotted in Figure 2 as the solid green line. As depicted there, the relative influence of atmospheric CO2 on the total yield of sugar cane is increasing with time. This fact is further borne out in Figure 3, where techno-intel yield values are plotted as a percentage of total sugar cane yield. Whereas the influence of technology and intelligence accounted for approximately 96% of the observed yield values in the early 1960s, by the end of record in 2011 it accounted for only 89%.

P a g e | 14
Center for the Study of Carbon Dioxide and Global Change © 2013, www.co2science.org.
0.50
0.60
0.70
0.80
0.90
1.00
1950 1960 1970 1980 1990 2000 2010 2020
Pe
rce
nt
Year
The Techno-Intel Effect as a Percent of Total Yield for Sugar Cane
Figure 3. The percentage of the total annual yield of sugar cane over the period 1961-2011 that is attributed to the techno-intel effect.
Focusing on the future, the 1961-2011 linear trend of the techno-intel yield line is next projected forward to the year 2050. Depicted as the dashed red line in Figure 4, this line represents the best estimate that can be made of the effect of technology and innovation on future sugar cane crop yields. Following this step, a second-order polynomial has been fitted to the data depicted in Figure 3, and this relationship is projected forward in time (Figure 5) to obtain an estimate of the annual contribution of the techno-intel effect on the total yield through 2050. Next, the total yield for each year between 2012 and 2050 can be calculated by dividing the linear projection of the techno-intel line in Figure 4 (dashed red line) by the corresponding yearly forecasted percentage contribution of the techo-intel line to the total yield, as depicted by the polynomial projection fit to the data and extended through 2050 in Figure 5. These resultant values, plotted in Figure 4 as the dashed blue line, provide an estimate of the total annual crop yield from 2012 through 2050. By knowing the annual total yield, as well as the portion of the annual total yield that is due to the techno-intel effect between 2012 and 2050, the part of the total yield that is due to CO2 can be calculated by

P a g e | 15
Center for the Study of Carbon Dioxide and Global Change © 2013, www.co2science.org.
subtracting the difference between them. These values are also plotted in Figure 4 as the dashed green line.
0
200,000
400,000
600,000
800,000
1,000,000
1,200,000
1950 1960 1970 1980 1990 2000 2010 2020 2030 2040 2050 2060
Suga
r C
ane
Yie
ld (
Hg/
Ha)
Year
Total Yield
Future Total Yield
Techno-Intel Yield
Future Techno-Intel Yield
CO2 Yield
Future CO2 Yield
Figure 4. Same as Figure 2, but with the added projections of the total yield and the portion of the total yield due to the techno-intel and CO2 effects estimated for the period 2012-2050 (dashed blue, red, and green lines, respectively).

P a g e | 16
Center for the Study of Carbon Dioxide and Global Change © 2013, www.co2science.org.
y = -0.000009x2 + 0.034316x - 31.706818R² = 0.998970
0.50
0.60
0.70
0.80
0.90
1.00
1950 1960 1970 1980 1990 2000 2010 2020 2030 2040 2050 2060
Pe
rce
nt
Year
The Techno-Intel Effect as a Percent of Total Yield for Sugar Cane
Figure 5. Same as Figure 3, but with a second order polynomial equation fit to the 1961-2011 data, projecting the data forward through 2050.
In order to apply the future estimates of the CO2 influence on crop yields to future estimates of crop production, linear trends in each of the 45 crops’ 1961-2011 production data were next extended forward in time to provide projections of annual production values through 2050. As with the historic calculations discussed in the previous section, these production values were multiplied by the corresponding annual percentage influence of CO2 on 2012-2050 projected crop yields. The resultant values were then multiplied by an estimated gross production value (in constant 2004-2006 U.S. dollars) for each crop per metric ton. And as there are several potential unknowns that may influence the future production value assigned to each crop, a simple 50-year average of the observed gross production values was applied over the period 1961-2011. The ensuing monetary values for each of the 45 crops over the 2012 through 2050 period are listed in Table 4.
P a g e | 17
Center for the Study of Carbon Dioxide and Global Change © 2013, www.co2science.org.
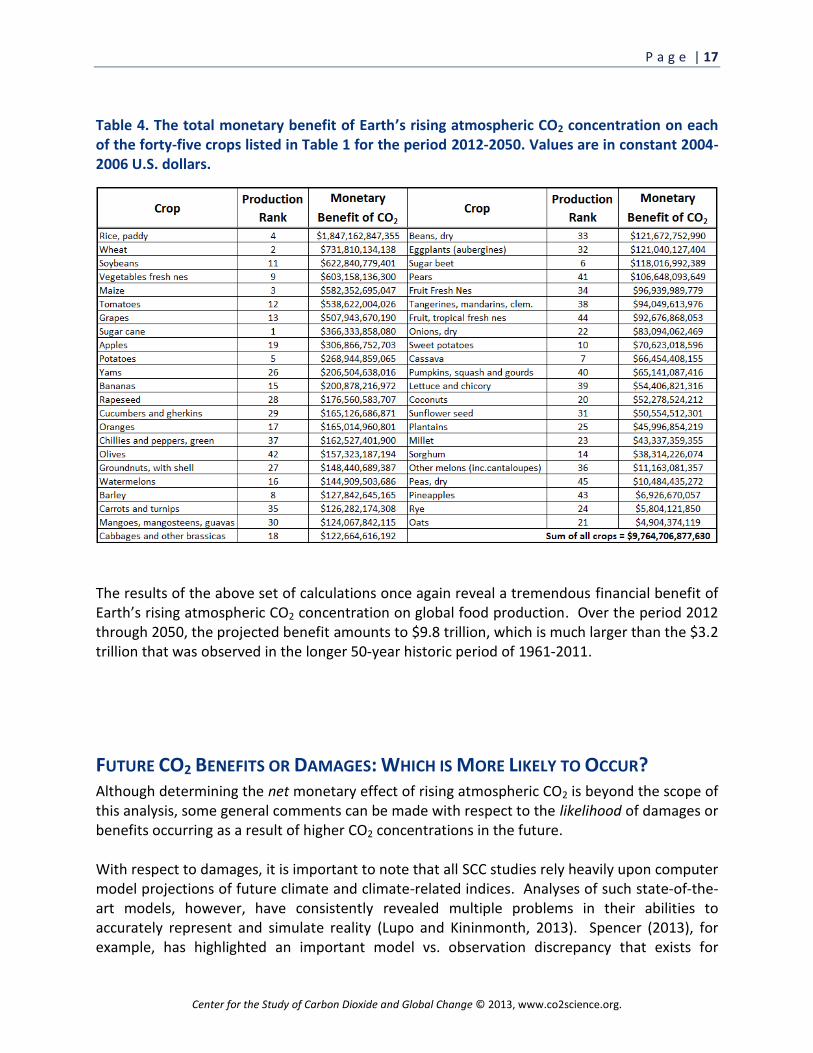
Table 4. The total monetary benefit of Earth’s rising atmospheric CO2 concentration on each of the forty-five crops listed in Table 1 for the period 2012-2050. Values are in constant 2004-2006 U.S. dollars.
The results of the above set of calculations once again reveal a tremendous financial benefit of Earth’s rising atmospheric CO2 concentration on global food production. Over the period 2012 through 2050, the projected benefit amounts to $9.8 trillion, which is much larger than the $3.2 trillion that was observed in the longer 50-year historic period of 1961-2011.
FUTURE CO2 BENEFITS OR DAMAGES: WHICH IS MORE LIKELY TO OCCUR? Although determining the net monetary effect of rising atmospheric CO2 is beyond the scope of this analysis, some general comments can be made with respect to the likelihood of damages or benefits occurring as a result of higher CO2 concentrations in the future. With respect to damages, it is important to note that all SCC studies rely heavily upon computer model projections of future climate and climate-related indices. Analyses of such state-of-the-art models, however, have consistently revealed multiple problems in their abilities to accurately represent and simulate reality (Lupo and Kininmonth, 2013). Spencer (2013), for example, has highlighted an important model vs. observation discrepancy that exists for
P a g e | 18
Center for the Study of Carbon Dioxide and Global Change © 2013, www.co2science.org.
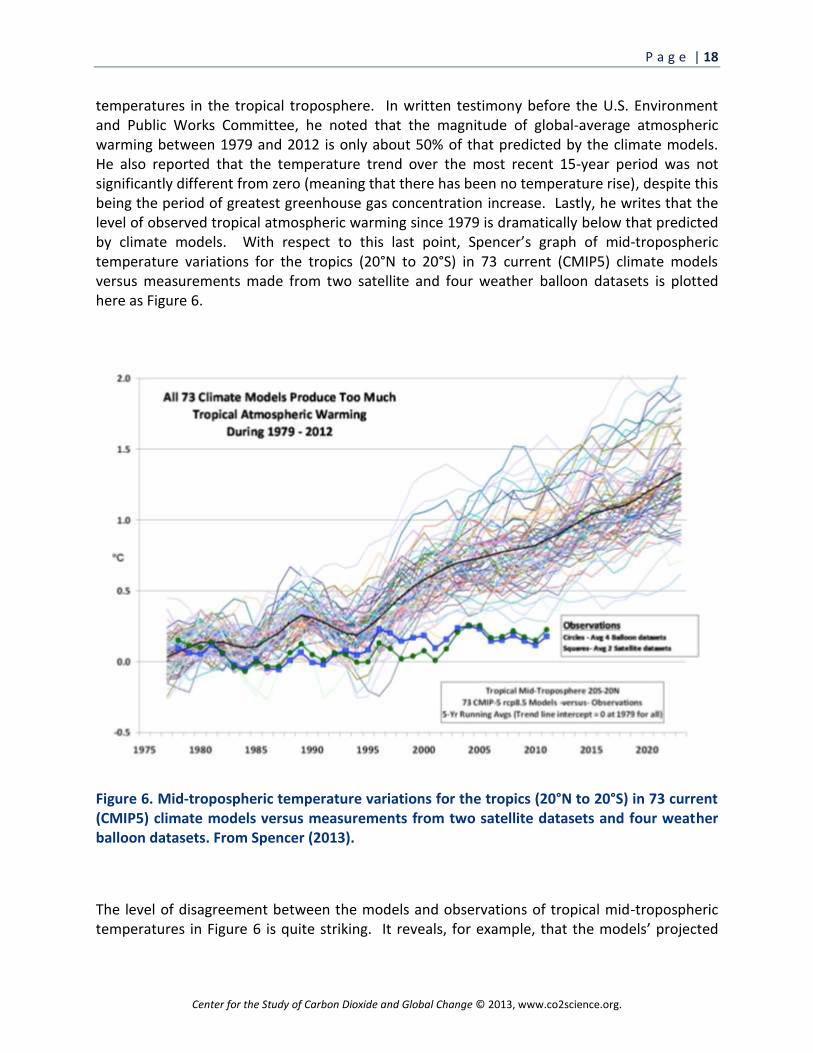
temperatures in the tropical troposphere. In written testimony before the U.S. Environment and Public Works Committee, he noted that the magnitude of global-average atmospheric warming between 1979 and 2012 is only about 50% of that predicted by the climate models. He also reported that the temperature trend over the most recent 15-year period was not significantly different from zero (meaning that there has been no temperature rise), despite this being the period of greatest greenhouse gas concentration increase. Lastly, he writes that the level of observed tropical atmospheric warming since 1979 is dramatically below that predicted by climate models. With respect to this last point, Spencer’s graph of mid-tropospheric temperature variations for the tropics (20°N to 20°S) in 73 current (CMIP5) climate models versus measurements made from two satellite and four weather balloon datasets is plotted here as Figure 6.
Figure 6. Mid-tropospheric temperature variations for the tropics (20°N to 20°S) in 73 current (CMIP5) climate models versus measurements from two satellite datasets and four weather balloon datasets. From Spencer (2013).
The level of disagreement between the models and observations of tropical mid-tropospheric temperatures in Figure 6 is quite striking. It reveals, for example, that the models’ projected

P a g e | 19
Center for the Study of Carbon Dioxide and Global Change © 2013, www.co2science.org.
average values are 0.5°C higher than observations at the end of the record. Although these data are restricted to the tropics (from 20°N to 20°S), Spencer notes that “this is where almost 50% of the solar energy absorbed by the Earth enters the climate system.” In concluding his discussion of the topic, Spencer candidly writes:
It is time for scientists to entertain the possibility that there is something wrong with the assumptions built into their climate models. The fact that all of the models have been peer reviewed does not mean that any of them have been deemed to have any skill for predicting future temperatures. In the parlance of the Daubert standard for rules of scientific evidence, the models have not been successfully field tested for predicting climate change, and so far their error rate should preclude their use for predicting future climate change (Harlow & Spencer, 2011).
The sensitivity of temperature to carbon dioxide, which is the amount of total warming for a nominal doubling of atmospheric carbon dioxide, is the core parameter that ultimately drives climate model temperature projections. The magnitude of this parameter used in the models is likely the reason for their overestimation of recent (and likely future projections of) temperature observations. Although most models incorporate a mean sensitivity of 3.4°C (range of 2.1 to 4.7°C), several recent studies indicate the true sensitivity is much lower (Annan and Hargreaves, 2011; Lindzen and Choi, 2011; Schmittner et al., 2011; Aldrin et al., 2012; Hargreaves et al., 2012; Ring et al., 2012; van Hateren, 2012; Lewis, 2013; Masters, 2013; Otto et al., 2013). And until such problems are resolved, SCC damage estimates relying on future temperature projections should be considered to be significantly inflated. A somewhat related problem with SCC calculations is their inclusion of costs due to sea level rise. Here, it is presumed that rising temperatures from CO2-induced global warming will result in an acceleration of sea level rise that will bring on a host of economic damages. There are two problems with this projection. First, temperatures are not rising in the manner or degree projected by the models. Second, observations reveal no acceleration of sea level rise over the past century. In fact, just the opposite appears to be occurring in nature. Holgate (2007), for example, derived a mean global sea level history over the period 1904-2003. According to their calculations, the mean rate of global sea level rise was “larger in the early part of the last century (2.03 ± 0.35 mm/year 1904-1953), in comparison with the latter part (1.45 ± 0.34 mm/year 1954-2003).” In other words, contrary to model projections, the mean rate of global sea level rise (SLR) has not accelerated over the recent past. If anything, it’s done just the opposite. Such observations are striking, especially considering they have occurred over a period of time when many have claimed that (1) the Earth warmed to a degree that is unprecedented over many millennia, (2) the warming resulted in a net accelerated melting of the vast majority of the world’s mountain glaciers and polar ice caps, and (3) global sea level rose at an ever increasing rate.

P a g e | 20
Center for the Study of Carbon Dioxide and Global Change © 2013, www.co2science.org.
In another paper, Boretti (2012) applied simple statistics to the two decades of information contained in the TOPEX and Jason series of satellite radar altimeter data to “better understand if the SLR is accelerating, stable or decelerating.” In doing so, the Australian scientist reports that the rate of SLR is reducing over the measurement period at a rate of -0.11637 mm/year2, and that this deceleration is also “reducing” at a rate of -0.078792 mm/year3 (see Figure 7). And in light of such observations, Boretti writes that the huge deceleration of SLR over the last 10 years “is clearly the opposite of what is being predicted by the models,” and that “the SLR’s reduction is even more pronounced during the last 5 years.” To further illustrate the importance of his findings, he notes that “in order for the prediction of a 100-cm increase in sea level by 2100 to be correct, the SLR must be almost 11 mm/year every year for the next 89 years,” but he notes that “since the SLR is dropping, the predictions become increasingly unlikely,” especially in view of the facts that (1) “not once in the past 20 years has the SLR of 11 mm/year ever been achieved,” and that (2) “the average SLR of 3.1640 mm/year is only 20% of the SLR needed for the prediction of a one meter rise to be correct.”
Figure 7. Comparison of Mean Sea Level (MSL) predictions from Rahmstorf (2007) with measurements from the TOPEX and Jason series. Adapted from Boretti (2012), who states in the figure caption that “the model predictions [of Rahmstorf (2007)] clearly do not agree with the experimental evidence in the short term.”
P a g e | 21
Center for the Study of Carbon Dioxide and Global Change © 2013, www.co2science.org.
The real-world data-based results of Holgate and Boretti, as well as those of other researchers (Morner, 2004; Jevrejeva et al., 2006; Wöppelmann et al., 2009; Houston and Dean, 2011), all suggest that rising atmospheric CO2 emissions are exerting no discernible influence on the rate of sea level rise. Clearly, SCC damages that are based on model projections of a CO2-induced acceleration of SLR must be considered inflated and unlikely to occur. Additional commentary could be supplied with respect to other model-based projections of economic damages resulting from other climate- and extreme weather-related maladies. As reported in the most recent assessment of the Nongovernmental International Panel on Climate Change (Idso et al., 2013), in almost all instances model projections of climate and climate-related catastrophes are not borne out by observational data. Thus, SCC calculations, which are based on (and even necessitated by) the fulfillment of such computer-projected catastrophes, must be considered highly suspect and overinflated. In contrast, the monetary benefits of rising carbon dioxide, calculated to accrue to global crop production in previous sections of this report, are far more certain to occur, because they are based on hundreds of laboratory and field observations. It should also be noted that the benefit calculations reported here, although truly remarkable, may yet be found to be conservative. Recognizing these positive impacts of rising CO2 concentrations, some researchers have begun to explore ways in which to maximize the influence of atmospheric CO2 on crop yields even more. Much of these efforts are devoted to identifying “super” hybrid cultivars that can “further break the yield ceiling” presently observed in many crops (Yang et al., 2009). De Costa et al. (2007), for example, grew 16 genotypes of rice (Oryza sativa L.) under standard lowland paddy culture with adequate water and nutrients within open-top chambers maintained at either the ambient atmospheric CO2 concentration (370 ppm) or at an elevated CO2 concentration (570 ppm). Their results indicated that the CO2-induced enhancement of the light-saturated net photosynthetic rates of the 16 different genotypes during the grain-filling period of growth ranged from +2% to +185% in the yala season (May to August) and from +22% to +320% in the maha season (November to March). Likewise, they found that the CO2-induced enhancement of the grain yields of the 16 different genotypes ranged from +4% to +175% in the yala season and from -5% to +64% in the maha season. In commenting on their findings, the five Sri Lanka researchers say their results “demonstrate the significant genotypic variation that exists within the rice germplasm, in the response to increased atmospheric CO2 of yield and its correlated physiological parameters,” and they go on to suggest that “the significant genotypic variation in this response means that genotypes that are highly responsive to elevated CO2 may be selected and incorporated into breeding programs to produce new rice varieties which would be higher yielding in a future high CO2 climate.” Selecting such genotypes, as per the results experienced in the De Costa et al. study, has the potential to increase the CO2 monetary benefit per ton of rice by a factor of 4 or more! Atmospheric CO2 enrichment also tends to enhance growth and improve plant functions in the face of environmental constraints. Conway and Toenniessen (2003), for example, describe how ameliorating four such impediments to plant productivity – soil infertility, weeds, insects and
P a g e | 22
Center for the Study of Carbon Dioxide and Global Change © 2013, www.co2science.org.
diseases, and drought – significantly boosts crop yields. Therefore, reducing the negative consequences of each of these yield-reducing factors via human ingenuity should boost crop productivity in an additive manner. And a continuation of the historical increase in the air’s CO2 content should boost crop productivity even more. In the case of soil infertility, many experiments have demonstrated that even when important nutrients are present in the soil in less than optimal amounts, enriching the air with CO2 still boosts crop yields. With respect to the soil of an African farm where their “genetic and agro-ecological technologies” have been applied, for example, Conway and Toenniessen speak of “a severe lack of phosphorus and shortages of nitrogen.” Yet even in such adverse situations, atmospheric CO2 enrichment has been reported to enhance plant growth (Barrett et al., 1998; Niklaus et al., 1998; Kim et al., 2003; Rogers et al., 2006). And if supplemental fertilization is provided as described by Conway and Toenniessen, even larger CO2-induced benefits above and beyond those provided by the extra nitrogen and phosphorus applied to the soil would likely be realized. In the case of weeds, Conway and Toenniessen speak of one of Africa’s staple crops, maize, being “attacked by the parasitic weed Striga (Striga hermonthica), which sucks nutrients from roots.” This weed also infects many other C4 crops of the semi-arid tropics, such as sorghum, sugar cane and millet, as well as the C3 crop rice, particularly throughout much of Africa, where it is currently one of the region’s most economically important parasitic weeds. Here, too, studies have shown that atmospheric CO2 enrichment greatly reduces the damage done by this devastating weed (Watling and Press, 1997; Watling and Press, 2000). In the case of insects and plant diseases, atmospheric CO2 enrichment also helps prevent crop losses. In a study of diseased tomato plants infected with the fungal pathogen Phytophthora parasitica, which attacks plant roots inducing water stress that decreases yields, for example, the growth-promoting effect of a doubling of the air’s CO2 content completely counterbalanced the yield-reducing effect of the pathogen (Jwa and Walling, 2001). Likewise, in a review of impacts and responses of herbivorous insects maintained for relatively long periods of time in CO2-enriched environments, as described in some 30-plus different studies, Whittaker (1999) noted that insect populations, on average, have been unaffected by the extra CO2. And since plant growth is nearly universally stimulated in air of elevated CO2 concentration, Earth’s crops should therefore gain a relative advantage over herbivorous insects in a high-CO2 world of the future. Lastly, in the case of drought, there is a nearly universal bettering of plant water use efficiency that is induced by atmospheric CO2 enrichment. Fleisher et al. (2008), for example, grew potato plants (Solanum tuberosum cv. Kennebec) from “seed tubers” in soil-plant-atmosphere research chambers maintained at daytime atmospheric CO2 concentrations of either 370 or 740 ppm under well-watered and progressively water-stressed conditions. And in doing so, they found that “total biomass, yield and water use efficiency increased under elevated CO2, with the largest percent increases occurring at irrigations that induced the most water stress.” In addition, they report that “water use efficiency was nearly doubled under enriched CO2 when

P a g e | 23
Center for the Study of Carbon Dioxide and Global Change © 2013, www.co2science.org.
expressed on a tuber fresh weight basis.” These results indicate, in the words of the three researchers, that “increases in potato gas exchange, dry matter production and yield with elevated CO2 are consistent at various levels of water stress as compared with ambient CO2,” providing what we so desperately need in today’s world, and what we will need even more as the world’s population continues to grow: significantly enhanced food production per unit of water used. And there are many other studies that have produced similar results (De Luis et al., 1999; Kyei-Boahen et al., 2003; Kim et al., 2006). The same situation exists with respect to excessive heat, ozone pollution, light stress, soil toxicity and most any other environmental constraint. Atmospheric CO2 enrichment generally tends to enhance growth and improve plant functions to minimize or overcome such challenges (Idso and Singer, 2009; Idso and Idso, 2011). As researchers continue to explore these benefits and farmers select cultivars to maximize them, the monetary value of this positive externality of raising the global CO2 concentration of the atmosphere will surely increase. Considering all of the above, it is thus far more likely to expect the monetary benefits of rising atmospheric CO2 to accrue in the future than it is to expect the accrual of monetary damages.
CONCLUSION It is clear from the material presented in this report that the modern rise in the air’s CO2 content is providing a tremendous economic benefit to global crop production. As Sylvan Wittwer, the father of agricultural research on this topic, so eloquently put it nearly two decades ago: “The rising level of atmospheric CO2 could be the one global natural resource that is progressively increasing food production and total biological output, in a world of otherwise diminishing natural resources of land, water, energy, minerals, and fertilizer. It is a means of inadvertently increasing the productivity of farming systems and other photosynthetically active ecosystems. The effects know no boundaries and both developing and developed countries are, and will be, sharing equally,” for “the rising level of atmospheric CO2 is a universally free premium, gaining in magnitude with time, on which we all can reckon for the foreseeable future” (Wittwer, 1995). The relationship described above by Wittwer is illustrated below in Figure 8, where data pertaining to atmospheric CO2 emissions, food production, and human population are plotted. Standardized to a value of unity in 1961, each of these datasets has experienced rapid and interlinked growth over the past five decades. Rising global population has led to rising CO2 emissions and rising CO2 emissions have benefited food production. The very real positive externality of inadvertent atmospheric CO2 enrichment must be considered in all studies examining the SCC; and its observationally-deduced effects must be given premier weighting over the speculative negative externalities presumed to occur in

P a g e | 24
Center for the Study of Carbon Dioxide and Global Change © 2013, www.co2science.org.
computer model projections of global warming. Until that time, little if any weight should be placed on current SCC calculations.
0.50
1.00
1.50
2.00
2.50
3.00
3.50
4.00
1950 1960 1970 1980 1990 2000 2010 2020
No
rmal
ize
d V
alu
e o
f P
lott
ed
Par
amet
ers
Year
Food Production CO2 Emissions Population
Figure 8. Global population, CO2 emissions, and food production data over the period 1961-2010, normalized to a value of unity at 1961. A data value of 2, therefore, represents a value that is twice the amount reported in 1961. Food production data represent the total production values of the forty-five crops that supplied 95% of the total world food production over the period 1961-2011, as listed in Table 1.
REFERENCES Aldrin, M., Holden, M., Guttorp, P., Skeie, R.B., Myhred, G. and Berntsen, T.K. 2012. Bayesian estimation of climate sensitivity based on a simple climate model fitted to observations of hemispheric temperature and global ocean heat content. Environmetrics 23: 253-271. Allen, L.H., Jr., Boote, K.J., Jones, J.W., Jones, P.H., Valle, R.R., Acock, B., Rogers, H.H. and Dahlman, R.C. 1987. Response of vegetation to rising carbon dioxide: Photosynthesis, biomass, and seed yield of soybean. Global Biogeochemical Cycles 1: 1-14.

P a g e | 25
Center for the Study of Carbon Dioxide and Global Change © 2013, www.co2science.org.
Annan, J.D. and Hargreaves, J.D. 2011. On the generation and interpretation of probabilistic estimates of climate sensitivity. Climatic Change 104: 324-436. Barrett, D.J., Richardson, A.E. and Gifford, R.M. 1998. Elevated atmospheric CO2 concentrations increase wheat root phosphatase activity when growth is limited by phosphorus. Australian Journal of Plant Physiology25: 87-93. Boretti, A.A. 2012. Short term comparison of climate model predictions and satellite altimeter measurements of sea levels. Coastal Engineering 60: 319-322. Center for the Study of Carbon Dioxide and Global Change. 2013. CO2 Science Plant Growth Database, http://www.co2science.org/data/plant_growth/plantgrowth.php. Christidis, N., Donaldson, G.C. and Stott, P.A. 2010. Causes for the recent changes in cold- and heat-related mortality in England and Wales. Climatic Change 102: 539-553. Conway, G. and Toenniessen, G. 2003. Science for African food security. Science 299: 1187-1188. Cummings, M.B. and Jones, C.H. 1918. The Aerial Fertilization of Plants with Carbon Dioxide. Vermont Agricultural Station Bulletin No. 211. Cunniff, J., Osborne, C.P., Ripley, B.S., Charles, M. and Jones, G. 2008. Response of wild C4 crop progenitors to subambient CO2 highlights a possible role in the origin of agriculture. Global Change Biology 14: 576-587. De Costa, W.A.J.M., Weerakoon, W.M.W., Chinthaka, K.G.R., Herath, H.M.L.K. and Abeywardena, R.M.I. 2007. Genotypic variation in the response of rice (Oryza sativa L.) to increased atmospheric carbon dioxide and its physiological basis. Journal of Agronomy & Crop Science 193: 117-130. De Luis, J., Irigoyen, J.J. and Sanchez-Diaz, M. 1999. Elevated CO2 enhances plant growth in droughted N2-fixing alfalfa without improving water stress. Physiologia Plantarum 107: 84-89. Demoussy, E. 1902-1904. Sur la vegetation dans des atmospheres riches en acide carbonique. Comptes Rendus Academy of Science Paris 136: 325-328; 138: 291-293; 139: 883-885. Egondi, T., Kyobutungi, C., Kovats, S., Muindi, K., Ettarh, R. and Rocklov, J. 2012. Time-series analysis of weather and mortality patterns in Nairobi’s informal settlements. Global Health Action 5: 23-31. FAO (Food and Agriculture Organization). 2013. FAO Statistics Database. FAO, Rome, Italy.
P a g e | 26
Center for the Study of Carbon Dioxide and Global Change © 2013, www.co2science.org.
Fleisher, D.H., Timlin, D.J. and Reddy, V.R. 2008. Elevated carbon dioxide and water stress effects on potato canopy gas exchange, water use, and productivity. Agricultural and Forest Meteorology 148: 1109-1122. Hargreaves, J.C., Annan, J.D., Yoshimori, M. and Abe-Ouchi, A. 2012. Can the Last Glacial Maximum constrain climate sensitivity? Geophysical Research Letters 39: L24702, doi: 10.1029/
2012GL053872. Harlow, B.E. and Spencer, R.W. 2011. An Inconvenient burden of proof? CO2 nuisance plaintiffs will face challenges in meeting the Daubert standard. Energy Law Journal 32: 459-496. Holgate, S.J. 2007. On the decadal rates of sea level change during the twentieth century. Geophysical Research Letters 34: 10.1029/2006GL028492. Houston, J.R. and Dean, R.G. 2011. Sea-level acceleration based on U.S. tide gauges and extensions of previous global-gauge analyses. Journal of Coastal Research 27: 409-417. Idso, C.D, Carter R.M., and Singer S.F. 2013. (Eds.) Climate Change Reconsidered II: Physical Science. Chicago, IL: The Heartland Institute. Idso, C.D. and Idso, S.B. 2011. The Many Benefits of Atmospheric CO2 Enrichment. Vales Lake Publishing, LLC, Pueblo West, Colorado, USA. Idso, C.D. and Singer, S.F. 2009. Climate Change Reconsidered: 2009 Report of the Nongovernmental International Panel on Climate Change (NIPCC). The Heartland Institute, Chicago, Illinois, USA. Interagency Working Group on Social Cost of Carbon. 2013. Technical Support Document: Technical Update of the Social Cost of Carbon for Regulatory Impact Analysis Under Executive Order 12866. United States Government, 21 pages, http://www.whitehouse.gov/sites/default/ files/omb/inforeg/social_cost_of_carbon_for_ria_2013_update.pdf. IPCC. 2013. Annex II: Climate System Scenario Tables - Final Draft Underlying Scientific-Technical Assessment. In: Working Group I Contribution to the IPCC Fifth Assessment Report (AR5), Climate Change 2013: The Physical Science Basis. Geneva, Switzerland, 52 pp. Jevrejeva, S., Grinsted, A., Moore, J.C. and Holgate, S. 2006. Nonlinear trends and multiyear cycles in sea level records. Journal of Geophysical Research 111: 10.1029/2005JC003229. Jwa, N.-S. and Walling, L.L. 2001. Influence of elevated CO2 concentration on disease development in tomato. New Phytologist 149: 509-518.

P a g e | 27
Center for the Study of Carbon Dioxide and Global Change © 2013, www.co2science.org.
Kim, H.-Y., Lieffering, M., Kobayashi, K., Okada, M., Mitchell, M.W. and Gumpertz, M. 2003. Effects of free-air CO2 enrichment and nitrogen supply on the yield of temperate paddy rice crops. Field Crops Research 83: 261-270. Kim, S.-H., Sicher, R.C., Bae, H., Gitz, D.C., Baker, J.T., Timlin, D.J. and Reddy, V.R. 2006. Canopy photosynthesis, evapotranspiration, leaf nitrogen, and transcription profiles of maize in response to CO2 enrichment. Global Change Biology 12: 588-600. Kyei-Boahen, S., Astatkie, T., Lada, R., Gordon, R. and Caldwell, C. 2003. Gas exchange of carrot leaves in response to elevated CO2 concentration. Photosynthetica 41: 597-603. Lemon, E.R. (Ed.). 1983. CO2 and Plants: The Response of Plants to Rising Levels of Atmospheric Carbon Dioxide. Westview Press, Boulder, CO. Lewis, N. 2013. An objective Bayesian, improved approach for applying optimal fingerprint techniques to estimate climate sensitivity. Journal of Climate, doi: 10.1175/JCLI-D-12-00473.1. Lindzen, R.S. and Choi, Y.-S. 2011. On the observational determination of climate sensitivity and its implications. Asia-Pacific Journal of Atmospheric Science 47: 377-390. Lupo, A. and Kininmonth, W. 2013. Global climate models and their limitations. In: Climate Change Reconsidered II: Physical Science. C.D. Idso, R.M. Carter and S.F. Singer, (Eds.). Chicago, IL: The Heartland Institute. Masters, T. 2013. Observational estimates of climate sensitivity from changes in the rate of ocean heat uptake and comparison to CMIP5 models. Climate Dynamics, doi:101007/s00382-013-1770-4. Mayeux, H.S., Johnson, H.B., Polley, H.W. and Malone, S.R. 1997. Yield of wheat across a subambient carbon dioxide gradient. Global Change Biology 3: 269-278. Morner, N.-A. 2004. Estimating future sea level changes from past records. Global and Planetary Change 40: 49-54. Niklaus, P.A., Leadley, P.W., Stocklin, J. and Korner, C. 1998. Nutrient relations in calcareous grassland under elevated CO2. Oecologia116: 67-75. Otto, A., Otto, F.E.L., Boucher, O., Church, J., Hegerl, G., Forster, P.M., Gillett, N.P., Gregory, J., Johnson, G.C., Knutti, R., Lewis, N., Lohmann, U., Marotzke, J., Myhre, G., Shindell, D., Stevens, B. and Allen, M.R. 2013. Energy budget constraints on climate response. Nature Geoscience 6, 415-416. Ring, M.J., Lindner, D., Cross, E.F., Schlesinger, M.E. 2012. Causes of the global warming observed since the 19th century. Atmospheric and Climate Sciences 2: 401-415.
P a g e | 28
Center for the Study of Carbon Dioxide and Global Change © 2013, www.co2science.org.
Rogers, A., Gibon, Y., Stitt, M., Morgan, P.B., Bernacchi, C.J., Ort, D.R. and Long, S.P. 2006. Increased C availability at elevated carbon dioxide concentration improves N assimilation in a legume. Plant, Cell and Environment 29: 1651-1658. Schmittner, A., Urban, N.M., Shakun, J.D., Mahowald, N.M., Clark, P.U., Bartlein, P.J., Mix, A.C. and Rosell-Melé, A. 2011. Climate sensitivity estimated from temperature reconstructions of the Last Glacial Maximum. Science 334: 1385-1388. Spencer, R.W. 2013. Statement to the Environment and Public Works Committee, 19 July 2013, Washington, DC, 13 p. Strain, B.R. 1978. Report of the Workshop on Anticipated Plant Responses to Global Carbon Dioxide Enrichment. Department of Botany, Duke University, Durham, NC. van Hateren, J.H. 2012. A fractal climate response function can simulate global average temperature trends of the modern era and the past millennium. Climate Dynamics, doi: 10.1007/s00382-012-1375-3. Wanitschek, M., Ulmer, H., Sussenbacher, A., Dorler, J., Pachinger, O. and Alber, H.F. 2013. Warm winter is associated with low incidence of ST elevation myocardial infarctions and less frequent acute coronary angiographies in an alpine country. Herz 38: 163-170. Watling, J.R. and Press, M.C. 1997. How is the relationship between the C4 cereal Sorghum bicolor and the C3 root hemi-parasites Striga hermonthica and Striga asiatica affected by elevated CO2? Plant, Cell and Environment 20: 1292-1300. Watling, J.R. and Press, M.C. 2000. Infection with the parasitic angiosperm Striga hermonthica influences the response of the C3 cereal Oryza sativa to elevated CO2. Global Change Biology 6: 919-930. Whittaker, J.B. 1999. Impacts and responses at population level of herbivorous insects to elevated CO2. European Journal of Entomology 96: 149-156. Wichmann, J., Anderson, Z.J., Ketzel, M., Ellermann, T. and Loft, S. 2011. Apparent temperature and cause-specific mortality in Copenhagen, Denmark: A case-crossover analysis. International Journal of Environmental Research and Public Health 8: 3712-3727. Wittwer, S.H. 1982. Carbon dioxide and crop productivity. New Scientist 95: 233-234. Wittwer, S.H. 1995. Food, Climate, and Carbon Dioxide: The Global Environment and World Food Production. Lewis Publishers, Boca Raton, FL.

P a g e | 29
Center for the Study of Carbon Dioxide and Global Change © 2013, www.co2science.org.
Wöppelmann, G., Letetrel, C., Santamaria, A., Bouin, M.-N., Collilieux, X., Altamimi, Z., Williams, S.D.P. and Miguez, B.M. 2009. Rates of sea-level change over the past century in a geocentric reference frame. Geophysical Research Letters 36: 10.1029/2009GL038720. Wu, W., Xiao, Y., Li, G., Zeng, W., Lin, H., Rutherford, S., Xu, Y., Luo, Y., Xu, X., Chu, C. and Ma, W. 2013. Temperature-mortality relationship in four subtropical Chinese cities: A time-series study using a distributed lag non-linear model. Science of the Total Environment 449: 355-362. Yang, L., Liu, H., Wang, Y., Zhu, J., Huang, J., Liu, G., Dong, G. and Wang, Y. 2009. Yield formation of CO2-enriched inter-subspecific hybrid rice cultivar Liangyoupeijiu under fully open-air condition in a warm sub-tropical climate. Agriculture, Ecosystems and Environment 129: 193-200.
ABOUT THE AUTHOR CRAIG D. IDSO is the founder and former President of the Center for the Study of Carbon Dioxide and Global Change and currently serves as Chairman of the Center’s board of directors. Dr. Idso received his B.S. in Geography from Arizona State University, his M.S. in Agronomy from the University of Nebraska - Lincoln, and his Ph.D. in Geography from Arizona State University, where he studied as one of a small group of University Graduate Scholars.
Dr. Idso has been involved in the global warming debate for many years and has published peer-reviewed scientific articles on issues related to data quality, the growing season, the seasonal cycle of atmospheric CO2, world food supplies, coral reefs, and urban CO2 concentrations, the latter of which he investigated via a National Science Foundation grant as a faculty researcher in the Office of Climatology at Arizona State University. Since 1998, he has been the editor and a chief contributor to the online magazine CO2 Science. Dr. Idso is the author of several books, including The Many Benefits of Atmospheric CO2 Enrichment, which details 55 ways in which the modern rise in atmospheric CO2 is benefiting Earth’s biosphere. Dr. Idso has also produced three video documentaries, Carbon Dioxide and the Climate Crisis: Reality or Illusion?, Carbon Dioxide and the Climate Crisis: Avoiding Plant and Animal Extinctions, and Carbon Dioxide and the Climate Crisis: Doing the Right Thing, and he has lectured in Meteorology at Arizona State University and in Physical Geography at Mesa and Chandler-Gilbert Community Colleges. Dr. Idso is a member of the American Association for the Advancement of Science, American Geophysical Union, American Meteorological Society, Association of American Geographers, Ecological Society of America, and The Honor Society of Phi Kappa Phi. He also serves as co-
P a g e | 30
Center for the Study of Carbon Dioxide and Global Change © 2013, www.co2science.org.
editor of the Assement Reports for the Nongovernmental International Panel on Climate Change (NIPCC) and he is the former Director of Environmental Science at Peabody Energy in St. Louis, Missouri.
ABOUT THE CENTER
The Center for the Study of Carbon Dioxide and Global Change was founded as a non-profit organization in 1998 to provide regular reviews and commentary on new developments in the world-wide scientific quest to determine the climatic and biological consequences of the ongoing rise in the air’s CO2 content. It achieves this objective primarily through the weekly online publication of ‘CO2 Science,’ which is freely available on the Internet at www.co2science.org, and contains reviews of recently published peer-reviewed scientific journal articles, original research, and other educational materials germane to the debate over carbon dioxide and global change. The Center’s main focus is to separate reality from rhetoric in the emotionally-charged debate that swirls around the subject of carbon dioxide and global change and to avoid the stigma of biased advocacy by utilizing sound science. It has a stated commitment to empirical evidence and its position on global warming may be summarized as follows. There is little doubt the carbon dioxide concentration of the atmosphere has risen significantly over the past 100 to 150 years from humanity’s use of fossil fuels and that the Earth has warmed slightly over the same period; but there is no compelling reason to believe that the rise in temperature was caused primarily by the rise in carbon dioxide. Moreover, real world data provide no compelling evidence to suggest that the ongoing rise in the carbon dioxide concentration of the atmosphere will lead to significant global warming or changes in Earth’s climate. In the 15-year period since its creation, the Center has published over 5000 timely and objective reviews of scientific research reports on both the biological and climatological effects of atmospheric CO2 enrichment. Accompanying each review is the full peer-reviewed scientific journal reference from which the review was derived, so that patrons may independently obtain the original journal articles and verify the information for themselves.