Embed Size (px)
Citation preview

The Politics of Classification in Global Development
Lindsay R. Dolan
Submitted in partial fulfillment of therequirements for the degree of
Doctor of Philosophyin the Graduate School of Arts and Sciences
COLUMBIA UNIVERSITY
2018

c©2018Lindsay R. DolanAll rights reserved

Abstract
The Politics of Classification in Global Development
Lindsay R. Dolan
Many scholars primarily view international organizations as vehicles used by powerful states to
distribute resources. However, this view trivializes the profound influence of their day-to-day
operations on the world. This dissertation argues that that the classification systems developed
by these bureaucracies significantly affect how classified countries are treated by many influential
elites in the global economy. Focusing on the domain of development, I show that whether a
country is categorized as a developing country has major effects on high-stakes decisions such as
aid, investment, and credit and democracy ratings.
Why do international observers rely so heavily on these blunt categories? I propose two mech-
anisms by which classifications influence elite behavior: Elites may use classifications cognitively
as heuristic devices that simplify decision-making processes or strategically as a way of justifying
their behaviors to external audiences. I then show with cross-national data from 1987 to 2015 that
a country’s World Bank income classification correlates with the rewards it receives from actors
who are susceptible to one or both of these mechanisms. Specifically, I find that becoming a mid-
dle income country causes a country to lose aid but receive better ratings of its creditworthiness
and democracy. These findings are echoed in interviews with stakeholders in the graduation pro-
cesses of several countries within a World Bank system. I test the micro-foundations of my theory
with experimental data by inviting an elite sample of development professionals and students to
participate in a hypothetical aid allocation activity. By randomizing the information included on
the country profiles and the participation incentives, I show both that a classification effect exists
and that, in the case of donors, it is primarily driven by the strategic mechanism. Coupled with the
observational findings, which illustrate that classifications affect investors and raters with no such
strategic incentives, this suggests that both mechanisms are essential to understanding who uses
classifications.
How do these dynamics affect the experiences and behaviors of classified countries and groups
within those countries? I argue that classifications produce winners and losers, who strategically re-
spond to their classifications when able and informed. In particular, being categorized as a more de-
veloped country punishes non-governmental organizations and those they represent, while business
interests and individual leaders benefit materially and socially. I illustrate these patterns through
dozens of interviews with representatives from civil society, the business community, and govern-
ment in Nepal and Botswana, two countries that are currently or have previously “graduated” from
the UN’s Least Developed Country category. Moreover, I provide qualitative and quantitative ev-
idence that countries use a variety of strategies to attempt to change their classifications, and they
do so in both directions. For example, I show that countries manipulate their data as they approach
significant thresholds that separate categories, and while some seek to accelerate their transition,
others try to hinder it.
This project identifies and explains a relatively unexamined power of international organiza-
tions in a context where its deployment significantly affects outcomes for developing countries.
Classifications affect the highest level of interactions in ways that are felt by the poorest in society.
As numerous countries begin to graduate from their developing country statuses, these findings are
especially relevant for ongoing policy debates about how international organizations spread their
understandings of development. Far from merely describing the world, these bureaucrats shape it
in profound ways.

Contents
List of Tables iv
List of Figures vi
List of Acronyms vii
Acknowledgments ix
1 Introduction 11.1 The Argument . . . . . . . . . . . . . . . . . . . . . . . . . . . . . . . . . . . . . 31.2 The Rise of Classifications in Global Development . . . . . . . . . . . . . . . . . 61.3 International Organizations as Narrators . . . . . . . . . . . . . . . . . . . . . . . 101.4 Winners and Losers from Classifications . . . . . . . . . . . . . . . . . . . . . . . 151.5 To Classify or Not to Classify? . . . . . . . . . . . . . . . . . . . . . . . . . . . . 181.6 Method and Plan of Dissertation . . . . . . . . . . . . . . . . . . . . . . . . . . . 19
2 Theoretical Framework 222.1 The Actors . . . . . . . . . . . . . . . . . . . . . . . . . . . . . . . . . . . . . . 232.2 The Puzzle of Classifications . . . . . . . . . . . . . . . . . . . . . . . . . . . . . 252.3 Why Classifications Work . . . . . . . . . . . . . . . . . . . . . . . . . . . . . . 30
2.3.1 Cognitive Mechanism . . . . . . . . . . . . . . . . . . . . . . . . . . . . 302.3.2 Strategic Mechanism . . . . . . . . . . . . . . . . . . . . . . . . . . . . . 32
2.4 Empirical Expectations . . . . . . . . . . . . . . . . . . . . . . . . . . . . . . . . 342.4.1 How International Observers Use Classifications . . . . . . . . . . . . . . 342.4.2 The Distributive Effects of Classifications . . . . . . . . . . . . . . . . . . 432.4.3 Which Classifications Prevail . . . . . . . . . . . . . . . . . . . . . . . . 46
2.5 Summary . . . . . . . . . . . . . . . . . . . . . . . . . . . . . . . . . . . . . . . 47
3 Classification Systems in Global Development 483.1 A Proliferation of Development Classifications . . . . . . . . . . . . . . . . . . . 493.2 Departing from Intended Use: The World Bank Classification Systems . . . . . . . 523.3 Proceduralizing Politics: The UN’s Least Developed Countries Category . . . . . . 553.4 Why These Classifications? . . . . . . . . . . . . . . . . . . . . . . . . . . . . . . 60
i
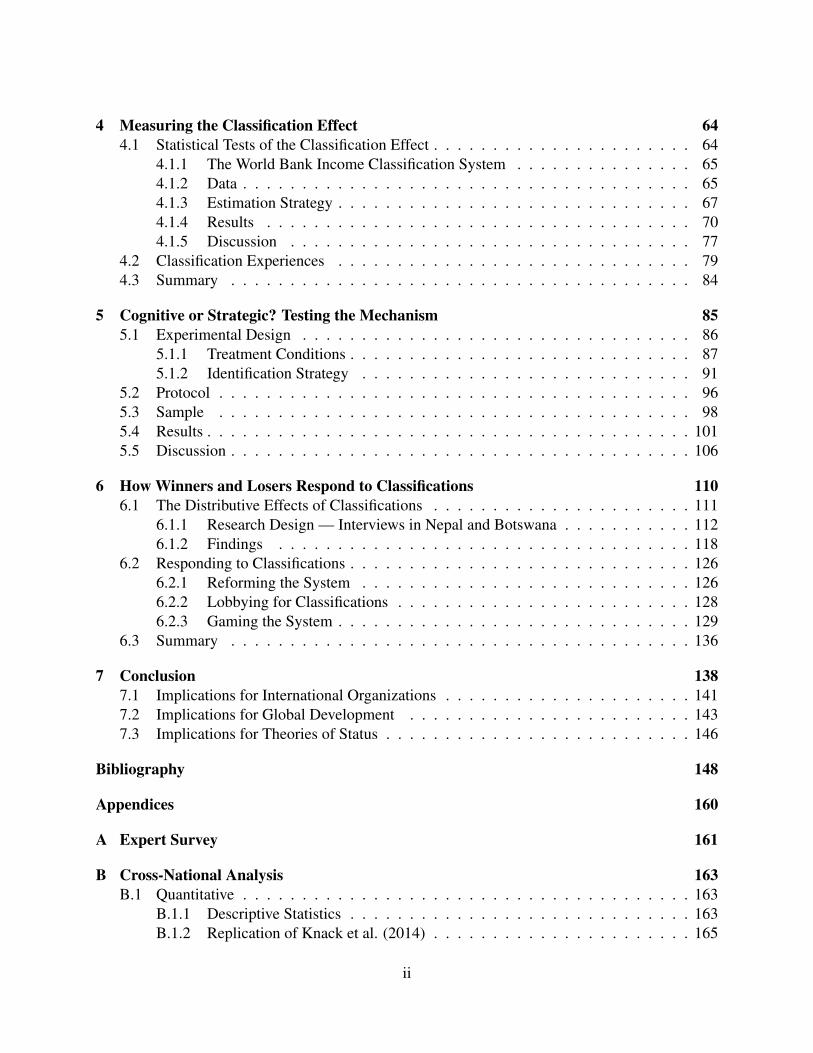
4 Measuring the Classification Effect 644.1 Statistical Tests of the Classification Effect . . . . . . . . . . . . . . . . . . . . . . 64
4.1.1 The World Bank Income Classification System . . . . . . . . . . . . . . . 654.1.2 Data . . . . . . . . . . . . . . . . . . . . . . . . . . . . . . . . . . . . . . 654.1.3 Estimation Strategy . . . . . . . . . . . . . . . . . . . . . . . . . . . . . . 674.1.4 Results . . . . . . . . . . . . . . . . . . . . . . . . . . . . . . . . . . . . 704.1.5 Discussion . . . . . . . . . . . . . . . . . . . . . . . . . . . . . . . . . . 77
4.2 Classification Experiences . . . . . . . . . . . . . . . . . . . . . . . . . . . . . . 794.3 Summary . . . . . . . . . . . . . . . . . . . . . . . . . . . . . . . . . . . . . . . 84
5 Cognitive or Strategic? Testing the Mechanism 855.1 Experimental Design . . . . . . . . . . . . . . . . . . . . . . . . . . . . . . . . . 86
5.1.1 Treatment Conditions . . . . . . . . . . . . . . . . . . . . . . . . . . . . . 875.1.2 Identification Strategy . . . . . . . . . . . . . . . . . . . . . . . . . . . . 91
5.2 Protocol . . . . . . . . . . . . . . . . . . . . . . . . . . . . . . . . . . . . . . . . 965.3 Sample . . . . . . . . . . . . . . . . . . . . . . . . . . . . . . . . . . . . . . . . 985.4 Results . . . . . . . . . . . . . . . . . . . . . . . . . . . . . . . . . . . . . . . . . 1015.5 Discussion . . . . . . . . . . . . . . . . . . . . . . . . . . . . . . . . . . . . . . . 106
6 How Winners and Losers Respond to Classifications 1106.1 The Distributive Effects of Classifications . . . . . . . . . . . . . . . . . . . . . . 111
6.1.1 Research Design — Interviews in Nepal and Botswana . . . . . . . . . . . 1126.1.2 Findings . . . . . . . . . . . . . . . . . . . . . . . . . . . . . . . . . . . 118
6.2 Responding to Classifications . . . . . . . . . . . . . . . . . . . . . . . . . . . . . 1266.2.1 Reforming the System . . . . . . . . . . . . . . . . . . . . . . . . . . . . 1266.2.2 Lobbying for Classifications . . . . . . . . . . . . . . . . . . . . . . . . . 1286.2.3 Gaming the System . . . . . . . . . . . . . . . . . . . . . . . . . . . . . . 129
6.3 Summary . . . . . . . . . . . . . . . . . . . . . . . . . . . . . . . . . . . . . . . 136
7 Conclusion 1387.1 Implications for International Organizations . . . . . . . . . . . . . . . . . . . . . 1417.2 Implications for Global Development . . . . . . . . . . . . . . . . . . . . . . . . 1437.3 Implications for Theories of Status . . . . . . . . . . . . . . . . . . . . . . . . . . 146
Bibliography 148
Appendices 160
A Expert Survey 161
B Cross-National Analysis 163B.1 Quantitative . . . . . . . . . . . . . . . . . . . . . . . . . . . . . . . . . . . . . . 163
B.1.1 Descriptive Statistics . . . . . . . . . . . . . . . . . . . . . . . . . . . . . 163B.1.2 Replication of Knack et al. (2014) . . . . . . . . . . . . . . . . . . . . . . 165
ii

B.1.3 Robustness Checks . . . . . . . . . . . . . . . . . . . . . . . . . . . . . . 170B.1.4 Alternative Model: Graduations . . . . . . . . . . . . . . . . . . . . . . . 174
B.2 Qualitative . . . . . . . . . . . . . . . . . . . . . . . . . . . . . . . . . . . . . . . 176
C Experimental Analysis 178C.1 Recruitment E-mail . . . . . . . . . . . . . . . . . . . . . . . . . . . . . . . . . . 179C.2 Survey Instrument . . . . . . . . . . . . . . . . . . . . . . . . . . . . . . . . . . . 180C.3 Randomization Checks . . . . . . . . . . . . . . . . . . . . . . . . . . . . . . . . 187
D Sub-National Analysis 190D.1 Nepal Interviews . . . . . . . . . . . . . . . . . . . . . . . . . . . . . . . . . . . 190D.2 Botswana Interviews . . . . . . . . . . . . . . . . . . . . . . . . . . . . . . . . . 191
E Analysis of Data Manipulation 193
iii
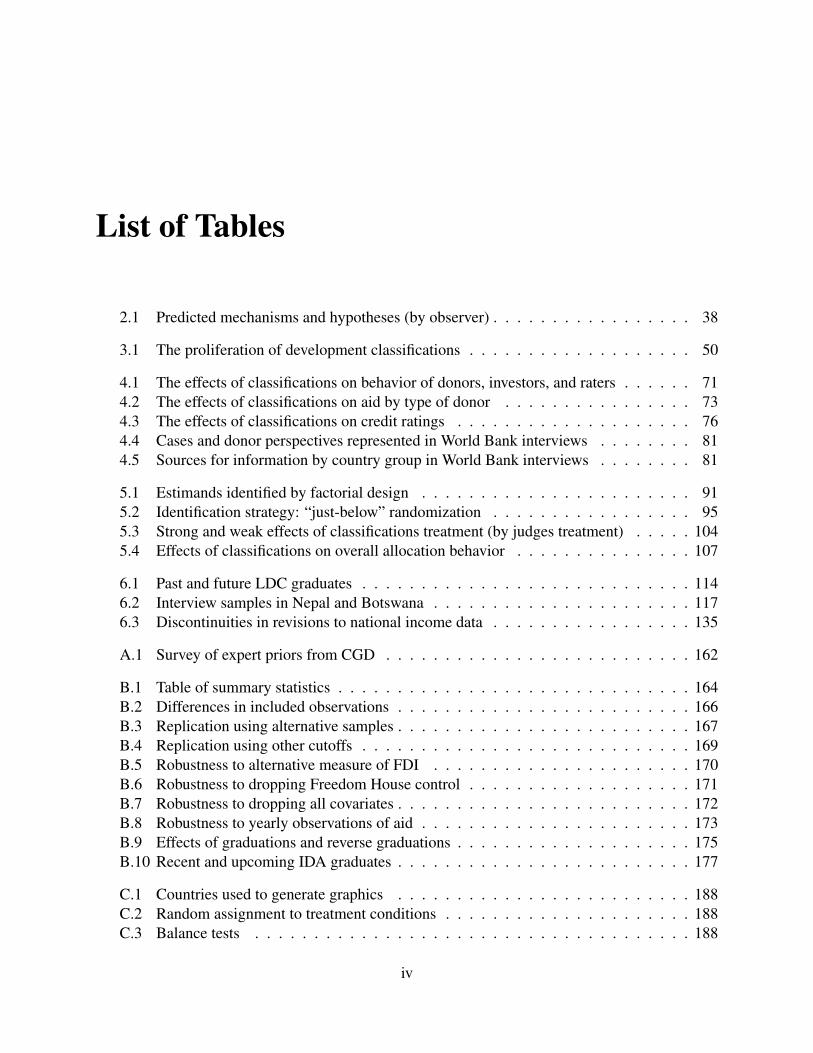
List of Tables
2.1 Predicted mechanisms and hypotheses (by observer) . . . . . . . . . . . . . . . . . 38
3.1 The proliferation of development classifications . . . . . . . . . . . . . . . . . . . 50
4.1 The effects of classifications on behavior of donors, investors, and raters . . . . . . 714.2 The effects of classifications on aid by type of donor . . . . . . . . . . . . . . . . 734.3 The effects of classifications on credit ratings . . . . . . . . . . . . . . . . . . . . 764.4 Cases and donor perspectives represented in World Bank interviews . . . . . . . . 814.5 Sources for information by country group in World Bank interviews . . . . . . . . 81
5.1 Estimands identified by factorial design . . . . . . . . . . . . . . . . . . . . . . . 915.2 Identification strategy: “just-below” randomization . . . . . . . . . . . . . . . . . 955.3 Strong and weak effects of classifications treatment (by judges treatment) . . . . . 1045.4 Effects of classifications on overall allocation behavior . . . . . . . . . . . . . . . 107
6.1 Past and future LDC graduates . . . . . . . . . . . . . . . . . . . . . . . . . . . . 1146.2 Interview samples in Nepal and Botswana . . . . . . . . . . . . . . . . . . . . . . 1176.3 Discontinuities in revisions to national income data . . . . . . . . . . . . . . . . . 135
A.1 Survey of expert priors from CGD . . . . . . . . . . . . . . . . . . . . . . . . . . 162
B.1 Table of summary statistics . . . . . . . . . . . . . . . . . . . . . . . . . . . . . . 164B.2 Differences in included observations . . . . . . . . . . . . . . . . . . . . . . . . . 166B.3 Replication using alternative samples . . . . . . . . . . . . . . . . . . . . . . . . . 167B.4 Replication using other cutoffs . . . . . . . . . . . . . . . . . . . . . . . . . . . . 169B.5 Robustness to alternative measure of FDI . . . . . . . . . . . . . . . . . . . . . . 170B.6 Robustness to dropping Freedom House control . . . . . . . . . . . . . . . . . . . 171B.7 Robustness to dropping all covariates . . . . . . . . . . . . . . . . . . . . . . . . . 172B.8 Robustness to yearly observations of aid . . . . . . . . . . . . . . . . . . . . . . . 173B.9 Effects of graduations and reverse graduations . . . . . . . . . . . . . . . . . . . . 175B.10 Recent and upcoming IDA graduates . . . . . . . . . . . . . . . . . . . . . . . . . 177
C.1 Countries used to generate graphics . . . . . . . . . . . . . . . . . . . . . . . . . 188C.2 Random assignment to treatment conditions . . . . . . . . . . . . . . . . . . . . . 188C.3 Balance tests . . . . . . . . . . . . . . . . . . . . . . . . . . . . . . . . . . . . . 188
iv

C.4 Manipulation check . . . . . . . . . . . . . . . . . . . . . . . . . . . . . . . . . . 189
E.1 “Mis”-classifications . . . . . . . . . . . . . . . . . . . . . . . . . . . . . . . . . 193E.2 Discontinuities in revisions to national income data (removing outliers) . . . . . . 194
v

List of Figures
2.1 The political economy of classifications . . . . . . . . . . . . . . . . . . . . . . . 24
3.1 The World Bank analytical income classification system . . . . . . . . . . . . . . 543.2 Thresholds for graduating from the UN Least Developed Country category . . . . . 583.3 Salience of World Bank income classifications and UN LDC category in compar-
ative perspective . . . . . . . . . . . . . . . . . . . . . . . . . . . . . . . . . . . . 62
4.1 The effects of classifications by individual donors . . . . . . . . . . . . . . . . . . 74
5.1 Examples of profiles including and excluding classifications . . . . . . . . . . . . 885.2 Complete treatment possibilities . . . . . . . . . . . . . . . . . . . . . . . . . . . 945.3 Descriptive statistics . . . . . . . . . . . . . . . . . . . . . . . . . . . . . . . . . 1005.4 Effects on allocation to threshold country . . . . . . . . . . . . . . . . . . . . . . 1025.5 Distribution of allocation behavior . . . . . . . . . . . . . . . . . . . . . . . . . . 1035.6 Effects on overall allocation . . . . . . . . . . . . . . . . . . . . . . . . . . . . . 105
6.1 Nepal’s and Botswana’s performances on LDC indicators (2015) . . . . . . . . . . 1166.2 National income data is revised over time: the example of Kenya . . . . . . . . . . 1326.3 Revisions to GNIpc increase as a country approaches the LIC ceiling . . . . . . . . 135
vi

List of Acronyms
CDP Committee for Development Policy
CGD Center for Global Development
DAC Development Assistance Committee
FCAS Fragile and Conflict Affected State
FDI foreign direct investment
GNI gross national income
HIC High Income Country
HIPC Highly Indebted Poor Country
IBRD International Bank for Reconstruction and Development
IDA International Development Association
IGO intergovernmental organization
IIR Institutional Investor ratings
IMF International Monetary Fund
IO international organization
IR international relations
LDC Least Developed Country
LIC Low Income Country
LMIC Lower-Middle Income Country
MCC Millennium Challenge Corporation
MIC Middle Income Country
vii

ODA official development assistance
OECD Organization for Economic Cooperation and Development
PPP purchasing power parity
NGO non-governmental organization
SDR Special Drawing Rights
UMIC Upper-Middle Income Country
UN United Nations
UNCTAD UN Conference on Trade and Development
U.S. United States
WDI World Development Indicators
viii

Acknowledgments
I owe a debt of gratitude to my advisors, funders, colleagues, and family for their support during
the process of writing this dissertation. I am humbled by the grace of those around me to nurture
my ideas and inspire me to pursue them.
My mentors at Columbia have been extraordinary. I thank Chris Blattman for training me from
my first year of graduate school to push myself, try bold new ideas, and leave behind those that fail
without looking back. He has been a great advocate for me and a model of excellence in research. I
am deeply lucky to have worked with Allison Carnegie, who has forever changed how I frame and
write arguments in political science. She has reviewed countless drafts of my work and has always
provided positive, constructive suggestions. It has been a privilege to be advised by Jack Snyder,
whose expansive worldview and understanding of how ideas interact is unparalleled. His advice to
connect my argument to the literature on status has helped me to arrive at a research agenda I am
very excited about. I thank Don Green for helping me to think through my empirical strategies,
designs, and inferences. He is an incredible and willing resource.
Much of the foundation for this project was laid during a fellowship at the Center for Global
Development. I am grateful to CGD for hosting me in such an engaging environment. In particular,
I thank Sebastian Bauhoff, Todd Moss, Scott Morris, and Sarah Rose for their guidance and help.
This project would not have been possible without the support of the NSF Graduate Research
Fellowship (DGE 16-44869) and Doctoral Dissertation Research Improvement Grant (1647493).
I thank my peers at Columbia for their thoughtful comments and encouragement at numerous
ix
workshops where I have presented this work. Our department’s collegiality and talent have been
an enormous source of both inspiration and helpful criticism. While there is truly a full village
of these supportive peers, a few colleagues in particular deserve my special thanks. As someone
aptly Tweeted last year, “Behind every strong woman is 5 other strong women who proofread
her email real quick when they had a second.” I thank Alicia Cooperman for many (sometimes
inter-continental Skype) work dates, for unflappable support and positive energy, and for reading
countless drafts of my papers — and e-mails. Tara Slough is a generous guru who has always been
there to help me work with my data. She pushes the hardest and provides the greatest value added.
From the first day I met her, I knew Tamar Mitts would be an incredible friend and colleague, and
I have been so grateful for her motivation and advice. She is a brilliant scholar who knows what
matters in life. I am lucky that Abby Long came into my life and appointed herself my publicist. I
thank her for helping me extend my work into the policy community.
I am most grateful to my talented colleague Kolby Hanson, whom I am now proud to call
my husband. This project reflects years of dinnertime conversations in which he helped me to
explore my theory and make sense of what I learned in interviews. I am exceptionally lucky
to have someone who can both credibly validate my ideas and affirm that those ideas are not
why he loves me. Thank you, Kolby, for being an unbelievable partner, from cooking dinners
to wedding planning to reviewing endless drafts, even as you were hard at work on your own
ambitious dissertation project. You brighten my day and anchor my goals and I love you.
Finally, I thank my family for their incredible support throughout this process. My parents,
Dave and Mary Dolan, raised me to love learning and made several life decisions that would allow
me to pursue this research. I am so grateful for the sacrifices they have made. I especially thank my
mom, one of the most intellectual people I know, for enthusiastically engaging my ideas, sending
me articles related to my work, and proofreading parts of this project (even the regression tables!).
I am lucky to have gained a second family in the middle of this project and thank the Hansons too
for their encouragement.
x

Chapter 1
Introduction
It is 2015 and commuters in Washington, DC, walk by a new series of billboard ads, prominently
featuring a Starbucks-style disposable coffee cup with a World Bank logo. The caption reads,
“$2.86 per day is NOT middle income. Raise the MIC!” The message of this cryptic image is
that the World Bank’s income classification system should be changed. The World Bank currently
defines a Middle Income Country (MIC) as one in which a person earns at least $2.86 per day,
about the same as a cup of coffee in a cosmopolitan city and, in the view of this campaign, far too
low to be considered middle income. The Raise the MIC group, which has also organized petitions
and protests in addition to the ads, argues that this low threshold allows needy countries to be
perceived as no longer poor, which limits the assistance they are able to obtain in the international
community.1 The organizers publicly call on the World Bank to reform their classification system.
A year later, officials of the Commonwealth Secretariat schedule a private meeting with the
World Bank Development Economics Group.2 The Commonwealth Secretariat is an intergovern-
mental organization representing many of the United Kingdom’s former colonies, including those
1In their words, “the World Bank income classification scale sends a global message that is distorting the realityand does not accurately reflect the income level of the majority of people in these countries.” Letter addressed toJim Yong Kim, president of the World Bank, co-signed by 520 organizations. http://raisethemic.org/wp-content/uploads/2016/01/World-Bank-Packet.pdf
2Meeting titled “The World Bank Income Classification System: Is it Time for Change?” and held June 23, 2016,at the Center for Global Development in Washington, DC. Author’s notes.
1
in the Caribbean. Countries such as Antigua and Barbuda, Barbados, Jamaica, and others share
an experience common to many small island states: Despite significant development challenges
and vulnerability to environmental and economic shocks, they are classified as “middle income”
by virtue of their small populations. The purpose of this meeting? Caribbean representatives hope
to convey to the World Bank that lending decisions should be based on more nuanced criteria than
this simplistic label, which fails to capture the needs of their countries. Much to their surprise,
World Bank officials are already familiar with these challenges and reply that, for these reasons,
they never use these classifications to allocate grants or loans. While they also advise that these
classifications should not be used for the purpose of awarding funds, they acknowledge that they
are powerless to stop other international institutions and powerful donors from engaging in this
practice.
Why are so many objecting to a fairly technical classification system found in the World Bank
bureaucracy? Are their concerns valid, and conversely, do others actually benefit from these labels?
Why did the World Bank begin classifying countries, and does this system achieve its intended
objectives?
In answering these questions, I will illustrate that seemingly benign bureaucratic classifications
can carry powerful political consequences. Specifically, I will show that how international orga-
nizations define and categorize countries’ levels of development itself changes their development
trajectories. This is true not only of the World Bank’s classification system but also of others
maintained by organizations like the United Nations (UN). Highlighting these dynamics in the
domain of development, I claim that classifications are a great and often overlooked tool by which
international organizations shape the world.
222
CHAPTER 1. INTRODUCTION
1.1 The Argument
This dissertation argues that classifications do not just describe the world — they change it in
material ways. My study focuses on the classifications that international organizations use to char-
acterize a country’s level of development. I will present statistical evidence that when countries
move into categories indicating a higher level of development (an event often celebrated as a suc-
cess by national newspapers), those countries receive significantly less foreign aid from a variety
of international financiers. But they also enjoy new privileges in the global economy, for example,
improvements in evaluations of their creditworthiness and democracy. Moreover, these effects ex-
ist even when there is no real change in the country’s economic or political situation; rather, it has
been reclassified for mundane technical reasons. In other words, classifications are self-fulfilling
prophecies that partially create the realities they describe.
To explain these dynamics, I start by examining the interactions between international organi-
zations and a group of actors I call international observers. By international observers, I mean the
many actors (both state and non-state) who knowingly participate in the global economy. These
are the actors who consume classifications and use them, consciously or unconsciously, when they
make decisions of import for developing countries. International observers could be countries, in-
tergovernmental organizations, nongovernmental organizations, private investors, or even the mass
public, when their behaviors in the aggregate affect the welfare of other countries. International
organizations, in turn, produce the classifications that international observers consume.
Why would international observers rely on the classifications produced by international orga-
nizations? I develop two theoretical mechanisms by which classifications may be of use to so
many audiences. First, classifications can cognitively simplify complex and often contradictory
information about a country. Evidence from psychology suggests that people will eagerly and
implicitly resort to labels to make inferences about objects, even when there is plenty of better
333
1.1. The Argument
information available elsewhere.3 But even actors who are purely rational may nonetheless con-
sciously and strategically use classifications in their decision-making. According to the second
mechanism, these actors use classifications to publicly justify their decisions, especially when they
are responsible for allocating scarce political resources.4
International observers can be susceptible to one, both, or neither mechanism. For the purposes
of my argument, I examine the international observers whose behaviors are of greatest consequence
to developing countries—donors, investors, and raters. I use knowledge about the career concerns
and the organizational structures of these actors to generate predictions about which mechanism(s)
they may or may not be susceptible to. I use this to develop observable implications regarding
how each of these actors would make decisions that reflect the classifications countries receive.
I generate and test these predictions in the domain of development, showing that bureaucrats in
international organizations have great ability to influence economic interactions in ways that ma-
terially affect the lives of millions living in poverty. The broader theoretical claim, however, is that
classifications of any type will be most likely to influence the behaviors of actors most susceptible
to cognitive biases and strategic incentives. This suggests who will be most likely to consume a
given classification system.
How international observers use classifications to make decisions will have important conse-
quences for a different group of actors, which I call affected parties. Governments of classified
countries, for example, are clearly affected when their classifications are used to determine eligi-
bility for international programs. But affected parties can also include groups and non-political en-
tities who are affected by the way their country is perceived. For example, firms, non-governmental
organizations, and even the mass public may experience the effects of their country’s label as they
interact with the global economy. How these parties are specifically affected will depend on how
particular international observers use classifications. Sometimes these behaviors will result in priv-
ileges for countries receiving a particular label, while at other times they will result in punishments.3See Tversky and Kahneman (1974); Kahneman (2011).4See Fearon (1994).
444

CHAPTER 1. INTRODUCTION
Some groups may feel a disproportionate share of the benefits, while others may disproportionately
feel the burdens. As with any political economy, classifications produce both winners and losers.
Affected parties therefore engage in strategic behaviors to influence their classifications. They
do this in one of three ways: First, they can take advantage of any opportunities within a classifi-
cation system for them to petition for a specific label. Second, they can lobby to reform the entire
classification system in such a way that will result in their preferred designation. Third, when all
else fails, they might resort to covert ways of securing their desired category. For example, I present
evidence that countries actually manipulate their data to engineer their classifications. Importantly,
and breaking with previous work, I show that while some affected parties prefer improvements in
their rankings, others work for the reverse. This is consistent with my argument that classifications
carry complex and multifaceted distributive consequences.
Finally, international observers’ sensitivity to classifications empowers international organi-
zations to behave strategically. International organizations themselves are political actors. Their
political goals could result from the agenda of their most powerful state backers as well as that
of the bureaucrats working within the organization. Regardless of where these goals come from,
international organizations can achieve them by deploying classifications that will coordinate the
behaviors of relevant international observers. Of course, international organizations may be forced
to compromise in their pursuits if they face sufficiently great pressure from affected parties lobby-
ing on their own behalf.
While I focus on the domain of development, my argument addresses broader questions about
international organizations and how they structure the global economy. I argue that international
organizations have significant ability to shape the world through ideas and narratives, and they
promote those ideas and narratives using devices like classifications. A longstanding constructivist
tradition in international relations holds that beliefs matter. My cognitive-strategic theory helps to
explain why and when they do, and I test this theory using cross-national statistical analysis, an
elite survey experiment, and dozens of in-depth interviews. In so doing, I explain how established
555
1.2. The Rise of Classifications in Global Development
international institutions can wield power in a world saturated with new sources of finance.
My argument also helps to explain why and when countries pursue improvements in their
international reputations. Countries recognize that how they are classified matters considerably for
their status in the international community. But whereas previous scholars assume status to be an
unqualified boon, I illustrate that sometimes it is a bust. Not everyone benefits when a country is
awarded higher status, so some groups prefer to undermine this. In classifying, systematizing, and
labeling the world, international organizations have created new areas in which states may compete
for status, and the dynamics I observe in one of these areas raise important questions for the future
study of reputation in international relations.
1.2 The Rise of Classifications in Global Development
Indicators, rankings, and ratings are an increasingly important component of global governance.
Private authorities and international institutions now produce a broad range of metrics, claiming
to measure levels of corruption, respect for human rights, democracy, debt sustainability and other
features of interest.5 Their widely acknowledged influence has made these numbers a popular
target of political scrutiny. For example, Chile’s outgoing president Michelle Bachelet in 2018
criticized the World Bank for a decline in her country’s ranking in the “Doing Business” report. In
a Twitter post, she claimed “Rankings provided by international institutions should be trustworthy,
because they have an impact on a country’s investment and development.”6 Diplomatic incidents
over performance assessments like these are increasingly common and have not gone unnoticed by
social scientists.
This attention to numbers is just the most recent manifestation of social science’s preoccupation
with knowledge and power. For Foucault, these concepts are inseparable: through the creation,
5See Cooley and Snyder (2015) for a review. Rankings and ratings, they argue, have proliferated since the 1980s(10).
6Pascale Bonnefoy and Ernesto Londono, “Chile Slams World Bank Amid Charges of Political Bias,” The NewYork Times, January 13, 2018.
666

CHAPTER 1. INTRODUCTION
acquisition, and management of knowledge, authorities are able to assign identities and coerce
subjects accordingly.7 Scott (1998) builds on this tradition in his discussion of the origins of the
modern state. He argues that states extended their bureaucratic reach by making their populations
“legible” to the state through censuses, mapping, and records. Once the state could measure and
manage its population, it could call them “citizens” and subject them to its authority. Numbers
exaggerate these dynamics because they conceal the origins of their power. As Merry (2011,
584) explains, “Numerical measures produce a world knowable without the detailed particulars
of context and history. ... This knowledge is presented as objective and often as scientific. The
interpretations lurk behind the numbers but are rarely presented explicitly.” In other words, the
more an indicator appears to be technical and systematic, the less it is possible to challenge its
claim to authority, and the more powerful it is.
It is no wonder that ratings, rankings, and indicators have earned the scrutiny of political sci-
entists. Recent works have called attention to the significance of “global benchmarking,”8 “ratings
and rankings organizations,”9 “global power assessments,”10 and “scorecard diplomacy.”11 Cov-
ering indicators across a range of issue areas, these works investigate the origins of raters’ au-
thority, measurement issues in the production of indicators, and how these metrics shape political
interactions.12 Many of these accounts reveal that indicators have been intentionally developed or
deployed to exert social pressure on rated countries to comply with international norms.13 They of-
ten rely on data that may seem objective but actually reflects important political biases.14 Graded
countries, perceiving the benefits of desirable scores, labels, or groupings, respond by adopting
policies targeted at changing their scores or petitioning the ratings organizations to amend them.15
7See Foucault (1978).8See Broome and Quirk (2015).9See Cooley and Snyder (2015).
10See Kelley and Simmons (2016).11See Kelley (2017). See also Davis et al. (2012). Still others investigate the validity of the numbers going into
these political figures. See Andreas and Greenhill (2010); Jerven (2013).12See Cooley and Snyder (2015, 24) for a helpful framework for thinking about this literature.13See Kelley and Simmons (2015); Kelley (2017); Morse (2017).14See Bush (2017).15See, for example, Cooley and Snyder (2015); Kelley and Simmons (2015); Buntaine et al. (2017); Carnegie and
777
1.2. The Rise of Classifications in Global Development
Yet despite scholarship’s increasing awareness of the politicization of these metrics, we lack
a theory to explain why they occur. We know that indicators are powerful, but why? In Buthe
(2012)’s conceptual model of indicators, he introduces the idea that there exists both a supply and
demand for indicators. Some actors demand certain metrics, and others produce them. My argu-
ment builds on this insight by exploring why various actors demand indicators and how this helps
us understand what kind of indicators will be supplied. In brief, I claim that indicators affect actors
who are susceptible to cognitive biases and/or who must justify their behaviors to external audi-
ences. This explanation for why indicators change behaviors is essential for moving this literature
from the descriptive observation that indicators matter to theoretical predictions about which indi-
cators matter and what their consequences will be.16 Not all indicators are powerful, and no single
indicator is all-powerful. This theory equips scholars to study indicators with greater precision and
equips practitioners to design effective indicators that achieve their desired objectives.
My argument is about classifications, which are a type of indicator. Davis et al. (2012, 7) point
out four notable features of an indicator: “1) the significance of the name of the indicator and the
associated assertion of its power to define and represent a phenomenon such as ‘the rule of law’; (2)
the ordinal structure enabling comparison and ranking and exerting pressure for ‘improvement’ as
measured by the indicator; (3) the simplification of complex social phenomena; and (4) the poten-
tial to be used for evaluative purposes.” Classifications are indicators that are particularly extreme
on the third feature: simplification. While a classification could be made on the basis of multiple
criteria, the result reduces an object’s identity to its inclusion inside or outside a group, usually on
the basis of thresholds. Cooley and Snyder (2015, 16) point out that classifications are often the
high-profile complements to numerical indicators and that “in many cases, it is the classification or
labeling of their country by ratings and rankings organizations that state officials find more objec-
tionable than the country score itself.” While country scores may have been the focus during the
information boom of the 1980s and 1990s, today’s world of big data makes information the most
Samii (2017).16I am grateful to Melissa Lee for pushing me on this point.
888
CHAPTER 1. INTRODUCTION
valuable in the aggregate, when it is effectively summarized. In short, there are too many numbers
to focus on any one, and there is widespread respect for the simple output of a complex algorithm.
Classifications are therefore especially appealing because they digest these numbers. My study
of classifications highlights political dynamics that, while true of indicators more generally, are
especially powerful in the current information environment.17
In particular, my argument focuses on classifications in the domain of development. While
international agencies classify many objects, ranging from hurricanes to commodities to democra-
cies, I focus on classifications of development for three reasons. First, there are several different
classification systems, which allows me to compare between them. In addition to receiving a World
Bank income classification, states may belong to the Least Developed Country (LDC) category, the
Fragile and Conflict Affected State (FCAS) category, the Highly Indebted Poor Country (HIPC)
category, and others.18 Second, many countries are expected to change categories within a decade
and many high-profile “graduations” have already occurred (e.g. India).19 This not only makes my
study highly policy relevant but also allows me to observe within-country variation as countries
transition between categories.
A third reason to focus on development is to mitigate alternative explanations for the power
of classifications. Many recent studies of indicators have argued that international organizations
design indicators that measure desirable behaviors to create social pressure to perform well on
these metrics. These indicators could take the form, for example, of scorecards or blacklists.20 But
17Other studies find that investors’ risk perceptions are influenced by a country’s affiliation with other countries.See Gray (2013); Brooks et al. (2015). While these findings exhibits similar decision-making processes to those I willdescribe, these categories are not classifications because they are not officially defined and maintained. However, theseresults underscore what a power international organizations have to create categories by embedding classifications intheir institutions.
18While I focus on classifications, there is also a proliferation of indicators in the domain of global development.Although investigating the origins of this trend is beyond the scope of my study, this proliferation has occurred atthe same time as donors have pushed for results-based aid and have created metrics to assess aid effectiveness. SeeBirdsall and Savedoff (2010). Honig and Weaver (2018) argue that the culture of the elite development communityso strongly values performance indicators that they have taken costly steps to improve the transparency of their aidprojects, despite relatively little demand for these indicators.
19See Moss and Leo (2011); Morris and Gleave (2015).20See Kelley (2017); Morse (2017).
999
1.3. International Organizations as Narrators
these studies focus on measuring certain behaviors that governments decide to either engage or not
engage in, such as acts of corruption or adopting certain laws. This means that a country’s inclusion
or exclusion from the list is quite a clear signal of its type to the international community, and there
is therefore a rational basis for why these indicators are so important to a country’s international
reputation or status.21 In contrast, a country’s level of development, while related to its behaviors,
is a much murkier signal of that government’s quality. It is difficult to imagine that international
organizations can successfully incentivize specific behaviors with classifications that capture such
a distantly related outcome, and it is also challenging to justify the power of these classifications
on a rational basis. I therefore need to dig deeper to understand where these classifications get
their influence. In so doing, I uncover additional mechanisms by which indicators more broadly
(including performance assessments) may cause such strong effects.
1.3 International Organizations as Narrators
Indicators and classifications can come from many different sources. Some are produced by non-
governmental organizations, such as Transparency International or Freedom House, who use them
them to monitor or “name and shame” certain behaviors.22 Others are produced by governments,
who similarly align their metrics with their diplomatic goals.23 Still others are produced by private
authorities, such as credit raters, whose independence and expertise give them a profitable business
model.24
I focus on classifications that are produced by international organizations (IOs). Of all the
previous producers mentioned, we might expect IOs (also known as intergovernmental organiza-
21An extensive literature in international relations explores the various signaling behaviors states engage in to cul-tivate their reputations or statuses. See Bordo and Rockoff (1996); Buthe and Milner (2008); Tomz (2007); Towns(2010); Hyde (2011); Bush (2011); Carnegie and Dolan (2018). Indicators are argued to be, simply, ways of measur-ing the behaviors that states undertake.
22See Buthe (2012).23See Kelley and Simmons (2015); Kelley (2017).24See Abdelal and Blyth (2015).
101010

CHAPTER 1. INTRODUCTION
tions (IGOs))25 to be the most restrained in the indicators they create. Unlike non-governmental
organizations (NGOs), IGOs are answerable to state actors and often rely on them for funding.
It is therefore more challenging for an IGO than a NGO to rate a country poorly, since an IGO
can face diplomatic consequences. Moreover, IGOs must represent a broader spectrum of views
than do individual governments. While a country might choose to create an indicator on a topic
relevant to its interests (as the U.S. did with human trafficking), IGOs represent governments with
sometimes competing interests, making it less likely that they find an issue of sufficient importance
to many that deserves the creation of an indicator. Finally, unlike private authorities, they lack a
profit motive to do so. As a result, we might expect the classifications resulting from IGOs to be
particularly innocuous, making this study a hard test for the claim that these indicators are highly
political.
Academic scholarship has been slow to identify classification as an important instrument of IO
power. In their work on IOs, Michael Barnett and Martha Finnemore called classification “one of
bureaucracy’s greatest sources of power,” but we still have little understanding of its usefulness,
its limitations, or its deployment.26 My theory provides a novel framework for explaining this
particular power of IOs.
My argument relates to one of the central debates in the IO literature about whether IOs are
powerful in their own right. For decades, scholars contended that IOs were rationally designed by
states to carry out their interests, trivializing the possibility that IOs could wield power indepen-
dently of states. In this account, states are rational actors who strategically create rule structures
in IOs that subsequently bind the agents within those institutions to doing the bidding of states.27
Many goals require coordination among states, who come together out of pure self-interest.28 This25I use international organizations and intergovernmental organizations interchangeably. While I generally refer to
them as IOs, I refer to them as IGOs in this paragraph for clarity.26More fully, the authors assert, “An elementary feature of bureaucracies is that they organize information and
knowledge. ...The ability to classify objects, to shift their very definition and identity, is one of bureaucracy’s greatestsources of power.” Barnett and Finnemore (1999, 711).
27According to Koremenos et al. (2001), “states use international institutions to further their own goals, and theydesign institutions accordingly.”
28See Keohane (1984).
111111
1.3. International Organizations as Narrators
“rational design” approach does allow for the possibility that IOs veer from state preferences, but
this is primarily explained as the result of incomplete contracting: Governments (principals) might
delegate certain activities to IOs (agents), but they cannot possibly do so with complete precision.
Since agents will always have some degree of independence from principals, it is possible that IOs
will have some leeway to ignore the preferences of governments and instead advance their own
interests.29 In a rational design framework, governments are willing to accept this inefficiency as
simply the price of forming collective institutions. While IO bureaucrats may sometimes get the
opportunity to exercise discretion, this approach primarily sees IOs merely as vehicles through
which powerful states exercise power.30
Recently, however, bureaucrats have played a primary rather than a secondary role in scholars’
accounts of IOs. Many contend that “organizational culture” drives many decisions and activities
in IOs, far beyond the mild discretion afforded to these bureaucrats in a rational choice setting.31
Instead, these bureaucrats are thought to have considerable power to set the agenda of the insti-
tution, and their beliefs and worldviews matter enormously for its undertakings.32 For example,
Chwieroth (2009) highlights the autonomy of International Monetary Fund (IMF) staff to deliber-
ate over norms surrounding capital controls and to incorporate these norms into policy decisions.33
Other work suggests that bureaucrats are even involved in the founding of new IOs and design
them in ways to insulate them from political pressures.34
Rational design theorists and organizational culture theorists tend to focus on different instru-
ments by which IOs actually exercise power. Rational design arguments often highlight the ways
in which states use IOs to channel valuable material resources. Numerous works demonstrate “pol-29See Hawkins et al. (2006).30Many prominent theorists even claim that IOs are epiphenomenal and merely reflect the underlying distribution
of power. See Waltz (1979); Mearsheimer (1994); Carr (1964). This line of argumentation is more extreme than therational design school because it does not afford any opportunity for independent IO activity whatsoever, whereas therational design school accepts that some independence may occur after IO inception. I focus on theories of rationaldesign, which are much more pervasive in the contemporary IO literature.
31See Nelson and Weaver (2016) for a review.32See Barnett and Finnemore (1999, 2004).33See also Woods (2006); Phillips (2009); Abdelal (2008); Autesserre (2014); Nelson (2017).34See Johnson (2014).
121212

CHAPTER 1. INTRODUCTION
itics at work” in the disbursement of aid and lending to recipients with greater representation on
the Boards of these institutions.35 By illustrating these political biases, many scholars interpret
this evidence as support for the idea that states have great control over IOs, whether through their
institutional design or because IOs are epiphenomenal. Other rational design scholars argue that
IOs exert influence through enacting and enforcing laws and rules that bind state behavior — of
course, states consent to these laws and rules in order to overcome their inability to coordinate ab-
sent international institutions.36 But organizational culture theorists privilege other tools used by
IOs, focusing instead on the powers of bureaucratic procedures and beliefs.37 For these scholars,
IOs affect the world by consulting with country representatives, developing worldviews, and defin-
ing and applying procedures.38 It is in the day-to-day operations, when IO bureaucrats interpret
situations and judge how to handle them, where IOs exercise the greatest amounts of power.39
This dissertation focuses on one kind of bureaucratic procedure through which IOs exercise
power: classification. Although classifications are rarely integral to an IO’s mission or identity,
they are frequently the byproduct of its day-to-day activities and operations. Bureaucrats must
judge how to handle many types of situations, and classifications are often useful for systematizing
these procedures. Classifications therefore reflect and make concrete the IO’s worldview. Although
understanding how classifications emerge is also relevant, my argument primarily seeks to explain
the power of these classifications after they come into existence. I show that these classifications35For examples of empirical works on distributive politics in development institutions, see Kuziemko and Werker
(2006); Dreher et al. (2009); Kaja and Werker (2010); Kaya (2015); Kersting and Kilby (2016).36See Keohane (1984); Koremenos et al. (2001); Dai (2007).37I distinguish these from the laws and rules described previously. The laws and rules described above apply to
states, and IOs serve to create and enforce those laws and rules. When I discuss bureaucratic procedures, I refer tomatters of operating procedure that guide how IOs institutionally respond to those they deal with.
38See Barnett (2003); Chwieroth (2009); Autesserre (2014).39In this section, I have just argued that scholars’ beliefs about who controls IOs often relate to their beliefs about
how IOs exercise power in the world. It is important to recognize that these are two distinct questions and there isnothing inherently binding these beliefs. A counter-example comes from Nelson (2017), who argues that IOs do morebusiness with countries whose officials share the neoliberal ideology of IMF bureaucrats. In this way, he argues boththat organizational culture matters and that bureaucrats influence how the IMF makes material lending decisions. I amnot aware of any counter-examples of rational design theorists who argue that IOs primarily exercise power throughtheir worldviews and operating procedures. Perhaps the reason why we do not observe more instances of this logic isthat it is much easier for principals (states) to monitor how agents (IOs) spend money or enforce observable laws thanit is for them to monitor bureaucratic procedures and beliefs.
131313

1.3. International Organizations as Narrators
are useful to many more audiences than just the bureaucrats of an IO. When they are widely used,
the worldview that classifications embody becomes highly influential. In this way, classifications
allow the beliefs and ideas of an IO to proliferate beyond its walls.40
I contend that classifications make IOs powerful narrators. Far more than just distributing re-
sources, IOs actually shape how countries are treated by other influential economic and political
actors. They do this by creating useful devices that reflect how their institution interprets and in-
tervenes in the world. Classifications are more than just pieces of data — they tell a story about
data rather than present data. Classifications organize or distill information, but in so doing, they
identify certain features as more important or essential than others and are therefore information-
reducing rather than information-increasing. Political economists and economic sociologists have
previously argued that narratives and ideas play a causal role in motivating economic behavior.41
Innovations in financial models affect the strategies used by investors, narratives about the Great
Depression shaped consumer and investor behavior during the 2008 financial crisis, and economic
ideas about embedded liberalism facilitated institutional change in recent decades.42 According
to MacKenzie (2006), economic models are an “engine not a camera,” driving behaviors rather
than summarizing them. In international relations (IR), Wendt (1992) makes a similar argument
by asserting that international anarchy — a core assumption used by many realist scholars of IR
to explain state behavior — is itself a social construct and motivates states’ behavior only insofar
as they believe it does. In other words, narratives and ideas about how the world operates can be
self-fulfilling and can themselves cause the phenomena they describe. I argue that classifications
are an example of this dynamic. Development classifications, in particular, tell a story about what40The core of my argument relates to how IOs exercise power. As noted in fn. 39, I believe this is a conceptually
distinct question from the question of who controls IOs. But the two questions are highly relevant to one another.While it is theoretically possible that states could exert influence via the classifications espoused by their IOs, inpractice, bureaucrats are likely to bear much more responsibility for designing and maintaining classifications, as itwould be difficult for states to monitor this process. I therefore see my argument as providing additional evidencefor organizational culture theories, in which IO bureaucracies are independently powerful. However, if classificationswere to become a salient and politically controversial issue, it is reasonable to expect that state actors might at thispoint reclaim some control. I will return to this issue in the conclusion, where I explore the dynamics of the producers.
41See Rodrik (2013).42See Shiller (2017); Blyth (2002).
141414

CHAPTER 1. INTRODUCTION
constitutes development and coordinate the behavior of international actors; consequently, grad-
uations from Low Income Country (LIC) status are often celebrated by national news outlets as
markers of success. Most important, I suggest that IO bureaucrats are often the narrators and have
the power to influence international politics.
It is a particularly timely moment to study the narrative functions of global development in-
stitutions. Observers note that, because of the low interest rate environment and new sources of
finance, the primary role of the World Bank has shifted from lending to facilitating international
agreements and providing expertise, affairs that are more germane to its bureaucracy.43 Moreover,
as new donors such as China and the Middle East have entered the picture, many argue that previ-
ously established Western development norms are being threatened.44 International organizations
hoping to promote a particular vision of development may find great utility in producing classifica-
tions that advance their worldview, while new and competitive institutions representing emerging
players may begin to develop their own competitor systems.
1.4 Winners and Losers from Classifications
When a country is classified by an international organization, for example as a “Failed State” or a
“Low Income Country,” this label becomes an important component of that country’s international
reputation or status. I use the terms reputation and status interchangeably to refer to a general pub-
lic perception of a country’s performance across a variety of processes and outcomes.45 Status is a
country’s standing or rank in the international system, and it is inherently positional, social, and de-
termined by international consensus.46 Classifications help to coordinate international perceptions
of a country and define its status concretely. As Kelley (2017, 51) argues, “[T]heir comparative na-
43See Ravallion (2016); Clemens and Kremer (2016).44See Brautigam (2011); Walz and Ramachandran (2010).45Note that I avoid using “reputation” to mean a country’s credibility in following through on its commitments or
promises. This specific definition is common in the IR literature (see e.g. Tomz (2007)), but I avoid this usage for thereasons described in Kelley (2017, 34).
46See Dafoe et al. (2014).
151515

1.4. Winners and Losers from Classifications
ture makes grades particularly well suited to elicit reputational concerns. Comparisons can shape
and reinforce social identities. ... When states are grouped they can compare themselves with oth-
ers — a fundamental status exercise.” The fact that many classifications are awarded on the basis
of numbers and indices adds to their appearance as objective measures of status.47
While IR scholarship has long agreed on the relevance of status for understanding international
politics, the idea that status is found in economic or governance indicators is a relatively recent
one. Security scholars have primarily been responsible for investigations of status, from early
writings on the importance of relative gains48 to power transition theories predicting that states go
to war when their social standing is threatened49 to current studies of status and war.50 But status
has received relatively little attention in international political economy.51 As global conflict has
declined and global interconnectedness has increased in recent decades, it is essential to understand
how status manifests itself in global governance. My project joins Kelley (2017) in arguing that
indicators trigger states’ concerns about their reputations.
In previous works, scholars have assumed that countries uniformly seek improvements in their
status. Kelley (2017, 38-43) mentions several reasons why states desire status and therefore desire
better performance on indicators. These include instrumental benefits (such as better terms in a
loan or investment), international legitimacy (solidifying the international community’s belief in a
government’s sovereignty), domestic popularity (when citizens care about how their governments
are perceived), or even personal social standing (leaders want to be respected too).
But I will show that some actors actually prefer a lower status or standing. This is because high
status frequently entails added international responsibilities or requirements to meet more chal-
lenging international standards. For example, countries categorized as Least Developed Countries
by the UN are excused from paying dues and also receive certain exemptions in the World Trade47See Andreas and Greenhill (2010); Merry (2011); Kelley (2017).48See Carr (1964); Morgenthau (1973).49See Gilpin (1983); Organski and Kugler (1981).50See Schweller (1999); Wohlforth (2009); Larson and Shevchenko (2010); Larson et al. (2014); Renshon (2016a,b).51For an exception arguing that states reject foreign aid in order to improve their international status, see Carnegie
and Dolan (2018).
161616

CHAPTER 1. INTRODUCTION
Organization. Lower rankings not only excuse countries from some of these commitments but also
evoke international sympathy, often carrying with it material benefits. I will argue that publics are
more willing to support foreign aid to countries that are perceived as needy, and these countries
may also attract private donors, volunteers, and missionaries. Although some countries may seek
improvements in their status, I illustrate that others sometimes seek the opposite, highlighting a
new and different kind of status-seeking behavior.
In so doing, I also contribute to a literature on the distortions that result from eligibility cutoffs.
Many social welfare and aid programs institute eligibility criteria — be they for people, groups, or
countries — and studies point to many programs where candidates appear to understate their in-
comes or overstate their needs in order to benefit. In tax policy, this is called “secondary evasion,”
and researchers can detect it, for example, when they see many more Americans than they would
statistically expect reporting incomes just below the cutoff for the Earned Income Tax Credit.52
Scholars have noted that identity groups similarly mobilize to benefit from affirmative action poli-
cies. According to Vincentnathan (1996, 490), in the 1980s, certain castes in India petitioned to
be included among the “most backwards castes” in order to take advantage of government bene-
fits. Germane to my case, existing evidence supports the idea that countries also engage in these
behaviors. Kerner et al. (2015) show that there are also many more countries than they would sta-
tistically expect reporting incomes just below the cutoff for the most generous World Bank grants.
While these distortions are not surprising to economists, it is hard to make sense of them in light
of political scientists’ widespread assumption that status is always desirable. As scholars begin to
connect indicators to status in international politics, it is essential to understand how states balance
these behaviors alongside their social statuses.
A final contribution of my argument is to show that international status interacts with domestic
politics. Existing theories of international status have tended to focus on interstate relations. For
example, Renshon (2016b) argues that states initiate violent conflict when they are dissatisfied
52See Andrew and Edward (2005).
171717
1.5. To Classify or Not to Classify?
with the status they receive in the international system. States are the primary actors in this theory,
and their preferences for status and status-seeking activities are driven by their interactions with
other states. But I will show that when a country gains status, not everyone in that country benefits
equally, and many (often marginalized) groups lose. In this way, status can be seen as a distributive
good that benefits domestic populations unevenly. This insight is essential for understanding status-
seeking behavior: It suggests that states will be more driven by status when the “winners” from
status are politically influential and “losers” have little political voice.
While developing and testing a theory of status is beyond the scope of this project, it is im-
possible to ignore the tight relationship between classifications and status. My contributions here
are threefold: to provide further evidence of this tight relationship, to illustrate heterogeneity in
preferences over status, and to show that status is a distributive good with winners and losers both
cross-nationally and sub-nationally.
1.5 To Classify or Not to Classify?
The classifications featured in this book have attracted considerable criticism and controversy.
Some want the classification systems to be reformed, others defend them, and others think they
should be abolished altogether. Many researchers have offered their well-informed and expert
opinions about how these systems should operate.
This project, however, is not about how classifications should operate but rather how they do
operate. My argument explains why this pervasive and powerful tool of governance is so powerful,
even when existing theories predict it would not be. In explaining this puzzle, I outline the political
economy of classifications and show which actors benefit and lose by them. My goal is to help
scholars to understand this important and often overlooked feature of international politics.
But doing so offers instructive lessons for the actors who themselves participate in this political
economy of classifications, and especially for the policymakers who produce them. My theory
181818

CHAPTER 1. INTRODUCTION
suggests that classifications are unlikely to go away — if the present ones were to be abolished,
persistent demand for classifications would just cause new ones to take their place.53 Moreover,
classifications are inherently political, and it is dangerous to believe that any classification could
ever be truly objective. But bearing these limitations in mind, a theory of classifications can at
least empower policymakers to design classifications that most effectively achieve their intended
objectives and avoid unintended consequences. For example, as I will show in Chapter 3, the
World Bank’s income classification system was never intended for a mass audience. But had the
designers been exposed to the lessons of this dissertation, perhaps they would have been alert to
the consequences of classification and would have designed the system differently.
1.6 Method and Plan of Dissertation
The dissertation proceeds as follows. In Chapter 2, I offer a new theory to account for the power
of classification. This theory primarily seeks to explain why international observers are influenced
by classifications. In brief, I argue that the international observers who are susceptible to cog-
nitive biases or who must justify behaviors to external audiences will be the most likely to use
classifications in their decision-making. I apply this theory to the domain of global development,
generating predictions that classifications will influence the behaviors of donors, investors, and
raters. I also explore several other observable implications of my theory regarding the experiences
of the affected parties and which classifications will produce the strongest effects.
Chapter 3 situates development classifications in historical perspective. What are the vari-
ous systems IOs use to classify developing countries? Where did they come from? I address these
questions with special attention paid to the World Bank’s classification systems and the UN’s Least
Developed Country category. This chapter highlights in a preliminary way that while classifica-
tions are not always used as intended by their designers, their design and consequences are both
53This is also implied by Buthe (2012)’s conceptual model of indicators.
191919

1.6. Method and Plan of Dissertation
often politicized.
One of the benefits of studying multiple classification systems is that their different designs
present distinct research opportunities. Chapter 4 takes a quantitative approach to systematically
testing my hypotheses in the context of the World Bank’s income classification system. In this
system, countries are categorized only on the basis of their national income statistics and whether
they fall above or below certain arbitrary thresholds. This presents ideal conditions for statistically
measuring what happens when countries cross these thresholds, even if there has not been great
or meaningful change in their real levels of development. Exploiting the exogeneity of thresholds
separating categories and applying a difference-in-differences strategy, I show with cross-national
data from 1987 to 2015 that a country’s World Bank income classification correlates with its treat-
ment by actors who are susceptible to cognitive biases or accountable to external audiences. I
also point to similar dynamics taking place in the World Bank’s lending categories. Dozens of
interviews with stakeholders in World Bank “graduation” processes between these lending cat-
egories confirm that influential donors use them in their decision-making. In sum, this chapter
provides macro-level quantitative and qualitative evidence that classifications shape the behaviors
of international observers.
The empirical findings in Chapter 4 support the claim that classification effects matter, but they
are not able to speak to why. To this end, I explore the mechanisms proposed by my theory in
Chapter 5 by fielding a survey experiment to an elite sample of development-minded participants.
In the study, participants are asked to allocate a hypothetical aid budget across several profiles of
real countries, and they do so many times. I show that participants who see countries’ classifica-
tions exhibit distinctive patterns of allocation that favor lower income countries. But to speak to
mechanisms, I introduce one last manipulation, in which a randomly selected group of participants
are informed that their decisions will be evaluated by an outside judge, triggering the strategic
mechanism. While I show that cognitive effects do exist, this strategic mechanism accounts for
much of the total classification effect observed.
202020

CHAPTER 1. INTRODUCTION
After illustrating the effects of classifications on international observers, I turn to the expe-
riences and behaviors of affected parties in Chapter 6. First, I show that classifications produce
winners and losers at the sub-national level. Unlike the World Bank’s income classification sys-
tem, the UN’s Least Developed Country category involves extensive deliberations when countries
are recommended to “graduate” from the category. This creates many opportunities for various
stakeholders to form opinions and express them. To learn these opinions, I interviewed a variety
of stakeholders from government, the business community, and civil society in one current candi-
date for graduation (Nepal) and one country that has already graduated (Botswana). My findings
suggest that while government and business interests win from this graduation process, NGOs and
those they represent suffer. Having established that these distributional consequences exist, I use
the second part of the chapter to describe the strategic responses affected parties undertake. In
particular, I provide quantitative evidence that countries actually manipulate their national income
statistics in order to obtain different income classifications from the World Bank.
Chapter 7 concludes by discussing the implications of my argument for global development,
international organizations, and theories of status. In this chapter, I return to some of the themes
explored in Chapter 3’s narrative of classification systems to consider the perspective of the in-
ternational organizations who classify developing countries. Are these organizations strategic in
how they classify developing countries? I offer some preliminary discussion on this point and raise
questions for future study.
212121

Chapter 2
Theoretical Framework
Why would classifications produced by an international organization influence the behavior of
influential actors in the international economy? Although prominent donors, investors, and raters
have expert information available to them, I provide evidence that they nonetheless rely on simple
labels to assess developing countries. The goal of this chapter is to understand why.
The theoretical framework features two mechanisms by which classifications can affect the
decision-making processes of these elites. First, classifications can affect actors for cognitive rea-
sons. Even highly informed elite decision-makers are cognitively constrained, and classifications
serve as “heuristic” devices that can simplify a complex array of information. Second, classifi-
cations can be used strategically by actors. Even if actors are not susceptible to cognitive biases,
they may nonetheless use a third-party’s classification system to justify the impartiality of their
decisions to external audiences. The mechanisms are neither complements nor substitutes but are
independent of each other; an actor could be susceptible to one, both, or neither of these two
mechanisms.
By examining how susceptible a particular actor is to cognitive biases or audience effects, we
can predict how much that actor will rely on classifications. In general, an actor susceptible to both
mechanisms may be especially sensitive to classifications, while they will be relatively useless for
22
CHAPTER 2. THEORETICAL FRAMEWORK
an actor vulnerable to neither. In applying this theory to development classifications, I examine
how these mechanisms do or do not inform the behavior of international observers whose activities
are particularly important for developing countries: donors, investors, and raters. Donors, who
are susceptible to strategic and cognitive mechanisms, will exhibit a strong classification effect;
investors and raters, who are susceptible only to the cognitive mechanism, will also exhibit a
classification effect.
These behaviors carry important implications for the countries receiving these labels and for
various groups within them. For example, if donors reduce their aid to countries newly perceived
as developed, this could negatively affect poor or marginalized populations. But firms in these
countries may enjoy greater business as a result of their new reputation. Since classifications set
in motion these far-reaching effects, we would also expect that the international organizations
producing classifications will design them strategically to achieve their intended objectives.
2.1 The Actors
I argue that classifications create a political economy in which three groups of actors participate.
Figure 2.1 depicts their interactions. The first group of actors are the producers of classifications,
that is, the institutions and individuals who devise and maintain classification systems. While many
actors produce indicators or classifications, this project focuses on international organizations for
the reasons described in the introduction. The second group of actors are those that consume the
classifications produced by international organizations. I use the term international observers to
refer to the constellation of elite political and economic actors whose behaviors shape a country’s
development trajectory. These can include, for example, powerful states, donor governments, de-
velopment banks, private investors, ratings agencies, non-governmental organizations (NGOs), and
others. The behaviors of these different international observers carry important distributive con-
sequences, both for countries and for groups within countries. Some international observers, such
232323

2.1. The Actors
Figure 2.1: The political economy of classifications
as donors and NGOs, aim to benefit marginalized or poor populations with their resources. Other
international observers, such as private investors, may allocate their capital in a way that is more
likely to accrue to elite populations. The last group of actors featured in my theoretical framework
is therefore these affected parties. Because affected parties can win or lose from classifications,
they may apply political pressure to producers to secure classifications that benefit their interests.
The core of my theoretical framework, and the focus of this chapter, explains why classifica-
tions influence international observers. It is not obvious why highly informed, elite international
observers should use classifications in their decision-making. I therefore offer a cognitive and a
strategic explanation for this phenomenon. Understanding these mechanisms leads to predictions
about which international observers are susceptible to classifications. The different relationships
international observers have with affected parties will determine the outcomes experienced by
those affected parties. While I cannot provide a comprehensive account of the distributional ef-
fects of classifications, an observable implication of my theory is that classifications will create
winners and losers, based on the specific behaviors of the international observers who use the
classifications. An additional observable implication is that producers will design classifications
strategically to achieve their objectives. While this chapter will show how these claims follow from
242424
CHAPTER 2. THEORETICAL FRAMEWORK
my theory, I reserve discussion of the actual strategies used by affected parties and producers for
Chapter 6.
2.2 The Puzzle of Classifications
A classification is a category with formal membership criteria. In some cases, an object’s classifica-
tion is awarded on the basis of an automatic process. Hurricane classification typifies this approach
to classification: The Saffir-Simpson scale classifies storms as “Tropical Storms” or “Categories 1-
5” on the basis of wind speed and a series of pre-defined, fixed thresholds. Storms are only graded
to be hurricanes when their wind speed exceeds a particular threshold; no other feature of a storm,
no matter how dangerous, can cause it to be so labeled. The scale is institutionally maintained by
the National Hurricane Center, and while the thresholds themselves have been revised, they are
done so systematically rather than on an ad hoc basis. In other cases, an object’s classification
is made deliberatively, taking into account unique features of the object being categorized. For
example, the United Nations maintains a Register of Conventional Arms, categorizing weapons
into eight groups, which range from Battle Tanks to Missiles.1 While the agency formally defines
each category, disagreements in interpretation of those definitions are frequent, inviting the need
for contextual assessment of many weapons.2 Nonetheless, there exists a formal process for this
deliberation, resulting in an official classification. Whether objects are graded automatically or
deliberatively, they receive a classification that is formally defined and awarded by an official insti-
tution. Consider, in contrast, categories for which membership is determined informally. The term
“PIGS” became popular in the 1990s as a means of talking about Portugal, Italy, Greece, and Spain
— southern European countries with growing debt vulnerability. In the intervening decades, the
label has been modified to include Ireland or Italy (“PIIGS”) and even Great Britain (“PIIGGS”).
1See https://www.unroca.org/categories.2See https://www.sipri.org/commentary/expert-comment/2015/2015-un-register-
conventional-arms-still-time-improve.
252525
2.2. The Puzzle of Classifications
This label would not qualify as a classification because there exist no formal inclusion criteria or
deliberative process.
My argument, in short, is that classifications matter, and that they matter independently of the
criteria they employ. Take, for example, a focus of this project, the World Bank income classifica-
tion system under fire from the “Raise the MIC” campaign. In 2013, Bangladesh was classified as
a Low Income Country (LIC) because its national income per capita was $900, below the threshold
of $1,045 that separates LICs and Lower-Middle Income Countries (LMICs). (Malawi, at $270,
was also included in this category.) In 2014, however, its income was $1,080, above the threshold
and qualifying it as a LMIC, a category which also included Armenia at $3,810. Like wind speeds
and hurricanes, no information other than a country’s national income per capita is used to deter-
mine its income classification. The very same national income data used to classify economies
is widely available through the World Development Indicators, and, as I explain in greater detail
in Chapter 4, the thresholds separating the categories were arbitrarily selected. Consequently, an
international observer can arguably learn much more by looking at Bangladesh’s raw income per
capita than she can by looking at its classification, by which metric Bangladesh graduates from
Malawi’s category to Armenia’s in a single year. Nonetheless, I will show that international ob-
servers are often sensitive to these classifications, even when they know the underlying information
that determine them.
Some scholars of international organizations may find it unsurprising that classifications in-
fluence the behaviors of international observers. After all, regulatory agencies regularly classify
goods and behaviors to enable consumers to make informed decisions without being technical ex-
perts about their health, safety, or environmental consequences. These classifications summarize
technical information that may be publicly available but difficult for a non-expert consumer to syn-
thesize or comprehend. Indeed, technical expertise is a leading explanation for the empowerment
of private regulatory authorities; governments are willing to stomach policy uncertainty in ex-
262626

CHAPTER 2. THEORETICAL FRAMEWORK
change for the value of costly expertise.3 Similarly, the provision of technical expertise is among
the many collective action problems international organizations are thought to address, leading
many to argue that states rationally design institutions to further their independent and mutual in-
terests.4 Classifications could be rationally important if they communicate technical information
to non-experts.
But not all classifications communicate expert information. Some of the most prevalent classifi-
cation systems are highly simple and can be easily reproduced using publicly available data. While
one could argue that the classification still communicates expert information about how a particu-
lar concept should be measured, in many domains like democracy or development, the categories
being defined are themselves contested concepts. Even if defining them also requires expertise, it
is impossible to create these categorizations devoid of political influences.5 Moreover, an explana-
tion centered on technical expertise cannot explain why classifications shape the behavior of actors
who are also expert in the topic being measured. As I will show, development classifications do
affect the behavior of actors with deep contextual and economic knowledge about the countries
being measured, who would be both able to and better served to identify the most relevant features
of development for their purposes. The technical expertise or information explanation therefore
falls short.
Others who approach the study of institutions from a rational design perspective could view
classifications as rules that states agree to in order to coordinate their behaviors. According to
regime theory, as developed in Keohane (1984), international organizations are rationally formed
by self-interested states who wish to change the international environment in ways that allow them
to cooperate. In particular, institutions provide clusters of norms and rules that states follow in
order to reduce transaction costs and improve the predictability of decision-making. In the long
run, following these “rules of thumb” results in long-term efficiency gains that are far greater than3See Mattli and Buthe (2005); Mattli and Woods (2009).4See Abbott and Snidal (1998); Koremenos et al. (2001); Porter (2003).5See Buthe (2012); Bush (2017) for examples, with special attention on the Freedom House Freedom in the World
index.
272727
2.2. The Puzzle of Classifications
the immediate gains to be had by ignoring a rule in a particular case. Furthermore, Keohane (1984)
points out that governments are “boundedly rational” — that is, they are complex organizations
incapable of processing infinite information — which exaggerates the efficiency gains to be had
from following these rules. In this account, institutional rules exist in equilibrium; they arise in
response to self-interested states’ demands for long-term coordination, and for that reason states
tend to follow them.
Although I will argue that classifications coordinate behaviors, this account also falls short in
understanding their power. In Keohane’s framework, states empower institutions to create rules
that allow them to coordinate, which serves their interests; they follow the rules for the same
reasons they, in part, consented to them. But classification systems do not often come from state
demands — they come from the bureaucrats within international organizations. As I will show in
Chapter 3, while some of these bureaucrats appear to have entrepreneurially designed classification
systems that achieve intended ends, others create classification systems with wholly unintended
but large consequences. Regardless, these classification systems typically arise in international
organizations decades after their inception, suggesting they are less important to states than the
core rules and laws critical to the design of many institutions. Indeed, while it is understandable
why states would want to coordinate their behaviors in the form of laws and rules, it is less clear
what is gained by coordinating their beliefs about concepts such as democracy or development.
In fact, in the aid landscape, overly coordinated behaviors are actually problematic: when donors
“herd” around preferred recipients, other recipients are neglected.6 The rational design account
seems better suited to understanding why states follow institutional rules than to why they pay
attention to institutional classifications.
But the broader intuitions of regime theory are highly relevant and critical to my argument.
In particular, I share Keohane’s view that states are boundedly rational. In his account, bounded
rationality exaggerates behaviors that can be explained by rational means, but bounded rationality
6See Frot and Santiso (2011); Galiani et al. (2015).
282828

CHAPTER 2. THEORETICAL FRAMEWORK
is even more central to my account, since I have just shown how the rational design of institutions
does not adequately explain the power of classifications. For this reason, one of my central mecha-
nisms will be a cognitive mechanism, and I will argue that cognitive biases affect not only states but
also important non-state actors. While I will also introduce a strategic mechanism that can account
for the classification effect, this mechanism will involve a different rational logic than Keohane’s
argument about the design of institutions. Instead, I will argue that actors use classifications in
their decisions to rationally justify their decisions to external audiences.
In articulating these two mechanisms, my theory not only generates predictions for which ac-
tors rely on classifications but also, in a more limited sense, yields insights about what kinds of
classification systems are likely to be selected. All else equal, international organizations will
promote classification systems that they believe will be the most powerful. In brief, my theory
suggests that the simplest systems that are most easily understood by mass audiences will domi-
nate. But international organizations are also, to some extent, vulnerable to political pressure from
groups with interests in receiving a particular classification. One implication of my argument is
that classification systems, by coordinating many international behaviors, have distributive con-
sequences for both countries and particular groups within those countries. While I am unable to
comprehensively map the political economy of these consequences and interactions, I can show
that certain groups and states win and lose from classifications, and those groups will try to influ-
ence their classifications and classification systems strategically. International organizations will
therefore try to promote simple and intuitive classification systems that satisfy the preferences of
powerful states or interests. This sheds light on questions that are integral to regime theory: If
classifications are just rules, and rules are just coordinating devices, which rules will be selected?
Which equilibrium prevails?
292929

2.3. Why Classifications Work
2.3 Why Classifications Work
In what follows, I offer a theoretical framework to account for the disproportionate power these
classifications acquire. In brief, I lay out a cognitive mechanism by which classifications act as
heuristic devices to simplify decision-making and a strategic mechanism by which actors use clas-
sifications produced by a third-party actor to demonstrate the impartiality of their decisions. Sep-
arating these mechanisms improves our ability to explain variation in how classifications are used
and builds on existing scholarship seeking to understand indicators. Buthe (2012)’s conceptual
model shows that the “users” of an indicator encompass a broader audience than just the “rule-
demanders,” the group that demands an indicator from a private authority. By explaining what
kinds of indicators are likely to affect which actors, my theory speaks to the composition of an
indicator’s group of users (“international observers” in my model), which in turn has implications
for the kinds of indicators that will be supplied.
2.3.1 Cognitive Mechanism
Extensive research in behavioral economics has documented that many decision-makers are sus-
ceptible to cognitive biases that sway their decisions in irrational ways. One important finding
from this literature is that people lack the ability to process abundant information and behave ra-
tionally, and they turn to shortcuts or “heuristics” to assist in their decision-making.7 People often
cope with uncertainty and complexity by distilling a judgment or decision to simpler elements.
Specifically, individuals may use categories to make inferences about less familiar cases based
on the other cases they known in a category.8 In this way, heuristics are effort-reducing. Studies
show that categories cause individuals to think units are more similar within group and more dif-
7See Simon (1955); Conlisk (1996); Kahneman (2011).8These are known as representativeness heuristics. See Fiske and Taylor (2013).
303030
CHAPTER 2. THEORETICAL FRAMEWORK
ferent between group.9 Many developing countries may be especially unfamiliar to international
observers, making the heuristic all the more valuable. These practices can lead to stereotype bias,
as people can later activate learned categories when confronted with an evaluation or decision. At
this point, people tend to explain away information that is inconsistent with the held stereotype,
while latching on to reinforcing information.10 Data about developing countries often presents a
mixed picture, but heuristics will facilitate international observers’ propensities to explain away
inconsistencies. Other political scientists have investigated the relevance of heuristics to interna-
tional economic behavior, with evidence showing that peer country groupings influence sovereign
lending practices.11
Cognitive psychology has also shown the existence of a “halo effect,” which could amplify the
heuristic effects of classifications. Social psychologists have amassed evidence that an individual’s
opinions about an actor’s attribute A are influenced by information about that actor on unrelated
attribute B. For example, evidence shows that people who are thought to be more attractive are
often perceived as being more competent or intelligent.12 If actors in the international commu-
nity are also susceptible to this bias, classifications could affect international perceptions on more
dimensions than just that which they seek to measure. For instance, countries that graduate in a
development classification might also more easily persuade observers that they are democratic or
respect human rights.
Evidence from economics suggests these cognitive biases could affect the behavior of even
elite, highly informed actors. Previous works have pointed to the role of euphoria and positive
affect in how investors evaluate risk and returns, and these cognitive factors have been partially
blamed for financial crises.13 According to Steinbruner (1974), decision-makers actually work9Tajfel and Wilkes (1963) conduct an experiment in which individuals are asked to estimate the lengths of four
short lines labeled “A” and four long lines labeled “B.” The group who saw the “A” and “B” labels estimated thewithin-group lengths to be more similar than the group who did not see the labels. See also Taylor (1981); Wilder(1986) for social psychological studies of categorizations and intergroup bias.
10See Fiske and Taylor (2013, 296).11See, for example, Gray (2013); Gray and Hicks (2014); Brooks et al. (2015); Brazys and Hardiman (2015).12For a review, see Greenwald and Banaji (1995).13See Aspara and Tikkanen (2010); Kindleberger (2005) in addition to Gray (2013); Brooks et al. (2015).
313131
2.3. Why Classifications Work
to avoid exposing themselves to all relevant information in order to make it possible to navigate
complex problems, group decision-making dynamics, and conditions of uncertainty.14 At the same
time, it is possible that elite actors have more informed priors that are less sensitive to the heuristics
I describe. Moreover, decisions that are filtered through more institutionalized processes with more
veto players could be subject to greater, rather than less, rational scrutiny.15 Psychological research
shows that asking individuals to justify their treatment of cases reduces the effects of implicit
bias.16 Consequently, to a great extent, whether or not elite actors are susceptible to the cognitive
biases documented in the mass population remains an empirical question.
2.3.2 Strategic Mechanism
Even actors who are not susceptible to cognitive biases could nonetheless rely on classifications for
strategic reasons. When actors are responsible for making contentious distributive decisions that
will produce backlash from those who are adversely affected, using a classification developed by a
third party allows them to evade accusations of being partisan or political in their decisions. This
logic has previously been used to explain why governments delegate regulatory powers to inde-
pendent agencies. Weaver (1986) notes that one way legislators often avoid blame is to “cede dis-
cretion to the president or an independent agency for making politically costly decisions” (375).17
Similarly, if political actors incorporate classifications formally or informally into their allocative
decisions, they can credibly demonstrate their impartiality to any supporters who demand it. Since
an actor’s own classification system will never be perceived as credibly impartial, the actor prefers
14These organizational conditions that exacerbate cognitive biases have been especially scrutinized in security stud-ies. See Jervis (2006) for an example.
15Indeed, one of the most prevalent critiques of psychological theories of international relations is that these theoriesrarely offer an argument for how individual-level psychological traits explain behavior at the state level of analysis. Forexample, in their critique of the research on status inconsistency, Dafoe et al. (2014) argue, “international relations (IR)studies that used this as their theoretical foundation did not typically contain any theory that explained why we shouldexpect individual-level results linking inconsistency to “violent” or “dysfunctional” behavior to translate directly toworld politics.” (388)
16See Taylor (1981).17See also Fiorina (1982); Mattli and Buthe (2005); Flinders and Buller (2006); Landwehr and Bohm (2011).
323232
CHAPTER 2. THEORETICAL FRAMEWORK
this approach to spending valuable time and resources on a proprietary system.18
This argument is related to but distinct from an existing explanation for the influence of “pri-
vate authority” in world politics. Green (2013, 42-43) defines “private authority” as “situations
in which non-state actors make rules or set standards that others in world politics adopt.” One
explanation for the influence of private authority centers on the independence and neutrality of
that authority. For this reason, Green’s definition specifically excludes international organizations
“since they comprise state representatives who are responsible for taking or delegating decisions”
and therefore are not neutral. While this is true in an objective sense, multilateral organizations
are more widely trusted by the public than governments, especially to carry out development.19
Indeed, the perception of the classifier’s neutrality (particularly as compared to the perception of
the classification user’s neutrality) is sometimes more important than the neutrality itself.20
The strategic mechanism is most likely to affect the least autonomous actors, especially those
that are agents in a principal-agent relationship. The more an actor must produce evidence of
her strong performance in order to receive funding or avoid punishment, the more that actor must
prioritize the appearance of her behavior over making the most informed decision. Conversely,
an autonomous actor who reports to no one can behave optimally, no matter how it looks to an
outside audience. The strategic mechanism is therefore most strongly present in relationships of
institutional delegation.
18These resources are not insignificant: The World Bank data group has received much criticism regarding itsclassification system. See Fantom and Serajuddin (2016).
19Milner (2006) presents data from the Eurobarometer illustrating that Europeans had greater confidence in multi-lateral institutions than in their governments to give effective aid. Kaya and Walker (2014) present more recent surveydata from Europe indicating that Europeans have greater overall confidence in international organizations than in theirgovernments. Although it is possible that public trust in international organizations is waning (Bearce and Scott,2018), it is not clear that the gap between trust in international organizations and domestic governments is waning.
20Sinclair (2005) and Bush (2017) argue that credit ratings agencies and Freedom House respectively have beenawarded positions of private authority but are not the neutral, technical agencies they purport to be.
333333

2.4. Empirical Expectations
2.4 Empirical Expectations
In this section, I apply the theoretical framework to the case of development classifications. First,
I select the international observers whose behaviors are most important for developing countries:
donors, investors, and raters. For each class of observers, I analyze how susceptible we would
expect them to be to either or both the cognitive and strategic mechanism. This results in an expec-
tation for each about the existence and magnitude of a “classification effect.” While my theoretical
framework is itself agnostic about the direction of this effect, I draw on existing literature and a
survey of experts to predict in what direction each class of actors would adjust their behavior af-
ter observing a classification. Second, taking the predicted behaviors of international observers,
I outline the downstream consequences we would expect to see of those predicted behaviors on
the experiences and actions of affected parties. These serve as additional observable implications
of my theory. Third, in light of the two mechanisms, I explore which classifications are likely to
produce the strongest classification effects.
2.4.1 How International Observers Use Classifications
I investigate observers whose behaviors have profound effects on the economic and political tra-
jectories of developing countries: donors, investors, and raters. I select donors and investors be-
cause they are two of the three largest sources of external finance for developing economies.21 For
decades, donors have played a crucial role in correcting market failures by supplying finance to de-
veloping countries. International targets to increase official development assistance (ODA) to .7%
of national income suggest how greatly this aid is valued.22 Increasingly, though, the development
community recognizes the importance to developing countries of foreign direct investment (FDI),
that is, the ownership of enterprises in developing economies by foreign firms. While academic
21See UNCTAD (2017). The third source of external finance is from remittances, but since I do not expect migrantworkers abroad to be affected by classifications, I do not include this outcome in my study.
22http://www.oecd.org/dac/stats/the07odagnitarget-ahistory.htm
343434

CHAPTER 2. THEORETICAL FRAMEWORK
research finds mixed results on the effectiveness of FDI as a development strategy, it is widely
prioritized by international organizations and countries.23 For instance, the 2002 Monterrey Con-
sensus states, “Private international capital flows, particularly foreign direct investment, along with
international financial stability, are vital complements to national and international development ef-
forts. Foreign direct investment contributes toward financing sustained economic growth over the
long term.”24 Private investors are thought to be so important to development that donor govern-
ments dedicate development finance, such as the United States (U.S.)’ Overseas Private Investment
Corporation, toward facilitating their investments in poor countries.25 I also select raters because
their assessments are often the gateway through which developing countries can access both the
forms of external finance described above as well as international bond and loan markets. Democ-
racy ratings, and especially those produced by Freedom House, are widely cited ingredients in aid
and investment decisions.26 To survive in a global economy, developing countries must concern
themselves with the way they are perceived by these actors.
However, important differences among these actors mean that they are not likely to be uniform
in their sensitivity to either of my hypothesized mechanisms. I proceed by discussing each of these
actors in turn: Given findings in the literature about the decision-making processes of each of
these actors, I discuss which mechanisms are likely to transmit any classification effect and what
the direction of that classification effect is likely to be.
Donors
Donor agencies are especially sensitive to the strategic mechanism, as they must justify their allo-
cation decisions to the legislatures (and, by extension, mass publics) that determine their budgets.
Donor agencies often try to emphasize their impartiality in their concern for development. Mil-
23See, for example, Kosack and Tobin (2006).24http://www.un.org/esa/ffd/monterrey/MonterreyConsensus.pdf, paragraph 20.25See https://www.foreign.senate.gov/imo/media/doc/070716_Moss_Testimony.pdf for
a description of the importance of OPIC to U.S. development goals.26See Blanton and Blanton (2007); Buthe and Milner (2008); Bush (2017).
353535
2.4. Empirical Expectations
ner (2006), for example, argues that bilateral donors finance multilateral agencies, who are more
trusted by the mass public to carry out development, in an effort to reassure their funders that
they are providing needs-based aid. This aim was also behind the founding of the Millennium
Challenge Corporation (MCC), which was intended to be an apolitical aid instrument for the U.S.
government. Consistent with my argument, MCC has developed an eligibility and allocation rubric
that relies heavily on democracy measures produced by Freedom House, an external agency.27 This
allows MCC to avoid any appearance of making partisan decisions in its development assistance.
Particularly in the present political environment in which donor publics often feel aid could be
better spent at home, even bilateral donors with expressly political objectives may need to illus-
trate the impoverishment of their recipients to maintain support for funding aid.28 Donors are often
evaluated by the proportion of aid given to countries categorized as developing. For example,
the first page of every “peer review” conducted by the Organization for Economic Cooperation
and Development (OECD) of donor countries shows a pie chart depicting the donor’s allocation
of aid by income group and Least Developed Country (LDC) status.29 In this way, international
organizations (IOs) can influence the behavior of states indirectly by shaping the standards the
mass public and, by extension, legislators use to evaluate their governments.30 Additionally, this
logic potentially explains why researchers have observed frequently counterproductive “herding”
behavior among donors, who duplicate rather than complement the assistance provided by other
donors.31
Some donors are more susceptible than others. For example, Honig (2019) illustrates that
while some agencies receive considerable control over their operations, others are highly restricted27See Bush (2017).28For evidence connecting financial crises to reductions in aid, see Heinrich et al. (2016). Research on public opinion
in donor countries finds that humanitarian, altruistic, and sometimes paternalistic concerns can motivate individualsto support foreign aid or immigration despite countervailing nationalist incentives (Paxton and Knack, 2012; Newmanet al., 2013; Bechtel et al., 2014; Baker, 2015). This research suggests that emphasizing the relative need of aidbeneficiaries will improve support for foreign aid.
29See e.g. https://www.oecd.org/dac/peer-reviews/OECD\%20Australia\%20FinalONLINE.pdf.
30Similar arguments have been made about IOs in the context of military interventions. See Chapman (2009).31See Frot and Santiso (2011); Galiani et al. (2015).
363636
CHAPTER 2. THEORETICAL FRAMEWORK
by unpredictable and contingent sources of funding. These latter “insecure agencies,” which are
extensively monitored and evaluated, are more likely to prioritize the appearance of success over
prudence in development interventions. Given their institutional design, I would expect these non-
autonomous agencies to rely more heavily on classifications, since they must perpetually justify
their decisions and behaviors.32 Classifications can also provide a useful way for aid agencies to
signal their excellent performance to audiences, such as domestic constituencies or even to their
peers.33 When aid agencies face scrutiny from either of these audiences about the impartiality of
their decisions, they will be more likely to use classifications.
Turning to the cognitive mechanism, there is a weaker but non-trivial argument that donors
could be susceptible to cognitive biases. Of all the observers involved in my study, donors are the
most expert on the topic being described by a classification. This expertise could serve to reduce
their cognitive bias, as they may be more attentive to the nuances that must be taken into account
when considering classifications. While there have been a number of studies documenting cogni-
tive biases and stereotypes in the mass public’s preferences over aid allocation, to my knowledge,
no studies document these biases in elite decision-makers.34 This lack of empirical evidence means
that I do not rule out the possibility that donors could exhibit a cognitive bias, despite their relative
expertise. Testing this claim empirically will be one of the contributions of this project.
Given the strategic and cognitive reasons for donors’ sensitivity to classifications, I expect that
higher classifications will result in lower levels of aid, as a country is perceived as less needful
of assistance. Lumsdaine (1993) argues that the majority of foreign aid serves the humanitarian
interest of a donor public in improving conditions of poverty. While subsequent empirical research
reveals that donors’ strategic interests and concerns about governance in recipient countries also32Similarly, democratic donors have greater strategic incentives to use classifications in their decision-making, as
they must justify these behaviors to domestic audiences.33Honig (2019) argues that aid agencies try to improve their performance on the Aid Transparency Index out of
concern for their social reputation in the donor community. It is possible that aid agencies wish to show each other,not their funders, that they benefit the neediest. This possibility still follows the strategic logic in the sense that donorsuse classifications to signal to audiences.
34Napier et al. (2016) use an experiment to measure how maps cognitively change aid allocation decisions made bycollege students, but the study has not yet been fielded on an elite sample.
373737

2.4. Empirical Expectations
Table 2.1: Predicted mechanisms and hypotheses (by observer)
Mechanism HypothesisCognitive Strategic Higher classifications...
Donors X X H1A: ↓ aid...Donors facing scrutiny X XX H1B: ↓ ↓ aidInvestors X ∅ H2A: ↑ perceived creditworthiness
X ∅ H2B: ↑ FDIRaters X ∅ H3: ↑ democracy scores
...even with no real change.
condition allocation behavior, ceteris paribus, donor countries will be more likely to give aid to
needier recipients.35 Because aid is a scarce resource, I do not expect donors to contribute more to
a country perceived as more developed.
Hypothesis 1A. Higher classifications will decrease the amount of aid a country receives. This
effect will be transmitted through both cognitive and strategic mechanisms.
Hypothesis 1B. Classifications will most strongly affect aid from donors facing scrutiny from
external audiences.
Investors
Lacking capital, many developing countries depend heavily on foreign investment. This investment
can occur through two channels: portfolio investment (namely, sovereign lending) — in which
investors lend to national governments and retain no control over how the money is used — or
FDI — in which investors (often firms) directly invest their capital in a host country and maintain
control over its management. While their decision processes may differ, both types of investors
must assess the riskiness of a prospective investment. National governments could default on a
loan and lose the investor’s principal. Additionally, host governments could choose to violate the
property rights of a foreign firm in their country and render an investment unprofitable. Investors
therefore take into account many political factors that could influence this risk, including elections
35See Alesina and Dollar (2000); Neumayer (2005).
383838
CHAPTER 2. THEORETICAL FRAMEWORK
and institutions.36
However, risk is challenging to measure objectively, and existing research supports the idea
that investors’ risk perceptions are prone to cognitive biases. The very discipline of behavioral
economics grew in order to explain “irrational exuberance” in financial markets and did so by
documenting investors’ propensities for overconfidence and loss aversion, even in the face of real
penalties and losses.37 Investors’ beliefs, however irrational, in turn have enormous bearing on
the functioning of the global economy.38 One of the cognitive biases scholars have observed in
investors is their use of heuristics. In particular, investors heavily depend on peer country groupings
to assess the riskiness of a potential borrower.39 Even at the management level, canonical economic
models fail to explain the decisions of managers to internationalize their firms.40 Of particular
interest is the possibility that conceptions of “foreignness” and “distance” influence decisions more
than can be explained objectively.41 These studies suggest ample cause for concern that investors
may be cognitively predisposed to rely on the salient peer country groupings that follow from
classification systems.
Investors are less susceptible, however, to the strategic mechanism. This results from a profit
motivation, which is conventionally viewed as the primary determinant of their behavior.42 First
and foremost, investors seek to deliver a return on their investments. If they were to sacrifice profit
in the pursuit of social goals, this would violate their commitments to shareholders. Investors,
therefore, should not be concerned with the appearance of their decisions to an external audience.
One challenge to this view stems from the observation that human rights violations deter FDI.43
Some argue that multi-national corporations are, in fact, punished by consumers for exploiting
36See Mosley (2003); Bernhard and Leblang (2006); Tomz (2007).37For a summary of the discipline, see Shiller (2015); Thaler (2015).38See MacKenzie (2006); Blyth (2002).39See Gray (2013); Brooks et al. (2015).40See Aharoni (2010); Maitland and Sammartino (2015).41See Williams and Gregoire (2015).42See, for example, Grieder (1998).43See Blanton and Blanton (2007); Barry et al. (2013).
393939
2.4. Empirical Expectations
workers and investing in countries known to violate human rights.44 Even if this were to be the
case, it is not clear how this logic would translate from the domain of human rights to the domain of
development; if anything, these same audiences that punish human rights violators would be more
likely to support a firm’s investment in a country needing outside capital to create jobs. More-
over, the connection between human rights records and FDI can still be explained by investors’
self-interest: human rights violations signal a government’s willingness to ignore the law, which
heightens political risk for investing firms. Since investors are accountable only for delivering a re-
turn on their investments and not for the fairness implications of their decisions, any classification
effects they exhibit cannot be explained by the strategic mechanism.
If classifications have the cognitive effects I anticipate, then I expect the direction to be positive.
Investors will likely view higher levels of development as signs of stability and will be more likely
to invest in countries that are perceived as more developed. An extensive literature on the deter-
minants of FDI suggests that there exists a “developed nation discount.” Investors are attracted by
the high levels of industrialization, human capital, stable political environments, and democratic
domestic institutions.45 Although these factors are conceptually distinct from development, they
are frequently correlated with a country’s national income level, and many studies illustrate that
investors overlook these factors for countries that are viewed as developed.46 This behavior is es-
pecially consistent with the well-documented “halo effect,” whereby observers associate unrelated
positive or unrelated negative characteristics. An investor susceptible to cognitive biases may as-
sume that a country experiencing a higher level of development may also be more democratic and
politically stable.
Hypothesis 2A. Higher classifications will improve investors’ confidence in a country’s creditwor-
thiness. This effect will be transmitted through only the cognitive mechanism.
Hypothesis 2B. Higher classifications will result in greater FDI. This effect will be transmitted44See Spar (1998); Barry et al. (2013).45See, for example, Chan and Mason (1991); Noorbakhsh et al. (2001); Jensen (2006); Buthe and Milner (2008);
Biglaiser and Staats (2010).46See Mosley (2003, 2005); Blonigen and Wang (2005); Wibbels (2006).
404040
CHAPTER 2. THEORETICAL FRAMEWORK
through only the cognitive mechanism.
Raters
As argued in the introduction, ratings issued by prominent organizations in the global economy
are increasingly important for how states are treated in the global economy. Countries routinely
protest how they are scored on various metrics precisely because these numbers empower them to
pursue more diverse economic strategies — indeed, this is the motivation for this project.47 But one
possibility that has not yet been considered is the inter-dependency of ratings. Ratings are treated
as separate evaluations by independent authorities of certain attributes. Is it possible, though, that
raters also rely heavily on each other in their deliberations? To answer this question, I draw on
existing knowledge about the practices of raters to assess their susceptibility to the cognitive or the
strategic mechanisms.
While there are no direct studies (to my knowledge) of cognitive biases in raters, there is
certainly evidence that the methodologies of some raters permit these biases to influence ratings.
Although ratings agencies like to create the appearance of objectivity, in practice, some approaches
allow for highly subjective opinions to determine a rating. Bradley (2015, 37-38) describes, for
example, the coding criteria of Freedom House, a prominent rater of democracy and the focus of
this study:
Each main question is fleshed out in subquestions to guide scorers, although even
these subquestions are highly general and subjective in nature. In 2011, for instance,
a main question for ‘Functioning of Government’ included ‘Is the government free
from pervasive corruption?’ ... The subquestions illuminate some aspects of the main
question but are hardly designed to lead to comprehensive or verifiable results. ... In
addition, the actual, question-by-question breakdown of data — not to mention the
47See Cooley and Snyder (2015).
414141
2.4. Empirical Expectations
scorers’ identities, scorecards, or rationales is not publicly available.48
Ratings agencies may vary on this dimension, as some agencies using more objective and falsifiable
criteria than others. But where raters do not take measures to institutionally counteract these biases,
they may infiltrate the resulting ratings. In the Freedom House case, Bush (2017) illustrates that
the ratings consistently favor countries that vote with the United States at the UN. While this is
evidence of a political bias, cognitive biases can operate in a similar way.
Although raters are accountable to external audiences, I do not expect them to use classifica-
tions as a signaling device, as donors do. Like donors, raters are sometimes agents in a principal-
agent relationship. They may rely on a certain organization or interest group for funding, and there
are clear incentives for them to adopt ratings that promote their principal’s interests.49 Other raters
may be independent, using their indicators to advance their own ideological objectives or brand
name.50 But regardless of which career concern motivates raters, it is never in their strategic in-
terest to use a classification produced by another rater. Doing so concedes the relevance of their
competitors’ indicators and undermines their own. Recall that in the case of donors, classifications
were valuable precisely because they allow donors to publicly show that their aid benefits countries
that are labeled “developing” by a third-party. Conversely, a public admission that a rater made use
of a third-parties categorization backfires because it weakens the distinctiveness of the rater’s own
product. Raters should therefore never be strategically incentivized to use these classifications,
even if they are accountable to external audiences.
If a classification effect exists, then, I attribute it to a cognitive mechanism. Evidence of such
a classification effect would be especially concerning, as it suggests interdependencies between
ratings organizations. Such interdependencies could make it especially challenging for countries
48This codebook is itself the product of reforms within Freedom House, which originally awarded ratings on an evenmore tenuous basis. In the late 1980s, when the founder of Freedom House faced criticism for his use of numbers, hedefended his ratings by arguing that they are awarded on the basis of “holistic judgment.” Raymond Gastil, quoted inBradley (2015, 39).
49See Pistor (2012).50See Espeland and Sauder (2012).
424242

CHAPTER 2. THEORETICAL FRAMEWORK
to break out of their perceptions and change their scores.
In terms of direction, I expect a classification effect to bias ratings upwards rather than down-
wards. The halo effect suggests that individual raters will likely reward countries perceived as
more developed with higher scores on other dimensions. In no circumstance do I expect these
scores to be inversely correlated.
Hypothesis 3. Higher classifications will improve a country’s subjectively-determined ratings on
other dimensions, such as democracy scores. This effect will be transmitted through only the
cognitive mechanism.
Because the directions associated with each of these hypotheses are based on assumptions
that follow from existing literature, rather than following directly from my proposed theory, I
also surveyed a group of experts about their beliefs regarding the existence of and directions of
classification effects. Overall, respondents expected classifications to have effects in directions
that are consistent with the extant literature. (Details and results are available in Appendix A.)
Taken together, these hypotheses, if confirmed, suggest which actors more broadly are likely to
use classifications in their analysis and decision-making. If support is found, it sheds light on the
composition of the “users” in Buthe (2012)’s conceptual model of indicators. Specifically, those
actors who are susceptible to cognitive biases or must justify politically sensitive decisions to an
external audience will be the most likely users of a given classification system.
2.4.2 The Distributive Effects of Classifications
Above, I hypothesize that classifications will influence the amount of aid a country receives as well
as investors’ and raters’ perceptions of its economy. In this section, I explore how these outcomes
will be experienced by affected parties, the groups within and governments of classified countries.
While some groups and countries may be highly attuned to flows of foreign aid, other groups
and countries may pay greater attention to investor and rater perceptions. In other words, these
outcomes create different winners and losers. If classifications powerfully drive these outcomes,
434343
2.4. Empirical Expectations
then affected parties may try to change their classifications as a means of achieving their political
and economic goals, to the extent they are able. By illustrating which actors may be affected
by these important outcomes and how they may respond to classifications, I develop additional
observable implications of the above theoretical framework.
Foreign aid is an important source of funding for NGOs. Donors often choose to hire NGOs as
contractors to implement aid projects to take advantage of their local knowledge and, sometimes,
to bypass the state.51 Losing this foreign assistance, then, can severely restrict NGOs’ activities.
In Uganda and Kenya, legal bills threatening to reduce the amount of foreign funding NGOs can
accept have been met with vigorous opposition.52 Studies show that these grants are essential
to NGO survival.53 Even if NGOs are acting on behalf of others rather than in the interests of
their own survival, they represent populations that have often been marginalized or neglected by
their governments and so also benefit from foreign assistance. While these individuals may be
unaware of who actually funds aid projects in their area,54 leaders in NGOs (especially larger
NGOs and umbrella organizations) may be better informed and able to make this connection.
In this way, I expect NGOs to experience the negative repercussions of losing foreign aid. To
the extent that they associate these aid losses with classifications and are able to influence their
country’s classifications, I expect them to seek lower classifications.
Hypothesis 4A. Higher classifications will have a negative effect on NGOs.
Hypothesis 4B. NGOs will seek lower classifications, when possible.
The private sector, however, benefits from the willingness of foreign firms to invest in and do
business in their country. As such, these firms should greatly value their country’s international51See Murrell (2002); Dietrich (2013).52See Kelli Rogers, “Kenyan CSOs, NGOs to fight proposed foreign funding restrictions,” Devex, November
14, 2013. https://www.devex.com/news/kenyan-csos-ngos-to-fight-proposed-foreign-funding-restrictions-82297
53See Burger and Owens (2013).54See Dietrich et al. (2018). Of course, it is also important to note that foreign aid is often redirected away from
the poor and toward electorally valuable constituencies. See Jablonski (2014); Briggs (2015). To the extent that thisoccurs, the poor may not receive sufficient aid to experience a steep loss following a country’s classification. Thismakes it less likely that I would observe an effect of classifications on NGO experiences or behaviors, suggesting thatany evidence I find in support of these hypotheses makes an even stronger case for my argument.
444444

CHAPTER 2. THEORETICAL FRAMEWORK
reputation. It is widely believed that international investors depend heavily on a country’s ratings
when choosing where to invest their capital.55 Increases in investment and improvements in ratings,
predicted in hypotheses 2 and 3, will largely benefit the business community. I therefore expect
firms to experience greater business as result of higher classifications and that they will pressure
their governments to seek higher classifications.
Hypothesis 5A. Higher classifications will have a positive effect on firms.
Hypothesis 5B. Firms will seek higher classifications, when possible.
Governments of countries may also experience gains and losses as the result of different clas-
sifications, but the net effects are ambiguous. On the one hand, governments may also suffer as
the result of losing foreign aid if such assistance is integral to their budget support or (perversely)
if they rely on using foreign aid to buy votes. On the other hand, governments too can benefit
from improvements in perceptions of their country. Materially, these improvements can allow the
government to borrow on more favorable terms. Socially, leaders may enjoy greater standing in
diplomatic and professional relationships.56 To fully explain how governments experience classifi-
cations and act on them would require a complete theory of their preferences and action sets, which
is beyond the scope of this project. Nonetheless, evidence of any strategic behavior at all on the
part of governments is consistent with my argument: governments do experience the distributive
effects of classifications and seek classifications that are consistent with their overall political and
economic strategies, whatever those strategies may be.
Hypothesis 6. Dissatisfied classified governments will try to influence their country’s classifica-
tion.
55See Jayasuriya (2011).56See Kelley (2017).
454545

2.4. Empirical Expectations
2.4.3 Which Classifications Prevail
If classifications operate via a cognitive and a strategic mechanism, then we would also expect
some classifications to be more powerful than others. According to both mechanisms, classifica-
tions derive their power from their simplicity. Cognitively, they are most helpful when they allow
an international observer to quickly intuit a country’s level of development without too much de-
tail. Strategically, international observers also want them to be simple enough to be understood
by a less-informed principal, such as a legislator or in the eyes of the mass public. Even if tech-
nical classifications conceivably more meaningfully capture the concept of interest, simpler clas-
sification systems will be the most widely used and will therefore produce the strongest effects.
Moreover, insofar as international organizations themselves wish to produce classifications with
the strongest effects, they will strategically gravitate toward these simple classification schemes to
maximize their influence.
Hypothesis 7A. Intuitive classifications will produce stronger effects than technical classifications.
Hypothesis 7B. Producers will design intuitive rather than technical classification systems.
While these hypotheses follow from my theoretical framework, I am not able to directly test
them with the evidence I present in subsequent chapters. My empirical strategy uses different
research methods to assess the impacts of different classification systems. While this benefits
my argument by showing consistency in results across multiple empirical approaches, it restricts
my ability to directly compare the magnitude of the effects of the different systems. This limits
my ability to test hypothesis 7A. Furthermore, there is a limited sample of existing classification
systems and a great deal of path dependency in which classification systems prevail. This weakens
any inferences I can make about hypothesis 7B. Nonetheless, I include these hypotheses here to
outline a full set of observable implications for all the various actors involved in my theoretical
framework. Given the policy relevance of these hypotheses, I discuss them briefly in the next
chapter, describing the landscape and history of these systems, and again in the conclusion.
464646
CHAPTER 2. THEORETICAL FRAMEWORK
2.5 Summary
The proposed theoretical framework — consisting of a cognitive and a strategic mechanism —
explains why classifications influence the behaviors of international observers. Actors who are
susceptible to cognitive biases or who must justify their behaviors to external audiences will be
most inclined to use classifications. I applied this framework to the case of development to hy-
pothesize how classifications would affect donors, investors, and raters. I predict that higher devel-
opment classifications will result in less aid but more investment and better ratings for the classified
countries. I will test these hypotheses in Chapters 4 and 5. My argument also entails observable
implications at the domestic level regarding the experiences and behaviors of NGOs, firms, and
governments. I will provide evidence to support these predictions in Chapter 6. Finally, the pro-
posed mechanisms also suggest that intuitive classifications will carry the strongest effects and will
be selected by producers. While a systematic test of this hypothesis is outside the scope of this
project, I conclude by considering the implications of my work for those responsible for producing
and maintaining classifications.
474747

Chapter 3
Classification Systems in Global
Development
In 2016, the World Bank announced that it would no longer use the terms “developing” and “de-
veloped” countries in the new edition of its flagship dataset, The World Development Indicators.1
This announcement made waves precisely because development practitioners are so attentive to
how they talk about the group of countries they seek to advance. The term “developing world”
was itself a preferred alternative to its predecessor, “the Third World,” which eventually became
seen as pejorative. Now, the “developing world” appears to be experiencing a similar fate. When I
worked in Washington, D.C., a media consultant once corrected my pronunciation of “developed
and developing” to “developed and develop-ing,” a practice he saw as progressive and increasingly
normal among development practitioners who are now uncomfortable with the term “developing.”
How we talk about developing countries is increasingly contested. This is true not only of
these colloquial terms but also the formal labels that are officially maintained and assigned. In
this chapter, I introduce the array of classifications that international organizations designate to
developing countries. In particular, I describe how the World Bank classifies countries and how the
1https://blogs.worldbank.org/opendata/2016-edition-world-development-indicators-out-three-features-you-won-t-want-miss
48
CHAPTER 3. CLASSIFICATION SYSTEMS IN GLOBAL DEVELOPMENT
United Nations (UN) categorizes the Least Developed Countries (LDCs). I use these cases not only
to introduce the reader to the systems explored in this book but also to emphasize two themes that
are relevant for its argument. First, classifications are not always used as their creators intended.
Second, seemingly technocratic contestation over classifications may belie political motivations
and entail political consequences. I conclude this chapter by discussing why these classifications,
among many, have gained such power and deserve special attention.
3.1 A Proliferation of Development Classifications
In their survey of development classifications, Fialho and Bergeijk (2017) argue that these clas-
sifications have proliferated in recent decades. While in 1985, there were only four develop-
ment classifications, there were 17 in 2013, including the Least Developed Country category,
Low/Middle/High Income Countries, the Human Development Index, the Small and Vulnerable
Economies, and others. A complete list appears in Table 3.1. Each of these categories is main-
tained by a prominent international organization and groups a different set of countries.
While all of these categories aim to identify the countries that require special attention, dif-
ferences in their approaches cause them to disagree in their selections. According to Fialho and
Bergeijk (2017, 101), the average category shares about 40-50% membership with an average other
category. Even membership in seemingly obvious categories such as the Small Island Developing
States varies between official categories.2 For example, non-island economies Belize, Suriname,
and Guyana are sometimes classified as Small Island Developing States.
Disagreement and duplication partly stem from the subjective nature of defining development.
As in academia, there are extensive debates about what constitutes development, what causes it,
and what hinders it; these debates also drive how technocrats choose to define development within
their respective institutions. When ideas about development change, new categories may be in-
2See Fialho and Bergeijk (2017).
494949
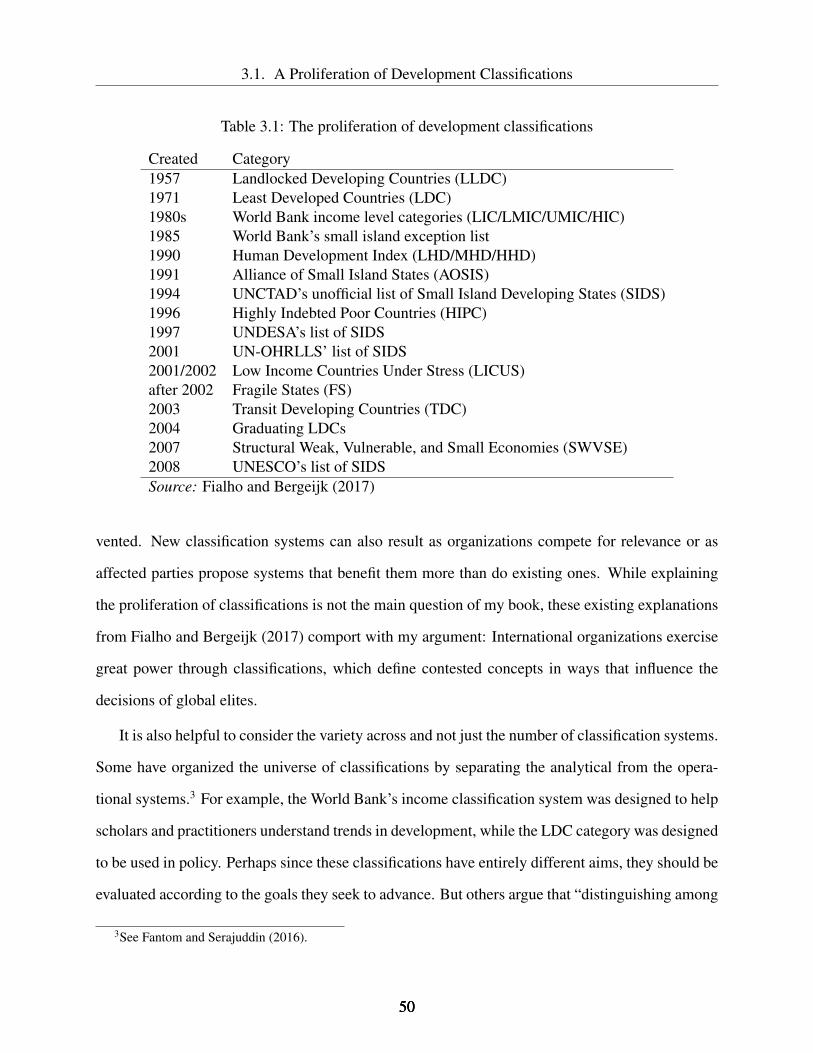
3.1. A Proliferation of Development Classifications
Table 3.1: The proliferation of development classifications
Created Category1957 Landlocked Developing Countries (LLDC)1971 Least Developed Countries (LDC)1980s World Bank income level categories (LIC/LMIC/UMIC/HIC)1985 World Bank’s small island exception list1990 Human Development Index (LHD/MHD/HHD)1991 Alliance of Small Island States (AOSIS)1994 UNCTAD’s unofficial list of Small Island Developing States (SIDS)1996 Highly Indebted Poor Countries (HIPC)1997 UNDESA’s list of SIDS2001 UN-OHRLLS’ list of SIDS2001/2002 Low Income Countries Under Stress (LICUS)after 2002 Fragile States (FS)2003 Transit Developing Countries (TDC)2004 Graduating LDCs2007 Structural Weak, Vulnerable, and Small Economies (SWVSE)2008 UNESCO’s list of SIDSSource: Fialho and Bergeijk (2017)
vented. New classification systems can also result as organizations compete for relevance or as
affected parties propose systems that benefit them more than do existing ones. While explaining
the proliferation of classifications is not the main question of my book, these existing explanations
from Fialho and Bergeijk (2017) comport with my argument: International organizations exercise
great power through classifications, which define contested concepts in ways that influence the
decisions of global elites.
It is also helpful to consider the variety across and not just the number of classification systems.
Some have organized the universe of classifications by separating the analytical from the opera-
tional systems.3 For example, the World Bank’s income classification system was designed to help
scholars and practitioners understand trends in development, while the LDC category was designed
to be used in policy. Perhaps since these classifications have entirely different aims, they should be
evaluated according to the goals they seek to advance. But others argue that “distinguishing among
3See Fantom and Serajuddin (2016).
505050
CHAPTER 3. CLASSIFICATION SYSTEMS IN GLOBAL DEVELOPMENT
the various motivations that give origin to classifications may be of limited relevance. Experience
has shown that even classifications initially formulated for analytical purposes only end up being
used to set guidelines for international action.”4 This perspective is much more consistent with my
theoretical framework, which describes how and why classifications are used, not how they should
be used.
Others instead organize the list by separating country-based classifications from issue-based
classifications.5 For example, the Human Development Index aims to describe a country’s level
of development writ large, whereas the Highly Indebted Poor Countries and the Small Island De-
veloping States point to specific development barriers (debt and geography, respectively). Some
propose that issue-based classifications avoid the dangers of country-based classifications: When
a country overcomes a specific impediment and exits a list, it will not lose the assistance it receives
on other dimensions. But this argument too rests on the faulty assumption that classifications are
used as they are intended to be used. While countries may be labeled Highly Indebted Poor Coun-
tries based on their debt levels, this does not mean that users of the category infer only a country’s
debt level and nothing more from its categorization.
This book is about how classifications are used in practice, not about how they are designed
to be used or should be used. Some of the classifications on this list are more powerful than
others, and my theoretical framework sheds light on why. In what follows, I describe two widely
recognizable development classification systems that will drive the empirical results throughout
this book. Even the histories of these systems reinforce my argument that descriptive use often
differs from prescribed use and illustrate the political power of technocracies.
4See Alonso et al. (2014, 4).5See Alonso et al. (2014).
515151
3.2. Departing from Intended Use: The World Bank Classification Systems
3.2 Departing from Intended Use: The World Bank Classifica-
tion Systems
Countries are often referred to as “low income” or “middle income” countries to convey their
levels of development. Speaking about Obama’s trade policy, the Los Angeles Times mentions a
“particularly acute problem for Vietnam, a low-income country which would be a major beneficiary
of the agreement.”6 A piece on Narendra Modi’s illiberal policies mentions “the longevity of Indian
democracy, a lower middle income country even after four decades of high economic growth.”7 The
Christian Science Monitor points out that “Mexico has transitioned to a middle-income country
thanks in part to growing economic integration with the US.”8 These are just a few recent and
prominent examples of a widely used vocabulary.
These labels result from an official classification system maintained by the World Bank. The
World Bank’s income classification system separates countries into Low Income Countries (LICs),
Lower-Middle Income Countries (LMICs), Upper-Middle Income Countries (UMICs), and High
Income Countries (HICs) on the basis of their gross national income (GNI) per capita. A series of
GNI per capita thresholds separate the categories, and no other indicators are used to determine a
country’s classification. Figure 3.1 illustrates that a country’s classification is an exact function of
its GNI per capita. Each year on July 1, the World Bank Development Economics Group updates
the thresholds in real terms to account for inflation and releases the set of country classifications
made on this basis, usually resulting in waves of headlines about which countries have ascended to
middle income status.9 Not only are these terms part of mainstream vocabulary, but also the cate-
gories are used in the official policies of many influential actors. The Global Fund to Fight AIDS,
6Doyle McManus, “Obama’s Pivot to Asia is Working,” The Los Angeles Times, May 22, 2016.7“Narendra Modi’s Illiberal Drift Threatens Indian Democracy,” The Financial Times, August 17, 2017.8Howard LaFranchi, “Trump Reawakens Mexican Fears of Yankee Aggression,” The Christian Science Monitor,
January 30, 2017.9See, for example, “Cambodia’s Economic Status Raised to Lower-Middle Income,” Phnom Penh Post, July 5,
2016.
525252
CHAPTER 3. CLASSIFICATION SYSTEMS IN GLOBAL DEVELOPMENT
TB, and Malaria, the Millennium Challenge Corporation (MCC), Gavi, and the Organization for
Economic Cooperation and Development (OECD) Development Assistance Committee (DAC) all
incorporate these income classifications into their eligibility criteria.10
What is most surprising about the significance of this classification system is that it was never
intended to be used in this way. The current system has been in place since 1989, when it was
devised for exclusively analytical purposes to facilitate World Bank research. With the first decade
of data from the World Development Indicators (WDI) at their fingertips, World Bank researchers
wished to document and visualize trends and patterns in development, and categorizing countries
helped them to do this.11 After selecting GNI per capita as the main indicator of national wealth,
they devised the classification system by selecting a series of thresholds that would distinguish
categories. For these thresholds, researchers identified several figures from World Bank policies
that had previously existed but were already defunct. The LIC ceiling, distinguishing LICs from
LMICs, is based on a cutoff introduced in the 1970s called the “civil works preference” cutoff,
below which countries received preferences in civil works procurement bids in Bank-financed
projects because they were not thought to be competitive enough. The threshold separating LMICs
from UMICs was based on a different operational threshold no longer in use: the cutoff used by
the International Bank for Reconstruction and Development (IBRD) to assess 15-year versus 17-
year repayment terms, categories that have since been collapsed. Finally, the UMIC/HIC threshold
was simply set at $6,000, and no rationale has ever been found for this number.12 In other words,
these thresholds were arbitrary at their adoption, and they are even more arbitrary now. Even if
the thresholds were originally adopted to favor certain countries, they could not strategically sort
countries today, since the thresholds have remained the same for decades. Given the arbitrariness
of these categories, the World Bank has never used these classifications for operational (lending)
10See Fantom and Serajuddin (2016).11Presentation by Neil Fantom, “Overview of the World Bank’s Classification Systems of Country by Income,” at
the Center for Global Development in Washington, D.C., June 23, 2016. Also see Fantom and Serajuddin (2016).12One individual who was present at this meeting asserted that it was adopted because it was a good, round number.
Author’s notes from meeting at the Center for Global Development in Washington, D.C., June 23, 2016.
535353
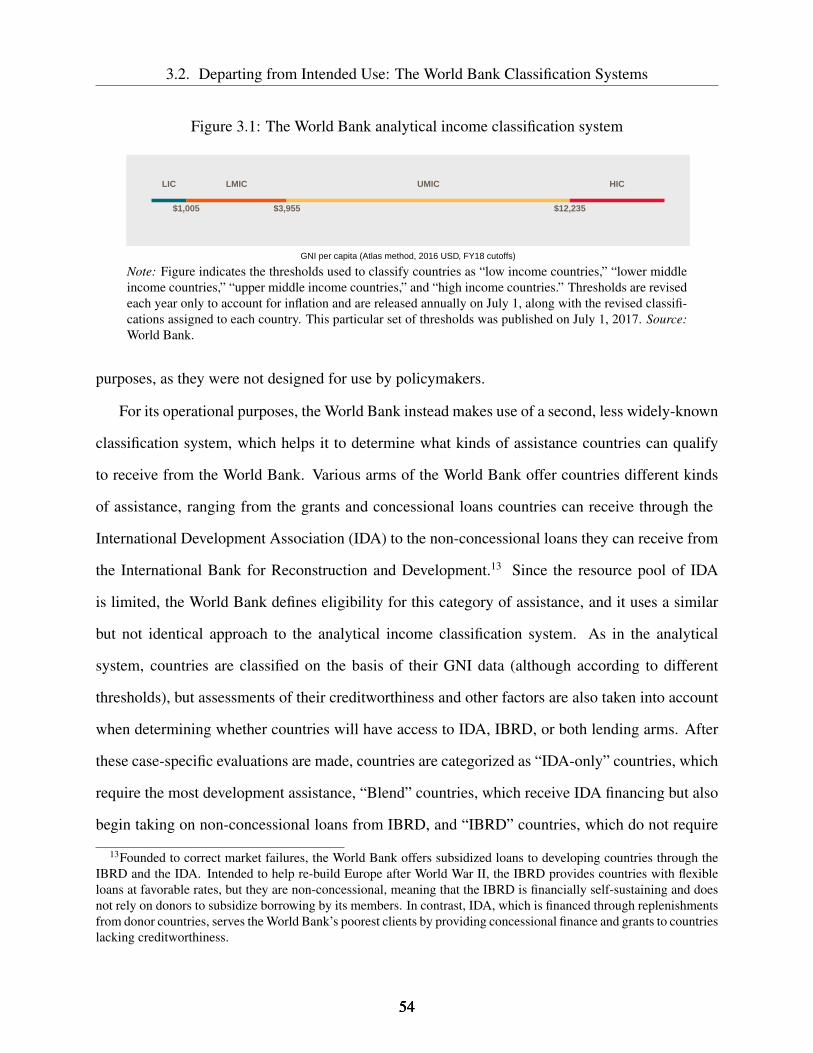
3.2. Departing from Intended Use: The World Bank Classification Systems
Figure 3.1: The World Bank analytical income classification system
LIC LMIC UMIC HIC
$1,005 $3,955 $12,235
GNI per capita (Atlas method, 2016 USD, FY18 cutoffs)
Note: Figure indicates the thresholds used to classify countries as “low income countries,” “lower middleincome countries,” “upper middle income countries,” and “high income countries.” Thresholds are revisedeach year only to account for inflation and are released annually on July 1, along with the revised classifi-cations assigned to each country. This particular set of thresholds was published on July 1, 2017. Source:World Bank.
purposes, as they were not designed for use by policymakers.
For its operational purposes, the World Bank instead makes use of a second, less widely-known
classification system, which helps it to determine what kinds of assistance countries can qualify
to receive from the World Bank. Various arms of the World Bank offer countries different kinds
of assistance, ranging from the grants and concessional loans countries can receive through the
International Development Association (IDA) to the non-concessional loans they can receive from
the International Bank for Reconstruction and Development.13 Since the resource pool of IDA
is limited, the World Bank defines eligibility for this category of assistance, and it uses a similar
but not identical approach to the analytical income classification system. As in the analytical
system, countries are classified on the basis of their GNI data (although according to different
thresholds), but assessments of their creditworthiness and other factors are also taken into account
when determining whether countries will have access to IDA, IBRD, or both lending arms. After
these case-specific evaluations are made, countries are categorized as “IDA-only” countries, which
require the most development assistance, “Blend” countries, which receive IDA financing but also
begin taking on non-concessional loans from IBRD, and “IBRD” countries, which do not require
13Founded to correct market failures, the World Bank offers subsidized loans to developing countries through theIBRD and the IDA. Intended to help re-build Europe after World War II, the IBRD provides countries with flexibleloans at favorable rates, but they are non-concessional, meaning that the IBRD is financially self-sustaining and doesnot rely on donors to subsidize borrowing by its members. In contrast, IDA, which is financed through replenishmentsfrom donor countries, serves the World Bank’s poorest clients by providing concessional finance and grants to countrieslacking creditworthiness.
545454

CHAPTER 3. CLASSIFICATION SYSTEMS IN GLOBAL DEVELOPMENT
any concessional assistance. However, unlike the analytical income classification system, these
categories are not widely known beyond the aid and development policy community.
Comparing the two systems, it is evident that the analytical income classification system is
much simpler and more intuitive than the operational lending categories within the World Bank.
This is partially because the designers of these systems expected that the lending categories, which
would be used in World Bank decisions, would be more consequential, so they wanted a category
to reflect a more nuanced understanding of a country’s level of development. However, it was the
analytical income classification system that attracted widespread attention. In fact, this book will
argue that it gained in popularity partially because of its simplicity and intuitive appeal, highlight-
ing an important trade-off classifiers face between developing systems that reflect expert judgment
and systems that will appeal to a mass audience.
The lesson from the World Bank’s two classification systems is that classifications are not
always used as they are intended to be used. It therefore makes little sense to distinguish classi-
fication systems by their intended use.14 This case illustrates that, once created, it is much more
important to understand how a classification is used than how it should be used. The theoretical
framework of this project helps us to do this by explaining the conditions under which classification
systems are used by which actors.
3.3 Proceduralizing Politics: The UN’s Least Developed Coun-
tries Category
Not all classification systems have benign origins. In contrast to the World Bank, which designed
one classification system for internal analytical use and one for internal operational use, the United
Nations developed a classification system that was always aimed for external operational use. Be-
cause of this, the process of developing the Least Developed Country category was intensely po-
14This point is also made by Alonso et al. (2014).
555555
3.3. Proceduralizing Politics: The UN’s Least Developed Countries Category
litical in a way that the World Bank’s processes were not.
The idea behind the LDC category originated at a meeting of the UN Conference on Trade and
Development (UNCTAD) in 1964, when member countries felt that international policy needed to
recognize the unique challenges faced by the least developed of countries. At this time, UNCTAD
tasked an internal working committee called the Committee for Development Planning (now the
Committee for Development Policy) with examining these challenges and determining criteria for
the creation of a list of countries deserving special attention.15 As Fialho (2012) describes, the en-
suing deliberations produced significant political conflict. Many countries, especially those from
Latin America and the broader G-77, objected to their exclusion from the list (757, 761). These
more advanced developing countries advocated for a larger list with more general criteria. In con-
trast, developed countries wished to maintain a shorter list, particularly as the benefits that would
be conferred upon its members were yet to be defined (762). Finally, specific developed countries
advocated for criteria that would include their former colonies on the list. In particular, France lob-
bied on behalf of Francophone African countries for criteria that would benefit them (756, 761).
By 1971, the Committee for Development Policy (CDP) had assembled a list of countries on the
basis of GDP per capita, the share of manufacturing in gross domestic product, and the adult lit-
eracy rate. However, to accommodate various political interests, exceptions were permitted and
there was great room for discretion in considering outlier cases (760). Fialho concludes, “serving
national interests seemed more important than striving for a bias-free agreement on LDC identi-
fication criteria” (763). Throughout the 1970s and 1980s, inclusion on the LDC list was made
on an ad hoc basis. Although the three criteria guided assessments, there were no systematic re-
views of the list and many decisions were either deferred or made on the basis of whether the CDP
determined there was sufficient data available.16
The CDP introduced sweeping reforms in 1991, resulting in a more technical approach to clas-
sifying LDCs. Reforms included systematic triennial (instead of ad hoc) reviews of all countries,15See Alonso et al. (2014).16See Alonso et al. (2014, 8).
565656
CHAPTER 3. CLASSIFICATION SYSTEMS IN GLOBAL DEVELOPMENT
clear guidelines for graduating countries from the LDC category, and a revision of the three cri-
teria. These criteria have also been subsequently refined after 1991, but generally, the CDP has
always sought to include an income criterion, a human development criterion, and an economic
and environmental risk criterion. Today, the CDP uses GNI per capita, the Human Assets In-
dex, and the Economic Vulnerability Index. The Human Assets Index, measuring human capital
like education and health, and the Economic Vulnerability Index, measuring a country’s exposure
to macroeconomic or environmental shocks, both contain multiple sub-indices. When the CDP
reviews the LDCs every three years, they also review a set of thresholds on each of the three di-
mensions to determine eligibility for inclusion in and graduation from the category. To be eligible
to graduate from being a “Least Developed Country” to being a “developing country,” countries
must either achieve graduation thresholds on at least two of the three indicators or they can meet
double the income criterion and be eligible on the basis of income alone (see Figure 3.2). After
being found eligible in two consecutive triennial reviews and on the basis of the recommendation
of UN committees in consultation with the governments in question, countries graduate three years
later. A different set of thresholds on the same three criteria determines countries’ inclusion in the
category.17
The CDP has also worked to systematize the special treatment LDCs receive. LDCs receive
preferential market access to developed countries through the World Trade Organization, can ac-
cess certain foreign aid to boost their trade capacity, and are granted leniency in meeting certain
international obligations. The CDP hopes to expand this array of benefits and, to this end, has
conducted its own investigation into why the category has not seen even greater uptake by inter-
national actors.18 At the same time, what limited benefits exist do not appear to be accessed by
LDCs. Even though LDCs often protest the possibility of graduating from the category, they rarely
take the minimal steps required to access their special terms. To address this problem, the UN
has even organized workshops in LDCs to inform their officials of the benefits to which they are17See Alonso et al. (2014).18See Lenzi (2017).
575757

3.3. Proceduralizing Politics: The UN’s Least Developed Countries Category
Figure 3.2: Thresholds for graduating from the UN Least Developed Country category
GNI per capita (3 year average)
$1,242 $2,484(income−only)
Human Assets Index
66
Economic Vulnerability Index
32
Countries are eligible to graduate when they meet any 2 of 3 criteria OR the income−only criterion for two consecutive tri−annual reviews
Eligible Ineligible
Note: Figure indicates the three criteria, and the thresholds for each, used to determine a country’s eligibil-ity for graduation from the UN’s LDC category. For the income criterion, the UN uses the same GNI percapita figures used by the World Bank but calculates a 3-year average. The Human Assets Index (higheris better) is a composite index of: the percentage of population undernourished, the under-five mortalityrate, the gross secondary enrollment ratio, and the adult literacy rate. The Economic Vulnerability Index(higher is worse) is a composite index of: population, remoteness, merchandise export concentration, shareof agriculture and forestry and fisheries in GDP, share of population in low elevated coastal zones, victimsof natural disasters, instability of agricultural production, and instability of exports of goods and services.A separate set of criteria exists to assess a country’s inclusion in the criteria. Source: UN Committee onDevelopment Policy.
entitled.19 This suggests that LDCs must care about categories for bigger reasons than just the
technical material benefits with which they are associated.
Interestingly, the push for systematizing these procedures came at end of the Cold War and
also at the same time as the World Bank developed its income classification system. There are a
few possible explanations for this coincidence. As Fialho (2012, 753-754) notes, during the Cold
War, developing (Third World) countries were fairly clearly the group that was left after accounting
for advanced democracies (North Atlantic Treaty Organization) and communist countries (Warsaw
Pact). But when these alliances no longer organized the world, institutions had to consider a more
rigorous way of identifying those countries in need of development. Alternatively, it could be the
case that international institutions no longer needed to use categories for political purposes and
could afford to adopt more technocratic approaches to crafting them.
Today, debates and decisions about classifications are highly technical. In fact, most of the
literature critiquing classification systems is published by the creators of other classification sys-
19Author’s interview with Namsuk Kim, March 22, 2016.
585858

CHAPTER 3. CLASSIFICATION SYSTEMS IN GLOBAL DEVELOPMENT
tems or academic economists. Because of this, arguments for or against certain systems are made
primarily by experts pointing to relatively obscure details.20 For example, UN economists cri-
tique the World Bank’s income classification system on the following grounds: it should employ
an internationally representative deflator rather than the Special Drawing Rights (SDR) deflator
to estimate GNI per capita; it should use purchasing power parity (PPP)-adjusted GNI per capita
data; and it should adopt relative rather than absolute thresholds to preserve its significance over
time.21 In response, World Bank economists argue that PPP-adjusted GNI per capita data would be
biased by data availability and relative thresholds would limit the comparability of its classification
over time, although they concur that an alternative deflator can be considered.22 It is not my aim
to weigh in on the merits of any of these arguments, and as a social scientist, I agree that these
are important factors to consider in devising a classification system. But as my argument is about
how classifications are constructed and subsequently used, I include these examples in order to
highlight that contestation over classifications is primarily engineered by technocrats.
What remains to be seen is whether this systematization truly reduces political bias or merely
disguises it. At the very least, this book shows that these classification systems entail significant
political consequences, and the costs are largely born by populations who are less able to chal-
lenge the technical basis on which they are appraised. Scholars of other indicators have pointed
to many instances in which indicators were used to advance explicitly political goals.23 This sec-
tion illustrates that development classifications have not been immune to this tendency. It also
raises questions that I will return to in the conclusion concerning who wields power in interna-
tional organizations. Whatever their motivations may be, technocrats clearly play an important
role in shaping how we think about developing countries. This is consistent both with Barnett and
Finnemore (1999)’s work on the power of bureaucracies in international organizations and with
MacKenzie (2006)’s work on economic models, which claims that they are an “engine, not a cam-20In addition to the below cited examples, see Nielsen (2011); Harttgen and Klasen (2013); Guillaumont (2010).21See Alonso et al. (2014).22See Fantom and Serajuddin (2016).23See, for example, Cooley and Snyder (2015); Bush (2017); Kelley (2017).
595959

3.4. Why These Classifications?
era.” But given the political consequences and incentives for classifying developing countries, it
is also important to consider the possibility that this technocratization simply conceals political
goals.
3.4 Why These Classifications?
Of many development classifications, why does this book focus on the World Bank’s classifications
and the UN’s LDC category?
One answer to this question is that these particular systems present a unique set of research op-
portunities. The World Bank’s analytical income classification system is especially well suited to
quantitative statistical analysis. Because this system is predicated on a relatively volatile variable
— national income — there is a great deal of movement across the thresholds separating the var-
ious categories.24 This creates a unique empirical opportunity to statistically quantify the effects
of these classifications in a large data set, made possible by the fact that the system has not been
changed at all since 1989. In contrast, only seven countries have ever graduated from the LDC
category, and three of them were in 2015. This limits the ability to conduct quantitative analysis
because there are insufficient opportunities to observe countries’ experiences under different clas-
sifications. However, the deliberation involved in these graduations offers considerable qualitative
evidence, as international organizations and country experts carefully assess the expected effects of
each of these graduations. Similarly, graduations from IDA to IBRD are also made on the basis of
more subjective assessments, and by studying this system also, I can examine variation within two
systems that are both produced by the World Bank. Consequently, studying these particular clas-
sifications permits a multi-method approach that applies both quantitative and qualitative evidence
to document the significance of classifications.
A second reason to focus on these systems is their policy relevance. Each of these systems
24Several, though fewer, countries have “graduated” from IDA-only to “Blend” and subsequently IBRD status, andsome have “reverse graduated.”
606060

CHAPTER 3. CLASSIFICATION SYSTEMS IN GLOBAL DEVELOPMENT
is currently undergoing internal review or external scrutiny. As described in the introduction,
the World Bank’s analytical income classification system has been heavily criticized for ignoring
poverty in middle income countries. Meanwhile, Executive Directors within the World Bank are
evaluating proposed reforms to the IDA graduation procedures, as large and influential countries
are scheduled to transition from IDA into IBRD. The UN is experiencing its first wave of several
significant candidates for LDC graduation, a departure from decades without many graduations at
all, causing it and others to critically evaluate this process. In fact, many of the studies cited in
this chapter were conducted for the explicit purpose of evaluating the fitness of these categories
and whether they require reform. These policy debates result in no small part from massive shifts
in the global economic landscape. Global changes in the demography of poverty are causing
many countries, which continue to experience high levels of poverty or inequality, to cross relevant
thresholds.25 Selecting classification systems currently undergoing review or reform both increases
the policy relevance of my research (it is important to understand what political consequences these
transitions will entail) and generates more evidence to test my hypotheses (many actors are engaged
in a vocal debate about whether and how these systems should be reformed).
But perhaps the biggest reason to focus on these classifications is the salience of the World
Bank’s income classification system and the UN’s LDC category. Figure 3.3 illustrates this in a
cursory way using Google Ngrams to show how frequently classifications appear in the corpus of
Google Books. Most of the classifications mentioned in Table 3.1 were not sufficiently frequent
to appear in Google Ngrams, but these ones did. The phrase “Least Developed Country” is clearly
most frequent, followed by the sum of the phrases “middle income” and “low income,” hailing
from the World Bank’s system. Because my theory concerns the behaviors of a whole network of
global elites, it is logical to study the classifications used most often by this group, justifying my
focus on these categories.
Of course, the deeper question is why these two classifications are more salient than others.
25See Moss and Leo (2011); Morris and Gleave (2015).
616161

3.4. Why These Classifications?
Figure 3.3: Salience of World Bank income classifications and UN LDC category in comparativeperspective
Note: Other classifications appearing in Table 3.1 were not sufficiently frequent to appear in this chart.Source: Google Ngram.
Why are Small Island Developing States or Low Income Countries Under Stress entirely absent
from the (common) vocabulary used to identify and discuss developing countries? Any answer to
this question first must acknowledge the role of path dependence, the idea that certain conventions
or systems are quite sticky.26 To some extent, the salience of a classification in this year is driven
by its salience in the previous year. As a classification becomes embedded in thoughts and policies,
it becomes increasingly difficult to switch to a new one. In this way, my study is especially limited
by the small-N problem: It is hardly fair to characterize the universe of classifications to be even
as high as 17 when just a few classifications have been part of the mainstream vocabulary for
decades. This makes it especially hard to tell whether anything we learn about these classifications
generalizes to all the potential classifications that never came into existence. It is for this reason
that I am particularly cautious about drawing empirical inferences about which classifications are
more powerful than others. Moreover, because I apply different empirical strategies to study each
classification, it is challenging to compare them head-to-head with the goal of seeing whether one
has different effects than the other.
But the theoretical framework does shed light on these important questions. Specifically, hy-
26See David (1985); Pierson (2000).
626262
CHAPTER 3. CLASSIFICATION SYSTEMS IN GLOBAL DEVELOPMENT
pothesis 7 expects simpler and more intuitive classifications to have greater influence than more
technical or complex classifications. While I cannot truly test this hypothesis for the reasons de-
scribed above, a few comments from various bureaucrats in these organizations suggest its plau-
sibility. A report by the World Bank Development Economics Group about the income classifi-
cations mentions in its conclusion that, “Users stress the need for transparent, easily understood
methodologies.”27 A UN Development Programme country director in Nepal echoed this sense that
simplicity drove demand for classifications, despite his objections to the accuracy of the category.
He claimed,
Why not petition for dropping these categories? They don’t mean anything. ... If
we have to have a meaningful classification, it would have to be a wise formula includ-
ing inequality reduction. Even the HDI [Human Development Index] doesn’t include
this, although it’s better than the World Bank system. The way out is disaggregating
everything but then it loses value. You want to use data to hit people’s attention, but if
you make them read five pages of data rather than one slide, then you can’t do that. So
you need the classification.28
In sum, widespread demand for heuristics has been met with a proliferation of development
classifications, and those that have harnessed popular attention have also used intuitive and simpli-
fied approaches. Not all of these classifiers necessarily even wanted this, as the case of the World
Bank’s income classification system illustrates. But others did, and the variety of classification
systems in existence suggests a competition between international organizations over the right to
define development and change the world. The following chapters illustrate that, regardless of
intent, they did just that.
27See Fantom and Serajuddin (2016, 32).28Author’s interview with Mr. Renaud Meyer, Country Director, UN Development Programme Nepal, July 12,
2017, Kathmandu, Nepal.
636363

Chapter 4
Measuring the Classification Effect
Do classifications shape the behaviors of international observers? Which international observers
make use of classifications in their decisions? This chapter answers these questions by showing
that classifications affect how donors, investors, and raters perceive and treat developing countries.
Specifically, my evidence speaks to the power of the World Bank’s classification systems, and I
make use of both quantitative and qualitative approaches.
4.1 Statistical Tests of the Classification Effect
The aim of this study is to illustrate systematic relationships between a country’s classification
in a given year and the way it is perceived and treated in the global economy. To do so quan-
titatively requires a large data set with sufficient variation in the classifications countries receive
cross-nationally and over time. Fortunately, the World Bank analytical income classification sys-
tem exhibits this necessary variation and is ideal for this quantitative analysis. In what follows, I
describe in detail how this system provides a unique empirical opportunity to measure the effects
of classifications. I show that when countries pass from low to lower-middle and upper-middle
income country categories, they receive less aid but better ratings of their creditworthiness and
64
CHAPTER 4. MEASURING THE CLASSIFICATION EFFECT
democracies.
4.1.1 The World Bank Income Classification System
As described in the previous chapter, the World Bank has classified countries as Low Income
Countries (LICs), Lower-Middle Income Countries (LMICs), Upper-Middle Income Countries
(UMICs), and High Income Countries (HICs) since 1989. It does so on the basis of only one
variable: gross national income (GNI) per capita. In 1989, the World Bank established official
GNI per capita cutoffs that would separate these categories, and each year it updates those cutoffs
only to account for inflation. This consistency is essential to my empirical strategy: It means that
a country’s “treatment” as LIC in 1992 is the same as another country’s “treatment” as a LIC in
2007. I am therefore able to pool my data and exploit within-country variation over time.
One approach to estimating these relationships would be to regress my outcomes of interest on
a country’s World Bank income classification in a given year. However, this naive approach would
not adequately show this relationship, since international observers could be influenced directly by
the factors that determine a country’s classification and not at all by the classification itself. Help-
fully, these factors can be directly controlled for in the case of the World Bank’s system. Since
there is only one factor determining a country’s classification and no role for subjective assess-
ments, simply controlling for GNI per capita will account for all variation in outcomes that can be
explained by income. What remaining variation can be explained by a country’s position relative
to these thresholds captures the classification effect. Subsequent analysis addresses endogeneity in
this relationship. Before outlining these models, I begin by introducing my data.
4.1.2 Data
To test my hypotheses, I combine data on a variety of economic outcomes with the classifications
countries received from the World Bank and the indicators used to determine those classifications.
656565
4.1. Statistical Tests of the Classification Effect
Since the World Bank began its current classification system in 1989, my sample includes all
country-years that ever received classifications during the period 1987 to 2015, excluding countries
that have been continually classified as HICs since before 1989.1
The main explanatory variables are historical data on GNI per capita and the historical thresh-
olds that were used to classify countries in each year. I obtained the original GNI data that were
used to classify countries at their time of classification from the World Bank Development Eco-
nomics Data Group.2 It is important to note that this figure can differ significantly from the esti-
mate of GNI that can be obtained by downloading the most current World Development Indica-
tors (WDI) online. This is because income estimates are often revised over time on the basis of
updated economic assumptions, new population data, and other causes. I use the historical income
data and the historical thresholds, which is the best way of approximating how a country was per-
ceived at the time of its classification, regardless of how it would be classified ex post on the basis
of contemporary data. The historical thresholds are available online from the World Bank.3
Dependent variables include aid, foreign direct investment (FDI), creditworthiness, and democ-
racy ratings. In keeping with the literature, I measure Aid as net disbursements of official develop-
ment assistance (ODA) as reported by the Organization for Economic Cooperation and Develop-
ment (OECD), and I impute zeroes for missing values.4 I use both a behavioral and a perceptual
measure of investment. I use logged net annual inward FDI flows from UN Conference on Trade
and Development (UNCTAD)’s Handbook of Statistics.5 This measures how firms behave with
respect to classified countries. I also use a perceptual measure of the classified countries’ Credit-
1Because the present categories were defined in FY89, the first observation for most countries therefore containsthe classification awarded in FY89 (July 1, 1988-June 30, 1989), which was determined in spring 1988 on the basis ofdata from calendar year 1987. Unless otherwise indicated, years are reported in terms of data years.
2The World Bank provided the GNI data used for the analytical classifications from 1999-2015 (i.e., used to classifyeconomies for FY01 onwards) and the GNI data used for the operational classifications from 1973-2007. In this paper,I use the analytical figure for all years after 1999 and the operational figure for years before. Where they overlap, thenumbers are very close to one another.
3http://databank.worldbank.org/data/download/site-content/OGHIST.xls4See Knack et al. (2014) for precedent.5While some scholars prefer to use FDI flows as a percentage of gross domestic product (see Buthe and Milner
(2008)), I prefer the use of levels to avoid detecting a mechanical relationship as the result of changes in GNI. However,the results are the same in both specifications (see Appendix Table B.5).
666666

CHAPTER 4. MEASURING THE CLASSIFICATION EFFECT
worthiness using the biannual country risk ratings published in the investment journal Institutional
Investor. These ratings range from 0 to 100 and are the most widely available continuous indicator
of creditworthiness.6 The Institutional Investor ratings (IIR) “are based on information provided
by senior economists and sovereign-risk analysts at leading global banks and money management
and securities firms. They have graded each country on a scale of zero to 100, with 100 represent-
ing those countries that have the least chance of default. ... The individual credit responses are
weighted using a formula that gives more importance to responses from institutions with greater
worldwide exposure and more sophisticated country analysis systems.” Because these ratings are
compiled using surveys, I treat them as a proxy for how investors perceive these countries. I ob-
tained the IIR by scanning and transcribing the tables published in March and September issues of
the U.S. edition, 1987-2012.7 Since income classifications are released on July 1, I operationalize
this variable by taking the mean of the September rating and the March rating from the following
year, resulting in a single rating for a fiscal year, and for my baseline model, I impute zeroes for
missing values to capture the poor reputation associated with being unrated. To measure the de-
cisions of professional raters, I use Freedom House’s political rights score measuring Democracy,
treating it as a perceptual rather than a latent variable. I flip the score so that higher levels refer to
higher scores on political rights, from 1 to 7. Summary statistics appear in Appendix Table B.1.
4.1.3 Estimation Strategy
The main challenge to identifying the effect of classifications is that international observers could
be influenced by the determinants of a country’s classification rather than by the classification
itself. Fortunately, since the World Bank uses exact, public, and arbitrary cutoffs in GNI per capita
to determine classifications, these factors can be controlled for directly. My main specification
6The creditworthiness ratings cover more countries than do formal credit ratings. This is especially true of devel-oping countries in which I am most interested. Many countries are included in the IIR before they receive a formalcredit rating. For works comparing various measures of creditworthiness, see Vij (2005); Oetzel et al. (2001); Rathaet al. (2011).
7I thank Jamie Park for her research assistance.
676767

4.1. Statistical Tests of the Classification Effect
regresses outcomes of interest on both a dummy variable indicating that a country’s GNI per capita
surpasses a relevant cutoff and also on the continuous GNI per capita variable, which conceivably
directly shapes observers’ perceptions of the country independent of its classification. Controlling
for this variable allows me to estimate the effect of the classification itself, β. The functional form
for this specification is:
Yi,t = α + βAbove cutoffi,t−1 + δlog(GNIpc)i,t−1 + γXi,t−1 + µi + τt + ε (4.1)
where Y is an outcome, X represents a vector of covariates, and t denotes the year or period
of analysis. Country and period/year fixed effects are used, and I cluster standard errors by coun-
try. A similar specification is used by Knack et al. (2014), who study the effect of crossing the
operational cutoff on aid allocations.8 I evaluate the effect of different cutoffs within the same
classification system in separate models, as different categories within the same classification sys-
tem could understandably produce effects of various magnitudes or directions. In order to improve
comparability across outcomes, I standardize all dependent variables.
The unit of analysis differs between Aid and other regressions. In keeping with Knack et al.
(2014), Aid is aggregated into three-year periods corresponding with the International Develop-
ment Association (IDA) replenishment cycles of the World Bank, a grouping which reflects the
natural decision-making timeline of most donors and also smooths an otherwise volatile variable.9
In Aid regressions, I restrict the sample to just those countries that have ever benefited from IDA
during the time frame. This is because countries that have never benefited from IDA are unlikely
to exhibit any change in their aid receipts, so their inclusion only serves to reduce my power. Since
all countries may receive FDI, creditworthiness scores, and democracy ratings, I use samples of all
8Despite using the same empirical model, the results I present in the next section will differ from those reportedin Knack et al. (2014). This is because my sample includes two additional periods (data through 2015) that werenot available at the time the authors conducted their analysis. A complete replication of the paper and more detailedexplanation of our different findings appears in Appendix B.1.2.
9All variables are aggregated using means, while income variables and the cutoff dummy are taken from the finalyear in each period.
686868
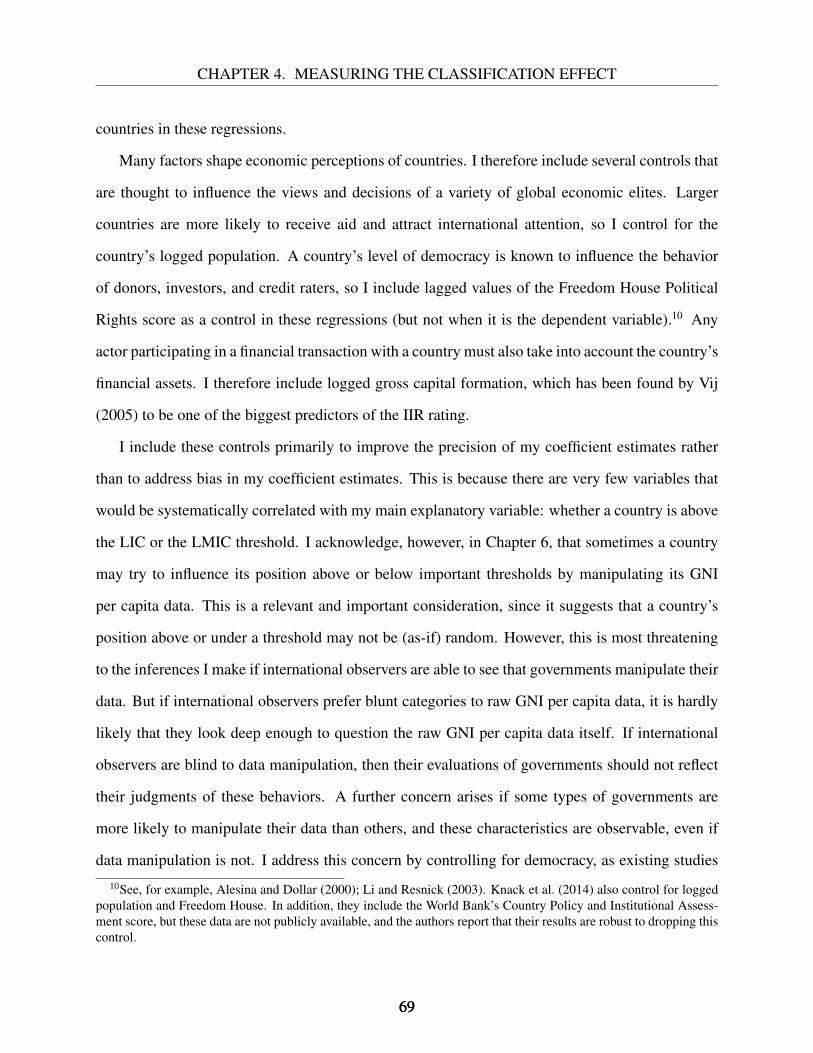
CHAPTER 4. MEASURING THE CLASSIFICATION EFFECT
countries in these regressions.
Many factors shape economic perceptions of countries. I therefore include several controls that
are thought to influence the views and decisions of a variety of global economic elites. Larger
countries are more likely to receive aid and attract international attention, so I control for the
country’s logged population. A country’s level of democracy is known to influence the behavior
of donors, investors, and credit raters, so I include lagged values of the Freedom House Political
Rights score as a control in these regressions (but not when it is the dependent variable).10 Any
actor participating in a financial transaction with a country must also take into account the country’s
financial assets. I therefore include logged gross capital formation, which has been found by Vij
(2005) to be one of the biggest predictors of the IIR rating.
I include these controls primarily to improve the precision of my coefficient estimates rather
than to address bias in my coefficient estimates. This is because there are very few variables that
would be systematically correlated with my main explanatory variable: whether a country is above
the LIC or the LMIC threshold. I acknowledge, however, in Chapter 6, that sometimes a country
may try to influence its position above or below important thresholds by manipulating its GNI
per capita data. This is a relevant and important consideration, since it suggests that a country’s
position above or under a threshold may not be (as-if) random. However, this is most threatening
to the inferences I make if international observers are able to see that governments manipulate their
data. But if international observers prefer blunt categories to raw GNI per capita data, it is hardly
likely that they look deep enough to question the raw GNI per capita data itself. If international
observers are blind to data manipulation, then their evaluations of governments should not reflect
their judgments of these behaviors. A further concern arises if some types of governments are
more likely to manipulate their data than others, and these characteristics are observable, even if
data manipulation is not. I address this concern by controlling for democracy, as existing studies10See, for example, Alesina and Dollar (2000); Li and Resnick (2003). Knack et al. (2014) also control for logged
population and Freedom House. In addition, they include the World Bank’s Country Policy and Institutional Assess-ment score, but these data are not publicly available, and the authors report that their results are robust to dropping thiscontrol.
696969
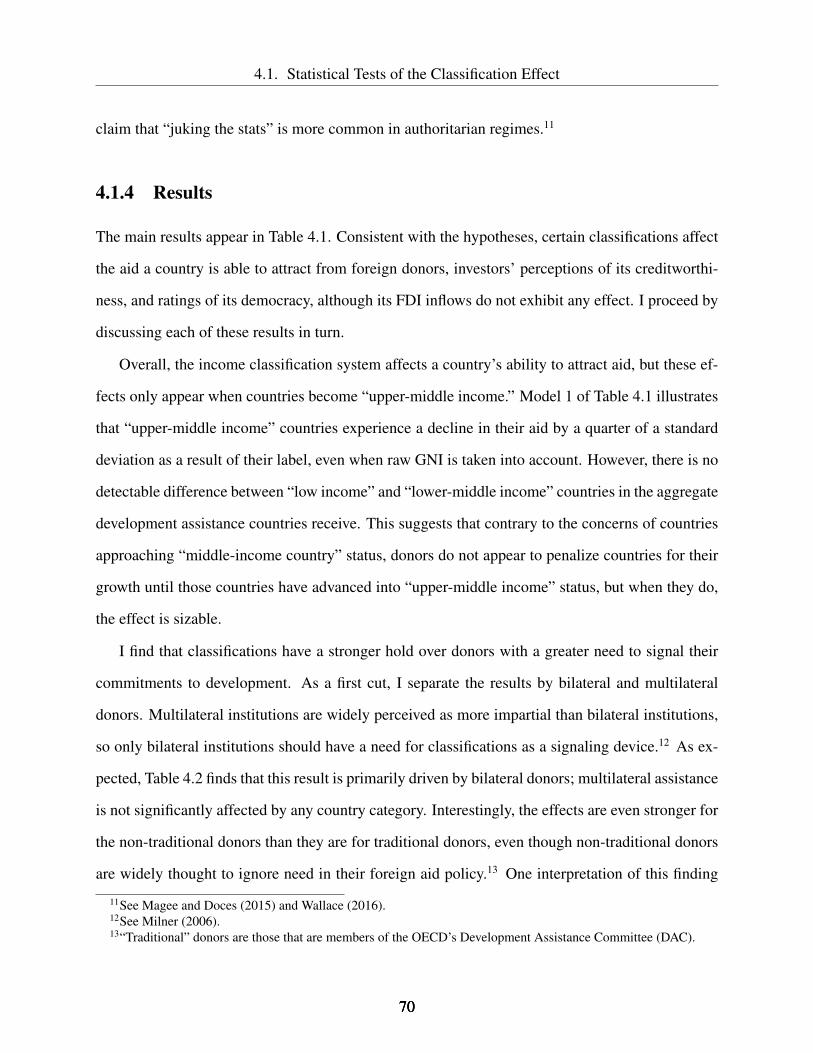
4.1. Statistical Tests of the Classification Effect
claim that “juking the stats” is more common in authoritarian regimes.11
4.1.4 Results
The main results appear in Table 4.1. Consistent with the hypotheses, certain classifications affect
the aid a country is able to attract from foreign donors, investors’ perceptions of its creditworthi-
ness, and ratings of its democracy, although its FDI inflows do not exhibit any effect. I proceed by
discussing each of these results in turn.
Overall, the income classification system affects a country’s ability to attract aid, but these ef-
fects only appear when countries become “upper-middle income.” Model 1 of Table 4.1 illustrates
that “upper-middle income” countries experience a decline in their aid by a quarter of a standard
deviation as a result of their label, even when raw GNI is taken into account. However, there is no
detectable difference between “low income” and “lower-middle income” countries in the aggregate
development assistance countries receive. This suggests that contrary to the concerns of countries
approaching “middle-income country” status, donors do not appear to penalize countries for their
growth until those countries have advanced into “upper-middle income” status, but when they do,
the effect is sizable.
I find that classifications have a stronger hold over donors with a greater need to signal their
commitments to development. As a first cut, I separate the results by bilateral and multilateral
donors. Multilateral institutions are widely perceived as more impartial than bilateral institutions,
so only bilateral institutions should have a need for classifications as a signaling device.12 As ex-
pected, Table 4.2 finds that this result is primarily driven by bilateral donors; multilateral assistance
is not significantly affected by any country category. Interestingly, the effects are even stronger for
the non-traditional donors than they are for traditional donors, even though non-traditional donors
are widely thought to ignore need in their foreign aid policy.13 One interpretation of this finding
11See Magee and Doces (2015) and Wallace (2016).12See Milner (2006).13“Traditional” donors are those that are members of the OECD’s Development Assistance Committee (DAC).
707070
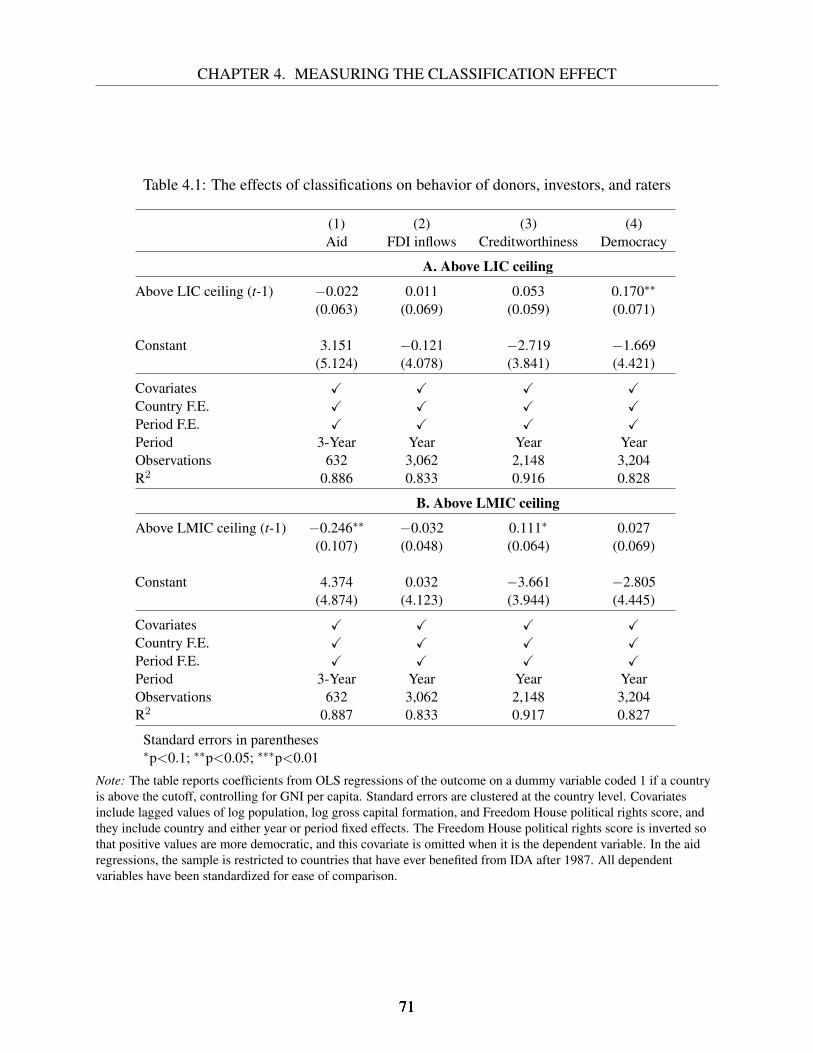
CHAPTER 4. MEASURING THE CLASSIFICATION EFFECT
Table 4.1: The effects of classifications on behavior of donors, investors, and raters
(1) (2) (3) (4)Aid FDI inflows Creditworthiness Democracy
A. Above LIC ceiling
Above LIC ceiling (t-1) −0.022 0.011 0.053 0.170∗∗
(0.063) (0.069) (0.059) (0.071)
Constant 3.151 −0.121 −2.719 −1.669(5.124) (4.078) (3.841) (4.421)
Covariates X X X XCountry F.E. X X X XPeriod F.E. X X X XPeriod 3-Year Year Year YearObservations 632 3,062 2,148 3,204R2 0.886 0.833 0.916 0.828
B. Above LMIC ceiling
Above LMIC ceiling (t-1) −0.246∗∗ −0.032 0.111∗ 0.027(0.107) (0.048) (0.064) (0.069)
Constant 4.374 0.032 −3.661 −2.805(4.874) (4.123) (3.944) (4.445)
Covariates X X X XCountry F.E. X X X XPeriod F.E. X X X XPeriod 3-Year Year Year YearObservations 632 3,062 2,148 3,204R2 0.887 0.833 0.917 0.827
Standard errors in parentheses∗p<0.1; ∗∗p<0.05; ∗∗∗p<0.01
Note: The table reports coefficients from OLS regressions of the outcome on a dummy variable coded 1 if a countryis above the cutoff, controlling for GNI per capita. Standard errors are clustered at the country level. Covariatesinclude lagged values of log population, log gross capital formation, and Freedom House political rights score, andthey include country and either year or period fixed effects. The Freedom House political rights score is inverted sothat positive values are more democratic, and this covariate is omitted when it is the dependent variable. In the aidregressions, the sample is restricted to countries that have ever benefited from IDA after 1987. All dependentvariables have been standardized for ease of comparison.
717171

4.1. Statistical Tests of the Classification Effect
could be that non-traditional donors have a reputation for using aid as political instruments, and
so they have greater need of classifications to overcome this stigma. However, this conclusion
should be interpreted with caution, as my data only reflects the aid given by non-traditional donors
who report their statistics to the OECD, a non-random sample of potentially more transparent
non-traditional donors.14
I further examine the importance of the strategic mechanism in Figure 4.1. I estimate the clas-
sification effect separately by each individual donor and plot them in order of effect sizes. Since I
observed earlier that aid was most strongly affected by the LMIC ceiling, I am primarily interested
in these effects, which appear in Panel B. Unsurprisingly, the strongest negative effects are for Gavi
and the Global Fund, two donors who formally include the World Bank classifications in their el-
igibility policies.15 These cases are useful because they are far more likely to be explained by the
strategic than the cognitive mechanism: Institutionalizing an eligibility policy requires great delib-
eration and justification, tempering cognitive biases but amplifying any audience effects. What is
especially interesting is that these same cases actually do respond to the LIC ceiling as well (Panel
A), but the effect is opposite to my original predictions. These strategically-motivated donors ac-
tually reward countries for becoming LMICs but punish them when they become UMICs. These
results also partially suggest that the original null finding of LIC graduation on aid may obscure
important heterogeneity: For example, Germany and Sweden do give less aid to countries once
they become LICs. In Panel B, we see many donors, such as Scandinavian donors, exhibiting the
classification effect. While these findings should be subjected to multiple comparisons corrections
before drawing inferences about any individual donor’s behavior, these results suggest important
heterogeneity in the responses of donors and their susceptibility to the two mechanisms.
I find mixed results regarding the sensitivity of investors to classifications. On the one hand,
private investors do not appear to change their decisions to directly invest in foreign countries based14These include: Azerbaijan, Bulgaria, Croatia, Cyprus, Estonia, Israel, Kazakhstan, Kuwait, Latvia, Liechtenstein,
Lithuania, Malta, Romania, Russia, Saudi Arabia, Chinese Taipei, Thailand, Timor-Leste, Turkey, and the UAE.15While they exhibit the strongest effects, these donors provide a relatively small amount of overall aid, so they do
not drive the overall finding in Table 4.1.
727272
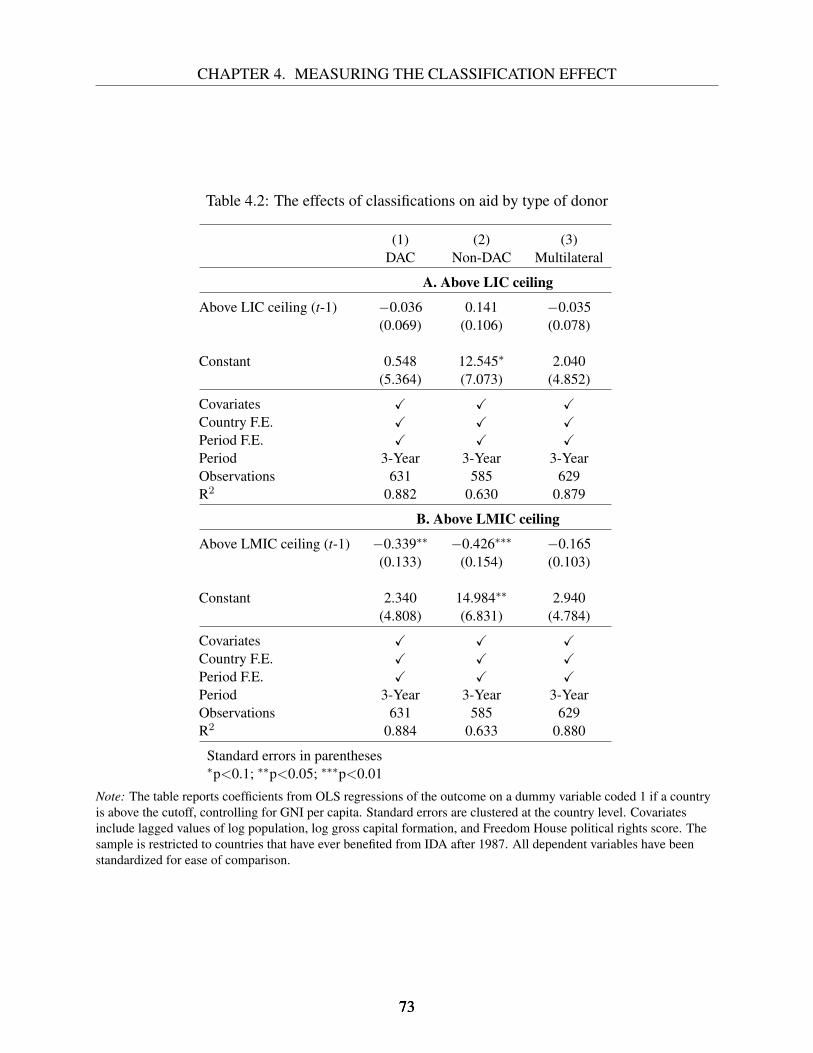
CHAPTER 4. MEASURING THE CLASSIFICATION EFFECT
Table 4.2: The effects of classifications on aid by type of donor
(1) (2) (3)DAC Non-DAC Multilateral
A. Above LIC ceiling
Above LIC ceiling (t-1) −0.036 0.141 −0.035(0.069) (0.106) (0.078)
Constant 0.548 12.545∗ 2.040(5.364) (7.073) (4.852)
Covariates X X XCountry F.E. X X XPeriod F.E. X X XPeriod 3-Year 3-Year 3-YearObservations 631 585 629R2 0.882 0.630 0.879
B. Above LMIC ceiling
Above LMIC ceiling (t-1) −0.339∗∗ −0.426∗∗∗ −0.165(0.133) (0.154) (0.103)
Constant 2.340 14.984∗∗ 2.940(4.808) (6.831) (4.784)
Covariates X X XCountry F.E. X X XPeriod F.E. X X XPeriod 3-Year 3-Year 3-YearObservations 631 585 629R2 0.884 0.633 0.880
Standard errors in parentheses∗p<0.1; ∗∗p<0.05; ∗∗∗p<0.01
Note: The table reports coefficients from OLS regressions of the outcome on a dummy variable coded 1 if a countryis above the cutoff, controlling for GNI per capita. Standard errors are clustered at the country level. Covariatesinclude lagged values of log population, log gross capital formation, and Freedom House political rights score. Thesample is restricted to countries that have ever benefited from IDA after 1987. All dependent variables have beenstandardized for ease of comparison.
737373

4.1. Statistical Tests of the Classification Effect
Figure 4.1: The effects of classifications by individual donors
(a) LIC Ceiling
●●●
●
●●
●
●
●●
●
●
●
●
●
●
●
●
●
●
●
●
●
●
●
●
●
●
●
●
●
●
●
−0.3
0.0
0.3
Spa
inIM
FS
wed
enA
ustr
iaN
ethe
rland
sIta
lyU
ND
PD
enm
ark
Bel
gium
Ger
man
yC
anad
aS
witz
erla
nd NZ
Japa
nA
fDB
WB
IFA
DU
KIr
elan
dIA
DB
Por
tuga
lN
orw
ayF
inla
ndA
ustr
alia
Asi
anD
BLu
xem
bour
gK
orea
Fra
nce
EC
Turk
ey US
GFA
TM
GA
VI
Donors (ordered by coefficient size)
Coe
ffici
ent (
Sta
ndar
dize
d)
● ●No Uses classifications in eligibility policy
Effect of LIC Ceiling on Aid by Donor
(b) LMIC Ceiling
●●
●
●●
●
●
●
●●
●●
●
●
●
●
●
●●
●
●
●
●
●
●
●●
●
●
●
●
●●
−1.0
−0.5
0.0
0.5
GFA
TM
GA
VI
IFA
DK
orea
Nor
way
Fin
land
Fra
nce
Irel
and
Luxe
mbo
urg
UK
Japa
nU
SA
sian
DB
Aus
tral
iaS
witz
erla
ndC
anad
aE
CN
ethe
rland
sN
ZD
enm
ark
Sw
eden
Spa
inTu
rkey
IAD
BW
BA
fDB
UN
DP
Bel
gium
Ger
man
yA
ustr
iaIta
lyP
ortu
gal
IMF
Donors (ordered by coefficient size)
Coe
ffici
ent (
Sta
ndar
dize
d)
● ●No Uses classifications in eligibility policy
Effect of LMIC Ceiling on Aid by Donor
Note: Each observation represents the effect of classifications on the official development assistance of asingle donor, noted on the x-axis. Each observation comes from a different regression and observations areordered by coefficient size. Donors in blue (Gavi, the Global Fund, and the European Community) includethe World Bank’s classifications as part of their eligibility policies.
747474
CHAPTER 4. MEASURING THE CLASSIFICATION EFFECT
on their classifications. Model 2 of Table 4.1 shows that graduating to “lower-middle income” and
later “upper-middle income” country status does not affect a country’s net FDI inflows. However,
surveys of sovereign risk analysts reveal that classifications affect their perceptions of the cred-
itworthiness of countries. Model 3 of Table 4.1 shows that becoming “upper-middle income” is
associated with a bump in a country’s creditworthiness score, and this result is significant at the
.1 level. This specification likely understates the effect at this threshold, as it imputes zeroes for
all country-years with no rating. Table 4.3 presents the results without these imputations, in other
words, using only the data for countries that received a creditworthiness score. In this specification,
the coefficient size on graduating to “upper-middle income” status doubles and becomes significant
at the .05 level. However, graduating to “lower-middle income” status also becomes significant yet
produces a negative rather than a positive effect. This is because countries are more likely to be
rated when they become “lower-middle income,” as shown in Model 3 of Table 4.3. This finding
too suggests the importance of the income classifications, as being rated itself communicates an
improvement in a country’s standing.16 Despite the fact that sovereign lending involves careful
analysis of economic fundamentals, these results suggest that even senior analysts responsible for
these decisions are biased by how a country is classified.
Finally, raters of democracy also exhibit a classification bias. Countries that reach “lower-
middle income” status have systematically higher Freedom House ratings than their “low income”
counterparts, and the result is statistically significant at the .05 level. This result should be surpris-
ing for two reasons: This rating aims to capture democracy rather than development, and raters
claim to follow rigorous coding procedures. The presence of a classification effect even in these
evaluations of a dimension separate from economic development is consistent with the widely doc-
umented “halo effect,” by which units sharing one characteristic are assumed to share other char-
acteristics. However, these classifications appear to more powerfully influence Freedom House
16However, the decision to include a country on the survey is made by the Institutional Investor magazine, not by thesovereign risk analysts they invite to participate in the survey. This decision, is therefore, not indicative of investors’perceptions but rather the magazine’s.
757575

4.1. Statistical Tests of the Classification Effect
Table 4.3: The effects of classifications on credit ratings
(1) (2) (3)With imputations Without imputations Any rating (0-1)
A. Above LIC ceiling
Above LIC ceiling (t-1) 0.053 −0.156∗∗∗ 0.185∗
(0.059) (0.055) (0.104)
Constant −2.719 14.489∗∗∗ −10.678(3.841) (5.496) (6.992)
Covariates X X XCountry F.E. X X XYear F.E. X X XPeriod Year Year YearObservations 2,938 2,148 3,202R2 0.851 0.916 0.768
B. Above LMIC ceiling
Above LMIC ceiling (t-1) 0.111∗ 0.197∗∗ 0.054(0.064) (0.077) (0.094)
Constant −3.661 13.820∗∗ −12.039∗
(3.944) (5.546) (7.066)
Covariates X X XCountry F.E. X X XYear F.E. X X XPeriod Year Year YearObservations 2,938 2,148 3,202R2 0.851 0.917 0.767
Standard errors in parentheses∗p<0.1; ∗∗p<0.05; ∗∗∗p<0.01
Note: The table reports coefficients from OLS regressions of the outcome on a dummy variable coded 1 if a countryis above the cutoff, controlling for GNI per capita. Standard errors are clustered at the country level. Covariatesinclude lagged values of log population, log gross capital formation, and Freedom House political rights score. Alldependent variables have been standardized for ease of comparison.
767676
CHAPTER 4. MEASURING THE CLASSIFICATION EFFECT
ratings at the lower end of the income spectrum; no difference is detected between “lower-middle”
and “upper-middle” income countries.
These results are robust to several alternative specifications. One concern is that including
Freedom House as a control variable in the aid, FDI, and creditworthiness regressions introduces
endogeneity, since I have demonstrated that the classifications influence this measure. In Appendix
Tables B.5-B.8, I show that my results are robust to dropping this control as well as all controls. The
aid results also do not change by using yearly rather than periodic observations. Finally, Appendix
B.1.4 presents the results from an alternative model, which uses change scores and holds changes
in GNI per capita constant to identify the effect of crossing a cutoff. This model focuses on
explaining year-to-year variation in how observers react to a single country’s change in category,
omitting the country-to-country variation in how observers react to countries just above and just
below a threshold. The results from this exercise are similar to those yielded by the baseline model.
4.1.5 Discussion
With some exceptions, the classification effects I measure are consistent with those predicted by
my theory. I found strong support for hypothesis 1A: Donors are susceptible to the income classi-
fications. Donors are significantly more likely to prefer allocating aid to LMICs than to UMICs.
Curiously, there is little evidence of donor flight following a country’s graduation from LIC to
LMIC status. This is possibly because some donors actually increase aid to countries as they be-
come LMICs, contrary to my predictions. This may be because there is a growing emphasis on
effective aid in the development community, leading some donors (such as the US) to privilege
giving aid to places where it will make a difference over the places with greatest need. Such be-
haviors may obscure my ability to observe a classification effect. An alternative possibility is that
publicity about the challenges LMICs face has succeeded in mitigating the classification effect at
this threshold, while UMICs receive no such attention. Both of these explanations are consistent
with the strategic story I outline, as donors must justify their allocation of a scarce resource across
777777

4.1. Statistical Tests of the Classification Effect
a pool of competitive applicants based on norms in the development community. Furthermore, the
heterogeneity in classification effects by donor is consistent with hypothesis 1B: Donors facing
greater skepticism from domestic publics or peer institutions have greater strategic need to use
classifications. Bilateral donors, both traditional and non-traditional, use classifications more than
multilateral donors.
With respect to hypothesis 2, I found more evidence that classifications affect the perceptions
(2A) than the behaviors (2B) of investors. When a country crosses the LMIC ceiling, it is more
likely to be perceived as creditworthy by sovereign risk analysts who are responsible for deciding
to lend to a country. However, classifications do not produce any observable change in FDI. One
interpretation of these findings is that classifications shape a country’s reputation as a borrower
but not its reputation for creating a stable business environment, but it is hard to imagine that
these two features are unrelated in the minds of investors. Another interpretation is that while
investors’ perceptions change, the effect is not large enough to induce changes in behaviors. One
existing study finds no observed relationship between the World Bank’s Ease of Doing Business
ranking and FDI.17 This is noteworthy because this ranking should rationally influence FDI in
a way that income classifications should not; if the Ease of Doing Business ranking does not
drive FDI, then it is much less surprising that income classifications do not either. According to
this interpretation, even the cognitive effects of classifications on investor behavior are minimal.
Yet another interpretation of these findings is that these reflect the evaluations of different types
of investors: firm owners responsible for FDI may differ from sovereign risk analysts. These
findings could also be explained if firm owners do, in fact, respond to classifications, but in opposite
directions. If some investors are attracted to the high rewards associated with LICs while others
are attracted to the low risk associated with MICs, then classification effects could exist but cancel
each other out. My study is not able to distinguish between these. Nonetheless, a conclusion that
investors do not exhibit a cognitive bias simply speaks to the limitations of the classification effect
17See Jayasuriya (2011).
787878

CHAPTER 4. MEASURING THE CLASSIFICATION EFFECT
rather than negating its power over other users.
I find strong evidence in favor of hypothesis 3: Countries with higher classifications are signifi-
cantly more likely than countries with lower classifications to receive favorable democracy scores.
In particular, when a country crosses the LIC ceiling, it receives a higher democracy rating. It is
plausible that I would observe this effect in the case of Freedom House’s political rights score,
where there is substantial room for the subjective views of raters to enter their judgments.18 These
results therefore add to scholarly concerns about the use of Freedom House ratings to measure
democracy.19
Taken together, my findings suggest that the cognitive mechanism likely accounts for at least
some portion of the classification effect. This is because the strategic mechanism is unable to
account for the effects I detected in raters’ behavior. It is not possible given this design to ex-
plain what portion of the aid findings are attributable to a cognitive versus a strategic mechanism,
although the heterogeneity in donors’ behavior is consistent with the existence of the strategic
mechanism. Distinguishing these mechanisms in the case of donors’ behavior is the primary goal
of Chapter 5.
4.2 Classification Experiences
In order to learn about how countries experience these transitions between categories, I carried
out several interviews of elites based in Washington, D.C., from June to August 2016. These
interviews were designed to be theory-building: They contributed to the theoretical framework,
which I then tested systematically above, but I present them here to illustrate examples of the
patterns described above in the experiences of specific graduating countries. To this end, I created
a sample of countries, and for each country I interviewed elites who would be able to speak to its
experience. This approach treats countries as unitary actors — that is, a whole country experiences
18See Bradley (2015).19For a countervailing perspective, see Bush (2017).
797979

4.2. Classification Experiences
a classification in the same way and pursues a coherent goal. While I often interviewed multiple
individuals about a country, I consider these to be multiple data points about a single (country)
observation. This is in contrast to the design of the interviews in Chapter 6, which seek to unpack
the separate experiences and preferences of various groups and individuals within a country.
In order to anchor my interviews in policy issues of relevance to interviewees, I focused these
conversations on proposed changes to policy regarding graduation from the World Bank’s grant
and concessional loans program, the International Development Association (IDA). As explained
in Chapter 3, graduation discussions begin when a country crosses a GNI per capita cutoff known
as the “operational cutoff.”20 This triggers an assessment of the country’s creditworthiness; if it is
found creditworthy, it begins also borrowing from the International Bank for Reconstruction and
Development (IBRD) on harder terms. The country can continue borrowing from both banks for
a few years as a “Blend” country, but every three years when donors convene, they will evaluate
whether to graduate the country from IDA so it only borrows from the IBRD. IDA graduation
policy reform is currently one of the most pressing issues within the World Bank because so many
populous and geopolitically important countries are expected to soon graduate to Blend or IBRD
status, challenging the resource constraints of the IBRD. Furthermore, my conversations occurred
during a year of one of these donor meetings (known as replenishments), so the topic provided a
natural context for discussing these dynamics. While conversations focused on IDA graduation,
mentions of other classifications also arose in conversations.
I constructed a group of all recent and upcoming IDA graduates, which appears in Appendix
Table B.10. For each case country, I sought to interview representatives from the graduating coun-
try to the World Bank, officials at the World Bank who worked with the graduating country, and
representatives from donor countries who had interacted with the graduating country (either Ex-
ecutive Directors of the World Bank or Deputies to IDA replenishment meetings). Often, officials
in these latter categories had experiences with multiple graduating countries. I tried to maximize20This cutoff is about $200 higher than the threshold separating low and lower-middle income countries. It is also
updated each year to account for inflation.
808080
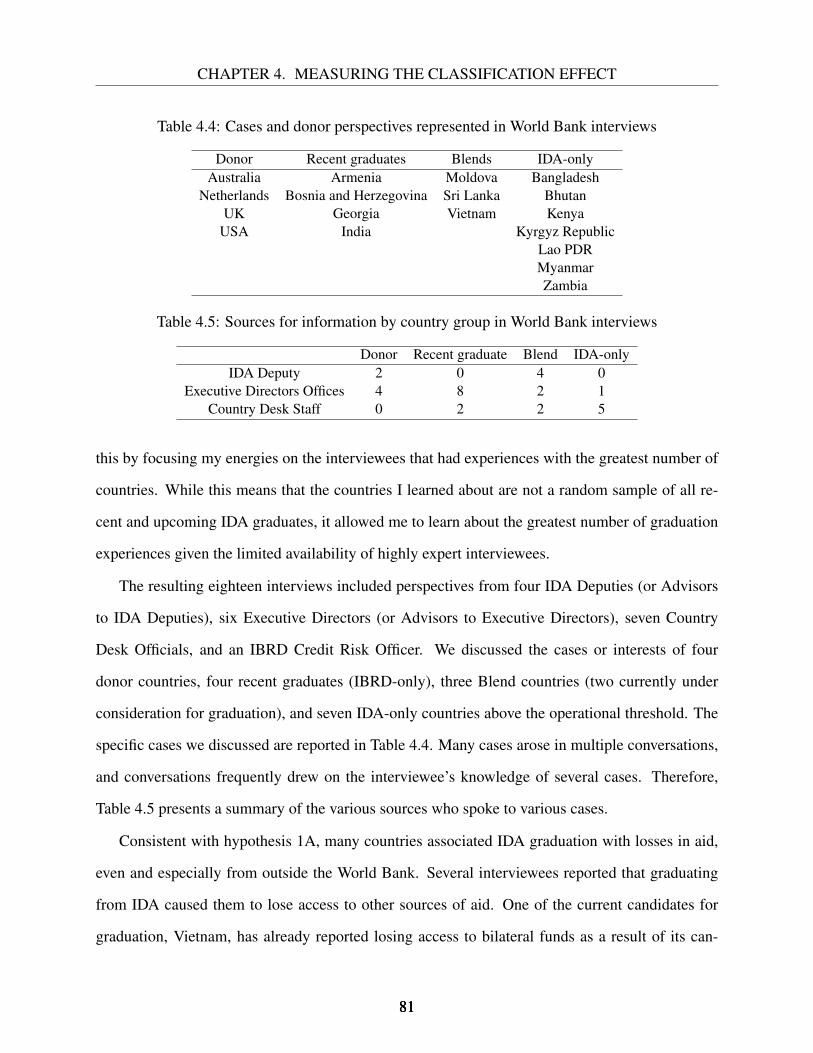
CHAPTER 4. MEASURING THE CLASSIFICATION EFFECT
Table 4.4: Cases and donor perspectives represented in World Bank interviews
Donor Recent graduates Blends IDA-onlyAustralia Armenia Moldova Bangladesh
Netherlands Bosnia and Herzegovina Sri Lanka BhutanUK Georgia Vietnam Kenya
USA India Kyrgyz RepublicLao PDRMyanmarZambia
Table 4.5: Sources for information by country group in World Bank interviews
Donor Recent graduate Blend IDA-onlyIDA Deputy 2 0 4 0
Executive Directors Offices 4 8 2 1Country Desk Staff 0 2 2 5
this by focusing my energies on the interviewees that had experiences with the greatest number of
countries. While this means that the countries I learned about are not a random sample of all re-
cent and upcoming IDA graduates, it allowed me to learn about the greatest number of graduation
experiences given the limited availability of highly expert interviewees.
The resulting eighteen interviews included perspectives from four IDA Deputies (or Advisors
to IDA Deputies), six Executive Directors (or Advisors to Executive Directors), seven Country
Desk Officials, and an IBRD Credit Risk Officer. We discussed the cases or interests of four
donor countries, four recent graduates (IBRD-only), three Blend countries (two currently under
consideration for graduation), and seven IDA-only countries above the operational threshold. The
specific cases we discussed are reported in Table 4.4. Many cases arose in multiple conversations,
and conversations frequently drew on the interviewee’s knowledge of several cases. Therefore,
Table 4.5 presents a summary of the various sources who spoke to various cases.
Consistent with hypothesis 1A, many countries associated IDA graduation with losses in aid,
even and especially from outside the World Bank. Several interviewees reported that graduating
from IDA caused them to lose access to other sources of aid. One of the current candidates for
graduation, Vietnam, has already reported losing access to bilateral funds as a result of its can-
818181
4.2. Classification Experiences
didacy.21 The same has occurred for previous graduates Armenia and Georgia. A former World
Bank official from Georgia stated that one donor backed out of a trust fund and cited Georgia’s loss
of IDA status as its reason for doing so. Furthermore, following Armenia’s and Georgia’s 2014
graduation, Georgia nearly lost its regional hub because it was viewed as less important to World
Bank operations.22 A World Bank Board official representing Armenia and Georgia noted that dur-
ing 2016 negotiations over graduation policy reform, a proposal for access to an additional source
of financing called IDA+ for recently graduated countries was withdrawn because “IDA is for the
poorest countries.”23 Even the countries that have not yet become categorized as Blend anticipate
this dynamic. One advisor spoke of Zambian officials’ concern about losing access to aid, par-
ticularly after crossing the LMIC/UMIC threshold.24 In summary, one advisor stated, “Proposed
IDA graduation reforms do not address the issue of perception of countries as IDA and non-IDA
by the donor community.”25 The perception that donors coordinate on World Bank classifications
was widespread; one IDA deputy stated, “we all know it goes on.”26
In the donor community, several pieces of evidence are consistent with the strategic mecha-
nism. Many donors formally tie eligibility for their assistance to the World Bank analytical income
classification system. Even though the World Bank has never attached any material benefits to
these categories, the Global Fund to Fight AIDS, TB, and Malaria,27 the Millennium Challenge
Corporation (MCC),28 and Gavi,29 all include income classifications in their eligibility policies.
Medecins Sans Frontieres notes that MICs are often excluded from voluntary license agreements
with pharmaceutical companies and are therefore penalized in tiered pricing schemes, limiting
21Author’s interview with IDA deputy, July 22, 2016, Washington, DC.22Author’s interview with former advisor to Executive Director, August 2, 2016, Washington, DC.23Author’s interview with advisor to Executive Director, August 3, 2016, Washington, DC. The recent graduates
were Angola, Armenia, Bosnia-Herzegovina, and Georgia.24Author’s interview with advisor to Executive Director, July 21, 2016, Washington, DC.25Author’s interview with former advisor to Executive Director, August 2, 2016, Washington, DC.26Author’s interview with IDA deputy, July 22, 2016, Washington, DC.27http://www.theglobalfund.org/documents/core/eligibility/Core_
EligibilityAndCounterpartFinancing_Policy_en/28https://www.mcc.gov/resources/doc/report-candidate-country-fy-201629http://www.gavi.org/support/apply/countries-eligible-for-support/
828282

CHAPTER 4. MEASURING THE CLASSIFICATION EFFECT
the provision of vaccines to countries with some of the highest rates of HIV/AIDS.30 To rely on
classifications as heuristics is one thing; to formally commit to using them as a matter of policy
demands a higher level of scrutiny and defense, making it less likely that cognitive biases account
for these behaviors. Furthermore, while representatives of donor governments are disincentivized
to be candid about strategic incentives for their allocations, some nonetheless are. As one U.S.
Treasury official commented, “When we can show that most of our aid is benefiting Least De-
veloped Countries (LDCs) or fragile and conflict-affected states, this helps our numbers.”31 This
logic is consistent with hypothesis 1B, as it implies that the need to show numbers drives the use
of classifications.
While these discussions laid the basis for my predictions about donors, they were less useful
for developing predictions about the behaviors of investors and raters for two reasons. First, a grad-
uation from IDA to IBRD entails a formal (subjective) evaluation of creditworthiness by the World
Bank. An IDA officer formerly in charge of assessing the creditworthiness of IDA graduates for
IBRD lending noted that countries often pursue IDA graduation as a “stamp of approval” because
it helps reduce their borrowing costs on the open market.32 While consistent with my findings, this
relationship could alternatively be explained by the private information contained in classifications
like these lending categories. In other words, I cannot rule out alternative explanations in this case.
Second, World Bank lending categories are not widely known beyond the world of development
finance. While donors will be familiar with the meaning of these categories, it is less likely that
other audiences would know the difference between IDA-only, Blend, and IBRD labels. In this
way, the World Bank lending categories are an example of an issue-specific classification that will
have limited reach, the opposite of the kind of classification described in hypothesis 7.
30https://www.msfaccess.org/sites/default/files/MSF_UTW_17th_Edition_4_b.pdf31Author’s interview with U.S. Treasury official, August 5, 2016, Washington, DC.32Author’s interview with IBRD credit risk officer, July 26, 2016, phone interview.
838383

4.3. Summary
4.3 Summary
In sum, this chapter has provided observational evidence to support my claims that classifications
drive the behaviors of international observers. I showed using cross-national data that countries
receive less aid but more favorable ratings of their creditworthiness and democracies when they
become MICs according to the World Bank. These patterns also characterized the experiences of
several countries who have graduated from the World Bank’s IDA group to its IBRD group, as I
learned during my interviews with a variety of stakeholders in this process. In the next chapter, I
focus on the aid results, where my observational evidence cannot decisively determine whether the
mechanism at work is a cognitive or strategic one. I will offer experimental evidence to illustrate
that donors are especially sensitive to a strategic mechanism.
848484
Chapter 5
Cognitive or Strategic? Testing the
Mechanism
In the previous chapter, I showed that classifications have dramatic real-world consequences. When
countries break out of development country categories, they receive less aid but better credit and
democracy ratings. This observational evidence is valuable because it shows that classifications
actually matter for relevant decision-makers. However, it can only say so much about why these
classifications are so important. In the theoretical framework, I argued that investors and raters
have no strategic incentives to employ classifications, so any classification effect must result from
a cognitive mechanism for these actors. Donors, on the other hand, have great strategic incentive
to use classifications, so it is not clear whether the effects of classifications on aid are caused by
this strategic mechanism or whether they are also caused by cognitive biases.
The aim of this chapter is to unpack why donors use classifications in their decision-making.
To do this, I invite individuals attending a side meeting of the United Nations (UN) focused on sus-
tainable development to allocate a hypothetical foreign aid budget across several country profiles.
I randomly manipulate the information provided to them about these countries, including their
income classifications. I find that classifications cause individuals to disproportionately allocate
85
5.1. Experimental Design
aid to lower income countries, even holding constant the identity of the countries. To distinguish
between the two proposed mechanisms, I also randomly manipulate the strategic incentives partic-
ipants face. Nearly all of the classification effect I observe is driven by these strategic incentives.
In other words, among donor elites, the strategic mechanism is more likely than the cognitive
mechanism to drive distortions in aid allocation. Overall, this experimental evidence shows that
the classification effect occurs on the micro-level and not just the macro-level.
In what follows, I present the experimental design, which randomly manipulates whether par-
ticipants are exposed to classifications and whether their decisions will be evaluated by a non-
expert actor. In addition, I exploit a unique quirk in historical World Bank data in order to ran-
domly assign the specific classifications associated with individual countries, all while avoiding
deceiving participants. Next, I describe the sample of 232 individuals who participated in this
UN-sponsored meeting on sustainable development. I claim that surveying this well-informed, ed-
ucated, and experienced sample is a strong second-best alternative to surveying those individuals
actually responsible for allocating aid. Finally, I present and discuss my results. I show that classi-
fications change aid allocation behavior, but only for individuals who are strategically incentivized
to consider how their actions will be judged by a non-expert actor.
5.1 Experimental Design
To test how and why classifications influence aid allocation decisions, I embed into a survey an ex-
perimental activity in which I randomize the information provided to participants and the strategic
incentives that influence their decisions.
The experimental participants are invited to allocate a hypothetical foreign aid budget across
five country profiles. Participants complete this task several times (“rounds”) and are paid a fixed
wage (the aid budget does not come from their wages). Each set of profiles includes data on gross
national income (GNI) per capita, the indicator used to directly determine whether a country is clas-
868686
CHAPTER 5. COGNITIVE OR STRATEGIC? TESTING THE MECHANISM
sified as a Lower-Middle Income Country (LMIC) or a Upper-Middle Income Country (UMIC).
To avoid priming respondents to consider only national income, I also include some other relevant
statistics for each of the five countries. The objective of this experiment is to understand how par-
ticipants’ allocation decisions are influenced by the presence of classifications and to test whether
this relationship can be explained through a cognitive or a strategic mechanism.
5.1.1 Treatment Conditions
Participants are randomly assigned to one, both, or neither of two treatment conditions in a factorial
design. In the Classifications treatment, participants see countries’ classifications on the five pro-
files. In the Judges treatment, participants are also informed that their decisions will be evaluated
by a “judge,” who will determine whether their allocation decisions deserve to be rewarded with a
bonus. As I will describe, these two treatment conditions permit me to (1) identify a “classification
effect” and (2) measure what part of this effect is driven by cognitive psychology versus strategic
behavior.
Classifications
The first treatment identifies the effect of a classification system on a participant’s allocation. All
participants see the same information about countries when they receive a set of five profiles: GNI
per capita, gross domestic product growth, the percent of the population that is undernourished,
and the maternal mortality ratio.1 Profiles are presented along a number line of GNI per capita (see
Figure 5.1). For a randomly selected group of participants, the threshold separating one income
classification from the next is also plotted on the number line, and the sides of the number line
are shaded and labeled to indicate the various countries’ classifications (see Panel A). A partic-
1These statistics were selected because they reflect various measures of a country’s need and because they haverelatively little missing data. Since they are not the focus of this experiment, these data are presented to all sub-jects regardless of treatment condition. In other words, while these statistics are also likely to influence participants’allocations, they will have equal influence for treatment and control groups.
878787

5.1. Experimental Design
ipant is assigned to the same classification treatment for the duration of the experiment to avoid
interference between rounds.
Figure 5.1: Examples of profiles including and excluding classifications
(a) Treatment
(b) Control
Note: To avoid any psychological tendencies associated with colors, I additionally randomize whether blueand yellow are on either left or right of the treatment graphic.
Under the logic of randomization, any observed differences in the allocation behaviors of par-
888888
CHAPTER 5. COGNITIVE OR STRATEGIC? TESTING THE MECHANISM
ticipants assigned to the classification condition may be attributed to the classifications themselves.
The classifications themselves convey no new information, and by placing the classifications along
a number line, the graphics illustrate that classifications are simply a construct of GNI per capita.
While the graphics do feature GNI per capita more prominently than the other included statistics,
this is true of both treatment and control groups and thus cannot bias the results.
Judges
The second treatment is designed to identify the mechanism by which a classification effect oper-
ates. I hypothesized that two such mechanisms could be at work: a cognitive mechanism, whereby
classifications simplify information for the decision-maker, and a strategic mechanism, whereby
classifications serve as useful tool by which decision-makers can signal their impartiality to an
audience. The classifications treatment, in isolation, could operate only via the cognitive effect. To
create strategic incentives for a participant to use classifications, the second treatment introduces
a “judge” who can punish or reward a participant for her allocation decisions. The judge is not
herself a strategic player in the experiment — what is important is the information about the judge
that I give to participants, as this is what will shape their decisions. Participants learn that “[t]he
judge will be an intern (i.e an entry-level staffer) in the office of a politician (i.e. a congressper-
son/MP) in a major donor country. The judge is NOT an expert on development.” Participants
in this treatment condition are also informed that if they are randomly selected to receive a prize,
then they will only receive this prize if the judge approves of their allocation decisions. Because a
participant’s expected payout is contingent on the evaluation of the judge, this relationship imitates
the real-world relationship between an aid agency (the participant) and any funder or observer of
the aid agency, such as a legislature, median taxpayer, or international citizen (the judge). By
comparing the treatment effect of classifications for the participants being assessed by judges to
the treatment effect of classifications for the participants with no such incentives, I can isolate the
cognitive and strategic mechanisms.
898989

5.1. Experimental Design
The judges treatment works by altering the participant’s utility function, comprising the fixed
sitting fee (F) and personal bonuses (B). This can be described as follows:
U = F + p ∗B (5.1)
where p is the probability that a participant is randomly selected to receive a bonus. The judges
treatment manipulates p.
In the control condition, p is a random variable, ensuring that participants’ earnings are unaf-
fected by their behavior in the game. They are not materially rewarded for allocating aid one way
or another and receive a fixed sitting fee.
In the judges treatment condition, however, allocation portfolios are the result of both random
chance as well as the decision of a judge. In other words, p decreases (because a participant’s
allocation must be both randomly selected and also approved by the judge) by an amount capturing
the preferences of the judge. This requires participants to take into account the way their allocation
appears to an external judge if they want to receive a bonus. Participants are informed that judges
will make their decisions after the conclusion of the experiment, so they have no opportunity to
learn the preference of the judge. Instead, they must guess what a judge will be looking for in their
allocation decisions. This is itself the treatment.
Factorial Design
Crossing the classifications and judges treatments (1) demonstrates the classification effect and
(2) tests whether the effect can be attributed to the strategic versus the cognitive mechanism. The
overall classification effect is captured by comparing allocations made by participants in the Clas-
sifications group to those in the No Classifications group. For the subset of participants in the No
Judges group, the classification effect is entirely cognitive because there are no strategic incentives
to use the classifications to signal. For the subset of participants in the Judges group, both the cog-
909090

CHAPTER 5. COGNITIVE OR STRATEGIC? TESTING THE MECHANISM
Table 5.1: Estimands identified by factorial design
ClassificationsTreatment Control
TreatmentJu
dges
Control
Estimand Comparison
Cognitive Effect
Total (Cognitive+Strategic) Effect
nitive and strategic effects may be at work. Table 5.1 illustrates the estimands identified through
the factorial design.
5.1.2 Identification Strategy
To operationalize my measure of individuals’ allocation behavior, I measure participants’ alloca-
tions to countries near the threshold separating two categories in the classification system. In the
World Bank income classification system, the threshold separating LMICs and UMICs is currently
a GNI per capita of $4,035.2 In every set of five profiles, I provide participants with profiles of
2I select the threshold separating LMICs and UMICs because this is the threshold that produced the strongestresults in my observational data, and I want to use the experiment to understand that. An alternative is to look at thedifference between Low Income Countries (LICs) and LMICs, but my early research suggests that participants tend to
919191
5.1. Experimental Design
two countries well below this threshold, two countries well above it, and one country near the
threshold. I expect classifications to primarily affect allocations to the middle country, whose need
is perceived to be the most ambiguous. Specifically, I expect the classifications treatment to cause
a middle country to receive less aid when it is above the threshold and more aid when it is below
the threshold. In contrast, participants assigned to the control condition who are unaware of the
existence of a threshold should not alter their allocation behavior to this middle country depending
on whether it is above or below the threshold.
Since participants are unlikely to be influenced by differences in GNI per capita on the scale of
$50-$100, any observed difference in their allocations to the middle country based on its position
above or below the threshold should only be caused by the participant’s exposure to the existence
of a threshold. However, given the limited number of real country profiles that fall within this
tight window, it is impossible to rule out the possibility that country-specific characteristics of the
countries below the threshold and above the threshold make them more or less desirable recipi-
ents. While in expectation these differences should be equally distributed across the threshold, the
limited sample of possible profiles increases the possibility that these effects dominate.
To address this concern, I circulate two versions of each middle country profile and randomize
whether the participant sees a version in which the country is just-above or just-below the threshold.
This eliminates any country-specific characteristics that could systematically distinguish the just-
above from the just-below countries.
However, lying about a country’s classification or national income violates the experimental
norm of no deception. Fortunately, I can ensure that the information I am providing participants is
honest by exploiting a unique feature of World Bank data: National income figures are frequently
revised over time. National income estimates are revised when national statistics offices or the
World Bank change their statistical assumptions or incorporate new information. These revisions
occur quite frequently and can sometimes be extreme. (For example, a rebasing exercise caused
feel that LICs and LMICs both require lots of aid; it is only higher in the income distribution where it is plausible thatcountries could no longer require aid.
929292

CHAPTER 5. COGNITIVE OR STRATEGIC? TESTING THE MECHANISM
the figure reported in the World Bank World Development Indicators (WDI) for Kenya’s GNI per
capita in 2011 to change from $820 to $1020.) The World Bank Database Archives contain all
published versions of the WDI, which allow me to see all the figures that have ever been published
about a country’s income in a given year. I select which figures are most appropriate for me to
report for participants and inform the Agents that data are sourced from the World Bank, accessed
various dates, 2011-2017.
For example, Paraguay’s 2013 GNI per capita exhibits important variation. In November 2014,
the WDI reported that Paraguay’s 2013 GNI per capita was $4,040. In September 2015, however,
the WDI revised its estimate: Paraguay’s 2013 GNI per capita was now thought to be $4,190. In
2013, the threshold separating LMICs from UMICs was $4,125. This meant that the revision to
the World Bank estimate resulted in a number that would have resulted in a different classification
for Paraguay in 2013.
I select recent country-years whose data revisions have been quite small in magnitude but have
caused a country-year to cross the threshold separating LMICs and UMICs. Once the country-
years are selected, I then select the two GNI figures that are (a) closest to the threshold and (b)
most symmetric in their distance to the threshold from either side. I am able to identify nine such
instances, leaving me with nine middle country profiles that can be randomly assigned to just-above
or just-below the threshold in that year. This produces four different versions of the graphic that
participants can see, as shown in Figure 5.2. (Additional information about the selection of these
profiles as well as the the two well-above and two well-below profiles, is available in Appendix C.)
Each participant sees each of the nine country profiles just once, so she never sees both the just-
above and just-below versions for a given country. In sum, participants are randomly assigned to
the Classifications and Judges conditions, which persist for the duration of the experiment, but each
of their rounds is individually randomly assigned to either the Just-Above or Just-Below condition.
An illustration of this appears in Table 5.2.
My primary research question is whether participants allocate more to just-below countries
939393

5.1. Experimental Design
Figure 5.2: Complete treatment possibilities
(a) No Classifications / Just Above
(b) Classifications / Just Above
(c) No Classifications / Just Below
(d) Classifications / Just Below
Note: To avoid any psychological tendencies associated with colors, I additionally randomize whether blueand yellow are on either left or right of the treatment graphic.
949494
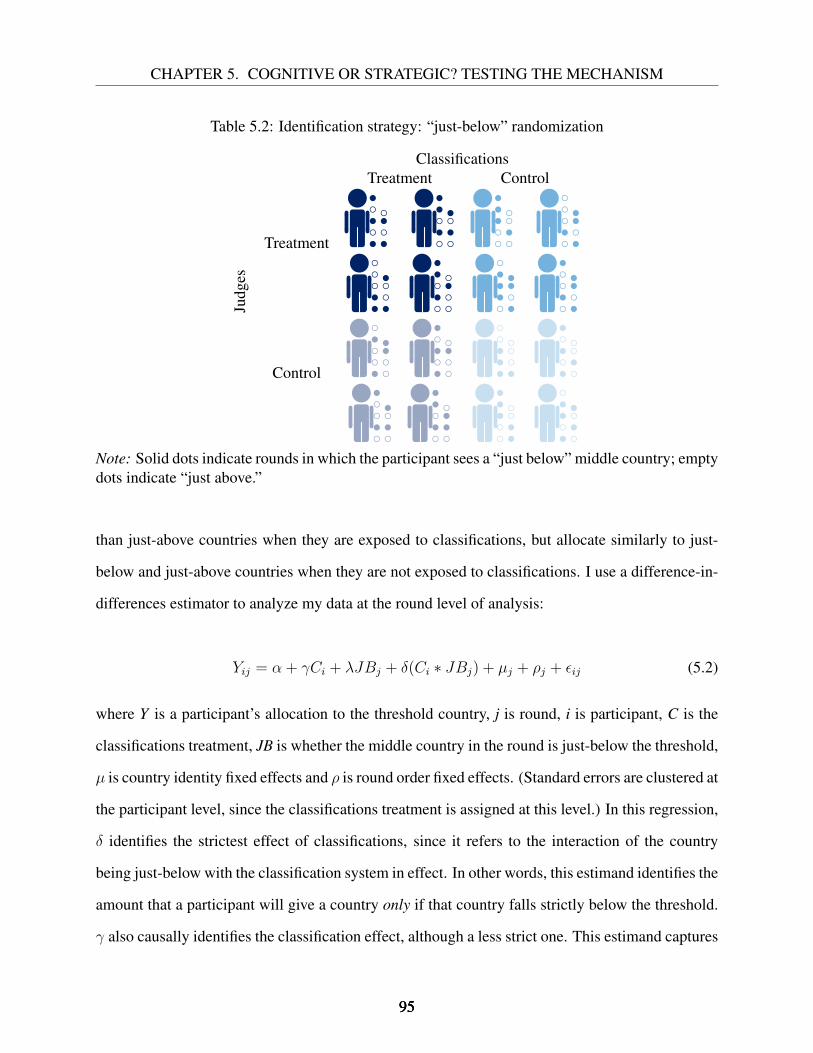
CHAPTER 5. COGNITIVE OR STRATEGIC? TESTING THE MECHANISM
Table 5.2: Identification strategy: “just-below” randomization
ClassificationsTreatment Control
Treatment •◦•◦•
•◦•◦
◦•◦••
◦•◦•
◦◦•••
◦•◦◦
◦•◦◦◦
•◦••
Judg
es
••◦◦◦
•◦◦•
◦•◦••
◦◦•◦
◦•••◦
•◦••
◦•◦◦•
•◦••
Control •◦◦•◦
◦◦••
•◦•◦•
◦◦•◦
•••◦◦
•◦◦◦
•◦•◦•
◦•◦◦
◦•◦◦•
◦•◦•
◦•◦••
◦••◦
◦◦•••
••◦◦
•◦••◦
◦•◦•
Note: Solid dots indicate rounds in which the participant sees a “just below” middle country; emptydots indicate “just above.”
than just-above countries when they are exposed to classifications, but allocate similarly to just-
below and just-above countries when they are not exposed to classifications. I use a difference-in-
differences estimator to analyze my data at the round level of analysis:
Yij = α + γCi + λJBj + δ(Ci ∗ JBj) + µj + ρj + εij (5.2)
where Y is a participant’s allocation to the threshold country, j is round, i is participant, C is the
classifications treatment, JB is whether the middle country in the round is just-below the threshold,
µ is country identity fixed effects and ρ is round order fixed effects. (Standard errors are clustered at
the participant level, since the classifications treatment is assigned at this level.) In this regression,
δ identifies the strictest effect of classifications, since it refers to the interaction of the country
being just-below with the classification system in effect. In other words, this estimand identifies the
amount that a participant will give a country only if that country falls strictly below the threshold.
γ also causally identifies the classification effect, although a less strict one. This estimand captures
959595

5.2. Protocol
the overall effect of seeing classifications on a participant’s allocation to the threshold country,
regardless of whether that country technically falls just above or just below the threshold. I will
refer to δ as a strict classification effect and γ as a general classification effect.
While I conduct this analysis for the full sample, the results are most instructive when calcu-
lated for the sub-samples of participants assigned to the Judges and No Judges treatment condi-
tions. The cognitive effect of classifications is measured by δ and γ for those participants assigned
to the No Judges (control) group. For those participants assigned to the Judges (treatment) group, δ
and γ reflect the participant’s strategic incentives in addition to any cognitive biases, so these repre-
sent the total classification effect. Implicitly, the strategic effect of classifications is the difference
in treatment effects between the two sub-samples.3
5.2 Protocol
The experiment was embedded in a survey fielded to those individuals who registered for the Inter-
national Conference on Sustainable Development.4 This event is held annually in September and
is an official side meeting of the UN General Assembly meetings, taking place at the same time.
Held at Columbia University, the agenda includes addresses by world leaders and development
partners as well as poster presentations of student research on sustainable development. Regis-
tered participants come from the private sector, civil society, government, and also many students
enrolled in development master’s programs.
The survey was fielded online using Qualtrics during the period September 15-19, 2017. I
obtained the e-mail addresses of registered participants and e-mailed each participant a link to
the study a few days before the conference took place. Alternatively, participants could take the
3I prefer this approach to an estimation using triple interactions because it is substantially easier to interpret.4I thank ICSD for graciously allowing me to conduct this study. In particular, Cheyenne Maddox was extremely
helpful and I greatly appreciate her efforts. I also thank enumerators Don Casler and Ricky Clark for their research as-sistance. I thank the Columbia Experimental Laboratory for the Social Sciences for helping me to pilot this experimentin their lab before fielding at ICSD.
969696
CHAPTER 5. COGNITIVE OR STRATEGIC? TESTING THE MECHANISM
survey during coffee breaks on computers provided at the conference site. The survey was e-mailed
to 2,188 registered participants and 232 completed the survey (10.6% response rate).
Study participants were compensated with gift cards and vouchers to eateries near the confer-
ence venue, valued at $5-$10. In addition, study participants were informed that during the survey
they would have the opportunity to win a prize of a subscription to their choice of a news or re-
search periodical, with values up to $300. For those participants who were assigned to the No
Judges treatment condition, they were informed that a randomly selected participant would receive
this prize. For those participants who were assigned to the Judges treatment condition, they were
informed that a randomly selected participant would receive this prize, provided that his or her
allocation decisions were approved by a judge.
The complete study materials — including exact instructions, treatment and question texts, and
screenshots — appear in Appendix C.
Randomization effectively took place through simple random assignment. Using R, I generated
a directory containing 2,188 folders (as many as I had registered participants), each containing 9
uniquely and randomly generated graphics. The 2,188 folders were randomly assigned to the
Classifications and Judges treatments, blocked by ID number, so that 2 folders were associated
with each of the 4 possible crossed treatment conditions for every set of 8 folders. Within each set
of 8, half of the images depicting classifications showed yellow on right and blue on left, while the
other half showed the reverse.
Each folder contained 9 graphics, all reflecting the same treatment condition assigned to the
folder. Each set of 9 graphics was independently generated using simple random assignment. First,
I randomized the order of the 9 threshold countries. Second, I randomized whether the respondent
would see 4 just-below and 5 just-above profiles or 5 just-below and 4 just-above profiles. Third,
I randomized which of the 9 threshold countries would be just-below and which would be just-
above. This determined which year of data from the WDI each round would pull from. Fourth,
I randomized an order for each of the 4 remaining sets of 9 countries each, ensuring that each
979797

5.3. Sample
respondent would see all countries only once in a randomly generated order.5 Fifth, using the
base year of data determined by the threshold country, I populated the associated statistics for all
countries. This resulted in a unique set of graphics for each respondent determined by simple
random assignment.6
Participant e-mail addresses were randomly assigned to folder numbers. When a participant
clicked her e-mailed link, the survey displayed only the images contained in her unique folder. Her
folder ID number also was used to determine whether she would see the treatment text shown to
those in the Judges treatment condition. Given a large sample and low response rate, it is not un-
usual that there is some imbalance in the resulting treatment conditions. In terms of classifications,
more were assigned to treatment (126) than control (106). The judges treatment is more equally
assigned (118 to treatment and 114 to control). However, there is no evidence of any treatment
imbalance on any covariates, suggesting that assignment to treatment was random. These results
are available in Appendix C.
5.3 Sample
The survey attracted a highly educated and diverse sample of individuals interested in and knowl-
edgeable about global development. Although this is not a group of decision-makers in donor
agencies, this is a good second-best group to proxy for their beliefs and behaviors. Figure 5.3
reports descriptive statistics to make this point. The average participant is 28 years old and has
received or will soon receive a master’s degree. As shown in Panel B, about a third of the sample
is currently enrolled in a graduate program in a development-related field. These are the kinds
of degree programs that many individuals working in development themselves attended. Nearly
another third of the sample is currently employed in research, the private sector, non-governmental
5The countries used for this exercise appear in Appendix Table C.1.6Because of the variation in the base year, there were a few cases in which the GNI per capita ordering of the
countries changed from their respective groupings. Data availability constrained my ability to address this problem inthe design, so I instead include a dummy variable for whether this situation occurred in all my analysis.
989898
CHAPTER 5. COGNITIVE OR STRATEGIC? TESTING THE MECHANISM
organizations (NGOs), government, or development partners. Professionals from these domains
attending a development conference are the peers that aid agencies frequently work with. In Panel
C, over half of the sample reports working on development-related issues, and for about a fifth,
they have worked in development for over five years.
It is worth acknowledging, though, that a sizable portion of the sample is less experienced in
development. Panel B shows that the remaining third are undergraduates or graduate students of
issues unrelated to development, and Panel C shows that half of the sample reports no experience
working on development issues. Although this last group are the most unlike decision-makers in
donor agencies, these students have been sufficiently motivated to attend a conference on the topic,
so they are at least a better proxy for an aid agency than a mass sample. In fact, the sample as
a whole demonstrates impressive knowledge of development. 74 percent correctly identified that
a GINI coefficient is a measure of inequality, and 56 percent correctly identified DFID as the aid
agency of the United Kingdom.
The sample is internationally diverse. Respondents represent 48 different countries, with the
largest delegations from the US (40%), India (9%), China (7%), Nigeria (4%), Japan (4%), Ger-
many (3%), and Colombia (3%). International respondents were either representing their countries
at the UN General Assembly meetings or sufficiently invested in development to pay to travel to
an international conference.
While it would be ideal to survey those actually responsible for allocating aid, doing so is a
costly imposition on expert time and resources. The sample of attendees at a side meeting of the
UN focused on sustainable development is a strong second-best sample. Despite the presence of
students, the sample is remarkably educated, professional, and knowledgeable about development
issues. Anecdotally, many participants approached the research team at the conference wishing to
extend the conversation, and they frequently offered informed insights and opinions about foreign
aid and about development in these countries.
999999
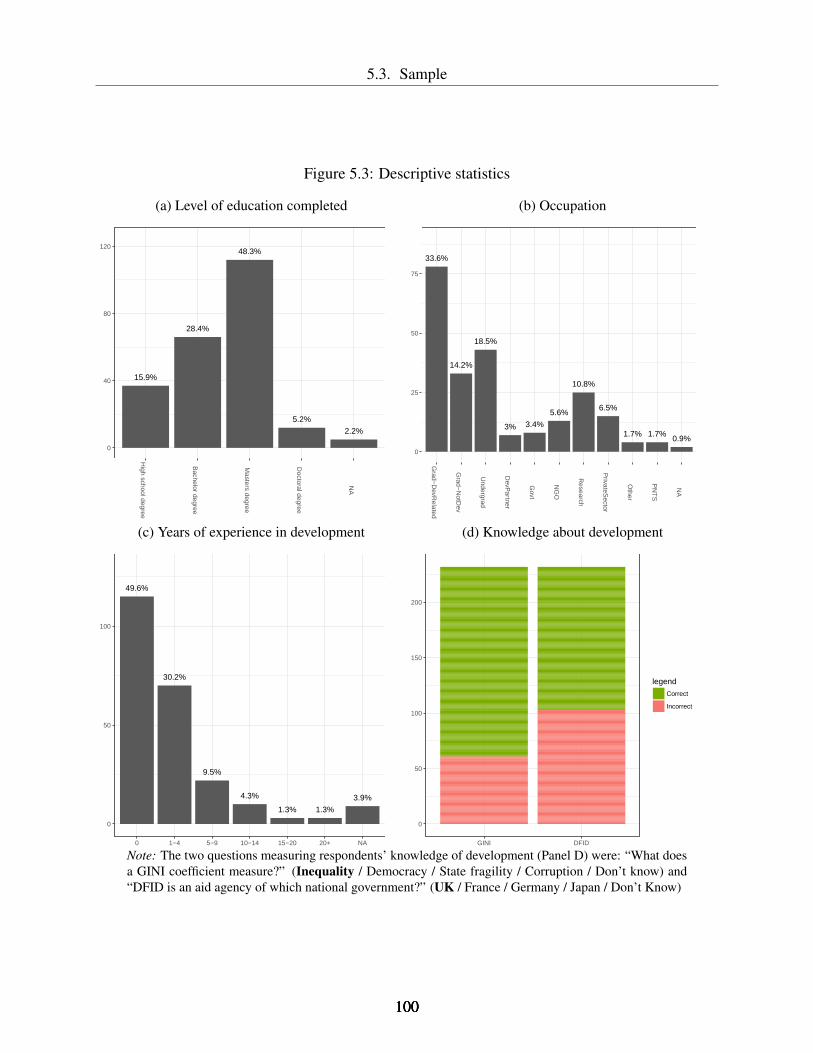
5.3. Sample
Figure 5.3: Descriptive statistics
(a) Level of education completed
15.9%
28.4%
48.3%
5.2%
2.2%
0
40
80
120
High school degree
Bachelor degree
Masters degree
Doctoral degree
NA
(b) Occupation
33.6%
14.2%
18.5%
3% 3.4%
5.6%
10.8%
6.5%
1.7% 1.7%0.9%
0
25
50
75
Grad−
DevR
elated
Grad−
NotD
ev
Undergrad
DevP
artner
Govt
NG
O
Research
PrivateS
ector
Other
PN
TS
NA
(c) Years of experience in development
49.6%
30.2%
9.5%
4.3%
1.3% 1.3%
3.9%
0
50
100
0 1−4 5−9 10−14 15−20 20+ NA
(d) Knowledge about development
0
50
100
150
200
GINI DFID
legend
Correct
Incorrect
Note: The two questions measuring respondents’ knowledge of development (Panel D) were: “What doesa GINI coefficient measure?” (Inequality / Democracy / State fragility / Corruption / Don’t know) and“DFID is an aid agency of which national government?” (UK / France / Germany / Japan / Don’t Know)
100100100

CHAPTER 5. COGNITIVE OR STRATEGIC? TESTING THE MECHANISM
5.4 Results
I find robust evidence of a classification effect, and my results suggest that these effects are pri-
marily driven by the strategic rather than the cognitive mechanism. As a first cut at the data, I plot
respondents’ allocation decisions to the threshold country by the various treatment conditions. The
classification effect is apparent in Figure 5.4, which shows the difference between participants’ al-
locations to the threshold country when it is randomly assigned to be just above or just below the
threshold. Any separation between the colors of the distribution is evidence of a classification
effect. Reassuringly, participants who are not assigned the classification treatment condition do
not appear to modify their allocation decision on the basis of a country’s position with respect to
the threshold. This is logical because these participants are unaware of a threshold separating just
above and just below countries, and differences in GNI per capita on the small scale of $50-$100
should not matter for their decisions. However, we do see differences in the colored distributions
for those participants who see classifications, and this is most observable for those who are also
assigned to the judges treatment condition. This graphical evidence supports the claim that classifi-
cations cause changes in allocation decisions and suggests that the strategic mechanism dominates
the cognitive mechanism in this sample. It is also helpful to see the distribution of the allocation
decisions in these graphics. Since the distribution of the raw variable is skewed right, I use the
logged version in the following analysis, which results in a more normal distribution of the data
(see Figure 5.5).
I present the statistical results in Table 5.3. First, I look for overall evidence of the classification
effect in the full sample. In Model 1, I regress the log allocation to the middle country on the
participant’s classification treatment status (identifying the “general” classification effect, or γ),
whether the threshold country in a round was just above or just below, and the interaction between
the two (the “strict” classification effect, or δ). Model 2 also includes fixed effects for the identity
of the threshold country and the order of the round, as pre-specified. The full sample exhibits a
101101101

5.4. Results
Figure 5.4: Effects on allocation to threshold country
treat_judge: 0 treat_judge: 1
treat_class: 0treat_class: 1
0 25 50 75 100 0 25 50 75 100
0.00
0.01
0.02
0.03
0.04
0.00
0.01
0.02
0.03
0.04
Allocation to threshold country
Den
sity
Just Above Just Below
Note: Plots depict participants’ allocations to the threshold country, which is randomly assigned to beeither just above or just below the threshold (depicted in colors). Where the colors of the distributionseparate, this is evidence of a classification effect. As shown above, this separation is noticeable only forthose participants in the classifications treatment condition (where participants see the threshold separatingjust above and just below countries) and most strongly for those also assigned to the judges treatmentcondition.
102102102
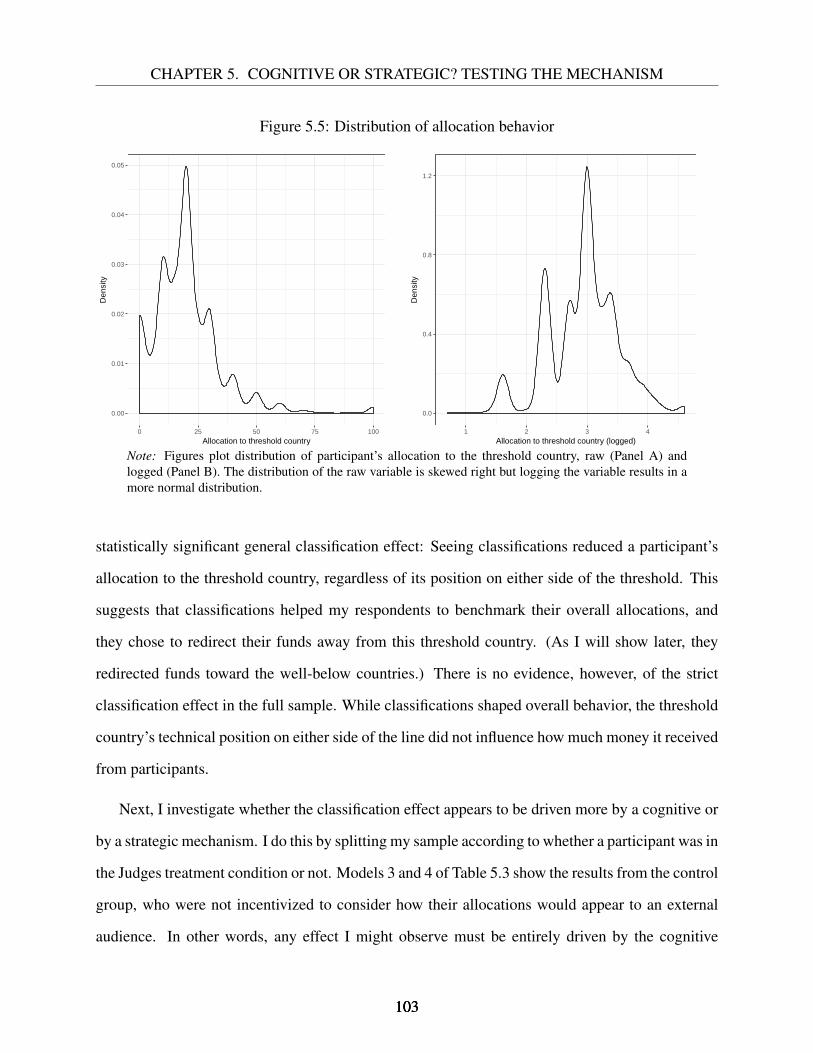
CHAPTER 5. COGNITIVE OR STRATEGIC? TESTING THE MECHANISM
Figure 5.5: Distribution of allocation behavior
0.00
0.01
0.02
0.03
0.04
0.05
0 25 50 75 100
Allocation to threshold country
Den
sity
0.0
0.4
0.8
1.2
1 2 3 4
Allocation to threshold country (logged)
Den
sity
Note: Figures plot distribution of participant’s allocation to the threshold country, raw (Panel A) andlogged (Panel B). The distribution of the raw variable is skewed right but logging the variable results in amore normal distribution.
statistically significant general classification effect: Seeing classifications reduced a participant’s
allocation to the threshold country, regardless of its position on either side of the threshold. This
suggests that classifications helped my respondents to benchmark their overall allocations, and
they chose to redirect their funds away from this threshold country. (As I will show later, they
redirected funds toward the well-below countries.) There is no evidence, however, of the strict
classification effect in the full sample. While classifications shaped overall behavior, the threshold
country’s technical position on either side of the line did not influence how much money it received
from participants.
Next, I investigate whether the classification effect appears to be driven more by a cognitive or
by a strategic mechanism. I do this by splitting my sample according to whether a participant was in
the Judges treatment condition or not. Models 3 and 4 of Table 5.3 show the results from the control
group, who were not incentivized to consider how their allocations would appear to an external
audience. In other words, any effect I might observe must be entirely driven by the cognitive
103103103
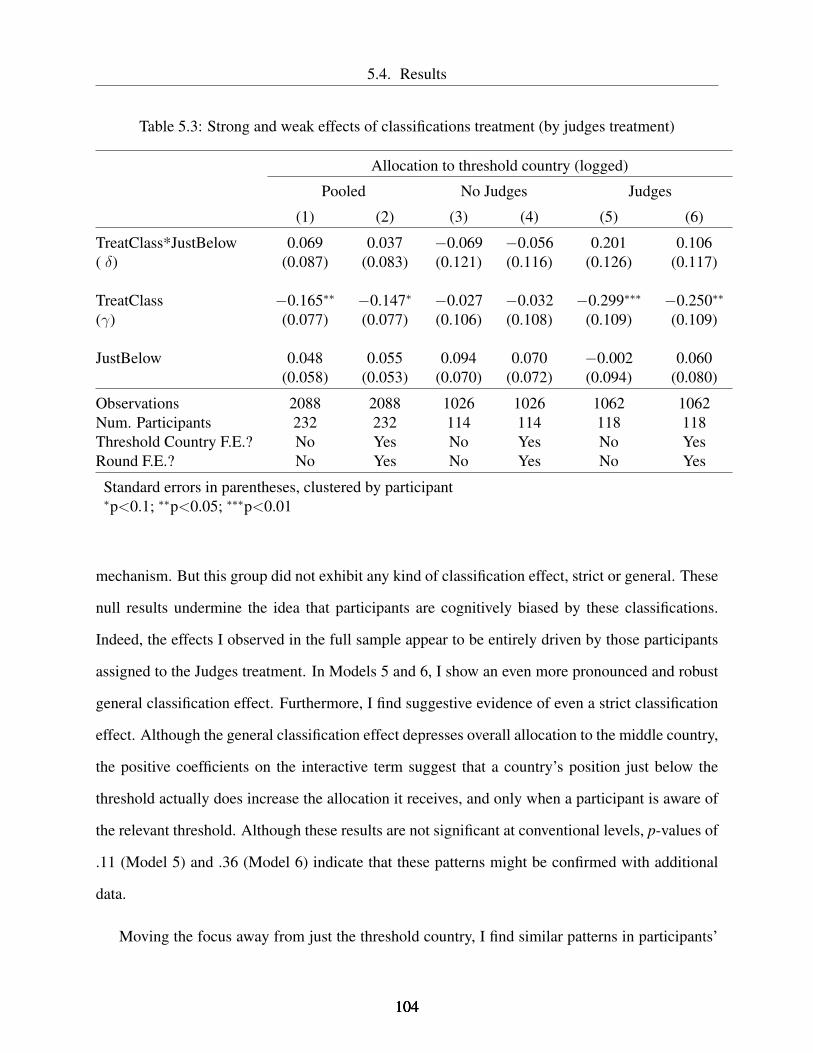
5.4. Results
Table 5.3: Strong and weak effects of classifications treatment (by judges treatment)
Allocation to threshold country (logged)
Pooled No Judges Judges
(1) (2) (3) (4) (5) (6)
TreatClass*JustBelow 0.069 0.037 −0.069 −0.056 0.201 0.106( δ) (0.087) (0.083) (0.121) (0.116) (0.126) (0.117)
TreatClass −0.165∗∗ −0.147∗ −0.027 −0.032 −0.299∗∗∗ −0.250∗∗
(γ) (0.077) (0.077) (0.106) (0.108) (0.109) (0.109)
JustBelow 0.048 0.055 0.094 0.070 −0.002 0.060(0.058) (0.053) (0.070) (0.072) (0.094) (0.080)
Observations 2088 2088 1026 1026 1062 1062Num. Participants 232 232 114 114 118 118Threshold Country F.E.? No Yes No Yes No YesRound F.E.? No Yes No Yes No Yes
Standard errors in parentheses, clustered by participant∗p<0.1; ∗∗p<0.05; ∗∗∗p<0.01
mechanism. But this group did not exhibit any kind of classification effect, strict or general. These
null results undermine the idea that participants are cognitively biased by these classifications.
Indeed, the effects I observed in the full sample appear to be entirely driven by those participants
assigned to the Judges treatment. In Models 5 and 6, I show an even more pronounced and robust
general classification effect. Furthermore, I find suggestive evidence of even a strict classification
effect. Although the general classification effect depresses overall allocation to the middle country,
the positive coefficients on the interactive term suggest that a country’s position just below the
threshold actually does increase the allocation it receives, and only when a participant is aware of
the relevant threshold. Although these results are not significant at conventional levels, p-values of
.11 (Model 5) and .36 (Model 6) indicate that these patterns might be confirmed with additional
data.
Moving the focus away from just the threshold country, I find similar patterns in participants’
104104104

CHAPTER 5. COGNITIVE OR STRATEGIC? TESTING THE MECHANISM
overall allocation behavior.7 Figure 5.6 plots the overall allocation behavior of participants. Panel
A again suggests that there exists a classification effect. The Loess curve indicating the allocation
behavior of participants in the classifications treatment is skewed right to the curve of those partic-
ipants in the control group. This indicates that the classifications treatment caused respondents to
prefer allocating to countries at the lower end of the income spectrum. In Panel B, again, I separate
this behavior based on a participant’s assignment to the judges treatment. Again, the effects are
more pronounced for individuals who received this treatment. In other words, informing partic-
ipants that they would be evaluated by a judge exaggerated the effects of classifications on their
giving behavior.
Figure 5.6: Effects on overall allocation
(a) Pooled
15
20
25
30
1 2 3 4 5
Country Position
Allo
catio
n
treat_class Control Treatment
(b) By judges treatment
treat_judge: Control
treat_judge: Treatment
1 2 3 4 5
10
15
20
25
30
10
15
20
25
30
Country Position
Allo
catio
n
treat_class Control Treatment
Note: Figures plot Loess curves indicating the distribution of participant’s (raw) allocation to all countries.The blue curves reflect the allocations made by participants in the classifications treatment, while the redcurves reflect the allocations made by those participants who did not see classifications. Panel A reports theallocation behavior of the full (pooled) sample, while Panel B separates the sample by the judges treatmentstatus.
I model the patterns observed in Figure 5.6 by regressing the skewness of each participant-
round’s allocation profile on her assignment to the classifications and the judges treatments. Skew-7The following analyses were not pre-specified.
105105105
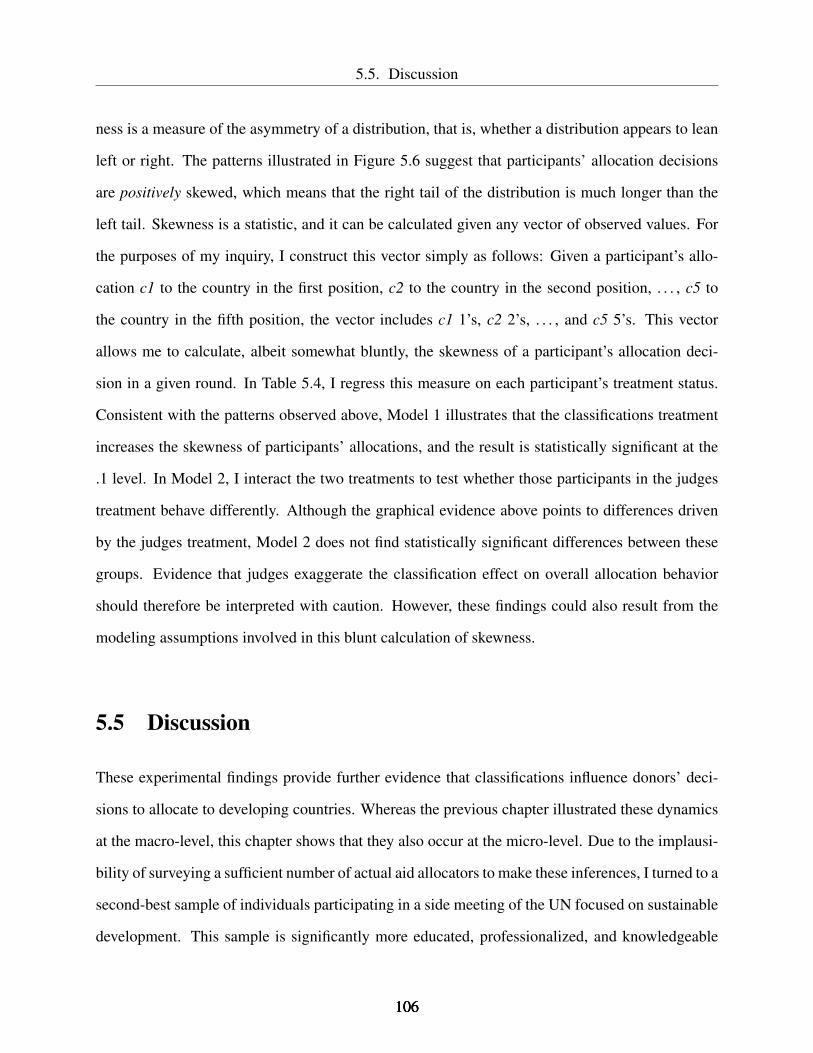
5.5. Discussion
ness is a measure of the asymmetry of a distribution, that is, whether a distribution appears to lean
left or right. The patterns illustrated in Figure 5.6 suggest that participants’ allocation decisions
are positively skewed, which means that the right tail of the distribution is much longer than the
left tail. Skewness is a statistic, and it can be calculated given any vector of observed values. For
the purposes of my inquiry, I construct this vector simply as follows: Given a participant’s allo-
cation c1 to the country in the first position, c2 to the country in the second position, . . . , c5 to
the country in the fifth position, the vector includes c1 1’s, c2 2’s, . . . , and c5 5’s. This vector
allows me to calculate, albeit somewhat bluntly, the skewness of a participant’s allocation deci-
sion in a given round. In Table 5.4, I regress this measure on each participant’s treatment status.
Consistent with the patterns observed above, Model 1 illustrates that the classifications treatment
increases the skewness of participants’ allocations, and the result is statistically significant at the
.1 level. In Model 2, I interact the two treatments to test whether those participants in the judges
treatment behave differently. Although the graphical evidence above points to differences driven
by the judges treatment, Model 2 does not find statistically significant differences between these
groups. Evidence that judges exaggerate the classification effect on overall allocation behavior
should therefore be interpreted with caution. However, these findings could also result from the
modeling assumptions involved in this blunt calculation of skewness.
5.5 Discussion
These experimental findings provide further evidence that classifications influence donors’ deci-
sions to allocate to developing countries. Whereas the previous chapter illustrated these dynamics
at the macro-level, this chapter shows that they also occur at the micro-level. Due to the implausi-
bility of surveying a sufficient number of actual aid allocators to make these inferences, I turned to a
second-best sample of individuals participating in a side meeting of the UN focused on sustainable
development. This sample is significantly more educated, professionalized, and knowledgeable
106106106

CHAPTER 5. COGNITIVE OR STRATEGIC? TESTING THE MECHANISM
Table 5.4: Effects of classifications on overall allocation behavior
Skewness
TreatClass 0.106∗∗ 0.077(0.046) (0.066)
TreatClass*TreatJudge 0.058(0.092)
TreatJudge −0.048(0.068)
Observations 2088 2088Num. Participants 232 232Threshold Country F.E.? Yes YesRound F.E.? Yes Yes
Standard errors in parentheses, clustered by participant∗p<0.1; ∗∗p<0.05; ∗∗∗p<0.01
about development issues than a mass sample, and one day they could well be actually involved in
these real-world decisions. It is therefore a noteworthy finding that classifications guide even their
decisions.
The experimental approach is able to shed greater light on the mechanisms underpinning the
classification effect. I show that the classification effect only appears when participants are in-
formed they will be judged by a non-expert. In contrast, participants with no strategic incentives to
deviate from what they consider to be an optimal allocation do not appear to respond to classifica-
tions. This suggests very little, if any, cognitive bias for this highly-informed, elite sample. This is
instructive considering the observational findings that classifications drive aid allocation behavior
in the real world. If decision-makers in aid agencies behave like those in my sample, then this
project suggests that they use classifications strategically rather than cognitively.
These patterns also appear in some of the reflections submitted by participants. When asked
whether they felt a non-expert would agree with their decisions, some participants who saw clas-
sifications replied positively, noting the labels and “color coding of the charts.” Responses empha-
107107107
5.5. Discussion
sized the importance of simplicity in their decisions. As one participant noted, “everyone knows
main or principal characteristics and generalities that help to allocate resources and know if a coun-
try is poor, rich or middle income.” Conversely, others felt that non-experts would disagree with
their decisions because their decisions reflected a level of complexity beyond the average person.
One participant (who did not receive the Judges treatment) argued, “This was a difficult exercise
because by leaving out the full context, it gives the impression that you find the issues in one
country more problematic than another - in reality, an aid agency can still try to address issues of
inequality/policy/governance, etc. in a middle income country without giving much aid.” Several
participants in the Classifications / No Judges condition voiced similar sentiments, having deliber-
ated carefully about their aid allocation decisions. Even some participants who were strategically
incentivized to consider the preferences of the judge expressed concern that a non-expert would
disagree with their decisions, for example, “because some did involve giving money to countries
considered upper middle.” But even if this participant appeared willing to ignore these preferences
in order to allocate aid as s/he saw fit, the statistical results suggest that the preferences of the
non-expert were quite important for the decisions made by most participants.
While the experiment does provide evidence of a classification effect, it is worth noting that
these effects may be less extreme than I anticipated. Specifically, I distinguished between a “strict”
classification effect — how much aid a specific country receives if and only if it receives a specific
label — and a “general” classification effect — how aid is allocated across a variety of countries
in the presence of classifications. I found robust evidence of a general classification effect. While
there is some evidence of a strict classification effect too, these results are not statistically sig-
nificant at conventional levels. It is possible that additional data collection may strengthen these
findings, given how slight these effects are likely to be and the relatively small sample size of this
experiment. For now, however, I apply caution to avoid overstating the effects of classifications.
While classifications certainly change general allocation behavior, it is not yet confirmed that they
drive sharp discontinuities at thresholds separating the different categories.
108108108

CHAPTER 5. COGNITIVE OR STRATEGIC? TESTING THE MECHANISM
Taken together, the evidence in Chapters 4 and 5 substantiates widespread concern that devel-
oping country classifications distort the allocation of foreign aid. I provided both observational
macro-level evidence and experimental micro-level evidence that countries receive less foreign aid
as they graduate from low and lower-middle income country status. I also argued that, in the case
of foreign aid, these results occur due to a strategic mechanism: Donors consider how their allo-
cation decisions look to an external audience, and they skew their allocations in favor of countries
that are widely perceived to be developing. In the next chapter, I look at these issues from the
perspective of countries that are themselves classified. How do they experience these losses in for-
eign aid? Conversely, do they experience any benefits? Finally, who wins and loses within these
countries, and do these affected parties try to influence their own classifications?
109109109

Chapter 6
How Winners and Losers Respond to
Classifications
This project is fundamentally about whether and why international observers rely on classifications
in their decisions. The preceding chapters address these questions by offering evidence of the direct
effects of classifications on the behaviors of these international observers (hypotheses 1-3). But if
classifications are so powerful, then I would also expect certain countries and groups to experience
these effects indirectly and, in turn, to try to influence their classifications to the extent they are able
(hypotheses 4-6). In this chapter, I further support my argument by investigating the experiences
and strategic responses of the affected parties.
Specifically, I explore how non-governmental organizations (NGOs), firms, and governments
experience their country’s classification. In prior chapters, I have treated classified countries as
unitary actors that receive aid, investment, and ratings. This chapter challenges this assumption by
focusing on various groups within a country that win and lose based on its classification. To this
end, I carried out dozens of interviews during separate fieldwork trips to Nepal and Botswana, two
cases that allow me to observe how these various groups experience a country’s graduation out of
a developing country category. I find that NGOs suffer due to losses in aid while firms anticipate
110

CHAPTER 6. HOW WINNERS AND LOSERS RESPOND TO CLASSIFICATIONS
benefits from this improvement in their country’s status. Both the predictions and the findings about
the material preferences of governments are ambiguous, since classifications produce diverse and
sometimes countervailing effects. However, many leaders in governments also noted the effects of
classifications on their social status. While this relationship was not predicted by my theoretical
framework, I explore its significance for the political economy of classifications. Taken together,
these findings illustrate that classifications and status are distributive goods that create winners and
losers at the sub-national level.
Next, I provide evidence that classified countries and groups attempt to influence their clas-
sifications. I outline three methods by which affected parties do this — reforming the system,
lobbying for specific classifications, and gaming the system — and offer examples of each behav-
ior. In particular, I draw on a novel source of data on revisions to statistics to show that countries
actually try to change their numbers in an attempt to engineer their classifications. While some
countries appear to seek higher classifications, others appear to seek lower classifications.
Indeed, while my theoretical framework offers clear predictions about the effects on NGOs and
firms, the prediction about the experiences and preferences of governments is ambiguous. Whether
a country seeks a higher or a lower classification should depend on how much that country values
aid relative to improved investment or borrowing opportunities. However, testing this theory would
involve imposing assumptions about how the diverse interests of government officials and various
domestic groups are aggregated into a unitary foreign policy. Since this preference aggregation
process is not obvious, I leave it to future research to explain which objectives states pursue, using
this space primarily to explain how they can manipulate classifications and that they do.
6.1 The Distributive Effects of Classifications
This section makes the case that classifications are a distributive good, benefiting some and pun-
ishing others. Previous work tends to make two assumptions: (1) classified countries are unitary
111111111
6.1. The Distributive Effects of Classifications
actors and (2) improvements in a country’s rank or indicator are uniformly good.1 But in a glob-
alized world, many sub-national groups interact directly with elites in foreign countries through
business or development-oriented relationships. How those foreign elites perceive a country’s level
of development can therefore not only affect how they interact with its government but also with
these sub-national groups. Moreover, since classifications cause a diverse web of effects, it is not
obvious that improvements in a country’s rank are always beneficial. Especially when considering
the perspective of various groups within a classified country, some may well lose considerably.
Focusing on the case at hand, I draw on evidence from dozens of qualitative interviews to show
that higher classifications punish NGOs but potentially benefit firms. (These findings support
hypotheses 4 and 5 respectively.) My findings also suggest the importance of social status for the
government leaders who are responsible for obtaining these classifications, illustrating that these
distributive consequences are not only material.
6.1.1 Research Design — Interviews in Nepal and Botswana
There is relatively little existing evidence of how domestic constituencies experience their coun-
try’s international reputation. Although my theoretical framework produces general empirical ex-
pectations for these relationships, I began this section of the project with few expectations about
the specific ways in which international reputation would affect the day-to-day experiences of these
groups. I therefore adopted a qualitative approach to gathering evidence on these topics by inter-
viewing relevant individuals about these issues. This required narrowing the scope of my inquiry
to a small number of country cases, where I could spend several weeks conducting fieldwork in
each.2
I wanted my conversations with respondents to be concrete. Asking individuals broad ques-
tions about their country’s reputation or status would likely confuse them or result in vague state-
1See, for example, Kelley (2017).2In particular, I thank Nishchal Pandey, Chedza Mogae, and Joel and Julia Newman for facilitating my fieldwork.
112112112

CHAPTER 6. HOW WINNERS AND LOSERS RESPOND TO CLASSIFICATIONS
ments. But I wanted to learn about specific ways that they had experienced classifications. To this
end, I chose to anchor my interviews by focusing on countries’ graduations from the United Na-
tions (UN)’s Least Developed Countries (LDCs) category. Unlike the World Bank’s income clas-
sification system, this category is not automatically determined: Countries become “pre-eligible”
to graduate on the basis of certain indicators, but the decision to graduate the country results from
several years of consultations between the UN and the eligible country. Several features of this
process make the UN LDC graduation process a rich focus for my qualitative interviews. First,
these deliberations provide many actors with an opportunity to form preferences and voice them.
This generates rich evidence of how these different actors experience and consider classifications.
Second, this process means that LDC graduation is a salient policy issue for many countries. While
countries cannot change the income classifications they receive from the World Bank, they do have
some say in their LDC graduation. I found that most individuals in the policy community in my
case study countries were therefore quite familiar with the most minute details of this graduation
process. Third, focusing on a graduation process allowed me to observe over-time variation in a
country’s classification, or at least what individuals expected to change as a result of graduation.
Asking individuals to consider the two counterfactuals for their country provided richer insight
than would asking individuals just to consider how their country had fared.
Focusing on graduations from the LDC category substantially narrowed the universe of cases.
This is because, to date, there are few LDC graduates or graduating countries, and most of them
are small island states where dynamics are likely not generalizable to other countries (see Table
6.1). Conversations about LDC graduation are most salient in a country currently undergoing the
process, so I chose to select one country where graduation is currently on the table. Of the five
countries that met the criteria in 2015, Nepal had the largest economy and would likely be most
generalizable to future cases. However, because interviewees in Nepal would be able to offer only
their predictions for the effects of graduation, I also included a country that previously graduated.
Of the available options, Botswana was the largest economy and offered the best opportunity to
113113113

6.1. The Distributive Effects of Classifications
study the long-term effects of graduation.
Table 6.1: Past and future LDC graduates
Graduates (year of graduation) First met criteria in 2015 (criteria met)Botswana (1994) Bhutan (Income, HAI)
Cabo Verde (2004) Nepal (HAI, EVI)Maldives (2011) Sao Tome and Principe (Income, HAI)Samoa (2014) Solomon Islands (Income, HAI)
Equatorial Guinea (2017) Timor-Leste (Income only)Vanuatu (2020)Angola (2021)
As briefly described in Chapter 3, countries graduate from the UN’s LDC category in a several
years-long process. Countries are routinely assessed by the UN on the basis of three indicators:
gross national income (GNI) per capita, the Human Assets Index, and the Economic Vulnerability
Index. The UN maintains a graduation threshold on each of these numerical indicators, and a
country becomes “pre-eligible” to graduate when it meets this graduation threshold in two of three
indicators. Alternatively, countries can become “pre-eligible” on the basis of only GNI per capita
if they exceed twice the graduation threshold. These conditions must be met in two consecutive
triennial reviews before a country can make preparations to graduate three years later, pending the
recommendation of various committees at the UN.
Nepal is a current graduation candidate. It became pre-eligible in 2015, when it passed the
Human Assets Index and Economic Vulnerability Index thresholds, but it has still not met the
income criterion (see Figure 6.1, Panel A). But regardless of its income, if these indicators are
consistent in its 2018 review, it will have the opportunity to pursue graduation three years later, in
2021. This final graduation decision will be made on the basis of the longstanding conversation
between Nepal and the UN. By most measures, Nepal has demonstrated notable improvement in
development outcomes in recent decades, although these successes experienced a setback in the
form of the 2015 earthquake. The country became a democracy at the end of the Cold War but
has yet to experience political stability: Since the 2006 conclusion of its civil war, governments
114114114
CHAPTER 6. HOW WINNERS AND LOSERS RESPOND TO CLASSIFICATIONS
continue to form and dissipate extremely quickly. Neighboring India and China, Nepal is deeply
exposed to power politics and the global economy. It exports textiles and tourism and relies on
remittances from Nepali migrants in the Middle East as a primary source of income. Characterizing
development in Nepal is therefore a challenging task.
Botswana, which graduated from the LDC category in 1994, enjoys a widespread international
reputation as a “success story.”3 Botswana is often praised for its prudent management of dia-
monds, which were discovered in the 1980s and were wisely re-invested in education and health
facilities. Unlike its neighbors, the country has enjoyed uninterrupted civil peace since indepen-
dence, and it even avoided the apartheid regime that characterized South Africa.4 Botswana’s grad-
uation from the LDC category is cited as a prominent indicator of these positive trends. Having
graduated decades ago, it surpasses the income criterion by orders of magnitude and faces abso-
lutely no risk of reverse graduating. Nonetheless, it is worth noting that Botswana’s Economic
Vulnerability Index actually fails to meet the graduation threshold. Again, it should be stressed
that there is no risk of reverse graduation for Botswana, especially since the LDC inclusion pro-
cess imposes even stricter criteria than the LDC graduation process, but this illustrates that even
the performance of graduates on these criteria can be mixed. Other indicators, which are irrelevant
for the LDC categorization, also raise alarms about Botswana’s performance. The country has
one of the world’s highest GINI coefficients (a measure of inequality) and HIV/AIDS infection
rates. This divergence between Botswana’s label and its reality made it an appealing environment
in which to study the domestic consequences of classifications.
The goal of these interviews was to understand how classified countries experience the gradua-
tion process and how these classifications affect the experiences of domestic groups. To this end, I
constructed an interview sample in each country consisting of government officials, leaders in civil
society and in business communities, and policy experts. With government officials, I aimed to3The subtitle of one article from The Economist reads: “Why is an arid, landlocked country in southern Africa such
a success?” “Africa’s prize democracy,” The Economist, November 4, 2004.4Sir Seretse Khama, the founder of modern Botswana and its first president, controversially married Ruth Williams,
a white woman, creating an international incident that led to his temporary exile from the British protectorate.
115115115
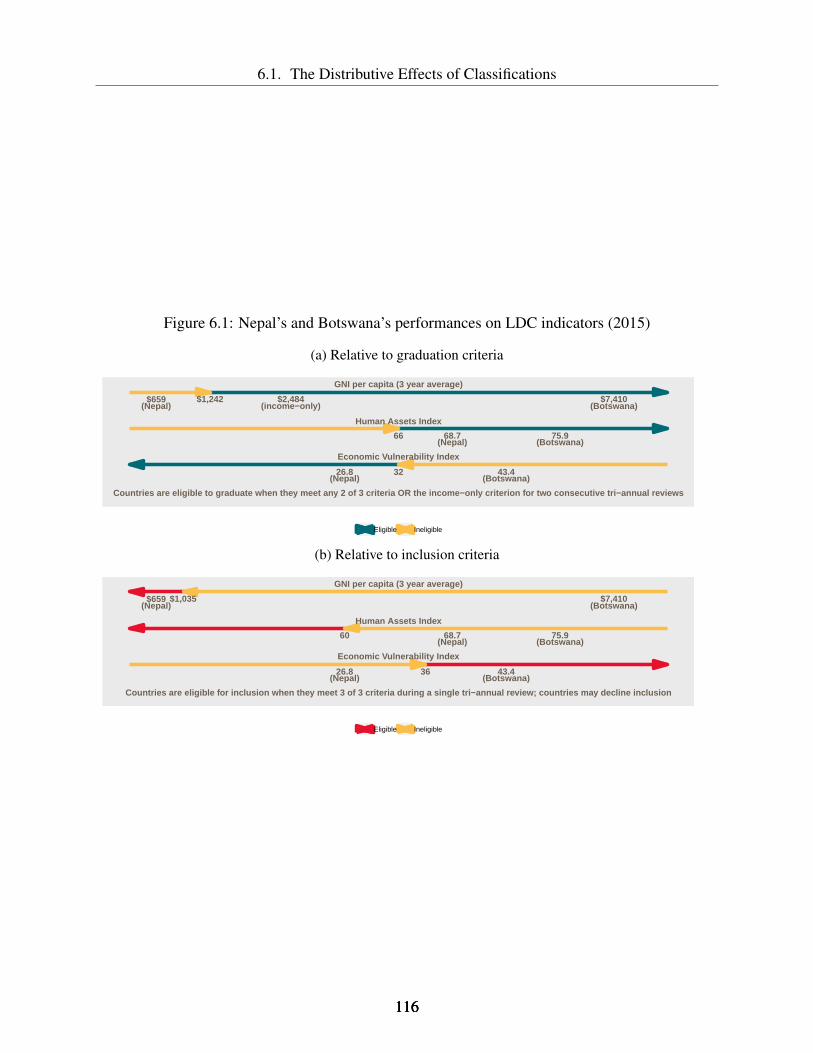
6.1. The Distributive Effects of Classifications
Figure 6.1: Nepal’s and Botswana’s performances on LDC indicators (2015)
(a) Relative to graduation criteria
GNI per capita (3 year average)
$1,242 $2,484(income−only)
Human Assets Index
66
Economic Vulnerability Index
32
Countries are eligible to graduate when they meet any 2 of 3 criteria OR the income−only criterion for two consecutive tri−annual reviews
$659(Nepal)
68.7(Nepal)
26.8(Nepal)
$7,410(Botswana)
75.9(Botswana)
43.4(Botswana)
Eligible Ineligible
(b) Relative to inclusion criteria
GNI per capita (3 year average)
$1,035
Human Assets Index
60
Economic Vulnerability Index
36
Countries are eligible for inclusion when they meet 3 of 3 criteria during a single tri−annual review; countries may decline inclusion
$659(Nepal)
68.7(Nepal)
26.8(Nepal)
$7,410(Botswana)
75.9(Botswana)
43.4(Botswana)
Eligible Ineligible
116116116

CHAPTER 6. HOW WINNERS AND LOSERS RESPOND TO CLASSIFICATIONS
understand the graduation process from their perspective: In what capacities were they consulted
about graduation, or did they seek it out? Did they believe a decision to graduate was warranted?
Was the government eager to graduate, or did it prefer to avoid graduation? I interviewed lead-
ers in civil society to understand how they believed it would affect the day-to-day operations of
NGOs and the welfare of the marginalized populations they represent. Although I interviewed
some small, local NGOs, I focused my sample on larger networks of NGOs, which were more
familiar with graduation policy and how it would affect a variety of organizations. I also recruited
leaders in the business community to my study. For example, I spoke with members of Chambers
of Commerce or business consulting firms who were involved in internationally oriented business
ventures. These individuals helped me to understand how the country’s reputation factored into
the global dealings of its firms. Finally, I interviewed policy experts, often in think tanks or uni-
versities, who were able to speak to these interactions as a whole. A description of the interview
protocol and questionnaire appears in Appendix D.
The breakdown of interviews in the two countries appears in Table 6.2. Important differences
between the two cases lead to a somewhat different balance of interviewees in each country. For
example, there are simply many more government officials and experts involved in the contempo-
rary case of Nepal than in the historical case of Botswana, although I did manage to speak with
retired officials who recalled the process.
Table 6.2: Interview samples in Nepal and Botswana
Nepal Botswana(Jun-Jul 2017) (Jul-Aug 2017)
Government officials 6 3Experts 4 1
Civil society 6 5Business community 3 1
Total 20 10
I chose not to interview members of the mass public. Although graduation does make na-
tional headlines, the mass public are generally uninformed about these dynamics, even if they are
117117117
6.1. The Distributive Effects of Classifications
affected by them. While my theoretical framework includes a space for those affected by classifi-
cations to exert political pressure, there is variation in how informed affected parties are about the
relationship between classifications and their experiences. As I was familiarizing myself with the
cases of Botswana and Nepal, it became clear to me that only elite actors are sufficiently aware of
these dynamics to act on them. This does not negate the importance of understanding the effects of
classifications on the mass public — these effects are quite real — but their interests will be repre-
sented only indirectly by elite actors in civil society who seek to improve the welfare of citizens.
(These dynamics are analogous to those surrounding trade policy: Firms with specific interests can
organize to erect trade barriers, even though they result in higher prices for consumers, because
these penalties are diffusely spread among a less aware population.) As such, interviewing the
mass public in classified countries would not yield useful evidence, even if these individuals were
significantly affected by classifications.
6.1.2 Findings
In what follows, I describe how LDC graduation affected various groups within Botswana and
Nepal. If hypothesis 4 is correct, then I would expect to observe NGOs voicing negative views
of graduation and experts or officials acknowledging the negative consequences of graduation for
marginalized groups. If hypothesis 5 is correct, then I would expect to observe business inter-
ests voicing positive views of graduation and experts or officials noting the positive consequences
of graduation for investment. I find evidence consistent with both hypotheses. In addition, my
interviews point to the importance of social status to political leaders, a factor which should be
incorporated into future theory on this topic.
Representatives from NGOs expressed deep discomfort with Botswana’s status as an LDC
graduate. Despite having left the category over two decades ago in 1994 and being widely con-
sidered a poster child for development success, Botswana tops global rankings in inequality and
HIV prevalence. For this reason, several interviewees expressed skepticism regarding the value
118118118
CHAPTER 6. HOW WINNERS AND LOSERS RESPOND TO CLASSIFICATIONS
of the income classification system or the LDC category. As one civil society leader stated, “The
media account of Botswana is not what’s on the ground, and international NGOs are prejudiced by
the label. They look at Botswana and see a wealthy country, but they don’t see the needs of the
neediest.”5 Many agreed not only that the label is inaccurate but also that Botswana’s outstanding
international reputation has actually played a role in contributing to the the country’s political and
economic stagnation by concealing its problems and deterring foreign donors.
The concept of donor flight is well-known in Botswana. According to one economist with
decades of experience in the country, Botswana managed to delay the departure of donors for some
time after Botswana became a MIC by arguing that the government used resources effectively, but
the LDC graduation again highlighted Botswana’s success and made it more challenging to justify
continued assistance. Many countries closed their embassies, which had primarily existed for the
purposes of bilateral aid.6 Development agencies from Sweden, the United Kingdom, and Norway
all pulled out, and the United States Agency for International Development ceased supporting
the salaries of technical officers in the government.7 One civil society leader mentioned that his
organization was recently rejected for funding by the Gates Foundation, which stated that it was
trying to dedicate more funding for Africa. He commented, “Botswana isn’t Africa enough for the
Gates Foundation. You can’t talk to any international donor and say you’re from Botswana. It’s
perceived as too wealthy.”8
The dearth of international support for Botswana creates problems not because Botswana needs
external resources but because it has crippled the development of a robust civil society that can hold
the government to account. Most (although not all) acknowledge that Botswana is relatively more
5Author’s interview with Mr. Oscar Motsumi, Executive Secretary, Botswana Network of AIDS Service Organi-zations (BONASO), August 8, 2017, Gaborone, Botswana.
6Author’s interview with Dr. Keith Jefferis, Managing Director, Econsult Botswana, August 10, 2017, Gaborone,Botswana.
7Author’s interview with Ms. Alice Mogwe, Director, Ditshwanelo Botswana Centre for Human Rights, August10, 2017, Gaborone, Botswana. Author’s interview with Dr. Jay Salkin, Director of Research, Bank of Botswana,August 9, 2017, Gaborone, Botswana.
8Author’s interview with Mr. Oscar Motsumi, Executive Secretary, Botswana Network of AIDS Service Organi-zations (BONASO), August 8, 2017, Gaborone, Botswana.
119119119

6.1. The Distributive Effects of Classifications
successful than other developing countries and that there are sufficient resources in the country
to address its problems. But one civil society leader pointed out, “Developing buildings and in-
frastructure is not congruent with developing people. Organizations like the World Bank and the
African Development Bank say we have enough resources to develop our people, but that aspect of
development is not happening. This is why NGOs must complement the work of the government.
But how do NGOs generate funding? They ask for money from donors. Unfortunately, because
of Botswana’s classification, most bilateral agreements that we used to have no longer exist.”9 But
civil society organizations primarily rely on the government for funding, and as one leader pointed
out, “they don’t bite the hands that feeds them. You see NGOs leaning more and more toward
the government, which limits the advocacy agenda.”10 What limited international funding exists
for Botswana exists only for organizations focused on HIV/AIDS and LGBTI issues, what one
interviewee called “the international development community’s flavor of the month.”11 While this
dynamic exists in all aid recipient countries, it is exaggerated in a country like Botswana, where
a claim for international assistance must be based on a specific thematic objective as opposed to
general need. It is no surprise that most civil society organizations work on these issues or attempt
to anchor their own agenda on these issues. But as a result, marginalized groups falling outside
these bounds are neglected. For example, an initiative to serve people with disabilities under the
office of the President, while well-intentioned, is judged by observers to be significantly outdated,
yet there are no NGOs actively holding government to account on this issue.12
Similar themes emerged in Nepal, where many respondents associated its planned graduation
with aid losses that punish the poor. One director of a research institute with experience in the
National Planning Commission and Ministry of Foreign Affairs in Nepal argued that Nepal’s LDC9Author’s interview with Ms. Cindy Kelemi, Executive Director, Botswana Network on Ethics, Law, and
HIV/AIDS, August 15, 2017, Gaborone, Botswana.10Author’s interview with Mr. Oscar Motsumi, Executive Secretary, Botswana Network of AIDS Service Organi-
zations (BONASO), August 8, 2017, Gaborone, Botswana.11Author’s interview with Ms. Alice Mogwe, Director, Ditshwanelo Botswana Centre for Human Rights, August
10, 2017, Gaborone, Botswana.12Author’s interview with Ms. Cindy Kelemi, Executive Director, Botswana Network on Ethics, Law, and
HIV/AIDS, August 15, 2017, Gaborone, Botswana.
120120120

CHAPTER 6. HOW WINNERS AND LOSERS RESPOND TO CLASSIFICATIONS
status was vital to the assistance it was able to secure from European donors. In particular, he cited
the recent closing of the Danish embassy in Kathmandu as evidence of the perception that Nepal no
longer needed assistance: “They argued that their priority had shifted to poor African countries that
needed their support. If we cannot brand ourselves as a country in need of development, we will
lose these things.”13 Another think tank director pointed to the importance of the special treatment
and duty-free access Nepal receives in the World Trade Organization as result of its LDC status,
arguing that if Nepal graduates, “the international community should know that it doesn’t reflect a
real structural transformation, and they should continue to offer these benefits to us.”14 The leader
of a widely-respected Nepali NGO grounded his expectation of donor flight in reports he had
heard from his colleagues in Vietnam, who encountered aid losses after Vietnam graduated from
Low Income Country (LIC) status: “Why should aid agencies give money to them when there are
so many other countries that need aid?”15 As the UN Development Programme Country Director
in Nepal commented, “Nepal has so much more to gain by being the focus of development partners
rather than trying to signal to the rest of the world, ‘Oh we can go it alone.”’16 The expectation of
donor flight has led one development consultant who works with NGOs in Nepal to encourage his
clients to diversify their sources of funding away from traditional donors.17 Indeed, momentum for
Nepal’s LDC graduation has slowed, and the new cohort of government officials I spoke with are
ambivalent about the prudence of pursuing LDC graduation in 2022.
Conversely, respondents involved with the business community in Nepal anticipated significant
perks of graduation. One World Bank country economist for Nepal spoke of the “positive psycho-
logical effect” Nepal’s graduation from the LDC category would have on private investment, which
13Author’s interview with Dr. Nishchal Pandey, Executive Director, Center for South Asian Studies, June 22, 2017,Kathmandu, Nepal.
14Author’s interview with Dr. Posh Raj Pandey, Executive Director, South Asia Watch on Trade, Economics, andthe Environment, July 20, 2017, Kathmandu, Nepal.
15Author’s interview with Mr. Gyan Adhikari, Executive Director, Rural Reconstruction Nepal, July 11, 2017,Kathmandu, Nepal.
16Author’s interview with Mr. Renaud Meyer, UN Development Programme Country Director, July 12, 2017,Kathmandu, Nepal.
17Author’s interview with development consultant, June 23, 2017, Kathmandu, Nepal.
121121121
6.1. The Distributive Effects of Classifications
he viewed as beneficial to a country with insufficient public investment.18 An expert with former
government experience agreed, anticipating that graduation would improve investor confidence in
Nepal. He cited multiple instances, including the puzzling departure of a hydroelectric multina-
tional corporation and the unwillingness of European insurers to cover domestic airlines in Nepal,
in which he believed Nepal’s status as an LDC had undermined international confidence in its ca-
pability, since in both cases there was a rational economic basis for investment in Nepal.19 Both
respondents felt that while graduation would not change the underlying fundamentals of the Nepali
economy, it could psychologically reassure private foreign investors.20
Evidence from Botswana’s business community is mixed. Botswana’s outstanding reputation,
according to the theory, should attract significant amounts of FDI. But Botswana has tried to at-
tract FDI for decades without much success, except in the sectors of mining, banking, and retail.
Batswana officials attributed this failure to difficulties in obtaining work permits and outdated im-
migration policies that make it challenging for foreign firms to operate.21 This evidence suggests
that classifications are not enough to shift investor behaviors, although given its lack of economic
diversification, Botswana is perhaps a very hard test of this. Despite this, business consultants did
note the uncanny effect that LDC graduation had on Botswana’s performance on ratings, allow-
ing Botswana to “punch above its weight in international affairs.”22 Consistent with hypothesis 5,
business consultants were aware of the importance of Botswana’s reputation, but they also pointed
out its costs. One consultant noted, “It produces the assumption that we don’t need to change
18Author’s interview with World Bank economist, June 28, 2017, Kathmandu, Nepal.19Author’s interview with Dr. Nishchal Pandey, Executive Director, Center for South Asian Studies, June 22, 2017,
Kathmandu, Nepal.20Even respondents with precise technical knowledge of the criteria involved in LDC graduation cited irrelevant
accomplishments that graduation would signal, such as overcoming civil war, increasing mobile phone coverage, andbetter governance. This is further evidence to support a cognitive mechanism behind the findings described in Chapter4. One respondent generalized to say that Nepal’s graduation would signal that “we are a normal country,” the mostgeneral possible halo. Author’s interview with Dr. Nishchal Pandey, Executive Director, Center for South AsianStudies, June 22, 2017, Kathmandu, Nepal.
21Author’s interview with Dr. Jay Salkin, Director of Research, Bank of Botswana, August 9, 2017, Gaborone,Botswana.
22Information in this paragraph based on author’s interview with Dr. Keith Jefferis, Managing Director, EconsultBotswana, August 10, 2017, Gaborone, Botswana.
122122122

CHAPTER 6. HOW WINNERS AND LOSERS RESPOND TO CLASSIFICATIONS
anything. Change is already hard. It makes it more difficult when the rest of the world says you’re
wonderful.”23 Their concern was that Botswana’s classification is too sticky: It may have been
merited in the 1970s and 1980s as the result of prudent management of diamond reserves, but now
it permits the government to avoid necessary economic and policy reforms. Others applied a sim-
ilar logic when criticizing the government for regressing in transparency and civil liberties.24 To
be sure, continued failure to match Botswana’s reputation with reality will likely eventually attract
global attention, but reputations are sticky, and Botswana’s elevated status arguably permits early
backsliding to go unnoticed. As one respondent summarized, “Nobody wants to rock the boat and
point out that for the last 10 years, Botswana has been on a downward spiral.”25 In sum, although
business interests in Botswana did not necessarily embrace its international reputation as those in
Nepal did, their concerns themselves illustrate how powerful these reputations are.
My evidence shows that classifications and graduations are intensely politicized in both Botswana
and Nepal, but it is important to note that these politics take place at the highest levels of govern-
ment and policy. Information about the importance of classifications is not widespread. Even
though one of the main benefits of LDC categorization is special treatment in the World Trade
Organization, even the chairman of the Export Council of Nepal and the Export Committee of the
Nepal Chamber of Commerce was not familiar with the LDC category or its benefits.26 In con-
trast, a small but vocal group of elites push at the highest levels for Nepal’s graduation, even and
especially if aid losses occur. One director of an economic think tank argued, “Nepal has always
projected itself as a poor country as a means of rent-seeking. They know the right story to tell you,
one that feeds into the business of development. Nepalis must change their mindset from poverty
23A similar sentiment was expressed by Diamond Hub coordinator Mmetla Masire in a national newspaper: “Wemust stop gloating about international ratings which are saying we have the best run economy in Africa and face thereality because we are on the ground and know what is happening.” The Patriot, November 19, 2014.
24Botswana, coded a dictatorship by the DD approach, has been ruled by the Botswana Democratic Party sinceindependence, although its previous presidents have been globally recognized for their commitments to democracy.
25Author’s interview with Mr. Oscar Motsumi, Executive Secretary, Botswana Network of AIDS Service Organi-zations (BONASO), August 8, 2017, Gaborone, Botswana.
26Author’s interview, July 14, 2017, Kathmandu, Nepal.
123123123

6.1. The Distributive Effects of Classifications
brokers to prosperity catalysts.”27 As a result, one expert concluded that if the UN recommends
graduation, “our politicians will happily accept that decision and tell people it was their achieve-
ment. Civil society and the business community aren’t aware enough to mobilize so politicians get
to claim an accomplishment in the news.”28 In other words, graduation’s consequences are likely
to be born by an unaware constituency unless they are organized by specific political interests.
Therefore, despite these important sub-national consequences of graduation, a country’s deci-
sion to pursue or avoid graduation will most prominently reflect the views of its elites and leaders.
I was struck by how important a motivator social status was to these leaders. I spoke with the Vice
Chairman of Nepal’s National Planning Commission who was responsible for first committing
Nepal to pursuing graduation in the 13th National Plan (2013-2016). This plan was drafted shortly
after Nepal chaired an international meeting in Istanbul in which LDCs collectively aimed for a 50
percent graduation rate within the next decade. He summarized his experience at this meeting:
I had a chance to talk to many leaders of LDCs, and we would ask each other: How
long do you want to be called an LDC? Do you ever want to graduate or shall we just
continue being LDCs forever? Because LDCs, you know, they are thought to have lazy
people and want to depend on donors, and donors are just tired of providing for them.
If anyone is going to develop, it has to come from us. We had very strong feelings
that we wanted to send a message to the developed world that we could take care of
ourselves. Well, Nepal was signatory to this message at the International Conference
of LDCs. After this, I became Vice Chairman of the National Planning Commission.
And I prepared the 13th plan and included that objective to do whatever was necessary
to get out of LDC status by 2022. When I turned to the government to get that docu-
ment approved, I said: Let us tell the world that we are capable of graduating and will
27Author’s interview with Mr. Sujeev Shakya, Chairman, Nepal Economic Forum, July 18, 2017, Kathmandu,Nepal.
28Author’s interview with Dr. Posh Raj Pandey, Executive Director, South Asia Watch on Trade, Economics, andthe Environment, July 20, 2017, Kathmandu, Nepal.
124124124
CHAPTER 6. HOW WINNERS AND LOSERS RESPOND TO CLASSIFICATIONS
no longer be part of the LDC community.29
For whatever reason, government officials’ support for Nepal’s graduation has recently waned.
Even their language, though, reflects a desire to avoid looking needy. They carefully avoid voicing
concerns about aid in their rationales, instead critiquing graduation protocol on technical grounds.
A current member of the National Planing Commission responsible for the most recent national
plan argued that the indicators used did not accurately capture development in a landlocked country
like Nepal, concluding, “We see little point in endorsing this technical process when its criteria are
unhinged from reality.”30 Instead, government officials intimate that Nepal should delay its gradu-
ation until it can graduate on all three criteria, otherwise graduation would not be “meaningful.”31
At the same time, government officials are quick to dismiss the concerns of “NGO activists who
think the sky will fall when we graduate because of the loss of aid. NGOs of course survive on
portraying Nepal as a helpless country. But look at the earthquake rescue money from the govern-
ment relative to what we received from abroad — it’s miniscule.”32 The concept of a “meaningful
graduation” is one that exists nowhere else, but it pervades the current discussion of the issue and
saves face for a government wishing to avoid the penalties associated with aid. In sum, whether or
not Nepal ultimately chooses to graduate, these interviews with various members of the National
Planning Commission illustrate that social status may be an important component of its decisions.
On the topic of Nepal’s LDC graduation, one consultant commented, “When the country graduates,
politicians will get the credit. They are working for their own interests, not the people. Leaders
want to travel to foreign countries and receive the international credibility associated with being a
developing country, not an LDC.”33
As in most issues in international political economy, classifications have consequences and
29Author’s interview with Dr. Rabindra Kumar Shkaya, Former Vice Chairman of the National Planning Commis-sion, July 20, 2017, Kathmandu, Nepal.
30Author’s interview with member of National Planning Commission, July 9, 2017, Kathmandu, Nepal.31NPC Vice-Chairman Govinda Raj Pokharel in The Kathmandu Post, April 2015.32Author’s interview with member of National Planning Commission, July 9, 2017, Kathmandu, Nepal.33Author’s interview with international NGO consultant, July 23, 2017, Kathmandu, Nepal.
125125125

6.2. Responding to Classifications
causes at the domestic level of analysis. This qualitative evidence from Nepal and Botswana, with
some caveats, supports my claims that a country’s international reputation produces winners (busi-
ness interests) and losers (NGOs and those they represent) sub-nationally. However, these groups
may not always be informed or organized enough to act on their interests. This affords dispropor-
tional influence to powerful individuals and leaders, who may seek graduation for social reasons
as well as material ones. It is beyond the scope of this work to understand the complex process
of preference formation, information asymmetry, and collective action that determines a country’s
foreign policy toward classifications. Instead, I use this evidence simply to further substantiate that
classification effects exist and to argue that international reputation is a distributive good that can
be modeled in this manner. Recognizing this is an important step in the literature on status and
reputation in international political economy and in international relations more generally.
6.2 Responding to Classifications
Having illustrated that classifications produce winners and losers, I now show that winners and
losers strategically respond to their classifications. Although these affected parties often have
no control over the classifications they receive, there are a few methods by which they may try
to influence the labels they are awarded: reforming the system, lobbying for classifications, and
gaming the system. In what follows, I provide specific examples of how affected parties have
deployed each of these strategies to change their classifications. This evidence supports my em-
pirical expectations that, where able, classified groups and countries will attempt to influence their
classifications (hypotheses 4B, 5B, and 6).
6.2.1 Reforming the System
One method by which affected parties can respond strategically is to try to reform the classifi-
cation system itself. Their proposed reforms would systematically affect how all classifications
126126126
CHAPTER 6. HOW WINNERS AND LOSERS RESPOND TO CLASSIFICATIONS
are awarded, but are presumably pursued by specific groups or countries who believe that these
reforms will specifically benefit them.
The Raise the MIC movement described in the introduction is a noteworthy example of this
approach. This movement is organized by the AIDS Healthcare Foundation and claims to rep-
resent the interests of NGOs working to fight poverty around the world. Specifically, the group
argues that the Middle Income Country label is a primary obstacle for NGOs trying to obtain for-
eign aid from the Global Fund and discounted vaccine prices from pharmaceutical companies.
Although these concerns are most relevant for HIV/AIDS affected populations, the movement has
been endorsed by hundreds of health, education, clean water, and human rights NGOs in middle
income countries. These NGOs are often primarily funded by foreign donors and may even be at
odds with their governments, making it unlikely that their interests will be represented following
a country’s “graduation.”34 A global coalition of NGOs pushing for policy change at the World
Bank is evidence consistent with hypothesis 4B.
Even the particular choice of strategy adopted by the Raise the MIC movement itself points
to the power of classifications: The Raise the MIC movement primarily seeks change on the part
of the classifying organization and not the users of the classification. While the group also lob-
bies the Global Fund (a user) directly, most of its resources are spent lobbying the World Bank (a
producer) to publicly and unequivocally clarify that its classifications are not intended to influence
funding or pricing. According to the movement, this “would indicate to the Global Fund that they
need to change the system... [and] would give more ammunition to civil society to pressure drug
companies to lower their prices in middle income countries.”35 This logic suggests that the move-
ment recognizes the widespread legitimacy of the World Bank to define a classification and that
the pressure applied by civil society will only succeed when backed by the World Bank’s endorse-
ment. That the World Bank receives the brunt of the blame for other actors’ use of a classification34Author’s interview with Denys Nazarov, Associate Director of Global Policy, AIDS Healthcare Foundation, April
7, 2017, phone interview.35Author’s interview with Denys Nazarov, Associate Director of Global Policy, AIDS Healthcare Foundation, April
7, 2017, phone interview.
127127127
6.2. Responding to Classifications
suggests that the blame-avoiding strategies employed by classification users are successful.
6.2.2 Lobbying for Classifications
Alternatively, affected parties may lobby classifiers to award them a specific label, without chang-
ing the classification procedure. This strategy can therefore only be applied when a classifier is
able to incorporate subjective evaluations into decisions about a country’s classification.
Where these conditions hold, countries do try to make their cases to those responsible for
classifications. One example comes from the World Bank’s International Development Associa-
tion (IDA) grants and loans program. Although graduation from IDA is triggered when national
income crosses a threshold, the decision to graduate is not automatic. This creates opportunities
for countries to push for or, in this case, avoid their graduations. Countries routinely protest their
scheduled graduations to influential donors using back-door conversations. One deputy from a
donor country to IDA noted that, at a 2016 replenishment meeting, he was approached by repre-
sentatives from both Vietnam and Sri Lanka who wished to delay the graduations of their respective
countries from IDA.36 Conversely, some countries exploit this discretion to lobby for or accelerate
graduation processes. Bangladesh, for example, has negotiated with the UN so that it can graduate
from the LDC category ahead of schedule in time for its 50 year anniversary in 2021.37 Yet other
categories allow countries to opt out of categorizations, as in the case of the International Mone-
tary Fund (IMF)’s Highly Indebted Poor Countries (HIPCs). The Kyrgyz Republic, in addition to
others, has declined to take advantage of the HIPC program, despite its eligibility, because of “the
authorities’ and civil society’s assessment that being classified as a Highly Indebted Poor Country
36Author’s interview with IDA deputy, July 22, 2016, Washington, DC. In the case of IDA graduation, whateverimproved credit countries can privately access as a result of graduation is far outweighed by the losses in borrowingvolumes they experience within the World Bank. Currently the International Bank for Reconstruction and Develop-ment (IBRD) faces significant capital constraints due to the low interest rate environment and is unable to accommo-date the volumes of lending demanded by recent IDA graduates. Moreover, the “blend” status allows countries toaccess both IDA and IBRD, so prolonging their time at this status is nearly always advantageous.
37Author’s interview with UN official, May 9, 2017, New York, NY.
128128128

CHAPTER 6. HOW WINNERS AND LOSERS RESPOND TO CLASSIFICATIONS
was unfavorable.”38 These anecdotes support hypothesis 6 by illustrating that dissatisfied countries
lobby for specific classifications, whatever their preferences over those specific classifications may
be.
6.2.3 Gaming the System
When affected parties cannot achieve their goals through either reforming the system or working
within the system, some may try to game the system. This strategy is most pertinent when a
classification is mechanically determined by data, with no role for subjective evaluation or country
preference. This is true of the World Bank’s income classification system, in which countries can
only change categories when their national income statistics cross important thresholds. In this
section, I provide evidence that countries actually change their data in order to obtain preferred
classifications.
The idea that countries manipulate national economic statistics is not new. Recent evidence
finds that that national governments “juke the stats” to appear more successful.39 Using the gross
domestic product figures reported in the World Development Indicators, Magee and Doces (2015)
and Wallace (2016) provide evidence that gross domestic product growth rates reported by author-
itarian regimes are inflated when benchmarked against growth rates of measures that are harder to
manipulate — nighttime lights and electricity, respectively.40 These works argue that all regimes
have an incentive to report rosy economic data to improve the odds of re-election or reappointment
and reduce the possibility of collective action from below but that democracies have institutional
checks that make this impossible. Authoritarian regimes may not be the only ones interested in
manipulating figures; Sandefur and Glassman (2013) argue that pay-for-performance incentives
from international donors encourage aid recipients to inflate their vaccination rates. Conversely, it
38Author’s interview with country manager, August 2, 2016, phone interview.39See Wallace (2016).40Hollyer et al. (2011) provide the basis for these tests by showing that authoritarian regimes are less likely to
provide data; the subsequent works have then examined the bias of the provided data.
129129129

6.2. Responding to Classifications
is possible that international organizations are complicit in statistical manipulation: Dreher et al.
(2008) and Lang and Presbitero (2017) find evidence of bias in IMF growth and inflation statistics
and debt sustainability analyses, which favor countries that are aligned with prominent sharehold-
ers.
Some studies even show that statistical manipulation takes place at relevant thresholds. Pre-
vious works especially germane to my study have used the McCrary statistical density test to
demonstrate systematic underreporting of GNI per capita in an attempt to remain below the World
Bank’s operational threshold.41 These tests, however, are misleading for two reasons. First, they
cannot illustrate heterogeneous strategies. I have argued that the classifications are associated with
both costs and benefits, suggesting that certain countries may prefer to be under-classified, while
others may prefer to be over-classified. If countries try to move in different directions, these ef-
fects could cancel each other out and present the illusion of continuity, or small discontinuities
may underestimate the extent of manipulation occurring in both directions. Second, these tests
will underestimate strategic behavior if some attempts fail. For example, if a country close to a
threshold tries to jump just over it but fails, it can easily appear to be a country that looks like a
country that tried to slide just under the threshold. Since countries are operating in a tight range, it
is likely that failures are not uncommon.
To overcome these limitations, I test whether countries are more likely to revise their national
income figures as they approach an important threshold. Revision to national income data can
occur for many benign reasons, but if countries revise their income data to influence their classifi-
cations, then we would expect these revisions to be strategically timed as countries try to avoid or
accelerate crossing certain cutoffs. This approach avoids any assumptions about whether figures
are revised upwards or downwards, and it measures countries’ attempts rather than their successes.
In what follows, I describe the unique “time machine” data that supports this exercise and present
41Kerner et al. (2015) observe significantly more observations just below the operational threshold in the historicaldata from the World Bank Atlas, but not in the revised figures currently found in the World Development Indicators(WDI).
130130130
CHAPTER 6. HOW WINNERS AND LOSERS RESPOND TO CLASSIFICATIONS
the results.
As previously mentioned, the GNI figures that were used at the time of a country’s classification
sometimes differ from the current version of those historical estimates. These differences are not
inconsequential: In 288 country-years, a country received a different classification than the one it
would have received on the basis of our current estimate of its GNI in that year.42 Fortunately, the
World Bank makes all previous versions of the WDI available for download, allowing me to detect
at what point in time substantial revisions to GNI are made.
Figure 6.2 illustrates the unique variation reported in this “time machine” data set. As an
example, this graph plots Kenya’s income over time according to every version of World Bank
data that has ever been published, with each version in a different color. Wherever there is vertical
distance between colored lines, ex post estimates of Kenya’s national income have been revised in
a version of the WDI indicated by the color. In these examples, the estimates diverge dramatically
in the 2010s, when the country rebased and revised its estimates of previous years ex post. The fact
that different colors of lines straddle the cutoff separating LICs and LMICs indicates that Kenya
would have been classified differently had researchers known what we know now.
Intuitively, my objective is to calculate the magnitude of the revisions reported in each of the
versions of the WDI (the area between one colored line and the colored line from the previous
version of the WDI) and to relate that magnitude to the country’s distance from a threshold. To
operationalize this, I start by calculating, for each version of the WDI, how much a country’s
estimates of the previous three years of GNI differed from its estimates of those same years as
reported by the previous version of the WDI. Mathematically, I define a revision for each version
as the following:
ThreeY rRevisioni,j = (GNIi,j−GNIi−1,j)+(GNIi,j−1−GNIi−1,j−1)+(GNIi,j−2−GNIi−1,j−2)
(6.1)
42Descriptive statistics on these “misclassifications” are available in Table E.1 in Appendix E.
131131131
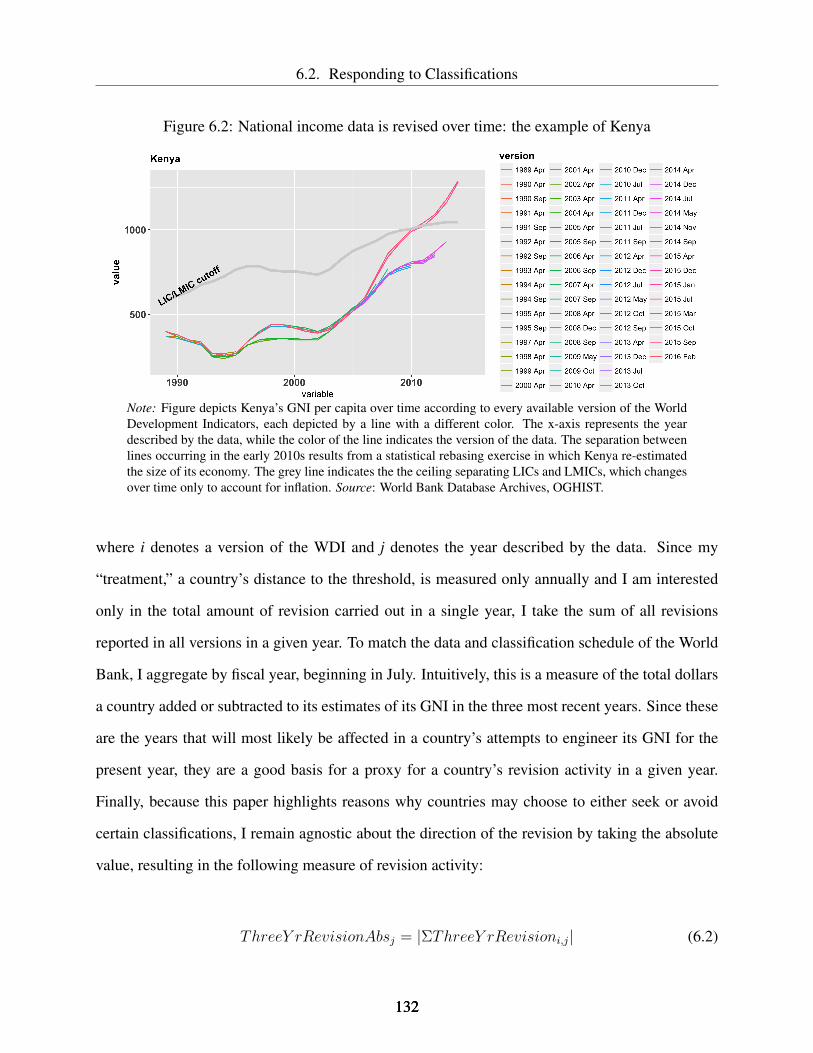
6.2. Responding to Classifications
Figure 6.2: National income data is revised over time: the example of Kenya
Note: Figure depicts Kenya’s GNI per capita over time according to every available version of the WorldDevelopment Indicators, each depicted by a line with a different color. The x-axis represents the yeardescribed by the data, while the color of the line indicates the version of the data. The separation betweenlines occurring in the early 2010s results from a statistical rebasing exercise in which Kenya re-estimatedthe size of its economy. The grey line indicates the the ceiling separating LICs and LMICs, which changesover time only to account for inflation. Source: World Bank Database Archives, OGHIST.
where i denotes a version of the WDI and j denotes the year described by the data. Since my
“treatment,” a country’s distance to the threshold, is measured only annually and I am interested
only in the total amount of revision carried out in a single year, I take the sum of all revisions
reported in all versions in a given year. To match the data and classification schedule of the World
Bank, I aggregate by fiscal year, beginning in July. Intuitively, this is a measure of the total dollars
a country added or subtracted to its estimates of its GNI in the three most recent years. Since these
are the years that will most likely be affected in a country’s attempts to engineer its GNI for the
present year, they are a good basis for a proxy for a country’s revision activity in a given year.
Finally, because this paper highlights reasons why countries may choose to either seek or avoid
certain classifications, I remain agnostic about the direction of the revision by taking the absolute
value, resulting in the following measure of revision activity:
ThreeY rRevisionAbsj = |ΣThreeY rRevisioni,j| (6.2)
132132132

CHAPTER 6. HOW WINNERS AND LOSERS RESPOND TO CLASSIFICATIONS
With this measure defined, I proceed to investigate whether a country’s revision activity in-
creases as it approaches an income classification cutoff. To do so, I make use of the analytic tools
developed for regression discontinuity designs, which allow me to test whether data just before
and just after a cutoff exhibit significantly different patterns. Regression discontinuities are typ-
ically employed in the service of causal identification. In these designs, an author makes use of
a situation in which some “treatment” or intervention occurs only after a certain threshold is met.
If this threshold is truly arbitrary, and if actors do not behave strategically, then in expectation,
units that have just met and have just failed to meet the threshold should be similar. Using this
design, a researcher will test whether outcomes for units just above and just below the threshold
are significantly different, and if they are, this may be causally attributed to the intervention. My
use of this design differs, since I am using it to illustrate that units’ behavior is strategic.
Specifically, I estimate the size of the jump in revision activity at the discontinuity of the thresh-
old through the use of local linear regression.43 This approach models linear relationships on either
side of the threshold and estimates the difference between them. Since regression discontinuities
model the difference only in the neighborhood of the cutpoint, distant observations are omitted.
Selection of the bandwidth within which observations are included, therefore, is an important
modeling decision. There is some debate in the literature whether bandwidths should be selected
through a data-driven process or through researcher discretion; I simply estimate the results at
several reasonable bandwidths to demonstrate the sensitivity of the results.44 In order to cluster
standard errors by country, I use block bootstrapping, since there are fewer than 50 clusters within
these bandwidths. Using the form
43For methodological reasons to use local linear regression instead of the use of higher-order polynomials, seeSkovron and Titiunik (2015).
44See Calonico et al. (2014).
133133133
6.2. Responding to Classifications
Yit = α+βAboveCutoffit+δDistanceToCutoffit+γAboveCutoff∗DistanceToCutoffit+εit
(6.3)
I estimate β, which is equivalent to the size of the jump at the discontinuity.
Revisions to GNI increase as countries approach the LIC ceiling and significantly fall as soon
as they have passed the cutoff. This trend is visually apparent in Figure 6.3. Panel A plots the
absolute value of revisions to GNI, positive and negative, while in Panel B, positive and negative
revisions to GNI are plotted separately. It is clear that some countries add to their GNI as they
near the cutoff, while others subtract from it, suggesting heterogeneous strategies in response to
the cutoff. Point estimates appear in Table 6.3, Panel A. The data-driven Imbens-Kalyanaraman
bandwidth is estimated to be 24. This proximity to the threshold is so close as to possibly obviate
the need for strategic behavior, so I prefer bandwidths of 50, 100, and 150, which are far enough
out for data manipulation to be helpful in making the difference one way or the other. The third
specification, using the bandwidth of 100, suggests that countries revise their GNI per capita by
about $70 more just before the cutpoint, and the effect is statistically significant at conventional
levels. While the other specifications are not statistically significant at conventional levels, with
p-values between .1 and .2, the overall results are similarly negative. This is cautious evidence
that countries are more likely to revise their GNI just before the LIC cutoff although the results
are sensitive to the selection of bandwidth. These findings are also robust to dropping the outlier
cases that are evident in Figure 6.3 (see Appendix E). In contrast, there is clearly no elevated GNI
revision just before reaching the ceiling of the LMIC category. Results from Table 6.3, Panel B
are slightly positive but extremely imprecise, suggesting that there is no systematic relationship
between data revisions and this cutoff.
This evidence supports hypothesis 6 by illustrating that some national governments attempt to
change their classifications by manipulating their data, but they do not all seek the same changes.
134134134

CHAPTER 6. HOW WINNERS AND LOSERS RESPOND TO CLASSIFICATIONS
Figure 6.3: Revisions to GNIpc increase as a country approaches the LIC ceiling
●
● ●
●
●
●
●
●●
●
●●
● ●
●
●
●
●
●● ● ●●
●
●
● ●
●
●
●
●
●●
●
●
●
●
●
●
●
●
●
●
●
●●●
●
●
●
●
●
●
● ●
●
●●
●
●
●
● ● ● ●
●
●
●
●
●
●
●
●
●
●
●
●
●
●
● ●
●
●
●
●
●
● ● ●●
● ● ●
●
●
●
● ●
●
●
●●●
●
●
●
●
● ● ● ●
●
●
●
●
●
● ● ●
●
●
●
●
●
●
●● ●
●
●
●
●
●
●●
●●
●
●
●
●
●
●
●
●
●
●
● ●
●● ●
●
●
●
●
●
●
●
●
●
●●
●
●
●
●
●
●
●
●
●
● ● ●
●
●
●
●
●
●
●
●
●
●
●
●
●
●
●
●
●
●
●
●
●
●
●
●●
●
●
● ●●
●
●
●
●
●
●
●
●
●
●
●
●
●
0
200
400
600
−100 −50 0 50 100
Distance from LIC ceiling
Sum
of 3
−ye
ar r
evis
ions
(ab
solu
te v
alue
)
●
● ●
●
●
●
●
●●
●
●●
● ●
●
●
●
●
●● ● ●●
●
●
● ●
●
●
●
●
●●
●
●
●
●
●
●
●
●
●
●
●
●●●
●
●
●
●
●
●
● ●
●
●●
●
●
●
● ● ● ●
●
●
●
●
●
●
●
●
●
●
●
●
●
●
● ●
●
●
●
●
●
● ● ●●
● ● ●
●
●
●
● ●
●
●
●●●
●
●
●
●
● ● ● ●
●
●
●
●
●
● ● ●
●
●
●
●
●
●
●● ●
●
●
●
●
●
●●
●●
●
●
●
●
●
●
●
●
●
●
● ●
●● ●
●
●
●
●
●
●
●
●
●
●●
●
●
●
●
●
●
●
●
●
● ● ●
●
●
●
●
●
●
●
●
●
●
●
●
●
●
●
●
●
●
●
●
●
●
●
●●
●
●
● ●●
●
●
●
●
●
●
●
●
●
●
●
●
●
0
200
400
600
−100 −50 0 50 100
Distance from LIC ceiling
Sum
of 3
−ye
ar r
evis
ions
(ab
solu
te v
alue
)
●
●
●
negative
positive
zero
Note: Figure plots the magnitude of revisions to recent national income estimates against the distancebetween a country’s most recent current estimate and the LIC ceiling. Revisions to national income dataincrease as a country approaches this ceiling. The figure plots the raw data, with each point representinga country-year observation. Loess smoothing lines fitted using bandwidths of 100. The extreme outlierjust below the LIC ceiling is Bhutan, which rebased its economy in 2005. See Appendix E for robustnesschecks removing outliers. Source: World Development Indicators Archives.
Table 6.3: Discontinuities in revisions to national income data
Absolute revisions to GNIpc in previous 3 years(1) (2) (3) (4)
A. LIC/LMIC Discontinuity
Above cutoff −205.01 −107.68 −69.89∗∗ −28.47(175.55) (75.46) (31.49) (23.39)
Bandwidth 24 50 100 150Observations 40 114 218 344
B. LMIC/UMIC Discontinuity
Above cutoff 16.06 71.52 −0.358 88.34(114.97) (119.64) (87.62) (67.60)
Bandwidth 39 50 100 150Observations 31 34 82 113
Standard errors in parentheses∗p<0.1; ∗∗p<0.05; ∗∗∗p<0.01
Note: Estimates come from a local linear regression of the outcome on the above-cutoff indicator, therunning variable (GNIpc distance to the cutoff), and the interaction. Model 1 uses the data-driven IKbandwidth. All standard errors are calculated using block bootstrapping, clustered by country.
135135135

6.3. Summary
While some appear to seek higher classifications, others prefer to avoid them for as long as possi-
ble.
6.3 Summary
This analysis, both qualitative and quantitative, illustrates that classifications create winners and
losers who, in turn, respond strategically. Interviews with members of civil society, the business
community, and government officials in Nepal and Botswana revealed that classifications create a
complex domestic political economy. As expected in hypothesis 4, higher classifications punish
NGOs and those they represent so much that NGOs have collectively tried to reform the classifica-
tion system of the World Bank. I also found some evidence to support hypothesis 5: Business in-
terests in Nepal pursued graduation in hopes that it would attract investment, although Botswana’s
experience suggests that this may not succeed.
It is beyond the scope of this book to account for how these domestic preferences aggregate
to the international level. Only highly elite actors are informed about the importance of classi-
fications, although the Raise the MIC movement serves as a reminder that these elite actors can
nonetheless organize smaller actors too. But given the elite nature of these politics, it is clear that
leaders have an outsize role in determining how a country will pursue or avoid certain classifica-
tions. To this end, a meaningful finding of my study is the importance of social status to these
leaders’ decision-making processes. Future work should incorporate these social motivations to
understanding how countries handle the labels they receive from classifying organizations.
Even if it is possible to aggregate domestic preferences into a unitary preference held by a
country, it is clear that countries hold diverse preferences over their classifications. Evidence of
data manipulation supported hypothesis 6 by illustrating that countries tried to manipulate their
data, but it also revealed that countries manipulated in both directions. While some countries prefer
higher classifications, others prefer lower classifications. Future work can draw on both material
136136136
CHAPTER 6. HOW WINNERS AND LOSERS RESPOND TO CLASSIFICATIONS
and social factors to explain this important heterogeneity in an important aspect of a country’s
foreign economic policy.
In sum, the studies presented in this chapter successfully test the observable implications of
my theoretical framework at the domestic level. The findings, however, also suggest important
questions about international status and lay the groundwork for building theories to answer those
questions.
137137137

Chapter 7
Conclusion
Far from simply describing the world, classifications structure it in tangible ways. When inter-
national organizations officially designate certain countries as “developing,” this changes the way
those countries are perceived and treated by influential elites around the world. The actions of these
international observers strongly affect the outcomes experienced by classified countries and groups
within those countries. These dynamics are not overlooked by affected parties, who sometimes try
to change their classifications to improve their situations. By illustrating this political economy
of classifications — existing between international organizations, international observers, and af-
fected parties — I show that classifications constitute a significant power of international organi-
zations, wielded through their bureaucracies.
As I argued in the introduction, this power of international organizations is not widely under-
stood. Although Barnett and Finnemore (1999) identified it in a preliminary way, existing theories
do not explain why global economic and political actors pay so much attention to these classi-
fications. Rather than providing private or expert information, these categories actually reduce
information about labeled countries. It is surprising that actors responsible for high-stakes deci-
sions do not develop their own criteria, tailored to their particular purposes. I answered this puzzle
with the theoretical framework proposed in Chapter 2, which sought to explain why international
138

CHAPTER 7. CONCLUSION
organizations are able to shape the behaviors of international observers. Specifically, I claimed
that categories operate through a cognitive and a strategic mechanism. International observers are
most likely to use classifications when they are susceptible to cognitive biases and when they must
justify sensitive decisions to an external audience. I applied this theoretical framework in order to
generate hypotheses about how development classifications would affect the behaviors of donors,
investors, and raters. I predicted that higher classifications would result in less aid but greater in-
vestment and improved ratings. All of these effects would be driven by the cognitive mechanism,
except for aid from donors, who are sensitive to the strategic mechanism as well. Given these
hypotheses, I developed additional observable implications for how affected parties would expe-
rience and respond to their classifications as well as which classifications would be most likely to
produce these dynamics.
While my empirical strategy limited my ability to systematically test why some classifica-
tions are more powerful than others, Chapter 3 spoke to this question by exploring the history and
landscape of development classifications. Paying special attention to the World Bank’s income
classification systems and the United Nations (UN)’s Least Developed Country (LDC) category,
I argued that these systems ascended in importance partly due to their simplicity and broad, in-
tuitive appeal. The stories of how these systems emerged and evolved also illustrate important
lessons about classifications. First, classifications are not always used as they are intended to be
used. Any organization creating or maintaining a classification must consider who will use the
classification system for cognitive or strategic reasons, and not just who should use it. Second,
classifications often have political origins and consequences. It is not clear whether the increas-
ingly technical debates over classifications reflect genuine academic disagreements or simply serve
to conceal political motivations. Regardless, it is evident that these technical models drive political
and economic realities.
The main evidence to support this last claim came in Chapter 4. Exploiting arbitrary thresholds
used by the World Bank’s income classification system, I showed that when a country moves up in
139139139
its development classification, it receives less aid and improved creditworthiness and democracy
ratings. These effects take place even when there is no real change in a country’s level of develop-
ment. I also supported my argument with qualitative evidence from interviews with stakeholders
involved in the cases of graduations from the World Bank’s International Development Associa-
tion (IDA) lending category to the International Bank for Reconstruction and Development (IBRD)
lending category. Although I did not observe the predicted effect on foreign direct investment,
these patterns largely support the hypotheses predicted by the theoretical framework, bolstering
my argument that international organizations influence international observers via classifications.
A limitation of the observational evidence presented in Chapter 4 is its inability to speak to the
two proposed mechanisms. This is of greatest concern in the case of donors, who could be sus-
ceptible to both a cognitive mechanism or a strategic mechanism. To separate these mechanisms,
I used an experimental approach, described in Chapter 5. Elite participants in a hypothetical aid
allocation activity changed their allocation behavior when exposed to countries’ categories, even
while they all received the same information. This effect was present only for the randomly se-
lected group of participants who were told that their allocation decisions would be reviewed by a
judge. In other words, a sample that is educated about and interested in development exhibited a
strong strategic classification effect but not a cognitive classification effect. An additional contri-
bution of this approach is to illustrate the micro-foundations of the relationships observed in the
previous chapter.
Having explained the relationship between international organizations and international ob-
servers, Chapter 6 turned to the affected parties. Drawing on interviews with dozens of stakehold-
ers in Nepal (an upcoming graduate) and Botswana (a future graduate), I showed that higher clas-
sifications can punish non-governmental organizations and those they represent, while benefiting
business interests. In addition, the interviews suggested that many political leaders are motivated
by social status considerations. Future work should explore how status relates to material consid-
erations and how these competing preferences aggregate into a country’s foreign economic policy
140140140

CHAPTER 7. CONCLUSION
with respect to its classification. Most important, and contrary to the claims of previous schol-
ars, not all countries want to improve their country’s status. When countries or groups do wish to
change their classifications, for better or for worse, they are sometimes able to do this by reforming
the system, lobbying for classifications, or gaming the system. I presented quantitative evidence
that countries try to game the system by revising their national income statistics as they approach
meaningful cutoffs. While future theory can work to explain variation in the preferences and strate-
gies used by these affected parties, results presented here serve to substantiate my core claim that
classifications are a powerful tool international organizations may deploy, either intentionally or
unintentionally, to affect outcomes and behaviors in the international economy.
7.1 Implications for International Organizations
An important implication of my argument is that international organizations exercise tremendous
power through bureaucratic devices such as classifications. These mundane devices are often over-
looked in the study of international financial institutions, a literature in which scholars often prefer
to focus on the political economy of lending and grants.1 These studies frequently demonstrate that
powerful countries use international institutions as a vehicle for channeling resources to politically
aligned countries. But I show that we need to look deeper than dollars: Bureaucratic procedures,
by coordinating the behaviors of many global actors, can also have distributive consequences. But
shining a spotlight on the importance of classifications does not satisfactorily answer the question
of who wields this power and to what ends.
One possibility is that classifications are the product of political patrons, using seemingly tech-
nical classifications to advance their material interests. One organizer of the Raise the MIC move-
ment expressed sentiments aligning with this view when he argued that the World Bank’s avoids
revising its classification system because of the self-serving interests of the World Bank’s major
1See, for example, Kuziemko and Werker (2006); Dreher et al. (2009); Kaja and Werker (2010); Kaya (2015);Kersting and Kilby (2016).
141141141

7.1. Implications for International Organizations
donors. He argued,
[T]here is a limited pool of resources for aid. My opinion is that this methodology
of basing aid levels on income levels gives donor countries justification to give less
because in reality the need is much greater than the amount of resources that is out
there. ... [O]f course the United States and ... western European countries have the
bulk of the voting power, so they don’t want to change the system because it would
open up the eligibility and the need for more resources.2
Fialho and Bergeijk (2017) make a similar argument about the founding of the UN’s LDC cate-
gory, claiming that developed countries advocated for criteria that would produce a smaller list of
countries to which special treatment would be offered, as well as for criteria that would benefit the
group of countries to which they had the strongest ties.
But an alternative possibility is that classifications are the product of committed economists,
dedicated to refining the principles by which they understand development and explain develop-
ment to the world. As explained in Chapter 3, the World Bank explains its reluctance to modify the
system because of the effects it would have on reclassified countries. The Development Economics
Group stated that they rejected many proposed alternatives because “countries would be reclassi-
fied based on a change of method, rather than as a result of economic growth,” an impact that
would be acceptable if the classifications were purely analytical, but which concerned them given
operational usage of the classifications.3 They also claim that preserving the classification system
in its original form allows users to track development over time, something no other classification
can do.4 Finally, they defend their unwilligness to incorporate measures of poverty or inequality
into the classification system due to limitations on data availability or quality. Only gross national
income per capita is readily available for all countries on a yearly basis with comparable quality,
2Author’s interview with Denys Nazarov, Associate Director of Global Policy, AIDS Healthcare Foundation, April7, 2017, phone interview.
3Fantom and Serajuddin (2016), p. 6.4Fantom and Serajuddin (2016), p. 13.
142142142

CHAPTER 7. CONCLUSION
which is why the World Bank argues it is the optimal basis for cross-country panel comparisons of
countries over time.5 These public defenses suggest very plausible and purely technical reasons to
maintain the system in its present form, regardless of any ulterior motivations.
Classifications could even be the tools of organizations seeking to extend their relevance and
reach. This explanation, like the last one, also makes bureaucrats the primary actors within inter-
national organizations, but it claims that these bureaucrats are motivated not by their commitment
to ideas but by their commitment to their organization.6 Fialho and Bergeijk (2017) have argued
that the proliferation of development classifications has partly resulted from competition between
organizations for dominance in the development space. Just recently, the UN’s Committee for De-
velopment Policy released a report encouraging international organizations to make more extensive
use of its LDC category (appeals which, if successful, will exaggerate the effects I have described
in this paper).7 This action underscores that international organizations are concerned with their
own importance and survival.
This project is not designed to adjudicate between these explanations. But it does illustrate that
technocrats have an important role in driving distributive outcomes, no matter what their motiva-
tions are. Future work examining these international financial institutions must acknowledge the
influential role played by bureaucracies and the ideas they codify.
7.2 Implications for Global Development
Another contribution of this argument is to extend insights from economic sociology to the domain
of development. Especially in financial economics, many have argued that economic models are
“an engine, not a camera,” moving and not just describing markets.8 I argue that similar dynamics
5Fantom and Serajuddin (2016), p. 16.6See Barnett and Finnemore (1999); Johnson (2014).7https://www.un.org/development/desa/dpad/publication/recognition-and-
application-of-the-least-developed-country-category-by-un-development-system-organizations/
8See MacKenzie (2006). See also Blyth (2002); Shiller (2017).
143143143
7.2. Implications for Global Development
exist in the economy experienced by developing countries, where ideas about what development is
powerfully shape development outcomes themselves.
In particular, my argument suggests a new interpretation of the phenomenon widely known as
the “middle income trap.”9 This phrase is commonly used to describe the situation many countries
face when they develop enough to reach middle income status but then plateau, never graduating
to high income status. While economists have pointed to many real structural impediments to
explain this pattern, my argument suggests that the Middle Income Country (MIC) category may
also be partially responsible: Perhaps the stagnation results from the changes that take place in
how international observers treat countries when they become classified as middle income. If,
for example, foreign aid helps a low income country to reach middle income status but then falls
off, then it is no wonder that improvements in the country’s position do not continue. As my
project has illustrated, the effects of classifications are too numerous and multifaceted to expect
this reductionist story to explain the full picture, but the intuition remains that the classification
effect could partly account for the middle income trap.
This is especially important to consider because numerous countries are scheduled to graduate
from these developing country categories. Already, 75% of the world’s poor live in MICs, and this
proportion will increase over time.10 Current projections indicate that, by 2025, half of today’s low
income countries will be middle income countries who will become eligible for graduation from
the IDA lending category.11 The UN expects that 16 of its 48 LDCs will graduate by 2025.12 These
numbers are unprecedented: for example, recall that only 5 countries have completed the gradua-
tion process since the founding of the LDC category. This suggests that the political dynamics I
described in this dissertation are about to affect a much larger group of countries.
Some may feel that international organizations should stop classifying altogether, but this pre-
9See Eichengreen et al. (2013); Kharas and Kohli (2011); Felipe et al. (2012). See also “The Middle-Income Trap,”The Economist, March 27, 2012.
10See Sumner (2012).11See Moss and Leo (2011); Morris and Gleave (2015).12See UNCTAD (2016).
144144144
CHAPTER 7. CONCLUSION
scription is infeasible. Classifications are just one way that international organizations develop and
disseminate ideas and narratives. It is impossible to strip international organizations of these nor-
mative underpinnings, and without classifications, they would influence discourse in other ways.
Furthermore, the cognitive and strategic mechanisms suggest that there will always be a demand
for classifications. Even if international organizations could coordinate to stop supplying them,
this does not prevent other actors from satisfying this demand.
Another reading of my argument is that international observers should stop using classifica-
tions. Consistent with this approach, one of the asks made by the Raise the MIC movement is
for the World Bank to make clear that their classifications should not be used to set foreign aid
levels or justify price differentiation.13 This could make a difference on the margin, perhaps clar-
ifying for some users who are confused about what the categories entail. To some extent, it may
reduce the cognitive effects of classifications by calling users’ attention to the biases that result
when classifications are used incorrectly. But it does very little to address the strategic incentives
to use classifications, in particular, those of donors. An alternative approach would be to petition
donors directly to illustrate the dangers of herding their allocative behaviors around these thresh-
olds. Since donors do have an interest in advancing development, it is possible that awareness of
these dynamics will be sufficient for them to change their approaches to allocating aid. It would be
more effective, however, to do this while also making aid agencies more independent.14 The less
that aid agencies must justify their behaviors to their funders, the less they will need to distort their
behaviors.
The most meaningful policy implications of my argument concern the classifiers themselves.
Classifiers have little control over who will or will not use their classifications, but my argument
shows that they can at least anticipate the user base of their classification. When an international
organization decides to produce a classification, it should consider the audiences who may rely on
13Author’s interview with Denys Nazarov, Associate Director of Global Policy, AIDS Healthcare Foundation, April7, 2017, phone interview.
14See Honig (2019).
145145145

7.3. Implications for Theories of Status
it for cognitive or strategic reasons. Designing simpler, more intuitive classifications will likely
attract a broader user base, while more complex or technical classifications will be more likely
to be used by specific audiences. In this way, international organizations can try, to the best of
their abilities, to design classifications that appeal only to the audiences they intend. Additionally,
classifying organizations should consider actual and not just intended audiences when consider-
ing revisions to their systems.15 These recommendations will reduce unintended consequences,
such as those that resulted from the unanticipated popularity of the World Bank income classifica-
tions. Conversely, international organizations can also apply my theoretical framework to develop
classifications that will become widely used, should they wish to promote their ideas to a broad
audience. Choosing classifications with fewer categories and intuitive names will strengthen the
cognitive appeal, and they can especially market their classifications to actors who can build these
systems into their operational policies and justifications of their actions in external reviews.
In sum, when international organizations consider graduating or reverse graduating a country
from a particular grouping or classification, they should take into consideration the expected re-
sponse of external actors when estimating the impact of such a move. Moreover, international
organizations should plan for the politicization of any classification they introduce, as my project
illustrates that global development institutions, intentionally or unintentionally, affect how devel-
oping countries are perceived and treated in the international economy.
7.3 Implications for Theories of Status
A last contribution of this project is to the broader international relations literature on status. While
scholars typically assume that states are motivated by seeking improved status, I show that some-
15The World Bank Development Economics Group is exemplary in this regard. They note, “A challenge with anyof the [alternative] approaches described above is that a number of countries would be reclassified on the basis of amethodology change, rather than as a result of growth or changes in per capita income. This is not problematic ifthe classification is used purely for analytical purposes, but this review has shown that its use extends into resourceallocation models and into policy development” (Fantom and Serajuddin, 2016, 30).
146146146

CHAPTER 7. CONCLUSION
times states actually seek lower status. This is especially true at the sub-national level; even if a
government pursues higher status, this may conceal the preferences of marginalized populations
who would prefer the sympathy to the reverence of international audiences. Future work must
seek to understand this heterogeneity in preferences, both at the country level as well as within
countries, and how these various preferences aggregate to international behaviors.
These novel observations about status politics may result, in part, from my unusual selection
of issue area. Status has largely been studied in the context of international security and military
conflict, and rare studies of status in international political economy typically focus on more de-
veloped economies and emerging markets. In contrast, I show that status politics are at work in
the foreign economic policies of developing countries. Future work should explore the other tools
these countries use to attain or eschew international status.
International organizations are able to change the world through the way they define and clas-
sify developing countries. These effects are felt by national governments, NGOs, businesses,
marginalized populations, and even leaders, whose social statuses are connected to those of their
countries. Because of these diverse and nuanced effects, bureaucrats in international organizations
have great power to design classifications that achieve their goals, but must also avoid unintended
consequences of this tool. As growth dynamics prompt the graduations of many developing coun-
tries, it is an ideal time to carefully consider how structures in global governance can, will, and
should mediate these seismic changes.
147147147

Bibliography
Kenneth W. Abbott and Duncan Snidal. Why States Act through Formal International Organiza-tions. Journal of Conflict Resolution, 42(1):3–32, 1998.
Rawi Abdelal. Capital Rules: The Construction of Global Finance. Harvard University Press,2008.
Rawi Abdelal and Mark Blyth. Just Who Put You in Charge? We Did: CRAs and the Politics ofCredit Ratings. In Ranking the World: Grading States as a Tool of Global Governance. 2015.
Yair Aharoni. Behavioral Elements in Foreign Direct Investments. Advances in InternationalManagement, 23:73–111, 2010.
Alberto Alesina and David Dollar. Who Gives Foreign Aid to Whom and Why? Journal ofEconomic Growth, 5:33–63, 2000.
Jose Antonio Alonso, Ana Luiza Cortez, and Stephan Klasen. LDC and other country groupings:How useful are current approaches to classify countries in a more heterogeneous developingworld? (21), 2014. URL http://www.un.org/en/development/desa/policy/cdp/cdp{\_}background{\_}papers/bp2014{\_}21.pdf.
Peter Andreas and Kelly Greenhill, editors. Sex, Drugs, and Body Counts: The Politics of Numbersin Global Crime and Conflict. Cornell University Press, Ithaca, NY, 2010.
P Andrew and M Edward. ”Secondary Evasion” and the Earned Income Tax Credit. The Journalof the American Taxation Association, 27(2), 2005.
Jaakko Aspara and Henrikki Tikkanen. The Role of Company Affect in Stock Investments: To-wards Blind, Undemanding, Non-Comparative and Committed Love. Journal of BehavioralFinance, 11(2), 2010.
Severine Autesserre. Peaceland: Conflict Resolution and the Everyday Politics of InternationalIntervention. Cambridge University Press, 2014.
Andy Baker. Race, Paternalism, and Foreign Aid: Evidence from U.S. Public Opinion. AmericanPolitical Science Review, 109(1), 2015.
148

BIBLIOGRAPHY
Michael Barnett. Eyewitness to a Genocide: The United Nations and Rwanda. Cornell UniversityPress, 2003.
Michael Barnett and Martha Finnemore. The Politics, Power, and Pathologies of InternationalOrganizations. International Organization, 53(4):699–732, 1999.
Michael Barnett and Martha Finnemore. Rules for the World. Cornell University Press, 2004.
Colin M Barry, K Chad Clay, and Michael E Flynn. Avoiding the Spotlight: Human Rights Sham-ing and Foreign Direct Investment. International Studies Quarterly, 57(February):532–544,2013. doi: 10.1111/isqu.12039.
David H Bearce and Brandy Jolliff Scott. Popular Opposition to International Organizations: HowExtensive and What Does this Represent? 2018.
Michael M. Bechtel, Jens Hainmueller, and Yotam Margalit. Preferences for International Redis-tribution: The Divide over the Eurozone Bailouts. American Journal of Political Science, 58(4):835–856, 2014.
William Bernhard and David Leblang. Democratic Processes and Financial Markets: PricingPolitics. Cambridge University Press, 2006.
Glen Biglaiser and Joseph L Staats. Do Political Institutions Affect Foreign Direct Investment? ASurvey of U.S. Corporations in Latin America. Political Research Quarterly, 63(3):508–522,2010. doi: 10.1177/1065912909331428.
Nancy Birdsall and William D. Savedoff. Cash on Delivery: A New Approach to Foreign Aid.Center for Global Development, 2010.
Shannon Lindsey Blanton and Robert Blanton. What Attracts Foreign Investors? An Examinationof Human Rights and Foreign Direct Investment. The Journal of Politics, 69(1):143–155, 2007.
Bruce A. Blonigen and Miao Wang. Inappropriate Pooling of Wealthy and Poor Countries inEmpirical FDI Studies. In T.H. Moran, E.M. Graham, and M. Blomstrom, editors, Does ForeignDirect Investment Promote Development? Brookings Institution Press, 2005.
Mark Blyth. Great Transformations: Economic Ideas and Institutional Change in the TwentiethCentury. Cambridge University Press, 2002.
Michael D. Bordo and Hugh Rockoff. The Gold Standard as a ”Good Housekeeping Seal ofApproval”. The Journal of Economic History, 56(2):389–428, 1996.
Christopher G Bradley. International Organizations and the Production of Indicators: The Case ofFreedom House. In Sally Engle Merry, Kevin E. Davis, and Benedict Kingsbury, editors, TheQuiet Power of Indicators: Measuring Governance, Corruption, and Rule of Law, pages 27–74.Cambridge University Press, 2015. ISBN 9781139871532.
149149149
Bibliography
Deborah Brautigam. Aid ‘With Chinese Characteristics’: Chinese Foreign Aid and DevelopmentFinance Meet the OECD-DAC Aid Regime. Journal of International Development, 23:752–764,2011. doi: 10.1002/jid.
Samuel Brazys and Niamh Hardiman. From ‘Tiger’ to ‘PIIGS’: Ireland and the use of heuristics incomparative political economy. European Journal of Political Research, 54:23–42, 2015. doi:10.1111/1475-6765.12068.
Ryan C. Briggs. The Influence of Aid Changes on African Election Outcomes. InternationalInteractions, 41(2):201–225, 2015. ISSN 0305-0629. doi: 10.1080/03050629.2014.948155.
Sarah M. Brooks, Raphael Cunha, and Layna Mosley. Categories, Creditworthiness, and Conta-gion: How Investors’ Shortcuts Affect Sovereign Debt Markets. International Studies Quarterly,59(3):587–601, 2015.
Andre Broome and Joel Quirk. The politics of numbers : the normative agendas ofglobal benchmarking. Review of International Studies, 41:813–818, 2015. doi: 10.1017/S0260210515000339.
Mark. T. Buntaine, Bradley C. Parks, and Benjamin P. Buch. Aiming at the Wrong Targets: TheDomestic Consequences of International Efforts to Build Institutions. International StudiesQuarterly, 61(2):471–488, 2017.
Ronelle Burger and Trudy Owens. Receive Grants or Perish? The Survival Prospects of UgandanNon-Governmental Organisations. Journal of Development Studies, 49(9):1284–1298, 2013.doi: 10.1080/00220388.2012.754430.
Sarah Bush. International Politics and the Spread of Quotas for Women in Legislatures. Interna-tional Organization, 65(1):103–137, 2011.
Sarah Bush. The Politics of Rating Freedom: The Role of Ideological Affinity in the PuzzlingAuthority of the Freedom in the World Ratings. Perspectives on Politics, 2017.
Tim Buthe. Beyond Supply and Demand: A Political-Economic Conceptual Model. In Governanceby Indicators: Global Power through Quantification and Rankings. Oxford University Press,2012.
Tim Buthe and Helen Milner. The Politics of Foreign Direct Investment into Developing Countries:Increasing FDI through International Trade Agreements? American Journal of Political Science,52(04):741 – 762, 2008.
Sebastian Calonico, Matias D. Cattaneo, and Rocio Titiunik. Robust Nonparametric ConfidenceIntervals for Regression-Discontinuity Designs. Econometrica, 82(6):2295–2326, 2014.
Allison Carnegie and Lindsay Dolan. The Effects of Aid on Recipients ’ Reputations: Evidencefrom Natural Disaster Responses. (Working paper), 2018.
150150150

BIBLIOGRAPHY
Allison Carnegie and Cyrus Samii. International Institutions and Political Liberalization: Evidencefrom the World Bank Loans Program. British Journal of Political Science, (Forthcoming), 2017.
Edward Hallett Carr. The Twenty Years’ Crisis, 1919-1939. Harper Perennial, 1964.
Steve Chan and Melanie Mason. Foreign Direct Investment and Host Country Conditions: Lookingfrom the Other Side Now. International Interactions, 17(3):215–232, 1991.
Terrence L. Chapman. Audience Beliefs and International Organization Legitimacy. InternationalOrganization, 63(X):733, 2009.
Jeffrey Chwieroth. Capital Ideas: The IMF and the Rise of Financial Liberalization. PrincetonUniversity Press, 2009.
Michael A. Clemens and Michael Kremer. The New Role for the World Bank. Journal of EconomicPerspectives, 30(1):53–76, 2016.
John Conlisk. Why Bounded Rationality? Journal of Economic Literature, 34(2):669–700, 1996.
Alexander Cooley and Jack Snyder, editors. Ranking the World: Grading States as a Tool of GlobalGovernance. Cambridge University Press, 2015.
Allan Dafoe, Jonathan Renshon, and Paul Huth. Reputation and Status as Motives for War. AnnualReview of Political Science, 17(1):371–393, 2014.
Xinyuan Dai. International Institutions and National Policies. Cambridge University Press, Cam-bridge, 2007.
Paul A. David. Clio and the Economics of QWERTY. The American Economic Review, 75(2),1985.
Kevin E. Davis, Angelina Fisher, Benedict Kingsbury, and Sally Engel Merry, editors. Governanceby Indicators: Global Power through Quantifications and Rankings. Oxford University Press,2012.
Simone Dietrich. Bypass or Engage? Explaining Donor Delivery Tactics in Foreign Aid Al-location. International Studies Quarterly, 57(4):698–712, dec 2013. ISSN 00208833. doi:10.1111/isqu.12041.
Simone Dietrich, Minhaj Mahmud, and Matthew S. Winters. Foreign Aid, Foreign Policy, andDomestic Government Legitimacy: Survey Experimental Evidence from Bangladesh. Journalof Politics, 80(1), 2018.
Axel Dreher, Silvia Marchesi, and James Raymond Vreeland. The Political Economy of IMFForecasts. Public Choice, 137(1-2):145–171, 2008.
151151151

Bibliography
Axel Dreher, Jan Egbert Sturm, and James Raymond Vreeland. Development Aid and InternationalPolitics: Does Membership on the UN Security Council Influence World Bank Decisions? Jour-nal of Development Economics, 88(1):1–18, 2009.
Barry Eichengreen, Donghyun Park, and Kwanho Shin. Growth Slowdowns Redux: New Evidenceon the Middle-Income Trap. NBER Working Papers, 18673, 2013. ISSN 1098-6596. doi:10.1017/CBO9781107415324.004.
Wendy Nelson Espeland and Michael Sauder. The Dynamism of Indicators. In Kevin E. Davis,Angela Fisher, Benedict Kingsbury, and Sally Engle Merry, editors, Governance by Indicators:Global Power through Quantification and Rankings. 2012.
Neil Fantom and Umar Serajuddin. The World Bank’s Classification of Countries by Income.World Bank Policy Research Working Paper, 7528, 2016.
James D. Fearon. Domestic Political Audiences and the Escalation of International Disputes. TheAmerican Political Science Review, 88(3):577–592, 1994.
Jesus Felipe, Arnelyn Abdon, and Utsav Kumar. Tracking the Middle-Income Trap: What Is It?Who Is in It, and Why? Levy Economics Institute Working Paper, 715, 2012.
Djalita Fialho. Altruism but not Quite: The Genesis of the Least Developed Country (LDC)Category. Third World Quarterly, 33(5):751–768, 2012. doi: 10.1080/01436597.2012.674700.
Djalita Fialho and Peter A G Van Bergeijk. The Proliferation of Developing Country ClassificationsThe Proliferation of Developing Country Classifications. The Journal of Development Studies,53(1):99–115, 2017. ISSN 0022-0388. doi: 10.1080/00220388.2016.1178383. URL http://dx.doi.org/10.1080/00220388.2016.1178383.
Morris P. Fiorina. Legislative Choice of Regulatory Forms - Legal Process or AdministrativeProcess. Public Choice, 39(1):33–66, 1982.
Susan T. Fiske and Shelley E. Taylor. Social Cognition: From Brains to Culture. SAGE Publica-tions, 2nd edition, 2013.
M. Flinders and J. Buller. Depoliticisation: Principles, Tactics and Tools. British Politics, 1:293–318, 2006.
Michel Foucault. A History of Sexuality. Vintage Press, New York, 1978.
Emmanuel Frot and Javier Santiso. Herding in Aid Allocation. Kyklos, 64(1):54–74, 2011.
Sebastian Galiani, Stephen Knack, Lixin Colin Xu, and Ben Zou. The Effect of Aid on Growth:Evidence from a Quasi-Experiment. (Working paper), 2015. ISSN 1556-5068. doi: 10.2139/ssrn.2400752.
Robert Gilpin. War and Change in World Politics. Cambridge University Press, 1983. ISBN9780521273763.
152152152
BIBLIOGRAPHY
Julia Gray. The Company States Keep: International Organizations and Investor Perceptions.Cambridge University Press, 2013.
Julia Gray and Raymond Hicks. Reputations, Perceptions, and International Economic Agree-ments. International Interactions, 40(3):325–349, 2014.
Jessica Green. Rethinking Private Authority: Agents and Entrepreneurs in Environmental Gover-nance. Princeton University Press, 2013.
Anthony G. Greenwald and Mahzarin R. Banaji. Implicit Social Cognition: Attitude, Self, andStereotypes. Psychological Review, 102(1):4–27, 1995.
William Grieder. One World, Ready or Not: The Manic Logic of Global Capitalism. Simon &Schuster, 1998.
Patrick Guillaumont. Caught in a Trap: Identifying the Least Developed Countries. Economica,2010.
Kenneth Harttgen and Stephan Klasen. Do Fragile Countries Experience Worse MDG Progress?Journal of Development Studies, 49(1):134–159, 2013. ISSN 00220388. doi: 10.1080/00220388.2012.713471.
Darren Hawkins, David Lake, Daniel Nielsen, and Michael J Tierney, editors. Delegation andAgency in International Organizations. Cambridge University Press, 2006.
Tobias Heinrich, Yoshiharu Kobayashi, and Kristin A. Bryant. Public Opinion and Foreign AidCuts in Economic Crises. World Development, 77:66–79, 2016.
James R. Hollyer, B. Peter Rosendorff, and James Raymond Vreeland. Democracy and Trans-parency. The Journal of Politics, 73(04):1191–1205, 2011.
Dan Honig. When Reporting Undermines Performance: The Costs of Politically ConstrainedOrganizational Autonomy in Foreign Aid Implementation. International Organization, 2019.
Daniel Honig and Catherine E. Weaver. A Race to the Top: The Aid Transparency Index and theSocial Power of Global Performance Indicators. 2018.
Susan D. Hyde. Catch Us If You Can: Election Monitoring and International Norm Diffusion.American Journal of Political Science, 55(2):356–369, 2011. ISSN 00925853. doi: 10.1111/j.1540-5907.2011.00508.x.
Ryan S. Jablonski. How Aid Targets Votes: The Impact of Electoral Incentives on ForeignAid Distribution. World Politics, 66(2):293–330, 2014. ISSN 1086-3338. doi: 10.1017/S0043887114000045.
Dinuk Jayasuriya. Improvements in the World Bank’s Ease of Doing Business Rankings Do theyTranslate into Greater Foreign Direct Investment Inflows ? World Bank Policy Research WorkingPaper, 5787, 2011.
153153153

Bibliography
Nathan M. Jensen. Nation-States and the Multinational Corporation: A Political Economy ofForeign Direct Investment. Princeton University Press, 2006.
Morten Jerven. Poor Numbers: How We Are Misled by African Development Statistics. CornellUniversity Press, Ithaca, NY, 2013.
Robert Jervis. Reports, Politics, and Intelligence Failures: The Case of Iraq. Journal of StrategicStudies, 29(1):3–52, 2006.
Tana Johnson. Organizational Progeny: Why Governments are Losing Control over the Prolifer-ating Structures of Global Governance. Oxford University Press, 2014.
Daniel Kahneman. Thinking Fast and Slow. Farrar, Straus, and Giroux, 2011.
Ashwin Kaja and Eric Werker. Corporate Governance at the World Bank and the Dilemma ofGlobal Governance. World Bank Economic Review, 24(2):171–198, 2010.
Ayse Kaya. Power and Global Economic Institutions. Cambridge University Press, 2015.
Ayse Kaya and James T Walker. How do Multilateral Institutions Influence Individual Perceptionsof International Affairs? Evidence from Europe and Asia. European Journal of DevelopmentResearch, 26(5):831–852, 2014. ISSN 0957-8811. doi: 10.1057/ejdr.2014.2. URL http://dx.doi.org/10.1057/ejdr.2014.2.
Judith Kelley. Scorecard Diplomacy: Rating Nations on the Fight against Human Trafficking.Cambridge University Press, 2017.
Judith G. Kelley and Beth A. Simmons. Politics by Number: Indicators as Social Pressure inInternational Relations. American Journal of Political Science, 59(1):55–70, 2015.
Judith G Kelley and Beth A Simmons. The Power of Ranking : The Ease of Doing BusinessIndicator as a form of Social Pressure. Number May. 2016. ISBN 2002080615.
Robert O. Keohane. After Hegemony: Cooperation and Discord in the World Political Economy.Princeton University Press, 1984.
Andrew Kerner, Morten Jerven, and Alison Beatty. Does It Pay to Be Poor? Testing for System-atically Underreported GNI Estimates. The Review of International Organizations, pages 1–38,2015.
Erasmus K. Kersting and Christopher Kilby. With a Little Help from My Friends: Global Elec-tioneering and World Bank Lending. Journal of Development Economics, 121:153–165, 2016.
Homi Kharas and Harinder Kohli. What Is the Middle Income Trap, Why do Countries Fall into It,and How Can It Be Avoided? Global Journal of Emerging Market Economies, 3(3):281–289,2011. ISSN 09752730. doi: 10.1177/097491011100300302.
154154154
BIBLIOGRAPHY
Charles Kindleberger. Maniacs, Panics, and Crashes: A History of Financial Crises. John Wileyand Sons, Inc., 5th edition, 2005.
Stephen Knack, Colin Xu, and Ben Zou. Interactions among Donors’ Aid Allocations: Evidencefrom an Exogenous World Bank Income Threshold. World Bank Policy Research Working Paper,7039, 2014.
Barbara Koremenos, Charles Lipson, and Duncan Snidal. The Rational Design of InternationalInstitutions. International Organization, 55(4):761–799, 2001.
Stephen Kosack and Jennifer Tobin. Funding Self-Sustaining Development: The Role of Aid, FDI,and Government in Economic Success. International Organization, 60(Winter), 2006.
Ilyana Kuziemko and Eric Werker. How Much Is a Seat on the Security Council Worth? ForeignAid and Bribery at the United Nations. Journal of Political Economy, 114(5):905–930, 2006.
Claudia Landwehr and Katharina Bohm. Delegation and Institutional Design in Health-Care Ra-tioning. Governance, 24(4):665–688, 2011.
Valentin F. Lang and Andrea F. Presbitero. Room for Discretion? Biased Decision Making inInternational Financial Institutions. 2017.
Deborah Larson and A Shevchenko. Status Seekers: Chinese and Russian Responses to US Pri-macy. International Security, 34(4):63–95, 2010.
Deborah Welch Larson, T.V. Paul, and William C. Wohlforth. Status and World Order. In T.V. Paul,Deborah Welch Larson, and William C. Wohlforth, editors, Status in World Politics. CambridgeUniversity Press, 2014. ISBN 9781107444409.
Teresa Lenzi. Recognition and Application of the Least Developed Country Category by UNDevelopment System Organizations. United Nations Committee for Development Policy (CDP)Policy Review, (6), 2017.
Quan Li and Adam Resnick. Reversal of Fortunes: Democratic Institutions and Foreign DirectInvestment Inflows to Developing Countries. International Organization, 57(1):175–211, 2003.ISSN 0020-8183. doi: 10.1017/S002081.
David Halloran Lumsdaine. Moral Vision in International Politics: The Foreign Aid Regime, 1949-1989. Princeton University Press, 1993.
Donald MacKenzie. An Engine, Not a Camera: How Financial Models Shape Markets. MITPress, Cambridge, 2006.
Christopher S. P. Magee and John A. Doces. Reconsidering Regime Type and Growth: Lies,Dictatorships, and Statistics. International Studies Quarterly, 59(2):223–237, 2015.
Elizabeth Maitland and Andre Sammartino. Material Cognition and Internationalization. Journalof International Business Studies, 46(7):733–760, 2015.
155155155
Bibliography
Walter Mattli and Tim Buthe. Accountability in Accounting? The Politics of Private Rule-Makingin the Public Interest. Governance, 18(3):399–429, 2005.
Walter Mattli and Ngaire Woods. In Whose Benefit? Explaining Regulatory Change in GlobalPolitics. In Walter Mattli and Ngaire Woods, editors, The Politics of Global Regulation, pages1–43. Princeton University Press, Princeton, 2009.
John J. Mearsheimer. The False Promise of International Institutions. International Security, 19(3):5–49, 1994.
Sally Engle Merry. Measuring the World: Indicators, Human Rights, and Global Governance.Current Anthropology, 52(3):83–95, 2011. doi: 10.1086/657241.
Helen Milner. Why Multilateralism? Foreign Aid and Domestic Principal-Agent Problems. InDarren Hawkins, David Lake, Daniel Nielsen, and Michael J. Tierney, editors, Delegation andAgency in International Organizations. Cambridge University Press, 2006.
Hans Morgenthau. Politics among Nations. Knopf New York, New York, 1973.
Scott Morris and Madeleine Gleave. The World Bank at 75. Center for Global Development PolicyPaper, (58), 2015.
Julia C. Morse. International Institutions and Indirect Market Enforcement: Analyzing the Regimeto Combat Terrorist Financing. 2017.
Layna Mosley. Global Capital and National Governments. Cambridge University Press, 2003.
Layna Mosley. Constraints, Opportunities, and Information: Financial Market-Government Rela-tions around the World. In Pranab Bardhan, Samuel Bowles, and Michael Wallerstein, editors,Globalization and Egalitarian Redistribution. 2005.
Todd Moss and Benjamin Leo. IDA at 65: Heading Toward Retirement or a Fragile Lease on Life?Center for Global Development Working Paper, 246, 2011.
Peter Murrell. The Interactions of Donors, Contractors, and Recipients in Implementing Aid forInstitutional Reform. In Bertin Martens, Peter Murrell, and Uwe Mummert, editors, The Insti-tutional Economics of Foreign Aid. Cambridge University Press, 2002.
Ashley Napier, Angie Acquatella, Michael G. Findley, Daniel L. Nielson, Brian O’Donnell,Michael J. Tierney, and Catherine E. Weaver. Mapping for Impact: Testing the Effects ofGeospatial Information on Development Aid Decision-Making. 2016.
Stephen C. Nelson. The Currency of Confidence: How Economic Beliefs Shape the IMF’s Rela-tionship with its Borrowers. Cornell University Press, 2017.
Stephen C Nelson and Catherine Weaver. Organizational Culture. In Jacob Katz Cogan, Ian Hurd,and Ian Johnstone, editors, Oxford Handbook of International Organizations. Oxford UniversityPress, 2016. ISBN 9780199672202.
156156156
BIBLIOGRAPHY
Eric Neumayer. Is the Allocation of Food Aid Free from Donor Interest Bias? Journal of Devel-opment Studies, 41(3):394–411, 2005.
Benjamin J. Newman, Todd K. Hartman, Patrick L. Lown, and Stanley Feldman. Easing theHeavy Hand: Humanitarian Concern, Empathy, and Opinion on Immigration. British Journalof Political Science, 45(03):583–607, 2013.
Lynge Nielsen. How to Classify Countries Based on Their Level of Development: How It is Doneand How It Could be Done. IMF Working Paper, 2011.
Farhad Noorbakhsh, Alberto Paloni, and Ali Youssef. Human Capital and FDI Inflows to Devel-oping Countries: New Empirical Evidence. World Development, 29(9):1593–1610, 2001.
Jennifer M. Oetzel, Richard A. Bettis, and Marc Zenner. Country Risk Measures: How Risky AreThey? Journal of World Business, 36(2):128–145, 2001.
Abramo Organski and Jacek Kugler. The War Ledger. University of Chicago Press, Chicago, 1981.
Pamela Paxton and Stephen Knack. Individual and Country-Level Factors Affecting Support forForeign Aid. International Political Science Review, 33(2):171–192, 2012.
David Phillips. Reforming the World Bank. Cambridge University Press, 2009.
Paul Pierson. Increasing Returns, Path Dependence, and the Study of Politics. American PoliticalScience Review, 94(2):251–267, 2000.
Katharina Pistor. Re-Construction of Private Indicators for Public Purposes. In Kevin E. Davis,Angelina Fisher, Benedict Kingsbury, and Sally Engle Merry, editors, Governance by Indica-tors: Global Power through Quantification and Rankings, pages 165–179. Oxford UniversityPress, 2012.
Tony Porter. Technical collaboration and political conflict in the emerging regime for internationalfinancial regulation. Review of International Political Economy, 10(3):520–551, 2003. doi:10.1080/09692290308430.
Dilip Ratha, Prabal K. De, and Sanket Mohapatra. Shadow Sovereign Ratings for Unrated Devel-oping Countries. World Development, 39(3):295–307, 2011.
Martin Ravallion. The World Bank: Why It Is Still Needed and Why It Still Disappoints. Journalof Economic Perspectives, 30(1):77–94, 2016.
Jonathan Renshon. Status Deficits and War. International Organization, 70(3):513–550, 2016a.
Jonathan Renshon. Fighting for Status. Book manuscript, 2016b.
Dani Rodrik. When Ideas Trump Interests: Preferences, World Views, and Policy Innovations.2013.
157157157

Bibliography
Justin Sandefur and Amanda Glassman. The Political Economy of Bad Data: Evidence fromAfrican Survey and Administrative Statistics. The Journal of Development Studies, 51(2):116–132, 2013.
Randall L. Schweller. Realism and The Present Great-Power System: Growth and PositionalCompetition Over Scarce Resources. In Unipolar Politics: Realism and State Strategies afterthe Cold War. Columbia University Press, New York, 1999. ISBN 0231113080.
James C. Scott. Seeing Like a State. Yale University Press, New Haven, 1998.
Robert J. Shiller. Irrational Exuberance. Princeton University Press, 3rd edition, 2015.
Robert J. Shiller. Narrative Economics. 2017.
Herbert A. Simon. A Behavioral Model of Rational Choice. Quarterly Journal of Economics, 69(1):99–118, 1955.
Timothy Sinclair. The New Masters of Capital. Cornell University Press, Ithaca, NY, 2005.
Christopher Skovron and Rocio Titiunik. A Practical Guide to Regression Discontinuity Designsin Political Science. 2015.
Debora L Spar. The Spotlight and the Bottom Line How Multinationals Export Human Rights.Foreign Affairs, 77(2):7–12, 1998.
John D. Steinbruner. The Cybernetic Theory of Decision: New Dimensions of Political Analysis.Princeton University Press, 1974.
Andy Sumner. Where Do The Poor Live? World Development, 40(5):865–877, 2012. ISSN0305750X. doi: 10.1016/j.worlddev.2011.09.007.
Henri Tajfel and A. L. Wilkes. Classification and Quantitative Judgement. British Journal ofPsychology, 54(2):101–114, 1963.
Shelley E. Taylor. A Categorization Approach to Stereotyping. In David L. Hamilton, editor,Cognitive Processes in Stereotyping and Intergroup Behavior. Psychology Press, 1981.
Richard Thaler. Misbehaving: The Making of Behavioral Economics. W.W. Norton, 2015.
Michael Tomz. Reputation and International Cooperation: Sovereign Debt Across Three Cen-turies. Princeton University Press, Princeton, 2007. ISBN 0691134693, 9780691134697.
Ann E. Towns. Women and States: Norms and Hierarchies in International Society. CambridgeUniversity Press, 2010.
Amos Tversky and Daniel Kahneman. Judgment under Uncertainty: Heuristics and Biases. Sci-ence, 185(4157):1124–1131, 1974.
158158158
BIBLIOGRAPHY
UNCTAD. The Least Developed Countries Report 2016: The path to graduation and beyond:Making the most of the process. Number December. 2016. ISBN 9789211129052.
UNCTAD. World Investment Report 2017. 2017.
Madhu Vij. The Determinants of Country Risk Analysis: An Empirical Approach. Journal ofManagement Research, 5(1):20–31, 2005.
S. George Vincentnathan. Caste Politics, Violence, and the Panchayat in a South Indian Commu-nity. Comparative Studies in Society and History, 38(3):484–509, 1996.
Jeremy L. Wallace. Juking the Stats? Authoritarian Information Problems in China. British Journalof Political Science, 46(01):11–29, 2016.
Kenneth N. Waltz. Theory of International Politics. Waveland Press, 1979.
Julie Walz and Vijaya Ramachandran. Brave New World: A Literature Review of EmergingDonors and the Changing Nature of Foreign Assistance. Center for Global Development Work-ing Paper, 273, 2010.
R. Kent Weaver. The Politics of Blame Avoidance. Journal of Public Policy, 6(4):371–398, 1986.
Alexander Wendt. Anarchy is What States Make of It: The Social Construction of Power Politics.International Organization, 46(2):391–425, 1992.
Erik Wibbels. Dependency Revisited: International Markets, Business Cycles, and Social Spend-ing in the Developing World. International Organization, 60:433–468, 2006.
David A. Wilder. Social Categorization: Implications for Creation and Reduction of IntergroupBias. Advances in Experimental Social Psychology, 19(C):291–355, 1986.
David W. Williams and Denis A. Gregoire. Seeking Commonalities or Avoiding Differences?Re-Conceptualizing Distance and Its Effects on Internationalization Decisions. Journal of In-ternational Business Studies, 46(3), 2015.
William C. Wohlforth. Unipolarity, Status Competition, and Great Power War. World Politics, 61(1):28–57, 2009. ISSN 0043-8871. doi: 10.1017/S0043887109000021.
Ngaire Woods. The Globalizers: The IMF, The World Bank, and their Borrowers. Cornell Univer-sity Press, 2006.
159159159

Appendices
160

Appendix A
Expert Survey
While my theory predicts which classifications influence which actors, it does not actually predict
the direction of the effects. To derive directional predictions would demand developing additional
theories for the costs and benefits each actor faces for allocating aid or investment to one coun-
try over another, or rating a country a certain way. While the directions of my hypotheses are
intuitive and consistent with previous findings, there are sometimes plausible reasons to believe
effects could occur in the opposite direction. In fact, Knack et al. (2014) begins with competing
hypotheses regarding donor behavior: Donors could add to the countries they observe other donors
funding, or they could do the opposite in an attempt to compensate for the behavior of others.
Prior to conducting my analysis, I conducted a brief survey of experts at the Center for Global
Development (CGD) to solicit their priors not only on where the effects would be but also on the
direction. CGD is one of the most actively involved think tanks in International Development As-
sociation (IDA) graduation policy reform and many of the fellows have decades of experience in
multilateral organizations working to promote development through aid, investment, finance, and
governance initiatives.1 To sufficiently define my research question for them, I presented respon-
dents with a list of the outcomes I would be examining, potential explanations for any effects, and
1While all staff were invited to participate in the survey, I subset my sample to only my 17 respondents whoreported 3 or above on a 5-point scale when asked about their expertise/familiarity with IDA graduation policy.
161
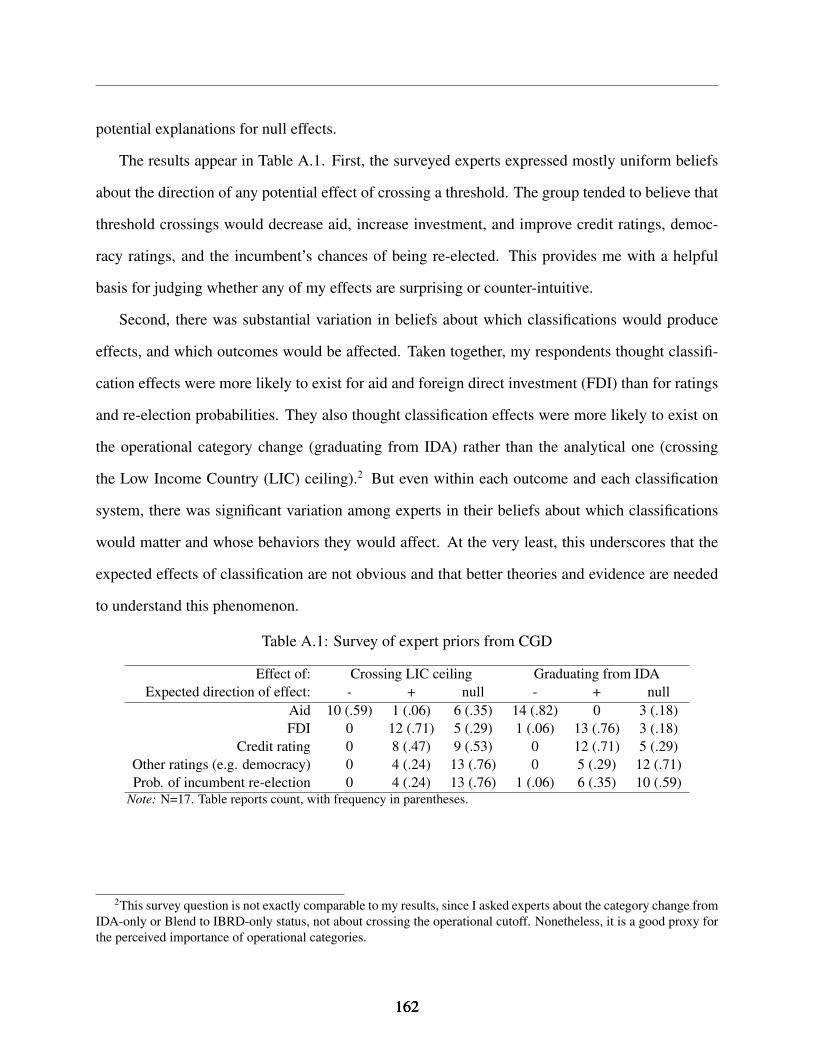
potential explanations for null effects.
The results appear in Table A.1. First, the surveyed experts expressed mostly uniform beliefs
about the direction of any potential effect of crossing a threshold. The group tended to believe that
threshold crossings would decrease aid, increase investment, and improve credit ratings, democ-
racy ratings, and the incumbent’s chances of being re-elected. This provides me with a helpful
basis for judging whether any of my effects are surprising or counter-intuitive.
Second, there was substantial variation in beliefs about which classifications would produce
effects, and which outcomes would be affected. Taken together, my respondents thought classifi-
cation effects were more likely to exist for aid and foreign direct investment (FDI) than for ratings
and re-election probabilities. They also thought classification effects were more likely to exist on
the operational category change (graduating from IDA) rather than the analytical one (crossing
the Low Income Country (LIC) ceiling).2 But even within each outcome and each classification
system, there was significant variation among experts in their beliefs about which classifications
would matter and whose behaviors they would affect. At the very least, this underscores that the
expected effects of classification are not obvious and that better theories and evidence are needed
to understand this phenomenon.
Table A.1: Survey of expert priors from CGD
Effect of: Crossing LIC ceiling Graduating from IDAExpected direction of effect: - + null - + null
Aid 10 (.59) 1 (.06) 6 (.35) 14 (.82) 0 3 (.18)FDI 0 12 (.71) 5 (.29) 1 (.06) 13 (.76) 3 (.18)
Credit rating 0 8 (.47) 9 (.53) 0 12 (.71) 5 (.29)Other ratings (e.g. democracy) 0 4 (.24) 13 (.76) 0 5 (.29) 12 (.71)Prob. of incumbent re-election 0 4 (.24) 13 (.76) 1 (.06) 6 (.35) 10 (.59)
Note: N=17. Table reports count, with frequency in parentheses.
2This survey question is not exactly comparable to my results, since I asked experts about the category change fromIDA-only or Blend to IBRD-only status, not about crossing the operational cutoff. Nonetheless, it is a good proxy forthe perceived importance of operational categories.
162162162

Appendix B
Cross-National Analysis
B.1 Quantitative
B.1.1 Descriptive Statistics
163

B.1. Quantitative
Table B.1: Table of summary statistics
Group Mean SD Min Max NGNI per capita
All 3619.85 8253.43 60.00 203900.00 3867L 409.59 198.32 60.00 1020.00 1290LM 1799.29 817.30 430.00 4050.00 1423UM 5812.16 2388.77 1700.00 12550.00 878H 21036.67 23462.91 6260.00 203900.00 276
ODA Disbursements (All donors)All 395.02 667.59 -959.96 11428.02 3846L 651.80 863.64 11.84 11428.02 1290LM 379.36 576.99 -943.15 5509.01 1423UM 151.30 344.10 -959.96 3441.78 877H 23.11 92.22 -460.26 559.30 256
FDI (percentage of GDP)All 3.95 7.31 -101.37 161.83 3703L 3.32 6.91 -7.29 90.46 1238LM 3.50 5.22 -32.29 62.30 1351UM 4.98 5.47 -39.69 36.88 861H 5.93 17.07 -101.37 161.83 253
Creditworthiness (IIR)All 33.63 17.68 4.95 84.60 2370L 20.47 9.48 4.95 63.10 791LM 31.84 12.32 7.20 76.20 888UM 47.03 14.90 14.85 82.35 556H 67.30 11.95 23.40 84.60 135
Freedom House PR score (flipped)All 4.33 2.02 1.00 7.00 3723L 3.22 1.68 1.00 7.00 1285LM 4.50 1.86 1.00 7.00 1350UM 5.31 1.87 1.00 7.00 858H 5.83 2.08 1.00 7.00 230
Logged populationAll 15.49 2.10 9.19 21.03 3864L 16.07 1.62 11.58 20.94 1287LM 15.40 2.17 10.85 21.01 1423UM 15.06 2.39 9.19 21.03 878H 14.59 1.99 10.30 18.78 276
Logged gross capital formationAll 21.46 2.91 0.00 29.20 3519L 20.06 3.49 0.00 26.66 1206LM 21.74 2.15 0.00 28.51 1234UM 22.53 2.30 17.44 29.20 832H 23.21 1.88 19.01 26.93 247
164164164
APPENDIX B. CROSS-NATIONAL ANALYSIS
B.1.2 Replication of Knack et al. (2014)
Knack et al. (2014) look at the effect of crossing the operational cutoff on aid disbursements from
the Organization for Economic Cooperation and Development (OECD). They use data from 1987-
2010 for all countries that either were eligible to graduate from the International Development
Association (IDA) or crossed the operational cutoff during this period and group country-years
into three-year periods that correspond with the IDA replenishment cycles. When aggregating to a
period, they take the income and threshold observation for the final year in the period, and for all
other variables they take the mean of the three observations in the period.
There are three main differences between their model and data and mine:
1. They include Country Policy and Institutional Assessment (CPIA) index as a control. This
is a score the World Bank awards to countries to evaluate economic policies, and this index
is an important component in the formula that determines allocation of IDA, although it is
not used in eligibility decisions. While the CPIA’s modern equivalent the IDA Resource
Allocation Index (IRAI) is available publicly after 2006, the CPIA before 2006 is private
data. Nonetheless, in correspondence with the authors, they confirmed that their results are
robust to dropping this control.
2. The Knack et al. data end in 2010, which is the last year of the IDA15 replenishment cycle.
My data end in 2015, which allows me to create observations for IDA16 and IDA17 as well.
3. There are minor differences in the observations included in the sample, mostly due to data
availability. These observations are reported in Table B.2.
In Table B.3, I replicate the main results of the Knack et al. paper on the data provided to
me by the authors and on my data. Model 1 is the benchmark result reported in Knack et al.,
although without the CPIA control. Even without this control, the result is significant: crossing the
operational cutoff causes total ODA to decrease. When I run the same model on my own data set
165165165
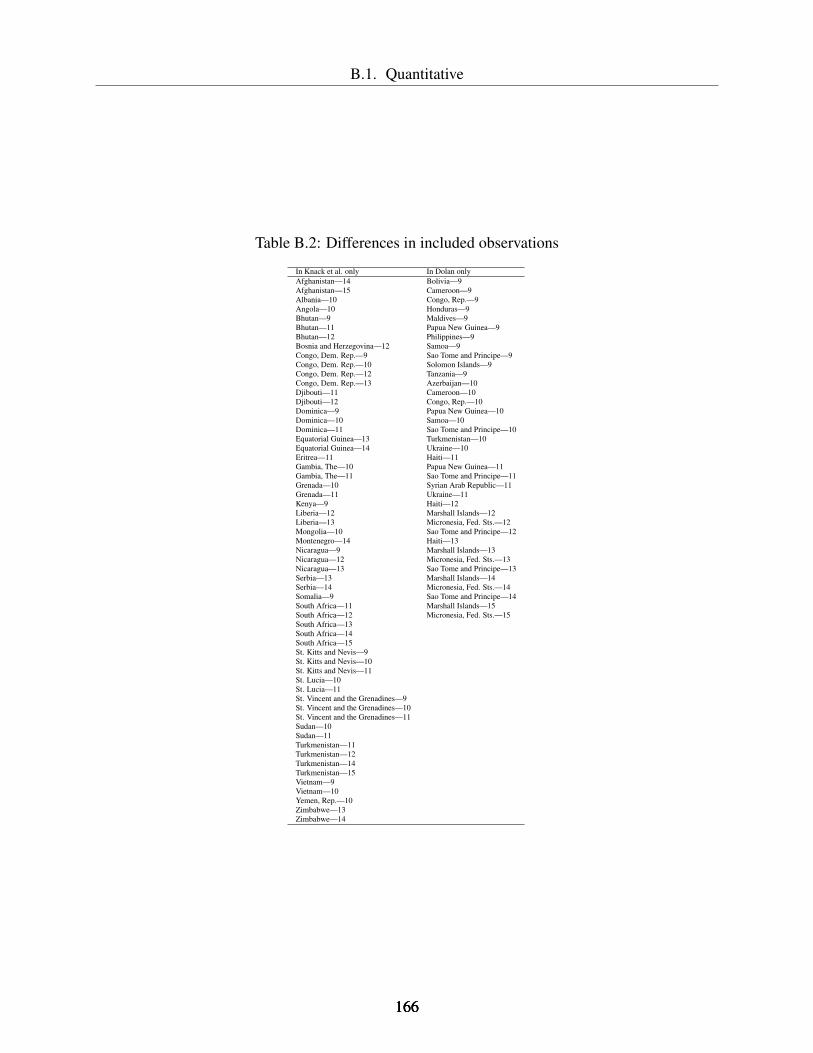
B.1. Quantitative
Table B.2: Differences in included observations
In Knack et al. only In Dolan onlyAfghanistan—14 Bolivia—9Afghanistan—15 Cameroon—9Albania—10 Congo, Rep.—9Angola—10 Honduras—9Bhutan—9 Maldives—9Bhutan—11 Papua New Guinea—9Bhutan—12 Philippines—9Bosnia and Herzegovina—12 Samoa—9Congo, Dem. Rep.—9 Sao Tome and Principe—9Congo, Dem. Rep.—10 Solomon Islands—9Congo, Dem. Rep.—12 Tanzania—9Congo, Dem. Rep.—13 Azerbaijan—10Djibouti—11 Cameroon—10Djibouti—12 Congo, Rep.—10Dominica—9 Papua New Guinea—10Dominica—10 Samoa—10Dominica—11 Sao Tome and Principe—10Equatorial Guinea—13 Turkmenistan—10Equatorial Guinea—14 Ukraine—10Eritrea—11 Haiti—11Gambia, The—10 Papua New Guinea—11Gambia, The—11 Sao Tome and Principe—11Grenada—10 Syrian Arab Republic—11Grenada—11 Ukraine—11Kenya—9 Haiti—12Liberia—12 Marshall Islands—12Liberia—13 Micronesia, Fed. Sts.—12Mongolia—10 Sao Tome and Principe—12Montenegro—14 Haiti—13Nicaragua—9 Marshall Islands—13Nicaragua—12 Micronesia, Fed. Sts.—13Nicaragua—13 Sao Tome and Principe—13Serbia—13 Marshall Islands—14Serbia—14 Micronesia, Fed. Sts.—14Somalia—9 Sao Tome and Principe—14South Africa—11 Marshall Islands—15South Africa—12 Micronesia, Fed. Sts.—15South Africa—13South Africa—14South Africa—15St. Kitts and Nevis—9St. Kitts and Nevis—10St. Kitts and Nevis—11St. Lucia—10St. Lucia—11St. Vincent and the Grenadines—9St. Vincent and the Grenadines—10St. Vincent and the Grenadines—11Sudan—10Sudan—11Turkmenistan—11Turkmenistan—12Turkmenistan—14Turkmenistan—15Vietnam—9Vietnam—10Yemen, Rep.—10Zimbabwe—13Zimbabwe—14
166166166
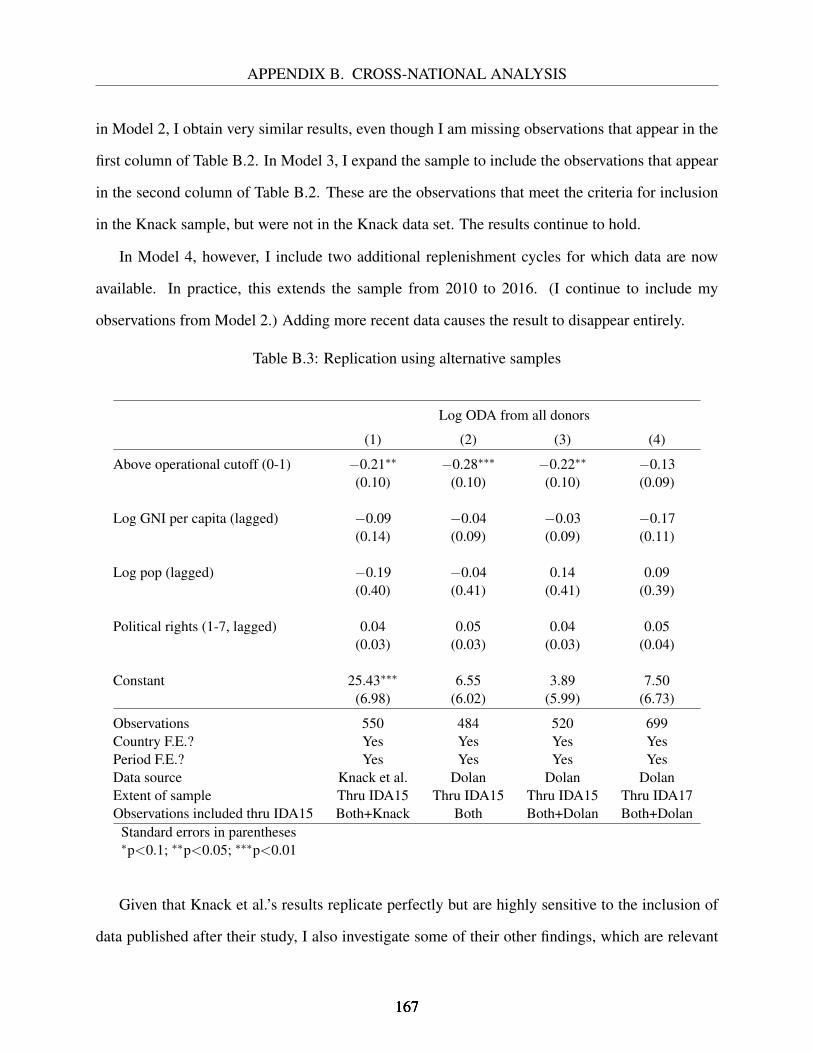
APPENDIX B. CROSS-NATIONAL ANALYSIS
in Model 2, I obtain very similar results, even though I am missing observations that appear in the
first column of Table B.2. In Model 3, I expand the sample to include the observations that appear
in the second column of Table B.2. These are the observations that meet the criteria for inclusion
in the Knack sample, but were not in the Knack data set. The results continue to hold.
In Model 4, however, I include two additional replenishment cycles for which data are now
available. In practice, this extends the sample from 2010 to 2016. (I continue to include my
observations from Model 2.) Adding more recent data causes the result to disappear entirely.
Table B.3: Replication using alternative samples
Log ODA from all donors
(1) (2) (3) (4)
Above operational cutoff (0-1) −0.21∗∗ −0.28∗∗∗ −0.22∗∗ −0.13(0.10) (0.10) (0.10) (0.09)
Log GNI per capita (lagged) −0.09 −0.04 −0.03 −0.17(0.14) (0.09) (0.09) (0.11)
Log pop (lagged) −0.19 −0.04 0.14 0.09(0.40) (0.41) (0.41) (0.39)
Political rights (1-7, lagged) 0.04 0.05 0.04 0.05(0.03) (0.03) (0.03) (0.04)
Constant 25.43∗∗∗ 6.55 3.89 7.50(6.98) (6.02) (5.99) (6.73)
Observations 550 484 520 699Country F.E.? Yes Yes Yes YesPeriod F.E.? Yes Yes Yes YesData source Knack et al. Dolan Dolan DolanExtent of sample Thru IDA15 Thru IDA15 Thru IDA15 Thru IDA17Observations included thru IDA15 Both+Knack Both Both+Dolan Both+Dolan
Standard errors in parentheses∗p<0.1; ∗∗p<0.05; ∗∗∗p<0.01
Given that Knack et al.’s results replicate perfectly but are highly sensitive to the inclusion of
data published after their study, I also investigate some of their other findings, which are relevant
167167167

B.1. Quantitative
for my argument. The authors also investigate the effects of the other thresholds that are included
in my study: the Low Income Country (LIC) ceiling, the historical cutoff, and the Lower-Middle
Income Country (LMIC) ceiling. They do so by including these other dummies in the regression
alongside the operational cutoff and find that each of these three other thresholds is not significant.
In Table B.4, I replicate their analysis on their sample (my data) and on my extended sample.
None of the other thresholds have any significance in the sample ending with IDA15. However,
the results change remarkably when we include observations through IDA17. Although the LIC
ceiling remains insignificant, the historical cutoff approaches significance, and the LMIC ceiling
is highly significant. These results hold regardless of whether the operational cutoff dummy is also
included.
Evidently, how donors respond to these thresholds changes over time. One possible explanation
for this is that the graduation process has become increasingly flexible in its application over time.
In other words, there are more countries that cross the operational cutoff but do not change lending
categories. If observers respond to lending categories, then the “treatment” of crossing the opera-
tional cutoff may attenuate. An alternative explanation is that other donors are less susceptible to
the bias than they once were.
168168168

APPENDIX B. CROSS-NATIONAL ANALYSIS
Tabl
eB
.4:R
eplic
atio
nus
ing
othe
rcut
offs
Log
OD
Afr
omal
ldon
ors
(1)
(2)
(3)
(4)
(5)
(6)
(7)
(8)
(9)
Abo
veop
erat
iona
lcut
off(
0-1)
−0.
26∗∗
−0.
18−
0.29
∗∗∗
−0.
13−
0.28
∗∗∗
−0.
18∗∗
(0.1
1)(0
.12)
(0.1
0)(0
.09)
(0.1
0)(0
.08)
Abo
veL
ICce
iling
(0-1
)−
0.05
0.08
−0.
01(0
.11)
(0.1
2)(0
.08)
Abo
vehi
scu
toff
(0-1
)−
0.14
−0.
28−
0.28
(0.1
1)(0
.18)
(0.1
8)
Abo
veL
MIc
eilin
g(0
-1)
0.02
−0.
42∗∗∗
−0.
37∗∗∗
(0.1
9)(0
.13)
(0.1
3)
Log
GN
Iper
capi
ta(l
agge
d)−
0.02
−0.
19∗
−0.
23∗∗
−0.
001
−0.
09−
0.14
−0.
04−
0.10
−0.
19∗∗
(0.0
9)(0
.11)
(0.1
1)(0
.09)
(0.1
3)(0
.11)
(0.0
9)(0
.09)
(0.0
8)
Log
pop
(lag
ged)
−0.
050.
080.
13−
0.12
−0.
09−
0.05
−0.
04−
0.07
0.01
(0.4
1)(0
.39)
(0.3
9)(0
.40)
(0.4
1)(0
.40)
(0.4
1)(0
.37)
(0.3
7)
Polit
ical
righ
ts(1
-7,l
agge
d)0.
05∗
0.05
0.05
0.05
0.05
0.05
0.05
0.05
0.05
(0.0
3)(0
.04)
(0.0
4)(0
.03)
(0.0
4)(0
.04)
(0.0
3)(0
.04)
(0.0
4)
Con
stan
t6.
577.
787.
097.
579.
979.
616.
499.
678.
89(6
.01)
(6.7
9)(6
.78)
(5.9
4)(6
.94)
(6.9
2)(6
.05)
(6.2
8)(6
.38)
Obs
erva
tions
484
699
699
484
699
699
484
699
699
Cou
ntry
F.E
.?Y
esY
esY
esY
esY
esY
esY
esY
esY
esPe
riod
F.E
.?Y
esY
esY
esY
esY
esY
esY
esY
esY
esE
xten
tofs
ampl
eT
hru
IDA
15T
hru
IDA
17T
hru
IDA
17T
hru
IDA
15T
hru
IDA
17T
hru
IDA
17T
hru
IDA
15T
hru
IDA
17T
hru
IDA
17
Stan
dard
erro
rsin
pare
nthe
ses
∗p<
0.1;
∗∗
p<0.
05;∗
∗∗
p<0.
01
169169169
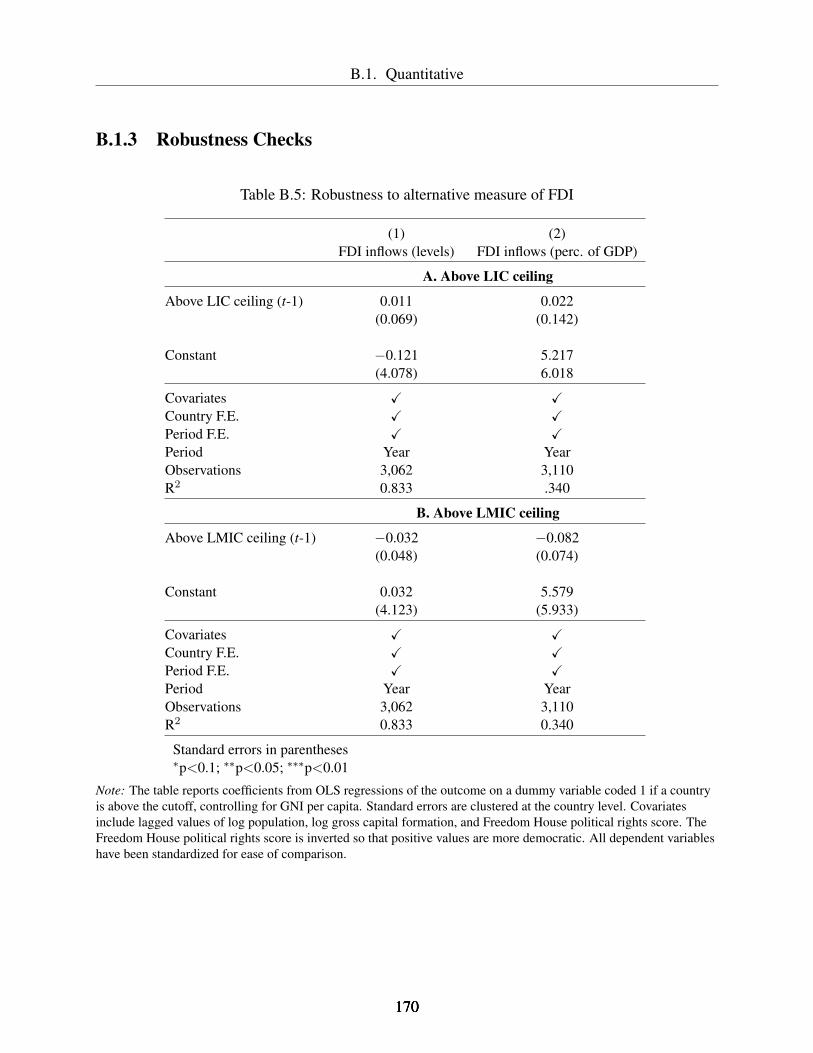
B.1. Quantitative
B.1.3 Robustness Checks
Table B.5: Robustness to alternative measure of FDI
(1) (2)FDI inflows (levels) FDI inflows (perc. of GDP)
A. Above LIC ceiling
Above LIC ceiling (t-1) 0.011 0.022(0.069) (0.142)
Constant −0.121 5.217(4.078) 6.018
Covariates X XCountry F.E. X XPeriod F.E. X XPeriod Year YearObservations 3,062 3,110R2 0.833 .340
B. Above LMIC ceiling
Above LMIC ceiling (t-1) −0.032 −0.082(0.048) (0.074)
Constant 0.032 5.579(4.123) (5.933)
Covariates X XCountry F.E. X XPeriod F.E. X XPeriod Year YearObservations 3,062 3,110R2 0.833 0.340
Standard errors in parentheses∗p<0.1; ∗∗p<0.05; ∗∗∗p<0.01
Note: The table reports coefficients from OLS regressions of the outcome on a dummy variable coded 1 if a countryis above the cutoff, controlling for GNI per capita. Standard errors are clustered at the country level. Covariatesinclude lagged values of log population, log gross capital formation, and Freedom House political rights score. TheFreedom House political rights score is inverted so that positive values are more democratic. All dependent variableshave been standardized for ease of comparison.
170170170

APPENDIX B. CROSS-NATIONAL ANALYSIS
Table B.6: Robustness to dropping Freedom House control
(1) (2) (3)Aid FDI inflows Creditworthiness
A. Above LIC ceiling
Above LIC ceiling (t-1) −0.013 0.014 .069(0.066) (0.067) (0.059)
Constant 2.733 −0.475 −3.244(5.308) (4.027) (3.864)
F.H. Covariate ∅ ∅ ∅Other Covariates X X XCountry F.E. X X XPeriod F.E. X X XPeriod 3-Year Year YearObservations 645 3,137 3,018R2 0.884 0.834 0.851
B. Above LMIC ceiling
Above LMIC ceiling (t-1) −0.233∗∗ −0.024 0.124∗
(0.109) (0.047) (0.064)
Constant 3.891 −0.395 −4.367(5.086) (4.068) (3.986)
F.H. Covariate ∅ ∅ ∅Other Covariates X X XCountry F.E. X X XPeriod F.E. X X XPeriod 3-Year Year YearObservations 645 3,137 3,018R2 0.885 0.834 0.851
Standard errors in parentheses∗p<0.1; ∗∗p<0.05; ∗∗∗p<0.01
Note: The table reports coefficients from OLS regressions of the outcome on a dummy variable coded 1 if a countryis above the cutoff, controlling for GNI per capita. Standard errors are clustered at the country level. Covariatesinclude lagged values of log population and log gross capital formation. All dependent variables have beenstandardized for ease of comparison.
171171171

B.1. Quantitative
Table B.7: Robustness to dropping all covariates
(1) (2) (3) (4)Aid FDI inflows Creditworthiness Democracy
A. Above LIC ceiling
Above LIC ceiling (t-1) −0.009 −0.010 0.061 0.127∗∗
(0.063) (0.062) (0.054) (0.064)
Constant 2.698∗∗∗ −3.424∗∗∗ −2.076∗∗∗ −1.291∗∗∗
(0.429) (0.236) (0.251) (0.296)
Covariates ∅ ∅ ∅ ∅Country F.E. X X X XPeriod F.E. X X X XPeriod 3-Year Year Year YearObservations 712 3,400 3,279 3,487R2 0.892 0.811 0.842 0.828
B. Above LMIC ceiling
Above LMIC ceiling (t-1) −0.261∗∗∗ 0.012 0.129∗∗ 0.034(0.089) (0.048) (0.063) (0.066)
Constant 2.526∗∗∗ −3.390∗∗∗ −1.987∗∗∗ −1.450∗∗∗
(0.342) (0.256) (0.254) (0.303)
Covariates ∅ ∅ ∅ ∅Country F.E. X X X XPeriod F.E. X X X XPeriod 3-Year Year Year YearObservations 712 3,400 3,279 3,487R2 0.894 0.811 0.843 0.828
Standard errors in parentheses∗p<0.1; ∗∗p<0.05; ∗∗∗p<0.01
Note: The table reports coefficients from OLS regressions of the outcome on a dummy variable coded 1 if a countryis above the cutoff, controlling for GNI per capita. Standard errors are clustered at the country level. In the aidregressions, the sample is restricted to countries that have ever benefited from IDA after 1987. All dependentvariables have been standardized for ease of comparison.
172172172

APPENDIX B. CROSS-NATIONAL ANALYSIS
Table B.8: Robustness to yearly observations of aid
(1) (2) (3)Aid Aid Aid
A. Above LIC ceiling
Above LIC ceiling (t-1) −0.022 −0.019(0.063) (0.055)
Above LIC ceiling (t-2) 0.013(0.049)
Constant 3.151 4.914 1.537(5.124) (4.211) (3.735)
Covariates X X XCountry F.E. X X XYear F.E. X X XPeriod 3-Year Period Year YearObservations 632 1,852 1,764R2 0.886 0.852 0.859
B. Above LMIC ceiling
Above LMIC ceiling (t-1) −0.246∗∗ −0.176∗∗
(0.107) (0.087)
Above LMIC ceiling (t-2) −0.134(0.088)
Constant 4.374 5.982 2.328(4.874) (4.080) (3.703)
Covariates X X XCountry F.E. X X XYear F.E. X X XPeriod 3-Year Period Year YearObservations 632 1,852 1,764R2 0.887 0.853 0.859
Standard errors in parentheses∗p<0.1; ∗∗p<0.05; ∗∗∗p<0.01
Note: The table reports coefficients from OLS regressions of the outcome on a dummy variable coded 1 if a countryis above the cutoff, controlling for GNI per capita. Standard errors are clustered at the country level. Covariatesinclude lagged values of log population, log gross capital formation, and Freedom House political rights score. Alldependent variables have been standardized for ease of comparison.
173173173

B.1. Quantitative
B.1.4 Alternative Model: Graduations
The baseline specification uses levels and holds gross national income (GNI) per capita constant to
identify the effect of being above a cutoff; an alternative approach is to use change scores and hold
changes in GNI per capita constant to identify the effect of crossing a cutoff. This specification
focuses on explaining year-to-year variation in how observers react to a single country’s change in
category, omitting the country-to-country variation in how observers react to countries just above
and just below a threshold.
To operationalize this, I take as my dependent variable the standardized difference between the
outcome in year t and in year t-1. I regress this change score on two dummy variables indicating
whether the country crossed the threshold from below (graduated) or above (reverse graduated)
since the previous year, and also the change in GNI per capita since the previous year. The main
estimands of interest are the coefficient on the graduation and reverse graduation terms. Consistent
with the main results, changes in income and classification are lagged by a year, so they take place
between year t-2 and year t-1 to produce changes in the outcome variable between year t-1 and
year t. I continue to include year fixed effects but remove country fixed effects since change scores
account for this.
Yi,t − Yi,t−1 = α + β1Graduatedi,t−1 + β2Reverse graduatedi,t−1
+ δ(log(GNIpc)i,t−1 − log(GNIpc)i,t−2) + τt + ε
(B.1)
The results appearing in Table B.9 suggest interesting similarities and differences with those
reported in the baseline specification. Consistent with the previous results, no threshold crossing
produces observable changes in net inflows of foreign direct investment (FDI) (column 2). Also
consistent with the previous results, graduating from LMIC to Upper-Middle Income Country
(UMIC) significantly improves perceptions of the country’s creditworthiness, and the effect is
174174174

APPENDIX B. CROSS-NATIONAL ANALYSIS
Table B.9: Effects of graduations and reverse graduations
(1) (2) (3) (4)Aid FDI inflows Creditworthiness Democracy
A. LIC to LMIC
Graduated −0.048 −0.035 −0.056 −0.019(0.104) (0.172) (0.169) (0.090)
Reverse graduated 0.140 0.185 0.098 −0.216(0.180) (0.200) (0.248) (0.222)
Log GNIpc change −0.142 0.024 1.320∗∗∗ 0.061(0.148) (0.137) (0.180) (0.161)
Constant −0.202∗∗∗ 0.030 −0.317∗∗∗ −0.135(0.065) (0.094) (0.096) (0.132)
Covariates ∅ ∅ ∅ ∅Country F.E. ∅ ∅ ∅ ∅Period F.E. X X X XPeriod 3-Year Year Year YearObservations 606 3,125 1,994 3,277R2 0.074 0.042 0.188 0.011
B. LMIC to UMIC
Graduated 0.090 0.115 0.365∗∗ 0.235∗
(0.222) (0.101) (0.181) (0.141)
Reverse graduated −0.103 0.012 0.340(0.118) (0.189) (0.249)
Log GNIpc change −0.185∗ −0.023 1.254∗∗∗ 0.085(0.133) (0.141) (0.184) (0.167)
Constant −0.196∗∗∗ 0.032 −0.314∗∗∗ −0.137(0.063) (0.094) (0.097) (0.133)
Covariates ∅ ∅ ∅ ∅Country F.E. ∅ ∅ ∅ ∅Period F.E. X X X XPeriod 3-Year Year Year YearObservations 606 3,125 1,994 3,277R2 0.073 0.042 0.190 0.012
Standard errors in parentheses∗p<0.1; ∗∗p<0.05; ∗∗∗p<0.01
Note: Dependent variables are change scores between year t and year t-1 and are standardized for ease of comparison.Independent variables (graduation indicators and change in GNI per capita) refer to the transition between year t-1and year t-2. In the aid regressions, the sample is restricted to countries that have ever benefited from IDA after 1987.Since change scores are used for the dependent variable, no imputations are made in the creditworthiness variable.
175175175
B.2. Qualitative
larger and more significant than in the baseline specification (column 3). This suggests that the
variation we observed in the baseline specification is primarily driven by credit raters reacting to
news of a country’s graduation as a positive signal, rather than comparing countries side-by-side.
Column 4 shows results that differ from the baseline model but are also consistent with Hypothesis
3: In these results, crossing the LMIC threshold but not the LIC threshold influences democracy
scores. In contrast with the baseline model, neither graduation produces a reaction from donors.
This suggests that the previous findings are better explained by donors allocating scarce resources
in favor of lower-income countries, rather than reacting to changes in country classifications. This
explanation in fact supports the strategic logic, which is rooted in the idea that donors must defend
the allocation of scarce resources.
B.2 Qualitative
176176176
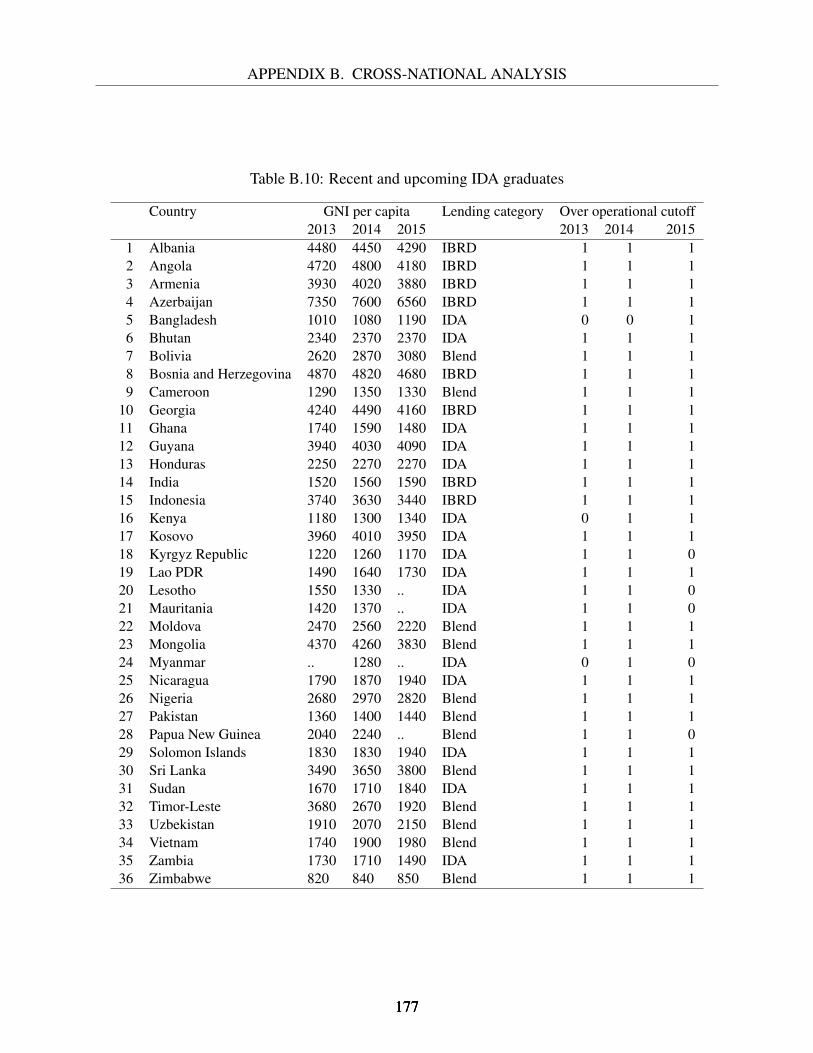
APPENDIX B. CROSS-NATIONAL ANALYSIS
Table B.10: Recent and upcoming IDA graduates
Country GNI per capita Lending category Over operational cutoff2013 2014 2015 2013 2014 2015
1 Albania 4480 4450 4290 IBRD 1 1 12 Angola 4720 4800 4180 IBRD 1 1 13 Armenia 3930 4020 3880 IBRD 1 1 14 Azerbaijan 7350 7600 6560 IBRD 1 1 15 Bangladesh 1010 1080 1190 IDA 0 0 16 Bhutan 2340 2370 2370 IDA 1 1 17 Bolivia 2620 2870 3080 Blend 1 1 18 Bosnia and Herzegovina 4870 4820 4680 IBRD 1 1 19 Cameroon 1290 1350 1330 Blend 1 1 1
10 Georgia 4240 4490 4160 IBRD 1 1 111 Ghana 1740 1590 1480 IDA 1 1 112 Guyana 3940 4030 4090 IDA 1 1 113 Honduras 2250 2270 2270 IDA 1 1 114 India 1520 1560 1590 IBRD 1 1 115 Indonesia 3740 3630 3440 IBRD 1 1 116 Kenya 1180 1300 1340 IDA 0 1 117 Kosovo 3960 4010 3950 IDA 1 1 118 Kyrgyz Republic 1220 1260 1170 IDA 1 1 019 Lao PDR 1490 1640 1730 IDA 1 1 120 Lesotho 1550 1330 .. IDA 1 1 021 Mauritania 1420 1370 .. IDA 1 1 022 Moldova 2470 2560 2220 Blend 1 1 123 Mongolia 4370 4260 3830 Blend 1 1 124 Myanmar .. 1280 .. IDA 0 1 025 Nicaragua 1790 1870 1940 IDA 1 1 126 Nigeria 2680 2970 2820 Blend 1 1 127 Pakistan 1360 1400 1440 Blend 1 1 128 Papua New Guinea 2040 2240 .. Blend 1 1 029 Solomon Islands 1830 1830 1940 IDA 1 1 130 Sri Lanka 3490 3650 3800 Blend 1 1 131 Sudan 1670 1710 1840 IDA 1 1 132 Timor-Leste 3680 2670 1920 Blend 1 1 133 Uzbekistan 1910 2070 2150 Blend 1 1 134 Vietnam 1740 1900 1980 Blend 1 1 135 Zambia 1730 1710 1490 IDA 1 1 136 Zimbabwe 820 840 850 Blend 1 1 1
177177177

178
APPENDIX C. EXPERIMENTAL ANALYSIS
Appendix C
Experimental Analysis
C.1 Recruitment E-mail
Researchers from Columbia University want to know what you think about foreign aid! We will be offering free food and coffee at eateries near the ICSD conference to every individual who completes our 15 minute survey.
Choose EITHER a $5 Starbucks gift card OR a free prepared salad from Sweetgreen, redeemable during Monday's lunch break. Both Starbucks and Sweetgreen are just across the street from Lerner Hall. The survey also includes the chance to win your choice of subscriptions to Financial Times, The New York Times, Foreign Affairs, or JSTOR.
Researchers will also be available at ICSD to administer the survey in person. Please note that the survey cannot be taken on a mobile device (phone or tablet). We apologize for any inconvenience and hope to hear your thoughts when you are back at your computer.
Follow this link to the Survey: ${l://SurveyLink?d=Take the Survey}
Or copy and paste the URL below into your internet browser: ${l://SurveyURL} Follow the link to opt out of future emails: ${l://OptOutLink?d=Click here to unsubscribe}
179179179
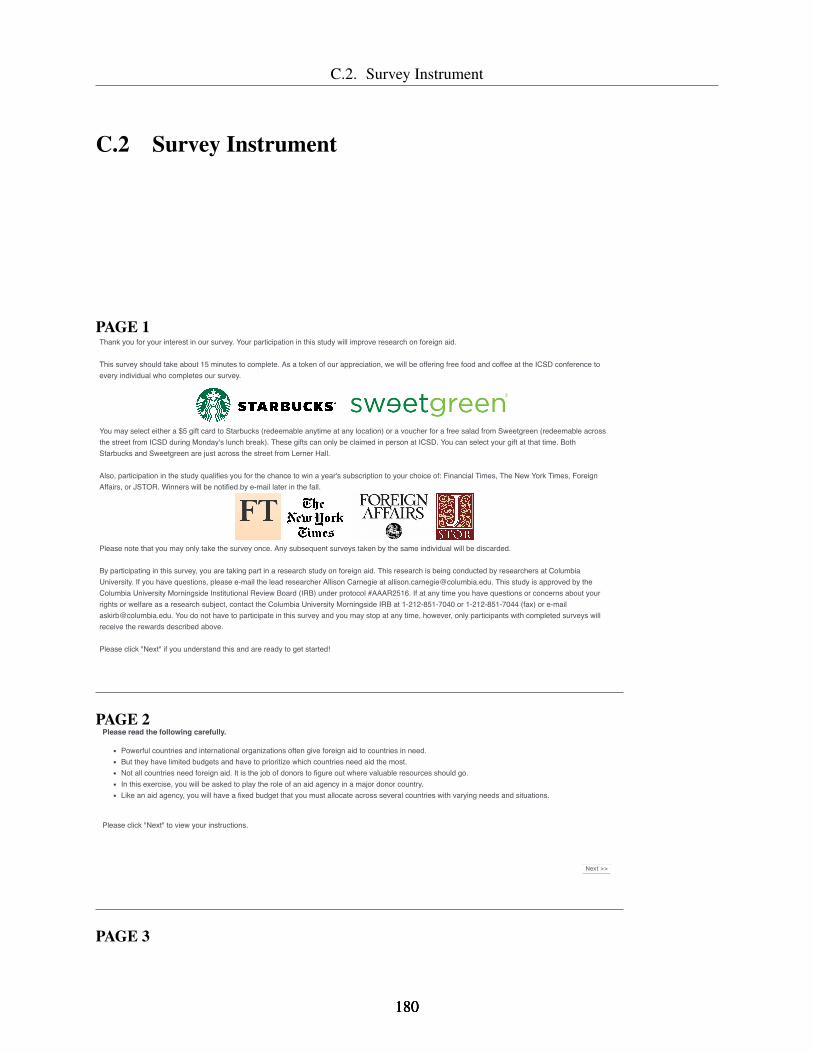
C.2. Survey Instrument
C.2 Survey Instrument
PAGE 1
2/17/2018 Online Survey Software | Qualtrics Survey Solutions
https://columbia.az1.qualtrics.com/jfe/preview/SV_3q0fpOHAsMltX9j?Q_CHL=preview 1/1
Powered by Qualtrics
Thank you for your interest in our survey. Your participation in this study will improve research on foreign aid. This survey should take about 15 minutes to complete. As a token of our appreciation, we will be offering free food and coffee at the ICSD conference toevery individual who completes our survey.
You may select either a $5 gift card to Starbucks (redeemable anytime at any location) or a voucher for a free salad from Sweetgreen (redeemable acrossthe street from ICSD during Monday's lunch break). These gifts can only be claimed in person at ICSD. You can select your gift at that time. BothStarbucks and Sweetgreen are just across the street from Lerner Hall.
Also, participation in the study qualifies you for the chance to win a year's subscription to your choice of: Financial Times, The New York Times, ForeignAffairs, or JSTOR. Winners will be notified by e-mail later in the fall.
Please note that you may only take the survey once. Any subsequent surveys taken by the same individual will be discarded.
By participating in this survey, you are taking part in a research study on foreign aid. This research is being conducted by researchers at ColumbiaUniversity. If you have questions, please e-mail the lead researcher Allison Carnegie at [email protected]. This study is approved by theColumbia University Morningside Institutional Review Board (IRB) under protocol #AAAR2516. If at any time you have questions or concerns about yourrights or welfare as a research subject, contact the Columbia University Morningside IRB at 1-212-851-7040 or 1-212-851-7044 (fax) or [email protected]. You do not have to participate in this survey and you may stop at any time, however, only participants with completed surveys willreceive the rewards described above. Please click "Next" if you understand this and are ready to get started!
Close Preview Restart Survey
Ní %� Place Bookmarkî È
PAGE 2
2/17/2018 Online Survey Software | Qualtrics Survey Solutions
https://columbia.az1.qualtrics.com/jfe/preview/SV_3q0fpOHAsMltX9j?Q_CHL=preview 1/1
Powered by Qualtrics
Please read the following carefully.
Powerful countries and international organizations often give foreign aid to countries in need.But they have limited budgets and have to prioritize which countries need aid the most.Not all countries need foreign aid. It is the job of donors to figure out where valuable resources should go.In this exercise, you will be asked to play the role of an aid agency in a major donor country.Like an aid agency, you will have a fixed budget that you must allocate across several countries with varying needs and situations.
Please click "Next" to view your instructions.
Close Preview Restart Survey
Ní %� Place Bookmarkî È
PAGE 3
180180180
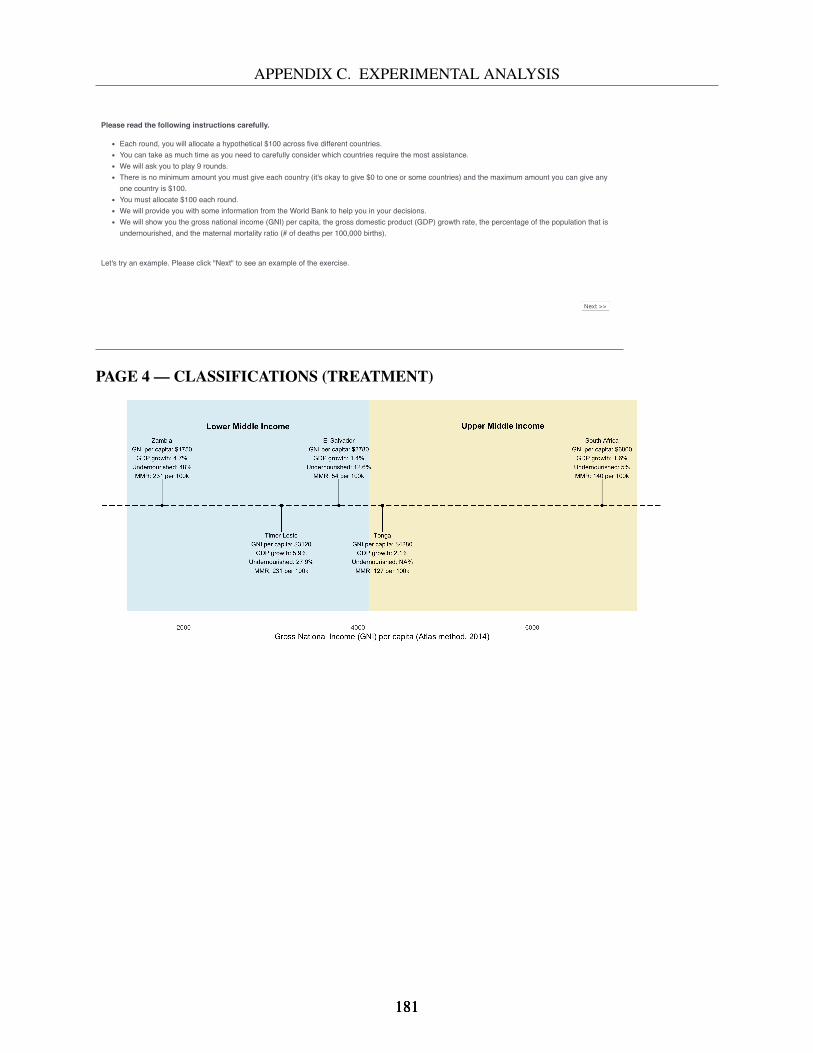
APPENDIX C. EXPERIMENTAL ANALYSIS2/17/2018 Online Survey Software | Qualtrics Survey Solutions
https://columbia.az1.qualtrics.com/jfe/preview/SV_3q0fpOHAsMltX9j?Q_CHL=preview 1/1
Powered by Qualtrics
Please read the following instructions carefully.
Each round, you will allocate a hypothetical $100 across five different countries.You can take as much time as you need to carefully consider which countries require the most assistance.We will ask you to play 9 rounds.There is no minimum amount you must give each country (it's okay to give $0 to one or some countries) and the maximum amount you can give anyone country is $100.You must allocate $100 each round.We will provide you with some information from the World Bank to help you in your decisions.We will show you the gross national income (GNI) per capita, the gross domestic product (GDP) growth rate, the percentage of the population that isundernourished, and the maternal mortality ratio (# of deaths per 100,000 births).
Let's try an example. Please click "Next" to see an example of the exercise.
Close Preview Restart Survey
Ní %� Place Bookmarkî È
PAGE 4 — CLASSIFICATIONS (TREATMENT)
181181181

C.2. Survey Instrument2/17/2018 Online Survey Software | Qualtrics Survey Solutions
https://columbia.az1.qualtrics.com/jfe/preview/SV_3q0fpOHAsMltX9j?Q_CHL=preview 1/1
Powered by Qualtrics
After reviewing the profiles above, carefully find each country's name in the list below and in the box next to it, record your desired allocation.
This is an example round only. Your answers to this question will be discarded. Here are your instructions again, if you need to review them.
Each round, you will allocate a hypothetical $100 across five different countries.
You can take as much time as you need to carefully consider which countries require the most assistance.
We will ask you to play 9 rounds.
There is no minimum amount you must give each country (it's okay to give $0 to one or some countries) and the maximum amount you can give any
one country is $100.
You must allocate $100 each round.
We will provide you with some information from the World Bank to help you in your decisions.
We will show you the gross national income (GNI) per capita, the gross domestic product (GDP) growth rate, the percentage of the population that is
undernourished, and the maternal mortality ratio (# of deaths per 100,000 births).
El Salvador 0
Zambia 0
Tonga 0
South Africa 0
Timor-Leste 0
Total 0
Close Preview Restart Survey
Ní %� Place Bookmarkî È
[NOTE: ORDER OF COUNTRIES LISTED IN RESPONSE BOX IS RANDOMIZED.]
[NOTE: PLACEMENT OF YELLOW/BLUE ON LEFT/RIGHT IS RANDOMIZED.]
PAGE 4 — NO CLASSIFICATIONS (CONTROL)
182182182

APPENDIX C. EXPERIMENTAL ANALYSIS2/17/2018 Online Survey Software | Qualtrics Survey Solutions
https://columbia.az1.qualtrics.com/jfe/preview/SV_3q0fpOHAsMltX9j?Q_CHL=preview 1/1
Powered by Qualtrics
After reviewing the profiles above, carefully find each country's name in the list below and in the box next to it, record your desired allocation.
This is an example round only. Your answers to this question will be discarded. Here are your instructions again, if you need to review them.
Each round, you will allocate a hypothetical $100 across five different countries.
You can take as much time as you need to carefully consider which countries require the most assistance.
We will ask you to play 9 rounds.
There is no minimum amount you must give each country (it's okay to give $0 to one or some countries) and the maximum amount you can give any
one country is $100.
You must allocate $100 each round.
We will provide you with some information from the World Bank to help you in your decisions.
We will show you the gross national income (GNI) per capita, the gross domestic product (GDP) growth rate, the percentage of the population that is
undernourished, and the maternal mortality ratio (# of deaths per 100,000 births).
El Salvador 0
Zambia 0
Tonga 0
South Africa 0
Timor-Leste 0
Total 0
Close Preview Restart Survey
Ní %� Place Bookmarkî È
[NOTE: ORDER OF COUNTRIES LISTED IN RESPONSE BOX IS RANDOMIZED.]
PAGE 5 — NO JUDGES (CONTROL)
PAGE 5 — JUDGES (TREATMENT)
183183183

C.2. Survey Instrument
PAGES 6-14 — SAME AS PAGE 4 WITH UNIQUELY GENERATED GRAPHICS
PAGE 15
2/17/2018 Online Survey Software | Qualtrics Survey Solutions
https://columbia.az1.qualtrics.com/jfe/preview/SV_3q0fpOHAsMltX9j?Q_CHL=preview 1/1
The aid allocation part of the survey is now complete. We would now like to ask you just a few questions about yourself.
What is your age?
What is your gender?
What is the highest level of education you have received?
How would you describe your current professional position?
Please mark any professional positions you have previously held.
Female
Male
Other
Doctoral degree
Masters degree
Bachelor degree
High school degree
Other
Prefer not to say
I work for a government
I work for a development partner or international organization
I work for a NGO/CSO
I work for a think tank/university
I work in the private sector
I am a graduate student studying development-related issues
I am a graduate student studying issues unrelated to development
I am an undergraduate student
Other
Prefer not to say
I have worked for a government
I have worked for a development partner or international organization
I have worked for a NGO/CSO
I have worked for a think tank/university
I have worked in the private sector
Other
None of the above
Prefer not to say
Close Preview Restart Survey
Ní %� Place Bookmarkî È
184184184

APPENDIX C. EXPERIMENTAL ANALYSIS2/17/2018 Online Survey Software | Qualtrics Survey Solutions
https://columbia.az1.qualtrics.com/jfe/preview/SV_3q0fpOHAsMltX9j?Q_CHL=preview 1/1
How many years of professional experience do you have in international development?
Which statement do you agree with more?
What does a GINI coefficient measure?
DFID is an aid agency of which national government?
What is your race?
What country are you from?
How would you describe your political views?
None
1-4
5-9
10-14
15-20
20 or more years
Prefer not to say
In general, it is most important to do what you think is best, regardless of what you have promised others you would do
In general, it is most important to do what you have promised others you would do, regardless of what you think is best
Corruption
State fragility
Inequality
Democracy
Don't know
UK
Japan
France
Germany
Don't know
White/Caucasian
African American
Hispanic
Asian
Native American
Pacific Islander
Other
Prefer not to say
Very liberal Liberal Somewhat liberal Neither liberal norti
Somewhatconservative Conservative Very conservative
Close Preview Restart Survey
Ní %� Place Bookmarkî È
185185185

C.2. Survey Instrument
2/17/2018 Online Survey Software | Qualtrics Survey Solutions
https://columbia.az1.qualtrics.com/jfe/preview/SV_3q0fpOHAsMltX9j?Q_CHL=preview 1/1
Powered by Qualtrics
DFID is an aid agency of which national government?
What is your race?
What country are you from?
How would you describe your political views?
Below are two real statements and their real authors. Please mark if you believe the statement contains a grammatical error. You can mark bothstatements, neither statement, or just one statement. Only respondents who answer this question correctly will be entered into our lottery to receive a subscription prize.
UK
Japan
France
Germany
Don't know
White/Caucasian
African American
Hispanic
Asian
Native American
Pacific Islander
Other
Prefer not to say
Very liberal Liberal Somewhat liberal Neither liberal norconservative
Somewhatconservative Conservative Very conservative
Neither the State Department nor the United Nations know why this is the case,
but experts have speculated that many Syrian Christians are moving toLebanon.
Check here if there is a grammatical error in this statement.
Though the terminology and process is (wildly, needlessly) complex, the adviceis simple for anyone wanting to borrow $25,000: Take out federal student loans
from the government.
Check here if there is a grammatical error in this statement.
Close Preview Restart Survey
Ní %� Place Bookmarkî È
[NOTE: ORDER OF MOST RESPONSE ITEMS IS RANDOMIZED.]
PAGE 16
186186186

APPENDIX C. EXPERIMENTAL ANALYSIS2/17/2018 Online Survey Software | Qualtrics Survey Solutions
https://columbia.az1.qualtrics.com/jfe/preview/SV_3q0fpOHAsMltX9j?Q_CHL=preview 1/1
Powered by Qualtrics
You are on the last page of the survey. We would like to just ask you a few questions about how you approached this activity.
Please briefly describe how you made your allocation decisions in this activity.
What factors did you consider in your allocation decisions? (Check any that apply.)
Do you think a person who knows very little about development would agree with your decisions? Why or why not?
Whether a country is "Lower Middle Income" or "Upper Middle Income"
A country's GNI per capita
How many people in a country are undernourished
A country's strategic importance
How my allocation decisions would be judged by others
Whether a country is in Africa
A country's population
A country's level of democracy
Whether a country is a small island state
A country's GDP growth
None of these factors
Other factors
No
Yes
Close Preview Restart Survey
Ní %� Place Bookmarkî È
PAGE 17
2/17/2018 Online Survey Software | Qualtrics Survey Solutions
https://columbia.az1.qualtrics.com/jfe/preview/SV_3q0fpOHAsMltX9j?Q_CHL=preview 1/1
Powered by Qualtrics
The survey is now complete. Thank you for participating in our study! To claim your Starbucks gift card or Sweetgreen salad voucher, please visit our booth near the registration desk at ICSD on Monday or Tuesday. Salads will beavailable while supplies last. If you plan to select a Sweetgreen salad, you must collect your voucher by 3pm on Monday. Starbucks gift cards will be availableboth days. You will be notified by e-mail if you have won a subscription. You can select your subscription at that time. Losers will not be notified. If you have any questions or comments about the study, please e-mail Co-PI Lindsay Dolan at [email protected].
Please avoid discussing the survey with anyone else until the conclusion of ICSD. Thanks and have a great day.
Close Preview Restart Survey
Ní %� Place Bookmarkî È
C.3 Randomization Checks
187187187

C.3. Randomization Checks
Table C.1: Countries used to generate graphics
Position (in terms of GNIpc)1st 2nd 3rd (Threshold) 4th 5th
Honduras Sri Lanka Georgia Bosnia and Herzegovina MaldivesVietnam Indonesia Mongolia Ecuador AzerbaijanGhana Guatemala Paraguay Macedonia Namibia
Uzbekistan Micronesia Albania Jamaica PeruMoldova Congo Angola Algeria SerbiaBolivia Nigeria Belize Thailand BelarusBhutan Morocco Jordan Tuvalu ColombiaKiribati Philippines Tunisia Dominican Republic Botswana
Papua New Guinea Ukraine Guyana Cuba Iraq
Table C.2: Random assignment to treatment conditions
ClassificationsTreatment Control
Treatment 66 52
Judg
es
Control 60 54
Table C.3: Balance tests
Classifications Judges
overall mean diff-in-means p-value diff-in-means p-valueFemale (0-1) 0.62 0.07 0.30 -0.04 0.55
Age 28.19 0.01 0.05 0.00 0.95Education (1-4) 2.44 0.02 0.70 -0.03 0.51
Development experience (1-6) 1.77 -0.03 0.44 0.01 0.76
188188188
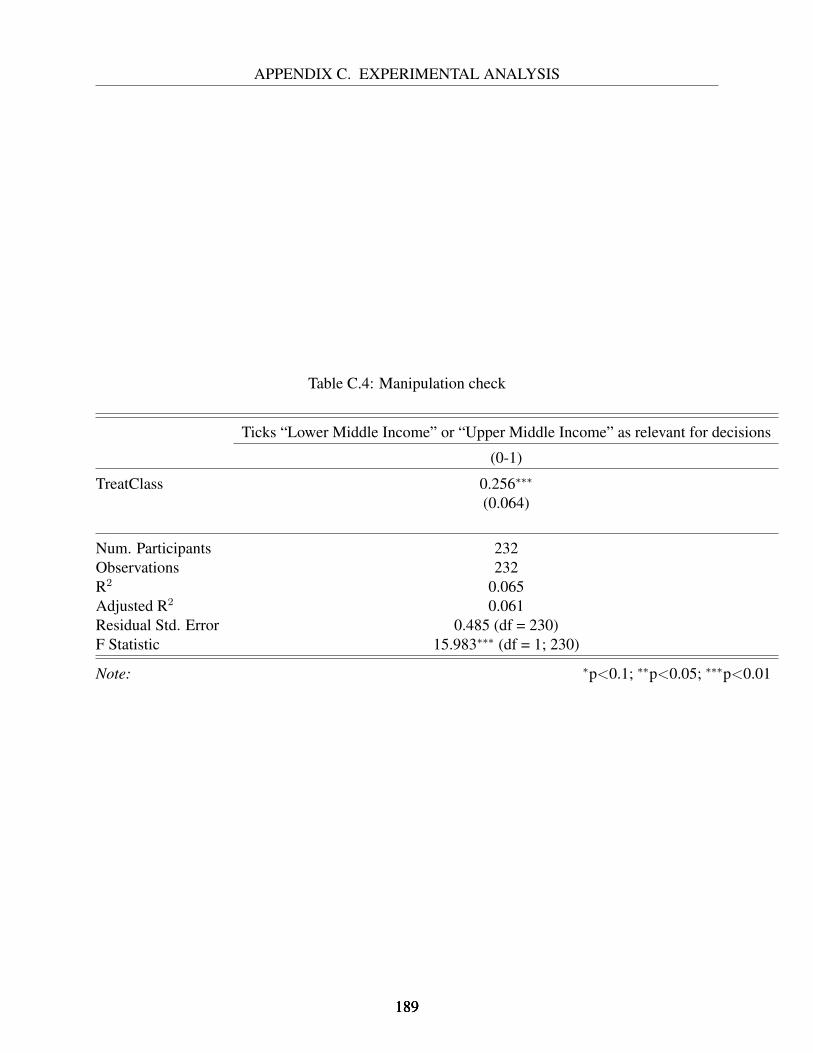
APPENDIX C. EXPERIMENTAL ANALYSIS
Table C.4: Manipulation check
Ticks “Lower Middle Income” or “Upper Middle Income” as relevant for decisions
(0-1)
TreatClass 0.256∗∗∗
(0.064)
Num. Participants 232Observations 232R2 0.065Adjusted R2 0.061Residual Std. Error 0.485 (df = 230)F Statistic 15.983∗∗∗ (df = 1; 230)
Note: ∗p<0.1; ∗∗p<0.05; ∗∗∗p<0.01
189189189
Appendix D
Sub-National Analysis
Below are the template questionnaires that guided the interviews in Nepal and Botswana. These
questions served as a departure point rather than as a script for conversations. Generally speaking,
I posed all of the questions to government officials and to policy experts, who would be able
to speak about (if only generally) the various effects of graduation on different groups. When
speaking with representatives from civil society and the business community, I focused only on the
questions most relevant for those groups.
In all interviews, I began by grounding our conversation in key facts about the country’s status.
In most cases, respondents were already familiar with these facts, but they served to establish my
credibility and refresh participants’ memories about the details. I carefully avoided priming my
respondents in any way to think positively or negatively about graduation. All respondents were
asked about both challenges and opportunities in graduation.
D.1 Nepal Interviews
I’d like to start by establishing three facts about LDC graduation.
• Nepal met the eligibility criteria on 2 indicators (Human Assets and Economic Vulnerability)in 2015. If it meets these criteria again in 2018, it will be eligible to graduate in 2022.
190

APPENDIX D. SUB-NATIONAL ANALYSIS
• Graduation does not follow automatically from eligibility. The CDP must consult with Nepaland make a recommendation for graduation.
• According to the most recent plan of the National Planning Commission, Nepal intends toseek graduation in 2022.
1. Based on your experiences, to what extent do you approve or disapprove of Nepal’s commit-ment to graduating from the LDC category, and why? (Members of NPC! (NPC!):
• What are the main reasons for the NPC’s commitment to seeking graduation?
• Although Nepal is eligible to graduate, some NPC representatives have argued thatsuch a graduation would not be “meaningful” unless Nepal met the income criterion.What is the reason for this?)
2. What are the main benefits that Nepal is likely to experience as a result of its graduation?
3. What are the main challenges that Nepal is likely to experience as a result of its graduation?
4. What groups are most likely to benefit from Nepal’s graduation, and what groups are mostlikely to lose?
5. I’d like to ask you four short questions about graduation from the LDC category. Would yousay that graduating from the “LDC” category will (increase/decrease/will not affect). . .
• Nepal’s ability to attract foreign aid from multilateral and bilateral donors?
• Nepal’s ability to attract foreign investment?
• ratings of Nepal’s creditworthiness?
• ratings of Nepal’s democracy?
6. Nepal needs to obtain a per capita income of $1,025 to be classified by the World Bank asa “lower-middle income country.” Many have argued that this threshold should be raisedso that countries like Nepal will have to demonstrate greater economic success before theyare called “middle-income countries.” Based on your experiences, to what extent do youapprove or disapprove of this idea, and why?
D.2 Botswana Interviews
Botswana is one of the few countries that have graduated from the UN’s “Least Developed Coun-try” category, and it did so in 1994. It has been classified by the World Bank as a “Middle IncomeCountry” since before then.
191191191
D.2. Botswana Interviews
1. What benefits, if any, have these graduations brought to Botswana (or particular groupswithin Botswana)?
2. Have these graduations created any obstacles for Botswana (or for particular groups withinBotswana)?
3. I’d like to ask you four short questions about Botswana’s experience as a LDC graduate andMiddle Income Country in the global economy.
• Would you say that being a LDC graduate and Middle Income Country has (increased/decreased/hasnot affected) Botswana’s ability to attract foreign aid from multilateral and bilateraldonors?
• Would you say that being a LDC graduate and Middle Income Country has (increased/decreased/hasnot affected) Botswana’s ability to attract foreign investment?
• Would you say that being a LDC graduate and Middle Income Country has (increased/decreased/hasnot affected) ratings of Botswana’s creditworthiness?
• Would you say that being a LDC graduate and Middle Income Country has (increased/decreased/hasnot affected) ratings of Botswana’s democracy?
192192192

Appendix E
Analysis of Data Manipulation
Revisions to gross national income (GNI) are frequently significant enough to influence a country’sclassification. I compare the classifications that countries received based on the best availableestimates at the time with the estimates that they would have received given our estimates today.In Table E.1, I find 288 country-years spanning dozens of countries are “misclassified,” that is, theclassifications they received would have been incorrect given the current state of knowledge. Thisalone is not sufficient evidence of manipulation, as such revisions could be perfectly benign, but itdoes point to the significance of income revisions in determining classifications.
Table E.1: “Mis”-classifications
De facto Ex post Country-years CountriesUnderestimated economies
L LM 73 30LM UM 106 43UM H 49 19
228 92Overestimated economies
LM L 32 17UM LM 22 11H UM 6 1
60 29
193
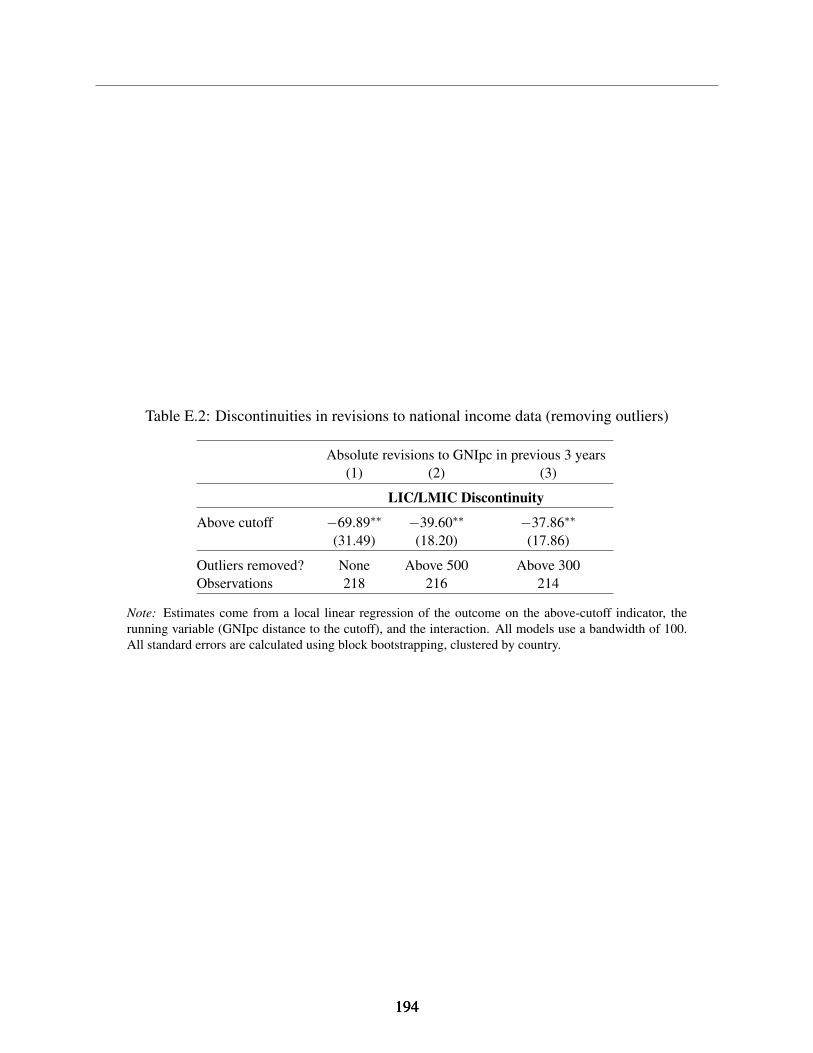
Table E.2: Discontinuities in revisions to national income data (removing outliers)
Absolute revisions to GNIpc in previous 3 years(1) (2) (3)
LIC/LMIC Discontinuity
Above cutoff −69.89∗∗ −39.60∗∗ −37.86∗∗
(31.49) (18.20) (17.86)
Outliers removed? None Above 500 Above 300Observations 218 216 214
Note: Estimates come from a local linear regression of the outcome on the above-cutoff indicator, therunning variable (GNIpc distance to the cutoff), and the interaction. All models use a bandwidth of 100.All standard errors are calculated using block bootstrapping, clustered by country.
194194194