Embed Size (px)
Citation preview

The Political Economy of Gram Panchayats
in South India: Results and Policy Conclusions From a Research Project
The World Bank July 2005

ii
ABBREVIATIONS AND ACRONYMS
AP Andhra Pradesh BP Block Panchayat BPL Below Poverty Line CEO Chief Executive Officer CFC Center Finance Commission CSS Centrally Sponsored Schemes DDP Desert Development Program DEA Department of Economic Affairs DPC District Planing Committee DRDA District Rural Development Agency EAS Employment Assurance System EGS Education Guarantee Scheme EO Executive Officer GOI Government of India GP Gram Panchayat GS Gram Sabha IAS Indian Administrative Service IRDP Integrated Rural Development
Program JRY Jawahar Rozgar Yojana JSGY Jawahar Gram Samridhi Yojana KA Karnataka
KE Kerala MLA Member of Legislative Assembly MLC Member of Legislative Council MP Member of Parliament; NGO Non-governmental Organization OBC Other Backward Caste PRI Panchayat Raj Institution PS Panchayat Samitis SAS State Administrative Service SC/ST Scheduled Caste/Scheduled Tribe SFC State Finance Commission SGSY Swarnjanyanti Gram Swarozgar
Yojana TAD Tribal Area Development TN Tamil Nadu UNDP United Nations Development
Program VEC Village Education Committee VTC Voluntary Technical Experts and
Core ZP Zilla Parishad
Vice President : Praful C. Patel Country Director : Michael Carter Sector Director : Connie Bernard Sector Manager : Adolfo Brizzi Task Manager : Vijayendra Rao
ii
GRAM PANCHAYATS IN SOUTH INDIA: A Report on a Research Project
TABLE OF CONTENTS
Acknowledgements…………………………………………..……………………………….....iv Executive Summary………………………………………………………………………..…....v I. Introduction……………………………………………………………………...…….....1 II. Panchayats and Resource Allocation: A Comparison of the Indian States……….…3
Tables and Maps for Section 2..................................................................................6 Map 1………………………………………………………………………………….6
Table 2.1: Political Participation......................................................………………….7 Table 2.2: Gram Sabha Participation………………………………………………..8 Table 2.3: Public Goods Levels……………………......................………………….9 Table 2.4: GP Activity, from PRA…………………………………………………10 Table 2.5: Private Benefits….………………………………………………………11 Table 2.6: Village Level Participation………………………………………………12 Table 2.7: Household Willingness to Pay…………………………………………...13 Table 2.8: Inequality and Caste Domination……………………………………...14
III. Caste Reservations and the Politics of Public Good Provision……………..….15 Household Level Evidence…………....……………………………………………..16 Village Level Evidence…………………….…………………….………………….16 Tables for Section 3....................................................................................................18 Table 3.1: Summary Statistics......................................................…………………..18 Table 3.2: Effect of SC/ST Reservation on Resource Allocation…………….……..19
IV. Gram Sabhas and Political Participation…………………………………..……20 Determinants of holding a Gram Sabha and who attends……………………….21 Does Participation Matter?..........................................................................................22 Tables for Section 4....................................................................................................24 Table 4.1: Descriptive Statistics......................................................………………...24 Table 4.2: Gram Sabha: Occurrence and Attendance…………...………….……..25 Table 4.3: Gram Sabha Occurrence and Beneficiary Selection...…………….……..26
V. Political Selection and the Quality of Government…………………………………..27 Political Selection…………………..…….………………………………………….28 Policy Effects………………………………..……………….………………………29 Summarizing the results on Political Selection……………….……………….……30 Tables for Section 5....................................................................................................31 Table 5.1: Descriptive Statistics......................................................……...…………31 Table 5.2: Individual Characteristics and Politician Selection………..…………….32 Table 5.3: Village Characteristics and Politician Selection........... ...……………….33

iii
Table 5.4: Politician Characteristics and Beneficiary Selection…….………………34 Table 5.5: Village Characteristics and Beneficiary Selection for BPL cards……….35
VI. Policy Implications…………...……………………………….…………………………..36
References……………………………………………………………………..…………...……38 Annex A: Panchayats and Resource AllocationAnnex B: The Politics of Public Good ProvisionAnnex C: Participatory Democracy in ActionAnnex D: Political Selection and the Quality of Government

iv
ACKNOWLEDGMENTS
This report was jointly authored by Timothy Besley of the London School of Economics, Rohini Pande of Yale University and Vijayendra Rao of the Development Economics Research Group at the World Bank. Radu Ban and Jillian Waid provided excellent research assistance. It was supervised by the South Asia Rural Development Department of the World Bank under themanagement of Adolfo Brizzi. The research underlying the report was co-funded by the South Asia Rural Development Department, the Development Research Group of the World Bank, and the Department for International Development (DFID) of the United Kingdom. Valuable comments were provided by peer reviewers - Ruth Alsop, Rob Chase and Brian Levy, and by Adolfo Brizzi, Stephen Howes and Dina Umali Dieninger. The project benefited greatly from Luis Constantino’sguidance and support.

v
EXECUTIVE SUMMARY
1. Our aim in this report is to summarize the results from a research project on Panchayat Decentralization, and draw some policy implications. The project is an effort to understand the political economy and institutional context of village government in India with a focus on the South Indian states of Andhra Pradesh, Karnataka, Kerala and Tamil Nadu. 2. We use a unique sampling design constructed to control for differences in institutional history and cultural differences by comparing villages on either side of the border of these states which belonged to the same political entity prior to 1956 (when the states were reorganized along linguistic lines). The sample of districts and villages selected is given in Map 1. Using this method, we examine the implications of cross-state and within-state differences in demographics, social structure and administrative and political organization for Panchayat performance. Kerala leads the four south Indian states in levels of civic engagement and literacy. In terms of social organization Karnataka villages have the highest levels of upper caste domination with Karnataka voters far more likely than those in other states to vote on caste or religious lines in Panchayat elections. In terms of administrative set up Tamil Nadu has relatively low levels of autonomy and funding available to Gram Panchayats (GPs) – power is more concentrated in higher levels of government. 3. Kerala leads in the provision of public goods at the village level. But its GPs are perceived by their constituents to have current levels of investment in public goods that are lower than the other South Indian states. Tamil Nadu, on the other hand, has the lowest provision of public goods in our sample, though its GPs are perceived to have higher levels of current activity than those in Kerala. The variation in GP performance across states that we observe seems to mirror findings from the World Bank study on panchayat finances. 4. The results suggest therefore that Kerala’s successes in promoting civic consciousness, along with fiscal and political decentralization, might have had real implications for better public service delivery. The current fiscal problems faced by the state may be contributing to the perceived slippage in the effectiveness of its GPs. These state level comparisons, however, cannot establish causal connections on the reasons behind the observed differences, including the important question of whether the Kerala model can be replicated in the other states. Here our more detailed analysis of the political economy of panchayats, which focuses more on examining variations within blocks/taluks, may be more instructive. 5. We examine the impact of caste reservations finding that when an SC/ST household resides in a village which has been reserved for an SC/ST pradhan they are 7 per cent more likely to obtain targeted benefits. This demonstrates that caste reservations help by improving the access of disadvantaged groups to government programs. It mirrors other research that has shown that women’s reservations improve the match between policy choices and the preferences of women. Thus, reservations seem to be a valuable tool to reduce traditional forms of discrimination in local government. 6. Our results on gram sabhas and political participation also have implications for policy. We find that gram sabhas are often not held regularly (25 per cent of GPs did not have

vi
even one gram sabha in the previous year), and even when they are held beneficiary selection is discussed only in 22 per cent. They are more likely to be held in larger villages with higher literacy rates. Interestingly, after conditioning on these variables, we find no state differences in the propensity to hold gram sabhas. However, we note that only 20 per cent of our household respondents have ever attended a gram sabha, with village literacy again associated with both hearing of and attending the meeting. The meetings are less likely to be attended by women, highlighting potentially important gender differences in participation. In contrast, SC/STs and landless are more likely to attend them. Furthermore, illiterates, landless and SC/STs are more likely to attend gram sabhas in villages which have higher levels of literacy. This again suggests the positive externalities from living in more literate communities. 7. We find that, when gram sabhas are held, there may be some policy benefits; Gram sabhas are associated with a better chance that landless, illiterate, and SC/ST households will obtain a BPL cards. However, while these results are suggestive we cannot conclude that they are causal. Similar results, but with weaker effects, are obtained when the village is more literate. 8. The gram sabha results are suggestive of the key role that they could play in improving the quality of panchayat government. But we find that they are often not held, and even they are held are not well attended with key issues not discussed. The findings suggest that more research into the nature and impact of gram sabhas is warranted, but the greater transparency that they engender could have positive implications. 9. The overall structure of the GP is important. The South Indian states differ in the administrative makeup of GPs, especially the number of villages per GP. We find evidence of cross village inequality in public good provision in a GP with the Pradhan’s village receiving more resources. 10. The final section examines the political economy of political selection and the determinants of politician quality. This section has three key findings. First, the political class is selected on the basis of political connections and economic advantage. Second, politicians exhibit a preference for people from their own social group in service delivery and are, on the whole, opportunistic and benefit disproportionately from public transfer programs. Third, the education level of politicians has a consistently positive effect on selection and a negative effect on opportunism. This suggests that more educated politicians are better and recognized as such by voters. However, whether education matters directly or because it is correlated with other characteristics that make an individual fit for public office cannot be discerned from our results. Nonetheless, the results add to a growing appreciation among economists that education may be important because of its role in inculcating civic values. The unique observation about its role in politics given here also offers a fresh perspective on the value of human capital investments in low income countries. 11. The results demonstrate important interplays between village level variables, the process of political selection, and the targeting of public resources. For example, increased literacy at the village level reduces political opportunism while measures of political dominance are correlated with worse targeting of resources. We also find evidence suggestive of barriers to

vii
entry – land ownership and political connections predict selection but not behavior when in office. 12. Our finding that educated politicians are better in terms of actual performance suggests that it is important to focus on factors that select better politicians as a step toward improving the quality of government. More generally, the results and analyses in the paper reinforce the observation that formal institutions of democracy are no guarantee of effective government. It is essential that preconditions exist for sorting in the right kinds of people – the talented, the virtuous and those who give political voice to the disadvantaged. There is clearly much more we can learn about this process, but these results are a first effort to study the issue empirically. 13. To summarize, we can draw the following lessons for policy from these findings:
a. Caste Reservations work by improving targeting of private transfers to schedule castes and tribes. We find that programs that provide private benefits such as toilets, housing and transfers to the poor and disadvantaged (including provision of BPL card) are more likely to reach SC/STs when the GP has a Pradhan that is reserved for an SC/ST. This suggests that caste reservations are effective in including disadvantaged groups into the purview of local government. It supplements previous research that finds that woman Pradhans in seats reserved for women tend to make decisions more in line with the needs of women. b. Pradhans prefer their home village: The home village of the pradhan tends to receive more high-spillover public goods than other villages in the GP controlling for factors such as village size and head quarter status. This result, a consequence of the incentives that underlie democracy, points to inequalities that may exist within GPs that could be persistent and may be important to address. c. Gram Sabhas may be central to effective local government but are not regularly held: When gram sabhas are held we find that benefits are better targeted to the poor and disadvantaged, and reduce political opportunism. Therefore they seem to improve the transparency of government. Further research will have to determine how this works and their implications for public goods allocation, but clearly they are potentially central to the effective and equitable functioning of GPs. The fact that they are often not held is worrying and needs attention. Also, while SC/STs are more likely to participate in gram sabhas, presumably because of their role in beneficiary selection, we find that women are far less likely to attend them. This is a potential source of gender exclusion that needs attention. d. Literacy Matters: Several results point to the importance of village literacy in improving the functioning of GPs – in reducing political opportunism, improving targeting, etc. We also find that more educated politicians are less opportunistic. Therefore, investments in human capital can be central to improving the quality of democratic governance in addition to their enhancing individual well-being.
viii
e. Finance Matters Corroborating findings from the recent World Bank report on fiscal decentralization in India (World Bank, 2004), we find that differences in the quality of local government between the four South Indian states are correlated with what we know of their levels of fiscal decentralization. In particular, Kerala has led the other states in providing public services at the local level but seems to be slipping more recently in a manner that concurs with its worsening fiscal situation. More generally we find that it is very difficult to understand the state of GP finances because of vast inconsistencies in accounting practices at the GP level. GP budgetary data is therefore very difficult to obtain and even when it is available is difficult to compare and evaluate. f. Socio-Cultural Institutions Matter We show that villages demonstrate high levels of inequality within them, and that this is inequality is both within and between castes. We find evidence showing that caste dominance tends to increase political opportunism. g. Higher salaries may reduce opportunism A result with direct policy implications is that relatively higher real wages for politicians tend to attract wealthier politicians, and improve beneficiary selection suggesting reduced political opportunism.
14. These findings provide some important insights into the political economy and the institutional setting for panchayats. In future research we hope to examine the role of land reform in reducing economic and social inequality, and the quality of government. We will also examine the determinants and implications of social, economic and political participation.

1. INTRODUCTION
1.1 The 73rd amendment to the Indian constitution, passed in 1993, has been one of the most important pieces of legislation in recent Indian history. Its goals are:
a) To systematize the functioning of Panchayati Raj Institutions (PRIs) by mandating regular elections to the three tiers of local government, and requiring states to both increase PRIs taxation and spending power, and PRIs allocation of state and central discretionary funds. At the same time there is an effort to improve the transparency of local government by requiring that gram sabhas or village councils be held at regular intervals, between four to six times a year, to discuss budgetary allocations, select beneficiaries and conduct other important panchayat business.
b) To ensure that disadvantaged groups within village communities are granted a voice in
local deliberations, the 73rd amendment also mandated that 1/3rd of all elected positions in Panchayats, including Panchayat president, be reserved for women. Similarly elected positions in Panchayats are to be reserved for Scheduled Castes and Tribes in proportion to their population share
1.2 All national governments since 1993 have been committed to the implementation of the amendment, and state governments have complied with varying degrees of commitment. The current United Progressive Alliance (UPA) government in Delhi has gone even further by substantially increasing panchayat budgets and possibly giving them the authority to administer important schemes like the Employment Guarantee Scheme. 1.3 This experiment in decentralization is, arguably, one of the most ambitious innovations in local government undertaken by a low income country. The stated aim is to improve citizens' ability to access and influence the public service delivery system and to directly tackle social exclusion by a system of political reservations. Despite the breadth of this democratic experiment, there is remarkably little quantitative evidence on how well the experiment has worked. There is, however, a large and growing qualitative and "action research" literature on Panchayats that come to a diverse set of conclusions - reflecting the difficulties of studying such a broad topic in a complex country. A comprehensive review of this literature is beyond the scope of this report but overviews can be found in World Bank (2000), Matthew and Buch (2000), and Crook and Manor (1998). 1.4 Quantitative analyses of Panchayats using large samples are rarer, however. An exception is the important work by Chattopadhyay and Duflo (2004a) on the causal impact of women's reservations on Panchayat action in Rajasthan and West Bengal. They find that reservations improve the ability of women to govern, in a way that is congruent with the desires of women in the population. Work by Alsop, Krishna and Sjoblom (2000), also on Rajasthan and Madhya Pradesh, highlights the role of reservation in reducing the systematic exclusion of women and disadvantaged groups from decision making processes at the local level. Bardhan and Mookherjee (2003) examine the role of elected village councils in affecting land reform in the Indian state of West Bengal, and Foster and Rosenzweig (2001) examine how decentralization interacts with land ownership patterns to affect public good outcomes. Finally,
1

Chaudhuri and Heller (2004) have, more recently, completed a survey studying the impact of the "People's Campaign for Decentralized Planning" in Kerala showing that it increased the level of participatory planning in panchayats, had a positive impact on development performance and on social inclusion, but that levels of participation have declined in recent years - findings that are consistent with our study. 1.5 But, given the scope of the experiment and regional focus of the existing quantitative work, a large number of open questions remain. How does the political economy of village democracy really work? What determines the quality of village politicians? How well has decentralization worked in early adopter states such as Kerala and Karnataka? What is the impact of caste reservations? Do village meetings open to all citizens (Gram Sabhas) succeed in increasing the voice of the poor and disadvantaged? Answering these questions is crucial in formulating Panchayat policy. 1.6 The above questions also point to a need for a sound, quantitative evidentiary base to provide some answers to these questions. This motivates the research that underlies this report. 1.7 The report is based on four research papers (“Panchayats and Resource Allocation: A Comparison of the South Indian States,” “The Politics of Public Good Provision: Evidence from Indian Local Governments,” “Participatory Democracy in Action: Survey Evidence from India," and “Political Selection and the Quality of Government: Evidence from South India”). We will summarize each of them, and then draw on the findings to discuss their implications for policy. We aim in these summaries to provide a sense of our findings using basic econometric tools, but for details on the theory and empirical methodology underlying our results we refer the readers to the actual papers. The actual papers can be found in the Annexes A-D.
2

2. PANCHAYATS AND RESOURCE ALLOCATION: A COMPARISON OF THE INDIAN STATES1
2.1 The four states in our sample provide an interesting contrast in their approach to panchayat decentralization. Kerala has taken decentralization the furthest among them, with forty percent of state expenditures mandated to be allocated to panchayats, with regular gram sabhas and high levels of citizen participation. Karnataka has also been a pioneer in panchayat decentralization, and was the first Indian state to mandate regular panchayat elections. Andhra Pradesh, under the former Chief Minister Chandrababu Naidu tried to find alternatives to the panchayat system via the Janmabhoomi program. Tamil Nadu, of all the states in our sample, has probably the weakest gram panchayats with much of the power held by higher levels of government. 2.2 An important question that remains in understanding the relative impact of the decentralization process in these four states is the extent to which their political history and social structure have affected the functioning of local governments. There is considerable evidence demonstrating that the Travancore region that is currently part of the state of Kerala has a long history of progressive policies (Jeffrey, 1993). Similarly Mysore state which is currently part of the state of Karnataka was also ruled by relatively autonomous rulers who placed a special emphasis on education and economic development (Bhagavan, 2003). Recent work by Banerjee and Iyer (2003) has shown that there are strong path dependencies in land tenure policies - specifically whether the region of India had a zamindari or ryotwari system in place during British Rule. These systems which were established early in the 19th century are shown to have significant contemporary impacts on a variety of indicators of development. Furthermore, scholars have argued that differences in cultural systems can have an important effect of human development (e.g. Dyson and Moore, 1983). Given these path-dependencies and the cultural differences, it is possible that Kerala is different because "Kerala is Kerala". There is something special about the state that makes it particularly hospitable to good, equitable governance. If such path -dependencies prove to be definitive, then policy options are likely to be relatively small. 2.3 The sampling strategy employed by this research project allows us to compare the states, controlling for differences that may come from historical or cultural path-dependencies. Details of the sampling strategy are available in the paper in the Appendix, but, in brief, we compare villages on either side of the current borders of the four states which belonged to the same political entity prior to the state’s reorganization in 1956. These villages have additionally been matched by majority language. Map 1 shows the districts that were selected, with each dot representing a village. Since, the villages across each pair of borders share a common history till 1956, and speak the same majority language, any differences we observe between the matched villages cannot be because of different political histories prior to 1956, or because of different language - which proxy for local kinship structure and social organization2. The differences have to be attributed to changes that have occurred after 1956. The comparison is particularly 1 This section summarizes results from the paper Tim Besley, Rohini Pande and Vijayendra Rao. “Panchayats and Resource Allocation: A Comparison of the South Indian States,” mimeo, 2005 2 Kolar district in Karnataka is an exception since it was part of old Mysore state, it was selected, however, because it shares large cultural affinities with Chithoor district in AP and Dharmapuri in Tamil Nadu.
3
interesting because the states provide an excellent comparison of differences in the implementation of the 73rd amendment. 2.4 What do we learn from our results? First, they provide more information on different aspects of Kerala's sophisticated political culture. Table 2.1 presents these results. Kerala has the highest voter turnout in all types of election among the four states. Households in Kerala are most likely to participate in political activities. Furthermore, Kerala’s electorate is among the least likely to vote for candidates based on caste or religious lines and most likely to vote based on party lines. Kerala has a more active civic culture with active participation in gram sabhas (See Chaudhuri and Heller (2004) for more on gram sabhas in Kerala) as is seen in Table 2.2. Table 2.2 also reveals an interesting composition effect: while having the highest gram sabha attendance, Kerala has at the same time the lowest attendance for beneficiary selection. This may imply that in Kerala, gram sabhas are devoted to more substantial issues. In addition, those attending the Gram Sabha in Kerala are much more likely to speak during the meeting than those in other states. Levels of land inequality are high in Kerala, as measured by the average fraction of landless households in a village, in table 2.8. However, the fraction of villages in which the upper caste holds the majority of the land is lowest in Kerala. This implies that land inequality is less likely to be driven by caste based inequality than in the other states. Kerala, perhaps influenced by this active political culture, also dominates the other states in the availability of public goods, as reflected in Table 2.3. However, all our indicators of current investments on public goods by the panchayats are lower in Kerala than in the other states (Table 2.4). Similarly we find that Kerala lags behind Andhra Pradesh in the provision of BPL cards and behind other states in public works programs (Table 2.5). To some extent this is because of Kerala's higher levels of development and lower levels of poverty. But, other evidence from the World Bank's fiscal decentralization study (World Bank, 2004) suggests that fiscal constraints have reduced the availability of funds to panchayats resulting in lower levels of GP activity. 2.5 Tamil Nadu GPs in our sample are at the other end. They lag all the other states in the provision of most public goods (other than water tanks and bus stops, Table 2.3). More importantly, current levels of activity by GPs are also below other states as seen in Table 2.4. This is also true in the provision of private benefits such as BPL cards, housing and electricity (Table 2.5). On the other hand, villagers in Tamil Nadu, are second only to those in Kerala in their political and civic participation - they are more likely to vote than villagers in AP and Karnataka, and more likely to pay taxes (Tables 2.1, and respectively 2.2). 2.6 It is interesting to note that the remaining two states, Karnataka and AP are rather similar, despite purported efforts in AP to circumvent the panchayat system. Since KA has been far ahead of AP in promoting democratic decentralization, it is interesting that this has not led to large differences in the provision of public goods (except for paved roads, Table 2.3), or indeed even in current GP activity in public goods provision (Table 2.4). On private benefits Karnataka leads all the states in overall activism - particularly in the provision of toilets and electricity. But AP leads the states in providing BPL cards and public works projects. Karnataka is the most likely state to have an NGO active in the village, but it is also the least likely to have held a gram sabha in the last six months (Table 2.6) - which can largely be attributed to drought conditions in
4
the state at the time of the survey. However, even though AP faced the same climatic conditions, it was far more likely than Karnataka to have held gram sabhas. 2.7 There are also some interesting results on the willingness to pay for public services shown in Table 2.7. Here we see that households in Kerala are much more likely to say that they are willing to pay more for public services across the board. We also observe a greater willingness to pay for public services in TN compared to the Andhra Pradesh and Karnataka. Note also that in the means, we see that in all the states except KA close to 50% of our respondents say that they are willing to pay more for one or more public services. While willingness to pay questions have important flaws, these results suggest a large gap between the demand and supply of service provision. They also point to a potential for increased participation by villagers in public good provision. 2.8 Finally, it is also interesting to note the strong caste influences in Karnataka. Karnataka villages have the highest proportion of land owned by upper castes (36 per cent, as given in Table 2.8). Perhaps as a consequence, Karnataka voters are far more likely than those in other states to vote along caste or religious lines. 2.9 Having explored broad patterns of differences across the states that reflect differences in state policies since 1956, in the next three sections we turn to a detailed examination of the political economy of panchayats.
5

Map 1: Sampling Strategy
6
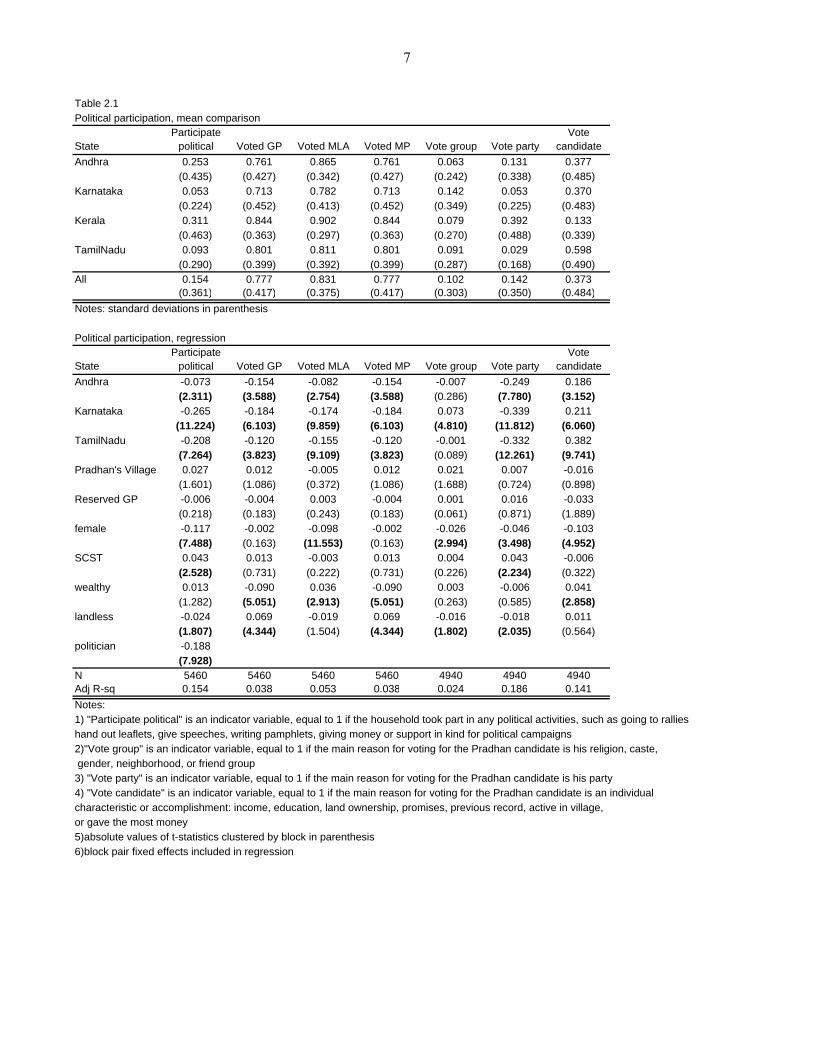
Table 2.1Political participation, mean comparison
StateParticipate
political Voted GP Voted MLA Voted MP Vote group Vote partyVote
candidateAndhra 0.253 0.761 0.865 0.761 0.063 0.131 0.377
(0.435) (0.427) (0.342) (0.427) (0.242) (0.338) (0.485)Karnataka 0.053 0.713 0.782 0.713 0.142 0.053 0.370
(0.224) (0.452) (0.413) (0.452) (0.349) (0.225) (0.483)Kerala 0.311 0.844 0.902 0.844 0.079 0.392 0.133
(0.463) (0.363) (0.297) (0.363) (0.270) (0.488) (0.339)TamilNadu 0.093 0.801 0.811 0.801 0.091 0.029 0.598
(0.290) (0.399) (0.392) (0.399) (0.287) (0.168) (0.490)All 0.154 0.777 0.831 0.777 0.102 0.142 0.373
(0.361) (0.417) (0.375) (0.417) (0.303) (0.350) (0.484)Notes: standard deviations in parenthesis
Political participation, regression
StateParticipate
political Voted GP Voted MLA Voted MP Vote group Vote partyVote
candidateAndhra -0.073 -0.154 -0.082 -0.154 -0.007 -0.249 0.186
(2.311) (3.588) (2.754) (3.588) (0.286) (7.780) (3.152)Karnataka -0.265 -0.184 -0.174 -0.184 0.073 -0.339 0.211
(11.224) (6.103) (9.859) (6.103) (4.810) (11.812) (6.060)TamilNadu -0.208 -0.120 -0.155 -0.120 -0.001 -0.332 0.382
(7.264) (3.823) (9.109) (3.823) (0.089) (12.261) (9.741)Pradhan's Village 0.027 0.012 -0.005 0.012 0.021 0.007 -0.016
(1.601) (1.086) (0.372) (1.086) (1.688) (0.724) (0.898)Reserved GP -0.006 -0.004 0.003 -0.004 0.001 0.016 -0.033
(0.218) (0.183) (0.243) (0.183) (0.061) (0.871) (1.889)female -0.117 -0.002 -0.098 -0.002 -0.026 -0.046 -0.103
(7.488) (0.163) (11.553) (0.163) (2.994) (3.498) (4.952)SCST 0.043 0.013 -0.003 0.013 0.004 0.043 -0.006
(2.528) (0.731) (0.222) (0.731) (0.226) (2.234) (0.322)wealthy 0.013 -0.090 0.036 -0.090 0.003 -0.006 0.041
(1.282) (5.051) (2.913) (5.051) (0.263) (0.585) (2.858)landless -0.024 0.069 -0.019 0.069 -0.016 -0.018 0.011
(1.807) (4.344) (1.504) (4.344) (1.802) (2.035) (0.564)politician -0.188
(7.928)N 5460 5460 5460 5460 4940 4940 4940Adj R-sq 0.154 0.038 0.053 0.038 0.024 0.186 0.141Notes:1) "Participate political" is an indicator variable, equal to 1 if the household took part in any political activities, such as going to rallieshand out leaflets, give speeches, writing pamphlets, giving money or support in kind for political campaigns2)"Vote group" is an indicator variable, equal to 1 if the main reason for voting for the Pradhan candidate is his religion, caste, gender, neighborhood, or friend group 3) "Vote party" is an indicator variable, equal to 1 if the main reason for voting for the Pradhan candidate is his party4) "Vote candidate" is an indicator variable, equal to 1 if the main reason for voting for the Pradhan candidate is an individual characteristic or accomplishment: income, education, land ownership, promises, previous record, active in village, or gave the most money5)absolute values of t-statistics clustered by block in parenthesis6)block pair fixed effects included in regression
7
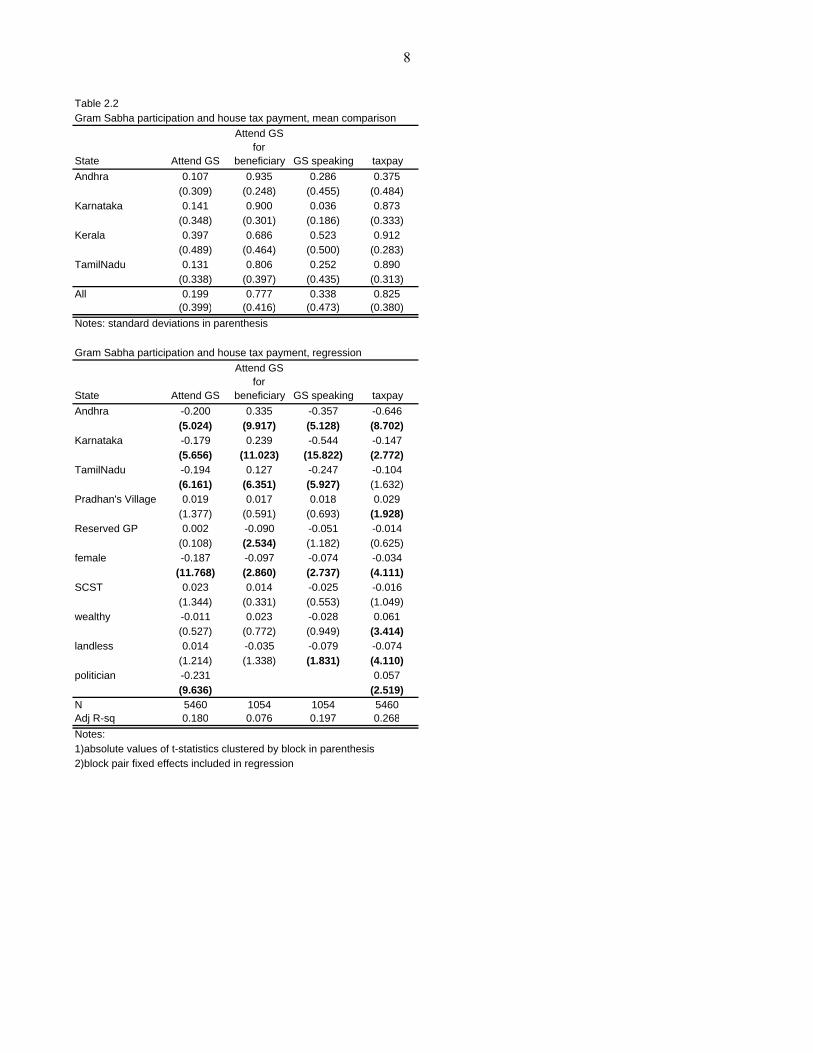
Table 2.2Gram Sabha participation and house tax payment, mean comparison
State Attend GS
Attend GS for
beneficiary GS speaking taxpayAndhra 0.107 0.935 0.286 0.375
(0.309) (0.248) (0.455) (0.484)Karnataka 0.141 0.900 0.036 0.873
(0.348) (0.301) (0.186) (0.333)Kerala 0.397 0.686 0.523 0.912
(0.489) (0.464) (0.500) (0.283)TamilNadu 0.131 0.806 0.252 0.890
(0.338) (0.397) (0.435) (0.313)All 0.199 0.777 0.338 0.825
(0.399) (0.416) (0.473) (0.380)Notes: standard deviations in parenthesis
Gram Sabha participation and house tax payment, regression
State Attend GS
Attend GS for
beneficiary GS speaking taxpayAndhra -0.200 0.335 -0.357 -0.646
(5.024) (9.917) (5.128) (8.702)Karnataka -0.179 0.239 -0.544 -0.147
(5.656) (11.023) (15.822) (2.772)TamilNadu -0.194 0.127 -0.247 -0.104
(6.161) (6.351) (5.927) (1.632)Pradhan's Village 0.019 0.017 0.018 0.029
(1.377) (0.591) (0.693) (1.928)Reserved GP 0.002 -0.090 -0.051 -0.014
(0.108) (2.534) (1.182) (0.625)female -0.187 -0.097 -0.074 -0.034
(11.768) (2.860) (2.737) (4.111)SCST 0.023 0.014 -0.025 -0.016
(1.344) (0.331) (0.553) (1.049)wealthy -0.011 0.023 -0.028 0.061
(0.527) (0.772) (0.949) (3.414)landless 0.014 -0.035 -0.079 -0.074
(1.214) (1.338) (1.831) (4.110)politician -0.231 0.057
(9.636) (2.519)N 5460 1054 1054 5460Adj R-sq 0.180 0.076 0.197 0.268Notes:1)absolute values of t-statistics clustered by block in parenthesis2)block pair fixed effects included in regression
8
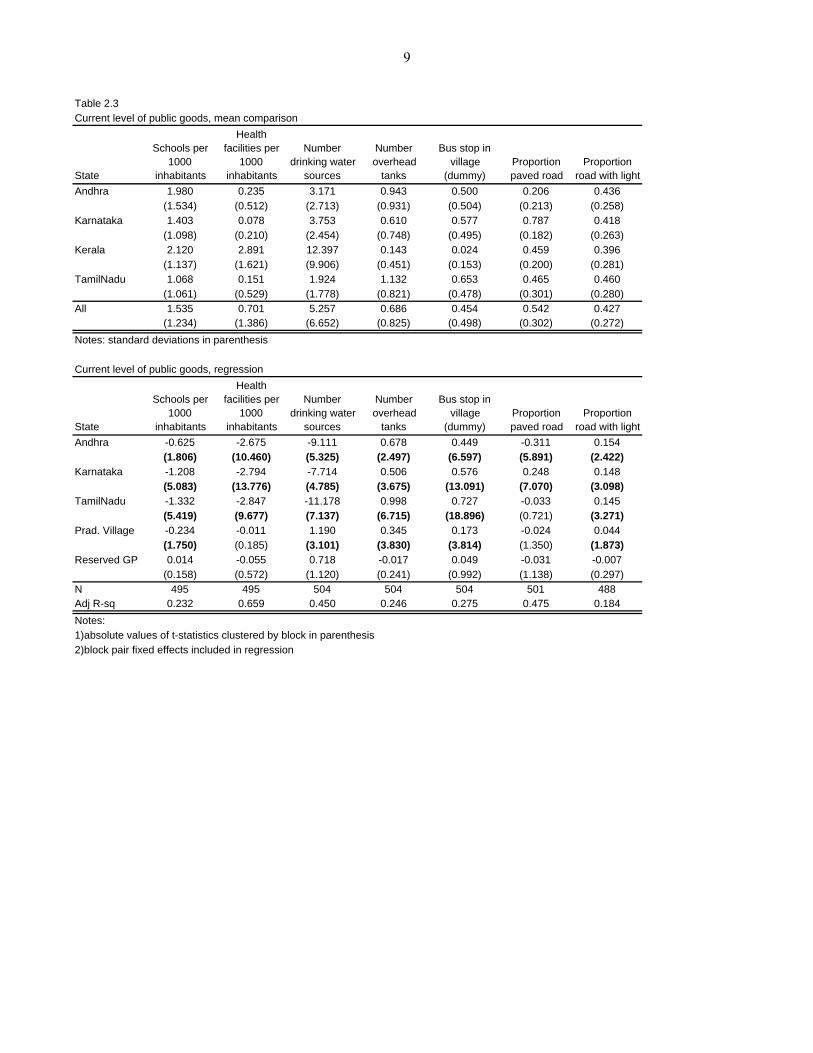
Table 2.3Current level of public goods, mean comparison
State
Schools per 1000
inhabitants
Health facilities per
1000 inhabitants
Number drinking water
sources
Number overhead
tanks
Bus stop in village
(dummy)Proportion paved road
Proportion road with light
Andhra 1.980 0.235 3.171 0.943 0.500 0.206 0.436(1.534) (0.512) (2.713) (0.931) (0.504) (0.213) (0.258)
Karnataka 1.403 0.078 3.753 0.610 0.577 0.787 0.418(1.098) (0.210) (2.454) (0.748) (0.495) (0.182) (0.263)
Kerala 2.120 2.891 12.397 0.143 0.024 0.459 0.396(1.137) (1.621) (9.906) (0.451) (0.153) (0.200) (0.281)
TamilNadu 1.068 0.151 1.924 1.132 0.653 0.465 0.460(1.061) (0.529) (1.778) (0.821) (0.478) (0.301) (0.280)
All 1.535 0.701 5.257 0.686 0.454 0.542 0.427(1.234) (1.386) (6.652) (0.825) (0.498) (0.302) (0.272)
Notes: standard deviations in parenthesis
Current level of public goods, regression
State
Schools per 1000
inhabitants
Health facilities per
1000 inhabitants
Number drinking water
sources
Number overhead
tanks
Bus stop in village
(dummy)Proportion paved road
Proportion road with light
Andhra -0.625 -2.675 -9.111 0.678 0.449 -0.311 0.154(1.806) (10.460) (5.325) (2.497) (6.597) (5.891) (2.422)
Karnataka -1.208 -2.794 -7.714 0.506 0.576 0.248 0.148(5.083) (13.776) (4.785) (3.675) (13.091) (7.070) (3.098)
TamilNadu -1.332 -2.847 -11.178 0.998 0.727 -0.033 0.145(5.419) (9.677) (7.137) (6.715) (18.896) (0.721) (3.271)
Prad. Village -0.234 -0.011 1.190 0.345 0.173 -0.024 0.044(1.750) (0.185) (3.101) (3.830) (3.814) (1.350) (1.873)
Reserved GP 0.014 -0.055 0.718 -0.017 0.049 -0.031 -0.007(0.158) (0.572) (1.120) (0.241) (0.992) (1.138) (0.297)
N 495 495 504 504 504 501 488Adj R-sq 0.232 0.659 0.450 0.246 0.275 0.475 0.184Notes:1)absolute values of t-statistics clustered by block in parenthesis2)block pair fixed effects included in regression
9

Tabl
e 2.
4G
P a
ctiv
ity, m
eans
com
paris
on
Sta
teO
vera
ll G
P
activ
ity
GP
act
ivis
m in
sc
hool
s (c
ount
)G
P a
ctiv
ism
in
heal
th (c
ount
)G
P a
ctiv
ism
in
wat
er (c
ount
)
GP
act
ivis
m in
sa
nita
tion
(cou
nt)
GP
act
ivis
m in
tra
nspo
rt (c
ount
)G
P a
ctiv
ism
in
road
(cou
nt)
GP
act
ivis
m in
el
ectri
city
(c
ount
)
GP
act
ivis
m in
irr
igat
ion
(cou
nt)
And
hra
0.40
70.
529
0.34
30.
529
0.62
90.
214
0.94
30.
714
0.25
7(0
.227
)(0
.653
)(0
.587
)(0
.675
)(0
.802
)(0
.447
)(0
.832
)(0
.783
)(0
.530
)K
arna
taka
0.40
90.
418
0.20
30.
484
0.50
50.
132
0.87
41.
011
0.09
3(0
.291
)(0
.596
)(0
.583
)(0
.646
)(0
.663
)(0
.370
)(0
.780
)(1
.217
)(0
.327
)K
eral
a0.
438
0.33
30.
500
0.31
00.
270
0.08
70.
802
0.76
20.
143
(0.2
38)
(0.5
37)
(0.6
54)
(0.5
13)
(0.4
97)
(0.2
83)
(0.6
07)
(0.7
74)
(0.3
94)
Tam
ilNad
u0.
238
0.31
30.
278
0.39
60.
125
0.04
90.
264
0.54
90.
076
(0.2
01)
(0.5
73)
(0.5
08)
(0.5
82)
(0.3
32)
(0.2
16)
(0.5
42)
(0.6
98)
(0.2
92)
All
0.36
90.
383
0.31
40.
423
0.36
00.
109
0.69
70.
784
0.12
3(0
.260
)(0
.587
)(0
.592
)(0
.606
)(0
.601
)(0
.330
)(0
.739
)(0
.952
)(0
.372
)N
otes
:1)s
tand
ard
devi
atio
ns in
par
enth
esis
2)O
vera
ll G
P a
ctiv
ity is
the
ratio
of s
ecto
rs in
whi
ch G
P w
as a
ctiv
e, to
tota
l sec
tors
3)A
ctiv
ities
are
afte
r las
t ele
ctio
n
GP
act
ivity
, reg
ress
ions
Sta
teO
vera
ll G
P
activ
ity
GP
act
ivis
m in
sc
hool
s (c
ount
)G
P a
ctiv
ism
in
heal
th (c
ount
)G
P a
ctiv
ism
in
wat
er (c
ount
)
GP
act
ivis
m in
sa
nita
tion
(cou
nt)
GP
act
ivis
m in
tra
nspo
rt (c
ount
)G
P a
ctiv
ism
in
road
(cou
nt)
GP
act
ivis
m in
el
ectri
city
(c
ount
)
GP
act
ivis
m in
irr
igat
ion
(cou
nt)
And
hra
0.10
30.
203
-0.2
170.
336
0.33
30.
050
0.46
10.
059
0.12
4(1
.375
)(0
.824
)(1
.459
)(1
.898
)(2
.428
)(0
.551
)(2
.330
)(0
.229
)(1
.390
)K
arna
taka
0.10
70.
117
-0.2
410.
291
0.26
50.
059
0.46
10.
361
-0.0
49(1
.776
)(0
.685
)(3
.048
)(2
.040
)(2
.537
)(1
.691
)(2
.978
)(2
.009
)(0
.997
)Ta
milN
adu
-0.1
120.
018
-0.1
600.
209
-0.1
40-0
.048
-0.2
86-0
.019
0.00
7(1
.781
)(0
.094
)(1
.551
)(1
.273
)(1
.450
)(1
.349
)(1
.794
)(0
.118
)(0
.122
)P
rad.
Vill
age
0.09
20.
103
0.12
50.
153
0.11
00.
082
0.27
90.
167
-0.0
07(3
.899
)(1
.425
)(2
.299
)(2
.509
)(1
.938
)(1
.983
)(4
.252
)(2
.381
)(0
.212
)R
eser
ved
GP
-0.0
10-0
.010
-0.0
240.
028
0.04
30.
016
0.00
90.
049
0.00
1(0
.273
)(0
.178
)(0
.383
)(0
.398
)(0
.631
)(0
.476
)(0
.165
)(0
.381
)(0
.024
)N
504
504
504
504
504
504
504
504
504
Adj
R-s
q0.
215
0.04
20.
203
0.04
20.
108
0.05
30.
246
0.16
70.
050
Not
es:
1)ab
solu
te v
alue
s of
t-st
atis
tics
clus
tere
d by
blo
ck in
par
enth
esis
2)bl
ock
pair
fixed
effe
cts
incl
uded
in re
gres
sion
10
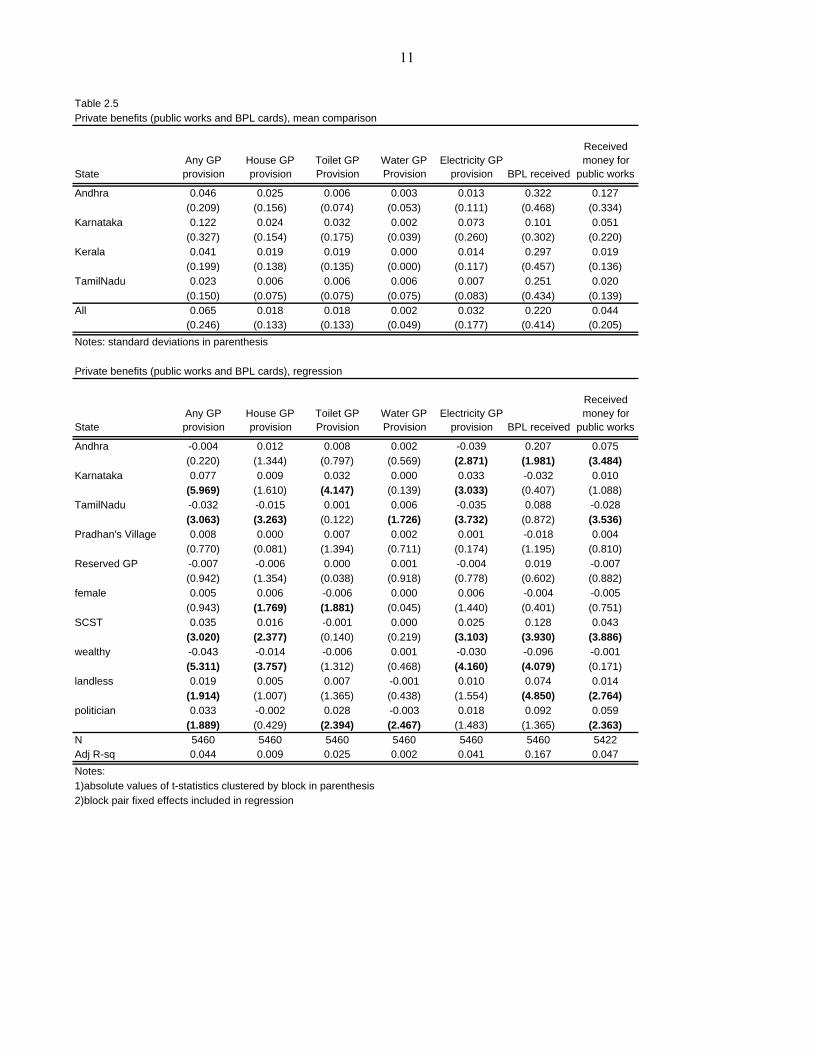
Table 2.5Private benefits (public works and BPL cards), mean comparison
StateAny GP provision
House GP provision
Toilet GP Provision
Water GP Provision
Electricity GP provision BPL received
Received money for
public works
Andhra 0.046 0.025 0.006 0.003 0.013 0.322 0.127(0.209) (0.156) (0.074) (0.053) (0.111) (0.468) (0.334)
Karnataka 0.122 0.024 0.032 0.002 0.073 0.101 0.051(0.327) (0.154) (0.175) (0.039) (0.260) (0.302) (0.220)
Kerala 0.041 0.019 0.019 0.000 0.014 0.297 0.019(0.199) (0.138) (0.135) (0.000) (0.117) (0.457) (0.136)
TamilNadu 0.023 0.006 0.006 0.006 0.007 0.251 0.020(0.150) (0.075) (0.075) (0.075) (0.083) (0.434) (0.139)
All 0.065 0.018 0.018 0.002 0.032 0.220 0.044(0.246) (0.133) (0.133) (0.049) (0.177) (0.414) (0.205)
Notes: standard deviations in parenthesis
Private benefits (public works and BPL cards), regression
StateAny GP provision
House GP provision
Toilet GP Provision
Water GP Provision
Electricity GP provision BPL received
Received money for
public works
Andhra -0.004 0.012 0.008 0.002 -0.039 0.207 0.075(0.220) (1.344) (0.797) (0.569) (2.871) (1.981) (3.484)
Karnataka 0.077 0.009 0.032 0.000 0.033 -0.032 0.010(5.969) (1.610) (4.147) (0.139) (3.033) (0.407) (1.088)
TamilNadu -0.032 -0.015 0.001 0.006 -0.035 0.088 -0.028(3.063) (3.263) (0.122) (1.726) (3.732) (0.872) (3.536)
Pradhan's Village 0.008 0.000 0.007 0.002 0.001 -0.018 0.004(0.770) (0.081) (1.394) (0.711) (0.174) (1.195) (0.810)
Reserved GP -0.007 -0.006 0.000 0.001 -0.004 0.019 -0.007(0.942) (1.354) (0.038) (0.918) (0.778) (0.602) (0.882)
female 0.005 0.006 -0.006 0.000 0.006 -0.004 -0.005(0.943) (1.769) (1.881) (0.045) (1.440) (0.401) (0.751)
SCST 0.035 0.016 -0.001 0.000 0.025 0.128 0.043(3.020) (2.377) (0.140) (0.219) (3.103) (3.930) (3.886)
wealthy -0.043 -0.014 -0.006 0.001 -0.030 -0.096 -0.001(5.311) (3.757) (1.312) (0.468) (4.160) (4.079) (0.171)
landless 0.019 0.005 0.007 -0.001 0.010 0.074 0.014(1.914) (1.007) (1.365) (0.438) (1.554) (4.850) (2.764)
politician 0.033 -0.002 0.028 -0.003 0.018 0.092 0.059(1.889) (0.429) (2.394) (2.467) (1.483) (1.365) (2.363)
N 5460 5460 5460 5460 5460 5460 5422Adj R-sq 0.044 0.009 0.025 0.002 0.041 0.167 0.047Notes:1)absolute values of t-statistics clustered by block in parenthesis2)block pair fixed effects included in regression
11
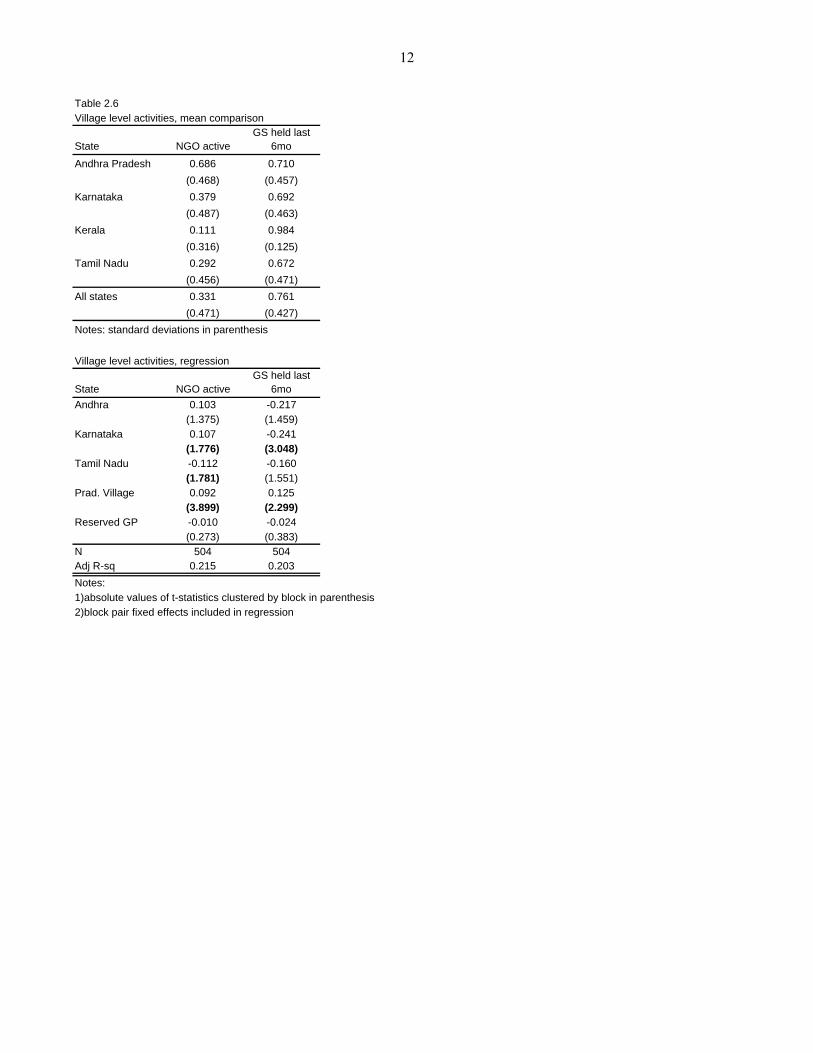
Table 2.6Village level activities, mean comparison
State NGO activeGS held last
6mo
Andhra Pradesh 0.686 0.710(0.468) (0.457)
Karnataka 0.379 0.692(0.487) (0.463)
Kerala 0.111 0.984(0.316) (0.125)
Tamil Nadu 0.292 0.672(0.456) (0.471)
All states 0.331 0.761(0.471) (0.427)
Notes: standard deviations in parenthesis
Village level activities, regression
State NGO activeGS held last
6moAndhra 0.103 -0.217
(1.375) (1.459)Karnataka 0.107 -0.241
(1.776) (3.048)Tamil Nadu -0.112 -0.160
(1.781) (1.551)Prad. Village 0.092 0.125
(3.899) (2.299)Reserved GP -0.010 -0.024
(0.273) (0.383)N 504 504Adj R-sq 0.215 0.203Notes:1)absolute values of t-statistics clustered by block in parenthesis2)block pair fixed effects included in regression
12

Table 2.7Household willingness to pay, mean comparison
State
Willing provide roads
Willing provide
anganwadi
Willing provide
Health subc
Willing provide P.
school
Willing provide dr
waterWilling
provide anyAndhra 0.329 0.210 0.263 0.228 0.276 0.485
(0.470) (0.407) (0.440) (0.420) (0.448) (0.500)Karnataka 0.103 0.084 0.021 0.089 0.090 0.189
(0.304) (0.277) (0.144) (0.285) (0.287) (0.392)Kerala 0.333 0.362 0.369 0.337 0.401 0.550
(0.471) (0.481) (0.483) (0.473) (0.490) (0.498)TamilNadu 0.352 0.296 0.291 0.314 0.338 0.439
(0.478) (0.457) (0.455) (0.464) (0.473) (0.496)All 0.258 0.228 0.214 0.231 0.260 0.386
(0.438) (0.420) (0.410) (0.422) (0.439) (0.487)Notes: standard deviations in parenthesis
Household willingness to pay, regression
State
Willing provide roads
Willing provide
anganwadi
Willing provide
Health subc
Willing provide P.
school
Willing provide dr
waterWilling
provide anyAndhra 0.009 -0.200 -0.133 -0.140 -0.168 0.027
(0.232) (4.108) (2.683) (2.819) (3.741) (0.821)Karnataka -0.211 -0.301 -0.348 -0.251 -0.334 -0.268
(6.429) (8.444) (8.842) (7.458) (10.691) (12.258)TamilNadu 0.030 -0.066 -0.068 -0.029 -0.067 -0.044
(0.893) (1.908) (1.719) (0.851) (2.241) (1.982)Pradhan's Village 0.010 0.033 0.025 0.031 0.017 0.032
(0.613) (2.204) (2.098) (2.170) (1.040) (1.747)Reserved GP 0.002 0.008 0.008 -0.001 0.025 0.015
(0.171) (0.460) (0.502) (0.079) (1.523) (0.760)female -0.045 -0.046 -0.057 -0.052 -0.065 -0.085
(4.104) (3.871) (4.318) (4.414) (6.235) (7.324)SCST 0.001 0.003 0.006 0.001 -0.013 0.019
(0.075) (0.150) (0.400) (0.061) (0.899) (1.071)wealthy 0.025 0.038 0.032 0.038 0.015 0.057
(1.547) (2.482) (2.401) (2.912) (1.116) (3.363)landless -0.014 -0.030 -0.027 -0.028 -0.026 -0.063
(0.901) (1.952) (1.715) (2.026) (1.712) (4.208)politician -0.053 -0.039 -0.089 -0.033 -0.023 -0.003
(1.524) (1.033) (2.476) (0.865) (0.589) (0.056)N 5460 5460 5460 5460 5460 5460Adj R-sq 0.077 0.097 0.150 0.084 0.099 0.116Notes:1)absolute values of t-statistics clustered by block in parenthesis2)block pair fixed effects included in regression
13

Table 2.8Inequality and caste domination, mean comparisons
Upper caste land
dominance (dummy)
Upper caste land
proportionFraction
landless hhsAndhra Pradesh 0.171 0.255 0.286
(0.380) (0.260) (0.235)Karnataka 0.335 0.364 0.232
(0.473) (0.277) (0.188)Kerala 0.087 0.171 0.430
(0.283) (0.201) (0.247)Tamil Nadu 0.236 0.244 0.409
(0.426) (0.331) (0.283)All states 0.226 0.270 0.336
(0.419) (0.284) (0.253)Notes: 1) Upper caste land dominance is an indicator variable, equals 1 if upper castes own more than half the land in the village2)Standard deviations in parenthesis
14
3. CASTE RESERVATIONS AND THE POLITICS OF PUBLIC GOOD PROVISION3
3.1 The 73rd constitutional amendment mandated political reservation in favor of SC/ST for the Pradhan position, and required that the extent of such reservation in a state reflect the SC/ST population share in that state. The amendment also required that no GP be reserved for the same group for two consecutive elections. The choice of which GPs to reserve was left to individual states. Typically, the same fraction of GPs are reserved in every district in a state. 3.2 A GP has responsibilities of civic administration with limited independent taxation powers. On average, roughly 10 percent of a GP's total revenue come from own revenues with the remainder consisting of transfers from higher levels of government. While the ambit of GP policy influence varies across Indian states GPs typically perform (at least) two distinct policy tasks. The first is beneficiary selection for central and state welfare schemes. We consider this policy task as provision of low spill-over public goods because the benefits are likely to accrue to individual households. These are schemes which provide beneficiary households with funds to acquire household public goods such as housing and private electricity and water supply. Eligibility for these schemes is usually restricted to households below the official poverty line. In addition, most schemes require that a minimum fraction of beneficiaries be SC/ST. The second area of GP policy activism is the construction and maintenance of village public goods such as street-lights, roads and drains. Using the same logic, we consider this policy task as provision of high spill-over public goods. The GP decides the distribution of these public goods within the village, and the quality of such public good provision. 3.3 Schedule XI of the Indian Constitution defines the functional items for which states may devolve responsibility to Panchayats. Panchayat legislation requires that the Pradhan consult with villagers (via gram sabha meetings) and ward members in deciding the choice of beneficiaries and allocation of public goods. However, final decision-making powers in a GP are vested with the Pradhan. 3.4 In this section we use information from an independent audit of village facilities to construct an index of GP activity on high spill-over (i.e. village-level) public goods. This index measures whether the GP undertook any construction or improvement activity on within-village roads, drains, street-lights and water sources since the last GP election. The index is normalized to lie between 0 and 1. Roughly 79% of our sample villages experienced GP activism on at least one of these public goods. 3.5 We use data from household surveys in a random sub-sample of 193 villages to measure the provision of low spill-over (household) public goods. In every sampled village twenty one household surveys were conducted, of which four were with SC/ST households and one was with an elected Panchayat representative.
3 This section summarizes results Timothy Besley, Rohini Pande, Lupin Rahman and Vijayendra Rao. (2004a), “The Politics of Public Good Provision: Evidence from Indian Local Governments,” Journal of the European Economics Association, 2(2-3), 416-426.
15
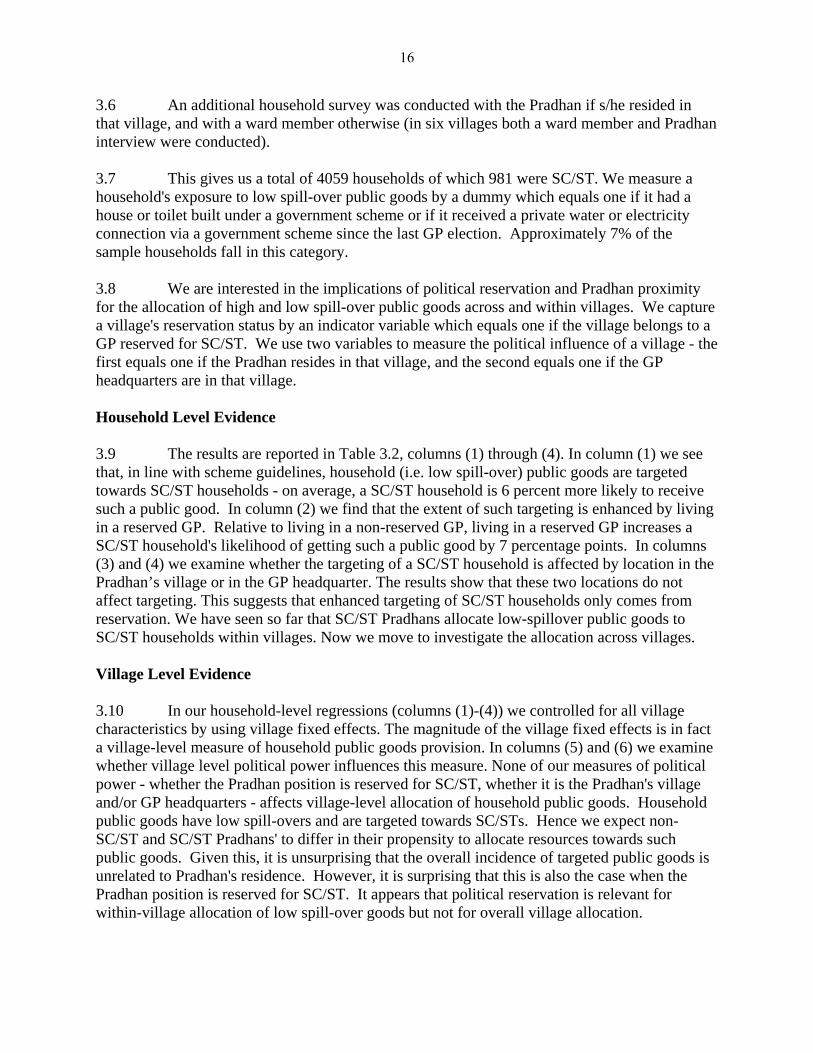
3.6 An additional household survey was conducted with the Pradhan if s/he resided in that village, and with a ward member otherwise (in six villages both a ward member and Pradhan interview were conducted). 3.7 This gives us a total of 4059 households of which 981 were SC/ST. We measure a household's exposure to low spill-over public goods by a dummy which equals one if it had a house or toilet built under a government scheme or if it received a private water or electricity connection via a government scheme since the last GP election. Approximately 7% of the sample households fall in this category. 3.8 We are interested in the implications of political reservation and Pradhan proximity for the allocation of high and low spill-over public goods across and within villages. We capture a village's reservation status by an indicator variable which equals one if the village belongs to a GP reserved for SC/ST. We use two variables to measure the political influence of a village - the first equals one if the Pradhan resides in that village, and the second equals one if the GP headquarters are in that village. Household Level Evidence 3.9 The results are reported in Table 3.2, columns (1) through (4). In column (1) we see that, in line with scheme guidelines, household (i.e. low spill-over) public goods are targeted towards SC/ST households - on average, a SC/ST household is 6 percent more likely to receive such a public good. In column (2) we find that the extent of such targeting is enhanced by living in a reserved GP. Relative to living in a non-reserved GP, living in a reserved GP increases a SC/ST household's likelihood of getting such a public good by 7 percentage points. In columns (3) and (4) we examine whether the targeting of a SC/ST household is affected by location in the Pradhan’s village or in the GP headquarter. The results show that these two locations do not affect targeting. This suggests that enhanced targeting of SC/ST households only comes from reservation. We have seen so far that SC/ST Pradhans allocate low-spillover public goods to SC/ST households within villages. Now we move to investigate the allocation across villages.
Village Level Evidence 3.10 In our household-level regressions (columns (1)-(4)) we controlled for all village characteristics by using village fixed effects. The magnitude of the village fixed effects is in fact a village-level measure of household public goods provision. In columns (5) and (6) we examine whether village level political power influences this measure. None of our measures of political power - whether the Pradhan position is reserved for SC/ST, whether it is the Pradhan's village and/or GP headquarters - affects village-level allocation of household public goods. Household public goods have low spill-overs and are targeted towards SC/STs. Hence we expect non-SC/ST and SC/ST Pradhans' to differ in their propensity to allocate resources towards such public goods. Given this, it is unsurprising that the overall incidence of targeted public goods is unrelated to Pradhan's residence. However, it is surprising that this is also the case when the Pradhan position is reserved for SC/ST. It appears that political reservation is relevant for within-village allocation of low spill-over goods but not for overall village allocation.
16

3.11 Columns (7) and (8) consider the village incidence of high spill-over public goods, as measured by the GP activism index. We find that this index is, on average 0.04 points, higher in the Pradhan's village and not significantly different in reserved GPs. The fact that these public goods are high spill-over is consistent with the finding that the reservation status of the GP does not affect the extent of village-level provision.
17
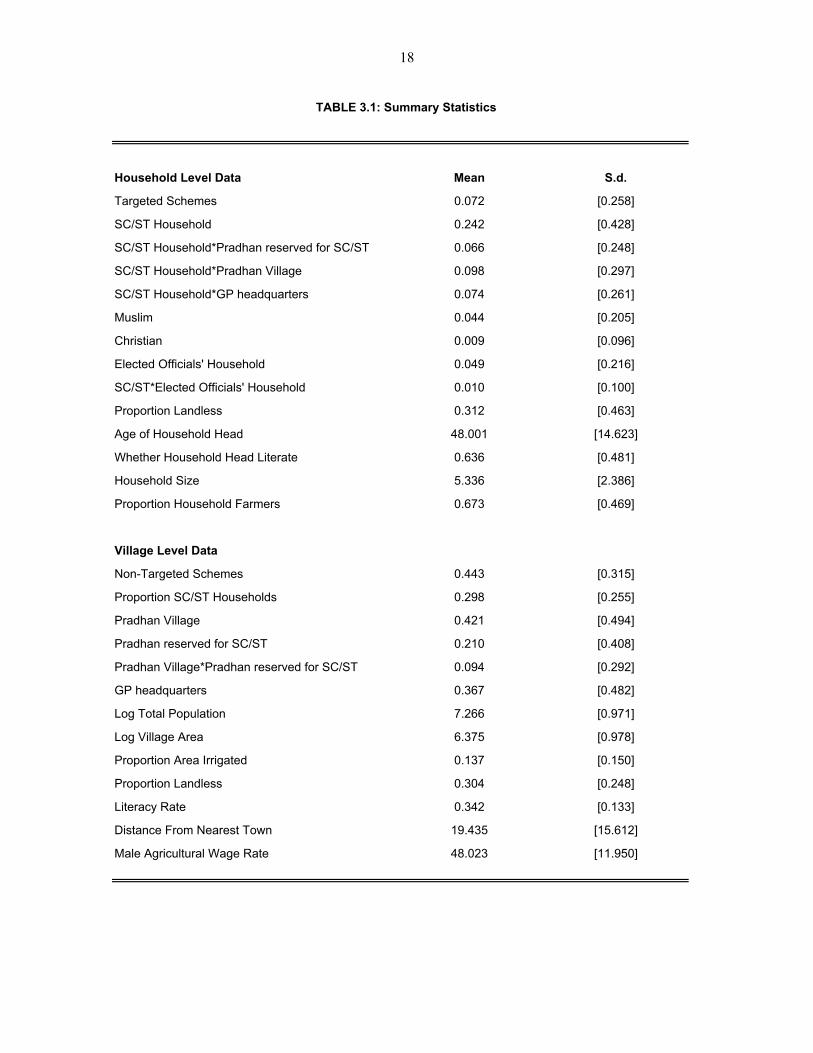
Household Level Data Mean S.d.
Targeted Schemes 0.072 [0.258]
SC/ST Household 0.242 [0.428]
SC/ST Household*Pradhan reserved for SC/ST 0.066 [0.248]
SC/ST Household*Pradhan Village 0.098 [0.297]
SC/ST Household*GP headquarters 0.074 [0.261]
Muslim 0.044 [0.205]
Christian 0.009 [0.096]
Elected Officials' Household 0.049 [0.216]
SC/ST*Elected Officials' Household 0.010 [0.100]
Proportion Landless 0.312 [0.463]
Age of Household Head 48.001 [14.623]
Whether Household Head Literate 0.636 [0.481]
Household Size 5.336 [2.386]
Proportion Household Farmers 0.673 [0.469]
Village Level Data
Non-Targeted Schemes 0.443 [0.315]
Proportion SC/ST Households 0.298 [0.255]
Pradhan Village 0.421 [0.494]
Pradhan reserved for SC/ST 0.210 [0.408]
Pradhan Village*Pradhan reserved for SC/ST 0.094 [0.292]
GP headquarters 0.367 [0.482]
Log Total Population 7.266 [0.971]
Log Village Area 6.375 [0.978]
Proportion Area Irrigated 0.137 [0.150]
Proportion Landless 0.304 [0.248]
Literacy Rate 0.342 [0.133]
Distance From Nearest Town 19.435 [15.612]
Male Agricultural Wage Rate 48.023 [11.950]
TABLE 3.1: Summary Statistics
18

(1)
(2)
(3)
(4)
(5)
(6)
(7)
(8)
SC
/ST
Hou
seho
ld0.
066*
**0.
048*
**0.
041
0.03
4(0
.014
)(0
.016
)(0
.025
)(0
.025
)S
C/S
T H
ouse
hold
*Pra
dhan
rese
rved
for S
C/S
T0.
071*
*0.
071*
*0.
064*
*(0
.031
)(0
.031
)(0
.032
)S
C/S
T H
ouse
hold
*Pra
dhan
vill
age
0.03
0.03
2(0
.025
)(0
.025
)S
C/S
T H
ouse
hold
*GP
hea
dqua
rters
-0.0
19-0
.019
(0.0
25)
(0.0
25)
Pro
porti
on S
C/S
T H
ouse
hold
s-0
.007
-0.0
170.
041
0.07
7*(0
.027
)(0
.027
)(0
.042
)(0
.045
)P
radh
an V
illag
e-0
.02
-0.0
260.
048*
*0.
044*
(0.0
20)
(0.0
21)
(0.0
23)
(0.0
24)
Pra
dhan
rese
rved
for S
C/S
T-0
.003
-0.0
02-0
.003
-0.0
24(0
.012
)(0
.013
)(0
.039
)(0
.039
)P
radh
an V
illag
e*P
radh
an re
serv
ed fo
r SC
/ST
-0.0
03-0
.008
0.00
3-0
.002
(0.0
28)
(0.0
30)
(0.0
51)
(0.0
52)
GP
hea
dqua
rter
-0.0
03-0
.007
0.04
1*0.
02(0
.012
)(0
.014
)(0
.023
)(0
.025
)C
ontro
lsno
nono
yes
noye
sno
yes
Fixe
d ef
fect
svi
llage
villa
gevi
llage
villa
gebl
ock
bloc
kbl
ock
bloc
kO
bser
vatio
ns40
5940
5940
5940
5919
317
439
536
6R
-squ
ared
0.1
0.11
0.11
0.11
0.43
0.46
0.67
0.68
TAB
LE 3
.2: E
ffect
of S
C/S
T R
eser
vatio
n on
reso
urce
allo
catio
n
Not
es: T
he d
epen
dent
var
iabl
e in
col
umns
(1)-
(4) i
s a
dum
my
varia
ble
whi
ch e
qual
s on
e if
the
hous
ehol
d's
hous
e or
toile
t was
bui
lt un
der a
gov
ernm
ent s
chem
e or
if it
rece
ived
a p
rivat
e w
ater
or
elec
trici
ty c
onne
ctio
n vi
a a
gove
rnm
ent s
chem
e si
nce
the
last
GP
ele
ctio
n. T
he d
epen
dent
var
iabl
e in
col
umns
(5)-
(6) i
s th
e vi
llage
fixe
d ef
fect
from
col
umn
(4) r
egre
ssio
n (e
xclu
ding
the
cons
tant
). Th
e de
pend
ent v
aria
ble
in c
olum
ns (7
) - (8
) is
an in
dex
of w
heth
er G
P u
nder
took
any
con
stru
ctio
n or
impr
ovem
ent a
ctiv
ity o
n ro
ads,
dra
ins,
stre
etlig
hts
and
wat
er s
ourc
es a
fter t
he la
st G
P e
lect
ion.
The
S
C/S
T H
ouse
hold
dum
my
equa
ls 1
for S
C/S
T ho
useh
olds
. The
Pra
dhan
vill
age
dum
my
equa
ls o
ne if
the
Pra
dhan
resi
des
in th
e gi
ven
villa
ge. T
he G
P h
eadq
uarte
r dum
my
equa
ls 1
if th
e G
P
head
quar
ter i
s lo
cate
d in
the
villa
ge. I
ndiv
idua
l con
trols
incl
uded
are
dum
mie
s fo
r if h
ouse
hold
is M
uslim
and
Chr
istia
n, h
ouse
hold
siz
e, a
ge, l
itera
cy a
nd o
ccup
atio
n of
hou
seho
ld h
ead
and
whe
ther
it is
th
e ho
useh
old
of a
n el
ecte
d pa
ncha
yat o
ffici
al (a
lone
and
inte
ract
ed w
ith d
umm
y fo
r bei
ng a
SC
/ST
hous
ehol
d. V
illag
e co
ntro
ls in
clud
ed a
re p
ropo
rtion
of l
andl
ess
hous
ehol
ds, l
og to
tal v
illag
e po
pula
tion,
log
villa
ge a
rea,
pro
porti
on o
f irr
igat
ed la
nd,
villa
ge li
tera
cy ra
te, d
ista
nce
from
nea
rest
tow
n, a
nd d
aily
mal
e ag
ricul
tura
l wag
e ra
te.
All
villa
ge c
ontro
ls e
xcep
t for
the
agric
ultu
ral w
ages
are
from
199
1 C
ensu
s of
Indi
a. A
gric
ultu
ral w
ages
are
from
sur
vey
data
. Var
iatio
n in
sam
ple
Rob
ust s
tand
ard
erro
rs in
bra
cket
s. *
sig
nific
ant a
t 10%
; **
sig
nific
ant a
t 5%
; ***
sig
nific
ant a
t 1%
Vill
age
fixed
effe
ctV
illag
e pu
blic
goo
dsH
ouse
hold
pub
lic g
oods
Hou
seho
ld re
gres
sion
Vill
age
leve
l
19

4. GRAM SABHAS AND POLITICAL PARTICIPATION4
4.1 The gram sabha is the lynchpin of the panchayat system. It has the potential to structure democratic institutions to ensure a fair and efficient allocation of public funds. The idea that encouraging citizen participation can improve the workings of a democracy is also echoed in the political science literature. One role for participation emphasized in that literature is to improve the flow of information into the political process beyond that available by electing representatives. Thus, Verba et al.(1995) characterize political participation as "information rich" acts and observe that:
"From the electoral outcome alone, the winning candidate cannot discriminate which of dozens of factors, from the position taken on a particular issue to the inept campaign run by the opposition ..., was responsible for the electoral victory." (page 10).
4.2 This paper studies an institution to encourage political participation among the poor and to improve the quality of governance in an Indian context - Gram Sabha meetings. These are village meetings called by the elected local government (Gram Panchayat) to discuss resource allocation decisions in the village. 4.3 The 73rd Constitutional Amendment Act of India in 1993 made it mandatory for Indian states to hold elections for Gram Panchayats and to give them policy-making powers. 4.4 There are two main ways in which such meetings may improve the workings of government. First, relative to elected representatives, these meetings may better reflect citizens' preferences on issues such as how to target resources to the neediest groups. Second, by providing a forum for monitoring the actions of elected representatives they may reduce agency problems in politics, and the extent of corruption. 4.5 While holding Gram Sabhas is compulsory, their frequency and content owes a lot to the discretion of elected officials. Officials from the State or District administration can also have a role in this by choosing not to attend, and therefore making the gram sabha less attractive to hold. It is also the case that a well-attended meeting may have no bite on policy decisions. We exploit our household and village surveys to examine the determinants of participation in Gram Sabhas, and whether having a Gram Sabha affects beneficiary selection for welfare programs.
4.6 While there is much interest in how participation improves the quality of governance in the developing world (see, for example, Manor (2004)), evidence on the determinants of participation at the household level is thin, especially compared to the extensive studies available for the advanced democracies. Moreover, the literature is replete with concerns about elite dominance of democratic institutions. (Bardhan and Mookherjee (2000) and Platteau and Abraham (2004))
4 This paper summarizes results from: Besley, Timothy, Rohini Pande and Vijayendra Rao, [2005], “Participatory Democracy in Action: Survey Evidence from India," forthcoming in the Journal of the European Economics Association.
20

4.7 This raises the specter of participatory institutions being a veil which have little impact on the well-being of the poor. Here, however, we find that it is the most disadvantaged groups who attend village meetings and that holding such meetings improves the targeting of resources towards the neediest groups. 4.8 Our findings contribute to a broader debate about the role of decentralized governance in improving the quality of government in the developing world. The merits of decentralization have been widely debated -- see, for example, Bardhan (2002) and Triesman (2002). However, it is clear that many institutional details, even within decentralized governance, can be important. The use of village meetings of the kind studied here is one. It is important to understand how these institutional differences affect the way in which government operates. 4.9 In our survey, in every village, we conducted group meetings in which we obtained information on the last Gram Sabha meeting, and also village-level demographic and economic variables. In a random sub-sample of 259 villages we conducted twenty household surveys, and obtained information on Gram Sabha attendance and household beneficiary status. 4.10 Table 4.1 reports descriptive statistics. The average village has 328 households, of which 34 percent are landless. Twenty percent belong to the traditionally well-off upper castes and 28 percent to the historically disadvantaged scheduled castes and tribes (now on, SC/ST). According to the 1991 census literacy rate in our sample villages averaged 41 percent, but as is well known was much higher in Kerala villages. Seventy five percent of the villages had at least one Gram Sabha meeting in the last year, and in 22 percent of these meetings beneficiary selection was discussed. 4.11 In our household data-set we observe that while over 50 percent of the respondents had heard of a Gram Sabha only 20 percent had ever attended a Gram Sabha meeting. We also collected information on a household's beneficiary status, as defined by whether it has a `Below Poverty Line' (BPL) card. The GP, in collaboration with state government officials, is supposed to identify (via a census) households with income below the poverty line, and to give these households a BPL card. Possession of this card makes the household eligible for an array of government schemes, ranging from subsidized food through the public distribution system to free hospitalization. The list of BPL households, and subsequent selection of beneficiary households under various schemes is supposed to be ratified in Gram Sabha meetings.
4.12 The analysis is in two parts. We first study the determinants of holding a Gram Sabha meeting and who attends. We then look for evidence that holding a Gram Sabha meeting affects public resources allocation.
Determinants of holding a Gram Sabha and who attends: 4.13 The results of the analysis are reported in Table 4.2, column (1). More populous villages are more likely to have had a Gram Sabha meeting, and there is weak evidence that villages with higher literacy rate are more likely to hold Gram Sabha meetings. Interestingly,
21

after conditioning on matched block pair effects we don't observe any significant state differences in the decision to have a Gram Sabha. 4.14 In Columns (2)-(5) we use our household data to examine who has heard of, and who attends Gram Sabha meetings. 4.15 Village literacy rate is positively correlated with both hearing of the Gram Sabha and attending it. We also find evidence of significant state effects, with respondents from Kerala much more likely to have both heard of Gram Sabha meetings and participated in them. However, in the case of individual characteristics we observe significant differences in who has heard of and who attends Gram Sabha meetings. Moreover, various measures of economic and social disadvantage have a differential impact on the propensity to attend Gram Sabhas. Women and illiterates are less likely to both hear of and attend these meetings. In contrast, SC/STs and the landless are more likely to attend Gram Sabha meetings but no more likely to have heard of Gram Sabhas. Wealthy and upper castes, on the other hand, are more likely to have heard of Gram Sabhas but not to attend. 4.16 In column (4) we show that the individual characteristics continue to have a significant effect even when we control for all village characteristics, through fixed effects. Finally, in column (5) we examine whether village literacy particularly affects the likelihood of the disadvantaged to attend. The results of the estimation with interaction terms imply that higher village literacy increases the likelihood of illiterates, landless, and to a lesser extent SC/STs to participate. Women however, are not more likely to participate in Gram Sabhas in higher literacy villages. 4.17 These findings are notable for two reasons. First, there is some suggestion of a political externality from living in a more literate community. Second, Gram Sabha meetings seem to be a forum used by some of the most disadvantaged groups in the village - landless and scheduled castes/tribes. This suggests that these groups find the Gram Sabha useful and that Gram Sabha meetings may play some role in moving policy in a direction favored by these groups. We now look for evidence of the latter.
Does participation matter? 4.18 There are many who argue that participation in the political process has an intrinsic benefit. It builds trust in government and legitimizes state action. Unfortunately, our data do not permit us to look at these issues. However, we will look at the possibility that participation in Gram Sabhas yields instrumental (i.e. policy) benefits. These could be community-wide or by targeting resources to more specific groups. Here, we will focus on the latter, examining whether targeting of public programs are related to whether a Gram Sabha meeting has been held in the past twelve months. 4.19 We focus on an important specific policy administered at the village level -- access to a below poverty line (BPL) card. Beneficiary selection for such cards is influenced by the GP. As discussed earlier, possession of this card gives a villager access to an array of public benefits. We estimate a household regression which exploits within village variation in individual
22
characteristics to examine whether the targeting of BPL cards differs depending on whether the village had a Gram Sabha in the last year. 4.20 The results are reported in Table 4.3. In column (1) we report the baseline regression which does not include any interaction terms. This shows, not surprisingly, that BPL cards are targeted towards landless, illiterate and SC/ST households. In column (2) we include interactions between measures of disadvantage and whether the village had a Gram Sabha meeting. We find targeting of landless and illiterate individuals is more intensive in villages that had held a Gram Sabha meeting. Moreover, these effects are economically significant with an 8-10% increase in the probability of receiving a BPL card in a village that held a Gram Sabha. We find similar, but statistically insignificant, evidence for SC/STs. 4.21 These results do show persuasively that there is heterogeneity in targeting BPL cards across villages. Moreover, it would be tempting to attribute this to whether a Gram Sabha meeting is held. However, some caution is warranted. In column (3), we interact the characteristics that represent disadvantage - illiteracy, landlessness and schedule caste/tribe -- with the village literacy rate instead of whether the village had a Gram Sabha meeting. All three of these interactions are significant. This does raise the possibility that holding a Gram Sabha meeting is correlated with other village characteristics that are important in shaping the way in which public resources are targeted. Therefore we cannot say that holding a Gram Sabha has a causal effect on targeting. This is not an issue we can resolve with the existing data. However, these encouraging results on Gram Sabhas clearly deserve further careful investigation. 4.22 In conclusion, while this paper focuses on a specific institution -- the Gram Sabha, the results contribute to a wider debate on how institution design can shape public resource allocation and how the poor can increase their voice in public institutions. It is frequently remarked that poverty is much more than material deprivation and that the poor may receive much less voice in the political process. Moreover, a good deal of cynicism attends initiatives to strengthen that voice. 4.23 While the context is very specific, our results sound a more optimistic note. The illiterate, landless and SC/STs are significantly more likely to attend Gram Sabha meetings than other groups. Moreover, there appears to be more targeting towards these groups where Gram Sabha meetings are held. The results are also suggestive of some externalities from literacy in the political process at the village level. 4.24 Less optimistically, it is clear that Gram Sabhas are not a forum for women in their current form. Women respondents are around 20% less likely to attend a Gram Sabha than men. Whether this has significant consequences for public resource allocation needs further investigation. But it is clear the representativeness of Gram Sabhas is likely to be affected by this. Other tools such as gender reservation in Panchayat representation may go some way towards remedying this (see Chattopadhyay and Duflo (2004a) and Besley et. al. (2004b)).
23

Table 4.1:Descriptive Statistics
Overall Andhra Pradesh Karnataka Kerala Tamil NaduVillage level dataTotal households 328.10 305.50 365.80 401.10 227.40
Fraction of households which are 0.34 0.25 0.23 0.48 0.41landlessFraction of households which are 0.28 0.23 0.41 0.21 0.22SC/STFraction of households which are 0.20 0.13 0.32 0.12 0.19Upper casteLiteracy Rate in 1991 0.41 0.24 0.37 0.63 0.35
Fraction of villages which had a 0.76 0.71 0.68 0.98 0.67Gram Sabha in last yearFraction of Gram Sabhas at which 0.22 0.21 0.33 0.30 0.02beneficiary selection was discussed
Household level dataHeard of Gram Sabha 0.53 0.29 0.42 0.93 0.37
Ever attended Gram Sabha 0.20 0.11 0.14 0.40 0.13
Possess a BPL Card 0.22 0.32 0.10 0.30 0.25All variables based on survey data, except the village literacy rate which is from the 1991 Census of India
24
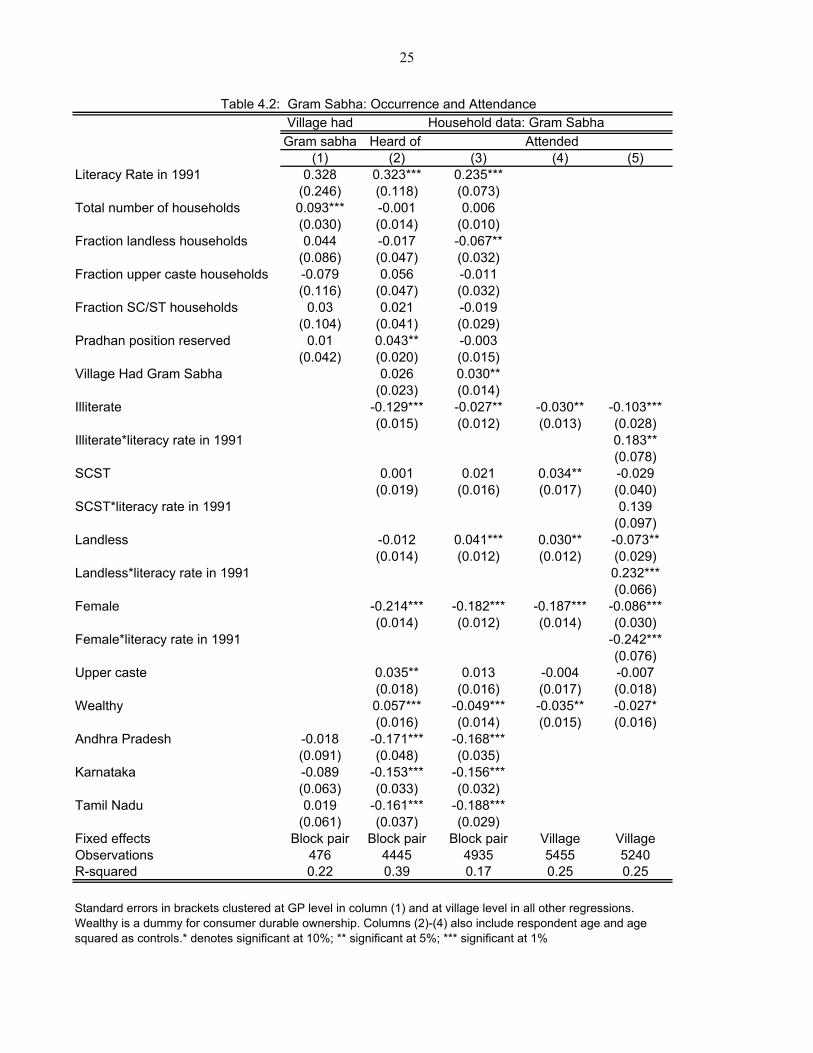
Table 4.2: Gram Sabha: Occurrence and AttendanceVillage had Household data: Gram Sabha
Gram sabha Heard of Attended (1) (2) (3) (4) (5)
Literacy Rate in 1991 0.328 0.323*** 0.235***(0.246) (0.118) (0.073)
Total number of households 0.093*** -0.001 0.006(0.030) (0.014) (0.010)
Fraction landless households 0.044 -0.017 -0.067**(0.086) (0.047) (0.032)
Fraction upper caste households -0.079 0.056 -0.011(0.116) (0.047) (0.032)
Fraction SC/ST households 0.03 0.021 -0.019(0.104) (0.041) (0.029)
Pradhan position reserved 0.01 0.043** -0.003(0.042) (0.020) (0.015)
Village Had Gram Sabha 0.026 0.030**(0.023) (0.014)
Illiterate -0.129*** -0.027** -0.030** -0.103***(0.015) (0.012) (0.013) (0.028)
Illiterate*literacy rate in 1991 0.183**(0.078)
SCST 0.001 0.021 0.034** -0.029(0.019) (0.016) (0.017) (0.040)
SCST*literacy rate in 1991 0.139(0.097)
Landless -0.012 0.041*** 0.030** -0.073**(0.014) (0.012) (0.012) (0.029)
Landless*literacy rate in 1991 0.232***(0.066)
Female -0.214*** -0.182*** -0.187*** -0.086***(0.014) (0.012) (0.014) (0.030)
Female*literacy rate in 1991 -0.242***(0.076)
Upper caste 0.035** 0.013 -0.004 -0.007(0.018) (0.016) (0.017) (0.018)
Wealthy 0.057*** -0.049*** -0.035** -0.027*(0.016) (0.014) (0.015) (0.016)
Andhra Pradesh -0.018 -0.171*** -0.168***(0.091) (0.048) (0.035)
Karnataka -0.089 -0.153*** -0.156***(0.063) (0.033) (0.032)
Tamil Nadu 0.019 -0.161*** -0.188***(0.061) (0.037) (0.029)
Fixed effects Block pair Block pair Block pair Village VillageObservations 476 4445 4935 5455 5240R-squared 0.22 0.39 0.17 0.25 0.25
Standard errors in brackets clustered at GP level in column (1) and at village level in all other regressions. Wealthy is a dummy for consumer durable ownership. Columns (2)-(4) also include respondent age and age squared as controls.* denotes significant at 10%; ** significant at 5%; *** significant at 1%
25
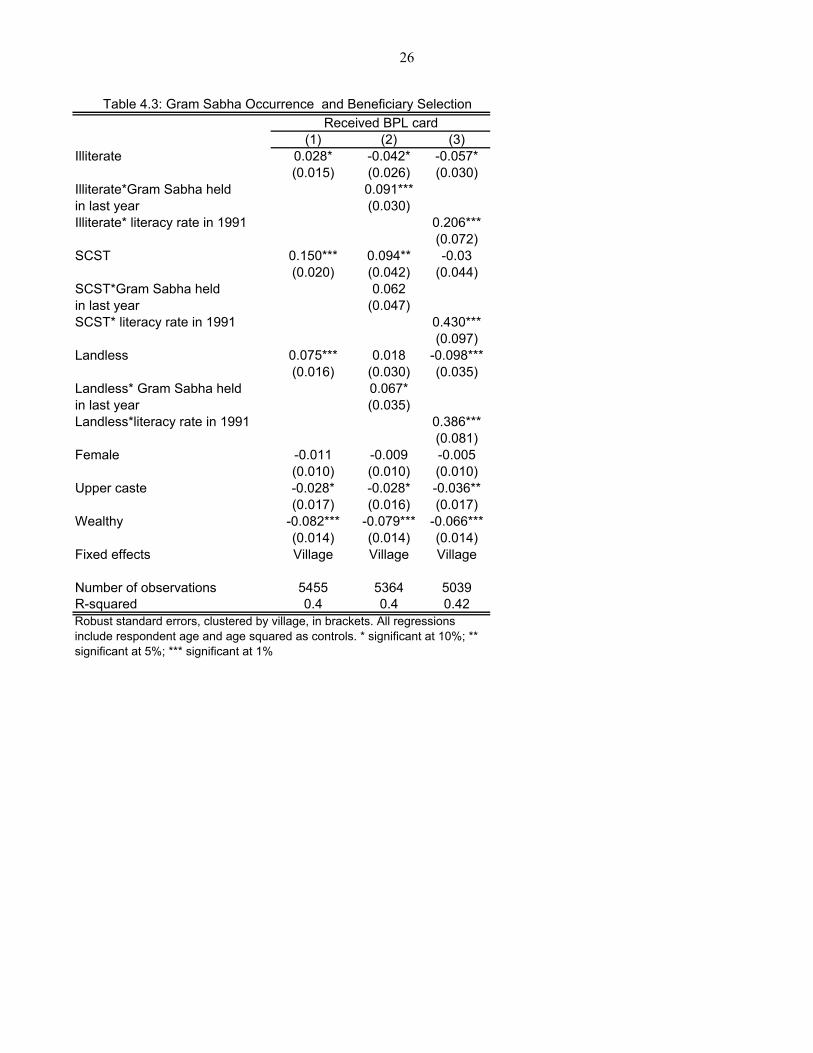
Table 4.3: Gram Sabha Occurrence and Beneficiary SelectionReceived BPL card
(1) (2) (3)Illiterate 0.028* -0.042* -0.057*
(0.015) (0.026) (0.030)Illiterate*Gram Sabha held 0.091***in last year (0.030)Illiterate* literacy rate in 1991 0.206***
(0.072)SCST 0.150*** 0.094** -0.03
(0.020) (0.042) (0.044)SCST*Gram Sabha held 0.062in last year (0.047)SCST* literacy rate in 1991 0.430***
(0.097)Landless 0.075*** 0.018 -0.098***
(0.016) (0.030) (0.035)Landless* Gram Sabha held 0.067*in last year (0.035)Landless*literacy rate in 1991 0.386***
(0.081)Female -0.011 -0.009 -0.005
(0.010) (0.010) (0.010)Upper caste -0.028* -0.028* -0.036**
(0.017) (0.016) (0.017)Wealthy -0.082*** -0.079*** -0.066***
(0.014) (0.014) (0.014)Fixed effects Village Village Village
Number of observations 5455 5364 5039R-squared 0.4 0.4 0.42Robust standard errors, clustered by village, in brackets. All regressions include respondent age and age squared as controls. * significant at 10%; ** significant at 5%; *** significant at 1%
26

5. POLITICAL SELECTION AND THE QUALITY OF GOVERNMENT5: 5.1 Common sense discussions of political life often place the quality of politicians at center stage. Yet the modern political economy literature remains dominated by a paradigm in which good policy is achieved solely by getting incentives right rather than by improving the quality of the political class. While incentives are important, personal qualities of politicians such as honesty, integrity and competence are also potentially important, especially in environments where politicians face limited formal sanctions. 5.3 We test these ideas using the data that we have collected from both politician and non-politician households. We also have information on a host of village institutions. We examine institutions which affect the identity of the politically dominant group, those determining returns to politics and finally, those affecting information flows. 5.4 There are two main components to our empirical analysis. We begin by studying politician characteristics -- the "selection equation" for politicians, and how these are affected by village institutions. Second, we look at which characteristics make politicians better policy makers -- specifically, showing less opportunism in relation to public programs. Here again, we examine the role of village institutions. 5.5 Our paper also contributes to a growing empirical literature on decentralized government in the developing world. There is emerging evidence that decentralization affects resource allocation. Faguet (2004) finds that decentralization improved targeting in Bolivia. Bardhan and Mookherjee (2003) examine the role of elected village councils in affecting land reform in the Indian state of West Bengal. Chattopadhyay and Duflo (2004a) show political reservation for women affected public good allocation in two Indian states. Finally, Foster and Rosenzweig (2001) examine how decentralization interacts with land ownership patterns to affect public good outcomes. None of these papers focuses on how politician's characteristics affect this process. 5.6 The results are presented in two parts. We first examine determinants of politician selection, and then at how policy is determined. In Table 5.1 we report some descriptive statistics. Politicians have 3.1 more years of education and 3.7 more acres of land than the average respondent. Furthermore, politicians are almost 4 times more likely to have a member of family in politics than the average respondent. Only 36 percent of the respondents believe that their pradhan kept their electoral promises. 8.7 percent say that their voting choices were most importantly determined by group identity (religion, caste, gender or region), while 36 percent state that they vote on their perception of the candidate’s quality. Note also that 21% of households possess a BPL card. As for village characteristics , it can be noted that a dominant caste – one that comprises at least 40 percent of the villagers – exists in more than half the villages (51.9 percent). In 78 percent of the villages a Gram Sabha was held in the last year and the average literacy rate across these villages is 42 percent. 5 This section summarizes results from Timothy Besley, Rohini Pande and Vijayendra Rao, “Political Selection and the Quality of Government: Evidence from South India,” mimeo, May 2005
27

Political Selection: 5.8 We start by examining the household data to see if particular types of individuals and households are more likely to become politicians – these regressions are reported in Table 5.2. All regressions in this table either control for village or GP fixed effects, thus the results examine variation within a village or GP. In columns (1) and (2) the dependent variable is whether the respondent is an elected GP politician( i.e. a Pradhan or ward member). Being eligible for reservation is not significantly correlated with being a politician. However, years of education and land ownership are positively correlated with being a politician. In addition, a respondent from a family with a history of political participation is 12% more likely to be a politician, and years of education and more land are both associated with a higher chance of being a politician. 5.9 In columns (2) and (3) we restrict the sample to the groups eligible for reservations – women and SC/STs. For both groups we observe positive selection of education, but not on land. We find that family political history is correlated with selection only for women. The absence of any impact from political history for SC/STs possibly reflects their relative lack of political experience. Columns (4) – (6) conduct the same analysis restricting the dependent variable to becoming a Pradhan and the results are similar. 5.10 In Table 5.3 we look at how village institutions affect the process of political selection. We are specifically interested in how different measures of political dominance influence the characteristics of elected politicians. We do this by interacting the institutional variable with individual characteristics and examining the effect of the interaction on the likelihood of being elected politician. In column (1) we consider the existence of a dominant caste and its effect on selection. The positive and significant coefficient on the interaction with land owned is evidence that in villages which have a dominant caste, individuals owning more land are more likely to be elected politicians. Columns (2) and (3) examine the effect of reservations – examining women’s reservation and SC/ST reservation in turn. In both cases we observe that, relative to other politicians, reserved politicians are less educated, own less land, and are less likely to come from families with political experience. This, we think, reflects the historic economic, social and political disadvantages faced by low castes and women. 5.11 In column (4) we examine the impact of the pradhan’s salary on selection to see whether higher formal returns from electoral politics cause more affluent politicians to enter politics. We observe that politicians in villages with relatively higher Pradhan salary own more land. In column (5) we see if there is a macro information effect that comes from belonging to a more literate village on political selection. We see that relatively more educated politicians are likely to be elected from more literate villages. Further, respondents belonging to groups eligible for reservation are more likely to enter politics in such villages. However, this effect is not significant. 5.12 Overall, the results suggest that village institutions that reduce the dominance of major castes increase the presence of economically disadvantaged groups in politics. Further higher returns to political office encourages the selection of wealthier politicians. In addition, more literate villages elect better educated leaders.
28
Policy Effects
5.13 We now examine how political selection affects the targeting of private goods, namely, BPL cards, provided by GPs. Table 5.4, column (1) demonstrates that BPL cards are indeed targeted towards economically disadvantaged households. Specifically, a SC/ST household is 16% more likely to get a BPL card while households with a more educated head and/or more land holdings are less likely. Finally, households with a family political history are no more likely to get a BPL card. But, being a politician helps. In column (2) we observe that a politician household is 7.5% more likely to have a BPL card. This is all the more striking in view of the results in Table 5.2 which demonstrated that politician households are more likely to be landed and educated. In column (3) we examine the role of politician characteristics. Political opportunism is invariant to most politician characteristics, except education. Political opportunism is lower among more educated politicians. An extra year of education for a politician makes him or her 1.4% less likely to have a BPL card. 5.16 In Table 5.5 we examine the role of village institutions in constraining political opportunism focusing once again on the probability of obtaining a BPL card. Column (1) considers the implications of caste dominance. The presence of dominant caste in the village make it more likely that a politician will have a BPL card. Column (2) looks at women’s reservation. The likelihood of a politician having a BPL card is higher when the pradhan is a woman. In contrast, column (3) shows that SC/ST reservations make it more likely that SC/ST households will have a BPL card, and more likely that reserved politicians will also have one. This shows the salience of SC/ST reservations in improving the access of SC/STs to anti-poverty programs. 5.17 Column (4) examines the implications of variations in the pradhan’s real salary. Higher salaries are associated with no change in political opportunism, but the targeting of socially and economically disadvantaged groups is improved. In column (5) we see whether holding a gram sabha meeting, which in theory should increase transparency, has an impact on opportunism. We see a significant reduction in opportunism when a gram sabha is held. Similar effects obtain with increases in village literacy as shown in column (6). This extends some of the results we reported earlier in our analysis of gram sabhas. Columns (5) and (6) also show that improved literacy and having a Gram Sabha improves targeting of disadvantaged household. SC/ST and economically disadvantaged household are more likely to receive a BPL card in villages with higher literacy and in villages where Gram Sabha was held. 5.18 Taken together these results demonstrate the importance of incentives, transparency, and education in affecting public resource allocation. More educated leaders are less opportunistic, as are those who are paid higher salaries and belong to GPs that hold gram sabhas and have higher levels of literacy.
29
Summarizing the Results on Political Selection 5.26 This section has three key findings. First, the political class is selected on the basis of political connections and economic advantage. Second, politicians are on the whole opportunistic and benefit disproportionately from public transfer programs. Third, the education level of politicians has a consistently positive effect on selection and a negative effect on opportunism. This suggests that more educated politicians are better. However, whether education matters directly or because it is correlated with other characteristics that make an individual fit for public office cannot be discerned from our results. Nonetheless, the results add to a growing appreciation among economists that education may be important because of its role in inculcating civic values. The unique observation about its role in politics given here also offers a fresh perspective on the value of human capital investments in low income countries. 5.27 The results demonstrate important interplays between village level variables and the process of political selection, and the targeting of public resources. For example, increased literacy at the village level reduces political opportunism while measures of political dominance are correlated with targeting of resources. We also find evidence suggestive of barriers to entry, as individuals owning less land or having no political connections are less likely to be elected. Land ownership and political connections predict selection but not behavior when in office. 5.28 Our finding that educated politicians are better in terms of actual performance suggests that it is important to focus on factors that select better politicians as step toward improving the quality of government. More generally, the results and analyses in the paper reinforce the observation that formal institutions of democracy are no guarantee of effective government. It is essential that preconditions exist for sorting in the right kinds of people – the talented, the virtuous and those who give political voice to the disadvantaged. There is clearly much more we can learn about this process, but these results are a first effort to study the issue empirically.
30

Mean s.d.Respondent characteristicsYears of Education All 4.49 (4.54)
Politicians 7.58 (4.51)Land owned (in acres) All 2.26 (4.77)
Politicians 5.98 (8.87)Eligible for reservation (%) All 60.90 (48.81)
Politicians 48.70 (50.07)Family political history (%) All 6.70 (25.04)
Politicians 25.30 (43.54)Beneficiary StatusBPL card (%) All 21.70 (41.20)
Politicians 24.20 (42.80)
Perceptions and Voting Behavior (% non-politicians) Pradhan looks after village needs 38.40 (48.63)Pradhan keeps election promises 36.10 (48.03)
Vote for group identity 8.72 (28.22)Vote for candidate quality 36.08 (48.02)Institutions (% villages)Dominant caste 51.93 (50.05)
Pradhan reserved for Female 15.89 (36.63)
Pradhan reserved for SC/ST 16.66 (37.34)
Literacy rate 42.20 (18.35)
Gram Sabha 77.95 (41.53)Notes:
Table 5.1: Descriptive Statistics
1. Years of education refer to respondent's years of education. Land owned is amount of land, in acres, owned by respondent's household. A respondent is eligible for reservation if female or SC/ST. A respondent has a family political history if any member of his/her household holds or as held a political position. BPL card refers to whether the household has a BPL card.
2. Vote dummies refer to GP election. Vote for group identity=1 if respondent says she voted for the candidate with the same caste/religion/gender/place of residence. Vote for candidate quality=1 if respondent says she voted for candidate with good policy promises/candidate active in the village/good reputation.
3. A Village has a Dominant caste if over 40 percent of villagers belong to a single caste. Literacy rate is the 1991 census village literacy rate. Gram Sabha is a dummy for whether the village had a Gram Sabha meeting in the last year.
31

Table 5.2: Individual Characteristics and Politician Selection
Sample All Female SC/ST(1) (2) (3)
Eligible for 0.008reservation (0.007)
Education 0.008*** 0.007*** 0.012***(0.001) (0.001) (0.002)
Land owned 0.007*** 0.003 0.002(0.002) (0.002) (0.003)
Family political 0.119*** 0.135*** 0.062history (0.020) (0.032) (0.044)
Fixed effects Village Village GP
R-squared 0.09 0.12 0.12
N 5397 2644 1245
2. The dependent variable is an indicator variable=1 if the respondent is a politician.
3. All regressions include control for respondent age and age squared. The Pradhan regressions restrict the sample to the Pradhan and non politician households in the Pradhan's village.
4. Eligible for reservation is an indicator variable which equals one if respondent is female or SC/ST. Land ownership is the land (in acres) owned by the respondent's household. Education refers to respondent's years of education. Family political history is an indicator variable which equals one if any family member of respondent has held/holds a political position.
Politician
Notes:
1. OLS regressions with standard errors, clustered by village, in parentheses. * significant at 10%; ** at 5%; *** at 1%.
32

Inst
itutio
nD
omin
ant C
aste
Fem
ale
Pra
dhan
R
eser
vatio
nS
C/S
T P
radh
an
Res
erva
tion
Sal
ary
Lite
racy
Rat
e(1
)(2
)(3
)(4
)(5
)E
ligib
le fo
r res
erva
tion
0.01
3-0
.013
**-0
.009
-0.0
37-0
.012
(0.0
09)
(0.0
06)
(0.0
06)
(0.0
64)
(0.0
16)
Elig
ible
for r
eser
vatio
n*-0
.007
1.03
2***
1.03
2***
0.02
70.
05V
illag
e C
hara
cter
istic
(0.0
12)
(0.0
06)
(0.0
07)
(0.0
38)
(0.0
34)
Edu
catio
n0.
008*
**0.
006*
**0.
006*
**-0
.001
0.00
5**
(0.0
01)
(0.0
01)
(0.0
01)
(0.0
07)
(0.0
02)
Edu
catio
n*-0
.001
-0.0
06**
*-0
.003
***
0.00
50.
007*
Vill
age
Cha
ract
eris
tic(0
.002
)(0
.001
)(0
.001
)(0
.004
)(0
.004
)
Land
ow
ned
0.00
5**
0.00
6***
0.00
8***
-0.0
27*
0.00
2(0
.002
)(0
.002
)(0
.002
)(0
.015
)(0
.004
)La
nd o
wne
d*0.
005*
-0.0
06**
*-0
.007
***
0.02
1**
0.01
6V
illag
e C
hara
cter
istic
(0.0
03)
(0.0
01)
(0.0
02)
(0.0
10)
(0.0
11)
Fam
ily p
oliti
cal h
isto
ry0.
112*
**0.
083*
**0.
111*
**0.
037
0.06
7(0
.030
)(0
.019
)(0
.020
)(0
.216
)(0
.051
)Fa
mily
pol
itica
l his
tory
*0.
013
-0.0
76**
*-0
.131
***
0.05
00.
104
Vill
age
Cha
ract
eris
tic(0
.040
)(0
.020
)(0
.022
)(0
.132
)(0
.108
)
Fixe
d ef
fect
sV
illag
eV
illag
eV
illag
eV
illag
eV
illag
eR
-squ
ared
0.09
0.25
0.26
0.09
0.09
N53
9753
9753
9753
7651
87
3. R
egre
ssio
ns in
clud
e re
spon
dent
age
and
age
-squ
ared
as
a co
ntro
l var
iabl
e. E
xpla
nato
ry v
aria
bles
are
def
ined
in n
otes
to T
able
s 1
and
2.
4. D
omin
ant c
aste
is a
n in
dica
tor e
qual
to 1
if th
e vi
llage
has
a d
omin
ant c
aste
, as
defin
ed in
tabl
e 5.
1; S
alar
y is
log
Pra
dhan
sal
ary/
log
mal
e ag
ricul
tura
l wag
e; L
itera
cy is
the
villa
ge li
tera
cy ra
te in
the
1991
cen
sus
Tabl
e 5.
3: V
illag
e C
hara
cter
istic
s an
d P
oliti
cian
Sel
ectio
n
Not
es:
1. O
LS re
gres
sion
s w
ith s
tand
ard
erro
rs, c
lust
ered
by
villa
ge, i
n pa
rent
hese
s. *
sig
nific
ant a
t 10%
; **
at 5
%; *
** a
t 1%
.
2. T
he d
epen
dent
var
iabl
e is
an
indi
cato
r var
iabl
e=1
if th
e re
spon
dent
is a
pol
itici
an.
33
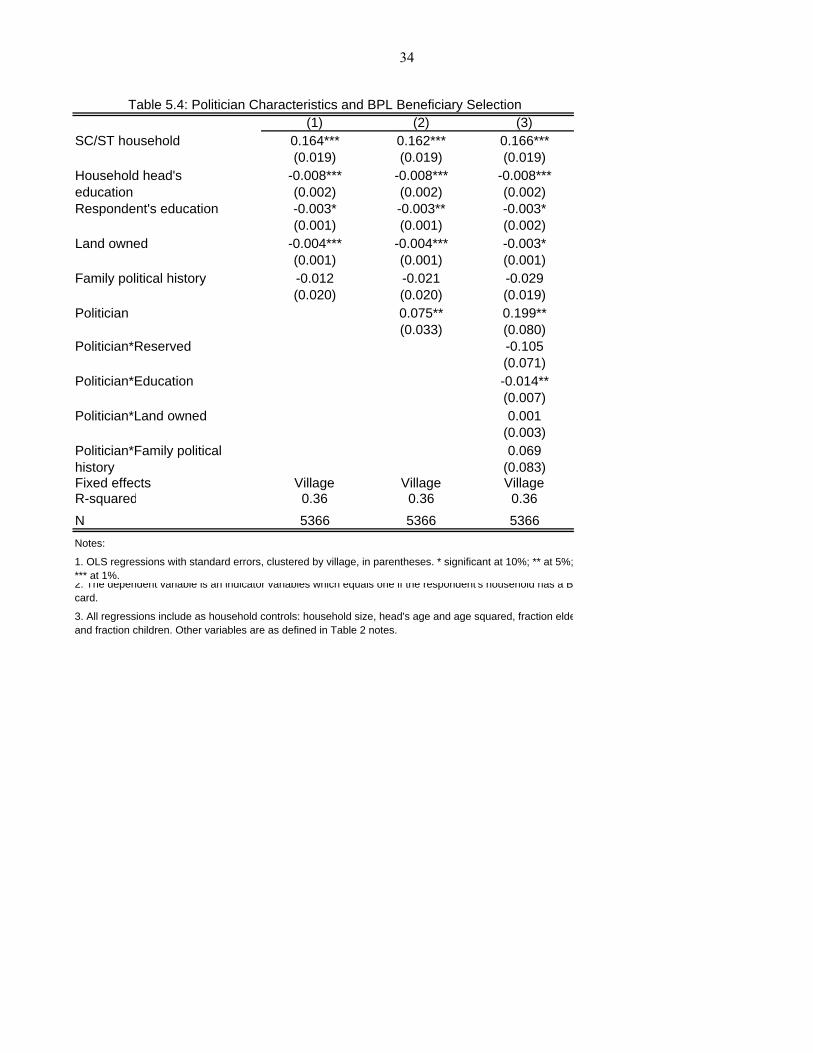
(1) (2) (3)SC/ST household 0.164*** 0.162*** 0.166***
(0.019) (0.019) (0.019)Household head's -0.008*** -0.008*** -0.008***education (0.002) (0.002) (0.002)Respondent's education -0.003* -0.003** -0.003*
(0.001) (0.001) (0.002)Land owned -0.004*** -0.004*** -0.003*
(0.001) (0.001) (0.001)Family political history -0.012 -0.021 -0.029
(0.020) (0.020) (0.019)Politician 0.075** 0.199**
(0.033) (0.080)Politician*Reserved -0.105
(0.071)Politician*Education -0.014**
(0.007)Politician*Land owned 0.001
(0.003)Politician*Family political 0.069history (0.083)Fixed effects Village Village VillageR-squared 0.36 0.36 0.36N 5366 5366 5366
3. All regressions include as household controls: household size, head's age and age squared, fraction eldeand fraction children. Other variables are as defined in Table 2 notes.
Table 5.4: Politician Characteristics and BPL Beneficiary Selection
Notes:
1. OLS regressions with standard errors, clustered by village, in parentheses. * significant at 10%; ** at 5%; *** at 1%.2. The dependent variable is an indicator variables which equals one if the respondent s household has a Bcard.
34
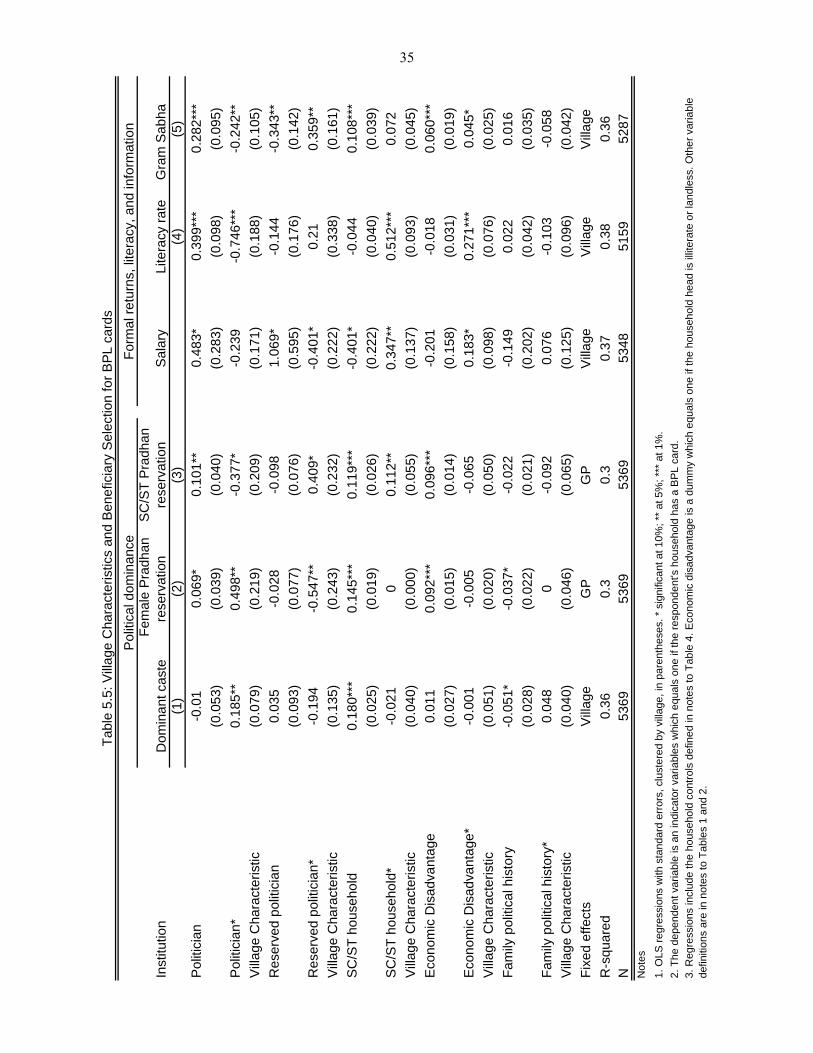
Inst
itutio
nD
omin
ant c
aste
Fem
ale
Pra
dhan
re
serv
atio
nS
C/S
T P
radh
an
rese
rvat
ion
Sal
ary
Lite
racy
rate
Gra
m S
abha
(1)
(2)
(3)
(4)
(5)
Pol
itici
an-0
.01
0.06
9*0.
101*
*0.
483*
0.39
9***
0.28
2***
(0.0
53)
(0.0
39)
(0.0
40)
(0.2
83)
(0.0
98)
(0.0
95)
Pol
itici
an*
0.18
5**
0.49
8**
-0.3
77*
-0.2
39-0
.746
***
-0.2
42**
Vill
age
Cha
ract
eris
tic(0
.079
)(0
.219
)(0
.209
)(0
.171
)(0
.188
)(0
.105
)R
eser
ved
polit
icia
n0.
035
-0.0
28-0
.098
1.06
9*-0
.144
-0.3
43**
(0.0
93)
(0.0
77)
(0.0
76)
(0.5
95)
(0.1
76)
(0.1
42)
Res
erve
d po
litic
ian*
-0.1
94-0
.547
**0.
409*
-0.4
01*
0.21
0.35
9**
Vill
age
Cha
ract
eris
tic(0
.135
)(0
.243
)(0
.232
)(0
.222
)(0
.338
)(0
.161
)S
C/S
T ho
useh
old
0.18
0***
0.14
5***
0.11
9***
-0.4
01*
-0.0
440.
108*
**(0
.025
)(0
.019
)(0
.026
)(0
.222
)(0
.040
)(0
.039
)S
C/S
T ho
useh
old*
-0.0
210
0.11
2**
0.34
7**
0.51
2***
0.07
2V
illag
e C
hara
cter
istic
(0.0
40)
(0.0
00)
(0.0
55)
(0.1
37)
(0.0
93)
(0.0
45)
Eco
nom
ic D
isad
vant
age
0.01
10.
092*
**0.
096*
**-0
.201
-0.0
180.
060*
**(0
.027
)(0
.015
)(0
.014
)(0
.158
)(0
.031
)(0
.019
)E
cono
mic
Dis
adva
ntag
e*-0
.001
-0.0
05-0
.065
0.18
3*0.
271*
**0.
045*
Vill
age
Cha
ract
eris
tic(0
.051
)(0
.020
)(0
.050
)(0
.098
)(0
.076
)(0
.025
)Fa
mily
pol
itica
l his
tory
-0.0
51*
-0.0
37*
-0.0
22-0
.149
0.02
20.
016
(0.0
28)
(0.0
22)
(0.0
21)
(0.2
02)
(0.0
42)
(0.0
35)
Fam
ily p
oliti
cal h
isto
ry*
0.04
80
-0.0
920.
076
-0.1
03-0
.058
Vill
age
Cha
ract
eris
tic(0
.040
)(0
.046
)(0
.065
)(0
.125
)(0
.096
)(0
.042
)Fi
xed
effe
cts
Vill
age
GP
GP
Vill
age
Vill
age
Vill
age
R-s
quar
ed0.
360.
30.
30.
370.
380.
36N
5369
5369
5369
5348
5159
5287
3. R
egre
ssio
ns in
clud
e th
e ho
useh
old
cont
rols
def
ined
in n
otes
to T
able
4. E
cono
mic
dis
adva
ntag
e is
a d
umm
y w
hich
equ
als
one
if th
e ho
useh
old
head
is il
liter
ate
or la
ndle
ss. O
ther
var
iabl
e de
finiti
ons
are
in n
otes
to T
able
s 1
and
2.
Form
al re
turn
s, li
tera
cy, a
nd in
form
atio
nP
oliti
cal d
omin
ance
Tabl
e 5.
5: V
illag
e C
hara
cter
istic
s an
d B
enef
icia
ry S
elec
tion
for B
PL
card
s
Not
es
1. O
LS re
gres
sion
s w
ith s
tand
ard
erro
rs, c
lust
ered
by
villa
ge, i
n pa
rent
hese
s. *
sig
nific
ant a
t 10%
; **
at 5
%; *
** a
t 1%
.2.
The
dep
ende
nt v
aria
ble
is a
n in
dica
tor v
aria
bles
whi
ch e
qual
s on
e if
the
resp
onde
nt's
hou
seho
ld h
as a
BP
L ca
rd.
35
6. POLICY IMPLICATIONS 6.1 The results from the four papers reported above have some important lessons for policy. We list some of them below:
a. Caste Reservations work by improving targeting of private transfers to schedule castes and tribes.
We find that programs that provide private benefits such as toilets, housing and transfers to the poor and disadvantaged (including provision of BPL card) are more likely to reach SC/STs when the GP has a Pradhan that is reserved for an SC/ST. This suggests that caste reservations are effective in including disadvantaged groups into the purview of local government. It supplements previous research that finds that woman Pradhans in seats reserved for women tend to make decisions more in line with the needs of women (Chattopadhyay and Duflo, 2004a). b. Pradhans prefer their home village: The home village of the pradhan tends to receive more high-spillover public goods than other villages in the GP controlling for factors such as village size and head quarter status. This result, a consequence of the incentives that underlie democracy, points to inequalities that may exist within GPs that could be persistent and may be important to address. c. Gram Sabhas may be central to effective local government but are not regularly held: When gram sabhas are held we find that benefits are better targeted to the poor and disadvantaged, and reduce political opportunism. Therefore they seem to improve the transparency of government. Further research will have to determine how this works and their implications for public goods allocation, but clearly they are potentially central to the effective and equitable functioning of GPs. The fact that they are often not held is worrying and needs attention. Also, while SC/STs are more likely to participate in gram sabhas, presumably because of their role in beneficiary selection, we find that women are far less likely to attend them. This is a potential source of gender exclusion that needs attention. d. Literacy Matters: Several results point to the importance of village literacy in improving the functioning of GPs – in reducing political opportunism, improving targeting, etc. We also find that more educated politicians are less opportunistic and perceived as better performing. Therefore, investments in human capital can be central to improving the quality of democratic governance in addition to their enhancing individual well-being. e. Finance Matters Corroborating findings from the recent World Bank report on fiscal decentralization in India (World Bank, 2004), we find that differences in the quality of local government between the four South Indian states are correlated with what we know of their levels of fiscal decentralization. In particular, Kerala has led the other states in providing public services at the local level but seems to be slipping more recently in a manner that concurs with its worsening fiscal situation. More generally we find that it is very difficult to understand the state of GP finances because of vast inconsistencies in accounting practices at the GP level.
36

GP budgetary data is therefore very difficult to obtain and even when it is available is difficult to compare and evaluate. f. Socio-Cultural Institutions Matter We show that villages demonstrate high levels of inequality within them, and that this is inequality is both within and between castes. We find evidence showing that caste dominance tends to increase political opportunism. g. Higher salaries may reduce opportunism A result with direct policy implications is that relatively higher real wages for politicians tend to attract wealthier politicians and to improve targeting of disadvantaged groups which suggests a reduction in political opportunism.
6.2 These findings provide some important insights into the political economy and the institutional setting for panchayats. In future research we hope to examine the role of land reform in reducing economic and social inequality, and the quality of government. We will also examine the determinants and implications of social, economic and political participation.
37

REFERENCES Alsop, Ruth, Anirudh Krishna, and Disa Sjoblom. (2000) “Inclusion and Local Elected Governments: The
Panchayat Raj System in India.” Social Development Paper 37. World Bank, South Asia Region, Social Development Unit, Washington, D.C.
Banerjee, Abhijit and Laksmi Iyer (2003). “History, Institutions and Economic Performance: The Legacy
of Colonial land Tenure Systems in India.” mimeo, MIT. Bardhan, Pranab, (2002) “Decentralization of Government and Development,” Journal of Economic
Perspectives 16(4), 185-205. Bardhan, Pranab and Dilip Mookherjee. (2000) “Capture and Governance at Local and National Levels.”
American Economic Review. 90(2), 135-139. Bardhan, Pranab and Dilip Mookherjee, (2003) “Political Economy of Land Reforms in West Bengal
1978-98 ." mimeo Boston University. Besley, Timothy, Rohini Pande, Lupin Rahman and Vijayendra Rao. (2004a), “The Politics of Public
Good Provision: Evidence from Indian Local Governments,” Journal of the European Economics Association, 2(2-3), 416-426.
Besley, Timothy, Rohini Pande, Vijayendra Rao and Radu Ban, (2004b), “Tokenism or Agency? The
Impact of Women’s Reservation on Panchayats in South India.” mimeo, Development Research Group, The World Bank
Besley, Timothy, Rohini Pande and Vijayendra Rao, [2005a], “Participatory Democracy in Action:
Survey Evidence from India," forthcoming in the Journal of the European Economics Association. Besley, Timothy, Rohini Pande and Vijayendra Rao.[2005b] “Panchayats and Resource Allocation: A
Comparison of the South Indian States,” mimeo Besley, Timothy, Rohini Pande and Vijayendra Rao [2005c]. “Political Selection and the Quality of
Government: Evidence from South India,” mimeo. Bhagavan, Manu. (2003) Sovereign Spheres: Princes, Education and Empire in Colonial India, Oxford
University Press, New Delhi. Chattopadhyay, Raghabendra and Esther Duflo, (2004a), “Women as Policy Makers: Evidence from a
India-Wide Randomized Policy Experiment,” Econometrica, 72(5), 1409-1444. Chaudhuri, Subham and Patrick Heller, (2004) "Building Local Democracy: Evaluating the Impact of
Decentralization in Kerala," Paper presented to Netsappe III, Paris, June 2004 Crook, Richard C. and James Manor. (1998) Democracy and Decentralisation in South Asia and West
Africa : participation, accountability, and performance. Cambridge ; New York : Cambridge University Press.
38
Dyson, Tim and Mick Moore (1983) ‘On Kinship Structure, Female Autonomy, and Demographic Behavior in India’ Population and Development Review Vol.9, No. 1, pp 35-60.
Faguet, Jean Paul, (2004), “Does Decentralization Increase Responsiveness to Local Needs? Evidence
from Bolivia,” Journal of Public Economics, 88: 867-894. Foster, Andrew and Mark Rosenzweig, (2001), “Democratization, Decentralization and the Distribution
of Local Public Goods in a Poor Rural Economy,” mimeo, Brown. Jeffrey, Robin (1993), Politics, Women and Well-Being: How Kerala Became "A Model,” Oxford
University Press, Delhi Manor, James. (2004) “Democratization with Inclusion: political reforms and people’s empowerment at
the grassroots,” Journal of Human Development, 5(1), 5-29. Matthew, George and Nirmala Buch. (2000) Status of Panchayati Raj in the States and Union Territories
of India 2000, Institute for Social Studies, Delhi. Platteau, Jean-Philippe and Anita Abraham, [2002], “Participatory Development in the Presence of
Endogenous Community Imperfections,” Journal of Development Studies, 39(2), 104-136. Triesman, Daniel. (2002) “Decentralization and the Quality of Government,” mimeo, UCLA. Verba, Sidney, Kay Lehman Scholzman and Henry E. Brady, (1995) Voice and Equality: Civic
Voluntarism in American Politics Cambridge Mass: Harvard University Press. World Bank (2004) "India: Fiscal Decentralization to Local Governments," Report No. 26654-IN, Rural
Development Unit, South Asia Region. World Bank (2000) Overview of Rural Decentralization in India, Vol 1, 2, and 3, Rural Development
Unit, South Asia Region.
39

ANNEX A:
Panchayats and Resource Allocation: A Comparison of the South Indian States

Panchayats and Resource Allocation: A
Comparison of the South Indian States�
Timothy Besley
LSE
Rohini Pande
Yale University
Vijayendra Rao
World Bank
Draft: April 2005
Contents
1 Introduction 3
2 Methodology 7
2.1 Sampling . . . . . . . . . . . . . . . . . . . . . . . . . . . . . . 7
2.2 Questionnaires . . . . . . . . . . . . . . . . . . . . . . . . . . 11
3 State Comparisons 12�Acknowledgements: We are grateful to Radu Ban, Lupin Rahman, Siddharth Sharma
and Jillian Waid for research assistance, and the IMRB sta¤ for conducting the survey.
We thank the World Bank�s Research Committee and the South Asia Rural Development
Unit for �nancial support. The opinions in the report are those of the authors and do not
necessarily re�ect the points of view of the World Bank or its member countries.
1

3.1 Background . . . . . . . . . . . . . . . . . . . . . . . . . . . . 15
3.2 Evidence . . . . . . . . . . . . . . . . . . . . . . . . . . . . . . 20
3.2.1 Cross Village Resource Allocation . . . . . . . . . . . . 21
3.2.2 Household targeting . . . . . . . . . . . . . . . . . . . 24
3.2.3 Participation, Information and Socio-Political Structure 26
4 Conclusions 32
2

1 Introduction
The 73rd amendment to the Indian constitution, passed in 1993, has been
one of the most important pieces of legislation in recent Indian history. Its
goals are:
a) To systematize the functioning of Panchayati Raj Institutions (PRIs)
by mandating regular elections to the three tiers of local self government,
and requiring states to both increase PRI taxation and spending power, and
PRIs allocation of state and central discretionary funds.
b) To ensure that disadvantaged groups within village communities are
granted a voice in local deliberations, the 73rd amendment also mandated
that 1/3rd of all elected positions in Panchayats, including Panchayat pres-
ident, be reserved for women. Similarly elected positions in Panchayats are
to be reserved for Scheduled Castes and Tribes in proportion to their popu-
lation share. No elected post should be reserved for the same group for two
consecutive elections.
All National governments since 1993 have been committed to the im-
plementation of the amendment, and State governments have complied with
varying degrees of commitment. The current United Progressive Alliance
(UPA) government in Delhi has gone even further and asserted in its Com-
mon Minimum Program that:
1) After consultations with States, the UPA Government will
ensure that all funds given to States for poverty alleviation and
rural development schemes by Panchayats are neither delayed nor
diverted. Monitoring will be strict. In addition, after consultation
3
with States, the UPA Government will consider crediting elected
Panchayats such funds directly.
2) Devolution of funds will be accompanied by a similar devo-
lution of functions and functionaries as well. Regular elections to
Panchayat bodies will be ensured and the amended Act in respect
of the Fifth and Sixth Schedule Areas will be implemented.
3) The UPA Government will ensure that the Gram Sabha is
empowered to emerge as the foundation of Panchayati Raj. "
Thus, there is likely to be a renewed emphasis on PRIs as a means of
providing public services to the poor, and thereby ensuring that rural com-
munities can bene�t from the gains to economic growth.
This experiment in decentralization is, arguably, one of the most ambi-
tious experiments in redesigning governance structures undertaken by a low
income country. The stated aim was to improve citizens�ability to access
and in�uence the public service delivery system and to directly tackle social
exclusion by a system of political reservations. Despite the breadth of this
democratic experiment, there is remarkably little quantitative evidence on
how well the experiment has worked. There is, however, a large and growing
qualitative and "action research" literature on Panchayats that come to a
diverse set of conclusions - re�ecting the di¢ culties of studying such a broad
topic in a such a complex country. A comprehensive review of this literature
is beyond the scope of this report but overviews can be found in World Bank
(2000), Matthew and Buch (2000), and Manor (1998).
Qualitative work has important strengths, but it also has important weak-
nesses (Rao and Woolcock 2003), central among which is its relative inability
4
to generate generalizable �ndings which are essential to a policy dialogue.
It is also more suited to demonstrating correlations or "a¢ nities" rather
than clear causal connections - for instance on the important question of the
impact of the reservations policy. Therefore, an informed policy dialogue
requires both qualitative and quantitative information.
Quantitative analysis of Panchayats using large samples are rare. An ex-
ception to this is the important work by Chattopadhyay and Du�o (2004a)
on the causal impact of women�s reservations on Panchayat action in Ra-
jasthan and West Bengal. They �nd that reservations improve the ability of
women to govern, in a way that is congruent with the desires of women in
the population. Work by Alsop, Krishna and Sjoblom (2000), also on Ra-
jasthan and Madhya Pradesh, highlights the role of reservation in reducing
the systematic exclusion of women and disadvantaged groups from decision
making processes at the local level. Chaudhuri and Heller (2004) have, more
recently, completed a survey studying the impact of the "People�s Campaign
for Decentralized Planning" in Kerala showing that it increased the level of
particpatory planniong in panchayats, had a positive impact on development
performance and on social inclusion, but that levels of participation have
declined in recent years - �ndings that are consistent with our study.
But, given the scope of the experiment and regional focus of the existing
quantitative work, a large number of open questions remain. How well has de-
centralization worked in early adopter states such as Kerala and Karnataka?
How do village Panchayats raises resources and implement policies? What
is the impact of caste reservations? Do village meetings open to all citizens
(Gram Sabha meetings) succeed in increasing the voice of the poor and dis-
5

advantaged? Answering these question are crucial in formulating Panchayat
policy.
The above questions also point to a crucial need for a sound, quantitative
evidentiary base to provide some answers to these questions. Quantitative
data collection can also allow us to establish a baseline regarding functioning
of PRIS that will permit researchers and policymakers to identify how public
service delivery via PRIs changes as PRIs get more resources and more powers
over time. These observations motivate the research that underlies this
report.
This paper is based on survey evidence collected by the authors in con-
junction with the World Bank in four Indian states (Andhra Pradesh, Tamil
Nadu, Karnataka and Kerala) in 2002. The survey focussed on the local tier
of elected self government �Gram Panchayats (GP).
Section 3 describes the sampling methodology and survey design in detail.
Section 4 describes the institutional di¤erences in PRIs across our four sample
states, and studies the di¤erences in the e¤ectiveness of GP Institutions. This
analysis is informative of the extent to which states di¤er in the provision
of public services at the village level, and how GP activism di¤ers in the
four states. Section 5 summarizes �ndings from a research program which
uses these data to conduct in-depth analysis of the political economy of GP,
reservations for women, reservations for Scheduled Castes and Tribes, and the
e¤ectiveness of Gram Sabha meetings. Section 6 draws out the implications
of the �ndings from this analysis for policy.
6

2 Methodology
Our data come from a village- and household- level survey conduced in
Andhra Pradesh (AP), Karnataka (KA), Kerala (KE) and Tamil Nadu (TN).
The survey was conducted between September-November 2002.
The administrative unit below the state in India is the district. Each
Indian district is divided into blocks. Every block consists of multiple GPs.
A GP typically consists of 1-5 revenue villages, and its demarcation is done
on a population basis. The Panchayat Act of every Indian states mandates
the population criteria to be followed in that state.1
Sampling was done in multiple stages, and consisted of purposive sam-
pling up to the level of blocks and random sampling within these blocks.
Our �nal sample consists of 527 villages belonging to 201 elected GPs. In
a random sub-sample of 259 villages, 20 household surveys per village were
conducted, giving a sample of 5,180 households. In addition, a household
survey was also �elded to an elected member of the GP in every village (with
precedence given to the GP head if he/she lived in that village) - this gives
us an additional household sample of 544 elected o¢ cials. We describe the
stages of our sampling below.
2.1 Sampling
� District sample: for each pair of states two districts (one per state)
that shared a common boundary were selected. One district in KA
1In Andhra Pradesh and Kerala, it is a (revenue) village irrespective of its size. In
Tamil Nadu it is a revenue village with population of 500 or more. In Karnataka it is a
group of villages with population between 5 and 7 thousand.
7
(Kolar) that shared boundaries with both AP and TN entered the
sample twice. The same holds for one district in AP (Chithoor) This
gives us nine unique districts - 2 districts each in AP, KE and TN
and 3 in KA. The district pairs were selected, with one exception, to
focus on districts that had belonged to same administrative unit during
colonial rule, but had been transferred to di¤erent units when the states
were reorganized in 1956. These are the districts of Bidar and Medak
from the erstwhile state of Hyderabad, now in KA and AP respectively,
Pallakad, Coimbatore, Kasargod, Dakshin Kanada, Dharmapuri, and
Chithoor, all from erstwhile Madras state and now in KE, TN, KE,
KA, TN and AP respectively.
In KA, we also sampled Kolar district. This was a part of erstwhile
Mysore state, the precursor to modern KA, and thus does not follow the
colonial- rule matching process described above. However, its inclusion
increases variation when we compare the other three states with KA.
Furthermore, Kolar has common borders with both Chithoor in AP and
Dharmapuri in TN - which allows for a three part comparison within
the same geographic area. Map 1 provides a graphical description of
this matching.
� Block sample: For each district pair (which shared a common bound-
ary) 3 pairs of blocks were selected (that is, 3 blocks in each of the two
districts). If one district was matched with 2 di¤erent districts then
6 blocks were chosen from it (three per match). In one block in KE
an additional block was sampled as a check on our language matching.
This gave us a total of 37 blocks (12 in KA, 9 in AP and TN and 7 in
8
KE).2
For each pair of districts the three pairs of blocks which were the most
�linguistically similar�, in terms of the mother tongue of individuals
living in the block, were chosen. Language is a good proxy in these
regions for cultural di¤erences given the prevalence of caste and lin-
guistic endogamy. Hence, language matching allows us to partially
control for "unobservable" socio-cultural di¤erences. Linguistic simi-
larity was computed using 1991 census block level language data. The
historical and administrative similarity of linguistically matched blocks
was checked using princely state maps and the Report of the States
Reorganization Committee. Details on how the linguistic and historic
matching was implemented are in Appendix II.
� GP sample: In AP, KA and TN we randomly sampled 6 GPs per
block. In KE the population per GP in KE is roughly double that in
the other three states. For this reason, in KE we instead sampled 3
GPs in every block. This procedure gave a total of 201 GPs.
� Village sample: In every sampled GP in AP, KA and TN we sampled
all villages if the GP had 3 or fewer villages. If it had more than
three villages, then we selected the Pradhan�s village and randomly
selected two other villages. We excluded all villages with less than 200
persons from our sampling frame. All hamlets with population over
200 were considered as independent villages in drawing the sample. In
KE, we directly sampled wards instead of villages (as villages in KE
2The additional block was sampled in Kerala as a check on our sampling strategy.
9

tend to be very large) - we sampled 6 wards per GP. This gave us
a �nal village sample size of 527 villages.3 For sampled villages, any
associated hamlets were also included as part of the sample.
� Household village sample: In every block in AP, KA and TN we
randomly selected 3 of our 6 sampled GPs and conducted household in-
terviews in all sampled villages falling in these GPs. In KE we randomly
selected 2 GPs in one block and one GP in the other block. Within
sampled GPs we conducted household interviews in all sampled wards.
Overall this gave us a �nal sample size of 5180 households.4
� Choice of households within a village: Twenty households were
sampled, of which four were always SC/ST. The survey team leader
in every village walked the entire village to map it and identify total
number of households. This was used to determine what fraction of
households in the village were to be surveyed. The start point of the
survey was randomly chosen, and after that every Xth household was
surveyed such that the entire village was covered (going around the
village in a clockwise fashion).
� Elected o¢ cial sample: In every village in our sample an interview
was conducted with an elected Panchayat o¢ cial - if the Pradhan lived
in the village he/she was interviewed, otherwise a ward member was
randomly selected. In some cases, the Pradhan was not available at
3The state-wise break up is AP: 69 villages, KA: 182 villages, KE: 126 wards; TN 129
villages.4Number of villages for household sample were: AP: 32 villages, KA: 90 villages, KE
66 villages, TN 71 villages.
10

�rst visit and a ward member was selected. However, in these cases the
investigator usually went back and interviewed the Pradhan. Hence our
sample of elected o¢ cials is larger than the number of sampled villages
- and stands at 544.
2.2 Questionnaires
Four di¤erent questionnaires were used to collect data at the Village, Politi-
cian and Household level (see Appendix B for the questionnaires).
At the village level two questionnaires were used. First, we administered a
questionnaire using Participatory Rapid Appraisal (PRA) techniques (Cham-
bers 2003) to a group of men selected to represent di¤erent caste groups in
the village. The PRA questionnaire assessed villagers views on problems in
the village, and the work done by the GP. The PRA was also used to collect a
detailed listing of castes within the village, and land distribution both within
and between castes. The PRA respondents were also asked to construct an
oligarchy matrix for the village - listing the extent to which prominent ac-
tivities in the village were controlled by the Pradhan, former Pradhan and
the Vice-Pradhan. A short PRA-based questionnaire was separately �elded
to a (i) a group of women and (ii) a group of SC/ST individuals. These
PRA obtained separate measures of women�s and SC/ST problem ranking
vis-a-vis public service delivery.
The second village-level questionnaire was an audit of all public goods
in the village. This was an independent audit conducted by an investigator
who visually assessed the quality of schools, clinics, roads, drinking water,
and sanitation and also identi�ed the extent of GP involvement improving
11

these facilities.
In 259 villages we �elded household surveys. Twenty households were
surveyed per village, with 10 male and 10 female respondents. Four SC/ST
households were purposively selected in every village. The household ques-
tionnaire obtained information on household�s socio-economic status, house-
hold structure, views and use of public services in the village, private govern-
ment bene�ts. Respondents were also asked to rank-order problems in the
village. Since the sample is divided between male and female and SC/ST and
non-SC/ST respondents this provides yet another source of information on
gender and caste di¤erences on preferences about village problems. In each
of the 522 sample villages a household survey was also conducted with one
elected GP o¢ cial. In addition to all the questions on the household ques-
tionnaire politicians were also asked a series of questions about their conduct
of GP activities.
3 State Comparisons
The empirical analysis in this report focusses on comparing GPs in the four
South Indian states of Andhra Pradesh, Karnataka, Kerala and Tamil Nadu.
An important question that remains in understanding the relative impact of
the decentralization in these four states is the extent to which their political
history and social structure have a¤ected the functioning of local govern-
ments. There is considerable evidence demonstrating that the Travancore
region that is currently part of the state of Kerala has a long history of
progressive policies since (Je¤rey, 1992). Similarly Mysore state which is
12
currently part of the state of Karnataka was also ruled by relatively au-
tonomous rulers who placed a special emphasis on education and economic
development (Bhagavan, 2003). Recent work by Banerji and Iyer (2003)
has shown that there are strong path dependencies in land tenure policies -
speci�cally whether the region of India had a zamindari or ryotwari system in
place during British Rule. These systems which were established early in the
19th century are shown to have signi�cant contemporary impacts on the a
variety of indicators of development. Furthermore, scholars have argued that
di¤erences in cultural systems can have an important e¤ect of human devel-
opment (e.g. Dyson and Moore, 1983). Given these path-dependencies and
the cultural di¤erences, it is possible that Kerala is di¤erent because "Kerala
is Kerala". There is something special about the state that makes it partic-
ularly hospitable to good, equitable governance. If such path -dependencies
prove to be de�nitive, then policy options are likely to be relatively small.
The sampling strategy outlined above allows us to compare the states,
controlling for di¤erences that may come from historical or cultural path-
dependencies. We will compare villages on either side of the current borders
that originally belonged to the same political entity, and which have also
been matched by majority language. Thus, any di¤erences we observe be-
tween these matched villages cannot be because of di¤erent political histories
prior to 1956, or because of di¤erences langauge - which is a proxy for local
kinship structure and social organization. The di¤erences have to attributed
to di¤erences that have emerged after 1956. The comparison is particularly
interesting because the states provide an excellent contrast of di¤erences in
the implementation of the 73rd amendment. In this section, we will brie�y
13

highlight these di¤erences.5
In the last two decades there have been important di¤erences in how
states have structured panchayats. Some of these di¤erences are summarized
in Table 1. Consider the data on village funding. The data are from 1997
and likely to be considerably di¤erent today, but some di¤erences that are
consistent with the above discussion can be discerned. It is clear that the four
states di¤er considerably in the availability of funding to GPs. Much of the
funding is tied to particular programs and the level of discretionary funding
di¤ers even more across the states. Kerala clearly dominates, followed by
Karnataka. These two states are the subject of an excellent recent report on
�scal decentralization (World Bank 2004) which makes clear that Kerala and
Karnataka are rather di¤erent from in each other in many respects. While
Kerala followed a learning-by-doing strategy of progressively increasing the
responsibility of GPs with a signi�cant decentralization program, Karnataka
has been more cautious in its approach with more authority in the hands
of the state government. Both these states, despite being better than other
Indian states, do not have good accounting systems which does not permit for
much transparency in local funding decisions. An important conclusion of the
report is the fact Kerala has faced signi�cant �scal problems in recent years.
This has caused considerable strain in GP �nances, with promised allocations
from state governments not being sanctioned to GPs. Thus, while Kerala has
over the years been leading in giving GPs considerable �scal authority and
power, in recent years this authority has su¤ered considerable strains. Thus,
the report concludes "a necessary condition for a well-functioning system
5The state di¤erences are derived from a note prepared by Geeta Sethi (SASRD).
14
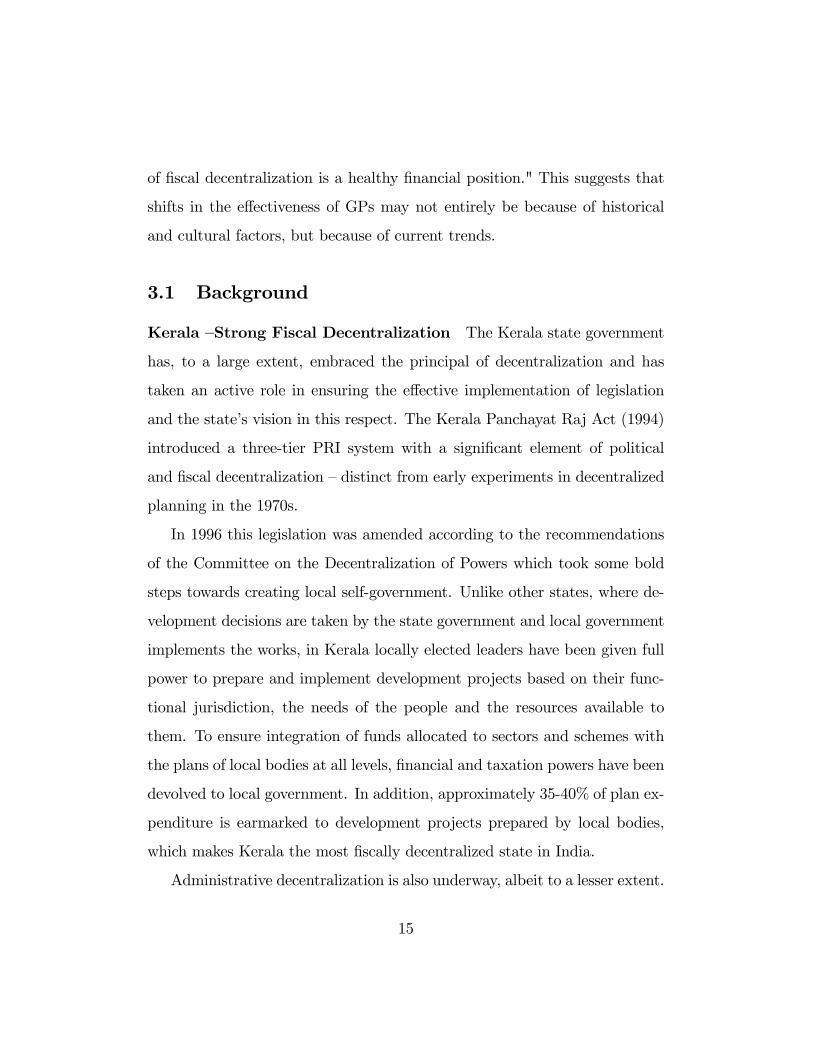
of �scal decentralization is a healthy �nancial position." This suggests that
shifts in the e¤ectiveness of GPs may not entirely be because of historical
and cultural factors, but because of current trends.
3.1 Background
Kerala �Strong Fiscal Decentralization The Kerala state government
has, to a large extent, embraced the principal of decentralization and has
taken an active role in ensuring the e¤ective implementation of legislation
and the state�s vision in this respect. The Kerala Panchayat Raj Act (1994)
introduced a three-tier PRI system with a signi�cant element of political
and �scal decentralization �distinct from early experiments in decentralized
planning in the 1970s.
In 1996 this legislation was amended according to the recommendations
of the Committee on the Decentralization of Powers which took some bold
steps towards creating local self-government. Unlike other states, where de-
velopment decisions are taken by the state government and local government
implements the works, in Kerala locally elected leaders have been given full
power to prepare and implement development projects based on their func-
tional jurisdiction, the needs of the people and the resources available to
them. To ensure integration of funds allocated to sectors and schemes with
the plans of local bodies at all levels, �nancial and taxation powers have been
devolved to local government. In addition, approximately 35-40% of plan ex-
penditure is earmarked to development projects prepared by local bodies,
which makes Kerala the most �scally decentralized state in India.
Administrative decentralization is also underway, albeit to a lesser extent.
15
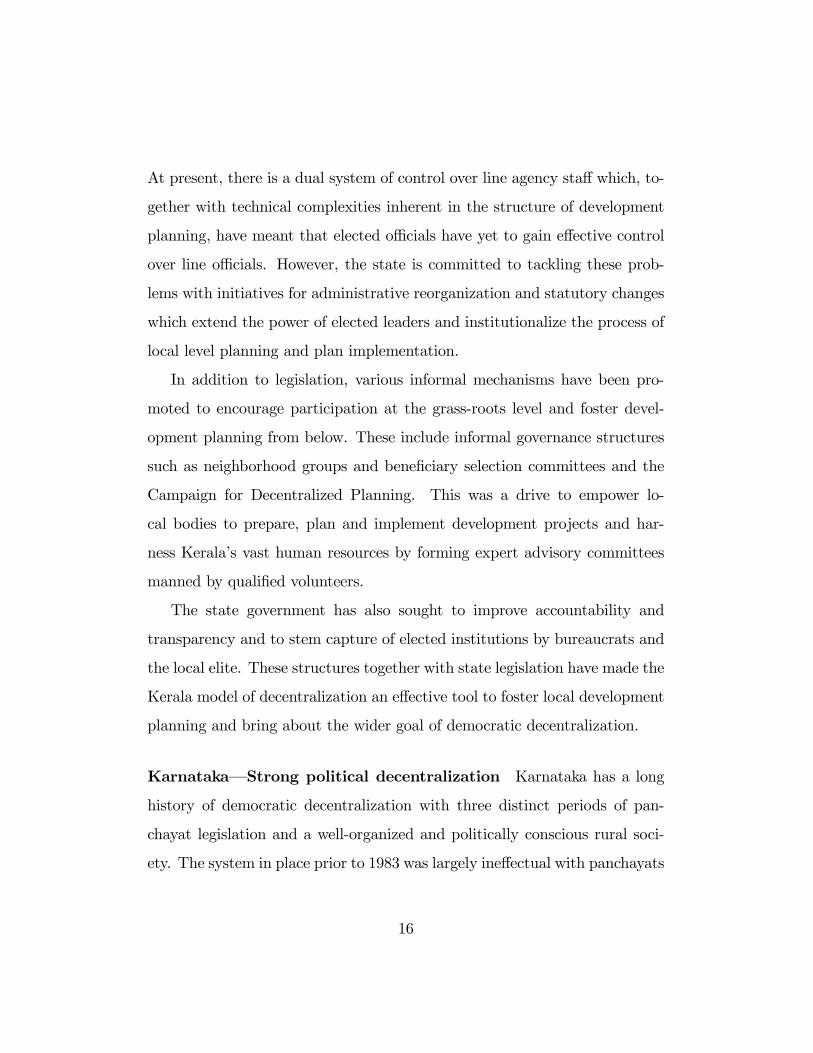
At present, there is a dual system of control over line agency sta¤ which, to-
gether with technical complexities inherent in the structure of development
planning, have meant that elected o¢ cials have yet to gain e¤ective control
over line o¢ cials. However, the state is committed to tackling these prob-
lems with initiatives for administrative reorganization and statutory changes
which extend the power of elected leaders and institutionalize the process of
local level planning and plan implementation.
In addition to legislation, various informal mechanisms have been pro-
moted to encourage participation at the grass-roots level and foster devel-
opment planning from below. These include informal governance structures
such as neighborhood groups and bene�ciary selection committees and the
Campaign for Decentralized Planning. This was a drive to empower lo-
cal bodies to prepare, plan and implement development projects and har-
ness Kerala�s vast human resources by forming expert advisory committees
manned by quali�ed volunteers.
The state government has also sought to improve accountability and
transparency and to stem capture of elected institutions by bureaucrats and
the local elite. These structures together with state legislation have made the
Kerala model of decentralization an e¤ective tool to foster local development
planning and bring about the wider goal of democratic decentralization.
Karnataka� Strong political decentralization Karnataka has a long
history of democratic decentralization with three distinct periods of pan-
chayat legislation and a well-organized and politically conscious rural soci-
ety. The system in place prior to 1983 was largely ine¤ectual with panchayats
16

having little real power.
In 1983 the Government of Karnataka, led by the Janata Party, passed a
radical decentralization act which legislated a two-tier panchayati raj system
with reservations for women and SCs and STs and a local participatory insti-
tution called the Gram Sabha. This was taken as a basis for the subsequent
Karnataka Panchayat Raj Act (1993) passed in order to bring state legisla-
tion in line with the 73rd and 74th Amendments to the Constitution. The
Act introduced a three-tier system with the aim of empowering representative
local government and fostering local participation in rural development to-
gether with the formation of the District Planning Committee (DPC) whose
main function involved overseeing the development plan for the district as
a whole. Particular focus was placed on distributing political power within
PRIs to improve accountability and reduce elite-group capture by introducing
rotation of leadership between elected members.
Andhra Pradesh� Weak Political Decentralization Since 1958, Andhra
Pradesh has incorporated the PRI system in its state legislation, the most
recent being the Andhra Pradesh Panchayat Raj Act (1994). In addition to
constitutional requirements this act introduced reservation of seats for the
Backward Classes and party-based elections for the top two tiers of local
government.
In practice, the state vision of PRIs, and their role with respect to develop-
ment planning and local governance, is mixed. While several sub-committees
have been formed to examine decentralization with regards to panchayats,
the state legislator has done little to empower them. Identi�cation of PRI
17
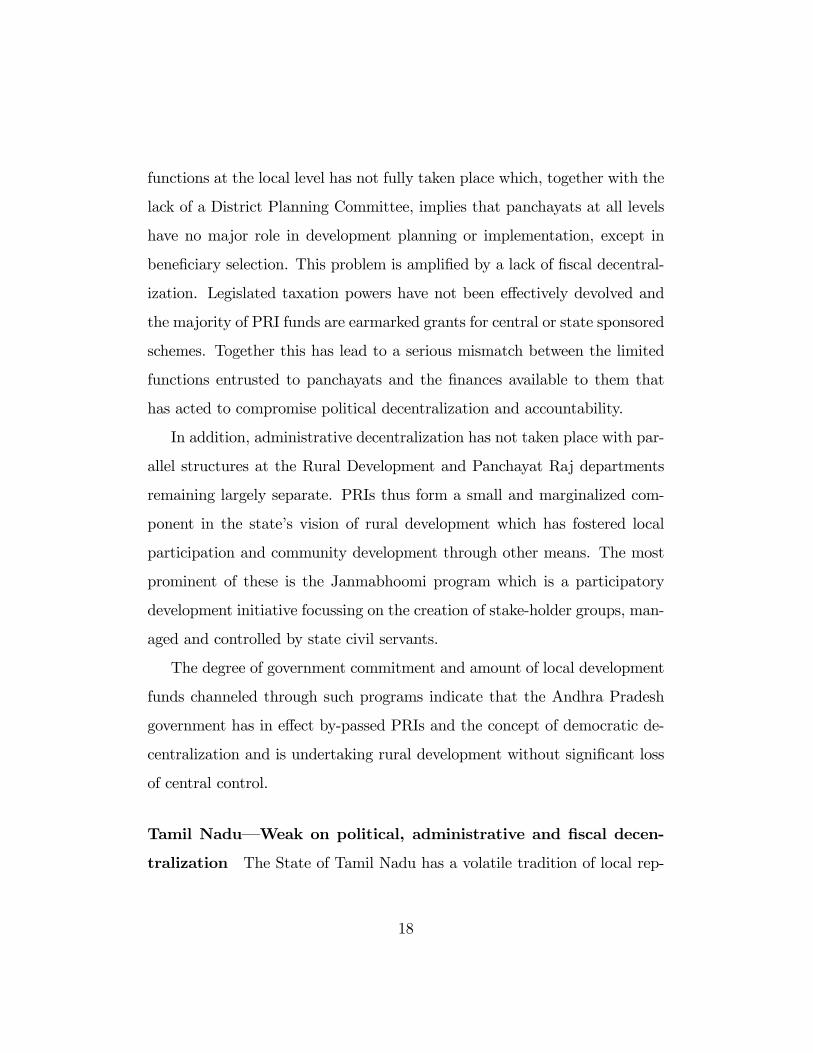
functions at the local level has not fully taken place which, together with the
lack of a District Planning Committee, implies that panchayats at all levels
have no major role in development planning or implementation, except in
bene�ciary selection. This problem is ampli�ed by a lack of �scal decentral-
ization. Legislated taxation powers have not been e¤ectively devolved and
the majority of PRI funds are earmarked grants for central or state sponsored
schemes. Together this has lead to a serious mismatch between the limited
functions entrusted to panchayats and the �nances available to them that
has acted to compromise political decentralization and accountability.
In addition, administrative decentralization has not taken place with par-
allel structures at the Rural Development and Panchayat Raj departments
remaining largely separate. PRIs thus form a small and marginalized com-
ponent in the state�s vision of rural development which has fostered local
participation and community development through other means. The most
prominent of these is the Janmabhoomi program which is a participatory
development initiative focussing on the creation of stake-holder groups, man-
aged and controlled by state civil servants.
The degree of government commitment and amount of local development
funds channeled through such programs indicate that the Andhra Pradesh
government has in e¤ect by-passed PRIs and the concept of democratic de-
centralization and is undertaking rural development without signi�cant loss
of central control.
Tamil Nadu�Weak on political, administrative and �scal decen-
tralization The State of Tamil Nadu has a volatile tradition of local rep-
18

resentative institutions dating from the 1860s, and was one of the few states
to voice concern over the 73rd and 74th Constitutional Amendments. Wide-
spread state-level reluctance to comply with this legislation is re�ected in the
Tamil Nadu Panchayats Act (1994) which did little to devolve state powers
and empower PRIs, even to the extent that past legislation had done. Elec-
tions were delayed to such an extent that central government threatened to
withdraw all funds for rural development and were �nally held in 1996 when
the DMK party came in power and embraced democratic decentralization as
one of its political mandates.
The experience of decentralization in Tamil Nadu is therefore in �ux
with greater devolution of powers to local government expected in the future.
Under the current legislation, political and functional decentralization is very
limited. PRIs fall under the jurisdiction of state o¢ cials (who have the power
to dissolve them) and there are virtually no state schemes and functionaries
transferred to local government.
The Gram Sabha, till recently, was a defunct institution for community
decision-making with its bene�ciary selection function being carried out by
line or elected o¢ cials at higher levels. However, e¤orts at the grass-roots
level to mobilize democracy in decision-making and rural participation in
development are going some way to improve its e¤ectiveness.
The main locus of state development planning and �nance is still through
the District Rural Development Agency which is a registered body controlled
by state bureaucrats with little connection with PRIs. Panchayats are also
bypassed in rural development planning by the growth of independent state
and central schemes such as the MPs and MLAs Area Development scheme.
19

Lack of �scal autonomy means that local bodies are largely dependent on
the meager state and central government for their resources which are pre-
assigned, state grants for local bodies being 8% of the share in tax collection.
There is also insu¢ cient administrative decentralization, which compromises
accountability. Line o¢ cials working in panchayat bodies are declared gov-
ernment o¢ cials and do not come under the management of local bodies. As
a result local elected o¢ cials cannot supervise their activities or contribute
to their projects except in service delivery.
As mentioned above, it is expected that democratic decentralization will
come to the forefront of rural development planning in the near future with
the change in government. Already recent community training drives and
capacity building for participatory planning at the village level indicate that
major initiatives are underway to strengthen PRIs at all levels.
3.2 Evidence
We now examine cross-state di¤erences in public good provision as a means of
examining whether these di¤erences mirror the institutional di¤erences that
we discussed above. We also discuss whether public good outcomes vary with
reservation and whether it is the Pradhan�s village. Our mode of analysis is
two fold. First, we present cross-tabulations. Second, we report the results
from a basic regression which includes state dummies, dummy for whether
the Pradhan�s post is reserved, a dummy for Pradhan�s village and dummies
for each matched block pair. As discussed above, there is ample reason to
believe that matched blocks share common historical and cultural traits. In
the following discussion we abbreviate Andhra Pradesh to AP, Karnataka to
20
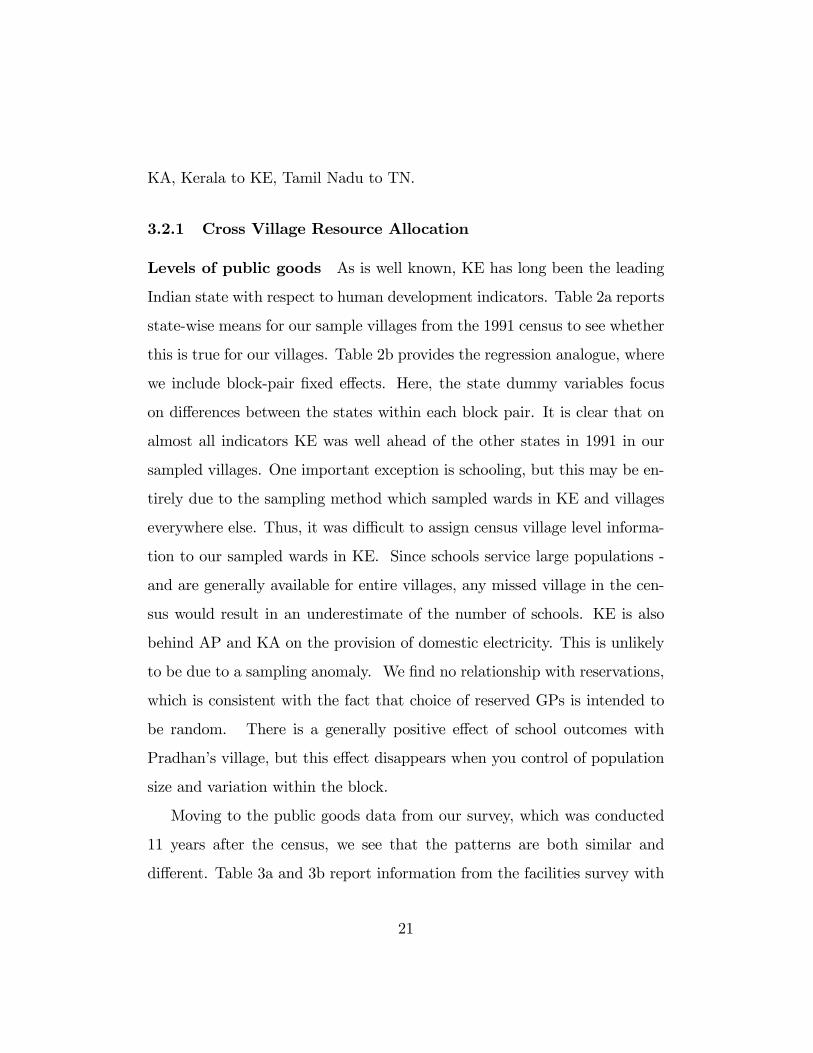
KA, Kerala to KE, Tamil Nadu to TN.
3.2.1 Cross Village Resource Allocation
Levels of public goods As is well known, KE has long been the leading
Indian state with respect to human development indicators. Table 2a reports
state-wise means for our sample villages from the 1991 census to see whether
this is true for our villages. Table 2b provides the regression analogue, where
we include block-pair �xed e¤ects. Here, the state dummy variables focus
on di¤erences between the states within each block pair. It is clear that on
almost all indicators KE was well ahead of the other states in 1991 in our
sampled villages. One important exception is schooling, but this may be en-
tirely due to the sampling method which sampled wards in KE and villages
everywhere else. Thus, it was di¢ cult to assign census village level informa-
tion to our sampled wards in KE. Since schools service large populations -
and are generally available for entire villages, any missed village in the cen-
sus would result in an underestimate of the number of schools. KE is also
behind AP and KA on the provision of domestic electricity. This is unlikely
to be due to a sampling anomaly. We �nd no relationship with reservations,
which is consistent with the fact that choice of reserved GPs is intended to
be random. There is a generally positive e¤ect of school outcomes with
Pradhan�s village, but this e¤ect disappears when you control of population
size and variation within the block.
Moving to the public goods data from our survey, which was conducted
11 years after the census, we see that the patterns are both similar and
di¤erent. Table 3a and 3b report information from the facilities survey with
21

state averages and block-pair �xed e¤ects regressions respectively. KE clearly
dominates the other states on schools, health facilities and drinking water
sources. But it is behind on the number of overhead tanks, bus stops in
the village, and the proportion of households with electric lights. Overhead
tanks are easy to explain since KE probably has di¤erent mechanisms of
water delivery than the other states, but the lack of bus stops in the village
and electric lights may suggest that KE has put a much greater emphasis
on basic investments in education, health and water than on other services.
Looking at di¤erences between the other three states we see that generally
TN lags behind AP and KA, which was not the case in 1991. This suggests
that there has been a reduction in investments in public services in TN in
the last decade, in comparison with AP and KA. Since these results compare
the variation within block pairs, geography should not play a big role in
explaining the di¤erences between states. These di¤erences should re�ect
public investments made since 1956 when the states were reorganized along
linguistic lines. Note again that reservations have no e¤ect, while the current
Pradhan�s home village has better public services.
The fact that KE is ahead in levels of public investments should not
be surprising given the size of allocation to GPs and its e¤orts on �scal
decentralization. But the fact that KA is no di¤erent than AP may lead one
to speculate that KA�s e¤orts on political decentralization have not translated
into results on the ground. TN�s distinctly worsening situation from 1991 to
2002 is also consistent with the fact that it has poorly funded PRIs that lack
authority.
22

GP activism The analysis of di¤erences in the levels of public good avail-
ability re�ect the history of investments in public services since 1956 by each
state. We are unable to distinguish between investments made directly by
the state government, and those made via PRIs. In order to get more insights
into this, we now move to a direct examination of levels of GP activism since
the last election in each of the states6. This Panchayat "activism" in our data
is measured from two di¤erent sources:
a)The facilities survey: Where after making an assessment of a facility
the interviewer asked households living close to the facility about changes
made since the last election.
b) The PRA: Where a detailed set of questions were asked about the
activities of the Panchayat since the last election.
We consider the PRA data to be more accurate than the facilities survey
data on this topic, because the PRA re�ects the results of a consensus view
from a moderated group discussion from a representative sample of knowl-
edgeable people, while the facilities information is more ad hoc. Nevertheless,
we report results from both sources of information. Table 4 begins with the
facilities survey results. The clearest result here is that TN signi�cantly
lags behind the other three states in overall activism, and in investments in
schools, anganwadis, health, drinking water, roads, and street lights. AP and
KA do not show any signi�cant di¤erences with KE in overall activism or in
schools. But they lag behind KE in anganwadis, health and drinking water.
AP does better than all the other states on roads and street lights, while KA
6Since GP elections in AP were held a few months before the survey, the AP results
re�ect activism from the previous election.
23
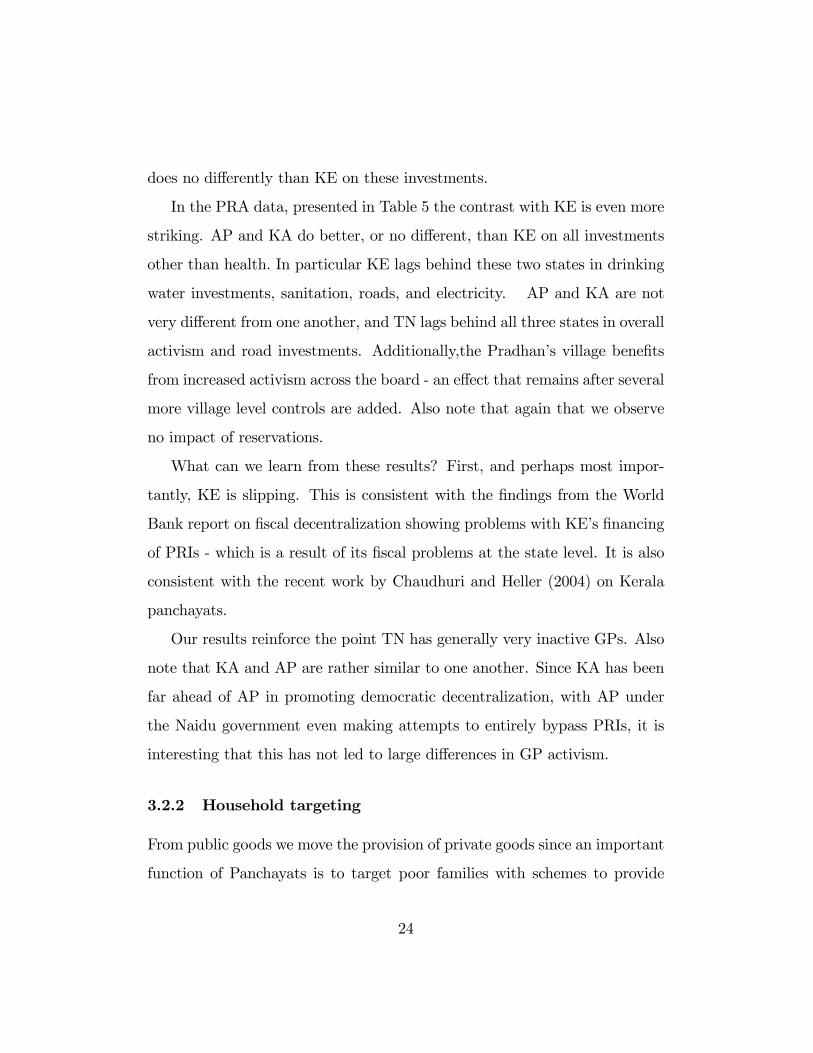
does no di¤erently than KE on these investments.
In the PRA data, presented in Table 5 the contrast with KE is even more
striking. AP and KA do better, or no di¤erent, than KE on all investments
other than health. In particular KE lags behind these two states in drinking
water investments, sanitation, roads, and electricity. AP and KA are not
very di¤erent from one another, and TN lags behind all three states in overall
activism and road investments. Additionally,the Pradhan�s village bene�ts
from increased activism across the board - an e¤ect that remains after several
more village level controls are added. Also note that again that we observe
no impact of reservations.
What can we learn from these results? First, and perhaps most impor-
tantly, KE is slipping. This is consistent with the �ndings from the World
Bank report on �scal decentralization showing problems with KE�s �nancing
of PRIs - which is a result of its �scal problems at the state level. It is also
consistent with the recent work by Chaudhuri and Heller (2004) on Kerala
panchayats.
Our results reinforce the point TN has generally very inactive GPs. Also
note that KA and AP are rather similar to one another. Since KA has been
far ahead of AP in promoting democratic decentralization, with AP under
the Naidu government even making attempts to entirely bypass PRIs, it is
interesting that this has not led to large di¤erences in GP activism.
3.2.2 Household targeting
From public goods we move the provision of private goods since an important
function of Panchayats is to target poor families with schemes to provide
24
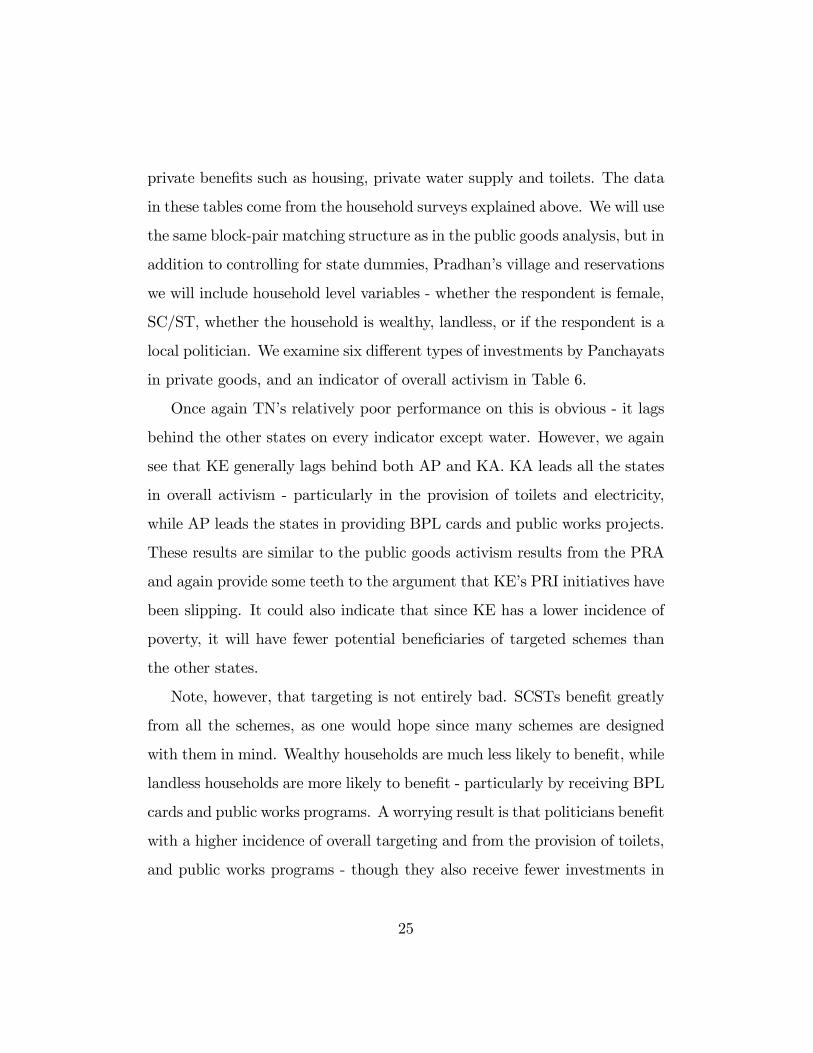
private bene�ts such as housing, private water supply and toilets. The data
in these tables come from the household surveys explained above. We will use
the same block-pair matching structure as in the public goods analysis, but in
addition to controlling for state dummies, Pradhan�s village and reservations
we will include household level variables - whether the respondent is female,
SC/ST, whether the household is wealthy, landless, or if the respondent is a
local politician. We examine six di¤erent types of investments by Panchayats
in private goods, and an indicator of overall activism in Table 6.
Once again TN�s relatively poor performance on this is obvious - it lags
behind the other states on every indicator except water. However, we again
see that KE generally lags behind both AP and KA. KA leads all the states
in overall activism - particularly in the provision of toilets and electricity,
while AP leads the states in providing BPL cards and public works projects.
These results are similar to the public goods activism results from the PRA
and again provide some teeth to the argument that KE�s PRI initiatives have
been slipping. It could also indicate that since KE has a lower incidence of
poverty, it will have fewer potential bene�ciaries of targeted schemes than
the other states.
Note, however, that targeting is not entirely bad. SCSTs bene�t greatly
from all the schemes, as one would hope since many schemes are designed
with them in mind. Wealthy households are much less likely to bene�t, while
landless households are more likely to bene�t - particularly by receiving BPL
cards and public works programs. A worrying result is that politicians bene�t
with a higher incidence of overall targeting and from the provision of toilets,
and public works programs - though they also receive fewer investments in
25
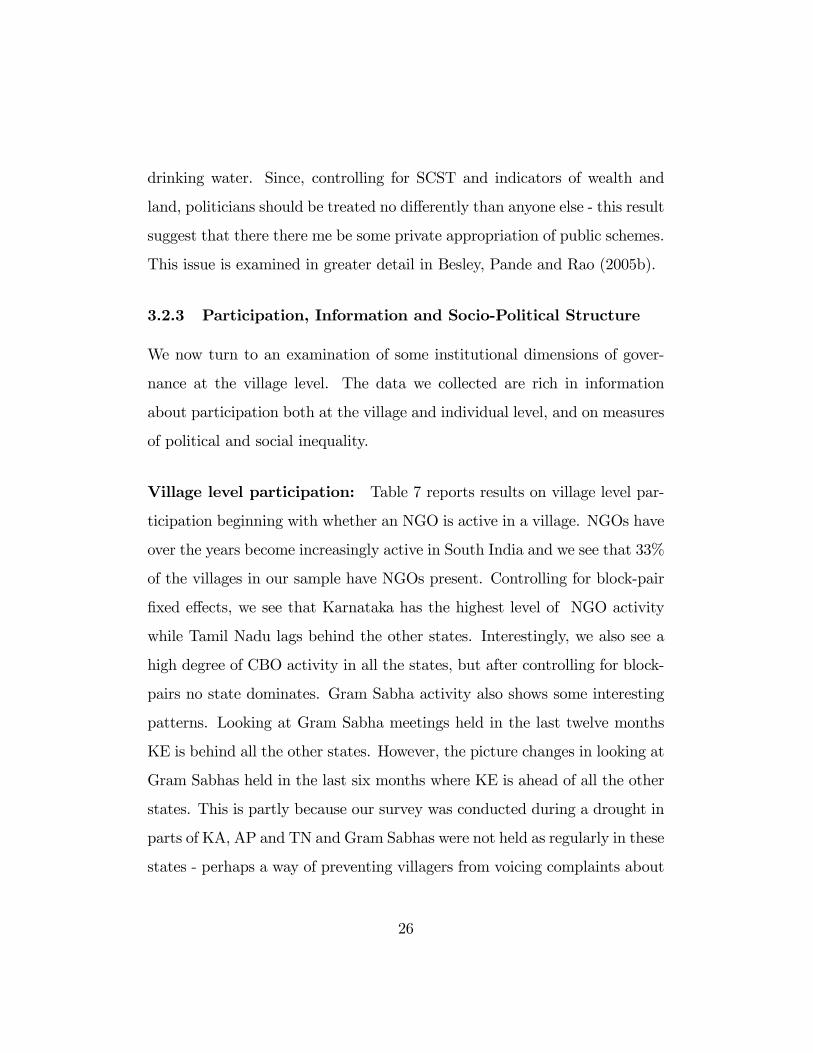
drinking water. Since, controlling for SCST and indicators of wealth and
land, politicians should be treated no di¤erently than anyone else - this result
suggest that there there me be some private appropriation of public schemes.
This issue is examined in greater detail in Besley, Pande and Rao (2005b).
3.2.3 Participation, Information and Socio-Political Structure
We now turn to an examination of some institutional dimensions of gover-
nance at the village level. The data we collected are rich in information
about participation both at the village and individual level, and on measures
of political and social inequality.
Village level participation: Table 7 reports results on village level par-
ticipation beginning with whether an NGO is active in a village. NGOs have
over the years become increasingly active in South India and we see that 33%
of the villages in our sample have NGOs present. Controlling for block-pair
�xed e¤ects, we see that Karnataka has the highest level of NGO activity
while Tamil Nadu lags behind the other states. Interestingly, we also see a
high degree of CBO activity in all the states, but after controlling for block-
pairs no state dominates. Gram Sabha activity also shows some interesting
patterns. Looking at Gram Sabha meetings held in the last twelve months
KE is behind all the other states. However, the picture changes in looking at
Gram Sabhas held in the last six months where KE is ahead of all the other
states. This is partly because our survey was conducted during a drought in
parts of KA, AP and TN and Gram Sabhas were not held as regularly in these
states - perhaps a way of preventing villagers from voicing complaints about
26
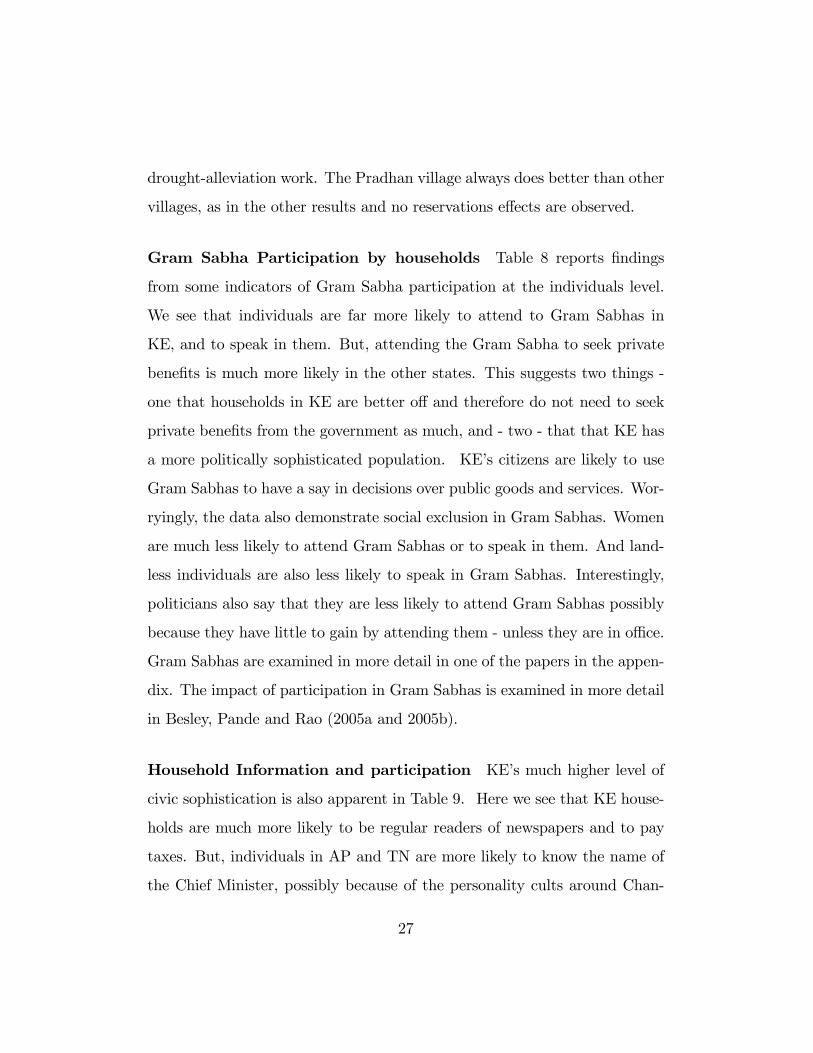
drought-alleviation work. The Pradhan village always does better than other
villages, as in the other results and no reservations e¤ects are observed.
Gram Sabha Participation by households Table 8 reports �ndings
from some indicators of Gram Sabha participation at the individuals level.
We see that individuals are far more likely to attend to Gram Sabhas in
KE, and to speak in them. But, attending the Gram Sabha to seek private
bene�ts is much more likely in the other states. This suggests two things -
one that households in KE are better o¤ and therefore do not need to seek
private bene�ts from the government as much, and - two - that that KE has
a more politically sophisticated population. KE�s citizens are likely to use
Gram Sabhas to have a say in decisions over public goods and services. Wor-
ryingly, the data also demonstrate social exclusion in Gram Sabhas. Women
are much less likely to attend Gram Sabhas or to speak in them. And land-
less individuals are also less likely to speak in Gram Sabhas. Interestingly,
politicians also say that they are less likely to attend Gram Sabhas possibly
because they have little to gain by attending them - unless they are in o¢ ce.
Gram Sabhas are examined in more detail in one of the papers in the appen-
dix. The impact of participation in Gram Sabhas is examined in more detail
in Besley, Pande and Rao (2005a and 2005b).
Household Information and participation KE�s much higher level of
civic sophistication is also apparent in Table 9. Here we see that KE house-
holds are much more likely to be regular readers of newspapers and to pay
taxes. But, individuals in AP and TN are more likely to know the name of
the Chief Minister, possibly because of the personality cults around Chan-
27
drababu Naidu and Jayalalitha the then chief ministers of these states. All
these indicators of civic sophistication are higher for the wealthy and for
politicians. However, these indicators are lower for the landless and much
lower for women - again demonstrating exclusion.
We further examine these themes with indicators of political participa-
tion in Table 10. Looking at various indicators - whether a member of the
household is politically active, voted in GP elections, MLA elections and
Parliamentary elections - we again see that KE dominates the other states.
Interestingly voters in KE are more likely to vote along political lines, while
in the other states they are more likely to base their decisions on the char-
acteristics of individual politicians. This is not surprising given the level to
which elections in AP and TN are based on the personalities of politicians,
but the fact that KA also shows less party-based voting than KE demon-
strates that KE elections are signi�cantly more determined by party politics.
Note again that women are much less likely to vote. However, other excluded
groups like SC/STs are more likely to participate in political activities and
the landless are also more likely to vote. This suggests that the political
process could provide a means for less advantaged groups to exercise their
preferences. Note that we also see a perverse e¤ect of politicians claiming
that they are likely to be a¢ liated with a political activity, and to participate
in politics - this suggests that the responses of politicians to the questions
we asked may also be driven by political motives.
Moving to more material forms of participation we examine the extent
to which households contribute in cash or kind to the provision of public
goods in Table 11. Note that material participation is higher in KE for
28

roads and health, but lower for schools and drinking water. This is consis-
tent with the �ndings on panchayat activism we observed above suggesting,
unsurprisingly, that household contributions may be driven by the extent of
panchayat involvement in these activities. Note again that the wealthy are
more likely to contribute, and politicians also say that they are more likely
to contribute. Women show a lower incidence of contributions but this may
be because of their lower levels of earning and lack of individual agency in
making decisions.
These results can be contrasted with the results on willingness to pay
for public goods, reported in Table 12. Here we see that households in KE
are much more likely to say that they are willing to pay more for public
services across the board. We also observe a greater willingness to pay in
TN compared to the other states. Similarly wealthy households indicate a
greater willingness to pay. Note also that in the means, we see that in all the
states except KA close to 50% of our respondents say that they are willing to
pay more for one or more public services. While willingness to pay questions
have important �aws, these results do suggest a gap between the demand
and supply of service provision.
Inequality Finally we examine various indicators of economic, social and
political inequality in these villages. We examine these indicators, reported
in Tables 13 and 14, merely by looking at mean di¤erences across the states
(rather than the block-pair �xed e¤ect regressions which are less relevant
here). We should note that the data for these indictors was collected entirely
by using PRA methods. For indicators of caste and land inequality the PRA
29
group was asked to list all the caste and religious groups living in the village
showing how many households belonged to each group. Then, for each
group, they were asked to place the households in di¤erent broad categories
of land ownership. This, method, allows us to obtain not only a detailed
caste listing for every village, and measures of village land inequality, but
to decompose land inequality in each village to its between and within-caste
components. The results of this decomposition can be observed in Table 13.
Interestingly KE shows the highest level of land inequality overall with a gini
of 0.66. This is probably because its higher level of economic development
makes non-farm incomes more salient and land less important as a measure
of overall inequality. The other three states have land ginis that are not
signi�cantly di¤erent from each other - ranging from 0.52 in KA to 0.58 in
TN.
We also use the Theil entropy measure of inequality because it can be
decomposed into between and within-caste components. Measuring this
presents a challenge because the number of castes per village varies consider-
ably. Villages with more castes would have arti�cially higher between-caste
inequality. To correct for this we group all castes into three categories - high
(which include "forward" castes and castes considered "dominant" in the
state, low (castes classi�ed as SC, ST, and "backward" but not "other back-
ward"), and middle which is the residual category. Decomposing inequality
into these three groups we see that 13% of inequality can be explained by
between-caste inequality in KE, which increases to 18% in AP. We should
note that between-within decompositions of inequality consistently tend to
hover around 15% regardless of the nature of the data and the type of group
30
(Kanbur and Venables, 2003), so it would not be valid to contrast these
results with racial or spatial inequality observed in other data. But, the
comparison across states in our own data are valid and suggest that caste
is a much less salient indicator of inequality in KE than in the other states.
This is further demonstrated in Table 14 where we see that only 17% of
land is controlled by upper castes in KE, compared with 36% in KA. Caste
dominance is therefore much more prevalent in KA.
Some villages also tend to be under the control of a few families. In order
to construct a measure of this type of oligarchy, we asked the PRA group to
construct another matrix showing whether the Pradhan, the ex-Pradhan and
the vice-Pradhan controlled some important categories of political and eco-
nomic power - such as whether they were the biggest landowners, or whether
they owned the largest factory in the village. The proportion of "yes" an-
swers in this matrix, then provides us a measure of oligarchy. State level
di¤erences in this measure are reported in Table 14 where we see that TN
has higher oligarchy than the other states, followed by KE.
To summarize, we see that villages are characterized by a great deal of
inequality and social heterogeneity within them. It has not been possible
to measure this with previous data from India, or indeed, most parts of the
world. The extent to which these variables a¤ect public services remains an
open question - which, to some extent, we examine in other papers.
31

4 Conclusions
What can we learn from these results? Fist, they have some relevance for
our understanding of the "Kerala model." Our �ndings provide more �esh
on the well-known fact of Kerala�s sophisticated political culture. Kerala has
the highest voter turnout among the four states in all types of election. Fur-
thermore, Kerala�s electorate is among the least likely to vote for candidates
on caste or religious lines. It also has a more active civic culture with active
participation in gram sabhas. While levels of land inequality are high, per-
haps because of the reduced salience of land as an indicator of wealth, these
inequalities are less likely to be because of caste based di¤erences than in
the other states. Kerala, perhaps in�uenced by this active political culture,
also dominates the other states in the availability of public goods. However,
consistent with other recent work, we �nd that Kerala is slipping. All our in-
dicators of current investments on public goods by the panchayats are lower
in Kerala than in the other states. Similarly we �nd that Kerala lags behind
Andhra Pradesh in the provision of BPL cards and public works programs.
To some extent this is because of Kerala�s higher levels of development and
lower levels of poverty. But, other evidence from the World Bank�s �scal
decentralization study suggests that a �scal constraints have reduced the
availability of funds to panchayats resulting in lower levels of GP activity.
Tamil Nadu GPs in our sample are at the end of the distribution. They
lag all the other states in the provision of most public goods (other than
water tanks and bus stops). More importantly, current levels of activity by
GPs are also behind the other states. This is also true in the provision of
private bene�ts such as BPL cards, housing and electricity. On the other
32
hand, villagers in Tamil Nadu, are second only to those in Kerala in their
political and civic participation - they are more likely to pay taxes than
villagers in AP and Karnataka, and more likely to vote.
It is interesting to note that the remaining two states, Karnataka and
AP are rather similar to one another. Since KA has been far ahead of AP
in promoting democratic decentralization, with AP under the Naidu govern-
ment even making attempts to entirely bypass PRIs, it is interesting that
this has not led to large di¤erences in the provision of public goods (except
for paved road), or indeed even in current GP activity in public goods provi-
sion. On private bene�ts Kartnataka leads all the states in overall activism
- particularly in the provision of toilets and electricity. But AP leads the
states in providing BPL cards and public works projects. Karnataka is the
most likely state to have an NGO active in the village, but it is also the
least likely to have held a gram sabha in the last six months - which can
largely be attributed to drough conditions in the state at the time of the
survey. However, even though AP faced the same climatic conditions, it was
far more likley than Karnatka to have held gram sabhas.
Finally, it is also interesting to note the strong caste in�uences in Kar-
nataka. Karnataka villages have the highest proportion of land owned by
upper castes (36 per cent), with 34 per cent of villages having over half their
land owned by upper castes. Perhaps as a consequence, Karnataka voters
are far more likely than those in other states to vote along caste or religious
lines.
33
References
[1] Bardhan, Pranab, [2002], �Decentralization of Government and Devel-
opment,� Journal of Economic Perspectives, 16(4), 185-205.
[2] Bardhan, Pranab and Dilip Mookherjee, [2000], �Capture and Gov-
ernance at Local and National Levels,� American Economic Review,
90(2), 135-139.
[3] Besley, Timothy and Stephen Coate, [1997], �An Economic Model of
Representative Democracy,�Quarterly Journal of Economics, 112(1),
85-114.
[4] Besley, Timothy, Rohini Pande, Lupin Rahman and Vijayendra Rao,
[2004a], �The Politics of Public Good Provision: Evidence from Indian
Local Governments,�Journal of the European Economics Association,
2(2-3), 416-426.
[5] Besley, Timothy, Rohini Pande, Lupin Rahman and Vijayendra Rao,
[2004b], �Decentralization in India: A Survey of South Indian Panchay-
ats,�mimeo, LSE.
[6] Besley, Timothy, Rohini Pande, Vijayendra Rao and Radu Ban, [2005a],
"Participatory Democracy in Action: Survey Evidence from South In-
dia," Journal of the European Economics Association (forthcoming).
[7] Besley, Timothy, Rohini Pande, and Vijayendra Rao, [2005b], "Political
Selectiona and the Quality of Government: Evidence from South India,"
mimeo, LSE
34

[8] Besley, Timothy, Rohini Pande, Vijayendra Rao and Radu Ban, [2004c],
�Tokenism or Agency? The Impact of Women�s Reservation on Pan-
chayats in South India,� mimeo, Development Research Group, The
World Bank
[9] Bhagavan, Manu, Sovereign Spheres: Princes, Education and Empire in
Colonial India, Oxford University Press, New Delhi, 2003
[10] Chattopadhyay, Raghabendra and Esther Du�o, [2004b], �E¢ ciency
and Rent-seeking in Local Governments,�mimeo MIT.
[11] Chattopadhyay, Raghabendra and Esther Du�o, [2004a], �Women as
Policy Makers: Evidence from a India-Wide Randomized Policy Exper-
iment,�Econometrica, 72(5), 1409-1444.
[12] Chaudhuri, Shubham, [2003], �What di¤erence does a constitutional
amendment make? The 1994 Panchayati Raj Act and the attempt to
revitalize rural local government in India,� typescript, Columbia Uni-
versity
[13] Chaudhuri, Subham and Patrick Heller, "Building Local Democracy:
Evaluating the Impact of Decentralization in Kerala," Paper presented
to Netsappe III, Paris, June 2004
[14] Dyson, Tim and Mick Moore (1983) �On Kinship Structure, Female
Autonomy, and Demographic Behavior in India�Population and Devel-
opment Review Vol.9, No. 1, pp 35-60.
35

[15] Enikolopov, Ruben and Ekaterina Zhuravskaya, [2004], �Decentraliza-
tion and Political Institutions,�mimeo, Institute for Advanced Study,
Princeton.
[16] Faguet, Jean Paul, [2004], �Does Decentralization Increase Responsive-
ness to Local Needs? Evidence from Bolivia,� Journal of Public Eco-
nomics, 88: 867-894.
[17] Foster, Andrew and Mark Rosenzweig, [2001], �Democratization, De-
centralization and the Distribution of Local Public Goods in a Poor
Rural Economy,�mimeo, Brown.
[18] Je¤rey, Robin (1993), Politics, Women and Well-Being: How Kerala
Became�A Model,�Oxford University Press, Delhi
[19] Kanbur, Ravi and Anthony Venables, "Spatial Inequality and Develop-
ment," mimeo, Cornell University, October 2003
[20] Manor, James, [2004], �Democratization with Inclusion: political re-
forms and people�s empowerment at the grassroots,�Journal of Human
Development, 5(1), 5-29.
[21] Matthew, George and Nirmala Buch, Status of Panchayati Raj in the
States and Union Territories of India 2000, Institute for Social Studies,
Delhi, 2000
[22] Platteau, Jean-Philippe and Anita Abraham, [2002], �Participatory De-
velopment in the Presence of Endogenous Community Imperfections,�
Journal of Development Studies, 39(2), 104-136.
36

[23] Rao, Vijayendra and Michael Woolcock, �Integrating Qualitative and
Quantitative Approaches in Program Evaluation,�Chapter 8 in Fran-
cois Bourguignon and Luiz A. Pereira da Silva (editors), The Impact
of Economic Policies on Poverty and Income Distribution: Evaluation
Techniques and Tools, World Bank and Oxford University Press, 2004.
[24] Triesman, Daniel, [2002], �Decentralization and the Quality of Govern-
ment,�mimeo, UCLA.
[25] Verba, Sidney, Kay Lehman Scholzman and Henry E. Brady, [1995],
Voice and Equality: Civic Voluntarism in American Politics, Cambridge
Mass: Harvard University Press.
[26] World Bank, [2000], World Development Report 2000/2001: Attacking
Poverty, Washington, DC, The World Bank
[27] World Bank (2004), "India: Fiscal Decentralization to Local Govern-
ments," Report No. 26654-IN, Rural Development Unit, South Asia Re-
gion.
[28] World Bank (2000), Overview of Rural Decentralization in India, Vol 1,
2, and 3, Rural Development Unit, South Asia Region.
37
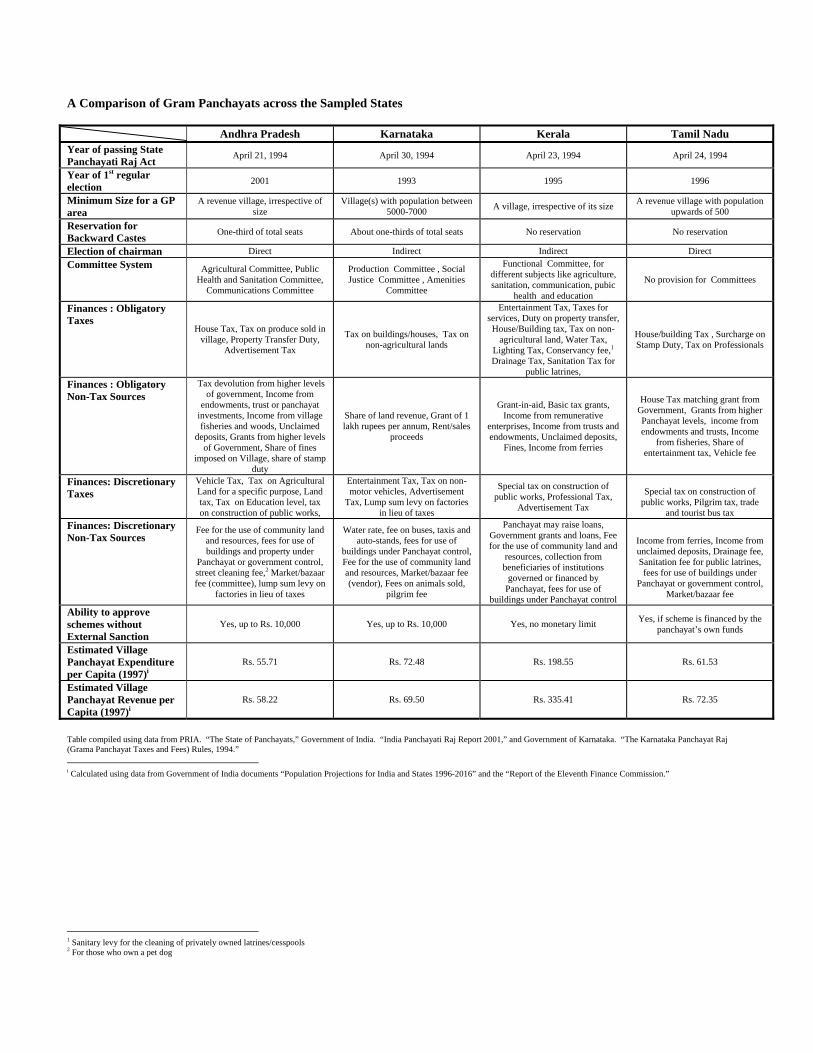
A Comparison of Gram Panchayats across the Sampled States Andhra Pradesh Karnataka Kerala Tamil Nadu Year of passing State Panchayati Raj Act April 21, 1994 April 30, 1994 April 23, 1994 April 24, 1994
Year of 1st regular election 2001 1993 1995 1996
Minimum Size for a GP area
A revenue village, irrespective of size
Village(s) with population between 5000-7000 A village, irrespective of its size A revenue village with population
upwards of 500 Reservation for Backward Castes One-third of total seats About one-thirds of total seats No reservation No reservation
Election of chairman Direct Indirect Indirect Direct Committee System Agricultural Committee, Public
Health and Sanitation Committee, Communications Committee
Production Committee , Social Justice Committee , Amenities
Committee
Functional Committee, for different subjects like agriculture, sanitation, communication, pubic
health and education
No provision for Committees
Finances : Obligatory Taxes
House Tax, Tax on produce sold in village, Property Transfer Duty,
Advertisement Tax
Tax on buildings/houses, Tax on non-agricultural lands
Entertainment Tax, Taxes for services, Duty on property transfer, House/Building tax, Tax on non-
agricultural land, Water Tax, Lighting Tax, Conservancy fee,1 Drainage Tax, Sanitation Tax for
public latrines,
House/building Tax , Surcharge on Stamp Duty, Tax on Professionals
Finances : Obligatory Non-Tax Sources
Tax devolution from higher levels of government, Income from
endowments, trust or panchayat investments, Income from village fisheries and woods, Unclaimed
deposits, Grants from higher levels of Government, Share of fines
imposed on Village, share of stamp duty
Share of land revenue, Grant of 1 lakh rupees per annum, Rent/sales
proceeds
Grant-in-aid, Basic tax grants, Income from remunerative
enterprises, Income from trusts and endowments, Unclaimed deposits,
Fines, Income from ferries
House Tax matching grant from Government, Grants from higher Panchayat levels, income from endowments and trusts, Income
from fisheries, Share of entertainment tax, Vehicle fee
Finances: Discretionary Taxes
Vehicle Tax, Tax on Agricultural Land for a specific purpose, Land tax, Tax on Education level, tax on construction of public works,
Entertainment Tax, Tax on non-motor vehicles, Advertisement
Tax, Lump sum levy on factories in lieu of taxes
Special tax on construction of public works, Professional Tax,
Advertisement Tax
Special tax on construction of
public works, Pilgrim tax, trade and tourist bus tax
Finances: Discretionary Non-Tax Sources
Fee for the use of community land and resources, fees for use of buildings and property under
Panchayat or government control, street cleaning fee,2 Market/bazaar fee (committee), lump sum levy on
factories in lieu of taxes
Water rate, fee on buses, taxis and auto-stands, fees for use of
buildings under Panchayat control, Fee for the use of community land and resources, Market/bazaar fee (vendor), Fees on animals sold,
pilgrim fee
Panchayat may raise loans, Government grants and loans, Fee for the use of community land and
resources, collection from beneficiaries of institutions
governed or financed by Panchayat, fees for use of
buildings under Panchayat control
Income from ferries, Income from unclaimed deposits, Drainage fee, Sanitation fee for public latrines, fees for use of buildings under
Panchayat or government control, Market/bazaar fee
Ability to approve schemes without External Sanction
Yes, up to Rs. 10,000 Yes, up to Rs. 10,000 Yes, no monetary limit Yes, if scheme is financed by the panchayat’s own funds
Estimated Village Panchayat Expenditure per Capita (1997)i
Rs. 55.71 Rs. 72.48 Rs. 198.55 Rs. 61.53
Estimated Village Panchayat Revenue per Capita (1997)i
Rs. 58.22 Rs. 69.50 Rs. 335.41 Rs. 72.35
Table compiled using data from PRIA. “The State of Panchayats,” Government of India. “India Panchayati Raj Report 2001,” and Government of Karnataka. “The Karnataka Panchayat Raj (Grama Panchayat Taxes and Fees) Rules, 1994.”
i Calculated using data from Government of India documents “Population Projections for India and States 1996-2016” and the “Report of the Eleventh Finance Commission.”
1 Sanitary levy for the cleaning of privately owned latrines/cesspools 2 For those who own a pet dog
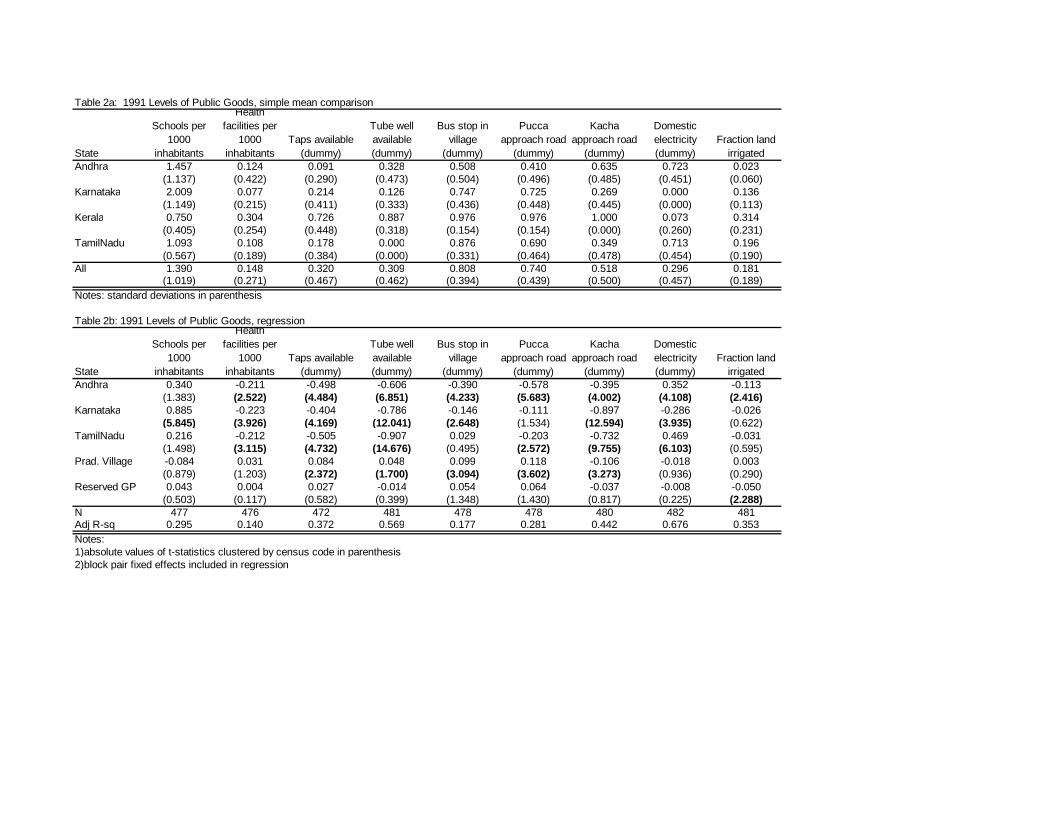
Table 2a: 1991 Levels of Public Goods, simple mean comparison
State
Schools per 1000
inhabitants
Health facilities per
1000 inhabitants
Taps available (dummy)
Tube well available (dummy)
Bus stop in village
(dummy)
Pucca approach road
(dummy)
Kacha approach road
(dummy)
Domestic electricity (dummy)
Fraction land irrigated
Andhra 1.457 0.124 0.091 0.328 0.508 0.410 0.635 0.723 0.023(1.137) (0.422) (0.290) (0.473) (0.504) (0.496) (0.485) (0.451) (0.060)
Karnataka 2.009 0.077 0.214 0.126 0.747 0.725 0.269 0.000 0.136(1.149) (0.215) (0.411) (0.333) (0.436) (0.448) (0.445) (0.000) (0.113)
Kerala 0.750 0.304 0.726 0.887 0.976 0.976 1.000 0.073 0.314(0.405) (0.254) (0.448) (0.318) (0.154) (0.154) (0.000) (0.260) (0.231)
TamilNadu 1.093 0.108 0.178 0.000 0.876 0.690 0.349 0.713 0.196(0.567) (0.189) (0.384) (0.000) (0.331) (0.464) (0.478) (0.454) (0.190)
All 1.390 0.148 0.320 0.309 0.808 0.740 0.518 0.296 0.181(1.019) (0.271) (0.467) (0.462) (0.394) (0.439) (0.500) (0.457) (0.189)
Notes: standard deviations in parenthesis
Table 2b: 1991 Levels of Public Goods, regression
State
Schools per 1000
inhabitants
Health facilities per
1000 inhabitants
Taps available (dummy)
Tube well available (dummy)
Bus stop in village
(dummy)
Pucca approach road
(dummy)
Kacha approach road
(dummy)
Domestic electricity (dummy)
Fraction land irrigated
Andhra 0.340 -0.211 -0.498 -0.606 -0.390 -0.578 -0.395 0.352 -0.113(1.383) (2.522) (4.484) (6.851) (4.233) (5.683) (4.002) (4.108) (2.416)
Karnataka 0.885 -0.223 -0.404 -0.786 -0.146 -0.111 -0.897 -0.286 -0.026(5.845) (3.926) (4.169) (12.041) (2.648) (1.534) (12.594) (3.935) (0.622)
TamilNadu 0.216 -0.212 -0.505 -0.907 0.029 -0.203 -0.732 0.469 -0.031(1.498) (3.115) (4.732) (14.676) (0.495) (2.572) (9.755) (6.103) (0.595)
Prad. Village -0.084 0.031 0.084 0.048 0.099 0.118 -0.106 -0.018 0.003(0.879) (1.203) (2.372) (1.700) (3.094) (3.602) (3.273) (0.936) (0.290)
Reserved GP 0.043 0.004 0.027 -0.014 0.054 0.064 -0.037 -0.008 -0.050(0.503) (0.117) (0.582) (0.399) (1.348) (1.430) (0.817) (0.225) (2.288)
N 477 476 472 481 478 478 480 482 481Adj R-sq 0.295 0.140 0.372 0.569 0.177 0.281 0.442 0.676 0.353Notes:1)absolute values of t-statistics clustered by census code in parenthesis2)block pair fixed effects included in regression

Table 3a: Current level of public goods, simple mean comparison
State
Schools per 1000
inhabitants
Health facilities per
1000 inhabitants
Number drinking water
sources
Number overhead
tanks
Bus stop in village
(dummy)Proportion paved road
Proportion road with light
Andhra 1.980 0.235 3.171 0.943 0.500 0.206 0.436(1.534) (0.512) (2.713) (0.931) (0.504) (0.213) (0.258)
Karnataka 1.403 0.078 3.753 0.610 0.577 0.787 0.418(1.098) (0.210) (2.454) (0.748) (0.495) (0.182) (0.263)
Kerala 2.120 2.891 12.397 0.143 0.024 0.459 0.396(1.137) (1.621) (9.906) (0.451) (0.153) (0.200) (0.281)
TamilNadu 1.068 0.151 1.924 1.132 0.653 0.465 0.460(1.061) (0.529) (1.778) (0.821) (0.478) (0.301) (0.280)
All 1.535 0.701 5.257 0.686 0.454 0.542 0.427(1.234) (1.386) (6.652) (0.825) (0.498) (0.302) (0.272)
Notes: standard deviations in parenthesis
Table 3b: Current level of public goods, regression
State
Schools per 1000
inhabitants
Health facilities per
1000 inhabitants
Number drinking water
sources
Number overhead
tanks
Bus stop in village
(dummy)Proportion paved road
Proportion road with light
Andhra -0.625 -2.675 -9.111 0.678 0.449 -0.311 0.154(1.806) (10.460) (5.325) (2.497) (6.597) (5.891) (2.422)
Karnataka -1.208 -2.794 -7.714 0.506 0.576 0.248 0.148(5.083) (13.776) (4.785) (3.675) (13.091) (7.070) (3.098)
TamilNadu -1.332 -2.847 -11.178 0.998 0.727 -0.033 0.145(5.419) (9.677) (7.137) (6.715) (18.896) (0.721) (3.271)
Prad. Village -0.234 -0.011 1.190 0.345 0.173 -0.024 0.044(1.750) (0.185) (3.101) (3.830) (3.814) (1.350) (1.873)
Reserved GP 0.014 -0.055 0.718 -0.017 0.049 -0.031 -0.007(0.158) (0.572) (1.120) (0.241) (0.992) (1.138) (0.297)
N 495 495 504 504 504 501 488Adj R-sq 0.232 0.659 0.450 0.246 0.275 0.475 0.184Notes:1)absolute values of t-statistics clustered by block in parenthesis2)block pair fixed effects included in regression
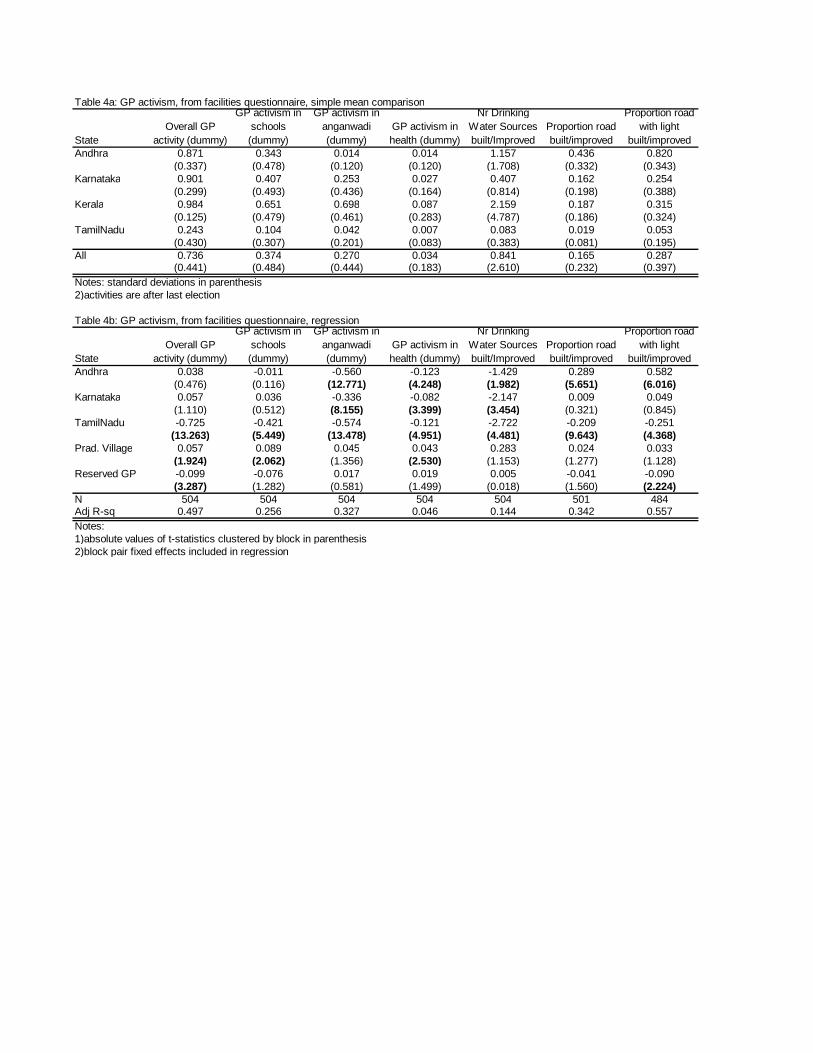
Table 4a: GP activism, from facilities questionnaire, simple mean comparison
StateOverall GP
activity (dummy)
GP activism in schools (dummy)
GP activism in anganwadi (dummy)
GP activism in health (dummy)
Nr Drinking Water Sources built/Improved
Proportion road built/improved
Proportion road with light
built/improvedAndhra 0.871 0.343 0.014 0.014 1.157 0.436 0.820
(0.337) (0.478) (0.120) (0.120) (1.708) (0.332) (0.343)Karnataka 0.901 0.407 0.253 0.027 0.407 0.162 0.254
(0.299) (0.493) (0.436) (0.164) (0.814) (0.198) (0.388)Kerala 0.984 0.651 0.698 0.087 2.159 0.187 0.315
(0.125) (0.479) (0.461) (0.283) (4.787) (0.186) (0.324)TamilNadu 0.243 0.104 0.042 0.007 0.083 0.019 0.053
(0.430) (0.307) (0.201) (0.083) (0.383) (0.081) (0.195)All 0.736 0.374 0.270 0.034 0.841 0.165 0.287
(0.441) (0.484) (0.444) (0.183) (2.610) (0.232) (0.397)Notes: standard deviations in parenthesis2)activities are after last election
Table 4b: GP activism, from facilities questionnaire, regression
StateOverall GP
activity (dummy)
GP activism in schools (dummy)
GP activism in anganwadi (dummy)
GP activism in health (dummy)
Nr Drinking Water Sources built/Improved
Proportion road built/improved
Proportion road with light
built/improvedAndhra 0.038 -0.011 -0.560 -0.123 -1.429 0.289 0.582
(0.476) (0.116) (12.771) (4.248) (1.982) (5.651) (6.016)Karnataka 0.057 0.036 -0.336 -0.082 -2.147 0.009 0.049
(1.110) (0.512) (8.155) (3.399) (3.454) (0.321) (0.845)TamilNadu -0.725 -0.421 -0.574 -0.121 -2.722 -0.209 -0.251
(13.263) (5.449) (13.478) (4.951) (4.481) (9.643) (4.368)Prad. Village 0.057 0.089 0.045 0.043 0.283 0.024 0.033
(1.924) (2.062) (1.356) (2.530) (1.153) (1.277) (1.128)Reserved GP -0.099 -0.076 0.017 0.019 0.005 -0.041 -0.090
(3.287) (1.282) (0.581) (1.499) (0.018) (1.560) (2.224)N 504 504 504 504 504 501 484Adj R-sq 0.497 0.256 0.327 0.046 0.144 0.342 0.557Notes:1)absolute values of t-statistics clustered by block in parenthesis2)block pair fixed effects included in regression
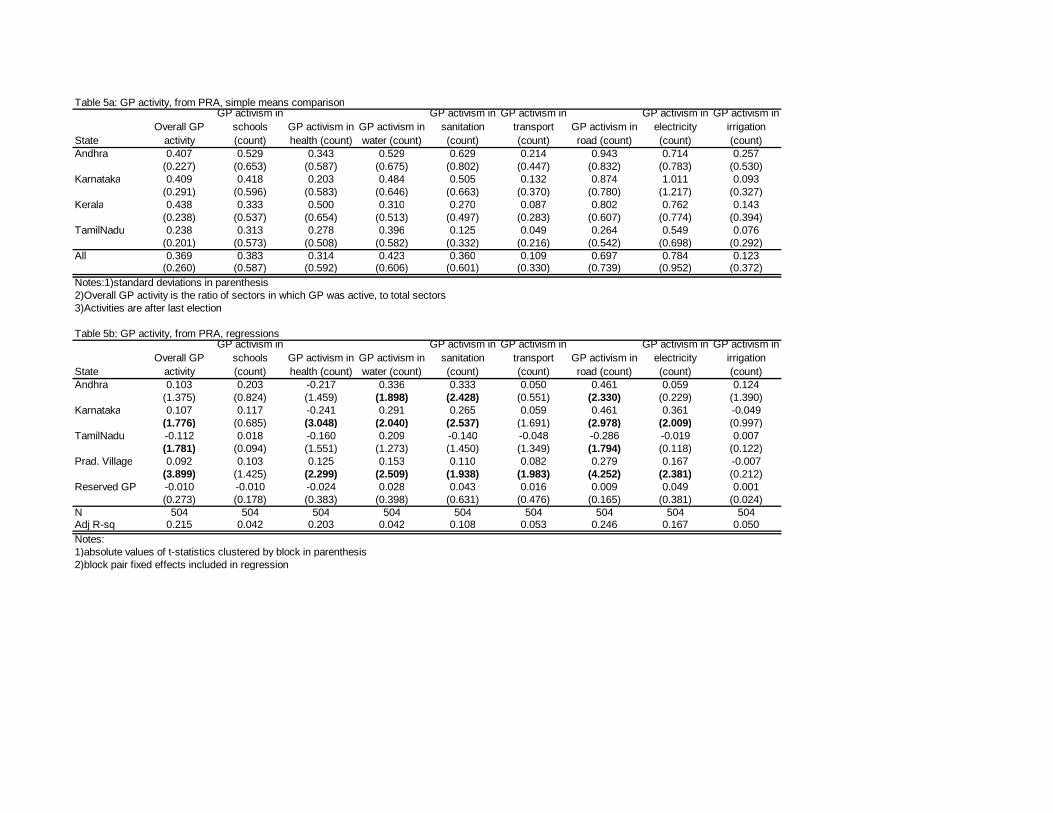
Table 5a: GP activity, from PRA, simple means comparison
StateOverall GP
activity
GP activism in schools (count)
GP activism in health (count)
GP activism in water (count)
GP activism in sanitation (count)
GP activism in transport (count)
GP activism in road (count)
GP activism in electricity (count)
GP activism in irrigation (count)
Andhra 0.407 0.529 0.343 0.529 0.629 0.214 0.943 0.714 0.257(0.227) (0.653) (0.587) (0.675) (0.802) (0.447) (0.832) (0.783) (0.530)
Karnataka 0.409 0.418 0.203 0.484 0.505 0.132 0.874 1.011 0.093(0.291) (0.596) (0.583) (0.646) (0.663) (0.370) (0.780) (1.217) (0.327)
Kerala 0.438 0.333 0.500 0.310 0.270 0.087 0.802 0.762 0.143(0.238) (0.537) (0.654) (0.513) (0.497) (0.283) (0.607) (0.774) (0.394)
TamilNadu 0.238 0.313 0.278 0.396 0.125 0.049 0.264 0.549 0.076(0.201) (0.573) (0.508) (0.582) (0.332) (0.216) (0.542) (0.698) (0.292)
All 0.369 0.383 0.314 0.423 0.360 0.109 0.697 0.784 0.123(0.260) (0.587) (0.592) (0.606) (0.601) (0.330) (0.739) (0.952) (0.372)
Notes:1)standard deviations in parenthesis2)Overall GP activity is the ratio of sectors in which GP was active, to total sectors3)Activities are after last election
Table 5b: GP activity, from PRA, regressions
StateOverall GP
activity
GP activism in schools (count)
GP activism in health (count)
GP activism in water (count)
GP activism in sanitation (count)
GP activism in transport (count)
GP activism in road (count)
GP activism in electricity (count)
GP activism in irrigation (count)
Andhra 0.103 0.203 -0.217 0.336 0.333 0.050 0.461 0.059 0.124(1.375) (0.824) (1.459) (1.898) (2.428) (0.551) (2.330) (0.229) (1.390)
Karnataka 0.107 0.117 -0.241 0.291 0.265 0.059 0.461 0.361 -0.049(1.776) (0.685) (3.048) (2.040) (2.537) (1.691) (2.978) (2.009) (0.997)
TamilNadu -0.112 0.018 -0.160 0.209 -0.140 -0.048 -0.286 -0.019 0.007(1.781) (0.094) (1.551) (1.273) (1.450) (1.349) (1.794) (0.118) (0.122)
Prad. Village 0.092 0.103 0.125 0.153 0.110 0.082 0.279 0.167 -0.007(3.899) (1.425) (2.299) (2.509) (1.938) (1.983) (4.252) (2.381) (0.212)
Reserved GP -0.010 -0.010 -0.024 0.028 0.043 0.016 0.009 0.049 0.001(0.273) (0.178) (0.383) (0.398) (0.631) (0.476) (0.165) (0.381) (0.024)
N 504 504 504 504 504 504 504 504 504Adj R-sq 0.215 0.042 0.203 0.042 0.108 0.053 0.246 0.167 0.050Notes:1)absolute values of t-statistics clustered by block in parenthesis2)block pair fixed effects included in regression

Table 6: Levels of activism, means
StateAny GP provision
House GP provision
Toilet GP Provision
Water GP Provision
Electricity GP provision BPL received
Received money for
public works
Andhra 0.046 0.025 0.006 0.003 0.013 0.322 0.127(0.209) (0.156) (0.074) (0.053) (0.111) (0.468) (0.334)
Karnataka 0.122 0.024 0.032 0.002 0.073 0.101 0.051(0.327) (0.154) (0.175) (0.039) (0.260) (0.302) (0.220)
Kerala 0.041 0.019 0.019 0.000 0.014 0.297 0.019(0.199) (0.138) (0.135) (0.000) (0.117) (0.457) (0.136)
TamilNadu 0.023 0.006 0.006 0.006 0.007 0.251 0.020(0.150) (0.075) (0.075) (0.075) (0.083) (0.434) (0.139)
All 0.065 0.018 0.018 0.002 0.032 0.220 0.044(0.246) (0.133) (0.133) (0.049) (0.177) (0.414) (0.205)
Levels of activism, regression
StateAny GP provision
House GP provision
Toilet GP Provision
Water GP Provision
Electricity GP provision BPL received
Received money for
public works
Andhra -0.004 0.012 0.008 0.002 -0.039 0.207 0.075(0.220) (1.344) (0.797) (0.569) (2.871) (1.981) (3.484)
Karnataka 0.077 0.009 0.032 0.000 0.033 -0.032 0.010(5.969) (1.610) (4.147) (0.139) (3.033) (0.407) (1.088)
TamilNadu -0.032 -0.015 0.001 0.006 -0.035 0.088 -0.028(3.063) (3.263) (0.122) (1.726) (3.732) (0.872) (3.536)
Pradhan's Village 0.008 0.000 0.007 0.002 0.001 -0.018 0.004(0.770) (0.081) (1.394) (0.711) (0.174) (1.195) (0.810)
Reserved GP -0.007 -0.006 0.000 0.001 -0.004 0.019 -0.007(0.942) (1.354) (0.038) (0.918) (0.778) (0.602) (0.882)
female 0.005 0.006 -0.006 0.000 0.006 -0.004 -0.005(0.943) (1.769) (1.881) (0.045) (1.440) (0.401) (0.751)
SCST 0.035 0.016 -0.001 0.000 0.025 0.128 0.043(3.020) (2.377) (0.140) (0.219) (3.103) (3.930) (3.886)
wealthy -0.043 -0.014 -0.006 0.001 -0.030 -0.096 -0.001(5.311) (3.757) (1.312) (0.468) (4.160) (4.079) (0.171)
landless 0.019 0.005 0.007 -0.001 0.010 0.074 0.014(1.914) (1.007) (1.365) (0.438) (1.554) (4.850) (2.764)
politician 0.033 -0.002 0.028 -0.003 0.018 0.092 0.059(1.889) (0.429) (2.394) (2.467) (1.483) (1.365) (2.363)
N 5460 5460 5460 5460 5460 5460 5422Adj R-sq 0.044 0.009 0.025 0.002 0.041 0.167 0.047Notes:1)absolute values of t-statistics clustered by block in parenthesis2)block pair fixed effects included in regression

Table 7a: Village participation, simple means comparison
State NGO active CBO activeGS held last
6moGS held last12mo
Nr education comitees
Nr total comitees
Andhra Pradesh 0.686 0.243 0.710 0.696 0.557 0.557
(0.468) (0.432) (0.457) (0.464) (1.016) (1.016)
Karnataka 0.379 0.819 0.692 0.538 0.264 0.330
(0.487) (0.386) (0.463) (0.500) (0.466) (0.657)
Kerala 0.111 0.389 0.984 0.984 0.675 2.341
(0.316) (0.489) (0.125) (0.125) (0.470) (1.550)
Tamil Nadu 0.292 0.590 0.672 0.664 0.021 0.056
(0.456) (0.493) (0.471) (0.474) (0.143) (0.308)
All states 0.331 0.575 0.761 0.702 0.335 0.770
(0.471) (0.495) (0.427) (0.458) (0.578) (1.304)
Table 7B: Village participation, regressions
State NGO active CBO activeGS held last
6moGS held last12mo
Nr education comitees
Nr total comitees
Andhra 0.103 0.203 -0.217 0.336 0.333 0.050(1.375) (0.824) (1.459) (1.898) (2.428) (0.551)
Karnataka 0.107 0.117 -0.241 0.291 0.265 0.059(1.776) (0.685) (3.048) (2.040) (2.537) (1.691)
Tamil Nadu -0.112 0.018 -0.160 0.209 -0.140 -0.048(1.781) (0.094) (1.551) (1.273) (1.450) (1.349)
Prad. Village 0.092 0.103 0.125 0.153 0.110 0.082(3.899) (1.425) (2.299) (2.509) (1.938) (1.983)
Reserved GP -0.010 -0.010 -0.024 0.028 0.043 0.016(0.273) (0.178) (0.383) (0.398) (0.631) (0.476)
N 504 504 504 504 504 504Adj R-sq 0.215 0.042 0.203 0.042 0.108 0.053Notes:1)absolute values of t-statistics clustered by block in parenthesis2)block pair fixed effects included in regression
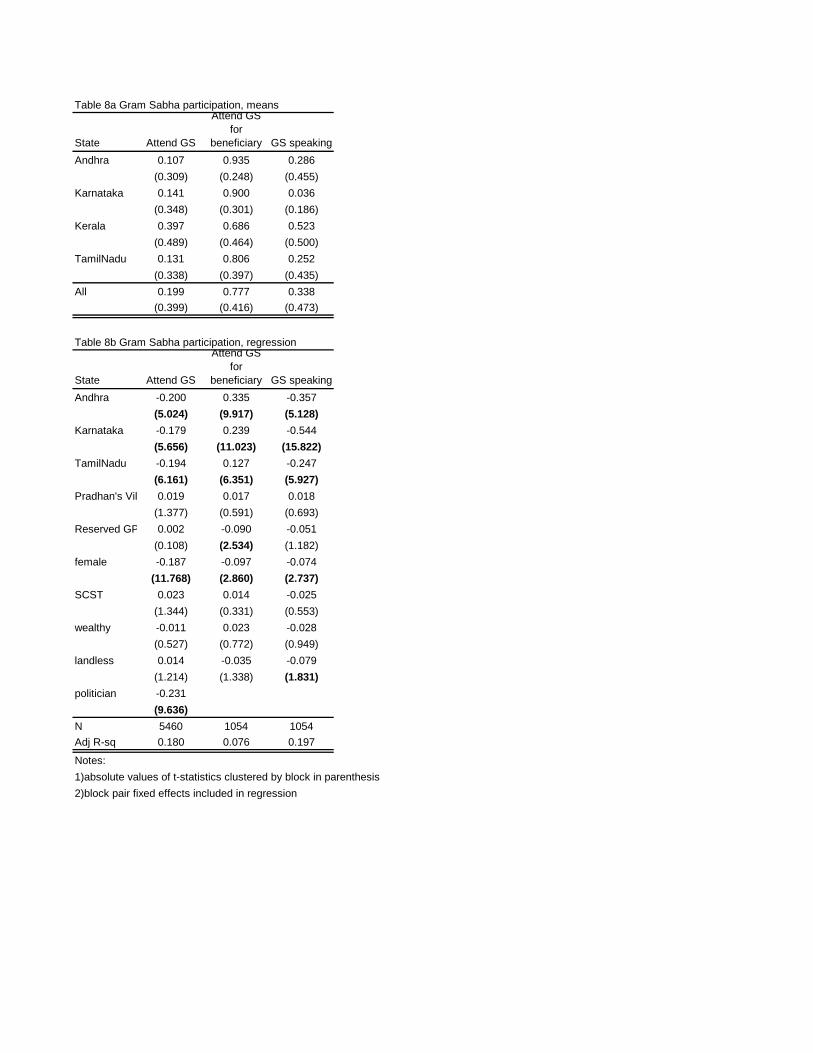
Table 8a Gram Sabha participation, means
State Attend GS
Attend GS for
beneficiary GS speaking
Andhra 0.107 0.935 0.286
(0.309) (0.248) (0.455)
Karnataka 0.141 0.900 0.036
(0.348) (0.301) (0.186)
Kerala 0.397 0.686 0.523
(0.489) (0.464) (0.500)
TamilNadu 0.131 0.806 0.252
(0.338) (0.397) (0.435)
All 0.199 0.777 0.338
(0.399) (0.416) (0.473)
Table 8b Gram Sabha participation, regression
State Attend GS
Attend GS for
beneficiary GS speaking
Andhra -0.200 0.335 -0.357
(5.024) (9.917) (5.128)
Karnataka -0.179 0.239 -0.544
(5.656) (11.023) (15.822)
TamilNadu -0.194 0.127 -0.247
(6.161) (6.351) (5.927)
Pradhan's Vill 0.019 0.017 0.018
(1.377) (0.591) (0.693)
Reserved GP 0.002 -0.090 -0.051
(0.108) (2.534) (1.182)
female -0.187 -0.097 -0.074
(11.768) (2.860) (2.737)
SCST 0.023 0.014 -0.025
(1.344) (0.331) (0.553)
wealthy -0.011 0.023 -0.028
(0.527) (0.772) (0.949)
landless 0.014 -0.035 -0.079
(1.214) (1.338) (1.831)
politician -0.231
(9.636)
N 5460 1054 1054
Adj R-sq 0.180 0.076 0.197
Notes:
1)absolute values of t-statistics clustered by block in parenthesis
2)block pair fixed effects included in regression
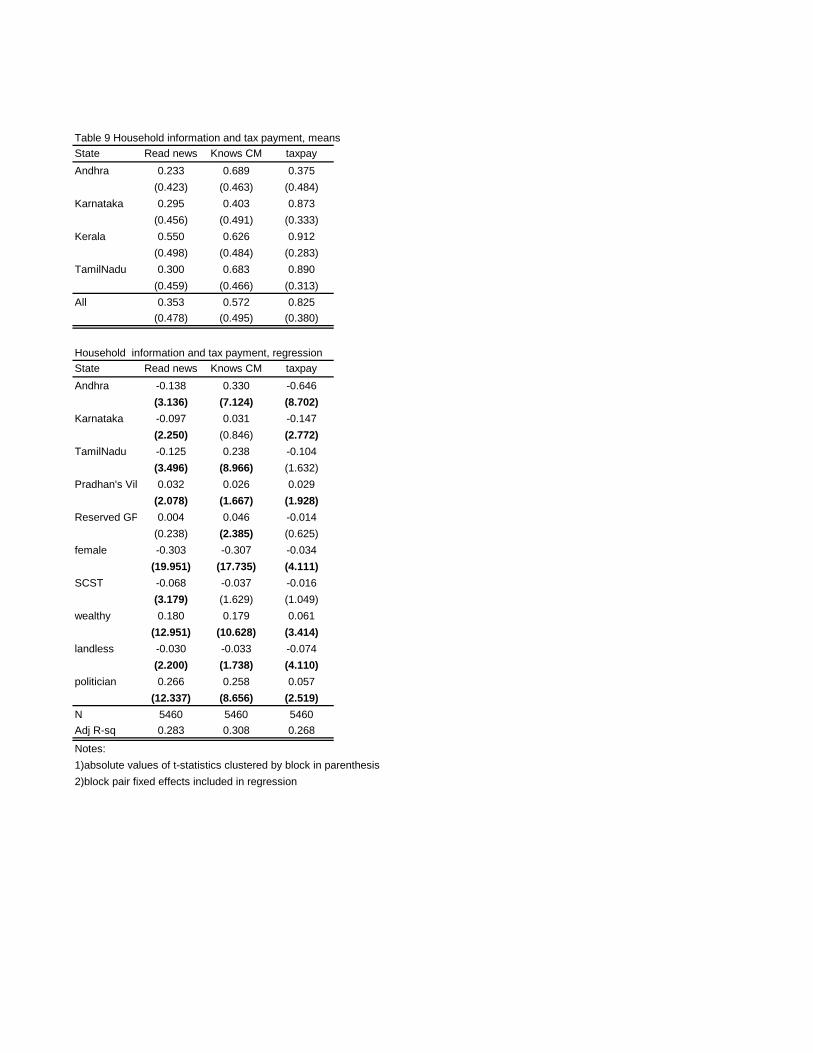
Table 9 Household information and tax payment, means
State Read news Knows CM taxpay
Andhra 0.233 0.689 0.375
(0.423) (0.463) (0.484)
Karnataka 0.295 0.403 0.873
(0.456) (0.491) (0.333)
Kerala 0.550 0.626 0.912
(0.498) (0.484) (0.283)
TamilNadu 0.300 0.683 0.890
(0.459) (0.466) (0.313)
All 0.353 0.572 0.825
(0.478) (0.495) (0.380)
Household information and tax payment, regression
State Read news Knows CM taxpay
Andhra -0.138 0.330 -0.646
(3.136) (7.124) (8.702)
Karnataka -0.097 0.031 -0.147
(2.250) (0.846) (2.772)
TamilNadu -0.125 0.238 -0.104
(3.496) (8.966) (1.632)
Pradhan's Vill 0.032 0.026 0.029
(2.078) (1.667) (1.928)
Reserved GP 0.004 0.046 -0.014
(0.238) (2.385) (0.625)
female -0.303 -0.307 -0.034
(19.951) (17.735) (4.111)
SCST -0.068 -0.037 -0.016
(3.179) (1.629) (1.049)
wealthy 0.180 0.179 0.061
(12.951) (10.628) (3.414)
landless -0.030 -0.033 -0.074
(2.200) (1.738) (4.110)
politician 0.266 0.258 0.057
(12.337) (8.656) (2.519)
N 5460 5460 5460
Adj R-sq 0.283 0.308 0.268
Notes:
1)absolute values of t-statistics clustered by block in parenthesis
2)block pair fixed effects included in regression

Table 10 Political participation, means
StateHH member
politicalHH party affilieated
Participate political Voted GP Voted MLA Voted MP Vote group Vote party
Vote candidate
Andhra 0.054 0.642 0.253 0.761 0.865 0.761 0.063 0.131 0.377
(0.227) (0.480) (0.435) (0.427) (0.342) (0.427) (0.242) (0.338) (0.485)
Karnataka 0.050 0.064 0.053 0.713 0.782 0.713 0.142 0.053 0.370
(0.218) (0.244) (0.224) (0.452) (0.413) (0.452) (0.349) (0.225) (0.483)
Kerala 0.053 0.429 0.311 0.844 0.902 0.844 0.079 0.392 0.133
(0.223) (0.495) (0.463) (0.363) (0.297) (0.363) (0.270) (0.488) (0.339)
TamilNadu 0.052 0.247 0.093 0.801 0.811 0.801 0.091 0.029 0.598
(0.222) (0.431) (0.290) (0.399) (0.392) (0.399) (0.287) (0.168) (0.490)
All 0.052 0.279 0.154 0.777 0.831 0.777 0.102 0.142 0.373
(0.222) (0.449) (0.361) (0.417) (0.375) (0.417) (0.303) (0.350) (0.484)
Political participation, regression
StateHH member
politicalHH party affilieated
Participate political Voted GP Voted MLA Voted MP Vote group Vote party
Vote candidate
Andhra 0.011 0.468 -0.073 -0.154 -0.082 -0.154 -0.007 -0.249 0.186
(0.809) (3.805) (2.311) (3.588) (2.754) (3.588) (0.286) (7.780) (3.152)
Karnataka 0.008 -0.147 -0.265 -0.184 -0.174 -0.184 0.073 -0.339 0.211
(0.944) (1.351) (11.224) (6.103) (9.859) (6.103) (4.810) (11.812) (6.060)
TamilNadu 0.006 0.020 -0.208 -0.120 -0.155 -0.120 -0.001 -0.332 0.382
(0.929) (0.162) (7.264) (3.823) (9.109) (3.823) (0.089) (12.261) (9.741)
Pradhan's Vill 0.011 -0.002 0.027 0.012 -0.005 0.012 0.021 0.007 -0.016
(1.568) (0.151) (1.601) (1.086) (0.372) (1.086) (1.688) (0.724) (0.898)
Reserved GP -0.001 0.037 -0.006 -0.004 0.003 -0.004 0.001 0.016 -0.033
(0.149) (1.078) (0.218) (0.183) (0.243) (0.183) (0.061) (0.871) (1.889)
female -0.014 -0.097 -0.117 -0.002 -0.098 -0.002 -0.026 -0.046 -0.103
(2.249) (7.945) (7.488) (0.163) (11.553) (0.163) (2.994) (3.498) (4.952)
SCST 0.009 0.060 0.043 0.013 -0.003 0.013 0.004 0.043 -0.006
(1.368) (2.723) (2.528) (0.731) (0.222) (0.731) (0.226) (2.234) (0.322)
wealthy 0.046 0.010 0.013 -0.090 0.036 -0.090 0.003 -0.006 0.041
(5.623) (0.722) (1.282) (5.051) (2.913) (5.051) (0.263) (0.585) (2.858)
landless -0.026 -0.018 -0.024 0.069 -0.019 0.069 -0.016 -0.018 0.011
(2.954) (1.170) (1.807) (4.344) (1.504) (4.344) (1.802) (2.035) (0.564)
politician -0.079 -0.326 -0.188
(12.695) (6.822) (7.928)
N 5460 5460 5460 5460 5460 5460 4940 4940 4940
Adj R-sq 0.019 0.316 0.154 0.038 0.053 0.038 0.024 0.186 0.141
Notes:
1)absolute values of t-statistics clustered by block in parenthesis
2)block pair fixed effects included in regression
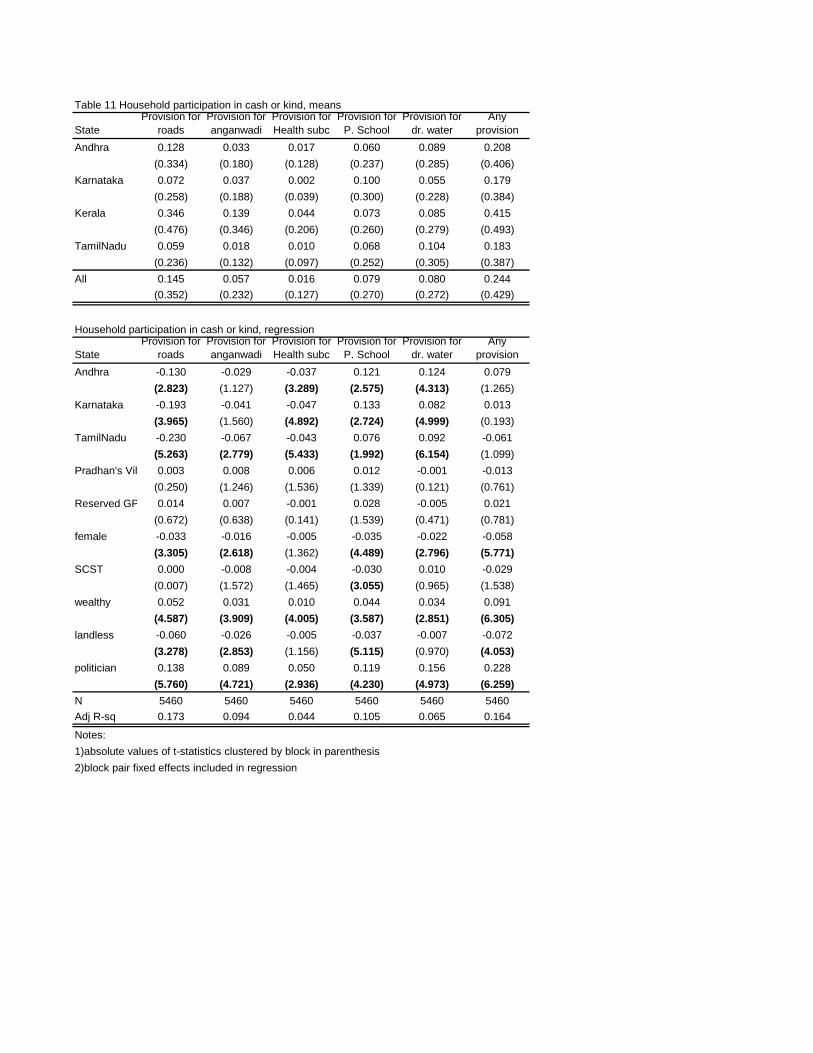
Table 11 Household participation in cash or kind, means
StateProvision for
roadsProvision for anganwadi
Provision for Health subc
Provision for P. School
Provision for dr. water
Any provision
Andhra 0.128 0.033 0.017 0.060 0.089 0.208
(0.334) (0.180) (0.128) (0.237) (0.285) (0.406)
Karnataka 0.072 0.037 0.002 0.100 0.055 0.179
(0.258) (0.188) (0.039) (0.300) (0.228) (0.384)
Kerala 0.346 0.139 0.044 0.073 0.085 0.415
(0.476) (0.346) (0.206) (0.260) (0.279) (0.493)
TamilNadu 0.059 0.018 0.010 0.068 0.104 0.183
(0.236) (0.132) (0.097) (0.252) (0.305) (0.387)
All 0.145 0.057 0.016 0.079 0.080 0.244
(0.352) (0.232) (0.127) (0.270) (0.272) (0.429)
Household participation in cash or kind, regression
StateProvision for
roadsProvision for anganwadi
Provision for Health subc
Provision for P. School
Provision for dr. water
Any provision
Andhra -0.130 -0.029 -0.037 0.121 0.124 0.079
(2.823) (1.127) (3.289) (2.575) (4.313) (1.265)
Karnataka -0.193 -0.041 -0.047 0.133 0.082 0.013
(3.965) (1.560) (4.892) (2.724) (4.999) (0.193)
TamilNadu -0.230 -0.067 -0.043 0.076 0.092 -0.061
(5.263) (2.779) (5.433) (1.992) (6.154) (1.099)
Pradhan's Vill 0.003 0.008 0.006 0.012 -0.001 -0.013
(0.250) (1.246) (1.536) (1.339) (0.121) (0.761)
Reserved GP 0.014 0.007 -0.001 0.028 -0.005 0.021
(0.672) (0.638) (0.141) (1.539) (0.471) (0.781)
female -0.033 -0.016 -0.005 -0.035 -0.022 -0.058
(3.305) (2.618) (1.362) (4.489) (2.796) (5.771)
SCST 0.000 -0.008 -0.004 -0.030 0.010 -0.029
(0.007) (1.572) (1.465) (3.055) (0.965) (1.538)
wealthy 0.052 0.031 0.010 0.044 0.034 0.091
(4.587) (3.909) (4.005) (3.587) (2.851) (6.305)
landless -0.060 -0.026 -0.005 -0.037 -0.007 -0.072
(3.278) (2.853) (1.156) (5.115) (0.970) (4.053)
politician 0.138 0.089 0.050 0.119 0.156 0.228
(5.760) (4.721) (2.936) (4.230) (4.973) (6.259)
N 5460 5460 5460 5460 5460 5460
Adj R-sq 0.173 0.094 0.044 0.105 0.065 0.164
Notes:
1)absolute values of t-statistics clustered by block in parenthesis
2)block pair fixed effects included in regression
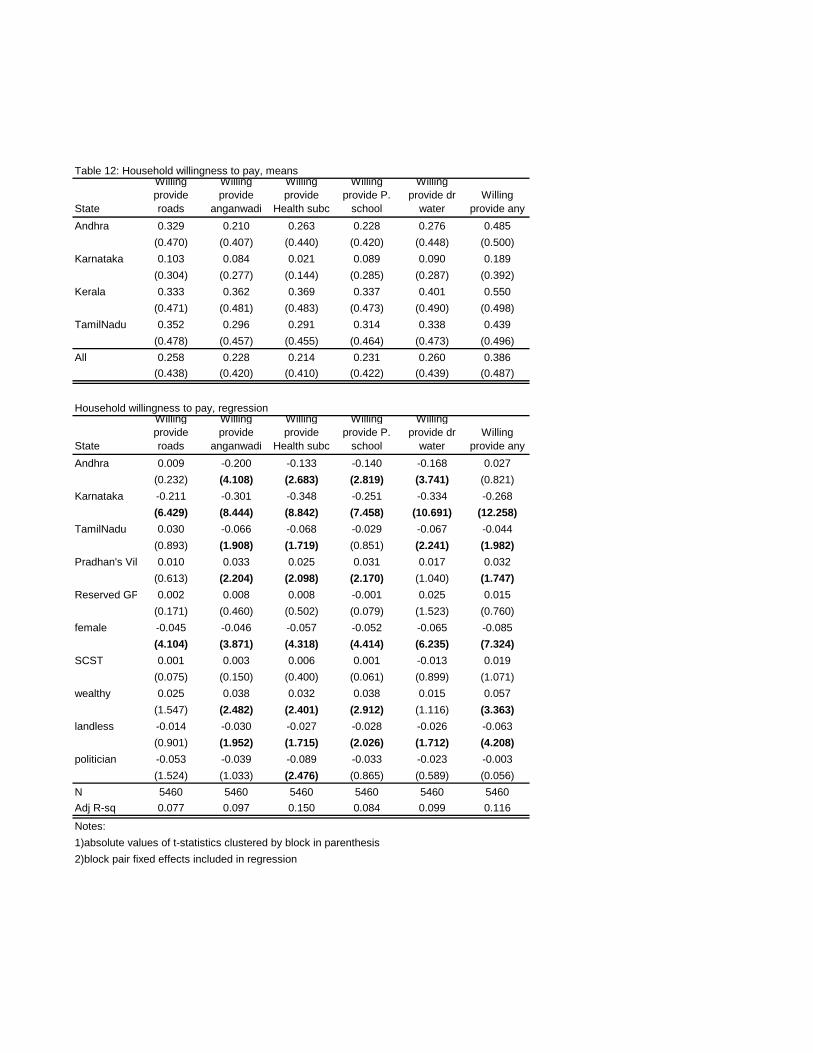
Table 12: Household willingness to pay, means
State
Willing provide roads
Willing provide
anganwadi
Willing provide
Health subc
Willing provide P.
school
Willing provide dr
waterWilling
provide any
Andhra 0.329 0.210 0.263 0.228 0.276 0.485
(0.470) (0.407) (0.440) (0.420) (0.448) (0.500)
Karnataka 0.103 0.084 0.021 0.089 0.090 0.189
(0.304) (0.277) (0.144) (0.285) (0.287) (0.392)
Kerala 0.333 0.362 0.369 0.337 0.401 0.550
(0.471) (0.481) (0.483) (0.473) (0.490) (0.498)
TamilNadu 0.352 0.296 0.291 0.314 0.338 0.439
(0.478) (0.457) (0.455) (0.464) (0.473) (0.496)
All 0.258 0.228 0.214 0.231 0.260 0.386
(0.438) (0.420) (0.410) (0.422) (0.439) (0.487)
Household willingness to pay, regression
State
Willing provide roads
Willing provide
anganwadi
Willing provide
Health subc
Willing provide P.
school
Willing provide dr
waterWilling
provide any
Andhra 0.009 -0.200 -0.133 -0.140 -0.168 0.027
(0.232) (4.108) (2.683) (2.819) (3.741) (0.821)
Karnataka -0.211 -0.301 -0.348 -0.251 -0.334 -0.268
(6.429) (8.444) (8.842) (7.458) (10.691) (12.258)
TamilNadu 0.030 -0.066 -0.068 -0.029 -0.067 -0.044
(0.893) (1.908) (1.719) (0.851) (2.241) (1.982)
Pradhan's Vill 0.010 0.033 0.025 0.031 0.017 0.032
(0.613) (2.204) (2.098) (2.170) (1.040) (1.747)
Reserved GP 0.002 0.008 0.008 -0.001 0.025 0.015
(0.171) (0.460) (0.502) (0.079) (1.523) (0.760)
female -0.045 -0.046 -0.057 -0.052 -0.065 -0.085
(4.104) (3.871) (4.318) (4.414) (6.235) (7.324)
SCST 0.001 0.003 0.006 0.001 -0.013 0.019
(0.075) (0.150) (0.400) (0.061) (0.899) (1.071)
wealthy 0.025 0.038 0.032 0.038 0.015 0.057
(1.547) (2.482) (2.401) (2.912) (1.116) (3.363)
landless -0.014 -0.030 -0.027 -0.028 -0.026 -0.063
(0.901) (1.952) (1.715) (2.026) (1.712) (4.208)
politician -0.053 -0.039 -0.089 -0.033 -0.023 -0.003
(1.524) (1.033) (2.476) (0.865) (0.589) (0.056)
N 5460 5460 5460 5460 5460 5460
Adj R-sq 0.077 0.097 0.150 0.084 0.099 0.116
Notes:
1)absolute values of t-statistics clustered by block in parenthesis
2)block pair fixed effects included in regression
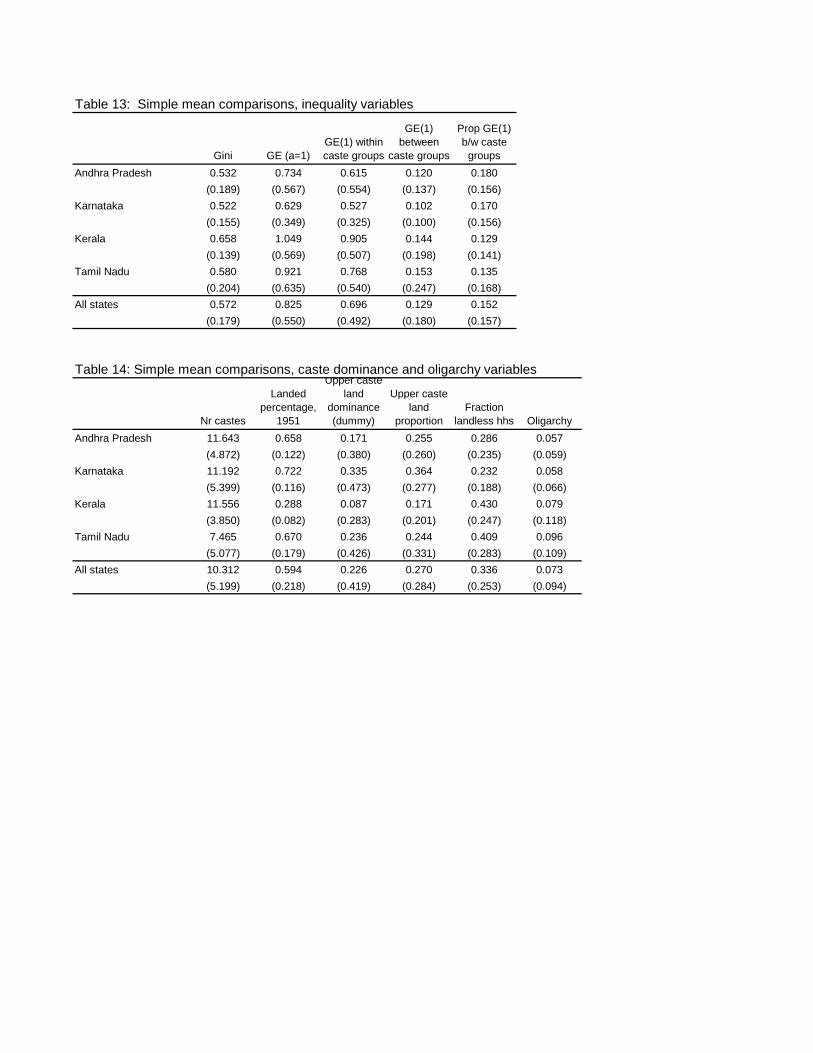
Table 13: Simple mean comparisons, inequality variables
Gini GE (a=1)GE(1) within caste groups
GE(1) between
caste groups
Prop GE(1) b/w caste
groups
Andhra Pradesh 0.532 0.734 0.615 0.120 0.180
(0.189) (0.567) (0.554) (0.137) (0.156)
Karnataka 0.522 0.629 0.527 0.102 0.170
(0.155) (0.349) (0.325) (0.100) (0.156)
Kerala 0.658 1.049 0.905 0.144 0.129
(0.139) (0.569) (0.507) (0.198) (0.141)
Tamil Nadu 0.580 0.921 0.768 0.153 0.135
(0.204) (0.635) (0.540) (0.247) (0.168)
All states 0.572 0.825 0.696 0.129 0.152
(0.179) (0.550) (0.492) (0.180) (0.157)
Table 14: Simple mean comparisons, caste dominance and oligarchy variables
Nr castes
Landed percentage,
1951
Upper caste land
dominance (dummy)
Upper caste land
proportionFraction
landless hhs Oligarchy
Andhra Pradesh 11.643 0.658 0.171 0.255 0.286 0.057
(4.872) (0.122) (0.380) (0.260) (0.235) (0.059)
Karnataka 11.192 0.722 0.335 0.364 0.232 0.058
(5.399) (0.116) (0.473) (0.277) (0.188) (0.066)
Kerala 11.556 0.288 0.087 0.171 0.430 0.079
(3.850) (0.082) (0.283) (0.201) (0.247) (0.118)
Tamil Nadu 7.465 0.670 0.236 0.244 0.409 0.096
(5.077) (0.179) (0.426) (0.331) (0.283) (0.109)
All states 10.312 0.594 0.226 0.270 0.336 0.073
(5.199) (0.218) (0.419) (0.284) (0.253) (0.094)
ANNEX B:
The Politics of Public Good Provision: Evidence from Indian Local Governments
The Politics of Public Good Provision: Evidence
from Indian Local Governments∗†
Timothy Besley
London School of Economics
Rohini Pande
Yale University
Lupin Rahman
IMF
Vijayendra Rao
World Bank
Abstract
This paper uses village and household survey data from South India
to examine how political geography and politician identity impacts
on public good provision. We provide evidence that the nature of
this relationship varies by type of public goods. For high spill-over
public goods residential proximity to elected representative matters. In
contrast, for low spill-over public goods sharing the politician’s group
identity is what matters.
JEL Classifications: D78, H40,
∗Acknowledgments: We thank Ian Gascoigne for research assistance. Funding was
provided by World Bank RSB grant P077385, and from the South Asia Rural Department
of the World Bank. The views in this paper are those of the authors and should not be
attributed to the World Bank or the IMF.†Email addresses: Besley: [email protected]; Pande: [email protected]; Rah-
man: [email protected]; Rao: [email protected].
1
1 Introduction
Making the state more relevant to the interests of the poor is an increasingly
important theme in discussions of anti-poverty policies. Yet there is little
consensus on the appropriate way to develop governance structures that are
responsive to the interests of the poor. Whether greater decentralization of
political power can achieve this remains unclear. On the one hand, it may
enhance the accountability of elected representatives and amplify the politi-
cal voice of poor people while, on the other, it may enhance the influence of
local elites (Bardhan and Mookherjee (2000)) Moreover, whether decentral-
ized public good provision better represents the needs of the local population
remains sensitive to assumptions about heterogeneity of preferences in the
local population and extent of spill-overs associated with different public
goods (Besley and Coate (2003)).
This paper uses survey data on village governments in South India to pro-
vide some evidence on these issues. In India, a 1993 constitutional amend-
ment made a three-tier elected local government obligatory throughout the
country.1 Our focus is on the lowest tier of this local self-government. This
is a popularly elected village council — the Gram Panchayat (from now on,
GP). The constitutional amendment also required state governments to del-
egate certain policy-making powers to these local governments. The specific
choice of these policies was left up to states. States have typically dele-
gated responsibility for the construction and maintenance of village public
goods and beneficiary selection for various central and state-funded wel-
1The three tiers are defined at different administrative levels with the village being the
lowest, then the block and finally the district. Matthew and Buch (2003) provide more
details about how this was implemented.
2

fare schemes to these bodies (see Chaudhuri (2003 and Matthew and Buch
(2000)) for overviews of the diverse experience of Indian states).
The Indian decentralization experiment is unique on many fronts — of
main interest to us are the facts that it mandated political representation
via reservation for socially and economically disadvantaged groups and gave
representatives elected by villagers decision-making power over an array of
village-level public goods.2
We focus on reservation for the post of the head of the GP in favor
of scheduled castes/scheduled tribes (SC/ST). SC/STs include castes and
tribes which have historically suffered economic and social discrimination.3
In GPs where the post is reserved for SC/STs only SC/ST individuals can
stand for election. The composition of the electorate is unaffected by polit-
ical reservation.
Previous work on political reservation suggests that political reserva-
tion for a group leads to a higher incidence of policies preferred by and/or
targeted towards that group (see Pande (2003) for state-level evidence in
the case of SC/ST, and Chattopadhyay and Duflo (2002) for village-level
evidence in the case of women). Our contribution is to point to the im-
portance of public good technology and political geography in shaping the
policy impact of political reservation.
The head has the ability to shape resource allocation, and hence may do
so in a direction that favors his own village. How village members benefit
from this depends on the technology of the public good. With high spill-over
2As expenditure levels of village governments are largely set by state governments our
main focus is on distribution.3See Pande (2003) for a description of which castes/tribes belong to these categories,
and Gupta (2000) for an overview of caste-based discrimination.
3
public goods such as the access road to a village or an overhead tank for
water, the whole village benefits. However, for low spill-over goods such as
programs targeted towards specific groups within the villages, it is less clear.
We may expect this to depend on the underlying preferences and sympathies
of the head.
Our analysis incorporates insights from the local public finance literature
— this concerns the allocation of public spending across geographical units
within a polity. In the well-knownWeingast, Shepsle, Johnsen (1980) model,
the problem is to allocate pure local public goods to a variety of districts,
each of whose interest is represented by a legislator. They propose that
resource allocation will obey a “norm of universalism” in which each district
gets what they want as long as all other districts are allowed to do the
same. In their model, there is excessive spending, but the allocation is
equal. This contrasts with agenda setting models of resource allocation
where the propose is able to get an advantage in getting his/her preferred
outcome (see Romer and Rosenthal (1978)) or a minimum winning coalition
model in which the winning group is able to get an outcome that it favors
(see Baron (1993)). Our findings suggest that agenda setting models can
better explain public good allocation in South Indian villages.
This paper fits into a wider literature studying the social and politi-
cal context of public spending. A variety of studies place weight on the
relationship between heterogeneity and public goods provision — see, for ex-
ample, Alesina, Baqir and Easterly (1999) and Miguel and Gugerty (2002).
It is also related to the large literature on political determinants of resource
allocation, see for example, Knight (2003).
The remainder of the paper is organized as follows. In the next section,
we describe the institutional setting. In section three, we discuss a simple
4

model which motivates our results. Section four we describe our survey and
present results. Section five concludes.
2 Institutional background
The GP is the lowest tier of local self-government in India and is a popularly
elected village council. Depending on village population, a GP may cover
between 1 and 5 revenue villages. Every GP consists of up to twenty wards.4
Elections are at the ward-level, and the elected ward members constitute the
GP council. The head of this council is the Pradhan.5
The 73rd constitutional amendment mandated political reservation in
favor of SC/ST for the Pradhan position, and required that the extent of
such reservation in a state reflect the SC/ST population share in that state.
The amendment also required that no GP be reserved for the same group
for two consecutive elections. The choice of which GPs to reserve was left to
individual states. Typically, the same fraction of GPs are reserved in every
district in a state.
A GP has responsibilities of civic administration with limited indepen-
dent taxation powers.6 While the ambit of GP policy influence varies across
Indian states GPs typically perform (at least) two distinct policy tasks. The
first is beneficiary selection for central and state welfare schemes. These are
schemes which provide beneficiary households with funds to acquire house-
hold public goods such as housing and private electricity and water supply.
4For our sample states the population per ward varies between 300 and 800.5In Andhra Pradesh and Tamil Nadu the Pradhan is directly elected, while in Kar-
nataka he/she is nominated from the pool of elected ward members.6On average, roughly 10 percent of a GP’s total revenue come from own revenues with
the remainder consisting of transfers from higher levels of government.
5

Eligibility for these schemes is usually restricted to households below the
official poverty line. In addition, most schemes require that a minimum
fraction of beneficiaries be SC/ST. The second area of GP policy activism
is the construction and maintenance of village public goods such as street-
lights, roads and drains. The GP decides the distribution of these public
goods within the village, and the quality of such public good provision.7
Panchayat legislation requires that the Pradhan consult with villagers
(via village meetings) and ward members in deciding the choice of beneficia-
ries and allocation of public goods. However, final decision-making powers
in a GP are vested with the Pradhan.
3 Theory
We start with a theoretical model which is intended to think through the
issues.8 Consider a GP comprising of two villages indexed j ∈ {1, 2}. Eachvillage has two caste groups indexed k ∈ {s, n}, where s denotes the SC/STgroup and n the non SC/ST group. The share of group s in village j is πj.
For simplicity, assume a single public good is provided to each group
within a village. Let gjk ∈ [0,G] denote the level of public good provisionfor caste k in village j. This public good may have positive spill-overs
for villagers belonging to the other caste group, −k. Hence individuals
(potentially) care about the level of public goods provided to both caste
groups in a village. Specifically:
7Schedule XI of the Constitution defines the functional items for which states may
devolve responsibility to Panchayats.8The model is very similar in many respects to Besley and Coate (2003).
6

V jk
³gjk, g
j−k´= log(gjk) + λ log(gj−k) + y
jk
λ ≥ 0 measures the extent of spill-overs in public good provision. Privategoods are captured in the term yjk. If λ = 1, then it is a pure village-level
public good, while if λ = 0, then the good only benefits the group to whom
it is provided.
Public goods are funded from a fixed pot of tax revenue, T . We normalize
the price of public good provision to one. Thus, the budget constraint is:
g1s + g2s + g
1n + g
2n = T .
Group-wise allocation of public goods is determined by elected GP rep-
resentatives. Each village elects one villager as representative, one of whom
is the Pradhan. We adopt the convention that village one is the Pradhan’s
village, that is it has the Pradhan as the representative. The GP is reserved
if only SC/ST individuals can run for election in village 1. For expositional
ease we assume that, absent reservation, SC/ST individuals never run for
election.9 We do not explicitly model the decision making procedure but
assume that it maximizes a weighted sum of the utility of the two repre-
sentatives where a weight µ > 1/2 is applied to the utility of the Pradhan.
Let ` (j) ∈ {s, n} be the type of the Panchayat representative in village j.9This assumption is in line with reality — Chattopadhyay and Duflo (2003) show that
this can be explained by the minority group having higher costs of running for election,
while Pande (2003) shows that this can also be explained by inadequate minority repre-
sentation in political parties.
7

Then, the public good allocation will solve:
µV 1`(1)
³g1`(1), g
1−`(1)
´+ (1− µ)V 2`(2)
³g2`(2), g
2−`(2)
´subject to
g1s + g2s + g
1n + g
2n = T
It is easy to check that the solution to this is:
g1`(1) =µ1+λT g1−`(1) =
µλ1+λT
g2`(2) =(1−µ)1+λ T g2−`(2) =
(1−µ)λ1+λ T.
Thus the village/caste group allocation depends on the decision-making pro-
cess as represented by µ and the extent of spill-overs in public good provision
as represented by λ. Comparison of the public good level across groups yields
the following empirically testable predictions.
Claim 1 Pradhan effects — Relative to non-Pradhan village, public good al-
location is higher in Pradhan’s village.
Claim 2 Caste effects — Relative to non SC/ST group, the public good al-
location for the SC/ST group is higher when the GP is reserved.
Claim 3 Spill-overs — The impact of reservation on public good allocation
diminishes as spill-overs increase.
4 Evidence
In this section we use survey data from India to provide evidence on the
impact of Pradhan residence and political reservation on the provision of
low and high spill-over public goods.
8

4.1 Data and Survey Design
Our data comes from a survey we conducted in three South Indian states —
Andhra Pradesh, Karnataka and Tamil Nadu — between September-November
2002. At this point at least one year had lapsed since the last GP election
in each of our sample states.10 The survey covered 396 villages across 181
GPs in thirty blocks (a block is the administrative unit below a district in
a state).11 Summary statistics are provided in Table 1 (for details of the
survey, see Besley, Pande, Rahman and Rao (2003)).
We use information from an independent audit of village facilities to
construct an index of GP activity on high spill-over (i.e. village-level) public
goods. This index measures whether the GP undertook any construction or
improvement activity on within-village roads, drains, street-lights and water
sources since the last GP election. The index is normalized to lie between 0
and 1. Roughly seventy-nine percent of our sample villages experienced GP
activism on at least one of these public goods.
We use data from household surveys in a random sub-sample of 193 vil-
lages to measure the provision of low spill-over (household) public goods.
In every sampled village twenty one household surveys were conducted, of
which four were with SC/ST households and one was with an elected Pan-
chayat representative.12 This gives us a total of 4059 households of which
10The second round of GP elections in these states occurred in August 2001 in Andhra
Pradesh, February 2000 in Karnataka, and October 2001 in Tamil Nadu.11The survey was also conducted in Kerala. Kerala, however, has a different adminis-
trative structure — for instance, a Kerala Gram Panchayat covers a population of 30,000
as against 5-10,000 in the other states.12An additional household survey was conducted with the Pradhan if s/he resided in
that village, and with a ward member otherwise (in six villages both a ward member and
Pradhan interview were conducted).
9

981 were SC/ST. We measure a household’s exposure to low spill-over public
goods by a dummy which equals one if it had a house or toilet built under a
government scheme or if it received a private water or electricity connection
via a government scheme since the last GP election. Approximately seven
percent of the sample households fall in this category.
We are interested in the implications of political reservation and Pradhan
proximity for the allocation of high and low spill-over public goods across
and within villages. We capture a village’s reservation status by a dummy
variable which equals one if the village belongs to a GP reserved for SC/ST.
We use two dummy variables to measure the political influence of a village
— the first equals one if the Pradhan resides in that village, and the second
equals one if the GP headquarters are in that village.
4.2 Household Level Evidence
Let yivg be an indicator variable which equals one if household i in village v
in GP g has received a low spill-over public good since the last GP election.
We estimate a regression of the form:
yivg = αv + γ1Civg + γ2Civg ×Rg + γ3Civg × Pvg + γ4Civg ×Gvg + φXivg + εivg
(1)
where Civg is a SC/ST dummy, Rg the SC/ST reservation dummy and Pvg
and Gvg the Pradhan’s village and GP headquarter dummies respectively.
αv are village fixed effects and Xivg is a set of household level controls (see
notes to Table 2 for details). Inclusion of a village fixed effect implies that
we identify the effect of reservation on public good provision solely from
within village variation in allocation.
10
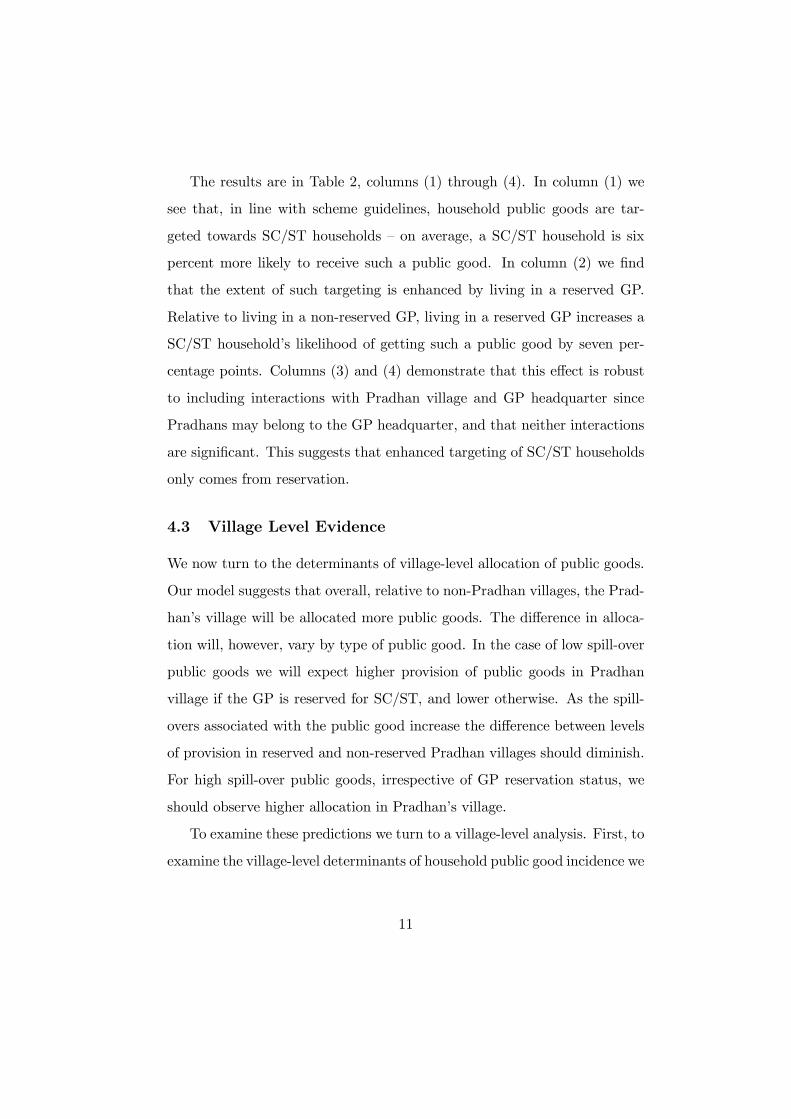
The results are in Table 2, columns (1) through (4). In column (1) we
see that, in line with scheme guidelines, household public goods are tar-
geted towards SC/ST households — on average, a SC/ST household is six
percent more likely to receive such a public good. In column (2) we find
that the extent of such targeting is enhanced by living in a reserved GP.
Relative to living in a non-reserved GP, living in a reserved GP increases a
SC/ST household’s likelihood of getting such a public good by seven per-
centage points. Columns (3) and (4) demonstrate that this effect is robust
to including interactions with Pradhan village and GP headquarter since
Pradhans may belong to the GP headquarter, and that neither interactions
are significant. This suggests that enhanced targeting of SC/ST households
only comes from reservation.
4.3 Village Level Evidence
We now turn to the determinants of village-level allocation of public goods.
Our model suggests that overall, relative to non-Pradhan villages, the Prad-
han’s village will be allocated more public goods. The difference in alloca-
tion will, however, vary by type of public good. In the case of low spill-over
public goods we will expect higher provision of public goods in Pradhan
village if the GP is reserved for SC/ST, and lower otherwise. As the spill-
overs associated with the public good increase the difference between levels
of provision in reserved and non-reserved Pradhan villages should diminish.
For high spill-over public goods, irrespective of GP reservation status, we
should observe higher allocation in Pradhan’s village.
To examine these predictions we turn to a village-level analysis. First, to
examine the village-level determinants of household public good incidence we
11

recover the village fixed effects from (1) and regress these on village char-
acteristics. Second, to examine the determinants of high spill-over public
goods we use our index of GP activism on village public goods.13.
Our empirical model for village level regressions is:
yvg = αb + γ1Rg + γ2Pvg + γ3Gvg + γ4Rg × Pvg + φXvg + εvg
where αb are block dummy variables andXvg are village level controls. These
regressions rely on within-block variation in the explanatory variables for
identification purposes.
In our household-level regressions (columns (1)-(4)) the village fixed ef-
fects were jointly significant. In columns (5) and (6), Table 2 we examine
whether village level measures of political power underlie the statistical sig-
nificance of the village fixed effects. However, none of our measures of polit-
ical power — whether the Pradhan position is reserved for SC/ST, whether it
is the Pradhan’s village and/or GP headquarters — affects village-level alloca-
tion of household public goods. Household public goods have low spill-overs
and are targeted towards SC/ST. Hence we expect non-SC/ST and SC/ST
Pradhans’ to differ in their propensity to allocate resources towards such
public goods. Given this, it is unsurprising that the overall incidence of
targeted public goods is unrelated to Pradhan’s residence. However, it is
surprising that this is also the case when the Pradhan position is reserved
for SC/ST. It appears that political reservation is relevant for within-village
allocation of low spill-over goods but not for overall village allocation.
Columns (7) and (8) consider the village incidence of high spill-over
public goods, as measured by the GP activism index. We find that this
13As the public good audit was conducted in every village while household surveys were
conducted in only half the villages we have twice as many observations in the latter case
12

index is, on average 0.04 points, higher in the Pradhan’s village. In term’s of
our theory, this underlines our assumption that µ exceeds one half — so that
the Pradhan enjoys agenda setting power in resource allocation. Moreover,
the fact that these public goods are high spill-over is consistent with the
finding that the reservation status of the GP does not affect the extent of
village-level provision.14
5 Concluding Remarks
This paper takes a preliminary look at resource allocation by elected village
governments using data from three Indian states. We motivated the em-
pirical analysis with a simple model of resource allocation based on three
aspects — the effect of Pradhan’s group identity on policy, the agenda setting
powers of the Pradhan and the extent of spill-overs associated with different
types of public goods. The evidence speaks to the relevance of these ideas.
The results add to a growing body of evidence which looks at decision mak-
ing at the local level and its impact on the well-being of the poor. However,
much remains to be done to gain a complete picture of democracy works in
low income contexts.
References
Alesina, Alberto, Reza Baqir and William Easterly, “Public Goods and Eth-
nic Divisions,” Quarterly Journal of Economics, 114(4), pp. 1243-1284.
Bardhan, Pranab and Dilip Mookherjee, [2000], “Capture and Governance
at Local and National Levels,” American Economic Review, 90(2), pp. 135-
14While the effect of being in the Pradhan’s village is interesting, we cannot rule out the
possibility that the Pradhan’s village is politically powerful for reasons other than having
the Pradhan.
13

39
Baron, David P., [1993], “Government Formation and Endogenous Parties,”
American Political Science Review ; 87(1), pp. 34-47.
Besley, Timothy and Stephen Coate, [2003], “Centralized versus Decentral-
ized Provision of Local Public Goods: A Political Economy Analysis,” Jour-
nal of Public Economics; 87(12), pp. 2611-2637.
Besley, Timothy, Rohini Pande, Lupin Rahman and Vijayendra Rao, [2003]
“Decentralization in India: A Survey of South Indian Panchayats”, Mimeo,
World Bank.
Chattopadhyay, Raghabendra and Esther Duflo, [2001], “Women as Pol-
icy Makers: Evidence from a India-Wide Randomized Policy Experiment,”
Mimeo, Department of Economics, MIT.
Chaudhuri, Shubham, [2003], “What difference does a constitutional amend-
ment make? The 1994 Panchayati Raj Act and the attempt to revitalize
rural local government in India,” typescript, Columbia University.
Gupta, Dipankar (2000), Interrogating Caste: Understanding hierarchy &
difference in Indian Society, Penguin Books, New Delhi
Mathew, George and Nirmala Buch [2003], Status of Panchayati Raj in the
States and Union Territories of India, Concept Publishing Company, New
Delhi
Miguel, Ted and Mary Kay Gugerty [2002], “Ethnic Diversity, Social Sanc-
tions and School Funding in Kenya”, Mimeo, Department of Economics,
University of California, Berkeley.
Oates, Wallace, [1972], Fiscal Federalism, Harcourt Brace: New York.
Pande, Rohini, [2003], “Minority Representation and Policy Choices: The
Significance of Legislator Identity,” American Economic Review ; 93(4), pp.
1132-1151.
14

Romer, Thomas and Howard Rosenthal, [1978], “Political Resource Allo-
cation, Resource Allocation and the Status Quo,” Public Choice, 33, pp.
27-43.
Weingast, Barry, Kenneth Shepsle, and C. Johnsen, [1981], “The Political
Economy of Benefits and Costs: A Neo-classical Approach to Distributive
Politics,” Journal of Political Economy, 89, pp. 642-64.
15
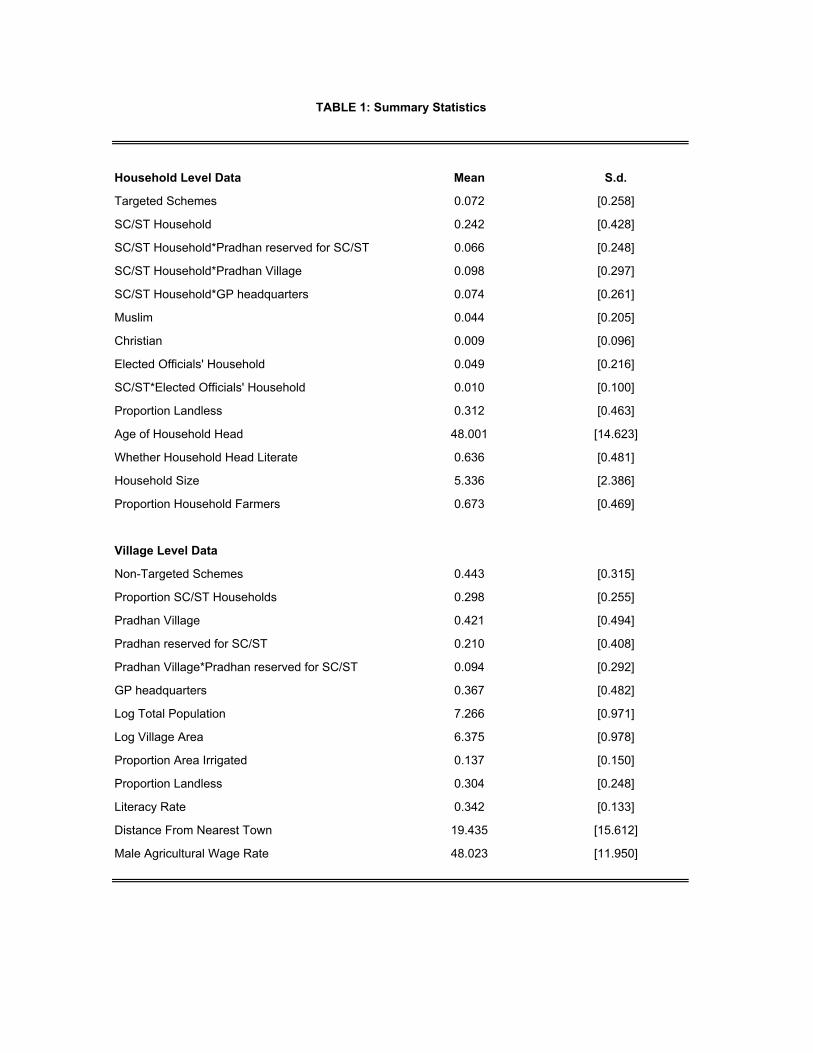
Household Level Data Mean S.d.
Targeted Schemes 0.072 [0.258]
SC/ST Household 0.242 [0.428]
SC/ST Household*Pradhan reserved for SC/ST 0.066 [0.248]
SC/ST Household*Pradhan Village 0.098 [0.297]
SC/ST Household*GP headquarters 0.074 [0.261]
Muslim 0.044 [0.205]
Christian 0.009 [0.096]
Elected Officials' Household 0.049 [0.216]
SC/ST*Elected Officials' Household 0.010 [0.100]
Proportion Landless 0.312 [0.463]
Age of Household Head 48.001 [14.623]
Whether Household Head Literate 0.636 [0.481]
Household Size 5.336 [2.386]
Proportion Household Farmers 0.673 [0.469]
Village Level Data
Non-Targeted Schemes 0.443 [0.315]
Proportion SC/ST Households 0.298 [0.255]
Pradhan Village 0.421 [0.494]
Pradhan reserved for SC/ST 0.210 [0.408]
Pradhan Village*Pradhan reserved for SC/ST 0.094 [0.292]
GP headquarters 0.367 [0.482]
Log Total Population 7.266 [0.971]
Log Village Area 6.375 [0.978]
Proportion Area Irrigated 0.137 [0.150]
Proportion Landless 0.304 [0.248]
Literacy Rate 0.342 [0.133]
Distance From Nearest Town 19.435 [15.612]
Male Agricultural Wage Rate 48.023 [11.950]
TABLE 1: Summary Statistics
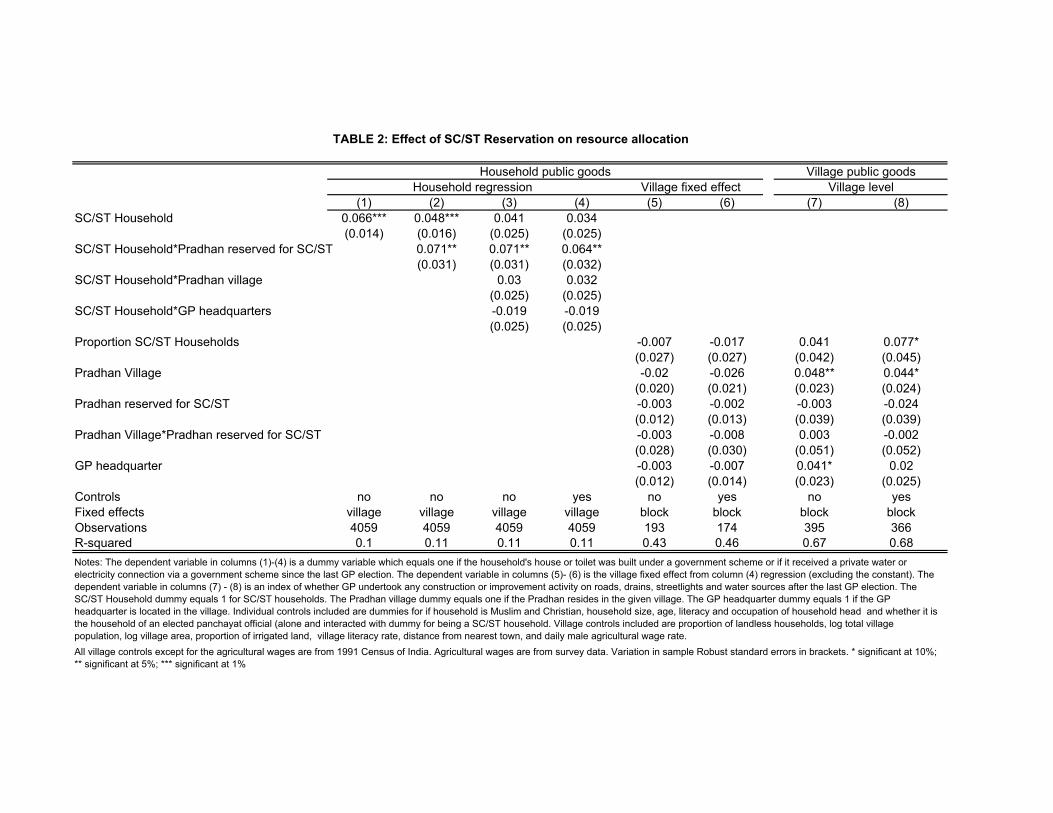
(1) (2) (3) (4) (5) (6) (7) (8)SC/ST Household 0.066*** 0.048*** 0.041 0.034
(0.014) (0.016) (0.025) (0.025)SC/ST Household*Pradhan reserved for SC/ST 0.071** 0.071** 0.064**
(0.031) (0.031) (0.032)SC/ST Household*Pradhan village 0.03 0.032
(0.025) (0.025)SC/ST Household*GP headquarters -0.019 -0.019
(0.025) (0.025)Proportion SC/ST Households -0.007 -0.017 0.041 0.077*
(0.027) (0.027) (0.042) (0.045)Pradhan Village -0.02 -0.026 0.048** 0.044*
(0.020) (0.021) (0.023) (0.024)Pradhan reserved for SC/ST -0.003 -0.002 -0.003 -0.024
(0.012) (0.013) (0.039) (0.039)Pradhan Village*Pradhan reserved for SC/ST -0.003 -0.008 0.003 -0.002
(0.028) (0.030) (0.051) (0.052)GP headquarter -0.003 -0.007 0.041* 0.02
(0.012) (0.014) (0.023) (0.025)Controls no no no yes no yes no yesFixed effects village village village village block block block blockObservations 4059 4059 4059 4059 193 174 395 366R-squared 0.1 0.11 0.11 0.11 0.43 0.46 0.67 0.68
TABLE 2: Effect of SC/ST Reservation on resource allocation
Notes: The dependent variable in columns (1)-(4) is a dummy variable which equals one if the household's house or toilet was built under a government scheme or if it received a private water or electricity connection via a government scheme since the last GP election. The dependent variable in columns (5)- (6) is the village fixed effect from column (4) regression (excluding the constant). The dependent variable in columns (7) - (8) is an index of whether GP undertook any construction or improvement activity on roads, drains, streetlights and water sources after the last GP election. The SC/ST Household dummy equals 1 for SC/ST households. The Pradhan village dummy equals one if the Pradhan resides in the given village. The GP headquarter dummy equals 1 if the GP headquarter is located in the village. Individual controls included are dummies for if household is Muslim and Christian, household size, age, literacy and occupation of household head and whether it is the household of an elected panchayat official (alone and interacted with dummy for being a SC/ST household. Village controls included are proportion of landless households, log total village population, log village area, proportion of irrigated land, village literacy rate, distance from nearest town, and daily male agricultural wage rate.All village controls except for the agricultural wages are from 1991 Census of India. Agricultural wages are from survey data. Variation in sample Robust standard errors in brackets. * significant at 10%; ** significant at 5%; *** significant at 1%
Village fixed effectVillage public goodsHousehold public goods
Household regression Village level

ANNEX C:
Participatory Democracy in Action: Survey Evidence from India

Participatory Democracy in Action:
Survey Evidence from South India∗
Tim Besley (LSE) Rohini Pande(Yale)
and Vijayendra Rao (World Bank)†
Abstract
We use household and village survey data from South India to exam-
ine who participates in village meetings called by elected local govern-
ments, and what effect these meetings have on beneficiary selection
for welfare programs. Our main finding is that members of socially
and economically disadvantaged groups, specifically landless and low
caste individuals, are both more likely to attend these meetings and
be chosen as beneficiaries in villages which have village meetings.
JEL Classification: H40, H42, O20∗Acknowledgements We thank Lupin Rahman, Radu Ban, Siddharth Sharma and Jil-
lian Waid for research assistance, and the IMRB staff for conducting the survey. We are
grateful to the World Bank’s Research Committee and the South Asia Rural Development
Unit for financial support. The opinions in the paper are those of the authors and do not
necessarily reflect the points of view of the World Bank or its member countries.†Email addresses: Besley <[email protected]>; Pande<[email protected]>;
Rao<[email protected]>
1

1 Introduction
How to structure democratic institutions to ensure a fair and efficient allo-
cation of public funds is a central issue in the political economy of devel-
opment. The new governance agenda has emphasized citizen empowerment
as a tool for improving the workings of democratic institutions.1 But such
terms can easily be dismissed as empty rhetoric unless embodied in workable
institutional solutions.
The idea that encouraging citizen participation can improve the work-
ings of a democracy is also echoed in the political science literature. One
role for participation emphasized in that literature is to improve the flow
of information into the political process beyond that available by electing
representatives. Thus, Verba et (1995) characterize political participation
as “information rich” acts and observe that:
”From the electoral outcome alone, the winning candidate cannot
discriminate which of dozens of factors, from the position taken
on a particular issue to the inept campaign run by the opposition
..., was responsible for the electoral victory.” (page 10).
This paper studies an institution aimed at encouraging political partici-
pation among the poor and improving the quality of governance in an Indian
context – Gram Sabha meetings. These are village meetings called by the
elected local government (Gram Panchayat) to discuss resource allocation
decisions in the village.2 There are two main ways in which such meetings1ee, for example, World Bank (2000).2he 73rd Constitutional Amendment Act of India in 1993 made it mandatory for Indian
states to hold elections for Gram Panchayats and to give them policy-making powers.
2

may improve the workings of government. First, relative to elected repre-
sentatives, these meetings may better reflect citizens’ preferences on issues
such as how to target resources to the neediest groups. Second, by provid-
ing a forum for monitoring the actions of elected representatives they may
reduce agency problems in politics, and the extent of corruption.
While holding Gram Sabhas is compulsory, their frequency and content
owes a lot to the discretion of elected officials.3 Moreover, even a well-
attended meeting may have no bite on policy decisions. Here, we exploit a
large household and village survey of local governments in the four South
Indian states to examine of participation in Gram Sabhas, and whether
having a Gram Sabha affects beneficiary selection for welfare programs.
While there is much interest in how participation improves the quality
of governance in the developing world (see, for example, Manor (2004)), evi-
dence on the determinants of participation at the household level is thin, es-
pecially compared to the extensive studies available for the advanced democ-
racies. Moreover, the literature is replete with concerns about elite dom-
inance of democratic institutions.4 This raises the specter of participatory
institutions being a veil which have little impact on the well-being of the
poor. Here, however, we find that it is the most disadvantaged groups who
attend village meetings and that holding such meetings improves the tar-
geting of resources towards the neediest groups.
Our findings contribute to a broader debate about the role of decentral-
ized governance in improving the quality of government in the developing
world. The merits of decentralization have been widely debated – see, for3State or District admininstration officials can also affect this by choosing not to attend,
and therefore making the Gram Sabha less attractive to hold.4see, for example, Bardhan and Mookherjee (2000) and Platteau and Abraham (2002).
3

example, Bardhan (2002) and Triesman (2002). However, it is clear that
many institutional details, even within decentralized governance, can be im-
portant. The use of village meetings of the kind studied here is one. It is
important to understand how these institutional differences affect the way
in which government operates.
The paper is organized as follows. In the next section, we describe the
context for our study and our data. Section three contains the analysis, and
Section four concludes.
2 Context
Our focus is on the lowest level of self government in India, the Gram Pan-
chayat (GP). Each GP covers between 1-5 villages. The Gram Sabha is a
village-level body consisting of persons registered in the electoral rolls of a
GP. It was intended to be a supervisory body that audits and regulates the
functioning of the GP. Specifically, it is supposed to ratify the GP budget,
and identify and approve of beneficiaries for welfare schemes implemented
by the GP. To achieve these tasks, most Indian states require that the Gram
Sabha meet (roughly) four times a year.
Between September -November 2002 we conducted a village and house-
hold survey of 522 villages and over 5000 households in the four South Indian
States of Andhra Pradesh, Karnataka, Kerala and Tamil Nadu . For admin-
istrative purposes Indian states are divided into districts, and then blocks.
For each state pair we selected two districts which shared a common state
boundary. The district pair belonged to the same political entity during the
200 years of British colonial rule, prior to 1956 when all Indian states were
reorganized along linguistic lines. This allows us to estimate state differ-
4

ences while controlling for common colonial history. For each district pair
we selected the 3 most ’linguistically similar’ block pairs (that is, 3 blocks
in each of the two districts). We defined linguistic similarity in terms of
the mother tongue of individuals living in the block, and computed it using
1991 census block level language data. 5 In total, we had 18 block pairs.
In each block we randomly sampled 3 GPs, and per GP up to 3 villages. In
Kerala, we sampled wards rather than villages as ward size approximates
village size in other states.
In every village, we conducted group meetings in which we obtained
information on the last Gram Sabha meeting, and also village-level demo-
graphic and economic variables. In a random sub-sample of 259 villages we
conducted twenty household surveys, and obtained information on Gram
Sabha attendance and household beneficiary status.
Table 1 reports descriptive statistics. The average village has 328 house-
holds, of which 34 percent are landless. Twenty percent belong to the tradi-
tionally well of upper castes and 28 percent to the historically disadvantaged
scheduled castes and tribes (hereafter SC/ST). According to the 1991 census
literacy rate in our sample villages averaged 41 percent, but as is well known
was much higher in Kerala villages. Seventy five percent of the villages had
at least one Gram Sabha meeting in the last year, and in 22 percent of these
meetings beneficiary selection was discussed.
In our household data-set we observe that while over 50 percent of the
respondents had heard of a Gram Sabha only 20 percent had ever attended
a Gram Sabha meeting. We also collected information on a household’s ben-5The historical and administrative similarity of linguistically matched blocks was
checked using princely state maps and the Report of the States Reorganization Com-
mittee (for details on sampling procedure, see Besley, Pande, Rahman and Rao, 2004b).
5

eficiary status, as defined by whether it has a ‘Below Poverty Line’ (BPL)
card. The GP, in collaboration with state government officials, is supposed
to identify (via a census) households with income below the poverty line,
and to give these households a BPL card. Possession of this card makes
the household eligible for an array of government schemes, ranging from
subsidized food through the public distribution system to free hospitaliza-
tion. The list of BPL households, and subsequent selection of beneficiary
households under various schemes is supposed to be ratified in Gram Sabha
meetings.
3 Analysis
The analysis is in two parts. We first study the determinants of holding
a Gram Sabha meeting and who attends. We then look for evidence that
holding a Gram Sabha meeting affects public resources allocation.
3.1 Determinants of holding a Gram Sabha and who attends
To study which villages have Gram Sabha meetings we estimate a linear
probability regression of the following form:
Svbs = αb + γs + δxvbs + εvbs
here Svbs is an indicator variable denoting whether village v in block
pair b and state s had a Gram Sabha in the past twelve months, alphab are
dummies for matched block pairs (18 in total) and γs are state fixed effects.
The variables xvbs are village level characteristics (number of households,
literacy rate in 1991, fraction landless, fraction SC/ST, fraction upper caste
6

and whether the position of Pradhan is reserved for a women or SC/ST).
We cluster the standard error at the GP level.
The results are in Table 2, column (1). More populous villages are more
likely to have had a Gram Sabha meeting, and villages with a higher literacy
rate are weakly more likely to hold Gram Sabha meetings. Interestingly,
after conditioning on matched block pair effects, we don’t observe significant
state differences in the decision to have a Gram Sabha.
In Columns (2)-(5) we use our household data to examine who has heard
of, and who attends Gram Sabha meetings. Columns (2) and (3) estimate
regressions of the form:
givbs = αb + γs + δxvbs + λcivbs + εivbs
here givbs indicates whether individual i (in village v in block pair b in state
s) has heard of the Gram Sabha in column (2), and whether he/she has ever
attended a Gram Sabha meeting in column (3). The variables civbs denote
a vector of respondent characteristics (whether respondent is an SC/ST,
female, illterate, landless, upper caste, to comes from a wealthy household
as measured by durables ownership).6
Village literacy rate is positively correlated with both hearing of the
Gram Sabha and attending it. We find evidence of significant state effects,
with respondents from Kerala more likely to have both heard of Gram Sabha
meetings and participated in them. However, in the case of individual char-
acteristics we observe significant differences in who has heard of and who
attends Gram Sabha meetings. Moreover, various measures of economic and
social disadvantage have a differential impact on the propensity to attend6he equation is estimated allowing for clustering of the error terms varepsiloniv at the
village level.
7

Gram Sabhas. Women and illiterates are less likely to both hear of and
attend these meetings. In contrast, SC/STs and the landless are more likely
to attend Gram Sabha meetings but no more likely to have heard of Gram
Sabhas. In contrast, the wealthy and upper castes are more likely to have
heard of Gram Sabhas but not to attend.
In column (4) we show that the effect of individual characteristics on
participation is robust to the inclusion of village fixed effects. Again, land-
less and SC/ST respondents report themselves more likely to attend a Gram
Sabha. Finally in column (5) we examine whether village literacy, in addi-
tion to affecting overall participation in a Gram Sabha meeting, also affects
the propensity of the disadvantaged to attend. We estimate the participa-
tion regression with village fixed effects and include the interactions between
village literacy rates and measures of individual economic and social disad-
vantage. Illiterate, landless and SC/ST individuals, but not women, are
more likely to participate in higher literacy villages.
These findings are notable for two reasons. First, there is some sug-
gestion of a political externality from living in a more literate community.
Second, Gram Sabha meetings seem to a be a forum used by some of the
most disadvantaged groups in the village – landless, illiterates and scheduled
castes/tribes. This suggests that these groups find the Gram Sabha useful
and that Gram Sabha meetings may play some role in moving policy in a
direction favored by these groups. We now look for evidence of the latter.
3.2 Does participation matter?
There are many who argue that participation in the political process has an
intrinsic benefit. It builds trust in government and legitimizes state action.
8

Unfortunately, our data do not permit us to look at these issues. However,
we are able to look at the possibility that participation in Gram Sabhas
yields instrumental (i.e. policy) benefits. These could be community wide
or by targeting resources to more specific groups. Here, we will focus on
the latter, examining whether targeting of public programs are related to
whether a Gram Sabha meeting has been held in the past twelve months.
We focus on an important specific policy administered at the village level
– access to a below poverty line (BPL) card. Beneficiary selection for such
cards is influenced by the GP. As discussed earlier, possession of this card
gives a villager access to an array of public benefits. We estimate a household
regression which exploits within village variation in individual characteristics
to examine whether the targeting of BPL cards differs depending on whether
the village had a Gram Sabha in the last year. Our key equation is:
biv = βv + ξciv + θ (civ ∗ Sv) + εiv
here βv is a village level fixed effect and εiv is adjusted for clustering at
the village level. The coefficients on household characteristics civ represent
the way in which access to BPL cards is targeted at the household level.
Our main interest is in the coefficients on θ which interacts household char-
acteristics with whether a Gram Sabha meeting was held in the past twelve
months – the indicator variable Sv. If θ is significantly different from zero,
then this suggests that some household types are favored in villages that
hold Gram Sabha meetings.
The results are reported in Table 3. In column (1) we report the base-
line regression which does not include any interaction terms, θ. This shows,
not surprisingly, that BPL cards are targeted towards landless, illiterate and
SC/ST households. In column (2) we include interactions between measures
9

of disadvantage and whether the village had a Gram Sabha meeting. We
find targeting of landless and illiterate individuals is more intensive in vil-
lages that have held a Gram Sabha meeting. Moreover, these effects are
economically significant with an 8-10% increase in the probability of receiv-
ing a BPL card in a village that held a Gram Sabha. We find similar, but
statistically insignificant, evidence for SC/STs.
These results do show persuasively that there is heterogeneity in target-
ing BPL cards across villages. Moreover, it would be tempting to attribute
this to whether a Gram Sabha meeting is held. However, some caution
is warranted. In column (3), we interact the characteristics that repre-
sent disadvantage – illiteracy, landlessness and schedule caste/tribe – with
the village literacy rate instead of whether the village had a Gram Sabha
meeting. All three of these interactions are significant. However, the
point estimate of the effect evaluated at the mean literacy rate is substan-
tially smaller than the effects in columns (2)-(4). But this does raise the
possibility that holding a Gram Sabha meeting is correlated with other vil-
lage characteristics that are important in shaping the way in which public
resources are targeted. Unfortunately, this is not an issue that we can re-
solve. However, these encouraging results on Gram Sabhas clearly deserve
further careful investigation.
4 Concluding Comments
While this paper focusses on a specific institution – the Gram Sabha –
the results contribute to a wider debate on how institution design can shape
public resource allocation and how the poor can increase their voice in public
institutions. It is frequently remarked that poverty is much more than
10
material deprivation and that the poor may receive much less voice in the
political process. Moreover, a good deal of cynicism attends initiatives to
strengthen that voice.
In this regard, our results sound a more optimistic note. The illiterate,
landless and SC/STs are significantly more likely to attend Gram Sabha
meetings than other groups. Moreover, there appears to be more targeting
towards these groups where Gram Sabha meetings are held. The results are
also suggestive of some externalities from literacy in the political process at
the village level.
Less optimistically, it is clear that Gram Sabhas are not a forum for
women in their current form. Women respondents are around 20% less
likely to attend a Gram Sabha than men. Whether this has significant
consequences for public resource allocation needs further investigation. But
it is clear the representativeness of Gram Sabhas is likely to be affected by
this. Other tools such as gender reservation in Panchayat representation
may go some way towards remedying this.7
Going forward, it is important to refocus debates on decentralization
more clearly on the institutional form that this takes. To this end, the kind
of study undertaken here should be useful in assessing the way in political
institutions are used. There are grounds for viewing participation may be
important in its own right. However, it may also have instrumental benefits
to groups who participate. Either way, it is clear that household surveys
have much potential in studying these issues.
7ee Chattopadhyay and Duflo (2004) and Besley et. al. (2004c)
11

References
Bardhan, Pranab, and Dilip Mookherjee (2000). ”Capture and Gover-
nance at Local and National Levels.” American Economic Review,
90(2), 135-139.
Bardhan, Pranab (2002). “Decentralization of Government and Devel-
opment.” Journal of Economic Perspectives, 16(4), 185-205.
Besley, Timothy, Rohini Pande, Lupin Rahman, and Vijayendra Rao
(2004a).“The Politics of Public Good Provision: Evidence from In-
dian Local Governments.” Journal of the European Economics As-
sociation, 2(2-3), 416-426.
Besley, Timothy, Rohini Pande, Lupin Rahman, and Vijayendra Rao,
[2004b]. “Decentralization in India: A Survey of South Indian Pan-
chayats.” mimeo, LSE.
Besley, Timothy, Rohini Pande, Vijayendra Rao, and Radu Ban,
(2004c). “Tokenism or Agency? The Impact of Women’s Reserva-
tion on Panchayats in South India.” mimeo Development Research
Group, The World Bank.
Chattopadhyay, Raghabendra, and Esther Duflo, (2004). “Women as
Policy Makers: Evidence from a India-Wide Randomized Policy
Experiment.” Econometrica, 72(5), 1409-1444.
Manor, James, (2004). “Democratization with Inclusion: political re-
forms and people’s empowerment at the grassroots.” Journal of Hu-
man Development, 5(1), 5-29.
Platteau, Jean-Philippe, and Anita Abraham, (2002). “Participatory
Development in the Presence of Endogenous Community Imperfec-
12

tions.” Journal of Development Studies, 39(2), 104-136.
Triesman, Daniel, (2002). “Decentralization and the Quality of Govern-
ment.” mimeo, UCLA.
Verba, Sidney, Kay Lehman Scholzman, and Henry E. Brady,
(1995).Voice and Equality: Civic Voluntarism in American Politics.
Cambridge Mass: Harvard University Press.
World Bank, (2000). World Development Report 2000/2001: Attacking
Poverty. Washington, DC, The World Bank.
13

Table 1:Descriptive Statistics
Overall Andhra Pradesh Karnataka Kerala Tamil NaduVillage level dataTotal households 328.10 305.50 365.80 401.10 227.40
Fraction of households which are 0.34 0.25 0.23 0.48 0.41landlessFraction of households which are 0.28 0.23 0.41 0.21 0.22SC/STFraction of households which are 0.20 0.13 0.32 0.12 0.19Upper casteLiteracy Rate in 1991 0.41 0.24 0.37 0.63 0.35
Fraction of villages which had a 0.76 0.71 0.68 0.98 0.67Gram Sabha in last yearFraction of Gram Sabhas at which 0.22 0.21 0.33 0.30 0.02beneficiary selection was discussed
Household level dataHeard of Gram Sabha 0.53 0.29 0.42 0.93 0.37
Ever attended Gram Sabha 0.20 0.11 0.14 0.40 0.13
Possess a BPL Card 0.22 0.32 0.10 0.30 0.25All variables based on survey data, except the village literacy rate which is from the 1991 Census of India

Table 2: Gram Sabha: Occurrence and AttendanceVillage had Household data: Gram Sabha
Gram sabha Heard of Attended (1) (2) (3) (4) (5)
Literacy Rate in 1991 0.328 0.323*** 0.235***(0.246) (0.118) (0.073)
Total number of households 0.093*** -0.001 0.006(0.030) (0.014) (0.010)
Fraction landless households 0.044 -0.017 -0.067**(0.086) (0.047) (0.032)
Fraction upper caste households -0.079 0.056 -0.011(0.116) (0.047) (0.032)
Fraction SC/ST households 0.03 0.021 -0.019(0.104) (0.041) (0.029)
Pradhan position reserved 0.01 0.043** -0.003(0.042) (0.020) (0.015)
Village Had Gram Sabha 0.026 0.030**(0.023) (0.014)
Illiterate -0.129*** -0.027** -0.030** -0.103***(0.015) (0.012) (0.013) (0.028)
Illiterate*literacy rate in 1991 0.183**(0.078)
SCST 0.001 0.021 0.034** -0.029(0.019) (0.016) (0.017) (0.040)
SCST*literacy rate in 1991 0.139(0.097)
Landless -0.012 0.041*** 0.030** -0.073**(0.014) (0.012) (0.012) (0.029)
Landless*literacy rate in 1991 0.232***(0.066)
Female -0.214*** -0.182*** -0.187*** -0.086***(0.014) (0.012) (0.014) (0.030)
Female*literacy rate in 1991 -0.242***(0.076)
Upper caste 0.035** 0.013 -0.004 -0.007(0.018) (0.016) (0.017) (0.018)
Wealthy 0.057*** -0.049*** -0.035** -0.027*(0.016) (0.014) (0.015) (0.016)
Andhra Pradesh -0.018 -0.171*** -0.168***(0.091) (0.048) (0.035)
Karnataka -0.089 -0.153*** -0.156***(0.063) (0.033) (0.032)
Tamil Nadu 0.019 -0.161*** -0.188***(0.061) (0.037) (0.029)
Fixed effects Block pair Block pair Block pair Village VillageObservations 476 4445 4935 5455 5240R-squared 0.22 0.39 0.17 0.25 0.25
Standard errors in brackets clustered at GP level in column (1) and at village level in all other regressions. Wealthy is a dummy for consumer durable ownership. Columns (2)-(4) also include respondent age and age squared as controls.* denotes significant at 10%; ** significant at 5%; *** significant at 1%

Table 3: Gram Sabha Occurrence and Beneficiary SelectionReceived BPL card
(1) (2) (3)Illiterate 0.028* -0.042* -0.057*
(0.015) (0.026) (0.030)Illiterate*Gram Sabha held 0.091***in last year (0.030)Illiterate* literacy rate in 1991 0.206***
(0.072)SCST 0.150*** 0.094** -0.03
(0.020) (0.042) (0.044)SCST*Gram Sabha held 0.062in last year (0.047)SCST* literacy rate in 1991 0.430***
(0.097)Landless 0.075*** 0.018 -0.098***
(0.016) (0.030) (0.035)Landless* Gram Sabha held 0.067*in last year (0.035)Landless*literacy rate in 1991 0.386***
(0.081)Female -0.011 -0.009 -0.005
(0.010) (0.010) (0.010)Upper caste -0.028* -0.028* -0.036**
(0.017) (0.016) (0.017)Wealthy -0.082*** -0.079*** -0.066***
(0.014) (0.014) (0.014)Fixed effects Village Village Village
Number of observations 5455 5364 5039R-squared 0.4 0.4 0.42Robust standard errors, clustered by village, in brackets. All regressions include respondent age and age squared as controls. * significant at 10%; ** significant at 5%; *** significant at 1%
ANNEX D:
Political Selection and the Quality of Government: Evidence from South India

Political Selection and the Quality of
Government: Evidence from South India∗
Timothy Besley (LSE) Rohini Pande (Yale)
and Vijayendra Rao (World Bank)†
Abstract
This paper uses household data from India to examine the economic and social
status of village politicians, and how individual and village characteristics affect
politician behavior while in office. Education increases the chances of selection
to public office and reduces the odds that a politician uses political power
opportunistically. In contrast, land ownership and political connections enable
selection but do not affect politician opportunism. At the village level, changes
in the identity of the politically dominant group alters the group allocation of
resources but not politician opportunism. Improved information flows in the
village, however, reduce opportunism and improve resource allocation.
∗We thank numerous seminar participants, and Joseph Altonji, Penny Goldberg, Asim Khwaja,
Dominic Leggett, Barry Weingast and, especially, Chris Udry for comments. We also thank Lupin
Rahman, Radu Ban, Sarah Goff, Siddharth Sharma and Jillian Waid for research assistance, and
IMRB staff for conducting the survey. We thank World Bank’s Research Committee and the
South Asia Rural Development Unit for financial support. The opinions in the paper are those
of the authors and do not necessarily reflect the points of view of the World Bank or its member
countries.†Email addresses: Besley <[email protected]>; Pande<[email protected]>;
Rao<[email protected]>
1
“The nature of the workings of government depends ultimately on the
men who run it. The men we elect to office and the circumstances we
create that affect their work determine the nature of popular government.
Let there be emphasis on those we elect to office.” V.O. Key (1956).
“A Hindu’s public is his caste.” B.R. Ambedkar (1937).
1 Introduction
Common sense discussions of political life often place the quality of politicians at
center stage. For example, Thomas Jefferson believed that a key role of elections
was to create a “natural aristocracy” of the talented and virtuous (Jefferson (1813)).
Yet the modern political economy literature remains dominated by a paradigm in
which good policy is achieved solely by getting incentives right rather than by im-
proving the quality of the political class. While incentives are important, personal
qualities of politicians such as honesty, integrity and competence are potentially im-
portant, especially in environments where politicians face limited formal sanctions.
Equally, in environments where ethnicity is central to the economic organization of
the society, a politician’s group identity is likely to matter.
This paper uses household data from Indian villages to examine how individuals’
economic and group characteristics affect political selection, and politician behavior
in office. Further, we study how village characteristics which alter the political
dominance of different population groups, and the extent of information flows in a
village, affects these relationships.
Our analysis makes use of a remarkable political experiment in India. The 73rd
amendment of the Indian constitution in 1993 created a new tier of local govern-
ment which, by the year 2000, had led to the constitution of 227,698 new village
governments, Gram Panchayats (GP), staffed by over two million elected represen-
tatives. In an effort to infuse fresh blood into the political class, the amendment
2

mandated that close to half of these elected positions be reserved for traditionally
disadvantaged population groups (lower caste groups and women). These village
governments enjoy wide-ranging responsibility for beneficiary selection for govern-
ment welfare programs (Matthew and Buch 2000).
One of the most important GP responsibilities, and one we use to identify politi-
cian quality, is the targeting of ‘Below Poverty Line’ cards (BPL). Ownership of
a BPL card provides a household with access to subsidized food via the Indian
public distribution system. It is also typically an eligibility requirement for other
government welfare schemes, e.g. housing schemes. The Indian Planning Com-
mission estimates that there were 45 million BPL households in 2000-01, and that
the effective annual income gain of owning a BPL card was Rs. 415 per household.
Further, it estimates that the public distribution system only reaches fifty seven per-
cent of BPL households and over twenty percent of BPL card holders are not poor,
suggesting substantial mis-targeting by, among others, village politicians (Planning
Commission, 2005).1
We develop a simple model of political selection to understand how the political
selection process in a village can affect the allocation of BPL cards. Politicians differ
along two dimensions – the group interest they represent and their quality as policy
makers. Higher quality politicians better target BPL cards. Voters favor higher
quality politicians, but also have group preferences. Bad politicians are relatively
more likely to enter when formal returns to politics are low and/or returns to polit-
ical opportunism are high. They are more likely to be selected if information about
politician quality is limited, and voters vote along group lines. At the village level,
political reservation of the village chief’s position changes the identity of the polit-1The estimated income gain is based on an All India household survey, and worked out as follows:
the differential between the average market and PDS price of the grains was multiplied with the
average quantity given to a cardholder (done separately for rice and wheat and then added up).
Their findings on targeting were based on a comparison of the number of households with BPL
cards with independent estimates of the number of poor.
3
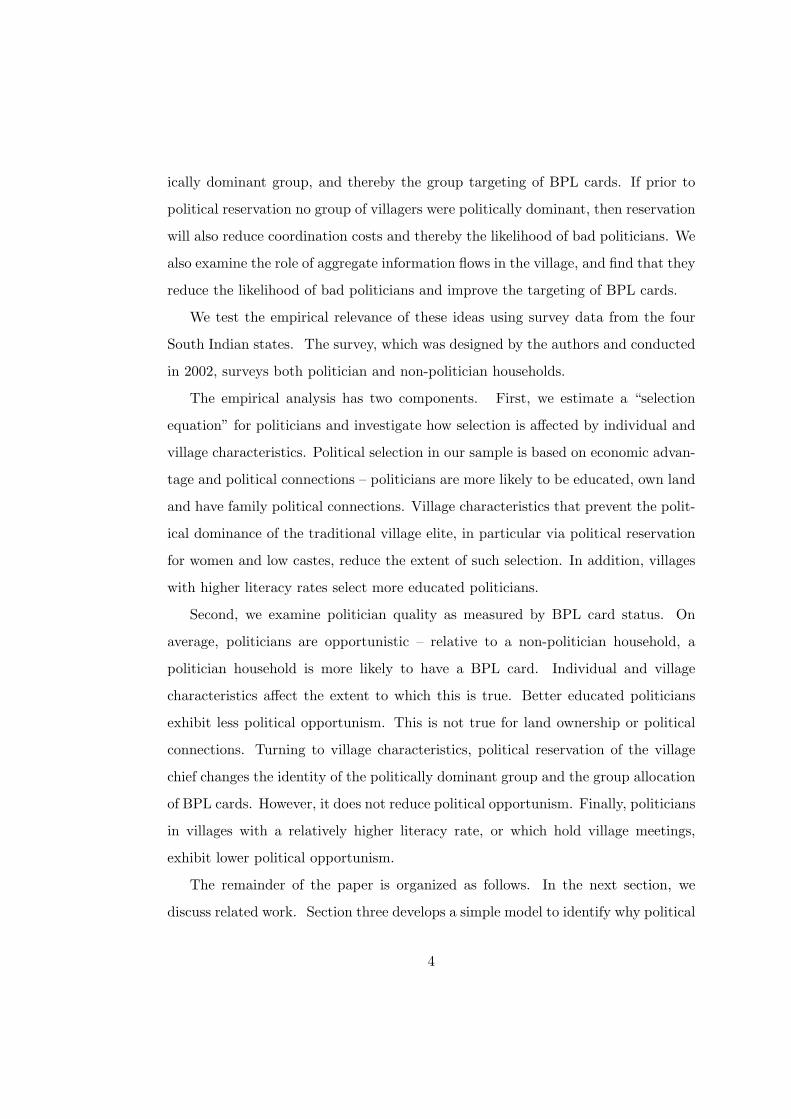
ically dominant group, and thereby the group targeting of BPL cards. If prior to
political reservation no group of villagers were politically dominant, then reservation
will also reduce coordination costs and thereby the likelihood of bad politicians. We
also examine the role of aggregate information flows in the village, and find that they
reduce the likelihood of bad politicians and improve the targeting of BPL cards.
We test the empirical relevance of these ideas using survey data from the four
South Indian states. The survey, which was designed by the authors and conducted
in 2002, surveys both politician and non-politician households.
The empirical analysis has two components. First, we estimate a “selection
equation” for politicians and investigate how selection is affected by individual and
village characteristics. Political selection in our sample is based on economic advan-
tage and political connections – politicians are more likely to be educated, own land
and have family political connections. Village characteristics that prevent the polit-
ical dominance of the traditional village elite, in particular via political reservation
for women and low castes, reduce the extent of such selection. In addition, villages
with higher literacy rates select more educated politicians.
Second, we examine politician quality as measured by BPL card status. On
average, politicians are opportunistic – relative to a non-politician household, a
politician household is more likely to have a BPL card. Individual and village
characteristics affect the extent to which this is true. Better educated politicians
exhibit less political opportunism. This is not true for land ownership or political
connections. Turning to village characteristics, political reservation of the village
chief changes the identity of the politically dominant group and the group allocation
of BPL cards. However, it does not reduce political opportunism. Finally, politicians
in villages with a relatively higher literacy rate, or which hold village meetings,
exhibit lower political opportunism.
The remainder of the paper is organized as follows. In the next section, we
discuss related work. Section three develops a simple model to identify why political
4

selection may fail to produce good politicians. Section four introduces the data and
develops the empirical tests. Results are in section five, and section six concludes.
2 Related Literature
The Downsian model of politics, which has dominated political economy for over a
generation, has no role for political selection. The role of politics is to seek out
the policy position of the median voter, and not to examine who implements that
policy. Until recently, political selection was also absent from political agency models
– the classic analyses being due to Barro (1973) and Ferejohn (1986). They focus
exclusively on the problem of moral hazard in politics and the role of elections in
restraining politicians.2 The problem of incentives embodied in constitution design
is also the main theme in the Public Choice literature pioneered by Buchanan.3
More recent work has emphasized the importance of politician characteristics in
explaining political behavior. This puts greater weight on the political selection
mechanism. The citizen-candidate approach of Besley and Coate (1997) and Os-
borne and Slivinski (1996) characterizes political competition as a three-stage game
of entry, voting and policy making. The model explains endogenously who enters,
and who succeeds, in politics. This approach can be used either to study selection2Recent political agency models study the implications of good and bad politicians for policy
outcomes where these types are unobserved. For example, Coate and Morris (1995) draw out
implications for the quality of public decisions and Maskin and Tirole (2004) contrast appointing
versus electing judges in this framework. Besley (2004) uses this framework to study equilibrium
quality of the pool of politicians as a function of the rewards to politicians.3The following quote from Buchanan captures this idea clearly:
“To improve politics, it is necessary to improve or reform rules, the framework
within which the game of politics is played. There is no suggestion that improvement
lies in the selection of morally superior agents who will use their powers in some ‘public
interest’ ” (Buchanan (1989, page 18)).
5
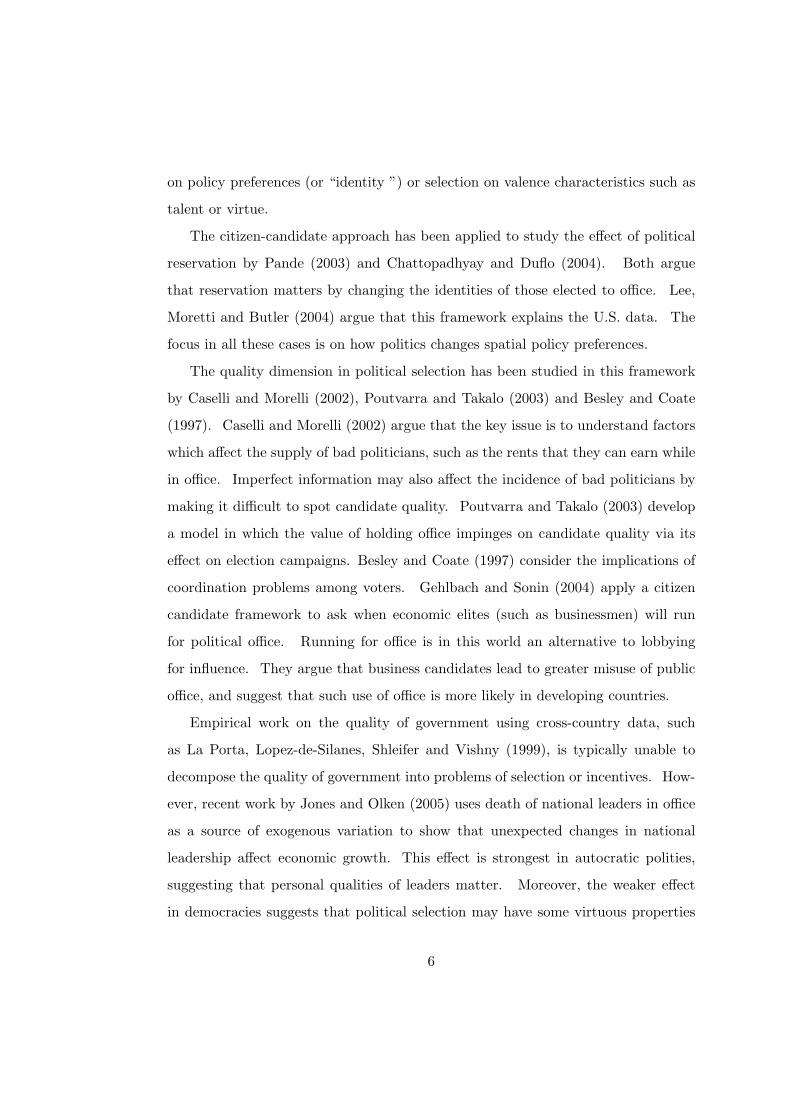
on policy preferences (or “identity ”) or selection on valence characteristics such as
talent or virtue.
The citizen-candidate approach has been applied to study the effect of political
reservation by Pande (2003) and Chattopadhyay and Duflo (2004). Both argue
that reservation matters by changing the identities of those elected to office. Lee,
Moretti and Butler (2004) argue that this framework explains the U.S. data. The
focus in all these cases is on how politics changes spatial policy preferences.
The quality dimension in political selection has been studied in this framework
by Caselli and Morelli (2002), Poutvarra and Takalo (2003) and Besley and Coate
(1997). Caselli and Morelli (2002) argue that the key issue is to understand factors
which affect the supply of bad politicians, such as the rents that they can earn while
in office. Imperfect information may also affect the incidence of bad politicians by
making it difficult to spot candidate quality. Poutvarra and Takalo (2003) develop
a model in which the value of holding office impinges on candidate quality via its
effect on election campaigns. Besley and Coate (1997) consider the implications of
coordination problems among voters. Gehlbach and Sonin (2004) apply a citizen
candidate framework to ask when economic elites (such as businessmen) will run
for political office. Running for office is in this world an alternative to lobbying
for influence. They argue that business candidates lead to greater misuse of public
office, and suggest that such use of office is more likely in developing countries.
Empirical work on the quality of government using cross-country data, such
as La Porta, Lopez-de-Silanes, Shleifer and Vishny (1999), is typically unable to
decompose the quality of government into problems of selection or incentives. How-
ever, recent work by Jones and Olken (2005) uses death of national leaders in office
as a source of exogenous variation to show that unexpected changes in national
leadership affect economic growth. This effect is strongest in autocratic polities,
suggesting that personal qualities of leaders matter. Moreover, the weaker effect
in democracies suggests that political selection may have some virtuous properties
6
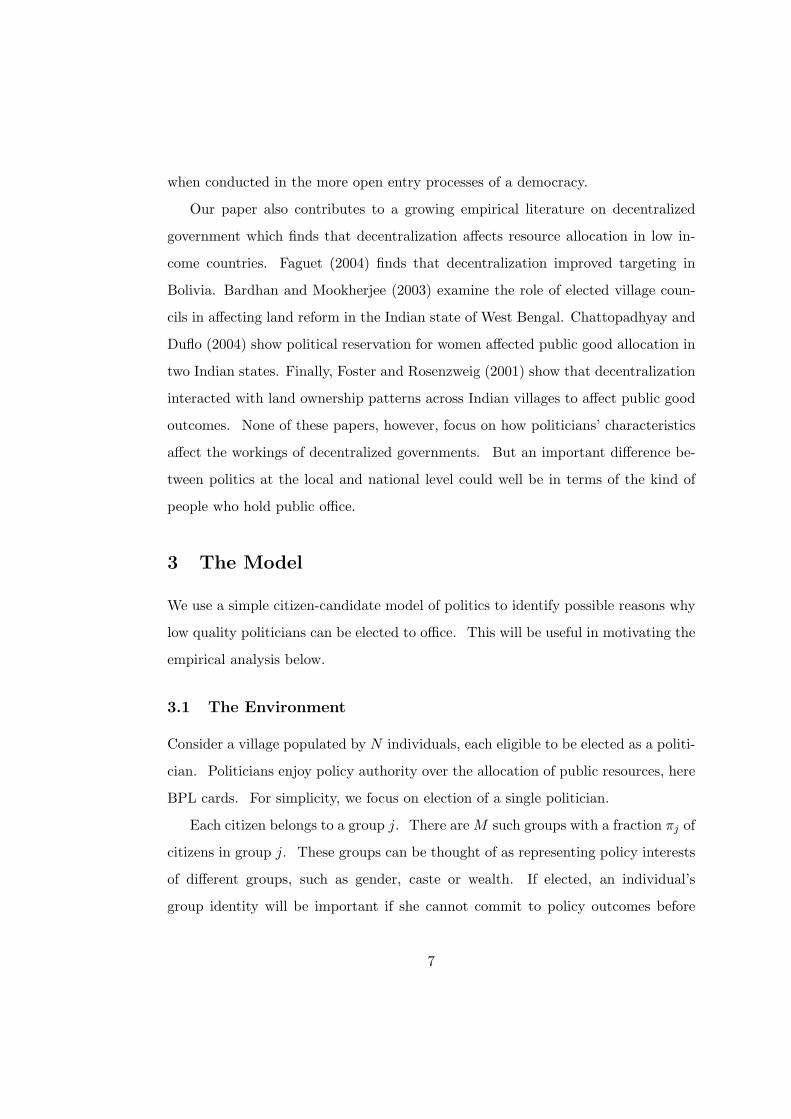
when conducted in the more open entry processes of a democracy.
Our paper also contributes to a growing empirical literature on decentralized
government which finds that decentralization affects resource allocation in low in-
come countries. Faguet (2004) finds that decentralization improved targeting in
Bolivia. Bardhan and Mookherjee (2003) examine the role of elected village coun-
cils in affecting land reform in the Indian state of West Bengal. Chattopadhyay and
Duflo (2004) show political reservation for women affected public good allocation in
two Indian states. Finally, Foster and Rosenzweig (2001) show that decentralization
interacted with land ownership patterns across Indian villages to affect public good
outcomes. None of these papers, however, focus on how politicians’ characteristics
affect the workings of decentralized governments. But an important difference be-
tween politics at the local and national level could well be in terms of the kind of
people who hold public office.
3 The Model
We use a simple citizen-candidate model of politics to identify possible reasons why
low quality politicians can be elected to office. This will be useful in motivating the
empirical analysis below.
3.1 The Environment
Consider a village populated by N individuals, each eligible to be elected as a politi-
cian. Politicians enjoy policy authority over the allocation of public resources, here
BPL cards. For simplicity, we focus on election of a single politician.
Each citizen belongs to a group j. There are M such groups with a fraction πj of
citizens in group j. These groups can be thought of as representing policy interests
of different groups, such as gender, caste or wealth. If elected, an individual’s
group identity will be important if she cannot commit to policy outcomes before
7

the election. Conflict of interest in policy priorities between groups creates spatial
political competition to holding office. Each group member prefers a politician from
her own group.
In addition to her group identity, a politician (once elected) can be good or bad.
Relative to a bad politician, a good politician better targets BPL cards towards
the deserving. We do not need to be specific about the exact interpretation of what
makes for a good politician – honesty or competence. We assume politician quality
is a valence issue, i.e. one on which all citizens (regardless of their group identity)
have the same ranking. We denote this characteristic by τ ∈ {g, b} where g stands
for ‘good’ and b for ‘bad’.
We do not model the policy process explicitly. Hence, preferences are in reduced
form – preferences over politicians rather than policy. Let k denote a politician’s
group identity. A type {k, τ} politician gives citizen i from group j a payoff of:
λj (k)− C (τ, I, k)
Thus, preferences are separable with λj (k) a group identity component and C (τ, I, k)
a quality component. Bad politicians are costly as C (g, I, k) = 0 < C (b, I, k)∀k.
The variable I indexes the extent to which village characteristics prevent dishon-
est politicians from imposing a cost on the other citizens. “Good” characteristics
reduce C (b, I, k). We will return to this below.
Politicians are citizens, with similar preferences. The difference is that politi-
cians may enjoy a private “benefit” from holding office. Thus a type (j, τ) politician
receives utility
λj (j) + B (τ, I)
from holding office. The term B (τ, I), which is also affected by characteristics I,
is a group-independent benefit from holding public office. It would, for example,
depend on politician wages and the returns to opportunism when in office. We
concentrate on the case where B (b, I) ≥ B (g, I) , which implies that bad politicians
8

have a higher demand for public office than good ones.4
3.2 The Political Process
We model the electoral process as a two-stage citizen-candidate game. At stage one
candidates decide whether to enter, and at stage two voters cast their votes. We
consider non-cooperative entry and voting decisions, and analyze the two stages of
the political process in reverse order.
Voting The group characteristic k is observed by voters before they cast their vote.
However, we allow for imperfect information with respect to candidate quality – τ .
For simplicity, assume that τ is revealed to all voters during the election campaign
with probability q (∈ (0, 1)) (Hence, voters are always symmetrically informed).
Voting decisions form a Nash equilibrium from among the candidates who enter.
Following Besley and Coate (1997), we refine the voting equilibrium by eliminating
weakly dominated strategies. This implies that voting is sincere in two-candidate
elections, but puts relatively little structure on multi-candidate voting. We assume
that indifferent voters abstain and that in the event of a tie, the winning candidate
is picked at random from among those who have the most votes.
Entry Each citizen faces a group-specific cost of running for office δj . Let vj (0)
be the utility of a citizen of type j when nobody runs for public office. We assume
everyone prefers to avoid a situation in which nobody runs for office, i.e. vj (0) <
λj (k)∀ (j, k) = 1, ...,M.. Each citizen’s pure strategy, denoted by σi ∈ {0, 1},is whether to enter as a candidate. A collection of such decisions (one for each
citizen) must form a Nash equilibrium in pure or mixed strategies.4This inequality may be reversed in societies that have a strong ethic of public service so that
good politicians earn relatively higher rents such that B (g, I) is large.
9
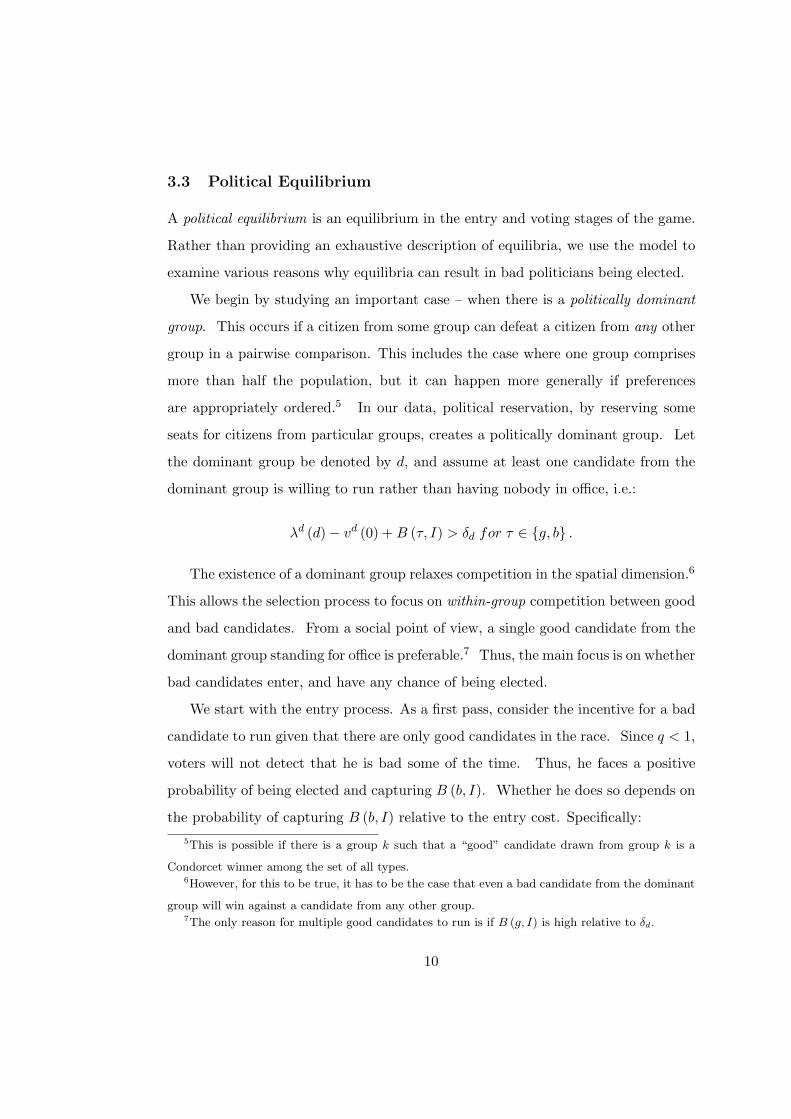
3.3 Political Equilibrium
A political equilibrium is an equilibrium in the entry and voting stages of the game.
Rather than providing an exhaustive description of equilibria, we use the model to
examine various reasons why equilibria can result in bad politicians being elected.
We begin by studying an important case – when there is a politically dominant
group. This occurs if a citizen from some group can defeat a citizen from any other
group in a pairwise comparison. This includes the case where one group comprises
more than half the population, but it can happen more generally if preferences
are appropriately ordered.5 In our data, political reservation, by reserving some
seats for citizens from particular groups, creates a politically dominant group. Let
the dominant group be denoted by d, and assume at least one candidate from the
dominant group is willing to run rather than having nobody in office, i.e.:
λd (d)− vd (0) + B (τ, I) > δd for τ ∈ {g, b} .
The existence of a dominant group relaxes competition in the spatial dimension.6
This allows the selection process to focus on within-group competition between good
and bad candidates. From a social point of view, a single good candidate from the
dominant group standing for office is preferable.7 Thus, the main focus is on whether
bad candidates enter, and have any chance of being elected.
We start with the entry process. As a first pass, consider the incentive for a bad
candidate to run given that there are only good candidates in the race. Since q < 1,
voters will not detect that he is bad some of the time. Thus, he faces a positive
probability of being elected and capturing B (b, I). Whether he does so depends on
the probability of capturing B (b, I) relative to the entry cost. Specifically:5This is possible if there is a group k such that a “good” candidate drawn from group k is a
Condorcet winner among the set of all types.6However, for this to be true, it has to be the case that even a bad candidate from the dominant
group will win against a candidate from any other group.7The only reason for multiple good candidates to run is if B (g, I) is high relative to δd.
10

Proposition 1 With a politically dominant group d, if B (b, I) is high enough, there
is no pure strategy equilibrium in which only good candidates of type d enter.
The intuition is straightforward – if bad candidates earn sufficiently high rents,
then at the point that no more good candidates wish to enter, it is worthwhile for
a bad candidate to enter if there is some chance that she will be elected. Thus, to
sustain equilibria with only good candidates the rents must be sufficiently low for
bad candidates. This is true if institutions restrain consumption or rents by bad
candidates sufficiently. Further, the threshold ratio of rents for bad and good candi-
dates is increasing in the information about candidates. Thus, better information
makes it more likely that only good candidates enter.
We next ask whether an equilibrium with only bad candidates is possible. Sup-
pose that a single bad candidate is running for office. Then, if a good candidate
enters, he will win as long as he is identified as good, i.e. with probability q. Thus
for only bad candidates to run, it must be that no good candidate wishes to enter.
Here, the source of political dominance matters. For reserved jurisdictions we need
only check that a good candidate from the reserved group would not enter. How-
ever, without reservation, we also need to consider entry by candidates who are not
from the politically dominant group. We consider each case in turn.
Proposition 2 Suppose the political position is reserved for group d. Then a pure
strategy Nash equilibrium with only bad candidates of type d exists if entry costs are
sufficiently large so that:
δd >
(1 + q
2
)[B (g, I) + C (b, I, d)] .
The required condition reflects the two motives for a good candidate to hold
office – the personal benefit to running [B (g, I)] and the gain from not having a
bad candidate in office [C (b, I, d)]. If, relative to entry costs, these are sufficiently
11

weak (reflecting the fact that winning is only probabilistic), then good candidates
will not enter.8
This kind of equilibrium is most likely when information is poor (q close to zero)
and when B (g, I) + C (b, I, d) is low relative to entry costs. Thus, high wages and
good information (q close to one) improve the quality of politicians by destroying
the equilibrium in which only bad candidates stand.
Extending this to politically dominant groups in general requires an additional
condition:
Proposition 3 Suppose that there is a politically dominant group d and
λk (k)− λk (d) > C (b, I, k)∀k 6= d.
Then a pure strategy Nash equilibrium exists with only bad candidates of type d if:
δd >
(1 + q
2
)[B (g, I) + C (b, I, d)]
The extra condition says that citizens prefer to vote on the basis of their group
identity rather than candidate quality.9 If group attachment is weak, then it is
not possible to construct an equilibrium where all candidates are bad, as voters will
switch to good candidates even if they are not from their group.
Propositions 2 and 3 both rest on entry costs in politics being non-negligible
relative to private benefits. More generally, they suggest two important issues in
affecting candidate quality: (i) the relative returns to holding office among good
and bad candidates and (ii) the probability of detecting bad candidates in electoral
competition. These are the main forces at work with a politically dominant group.8The proposition illustrates a somewhat extreme case – more generally there can be pure or
mixed strategy equilibrium comprising good and bad candidates.9It is feasible to work with weaker, but less straightforward to state, conditions. We require
that when contrasting a type k (6= d) candidate with a type d candidate the set of types for which
candidate quality is salient is a population minority.
12

If political reservation simply changes the type of political dominance, then the
reservation status of a village need not affect the probability of selecting a bad
politician. However, if politicians have group preferences that affect the policies
they implement, then the group allocation of resources should change.
In the absence of political dominance, it is hard to say much concretely about
the likelihood of bad politicians. However, one further important effect may arise
in such cases. This is the possibility of a coordination failure among voters as
illustrated by Besley and Coate (1997). They construct an equilibrium in which a
two candidate equilibrium between sufficiently polarized candidates can be sustained
by voters’ beliefs that insufficiently many other voters will support a high quality
candidate if he or she enters.10 This kind of example gives a further reason to
believe that polarization can result in low quality candidates holding office, as voter
coordination is not a issue when polarization is low.
We have assumed that bad politicians have no extra electoral power to influ-
ence elections. The likelihood of observing bad politicians would be strengthened if
bad candidates can directly influence voting outcomes and prevent citizens voting
for good candidates through bribery, intimidation or manipulation of information
flows. This can be incorporated in our model as implying lower (net) benefits for
good candidates from holding office. Although we do not have evidence of electoral
intimidation, we find that candidates’ economic and political power affect their like-
lihood of selection but not their performance. This is suggestive of extra electoral
power or barriers to entry for the politically and economically disadvantaged.
Our analysis ignores the role of parties. In reality, parties may also influence
outcomes. The coordination failure result of Besley and Coate (1997) cannot arise
if parties coordinate political entry among groups 1 and 2. However, in situations
where bad candidates can also corrupt parties, then we would not expect parties to
resolve the issues raised above.10This can be formalized in the framework described here in the case of two groups.
13
3.4 Empirical Implications
Our model of the political process identifies channels through which village char-
acteristics that alter political dominance, politician rents ex post, and information
flows in the village, should affect politician quality. Here, we briefly outline how we
will test the empirical relevance of these channels.
The main vehicle for testing the model is through the allocation of BPL cards,
one of the main ways of targeting transfers in our villages. While this is only one of
the many policies that are dealt with by village politicians, BPL card allocation is a
possible source of political rents. Moreover, having well-targeted transfer programs
is likely to be of interest to a wide group of citizens within a village.
If we suppose that good politicians make a bona fide effort to reach the poorest
groups, then the cost of a bad politician C (b, I, k) is (partly) that an eligible indi-
vidual from group k does not receive a BPL card. The private benefits of holding
public office B (b, I) could also be partly due to politicians targeting BPL cards to
themselves when they are not eligible for one.
Our model predicts that political institutions and village characteristics which
improve targeting and diminish the power of the politician (or make him more
accountable) affect the extent of BPL card mis-targeting. If institutions of restraint
through monitoring were perfect, then we would not expect the politician’s type to
affect the targeting rule.
In our empirical analysis we examine how individual, and village, characteristics
that alter political dominance and information flows affect who is selected as a
politician, and the selection of BPL card holders. If, as predicted by the model,
differences in politician performance are systematically linked to politician quality, as
measured by characteristics such as education, and group identity, then institutions
which alter the extent of selection on these characteristics should have a predictable
impact on policy outcomes. We look for such evidence.
14

4 Data and Empirical Analysis
We begin by describing the institutional context for our analysis. We then describe
the survey data and our empirical specification.
4.1 Institutional Context
The 73rd constitutional amendment of India, passed in 1993, created a three-tier
elected local government in every state. We focus on the lowest tier – a popularly
elected village council called the Gram Panchayat (GP). GPs are demarcated on a
state-specific population basis, and may consist of multiple villages. A GP is divided
into wards, with elections held at the ward-level. The GP council consists of elected
ward members, and is headed by an elected Pradhan.11
The 73rd constitutional amendment mandated political reservation of a certain
fraction of elected GP positions in favor of two groups – scheduled castes and tribes
(hereafter, SC/ST) and women. Only individuals belonging to the group benefitting
from reservation can stand for election in a reserved position. The constitutional
amendment required that SC/ST reservation in a state be proportional to the group’s
population share, while women’s reservation equal one-third of all positions. No
position can be reserved for the same group for two consecutive elections.
A GP has responsibilities of civic administration with limited independent tax-
ation powers. Here, we focus on the allocation of BPL cards by GP politicians.
Since 1997 the Indian government has used a targeted public food distribution sys-
tem which provides BPL card holders subsidized food while charging a near market11A state’s Panchayat Act mandates the population or geographic criteria for GP demarcation.
This is the (revenue) village in Andhra Pradesh and Kerala, and a revenue village with 500 or more
persons in Tamil Nadu. In Karnataka it is a group of villages with between 5,000 and 7,000 persons.
The population per ward varies between 300 and 800 for these states.There is also variation in mode
of Pradhan election. In Andhra Pradesh and Tamil Nadu the Pradhan is directly elected, while
Karnataka and Kerala she is nominated from the pool of elected ward members.
15

price for the others. In 2000-01 the annual income gain per household from having a
BPL card for our sample states was roughly 5% of an agricultural labor household’s
annual expenditure (using 1999 NSS figures).12 In addition to subsidized food, most
GP administered welfare schemes, e.g. employment and housing schemes, restrict
eligibility to BPL households.
The central government uses the Planning Commission’s poverty estimates (which
are based on the National Sample Survey) to determine the number of BPL house-
holds per state, and accordingly releases foodgrain. The state government allocates
district-wise “quota” of BPL cards. Similarly, within a district, a “quota” of BPL
households is determined at the GP level with the GP bearing much of the respon-
sibility for allocating these BPL cards.
States are required to conduct a household survey to identify eligible house-
holds. GP politicians bear substantial responsibility for conducting this survey.
They choose the village surveyors, and tabulate the results bearing in mind the
quota allocated to the GP. The result is a preliminary ‘BPL’ list of recipients. The
list is supposed to be finalized at a village meeting comprising all citizens registered
on the GP’s electoral roles (called a Gram Sabha). This Gram Sabha meeting also
arranges household names in the order of priority. The same procedure is supposed
to be used when choosing households from among BPL households for other welfare
schemes.
In reality GP officials enjoy substantial discretion in determining the final BPL
list. In our data, for example, only 76% of villages had held a Gram Sabha in the
past year and only 20% of households report ever having attended a Gram Sabha.
Moreover, beneficiary selection was reported as discussed in only 22% of Gram Sabha12Under the public food distribution system 20 kg of food grains per month is provided at 50%
economic cost to BPL households. The effective annual income gain was Rs. 1025 in Andhra
Pradesh, Rs. 520 in Karnataka, Rs. 1414 in Kerala and Rs. 809 in Tamil Nadu We describe how
this income gain was calculated in footnote 1. (Planning Commission, 2005)
16

meetings (See Besley, Pande and Rao (2005)). Further, of the 540 politicians we
surveyed, only 9% stated that the Gram Sabha decided final inclusions or exclusions
from the BPL list; in contrast, 87% believed that this power lay with a Panchayat
official.
4.2 Data
Our analysis uses household survey and village meeting data which we collected
between September and November 2002. Our sample covered 259 villages in the four
southern states of India – Andhra Pradesh, Karnataka, Kerala and Tamil Nadu.13
Our sample includes nine boundary districts in these states. Indian districts are
divided into blocks. In each district we sampled 3 blocks, and six randomly sampled
GPs within each block. In GPs with three or fewer villages, we sampled all villages;
otherwise, we sampled the Pradhan’s village and two randomly selected villages.14 In
each sample village we conducted twenty-one household surveys. Household selection
was random, and we alternated between male and female respondents. In every
village, we required that four of the sampled households be SC/ST households and
one be an elected Panchayat official, preferably the Pradhan.15 Our final household
sample size is 5180 non-politician and 265 politician households (100 politicians are
from reserved jurisdictions).
Table 1 provides descriptive statistics. The average respondent has slightly over
4 years of education. Politicians are significantly more educated. Average land
holdings are 2.4 acres; however, when we restrict the sample to politicians this figure
rises to 5.7 acres. Roughly sixty percent of our respondents are either SC/ST or
female, and therefore eligible for reservation. In terms of political experience, seven13At the time of our survey at least one year had lapsed since the last GP election in every state.14In Kerala to account for the higher GP population we sampled 3 GPs per block and 6 wards
per GP – the Pradhan’s ward and five randomly selected wards.15We always interviewed the Pradhan, and in non-Pradhan villages we interviewed a randomly
selected ward member.
17
percent of our respondents have/had a family member with a political position.
Finally, twenty-one percent of our households possess a BPL card.
Voter turnout in GP elections is high, with 85 percent of our respondents report-
ing having voted in the last GP election. Eight percent of our respondents stated
that candidate group identity (defined along religion, caste, gender or regional lines)
was the most important reason for their candidate choice in the GP election, while
over thirty percent stated that the candidate’s quality (in terms of reputation or
policy promises) determined their vote. However, less than forty percent of the re-
spondents believed that their Pradhan has either kept his/her election promises or
looked after their needs.
Our model suggests that increases in formal returns to politics, improvements
in information flows, and reductions in cost of entry should lower the incidence of
bad politicians. Political reservation would reduce the incidence of bad politicians
if it causes a previously undominated village to become politically dominated. Oth-
erwise, its main effect should be to change the group allocation of resources.
Our choice of village characteristics is aimed at testing these mechanisms. We
are unable to examine the formal returns to politics due to a lack of within-state
variation. We proxy for information flows in the village by the 1991 village literacy
rate, and whether the village had at least one Gram Sabha meeting in the last
year. Both variables were positively correlated with household survey measures of
individual information. By focussing on literacy rates from before the Panchayat
system was introduced, we can avoid the concern of Panchayat activism causing
educational change. However, we recognize that our information variables may be
correlated with other unobserved village characteristics, and later we discuss the
implications of this for our results.
For political reservation, we use data on the reservation status of our surveyed
politicians, and on whether the position of the Pradhan is reserved. The Pradhan
position is reserved for women and SC/STs in roughly 16% of our GPs each. Within
18
a block, reservation of the Pradhan position and of wards within a village, is deter-
mined by a rotational system and is exogenous to village characteristics.16 Finally,
we define a village as having a dominant caste if the fraction of households belonging
to the single largest non SC/ST caste exceeds the median caste dominance in our
village sample (this stands at 40%). Unlike political reservation, having a dominant
caste need not imply political dominance. However, a large anthropological liter-
ature suggests that barriers to entry for minority groups are often higher in such
villages, and it is also more likely that the largest caste group is politically dominant
(see, for instance, Wade 1988). Low migration rates across Indian villages imply that
village caste structure is relatively stable.
4.3 Empirical Specification
In our household data we observe who is ultimately elected, but not who stands.
Suppose that being elected depends upon some underlying candidate quality, eij ,
for politician i in village j. Further, suppose that candidate quality depends on a
vector of candidate characteristics xij so that:
eij = βxij + ψij (1)
where ψij is a component of candidate electability that may be observable to voters,
but not to us. The parameters β can be thought of as true “production function”
parameters for candidate quality.
We suppose that there is some unobserved threshold e∗j in village j for i to be
elected to office. This subsumes the quality of challengers for public office, and the
distribution of different voting groups in village j. Then, we observe candidate i in
village j if:
eij > e∗j16No political position can be reserved for the same group for two consecutive elections. In
Besley, Pande, Rao and Rahman (2004) we show that public good provision in 1991 was statistically
indistinguishable in GPs with and without a reserved Pradhan.
19

or
βxij + ψij + ηij > e∗j
where ηij is a shock which affects how the candidate is perceived by voters in village
j. Treating e∗j as an unobserved village effect, and assuming a linear probability
model, this yields:
pij = αj + ρxij + εij . (2)
where pij is a dummy variable for whether the respondent is a politician and αj is
a village fixed effect. The parameters ρ do not only reflect the production function
if the variance of the shock ηij depends on xij . The fact that the variance of
εij depends on village characteristics, Ij , may also justify interacting ρ with such
characteristics in equation (2).
Estimating (2) allows us to examine political selection on observables, and how
this varies with village characteristics. We consider village literacy rate in 1991,
whether the Pradhan’s position is reserved and whether the village has a dominant
caste (the last may reflect barriers to entry rather than dominance per se).
To test whether politician quality and group identity matters for policy making,
we examine household access to BPL cards. Let bij be the probability that household
i in village j has a BPL card. We model this empirically as:
bij = αj + λpij + τpijeij + γxij + ηij (3)
where, as above, eij is politician “quality”. If politicians are opportunistic we expect
λ > 0, but if quality matters, then we expect τ < 0.
The above selection model tells that we expect
eij = θxij + φIj + νij (4)
where θ is the “reduced form” effect of candidate characteristics on quality working
both through the production function (1) and the probability that a candidate with
20
characteristics xij is selected. Substituting (??) into (3), we get the reduced form
model:
bij = αj + λpij + χ1 (xij ∗ pij) + χ2 (pij ∗ Ij) + γxij + µij . (5)
The coefficients χ1 = τθ and χ2 = τφ. Hence, observing that characteristic xij
enters negatively is indicative of τ < 0 and θ > 0, i.e. this is associated with being a
good politician. The latter can also be related to (2) since we would expect that a
good politician characteristic xij would have ρ > 0, if that characteristic is valued by
voters. Similarly, Ij entering negatively is associated with being a good institution.
5 Results
The results are presented in three parts. We first examine the determinants of
politician selection, and then those of beneficiary selection. Finally, we examine
how voters perceive politicians in our sample.
5.1 Selection of Politicians
We start by asking whether individual characteristics affect the likelihood that a
respondent is an elected politician. The results from estimating (2) are in Table 2.
In column (1) the dependent variable is whether the respondent is an elected GP
politician (i.e. a Pradhan or ward member). Eligibility for reservation is uncorre-
lated with being a politician. However, years of education and land ownership are
positively correlated with being a politician. An additional year of education, and
owning an additional acre of land, increase the likelihood of being a politician by
roughly 0.7% each. A respondent belonging to a family with a history of political
participation is 12% more likely to be a politician.17
17We have estimated these regressions including party affiliation variables. A respondent affiliated
with the party in power in the state is roughly 7 percent more likely to be a politician.
21

In columns (2) and (3) we restrict the sample to the groups eligible for political
reservation, women and SC/ST respectively. For both groups we observe a positive
selection on education, but not land ownership. Family political history and selection
are positively correlated only for women. For SC/ST households the absence of
selection on land and political history reflects their relative landlessness, and recent
entry into politics on the back of reservation.18 In columns (4)-(6) we restrict the
sample to Pradhan villages, and the dependent variable to whether the respondent is
the Pradhan. We observe very similar patterns of selection. Overall, the data points
to the political selection process favoring economically advantaged and politically
connected individuals.
Table 3 explores political selection in village j as a function of village character-
istics Ij . We estimate:
pij = αj + βxij + γ (xij ∗ Ij) + εij . (6)
where xij are the individual characteristics considered in Table 2. For expositional
ease we focus on the sample of all politicians.
In column (1) we observe the presence of a dominant caste increases elitism
among politicians – caste dominance is correlated with elected politicians owning
relatively more land and increased selection on family political history. Columns
(2) and (3) examine how Pradhan reservation affects selection. We distinguish be-
tween reservation open to all women, and reservation for SC/STs. Unsurprisingly,
eligibility for reservation is a near perfect predictor of selection on gender and caste.
Relative to other politicians, reserved politicians are less educated, own less land
and are less likely to have a family political history of participation. This reflects
the historical legacy of the economic, social and political disadvantage faced by these
groups. Column (4) considers the literacy rate as a proxy for information flows in18In our sample mean landholding for SC/ST households is 1.14 acres and for non SC/ST house-
holds 2.79 acres.
22
a village. Relatively more educated respondents are selected as politicians in vil-
lages with higher literacy rates. Further, respondents belonging to groups eligible
for reservation are more likely to enter politics in such villages.
Overall, the results suggest that village characteristics that reduce the domi-
nance of major castes increase the presence of economically disadvantaged groups
in politics, while those that improve information flows (as proxied for by literacy)
enhance the selection of more educated politicians.
5.2 Selection of Beneficiaries
We now examine how political selection affects the targeting of BPL cards. In Table
4, we report results from estimating regressions of the form (5) where pij = 1 if the
household has a BPL card.
In column (1) we observe that, as intended by the program, BPL cards are
targeted towards economically disadvantaged households. An SC/ST household is
16% more likely to get a BPL card while a household with a more educated head
and/or more land holdings is less likely to have a BPL card. A household’s political
history does not affect its propensity to have a BPL card. However, a politician
household is 7% more likely to have a BPL card (column (2)). This is all the
more striking in view of the results in Table 2 which demonstrated that politician
households are more likely to be landed and educated.
In column (3) we examine whether reserved politicians behave differently, and
find mixed evidence. The point estimate suggests no significant differences between
reserved and unreserved politicians. However, we cannot reject the hypothesis that
reserved politicians exhibit no political opportunism.19 Column (4) examines the19As our regressions include village fixed effects we identify the effect of reservation off villages
where reserved and unreserved politicians were interviewed. This is a relatively small sample,
hence the noisiness of our estimates. If we run separate regressions for the sample of reserved and
unreserved politicians, the BPL effect is limited to the unreserved politician sample.
23
role of politician characteristics. Politician opportunism is invariant to most politi-
cian characteristics, save education. Political opportunism is lower among more
educated politicians. An extra year of education for a politician makes him or her
1.4% less likely to have a BPL card.20
Table 5 examines the role of village characteristics in constraining political op-
portunism. These regressions include controls for household demographics. For
expositional ease we replace the controls for landownership and education, by a
disadvantage dummy which equals one if the household head is illiterate or the
household is landless. In column (1) we observe that politicians are more likely to
have a BPL card in a village with a dominant caste. Strikingly, this effect is limited
to unreserved politicians. Having a dominant caste, however, does not alter the
targeting of BPL cards among villagers.
Columns (2) and (3) in Table 5 consider Pradhan reservation (these regressions
include GP fixed effects as reservation varies by GP). The likelihood that a politi-
cian has a BPL card is higher with a female Pradhan. This could reflect personal
aggrandizement on part of the Pradhan or a more limited ability to monitor other
politicians. Once again the targeting of BPL allocation among villagers is unaf-
fected. In contrast, column (3) shows that SC/ST reservation makes it more likely
that SC/ST households and reserved politicians have a BPL card. This points to
SC/ST Pradhans having preferences that favor members of their own group.
Columns (4) and (5) of Table 5 consider the impact on targeting of village literacy
and whether the village had a Gram Sabha meeting in the last year. Gram Sabha
meetings are intended as a forum at which villagers can discuss their problems with
the GP officials, and also monitor GP activities. Higher village literacy and holding
a Gram Sabha meeting significantly reduces the likelihood that a politician has a20We have also examined party affiliation. Sharing the affiliation of the main party in the state
does not matters. In contrast, a non-politician household with the same party affiliation as the
Pradhan is 8% more likely to get a BPL card. This effect is absent among politicians.
24

BPL card and improves targeting.21
Taken together these results illustrate the importance of selection and incentives
in affecting public resource allocation. Selection is manifested in more educated
politicians being less opportunistic. Incentives are shaped by village meetings in
which villagers ratify beneficiary lists chosen by politicians.
One key idea of the theory is that bad politicians impose a cost on other citizens.
Table 6 looks at one aspect of this by seeing whether politicians with BPL cards
target other groups differently. We do this by interacting the household character-
istics which in Table 4 made it more likely that a household gets a BPL card with
whether a politician has a BPL card and the politician’s years of education.
In column (1) we find that politicians with BPL cards, who tend to come from
unreserved seats (and hence, are not SC/ST) target fewer resources to SC/ST house-
holds. The flip side of this evidence is presented in column (2) of Table 6 which shows
that more educated politicians target more BPL cards towards SC/ST households.
This suggests that the main cost of having a bad politician is borne by the histor-
ically disadvantaged population group of SC/ST citizens. Given this, it is worth
noting that the main effect of political reservation for SC/ST seems to be to shift
resource allocation in their favor.
5.3 Robustness and Validation
This section looks at whether political opportunism is apparent for other public
transfer programs – government financed house improvements and participation in
public works programs. We also examine whether opportunistic politicians are per-
ceived as “bad” politicians. Finally, we examine whether citizens’ stated basis for
voting correlates with politician opportunism.21In Besley, Pande and Rao (2005) we show that villages with higher literacy are more likely
to hold Gram Sabha meetings. Importantly, economically disadvantaged households are relatively
more likely to attend these meetings.
25

Table 7 presents results on political opportunism for other public transfer pro-
grams. Columns (1) and (2) consider whether any household member worked on a
public works project during the last year. A politician household is four percentage
points more likely to have someone who does so. Once again, this effect is stronger
among unreserved politicians. Family political history is also a positive predictor
of participation in public works. Other politician characteristics do not, however,
explain such participation.
Columns (3) and (4) in Table 7 consider whether since the last election, the house-
hold had any home improvements under a government scheme. These include house
construction and repair, having a toilet constructed or drinking water or electricity
provided. Roughly seven percent of our households had such an improvement. Once
again, while economically disadvantaged households are targeted by this scheme,
politicians behave opportunistically. However, in this case, political opportunism is
limited to reserved politicians; see column (4). This is explained by the fact that
many home improvement schemes restrict eligibility to SC/ST households. It also
reflects the fact that unreserved politicians come from richer households which have
such home improvements (such as toilets) already. These two observations also
underlie the fact that politicians from politically connected families are less likely to
enjoy these home improvements.
We now examine how voters perceive the performance of opportunistic Pradhans.
If voters dislike opportunism, then politicians with BPL cards should be less popular.
This issue is explored in Table 8 where we use data on villagers’ perceptions of the
quality of their Pradhan. The survey asked whether households thought that their
Pradhan “looked after village needs” and whether they “kept their promises”.
Columns (1) and (3) demonstrate that Pradhans who have a BPL card are
perceived as worse on both indicators of Pradhan quality (the regressions include
block fixed effects since variation in Pradhan data is at GP-level). This is consistent
with our interpretation of politician participation in government transfer programs
26

as being a form of rent-seeking which is disapproved of by citizens. Columns (2)
and (4) show that educated Pradhans are better regarded by villagers in their GP –
again consistent with our earlier result on education. That said, female and SC/ST
Pradhans are regarded as worse even though we did not find any evidence of greater
opportunism among these groups of politicians. This may, therefore, be due to the
fact that these groups have specific policy agendas. It could also be a reflection of
respondents at large being biased against traditionally disadvantaged groups.22
The second issue is motivated by an observation from the theory – that voting
along group lines diminishes the extent to which politician quality is reflected in
voting decisions. Hence, bad politicians are more likely when villagers vote along
lines of group identity. To test this idea, we examine the relationship between
citizens’ self-reported basis for voting and whether the Pradhan holds a BPL card
and is educated. We restrict attention to Pradhan elections, as our survey asked
only about voting in GP Pradhan elections.
We construct two measures of citizens’ voting preferences. First, we use respon-
dents’ report of whether they voted for a candidate based on their caste, gender,
religious or regional identity to identify the fraction of citizens who voted on the
basis of group identity. Second, we use responses to a question asking whether
respondents used the candidate’s qualifications/previous work in the village as their
basis for voting. We conjecture that more group based voting measured this way
should lead to lower quality Pradhans, and voting based on candidate quality as
leading to higher quality Pradhans.
The results are in Table 9. We run our regressions at the GP level (that is,
we construct and use GP level averages), and include district fixed effects. Greater
group based voting is correlated with Pradhans who take BPL cards and have fewer
years of education. There is, however, little evidence that reported voting on22Duflo and Topolova (2004) also find that, despite no observable differences in performance,
women Pradhans are perceived as being of worse quality.
27

candidate quality makes a difference. While the evidence is only suggestive, it is
consistent with the interpretation of the results in the previous two sections.
6 Concluding Comments
This paper has three key findings. First, the political class is selected on the
basis of political connections and economic advantage. Second, in targeting public
resources politicians exhibit group preferences and are opportunistic (in that they
benefit disproportionately from public transfer programs). Third, individual and
village characteristics mediate the extent of opportunism.
Among individual characteristics, we find that the education level of politicians
has a consistently positive effect on selection and a negative effect on opportunism.
This suggests that the more educated make better politicians and are recognized
as such by voters. However, whether education matters directly or because it is
correlated with other characteristics that make an individual fit for public office
cannot be discerned from our results. Nonetheless, the results add to a growing
appreciation among economists that education may be important because of its
role in inculcating civic values (See, for example, Dee (2004) and Milligan et al
(2004)). The unique observation about its role in politics given here also offers a
fresh perspective on the value of human capital investments in low income countries.
For the most part, our findings for village characteristics are consistent with
the theory laid out in section 3 and suggest an important interplay between village
characteristics and the process of political selection and the targeting of public re-
sources. Increased literacy at the village level reduces political opportunism while
political reservation is correlated with targeting of resources. There is some sug-
gestion of most villages being politically dominated, so that political reservation
changes the type of political dominance rather than causing political dominance.
We also find evidence suggestive of barriers to entry – while land ownership and
28

political connections predict selection they do not predict behavior when in office.
The results also cast light on the process of decentralization as it is occurring
throughout the developing world. This has attached a lot of weight in the virtues
of local decision making processes in targeting beneficiaries. Our results show that
targeting is heterogeneous and depends on those who are selected to run this process.
It further emphasizes the need to have adequate models of the political economy of
targeting to shed light on the merits of decentralization.
Our finding that educated politicians are better both in terms of both actual and
perceived performance suggests, in line with the opening quote from V.O. Key, that
it is important to focus on factors that select better politicians as a step towards
improving the quality of government. Equally, as predicted by the father of the
Indian constitution, B.R. Ambedkar, group identity remains a significant predictor
of politician behavior in India. Overall, we see the results and analysis in the paper
reinforcing the observation that formal institutions of democracy are no guarantee
of effective government. It is essential that the preconditions exist for sorting in
the right kinds of people – the talented, the virtuous and those who give political
voice to the disadvantaged. This paper is a first effort to use household level data
to study this issue empirically. But clearly there is much more to be done to gain
a deeper understanding of political selection in democratic settings.
29

References
[1] Ambedkar, B.R, [1937], “The Annihilation of Caste with a Reply to Mahatma
Gandhi,”.
[2] Bardhan, Pranab and Dilip Mookherjee, [2003], “Political Economy of Land
Reforms in West Bengal 1978–98 ,” mimeo Boston University.
[3] Barro, Robert, [1973], “The Control of Politicians: An Economic Model,” Public
Choice, 14, 19-42.
[4] Besley, Timothy, [2004], “Paying Politicians: Theory and Evidence”, Joseph
Schumpeter Lecture 2004, Journal of the European Economics Association
[5] Besley, Timothy and Stephen Coate, [1997], “An Economic Model of Represen-
tative Democracy,” Quarterly Journal of Economics, 112(1), 85-114.
[6] Besley, Timothy, Rohini Pande and Vijayendra Rao, [2005], “Participatory
Democracy in Action: Survey Evidence from India,” Journal of the European
Economics Association, 3(2-3):648-657.
[7] Buchanan, James M., [1989], “The Public-Choice Perspective,” in Essays on
the Political Economy, Honolulu: University of Hawaii Press.
[8] Caselli, Francesco and Massimo Morelli, [2004], “Bad Politicians,” Journal of
Public Economics, 71(3), 829-53.
[9] Chattopadhyay, Raghabendra and Esther Duflo, [2004a], “Women as Policy
Makers: Evidence from a India-Wide Randomized Policy Experiment,” Econo-
metrica , 72(5), 1409-1443.
[10] Duflo, Esther and Petia Topolova[2004b], “Unappreciated Service: Perfor-
mance, Perceptions and Women Leaders in India,” mimeo MIT.
30
[11] Coate, Stephen and Stephen Morris, “On the form of transfers to special inter-
ests,” Journal of Political Economy, 103, 1210-35.
[12] Dee, Thomas S. [2004], “Are there civic returns to education?”, Journal of
Public Economics, Volume 88 (9-10) 1697-1720.
[13] Faguet, Jean Paul, [2004], “Does Decentralization Increase Responsiveness to
Local Needs? Evidence from Bolivia,” Journal of Public Economics, 88, 867-
894.
[14] Ferejohn, John, [1986], “Incumbent Performance and Electoral Control,” Public
Choice, 50, 5-25.
[15] Foster, Andrew and Mark Rosenzweig, [2001], “Democratization, Decentraliza-
tion and the Distribution of Local Public Goods in a Poor Rural Economy,”
mimeo, Brown.
[16] Gehlbach, Scott and Konstantin Sonin, [2004], Businessman Candidates: Spe-
cial Interest Politics in Weakly Institutionalized Environments, unpublished
typescript.
[17] Jefferson, Thomas, [1813], “The Natural Aristocracy.” Letter to John Adams.
October 28.
[18] Jones, Benjamin and Benjamin Olken, [2005], “Do Leaders Matter? National
Leadership and Growth since World War II”, Quarterly Journal of Economics,
August.
[19] Key, V.O., [1956], American State Politics: An Introduction, New York, NY:
Alfred A. Knopf.
[20] La Porta, Rafael, Florencio Lopez-de-Silanes, Andrei Shleifer and Robert W.
Vishny, [1999], “The Quality of Government,” Journal of Law, Economics and
Organization, 15(1), 222-79.
31

[21] Lee, David S., Enrico Moretti, and Matthew Butler, [2004], “Do Voters Af-
fect or Elect Policies? Evidence from the U.S. House,” Quarterly Journal of
Economics, 119(3), 807-860.
[22] Maskin, Eric and Jean Tirole, [2004], “The Politician and the Judge”, American
Economic Review,
[23] Matthew, George and Nirmala Buch, [2000] Status of Panchayati Raj in the
States and Union Territories of India, Institute for Social Studies, Delhi.
[24] Milligan, Kevin, Enrico Moretti and Philip Oreopoulos, [2004], “Does educa-
tion improve citizenship? Evidence from the United States and the United
Kingdom,” Journal of Public Economics, 88 (9-10), 1667-1695.
[25] Osborne, Martin J. and Al Slivinski, [1996], “A Model of Political Competition
with Citizen Candidates,” Quarterly Journal of Economics, 111(1), 65-96.
[26] Padro-i-Miquel, Gerard, [2005], “The Control of Politicians in Divided Societies:
The Politics of Fear,” Mimeo, MIT.
[27] Planning Commission, [2005], “Performance Evaluation of Targeted Public Dis-
tribution System,” Programme Evaluation Organisation, Planning Commis-
sion, Government of India, New Delhi.
[28] Poutvaara, Panu and Tuomas Takalo, [2003], “Candidate Quality,” unpublished
typescript.
[29] Pande, Rohini, [2003], “Can Mandated Political Representation Provide Dis-
advantaged Minorities Policy Influence? Theory and Evidence from India,”
American Economic Review ; 93(4), 1132-1151.
[30] Wade, Robert, [1988], “Village Republics: Economic Conditions for Collective
Action in Southern India,” ICS.
32
Appendix A: Theory
Proof of Proposition 1: Suppose not. Then the number of good candidates in the race
is:
mg = int
(δd
B (g, I)
)≥ 1.
This uses the fact that all good candidates win with equal probability in any voting equi-
librium. We require that no bad would wish to enter. This requires that:
1− q
mg + 1B (b, I) < δd.
But clearly this cannot hold for large enough B (b, I) – a contradiction. QED
Proof of Proposition 2: This is a special case of Proposition 3.
Proof of Proposition 3: We first show that a least one bad candidate of type d would
wish to enter. This follows from the fact that:
λd (d)− λd (0) + B (b, I) > δd.
We now show that there is a voting equilibrium in which no good candidate would wish to
enter. Suppose that there is a single bad candidate in the race. If a good candidate of d
chooses to enter and is identified as such, then he will win in any voting equilibrium which
eliminates weakly dominated strategies. If he is not identified as good, he will win with
probability one half. We now look at the incentives of such a candidate to enter. He will
wish to enter if :
λd (d) +[q +
1− q
2
]B (g, I)− 1− q
2C (b, I, d)− δd > λd (d)− C (b, I, d) .
which reduces to the condition in the Proposition. The condition holds a fortiori if there is
more than one bad candidate in the race.
Suppose that a candidate who is not of type d enters and is identified as good. Then
since:
λk (k)− λk (d) > C (b, I, k)∀k 6= d,
we can construct a voting equilibrium in which the bad candidate from group d wins in any
voting equilibrium which eliminates weakly dominated strategies. (This follows from the
definition of political dominance.) Thus, no good candidate will choose to enter. QED.
33
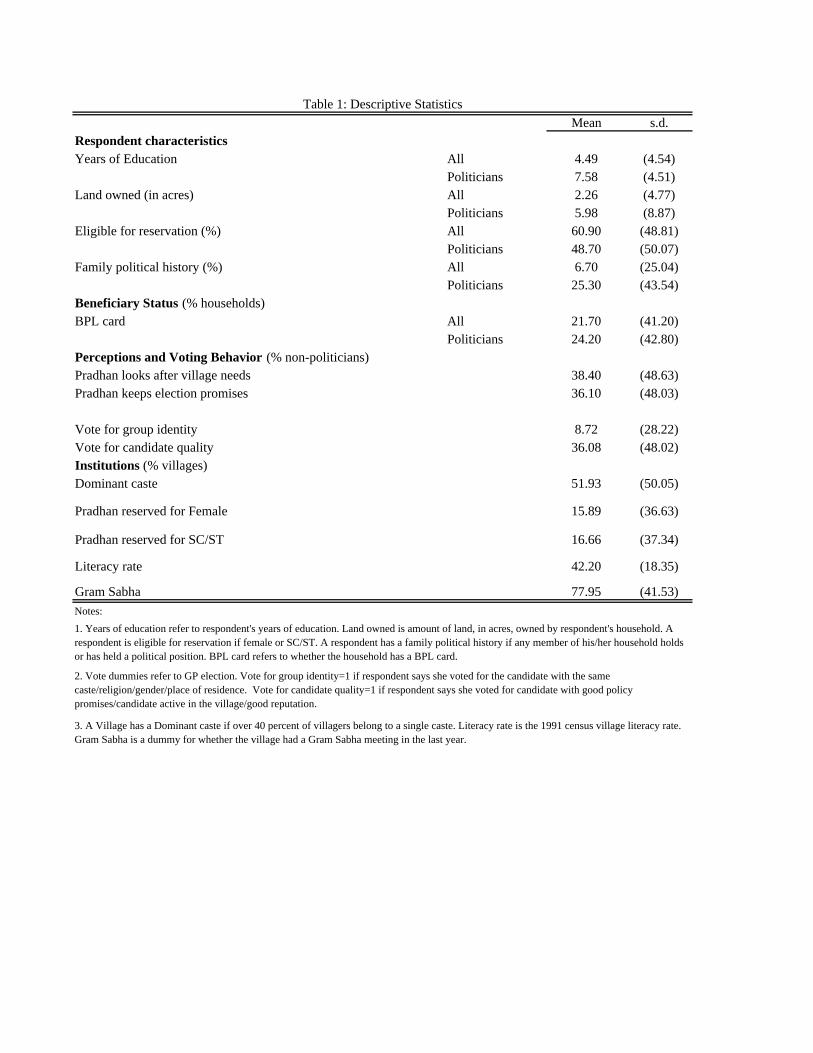
Table 1: Descriptive StatisticsMean s.d.
Respondent characteristicsYears of Education All 4.49 (4.54)
Politicians 7.58 (4.51)Land owned (in acres) All 2.26 (4.77)
Politicians 5.98 (8.87)Eligible for reservation (%) All 60.90 (48.81)
Politicians 48.70 (50.07)Family political history (%) All 6.70 (25.04)
Politicians 25.30 (43.54)Beneficiary Status (% households)BPL card All 21.70 (41.20)
Politicians 24.20 (42.80)Perceptions and Voting Behavior (% non-politicians) Pradhan looks after village needs 38.40 (48.63)Pradhan keeps election promises 36.10 (48.03)
Vote for group identity 8.72 (28.22)Vote for candidate quality 36.08 (48.02)Institutions (% villages)Dominant caste 51.93 (50.05)
Pradhan reserved for Female 15.89 (36.63)
Pradhan reserved for SC/ST 16.66 (37.34)
Literacy rate 42.20 (18.35)
Gram Sabha 77.95 (41.53)Notes:1. Years of education refer to respondent's years of education. Land owned is amount of land, in acres, owned by respondent's household. A respondent is eligible for reservation if female or SC/ST. A respondent has a family political history if any member of his/her household holds or has held a political position. BPL card refers to whether the household has a BPL card.
2. Vote dummies refer to GP election. Vote for group identity=1 if respondent says she voted for the candidate with the same caste/religion/gender/place of residence. Vote for candidate quality=1 if respondent says she voted for candidate with good policy promises/candidate active in the village/good reputation.
3. A Village has a Dominant caste if over 40 percent of villagers belong to a single caste. Literacy rate is the 1991 census village literacy rate. Gram Sabha is a dummy for whether the village had a Gram Sabha meeting in the last year.
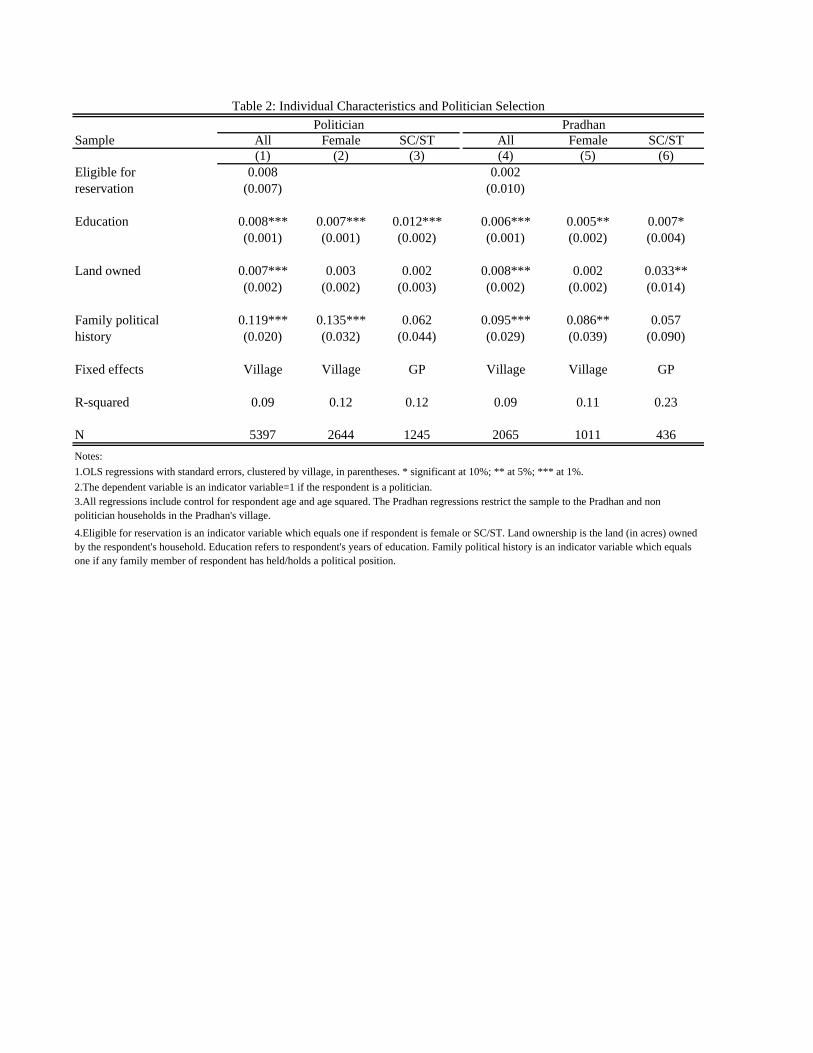
Table 2: Individual Characteristics and Politician SelectionPolitician Pradhan
Sample All Female SC/ST All Female SC/ST(1) (2) (3) (4) (5) (6)
Eligible for 0.008 0.002reservation (0.007) (0.010)
Education 0.008*** 0.007*** 0.012*** 0.006*** 0.005** 0.007*(0.001) (0.001) (0.002) (0.001) (0.002) (0.004)
Land owned 0.007*** 0.003 0.002 0.008*** 0.002 0.033**(0.002) (0.002) (0.003) (0.002) (0.002) (0.014)
Family political 0.119*** 0.135*** 0.062 0.095*** 0.086** 0.057history (0.020) (0.032) (0.044) (0.029) (0.039) (0.090)
Fixed effects Village Village GP Village Village GP
R-squared 0.09 0.12 0.12 0.09 0.11 0.23
N 5397 2644 1245 2065 1011 436Notes:1.OLS regressions with standard errors, clustered by village, in parentheses. * significant at 10%; ** at 5%; *** at 1%.2.The dependent variable is an indicator variable=1 if the respondent is a politician.3.All regressions include control for respondent age and age squared. The Pradhan regressions restrict the sample to the Pradhan and non politician households in the Pradhan's village.
4.Eligible for reservation is an indicator variable which equals one if respondent is female or SC/ST. Land ownership is the land (in acres) owned by the respondent's household. Education refers to respondent's years of education. Family political history is an indicator variable which equals one if any family member of respondent has held/holds a political position.

Table 3: Village Characteristics and Politician Selection
Institution Dominant CasteFemale Pradhan
ReservationSC/ST Pradhan
Reservation Literacy Rate(1) (2) (3) (4)
Eligible for reservation 0.013 -0.013** -0.009 -0.012(0.009) (0.006) (0.006) (0.016)
Eligible for reservation* -0.007 1.032*** 1.032*** 0.05Village Characteristic (0.012) (0.006) (0.007) (0.034)
Education 0.008*** 0.006*** 0.006*** 0.005**(0.001) (0.001) (0.001) (0.002)
Education* -0.001 -0.006*** -0.003*** 0.007*Village Characteristic (0.002) (0.001) (0.001) (0.004)
Land owned 0.005** 0.006*** 0.008*** 0.002(0.002) (0.002) (0.002) (0.004)
Land owned* 0.005* -0.006*** -0.007*** 0.016Village Characteristic (0.003) (0.001) (0.002) (0.011)
Family political history 0.112*** 0.083*** 0.111*** 0.067(0.030) (0.019) (0.020) (0.051)
Family political history* 0.013 -0.076*** -0.131*** 0.104Village Characteristic (0.040) (0.020) (0.022) (0.108)
Fixed effects Village Village Village VillageR-squared 0.09 0.25 0.26 0.09N 5397 5397 5397 5187Notes:1. OLS regressions with standard errors, clustered by village, in parentheses. * significant at 10%; ** at 5%; *** at 1%.2. The dependent variable is an indicator variable=1 if the respondent is a politician.3. Regressions include respondent age and age-squared as a control variable. Explanatory variables are defined in notes to Tables 1 and 2.
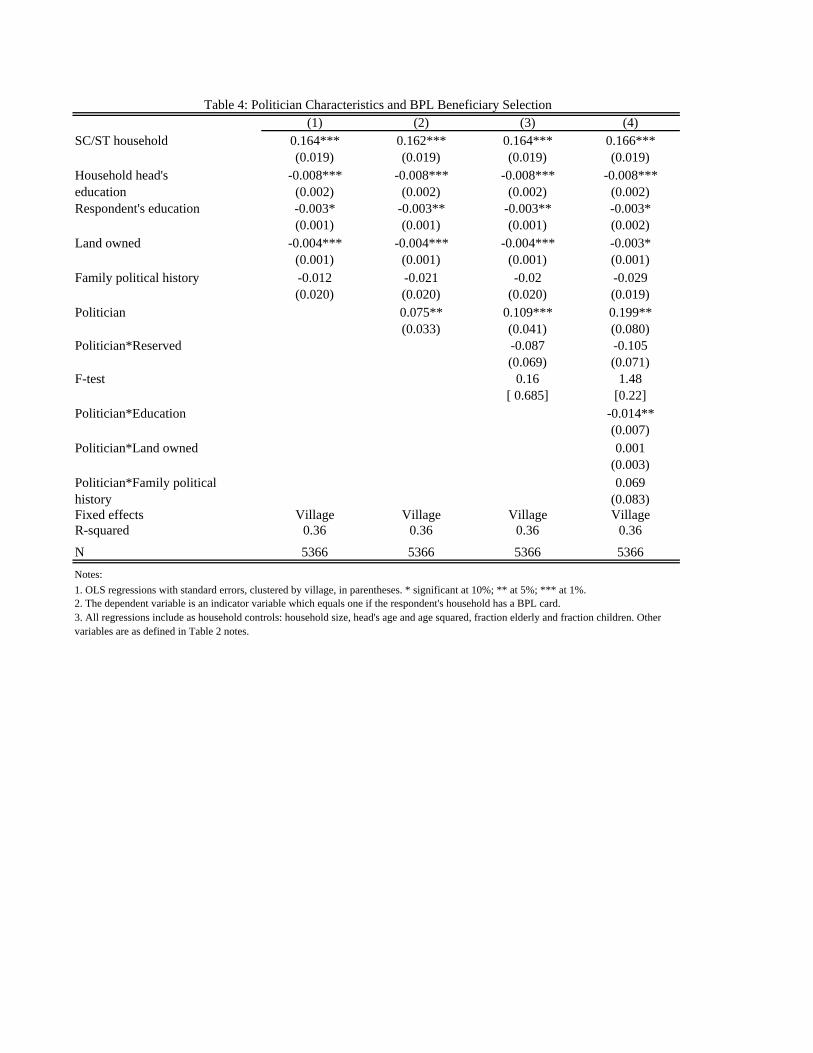
Table 4: Politician Characteristics and BPL Beneficiary Selection(1) (2) (3) (4)
SC/ST household 0.164*** 0.162*** 0.164*** 0.166***(0.019) (0.019) (0.019) (0.019)
Household head's -0.008*** -0.008*** -0.008*** -0.008***education (0.002) (0.002) (0.002) (0.002)Respondent's education -0.003* -0.003** -0.003** -0.003*
(0.001) (0.001) (0.001) (0.002)Land owned -0.004*** -0.004*** -0.004*** -0.003*
(0.001) (0.001) (0.001) (0.001)Family political history -0.012 -0.021 -0.02 -0.029
(0.020) (0.020) (0.020) (0.019)Politician 0.075** 0.109*** 0.199**
(0.033) (0.041) (0.080)Politician*Reserved -0.087 -0.105
(0.069) (0.071)F-test 0.16 1.48
[ 0.685] [0.22]Politician*Education -0.014**
(0.007)Politician*Land owned 0.001
(0.003)Politician*Family political 0.069history (0.083)Fixed effects Village Village Village VillageR-squared 0.36 0.36 0.36 0.36
N 5366 5366 5366 5366Notes:1. OLS regressions with standard errors, clustered by village, in parentheses. * significant at 10%; ** at 5%; *** at 1%.2. The dependent variable is an indicator variable which equals one if the respondent's household has a BPL card.3. All regressions include as household controls: household size, head's age and age squared, fraction elderly and fraction children. Other variables are as defined in Table 2 notes.
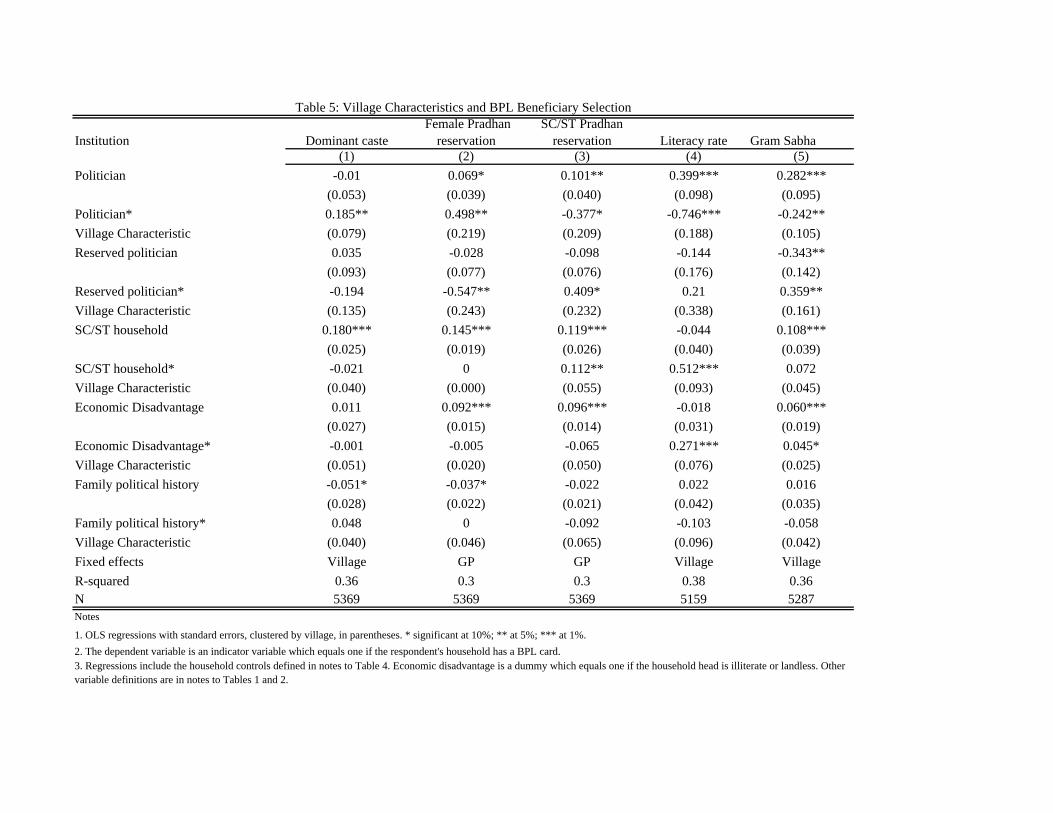
Table 5: Village Characteristics and BPL Beneficiary Selection
Institution Dominant casteFemale Pradhan
reservationSC/ST Pradhan
reservation Literacy rate Gram Sabha(1) (2) (3) (4) (5)
Politician -0.01 0.069* 0.101** 0.399*** 0.282***(0.053) (0.039) (0.040) (0.098) (0.095)
Politician* 0.185** 0.498** -0.377* -0.746*** -0.242**Village Characteristic (0.079) (0.219) (0.209) (0.188) (0.105)Reserved politician 0.035 -0.028 -0.098 -0.144 -0.343**
(0.093) (0.077) (0.076) (0.176) (0.142)Reserved politician* -0.194 -0.547** 0.409* 0.21 0.359**Village Characteristic (0.135) (0.243) (0.232) (0.338) (0.161)SC/ST household 0.180*** 0.145*** 0.119*** -0.044 0.108***
(0.025) (0.019) (0.026) (0.040) (0.039)SC/ST household* -0.021 0 0.112** 0.512*** 0.072Village Characteristic (0.040) (0.000) (0.055) (0.093) (0.045)Economic Disadvantage 0.011 0.092*** 0.096*** -0.018 0.060***
(0.027) (0.015) (0.014) (0.031) (0.019)Economic Disadvantage* -0.001 -0.005 -0.065 0.271*** 0.045*Village Characteristic (0.051) (0.020) (0.050) (0.076) (0.025)Family political history -0.051* -0.037* -0.022 0.022 0.016
(0.028) (0.022) (0.021) (0.042) (0.035)Family political history* 0.048 0 -0.092 -0.103 -0.058Village Characteristic (0.040) (0.046) (0.065) (0.096) (0.042)Fixed effects Village GP GP Village VillageR-squared 0.36 0.3 0.3 0.38 0.36N 5369 5369 5369 5159 5287Notes
1. OLS regressions with standard errors, clustered by village, in parentheses. * significant at 10%; ** at 5%; *** at 1%.2. The dependent variable is an indicator variable which equals one if the respondent's household has a BPL card.3. Regressions include the household controls defined in notes to Table 4. Economic disadvantage is a dummy which equals one if the household head is illiterate or landless. Other variable definitions are in notes to Tables 1 and 2.

Table 6: Politician Characteristics and BPL Beneficary SelectionPolitician Characteristic Has BPL card Years of education
(1) (2)Politician -0.147*** 0.264***
(0.023) (0.100)Politician* 1.076*** -0.020**Politician Characteristic (0.051) (0.009)Reserved politician -0.095** -0.115
(0.042) (0.141)Reserved politician* 0.118 0.002Politician Characteristic (0.087) (0.014)SC/ST household 0.169*** 0.110***
(0.019) (0.035)SC/ST household* -0.295*** 0.008**Politician Characteristic (0.083) (0.004)Economic Disadvantage 0.090*** 0.055**
(0.013) (0.027)Economic Disadvantage* -0.064 0.006*Politician Characteristic (0.062) (0.003)Family political history -0.044** 0.063
(0.017) (0.043)Family political history* 0.062 -0.010**Politician Characteristic (0.068) (0.004)Fixed effects Village VillageR-squared 0.42 0.37N 5369 5328Notes1. OLS regressions with standard errors, clustered by village, in parentheses. * significant at 10%; ** at 5%; *** at 1%.
2. The dependent variable is an indicator variable which equals one if the respondent's household has a BPL card.3. Regressions include the household controls defined in notes to Table 4. Other variable definitions are in notes to Tables 1 and 2.
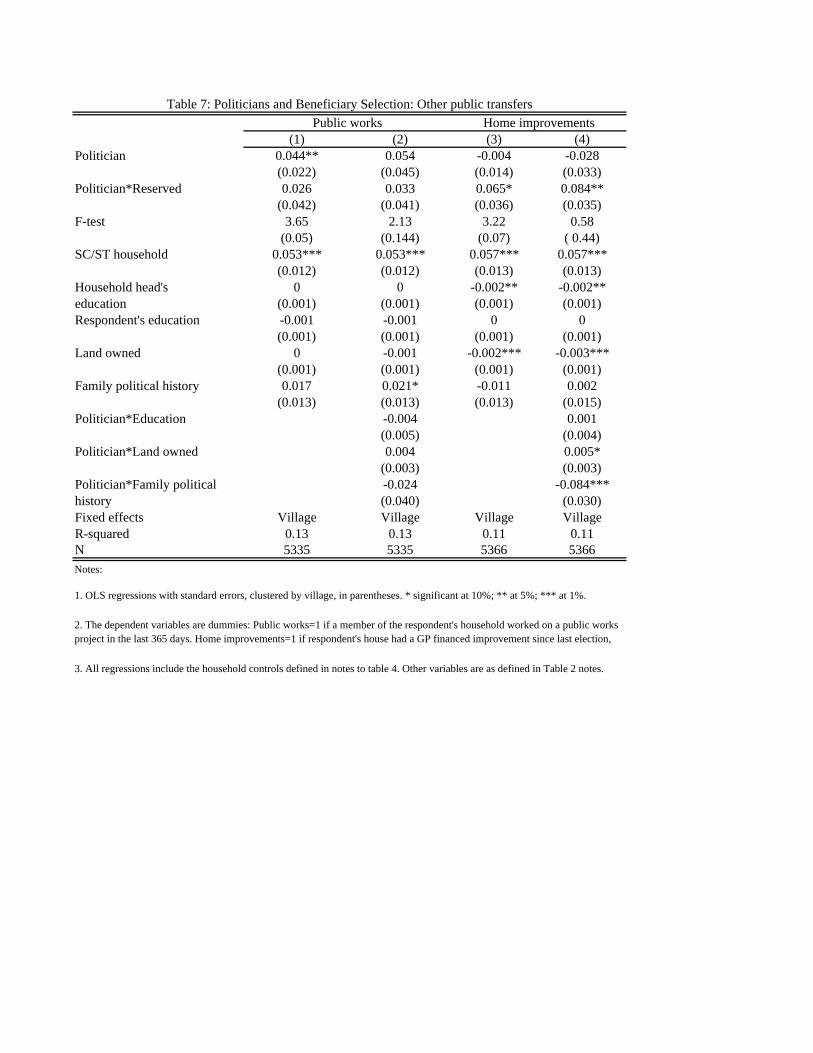
Table 7: Politicians and Beneficiary Selection: Other public transfersPublic works Home improvements
(1) (2) (3) (4)Politician 0.044** 0.054 -0.004 -0.028
(0.022) (0.045) (0.014) (0.033)Politician*Reserved 0.026 0.033 0.065* 0.084**
(0.042) (0.041) (0.036) (0.035)F-test 3.65 2.13 3.22 0.58
(0.05) (0.144) (0.07) ( 0.44)SC/ST household 0.053*** 0.053*** 0.057*** 0.057***
(0.012) (0.012) (0.013) (0.013)Household head's 0 0 -0.002** -0.002**education (0.001) (0.001) (0.001) (0.001)Respondent's education -0.001 -0.001 0 0
(0.001) (0.001) (0.001) (0.001)Land owned 0 -0.001 -0.002*** -0.003***
(0.001) (0.001) (0.001) (0.001)Family political history 0.017 0.021* -0.011 0.002
(0.013) (0.013) (0.013) (0.015)Politician*Education -0.004 0.001
(0.005) (0.004)Politician*Land owned 0.004 0.005*
(0.003) (0.003)Politician*Family political -0.024 -0.084***history (0.040) (0.030)Fixed effects Village Village Village VillageR-squared 0.13 0.13 0.11 0.11N 5335 5335 5366 5366Notes:
1. OLS regressions with standard errors, clustered by village, in parentheses. * significant at 10%; ** at 5%; *** at 1%.
2. The dependent variables are dummies: Public works=1 if a member of the respondent's household worked on a public works project in the last 365 days. Home improvements=1 if respondent's house had a GP financed improvement since last election,
3. All regressions include the household controls defined in notes to table 4. Other variables are as defined in Table 2 notes.
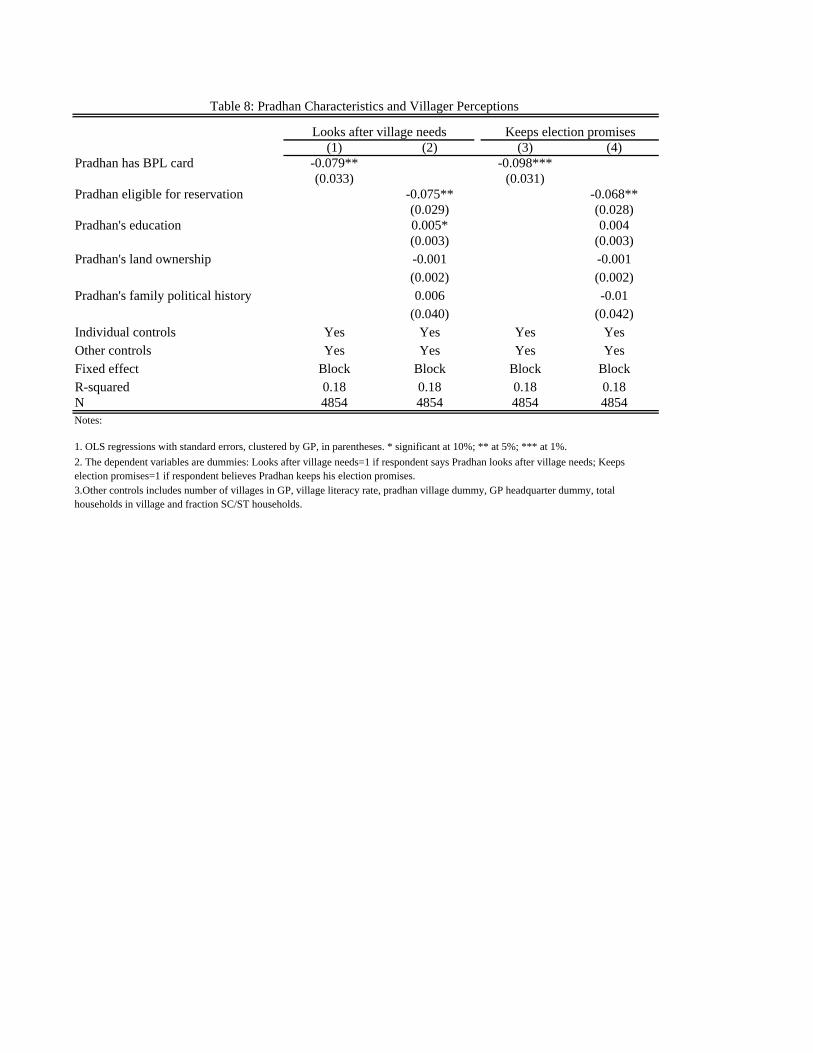
Table 8: Pradhan Characteristics and Villager Perceptions
Looks after village needs Keeps election promises(1) (2) (3) (4)
Pradhan has BPL card -0.079** -0.098***(0.033) (0.031)
Pradhan eligible for reservation -0.075** -0.068**(0.029) (0.028)
Pradhan's education 0.005* 0.004(0.003) (0.003)
Pradhan's land ownership -0.001 -0.001(0.002) (0.002)
Pradhan's family political history 0.006 -0.01(0.040) (0.042)
Individual controls Yes Yes Yes YesOther controls Yes Yes Yes YesFixed effect Block Block Block BlockR-squared 0.18 0.18 0.18 0.18N 4854 4854 4854 4854Notes:
1. OLS regressions with standard errors, clustered by GP, in parentheses. * significant at 10%; ** at 5%; *** at 1%.2. The dependent variables are dummies: Looks after village needs=1 if respondent says Pradhan looks after village needs; Keeps election promises=1 if respondent believes Pradhan keeps his election promises. 3.Other controls includes number of villages in GP, village literacy rate, pradhan village dummy, GP headquarter dummy, total households in village and fraction SC/ST households.
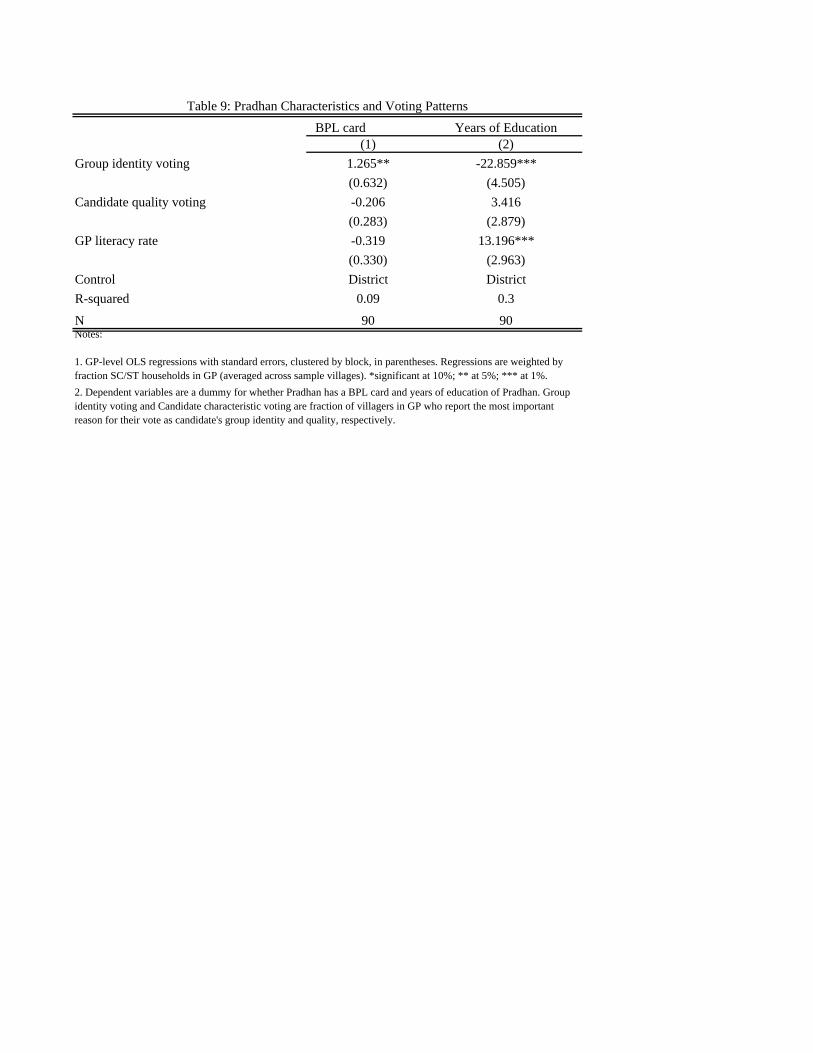
Table 9: Pradhan Characteristics and Voting Patterns BPL card Years of Education
(1) (2)Group identity voting 1.265** -22.859***
(0.632) (4.505)Candidate quality voting -0.206 3.416
(0.283) (2.879)GP literacy rate -0.319 13.196***
(0.330) (2.963)Control District DistrictR-squared 0.09 0.3
N 90 90Notes:
1. GP-level OLS regressions with standard errors, clustered by block, in parentheses. Regressions are weighted by fraction SC/ST households in GP (averaged across sample villages). *significant at 10%; ** at 5%; *** at 1%.2. Dependent variables are a dummy for whether Pradhan has a BPL card and years of education of Pradhan. Group identity voting and Candidate characteristic voting are fraction of villagers in GP who report the most important reason for their vote as candidate's group identity and quality, respectively.