Embed Size (px)
Citation preview

The Political Consequences of Franchise Extension:
Evidence from the Second Reform Act
Samuel Berlinski1 and Torun Dewan2
August, 2010
Abstract. We use evidence from the Second Reform Act, introduced in the United King-
dom in 1867, to analyze the impact on electoral outcomes of extending the vote to the un-
skilled urban population. Exploiting the sharp change in the electorate caused by franchise
extension, we separate the effect of reform from that of underlying constituency level traits
correlated with the voting population. Although we find that the franchise affected electoral
competition and candidate selection, there is no evidence relating Liberal electoral support
to changes in the franchise rules. Our results are robust to various sources of endogeneity.3
1. OVERVIEW AND INTRODUCTION
Several theoretical studies shed light on the relationship between franchise extension and policy
outcomes, providing plausible connections between changes in the rules governing the eligibil-
ity to vote and incentives of policy makers leading to greater redistribution (Boix, 2003, 2001;
Acemoglu and Robinson, 2000) or expansion of local public goods (Lizzeri and Persico, 2004).
Empirical analysis (Aidt and Jensen, 2009; Lindert, 2004; Husted and Kenny, 1997) suggests a
“growing consensus that the extension of the franchise contributed positively to the growth in gov-
ernment” (Aidt and Jensen, 2009, p19).4 From a political science perspective, however, a critical
element of the link between franchise extension and policy outcomes is missing. In particular we
know little about the political mechanism that relates changes in the franchise to the growth of
government. In principle, policy changes caused by franchise extension could arise due to several
1University College London. Email: [email protected] School of Economics. Email:[email protected] thank Facundo Albornoz, Jim Alt, Ernesto Dal Bo, Gary Jacobson, Jouni Kuha, Valentino Larcinese, Thomas
Pluemper, Stephanie Rickard, Ken Scheve, Ken Shepsle, and seminar participants at APSA, Berkeley, ECPR, Essex,
and Yale for helpful comments. We thank Cheryl Schonhardt-Bailey and James Robinson for sharing their data. We
thank STICERD for financial assistance and May Chu and Brenda van Copenolle for excellent research assistance.4At the same time the link between franchise reform and fiscal policy appears not to be direct: Aidt et al. (2009)
show a non-monotonic relationship between franchise extension and the probability of adopting income tax; Lindert
(1994), assesses the impact of variation in electoral rules across countries and finds little evidence that social spending
increased before 1920; Scheve and Stasavage (2008) show tax rates were flat during the late nineteenth and early
twentieth century, rising sharply as countries mobilized for war; and Aidt and Jensen (2009) and Husted and Kenny
(1997) show that institutional tax raising capacity is an important conditioning variable.
1

2
factors, inter alia, the voting behavior of newly enfranchised citizens, differences in party compe-
tition, candidacy and incumbency effects, or differences in agenda-setting and voting behavior of
political elites.
Analysis of specific franchise extensions can help isolate these different effects. An important test
case is the Second Reform Act in the United Kingdom. This extended the franchise to the unskilled
urban population, with an overall increase in the 1867 voting population in England, Scotland, and
Wales of 97%. To analyze the impact of franchise extension on political outcomes in the United
Kingdom during this period, we exploit the constituency level variation in the voting population
that arose from the reform. There are few studies that analyze the impact of franchise extension at
such a local level.5 Doing so allows us to understand the political mechanisms at work and provides
new insights into rival hypothesis about the underlying causes and effects of franchise extension.
Historians of the period have been puzzled by the exact nature of the suffrage reforms. Most have
seen extension of the franchise as related to competition between the Liberal and Conservative
parties and tensions between their two great leaders, Disraeli and Gladstone. In general, political
scientists concur with the notion that elites anticipate the competitive effects of any change to the
rules governing eligibility to vote. There are, however, several reasons why franchise extension
during this period is unlikely to be related to inter-party political calculations: the Second Reform
Act of 1867 preceded the election of the first ever unequivocally Liberal administration in 1868 and
ushered in a period of radical reform; the Reform Act was more extensive than a Liberal measure
that had failed to pass in the Commons in the previous year; the Act was, however, introduced by
a minority Conservative government, whose main constituency was the rural voters; finally, and
critically, the reforms increased the voting population in precisely those urban areas likely to be
sympathetic to the Liberals.
The argument is nicely summarized by Acemoglu and Robinson (2000): “as the result of the split
over the Corn Laws, support for the Conservative party was essentially concentrated in rural areas,
with Tory landowners exerting substantial control over the electorate in the absence of a secret
ballot. The reform measure passed under Disraeli increased the voting population by only 45
percent in counties, compared to 145 percent in the boroughs, effectively ensuring a Conservative
defeat in the following elections.”
The outcome of the 1868 general election- a comfortable victory for the Liberals- can then be
considered as evidence against the view that franchise extension arose due to such internal party
political considerations and suggests, instead, that franchise extension originated as a response to
popular pressure for reform. This claim would be stronger if the extension of the franchise, initiated
by the Conservative government, could be causally linked to the election of a Liberal government
5An exception is Aidt et al. (2009) who look at the impact of changes in the local government franchise in the UK in
the 19th century, showing a non-monotonic relationship between inequality and the provision of local goods.

3
with a reforming agenda. Although the extension of the franchise was correlated with Liberal
success, and hence the introduction of their radical agenda, it is as yet unproven that the change
in rules concerning voter eligibility contributed to that success. Whilst we cannot directly observe
the counterfactual - the electoral outcome had the electoral rules established in 1832 remained in
place- a careful identification strategy provides a second best solution that allows us to understand
the impact of change in the voting population.
Three features of the Second Reform Act allow us to identify the impact of the change in the
rules concerning eligibility to vote on the political outcomes of subsequent elections. Firstly, the
extent and impact of the Second Reform Act was largely unanticipated. Indeed Disraeli’s strategy
was famously described by Lord Cranborne, a senior minister who resigned from cabinet over the
issue, as a “leap in the dark”. Secondly, we show that there was a large amount of variability with
regard to the effect of the change in the electoral rules on the eligible voting population at the
constituency level. Thirdly, and unlike previous and later reforms, the extension of the franchise
in 1867 was unaccompanied by other constitutional changes that would confound any attempt to
isolate the causal impact of reform.
For most of our analysis, we look at a sample of boroughs where franchise reform was not asso-
ciated with any change in the constituency boundaries or the number of parliamentary seats to be
filled between the general elections of 1865 and 1868. Exploiting the constituency level variation
in the impact of franchise reform in this sample - to separate its effect from that of underlying con-
stituency level traits correlated with the voting population - and controlling for a national swing,
we thus isolate the effect on Liberal support that is due to the impact of the extension of the fran-
chise from that of other factors that may have lead to the Liberal victory in 1868. We then ask
whether the constituency level expansion of the franchise due to the new electoral law introduced
in 1867 provided a source of advantage for the Liberal Party.
We first explore whether the differences in the constituency level franchise were related to change
in the structure of party competition between the Liberals and Conservatives. Before the Second
Reform Act many seats were uncontested. In these constituencies no ballots were cast; either one
party received all seats unopposed, or both parties agreed the share of seats to be allocated. A
possible source of Liberal advantage is that, under the new franchise rules, they could contest a
larger share of constituency level seats. Unsurprisingly we find that the number of uncontested
seats declines sharply, and more so in the constituencies most affected by reform. Moreover, we
find that, overall, there is an increase in the ratio of candidates to seats and that this is due to greater
contestation by Liberal candidates. The evidence also suggests that incumbents were less likely to
run in areas most affected by reform.
However, and despite differences in the nature of party and candidate competition at the con-
stituency level, we find no evidence suggesting that the direct outcome of the election was related
4
to franchise reform. Neither the differences in the Liberal share of votes or the percentage of seats
won by Liberal candidates can be explained by changes to the rules governing the eligibility to
vote. Thus, our analysis suggests that the outcome of the election in 1868 - a victory for the Lib-
eral Party under Gladstone- was incidental to the major reform in the voting franchise that took
place in 1867.
Extending our analysis, we explore possible causes for our null findings. The first involves mea-
surement error that arises because we do not directly observe the relevant population - those eligible
to vote under the new rules - rather a subset of the eligible voting population who registered to vote.
As highlighted in the important study by Davis and Tanner (1996), the actual number of registered
voters in each constituency reflected local difficulties in registering the newly enfranchised popu-
lation. Moreover, the details of the new franchise rules, which included a residency requirement
and excluded certain types of dwellings, left ambiguities to be resolved by local judges and admin-
istrators. If, as a result, the ratio of registered voters to population is not constant between the two
elections analyzed, the resulting measurement error may bias downwards our results.
A second cause of our null findings relates to reverse causality that may bias downwards our
estimates of a marginal increase in the voting franchise in a given constituency. It is possible that,
at the margin, the reforms were administered in such a way that their effect was less in those areas
where Liberal support was growing more quickly. We should not overemphasize this issue. By
itself, extension of the franchise is a blunt tool for seeking political advantage. It was not possible
for Disraeli to cherry-pick conservative voting groups to be given the vote. Indeed, it is more likely
that in order to assuage social unrest, the franchise may have been allowed to grow faster in places
were social unrest and possibly liberal support was growing faster. If this is the case our estimates
will be biased upwards. Nevertheless, and to deal with both the issue of measurement error and
reverse causality, we instrument the change in the level of enfranchised voters and we study pre-
trends in the outcomes of interest. Doing so yields no systematic change in our results: we find
no evidence to support the view that the Liberals became stronger in those areas most affected by
electoral reform.
A third issue involves our sampling strategy. The main effect of the Second Reform Act was to
introduce into the franchise a large block of new voters. To identify the effect of this change we
focus mainly on those boroughs unaffected by boundary changes or changes in the number of
seats. Since the decision to leave the contours of a district (and the number of seats available)
was politicized, it is possible that different samples would yield different outcomes. We deal with
this in several ways: we show that the main (average) outcomes of interest do not vary systemati-
cally prior to 1868; thus the population of constituencies where the only thing that changed is the
number of eligible voters, is on average, and on our key indicators, the same as the population of

5
constituencies that received additional changes. In our regression analysis we also use different
samples and include interaction effects. This reveals no discernable difference to our estimates.
A final hypothesis for explaining our null findings is that Conservative incumbents may have
adapted their views in order to appeal to their new electorate. To explore this issue we analyze
the parliamentary voting behavior of Members of Parliament (MPs) in this period. In particular,
we focus our attention on the Abolition of Church Rates Bill introduced in the parliamentary ses-
sions of 1866 and 1867. Church rates were personal taxes on property owners that were used
to support the established church. There was popular agitation to abolish them and support for
abolition was divided along party lines. Due to the constraints of the parliamentary timetable, we
observe MPs’ voting behavior before and after the Second Reform Act bill was introduced into
parliament. We find no evidence suggesting that the intensity of the forthcoming expansion of the
franchise was related to changes in voting behavior on the Abolition of Church Rates Bill.
We begin our analysis in the following section by providing background information on the Second
Reform Act. We then look at why the nature of the reform has puzzled historians of the period
as well as contemporary political economists. In section 4 we describe our data. In section 5 we
present our identification strategy. In section 6 we present our main estimates. Section 7 looks
at the robustness of our results when analyzing different samples, taking into account possible
endogeneity, and exploring possible medium run effects of the reform act. Section 8 discusses
possible changes in MPs voting behavior that could have been caused by the forthcoming franchise
extension. Finally section 9 concludes.
2. BACKGROUND: ELECTORAL REFORM AND THE SECOND REFORM ACT
Elections in Britain in the Victorian period under investigation took place under the first-past-the-
post voting system that is still in place. Whilst some constituencies were single-member districts,
most constituencies elected two candidates and a few elected three and four. The constituency elec-
tions were contested by candidates who aligned with one of two major parties, the Conservatives
and the Liberals. The Liberals brought together a loose coalition of Whigs, Radicals, and Peelites
(a faction that had broken from the Conservatives) and by 1860 formed a cohesive parliamentary
block. Following Lord Palmerston’s death in 1865 the Liberals were lead by William Gladstone.
For the immediate period preceding the elections of our investigation, Liberals had held the key
ministries of government. However, between 1865 and 1868 the Conservatives formed a minority
government, first under Lord Derby and then under Benjamin Disraeli.
The Representation of the Peoples Act, otherwise known as the Second Reform Act, was passed
by Parliament on August 15th, 1867. As its name suggests it was the second major voting reform
bill that transformed the political landscape in the Great Britain. The first major extension of the

6
franchise in the UK took place in 1832. The Great Reform Act of that year introduced several
measures that mitigated malaportionment: increasing representation in the industrialized cities,
and taking away seats from the so-called “rotten boroughs” with small voting populations. The act
also increased the male franchise to around 650,000.
The Second Reform Act, that became law in England and Wales in 1867, extended the franchise in
the boroughs to all males over the age of 21 who were inhabitant occupiers, whether house-owners
or tenants, and to male lodgers whose rent was at least £10 per year. A residence of at least one
year in the borough was required and women were still unable to vote. In counties, the franchise
was extended to holders of life interests, copyholds and leases of sixty years and more worth £5
per annum (from a previous threshold of £10) and to tenants occupying land worth £12 (from a
previous threshold of £50 per annum). The Reform Acts for Scotland was delivered in 1868.6 The
reforms were swiftly followed by the election of a new parliament in 1868. This provides us with
a unique window of opportunity for identifying the impact of franchise extension.
Later Reform Acts introduced the secret ballot (1872), placed the counties on an equal footing with
the urban boroughs (1884), reduced the number of multiple member districts (1885), extended the
franchise to all males (1918), and provided women with electoral equality (1928). The full time
line of reforms since 1832 is provided in Figure 1.
Table 1 presents the number of registered electors in 1859, 1865, 1868 and 1874 for England,
Wales, and Scotland in both boroughs and counties.7It is clear that the Reform Act lead to an
increase in the franchise not witnessed either before or after the 1868 election. From 1859 to 1865
the registered electorate in England, Scotland and Wales increased by 7% and from 1868 to 1874
by 12%; this compares with a 97% increase between 1865 to 1868. Overall the franchise included
more than 1,000,000 newly registered electors. The increase was more marked in the more densely
populated urban boroughs where the franchise increased (on average) by 152% with respect to a
47% increase in counties. Indeed historians have noted that the most striking feature of the Second
Reform Act was the unexpectedly wide extension of the franchise in the boroughs, when compared
to the counties.
The Reform Act brought into the franchise voters from previously unenfranchised income brackets.
Who were the new voters? Mackenzie (1921) and Bowley (1937) estimate the income of the
head of the household at median, quartile and lowest decile of the income distribution in 1860.
Mackenzie (1921) also provides estimates of household budgets for a typical family (man, wife,
and 3 schoolchildren) which include the amount paid for rent. We present this information in Table
2 which shows that the annual income of a head of household in the upper quartile of the income
6Ireland had a reform act in 1868 but unlike in England, Scotland and Wales the impact of the reform on registered
voters was marginal.7These figures exclude the electors registered in the university constituencies which were allowed to vote both in the
university constituency and in their town of residence

7
distribution was more than £70; typically he was a semi-skilled worker (e.g, a brick-layer) and
paid an annual rent in excess of £10.8 The annual income of the head of household in the lower
quartile was around 60 percent of that in the upper quartile; this would typically be the income
of an unskilled worker (e.g., brick-layer laborer) and paid an annual rent in excess of £6. At the
median of the income distribution the rent paid was close to £8. Although the calculations are
(obviously) rough, given the data limitations, they help us to illustrate the type of households that
gained the vote under the new franchise: it is clear that the extension of the franchise gave the vote
to urban unskilled workers.9
However there were important qualifications. An aim of the Reform Act was to disqualify the
“feckless”. Paupers and those who did not satisfy the residency requirement were not entitled
to vote. In addition, the rules initially excluded those who did not pay their own rates from the
franchise. Payment of rates was seen as a signal of personal virtue, the possession of which was
deemed a necessary condition of being granted the vote. Prior to the Second Reform Act, landlords
were able to pay rates on their tenants behalf. This system of “compounding” eased administration
on levying rates on houses that consisted of separate units the occupiers of which paid rents to
a landlord. Hodgkinson’s amendment to the original bill, in principal, abolished the system of
compounding - henceforth, those eligible to vote were required to pay their own rates directly- but
it did so only for occupiers who rented a house rather than a room or apartment. Thus, whereas
some potential voters were excluded directly, the partial abolition of compounding introduced of
ambiguity into the system that could only resolved by local magistrates.10 The net effect was what
Davis and Tanner have called a “paradoxical and capricious system, still literally exclusive in that
it denied many men the vote, but not selective in the way that its creators, anxious to limit the vote
to those sharing Victorian norms of respectability, had intended.”
3. INTERPRETING AND UNDERSTANDING THE SECOND REFORM ACT
The Second Reform Act of 1867 was introduced by the Conservative government lead by Lord
Derby, though most historians view Disraeli as its prime architect. Electoral reform had been
considered for some time before the passing of the 1867 reform. Indeed a reform bill proposed by
the Liberals lead by Earl Russell had been defeated by a coalition of Conservatives and Liberals
opposed to reform in 1866.11The fact that the reform bill of 1867 was introduced by a minority
Conservative government, supported by backbench Conservatives, and that the reforms lead to a
8At the time 1 pound = 20 shillings and 1 shilling = 12 pence.9Those in the lowest decile of the income distribution (the agricultural laborers) were only enfranchised in 1884.10Compounding was partially reintroduced in 1869 under the Poor Rate Assessment and Collection Act.11Earl Russell also failed to pass an electoral reform bill in 1860. Interestingly, neither Disraeli or Palmerston men-
tioned electoral reform in their electoral addresses in 1865. The death of Palmerston -elected as Prime Minister after
the 1865 election- changed government policy and lead the Liberals to put the issue back on the table (Seymour, 1915).

8
far greater increase in the franchise than would have been possible had the original Liberal reforms
passed, has puzzled historians and commentators of the time.
The first, and simplest, view to consider is that Disraeli, the key architect of the Reform Act,
pursued this course of action as he believed the Conservatives could (at best) reap rewards or (at
worst) be left unaffected by implementation of the proposed voting reforms. Nineteenth century
commentators such as Bagehot, for example, explained the reform as part of Disraeli’s vision of a
‘Tory Democracy’ that would appeal to the conservative instincts of the British working classes.
So Disraeli’s strategy can be seen as part of his grander vision of one-nation conservatism: an
attempt to build a majority Conservative party that appealed to different elements of British society
(Himmelfarb, 1966). A related view is that Disraeli hoped to secure an electoral advantage by
introducing an inevitable reform that allowed him to claim credit amongst newly enfranchised
voters whilst exploiting divisions within the Liberal party over the issue. Further, in outsmarting
his erstwhile rival Gladstone by passing a more radical bill than the Liberals had been able to,
he hoped to reveal deficiencies in Gladstone as leader and parliamentarian (Jenkins (1996)). This
view is given further credence by Maclean (2001) who suggests that, whereas Disraeli may not
have been able to foresee the effects of reform, by “dishing the whigs”, in passing a more radical
reform, he ensured Tory backbench support.
The immediate electoral outcome in 1868, a victory for the Liberals, casts doubt on the hypothesis
that the Tories benefited electorally via the inclusion of new voters in the franchise. Yet the histori-
cal evidence does not suggest either that the unskilled workers who voted for the first time in 1868
systematically favored the Liberals: Gash (1953) highlighted the essentially conservative character
of the Victorian electorate; whereas Vincent (1968) showed that the social basis of voting behavior
was underdeveloped in this period, with voters casting their ballots on local and symbolic issues.
Thus, although members of Disraeli’s government were horrified at the thought of expanding the
Liberal voting base, it was not clear at the time that the extension of the franchise would have
this effect. Whilst some historians believe that the sympathies of the newly enfranchised workers
lay with the Liberals (see, for example, Whitfield (2001), p239), Disraeli’s faith in the inherently
conservative credentials of the new working class voters was not necessarily misplaced.
An alternative hypothesis relates extension of the franchise to external threats to the established po-
litical order, rather than inter-party disputes. Acemoglu and Robinson (2000) analyze the political
economy of franchise extension and offer a compelling account of how franchise extension relates
to fiscal redistribution. In their model, largely motivated by the Second Reform Act, an elite facing
the threat of social revolution, has incentives to raise taxes to levels desired under a democracy.
The ability of workers to extract concessions is transitory and arises only in periods of economic
growth. An elite is thus unable to credibly commit to a redistributory tax policy when growth is
stochastic and so are unable to assuage unrest. Extension of the franchise allows for a durable

9
compromise in which the wealthy can make credible commitments of moderate redistribution that
would dampen agitation for more radical economic reform. According to this view, events such as
the Hyde park riots in 1866 and 1867 -in which supporters of the Reform League were involved in
violent clashes with the police- were critical in shaping political incentives during this period, and
forced an elite sceptical about reform to nevertheless embark upon the path of enfranchising the
working classes.
Acemoglu and Robinson’s theory brings together several disparate parts of this Victorian puzzle-
the fact that the reform bill was passed by a Conservative government, and that the election was
won by a reforming Liberal party, who arguably went on to transform British society with a series
of radical measures. The critical piece of the puzzle is the fact that the reforms were designed to
increase the vote share disproportionately in urban boroughs relative to the counties, despite the
fact that the latter provided the bedrock for Conservative support. The authors argue that, due to
this feature of the reform, the change in the franchise rules could only have benefited the Liberals.
Thus the change in the rules can not plausibly be connected to electorally motivated considerations
by the architects of the reform. Moreover, an immediate glance at the data provided in Table 1,
that highlights the predominant impact of the reforms in the boroughs, tends to support the hunch
that Liberal success was likely attributable to the precise nature of the reforms. Analyzing the
immediate electoral outcomes can shed light on this issue. If the immediate electoral outcomes
can be shown to be both beneficial to the Liberals and causally related to the introduction of the
Second Reform Act then, indeed, it provides powerful supporting evidence for Acemoglu and
Robinson’s theory.
A central aim of our study is to explore which mechanism links franchise extension to change
in political outcomes. Whilst it is implausible that the changes to the franchise rules can have
had no effect, there are numerous mechanisms via which they might have impacted on British
political development. The first and most obvious is that already discussed: Liberal success in
1868 may have been due to the incorporation into the franchise of low skilled workers with an
average income lower than that found in the pre-existing franchise. Thus, fixing all aspects of
competition between the Liberals and Conservatives, the inclusion of a new block of voters may,
in and of itself, account for the immediate political outcomes. But of course, the parties responded
to the new situation: the Liberal party may have been attracted by the prospect of competing in
constituencies where previously the Conservatives had run unopposed; or increasing its share of
constituency level candidates. For example Cox (1987), p69, discusses the aggregate increase in
party competition during the period, as previously uncontested seats became open to competition,
and the number of candidates increased. The question arises to what extent these changes can be
seen as causally related to the impact of the Second Reform Act.

10
Another avenue by which the reforms might impact on political outcomes is in providing incen-
tives for parties to put forward different types of candidates, as changes in candidacy provides a
mechanism by which the parties could credibly appeal to their new electorate. Most of the key or-
ganizational changes, such as the setting up of National Union of Conservative and Constitutional
Associations (1867), and the National Liberal Foundation (1877), that affected the selection of
local candidates, came too late to affect the immediate 1868 election; (though later on we present
some evidence that organizational changes made by the Conservatives did impact on the 1874 elec-
tion). Nevertheless, in light of the new electorate, the decision as to which candidates to run, and
in which constituency to run them, took on renewed importance. In sum, a close investigation of
the data from the Second Reform Act may then reveal subtle channels via which suffrage reform
affected the political development of the United Kingdom. By looking at a wide range of outcomes
concerning party and candidate competition, as well as the immediate electoral outcomes, we can
ask what effects, if any, did franchise extension have on the political outcomes of the day.
A further aim of our study is to use the data from this period to shed light on the effect of franchise
reforms on political representation. To what extent did this important Act lead to a system of one-
man-one -vote in the United Kingdom? Historians have questioned the extent to which the Second
Reform Act lead to an equitable distribution of votes amongst the eligible franchise. A particular
problem, nicely summarized by Davis and Tanner (1996), p37, involved the registration of voters:
“a system geared to the registration of relatively small electorates was overwhelmed
by the steady growth in the number of voters between 1867 and the eighteen-
nineties, with the result that, however generous the law and however flexible the
registration authorities, large numbers of potential voters slipped through the net.”
A related concern involves Hodgkinson’s amendment, that abolished the system of compounding
whereby a landlord paid rates on his tenants behalf, as mentioned earlier. The new rules required
house occupiers to pay their own rates and thus be listed separately as ratepayers. From these lists
were then drawn the voting registers. In practice however, and due to ambiguities in Hodgkinson’s
amendment, in particular over what constituted a “dwelling house” under the new system, con-
siderable discretion was handed to local barristers who oversaw the drawing up of local registers
and this may in part explain the variance across constituencies in the number of registered voters.
Whilst we do not address directly the extent to which the registered constituency level electorate
represented the eligible voting population we can - by deploying a range of empirical strategies
- control for local effects in assessing the impact of the reform on political outcomes. We can
thus address directly the central question: did constituency level variation in the impact of the new
franchise rules have a systematic impact on the political outcome of the reforms?

11
4. DATA AND DESCRIPTIVE STATISTICS
Our data is gathered from Craig (1989), British Parliamentary Election Results, 1832-1885, which
provides, for all national elections and by constituency, information on: number of seats, boundary
changes, registered voters, name of candidates running, party of candidates, and votes per candi-
date. We also make use of the national population census 1861 and 1871 as reported in Vincent
and Stenton (1971), McCalmont’s Parliamentary Poll Book.
In order to identify the impact of the franchise extension we must be able to isolate its effect from
other possibly confounding institutional factors. Whilst the extension of the franchise in 1867
coincided with a level of redistricting -some constituencies which previously had two Members of
Parliament were reduced to one, or increased to three, some constituencies were eradicated, whilst
others merged- unlike in 1832, in most constituencies the only major district level change was the
increase in the franchise. Our focus on this period thus allows us to separate the effect of franchise
extension on political behavior from other possibly confounding effects at the constituency level,
in a way that an analysis of the earlier and posterior Reform Acts cannot.
Table 3 provides details of the total number of constituencies and seats in England, Scotland and
Wales during the 1859, 1865, 1868, and 1874 general elections as well as changes that arise during
this period of reform (see, Craig (1989)). There were a total of 349 constituencies and 546 seats in
the 1868 election with 304 constituencies appearing in all four elections. The difference between
these numbers is explained by the fact that some constituencies were either newly created or de-
franchised during the period of analysis. From those constituencies that appear in all four elections
only 43 experienced changes in the number of seats. Finally, there are 113 boroughs (with a total of
171 seats) and 60 counties (with a total of 95 seats) that do not experience either changes in seats or
boundaries and appear in all four elections. Whilst most of our results rely on this restricted sample,
that allows us to isolate the effect of changing the franchise rules from other institutional factors,
we also show that our main results are robust to the inclusion of a broader range of constituencies.
In the period of study, the nature of political competition was remarkably different in counties and
boroughs. As explained by Hanham (1959), p7: “village and tenant farmers generally voted along
with their landlord not only because it was the accepted custom, but also because in everyday life
the ordinary tenant was consciously dependant on the goodwill of his landlord”. In fact, political
competition was so weak in the counties that in 1865, for example, 67 percent of counties’ con-
stituency MPs were elected unopposed (i.e., without votes being cast). By contrast, in 1865 only
39 percent of borough MPs were elected unopposed. It was also the case that the different nature
of electoral reform in boroughs and the counties had differential effects on the type of voters who
were newly enfranchised. For these reasons we focus our main analysis in the boroughs. We show
results for the counties in our robustness checks.

12
Figure 2 (Panel A) presents kernel densities for the logged difference in the registered voters be-
tween 1865 and 1868 for the sample of boroughs without changes in boundaries and seats. An
immediate and important observation is the wide variance in the effect of franchise extension in
these constituencies. In some boroughs the changes in the voting rules had little discernible impact
on the number of eligible voters, whereas in others the size of the (registered) electorate increased
considerably. Adopting the language of the experimental literature- we can view the extension of
the franchise as a ‘treatment’ that varies in intensity, ranging from (just below) 0 to (just over)
2 with an average around 1. There are also substantive cross-sectional differences in the propor-
tion of the population in a given constituency registered to vote in 1865 and, particularly, in 1868.
This is described in Figure 2 (Panel B) that presents density estimates of proportion of registered
electorates to population per Borough in 1865 and 1868.
Table 4 provides further information on characteristics determining larger changes in electoral
registration. We first examine how the franchise extension in 1867 relates to the (logarithm of)
registered electorates in 1832. In column 1, we observe that the growth in voter registration is
negatively and strongly correlated with the level of registered voters in 1832. In column 2, we add
changes in the population size from 1871 to 1861 and find similar results. In columns (3) and (4),
we look at the effect of the log of the level of population in 1861. The results in this case are also
negative but less strong. In columns (5) and (6), we include both the log level of the electorate
in 1832 and population in 1861. Ceteris paribus, the electorate grew slower where the (log of)
registered electors in 1832 was larger and faster where the (log of) population 1861 was larger.
Constituency level voting behavior in Victorian Britain was affected by the menu of choices on
offer, that in turn reflected the strategic calculations made by parties. In the 1868 election some
constituencies were single member districts, some had two members, and a few retained three and
four members. An immediate political measure that we observe is the number of contested seats.
In 1865 and 1868 it was still the practice that, in some constituencies, Liberal or Conservative
candidates would run unopposed. And in some multi-member districts the division of seats was
agreed between the major parties before hand. As our results show this aspect of political collusion
decreased sharply with the passing of the Second Reform Act. We investigate whether the share
of uncontested seats in a constituency, which provides an indirect channel by which the extension
of the franchise can shape the electoral outcomes, is causally related to the franchise extension.
In addition, we assess whether the reform affected the number of candidates running per seat in a
given constituency. Furthermore, we look at whether there was a relative increase in those running
under the Liberal party label.
In our main analysis we concentrate on the constituency level impact of reform on electoral out-
comes. We start by looking at two indicators of Liberal strength that are directly related to the
behavior of the voting population. First, we look at the proportion of constituency level seats won

13
by the liberal party. Second, for those constituencies where the elections were not unopposed, we
look at the share of the liberal vote.12 Finally, we analyze voter turnout by looking at the average
number of votes per seat over the number of registered electors.
Our analysis also looks at the issue of candidate selection. First, we explore the ratio of incumbents
running to seats available in each constituency, and, disaggregating further, we study the proportion
of Liberal incumbents who run again in the same electoral district.13 Following the same logic, we
also look at the share of candidates who lose in the previous election but who stand again in the
same constituency.
Table 5 provides summary statistics on the outcomes we have described for our sample of boroughs
(without changes in seats and boundaries) during four national elections (1859, 1865, 1868 and
1874). The average constituency more than doubles in size between 1865 and 1868. During the
same period the average Liberal vote-share increases from 63% to 66%, and the share of Liberal
seats increases by 4 percentage points from 73% to 77%.
Turning to the competitiveness of the constituency races in our sample of boroughs, 37% of con-
stituencies returned candidates without any votes being cast in 1865, whereas in 1868 the percent-
age of uncontested seats falls sharply to 23%. The candidate to seat ratio also increased across the
period, and in particular from 1.51 to 1.70 in the elections immediately either side of the Second
Reform Act. The average Liberal candidate to seat ratio increases accordingly, from 0.97 to 1.12.
The share of incumbents who run increases from 57% to 67% and we observe that this increase is
also true of Liberal incumbents: 40% of Liberal candidates were sitting incumbents in 1865, and
this increases to 53% in 1868. The rate of retention of losing candidates is higher: only 5% of
candidates in 1865 had lost the same seat in the previous election and this increases to 7% in 1868,
with a similar rate of increase seen amongst losing Liberal candidates.
Whereas Table 5 provides summary statistics on our key outcomes for our sample of boroughs
without changes in seats and boundaries, it is possible that, due to the political nature of the de-
cision to leave boundaries and seats unaltered, this sample has particular properties. In particular,
a natural suspicion is that Disraeli chose to leave the boundaries and magnitude of a district un-
changed when he anticipated that the Liberals would then gain little in the next election, but to
change either boundary or magnitude (or both) where he thought he could save Tory seats. Were
this so then we would be unable to make any causal inference based on estimates from this sample.
12From the 452 election results we analyze (i.e., 113 constituencies over 4 national elections) a small number of
elections (16 in total) were void after petitions. Craig (1989) reports votes cast in the original election and the winner
as determined by electoral tribunal. We follow this procedure in assigning seats and votes to parties. However, in some
cases a new election was run, usually at a much later date. In such cases we keep the results of the original election.13Our incumbency measure does not adjust for the results of by-elections.
14
To avert the suspicion that the sample of boroughs with no changes to either boundaries or seats
is biased against the Liberals - a suspicion that arises due to the disputes between historians raised
earlier- we compare our main outcomes of interest for the 1865 election across these different
groups of constituencies. In particular, in Table 6, we draw comparisons between our baseline sam-
ple shown in column 1, that includes only those constituencies without boundary or seat changes,
and two other samples: column 2 shows a sample that includes those constituencies with boundary
changes but excludes those with seat changes; and column 3 shows a sample that includes those
constituencies that experienced both seat and boundary changes.
Table 6 confirms that the Liberals were not systematically disadvantaged in those boroughs with
boundary or seat changes. Indeed, if anything, the opposite is true: the average Liberal share of in
1865 is at least as large in the sample with no changes to boundaries or seats when compared to
either of the other samples. For example, the average Liberal vote share in constituencies without
boundary or seat changes is 63%, whereas in the sample that consists of those boroughs with
either boundary or seat changes it is 52%. A simple difference in means test fails to reject the null
hypothesis of no difference on average between our baseline sample and a sample that includes
those constituencies with boundary changes but excludes those with seat changes. The difference in
means between our baseline sample and that which includes those constituencies that experienced
both seat and boundary changes is statistically significant at conventional levels. In sum, Table 6
shows that, if anything, the initial conditions in 1865 in the sample of seats that were left unaltered,
and where the inclusion of a new tranche of voters was the main and only reform of 1867, were
relatively sympathetic to the Liberals.
With regard to our other outcomes of interest we find significant differences between our base-
line sample and one which includes those constituencies that experienced both seat and boundary
changes: the share of incumbents running is on average smaller in the former; whereas the candi-
date to seat ratio, and the Liberal candidate to seat ratio is on average higher in the former. The fact
that the constituencies with no boundary or seat changes had a relatively higher ratio of Liberal
candidates to seats adds further evidence that those constituencies left unaltered were not those
were the Conservative were relatively stronger.
Taken together, the basic statistics with regard to the outcomes in 1868 reveal that the change in the
electoral rules accompanied an increase in political competitiveness and a corresponding increase
in the average constituency level share of Liberal candidates, seats, and votes. In assessing different
samples with respect to these outcomes in 1865 we do not find major differences. This then allows
us, in what follows, to focus attention on the sample of constituencies where the only change that
occurred between 1865 and 1868 was the introduction of a new tranche of voters. In the absence of
other confounding changes to the rules, we can them analyze whether there is any causal relation

15
between the change to the franchise and the key political outcomes of interest. In the following
section we discuss our empirical strategy for dealing with other possible confounding factors.
5. EMPIRICAL STRATEGY: IDENTIFYING THE EFFECT OF FRANCHISE EXTENSION ON
POLITICAL OUTCOMES
To understand how political outcomes are causally related to the change in rules governing the
eligibility to vote, we need to isolate the effect of a change in the franchise from other possibly
confounding factors. Although franchise extension was applied nationally and simultaneously in
all constituencies, the magnitude of the change at the constituency level reflects local conditions.
In particular the local impact of a change in the electoral law is related to the constituency level
distribution of income and housing in 1867. In estimating the causal effect of franchise expansion
on political outcomes we face the problem that the change in franchise is systematically related to
a set of constituency level characteristics that are likely to have an independent effect on political
outcomes. Without controlling for these confounding factors, our estimates are likely to be biased
and inconsistent.
As long as this differential impact of the reform on franchise levels is driven by community char-
acteristics that are fixed overtime (or that vary slowly), we can measure the impact of franchise
extension by comparing the differences in outcomes between communities where franchise levels
vary by different amounts. Thus, including a constant to control for the national trend in liberal
support, we estimate the following benchmark model for constituency j at time t:
△Yjt = α0 + β1 △ Log(Rjt) + ǫjt (1)
where Yjt is one of our outcomes of interest and △Yijt represents the difference between 1865
and 1868 in this indicator; △Log(Rjt) is the difference in the log of constituency level registered
voters between 1865 and 1868; and, finally, ǫi is a random error term.14
If the franchise level is the ratio of registered voters to the relevant constituency population then,
provided that the population remains fixed or its change is uncorrelated with changes in Rjt, equa-
tion (1) is similar to regressing △Yjt on the log difference in franchise levels. Because this may
not be the case we also present estimates where we control for the change in the local popula-
tion by including the (logged) difference between the population in 1861 and 1871, via the term
△Log(Pjt). Including this term we then estimate
△Yjt = α0 + β1 △ Log(Rjt) + γ △ Log(Pjt) + ǫjt. (2)
14This model in first-differences is equivalent to one in levels with constituency fixed effects and a time dummy.
16
The parameter of interest in equation (1) and (2) is β, the causal effect of changes in the franchise
on electoral outcomes.15
Our empirical strategy goes a long way towards controlling for potential confounders in the re-
lationship between franchise extension and political outcomes. It seems unlikely that, given the
abrupt and unexpected change to the constituency franchise and the immediacy of the 1868 elec-
tion, local trends in population, income, or wealth, could be systematically correlated with the
expansion in the franchise. However, our identification strategy may still suffer from concerns
about the exogeneity of our measure of franchise expansion.
The first concern relates to the registration process, when using registered electors as a measure of
enfranchised voters we do not capture all citizens who are eligible to vote. In particular,
Rjt = rjtEjt
where Ejt is eligible voters and rjt is the registration rate. If the registration rate is constant over
time across constituencies, rjt = rj , then first differencing the logarithm of this expression elim-
inates the common error. However, if this error varies over time, we are subject to the traditional
downwards bias even when measurement error is uncorrelated with Ejt. Moreover, the historical
debate suggests, as we highlighted earlier, that some of the differences in registered electors were
due to different interpretations of the franchise rules at the local level. If these differences are cor-
related with the growth or decline of liberal support at the local level our estimate will be biased
and inconsistent.
The second issue concerns reverse causality. In order to assuage social unrest, the franchise may
have been allowed to grow faster in places were social unrest and possibly liberal support was
growing faster. If this is so then our estimates will be biased upwards. One way to test this
hypothesis is by looking at the difference in electoral outcomes between 1865 and 1859 and its
correlation with the change in the local franchise between 1868 and 1865.
We tackle the potential problem of endogeneity by instrumenting the change in the difference in the
constituency electorate using the level of the electorate in 1832 and the population size in 1861.16
These variables can then be used as instruments under the assumption that they are correlated with
changes in the electorate but not directly correlated with subsequent changes in the outcomes.
15We have also estimated our models using the quasi-maximum likelihood fractional logit estimator of Papke and
Wooldridge (1996). This estimator has the advantage that it deals with a dependent variable that may include 0 and 1
and the conditional expectations of a dependent variable given an exogenous variable is estimated directly. The results
are similar to the OLS estimates we present in the paper and are presented in the supplementary material.16This is equivalent in the fixed effects strategy to instrumenting using the interaction between the year dummy and
the log (electorate 1832) and log (population 1861).

17
6. RESULTS
We begin our analysis by focussing on how the change to the electoral rules affected party compe-
tition between the Liberals and Conservatives at the constituency level. This is an important aspect
of the reform, since choices made by voters in this landmark election depended upon the menu
of options available to them which, in turn, reflected the strategic choices made by candidates
responding to their new electoral environment.
As seen in Table 5, only 63% of seats were contested by both parties in 1865, though this falls
sharply in 1868, and in some constituencies the seats were shared without an electoral contest
taking place.17 A key strategic choice facing parties was where to run their candidates (and where
not to run them) thereby allowing parties to best target their resources. Moreover, upon entering
an electoral contest a decision was made on how many candidates to run. Most constituencies in
1868 were multi-member districts, thus providing a strategic incentive for parties to run with more
than one candidate. Moreover, in this way a candidate and his running mate would share the cost
of electioneering. Doing so was not without risk, however. Voters were not constrained to cast
their votes for the same party and split-ticket voting was common. Moreover, a party that had
little chance of winning more than one seat ran the risk of splitting its vote between its candidates,
thereby handing an advantage to their opponents, if running more than a single candidate.
We present our analysis in Table 7 which shows estimates for equations (1) and (2) when exploring
the effect of the franchise extension on the ratio of candidates to seats, the share of seats that were
uncontested in each constituency and, critically, the share of candidates at the constituency level
who were Liberal.
The first effect we look at is the ratio of candidates to seats. The first column records the impact
of the change in the log of the electorate on the change in this ratio between 1865 and 1868, the
second column looks at the same outcome conditioned on the change in (the log of) constituency
population as well.18 The ratio of candidates to seats increases and by more in those areas most
affected by reform. Indeed our estimates in column 2 show that a 100% increase in the registered
electorate corresponds to a 29% rise in the ratio of the number of candidates running to seats
available.19
Part of the effect that is recorded in columns 1 and 2 of Table 6 is due to the decrease in the
number of uncontested seats. Indeed, our estimates in columns 3 and 4 show that a decrease
in uncontested seats is causally related to the impact of the reform at the constituency level. The
17See Lloyd (1965) for a history of uncontested seats between 1852 and 1910.18Recall that, since we restrict our sample to those constituencies where the number of seats remains the same, the
difference within a constituency between 1865 and 1868 is driven by an increase in the number of candidates.19Note that a 100% change in the franchise is equivalent to a change in the difference in logs, our causing variable, of
around 0.693 (i.e., ln(2)).

18
estimate in column 4 suggest that a 100% increase in the registered electorate leads to a statistically
significant 22% decrease in the share of uncontested seats. A key question is whether the overall
increase in party competition is driven by greater contestation by Liberal candidates. Our estimates
in columns 5 and 6 show that, not only is there an increase in party competition that can be causally
related to the change in the electoral rules, but that this entire effect is driven by greater contestation
by Liberal candidates.20 In short, our estimates show that more candidates ran in the areas most
affected by reforms, and that these additional candidates stood under the Liberal label.
Did the increase in contestation by Liberal candidates supply an electoral advantage to the Liberals
that can be related to the reforms? To answer this question we can explore how the reforms affected
voting at the constituency level. We present our analysis in Table 8 which shows estimates for
equations (1) and (2) when exploring the effect of the franchise extension on the constituency
share of seats won by the Liberals, the Liberal share of the vote, and voter turnout. As before,
the first column records the impact of the difference in the log of the electorate on the difference
in the share of constituency seats won by the Liberals between 1868 and 1865, whilst the second
column looks at the same outcome conditioning on the difference in (the logs of) constituency
population. Perhaps surprisingly the effect of franchise extension is negative, small and statistically
insignificant. For example, taking column 2, a 100% increase in the registered electorate leads to
a 4% fall in the share of liberal seats. Columns 3 and 4 analyze whether there is any evidence
relating the change in the constituency level franchise to the change in the Liberal share of the
constituency level vote. The estimates are positive, as expected, but the magnitude of the effect is
small and non-statistically significant. For example, in column 4, a 100% increase in the registered
electorate leads to a 4% increase in the Liberal share of the vote.
Finally, the fifth and sixth columns of Table 8 estimate the effect of franchise extension on voter
turnout. Our estimates suggest that the difference in turnout between 1865 and 1868 is somewhat
lower in areas where the impact of franchise extension was largest. When including a control for
population change we find that the a 100% increase in the registered electorate corresponds with a
7% decrease in turnout, and thus an immediate consequence of changing the electoral rules was a
slight dampen of turnout in those areas most affected by reform.
Combining the results in Tables 7 and 8 for the period 1865-1868, and once we account for a
trend toward the Liberals that affects all constituencies, as well as constituency fixed traits, we
are left with a stark conclusion: although the Liberals responded to the new electoral environment
by increasing the number of candidates running and contesting more seats, this did not feed into
20The number of candidates, the numerator in the outcome for columns 1 and 2, is the sum of candidates running
under the liberal and conservative party labels. Therefore, if the denominator in columns 1, 2, 5 and 6 is the same for
every election, the coefficient that results from regressing candidate to seat ratio against any time varying variable is
identical to the sum of the coefficients that will result using liberal candidates to seat ratio and conservative candidates
to seat ratio as outcomes. Thus, the coefficient on the franchise variable for the outcome conservative candidate to seat
ratio is the difference between column 1 (2) and 5 (6).

19
greater support for Liberal candidates or an increase in the Liberal vote share. Thus, although the
Liberals were successful in winning the election in 1868, the outcome is not causally related to the
reform of the franchise introduced in 1867.
Probing further we ask whether this result is due to strategic considerations of candidates, influ-
enced perhaps by party pressures, that arose as a result of the reforms. Was a perceived Liberal
advantage in the electoral market nullified by the reaction of Conservative candidates?
The introduction to the franchise of a large number of unskilled workers may have affected the
strategic choice of sitting incumbents whether to run again in the same constituency. A particular
source of Tory disadvantage was that, as the party of the gentry, their established candidates may
have been deemed out of touch with the concerns of the new electorate. It seems likely that such
incumbents would be less inclined to run in those constituencies where franchise extension was
largest. The replacement of these incumbents, with candidates more likely to be elected, may then
have nullified a Liberal advantage.
Our estimates, shown in Table 9, confirm that the retention of incumbents decreases in those areas
most affected by reform: for example in column 2, a 100% increase in the registered electorate in
a constituency leads to a 21% reduction in the share of incumbents running for office. However,
turning to columns (3) and (4) of Table 8 we observe, perhaps surprisingly, more than 70 percent
of this effect is driven by the change in the share of Liberal incumbents.
In the remaining columns in Table 9 we explore the impact of reform on the attrition rate of
candidates who had lost in the 1865. We fail to reject the null hypothesis that the decision of a
candidate who lost in 1865 to run in the same constituency in 1868 was unaffected by the impact of
the electoral reform in the constituency. Though we note, from Table 5, that only 7% of candidates
running in 1868 were losing candidates in 1865.
7. ROBUSTNESS CHECKS
Our estimates do not show any conclusive evidence that the Liberal victory in 1868 was related
to the change in rules governing the eligibility to vote in this election. Our findings suggest that,
although the nature of the political contest between the Liberals and Conservatives would have
been different if the old rules had remained in place in 1868, the outcome would have been the
same. In this section we assess how robust are our null findings.
7.1. Extending the sample of constituencies. We explore whether our results change when we
consider different constituency samples. Redistricting is a politically charged issue, the more so in
light of a major change in the vote eligibility requirements. For this reason, thus far, we restricted
our sample to those boroughs not affected by boundary or other changes. One might expect,

20
however, that Disraeli would leave untouched those constituencies where the Liberal vote was
growing at a relatively lower rate, whilst tampering with the boundaries and district magnitude in
other districts where the Liberal vote share was increasing. If this were true then this could indeed
account for our null estimates in this restricted sample. To explore this issue we analyze a wider
sample of constituencies and assess non-linearities in the effect of our causing variable.
In Panel A of Table 10 we assess estimates from a set of regressions based on a sample that ex-
cludes only those constituencies where district magnitude changed, (ie. we now include districts
with boundary changes). In panel B we we use a wider sample still, including also those boroughs
that received changes in the number of seats. In these regressions we account for non-linearities
by allowing for interactions between the effect of extending the franchise to the local voting pop-
ulation and other aspects of the electoral law that changed simultaneously at the district level. For
brevity we concentrate on the regressions that control for population change.
Our main results concerning the effect of franchise extension on the Liberal vote share or seat share
are unchanged in Panel A: when assessing the wider sample of constituencies, including those with
boundary changes, there is no direct effect of the difference in the local voting population upon
either of these variables, and no systematic difference between constituencies according to whether
they were affected by boundary changes or not.
In Panel B, when assessing the wider sample of constituencies, including those with boundary
and/or changes to seats, an increase in the difference in the local voting population reduces the
change in the liberal share of the vote. Moreover it does so in precisely those constituencies
affected by boundary changes. The effect of an increase (difference) in the local franchise is not
that expected if the hypothesis that Disraeli was able to strategically manipulate the Liberal vote
were true. Whilst we would then expect that the difference in the Liberal vote share is greater in
those areas where boundary and seat changes were implemented, the opposite is in fact true: our
result shows a coincidence between those constituencies where the change in the franchise had a
negative effect on Liberal performance and districts where the boundary commission altered the
constituency contours. This evidence refutes the suspicion that Disraeli manipulated boundaries
where Liberal support was growing at a relatively faster rate. And it offers confirmation that that
our earlier null results are not an artefact of sample selection.
Turning to our other indicators of political competition, we find no evidence of an effect of chang-
ing the franchise in the estimates shown in Panel A. We find a direct effect on the Liberal share of
candidates of a similar magnitude to that reported earlier. Similarly, we find that the difference in
the constituency level franchise is associated with a decrease in the number of uncontested seats,
and an increase in the candidate seat ratio. However here we show that this occurred in precisely
those areas where there was a change to the number of district level seats available.

21
7.2. Are the differences in 1865-1859 outcomes associated with franchise extension? As dis-
cussed earlier, a possible problem with our analysis occurs if the change in the constituency level
electorate is systematically related to the growth in previous Liberal vote share in those constituen-
cies. If this were so then we could not reasonably claim that the treatment is exogenously assigned;
correspondingly, estimates derived from an analysis of equations (1) and (2) would be biased and
inconsistent.
To analyze the validity of our assumption, we study the correlation between our key measure,
difference in the log of the relative voting populations in 1865 and 1868, and the difference in
outcomes between the 1865 election and the 1859 election. If the impact of franchise reform on
the voting population was greater (smaller) in places where Liberal support was grew strongly
(weakly) we would expect a positive (negative) association between the difference in outcomes in
1865-1859 and the difference in log electorates in 1868-1865.
In Table 11 we present the result of our analysis. For brevity we concentrate on the regressions that
control for population change. Reassuringly, for our main measures of liberal strength, namely
the Liberal share of the vote and the Liberal share of constituency level seats, the estimates are
small and we are unable to reject the null hypothesis of no association between these variables.
Furthermore, there is no evidence of a statistically significant association between the candidate
seat ratio or the share of uncontested seats.
There is, however, a positive correlation between the difference in share of incumbents variables
between 1865 and 1859 and the log difference in the electorate between 1868 and 1865. This
association implies that the franchise grew by more in the constituencies where the share of lib-
eral incumbents was higher. This is likely to bias upwards the effect of franchise extension on
incumbency rates. Our instrumental variables results confirm this suspicion.
7.3. Instrumental variables estimates. An empirical strategy that can plausibly deal with biases
that arise due to reverse causality, as well as those that are due to measurement error, involve the
use of instrumental variables. We instrument the log difference in electorates using the (log) level
of the electorate in 1832 and the (log) population size in 1861. These variables can be used as
instruments under the assumption that they are correlated with changes in the electorate but not
directly correlated with subsequent changes in the outcomes.
The first-stage was presented in Table 4, the F-test for the excluded variables is around 20. In
Table 12 we replicate the analysis of Tables 6, 7 and 8 using our instruments. For brevity we
concentrate on the regressions that control for population change. Our findings from Table 6
concerning the relationship between the extension of the franchise and differences in the nature
of two-party competition at the constituency level continues to hold, though the estimates are now
larger in magnitude: a 100% increase in the registered electorate leads to a 63% decrease in the

22
share of uncontested seats and a 45% increase in the candidate to seat ratio, with almost all of this
effect picked up by an increase in the number of Liberal candidacies.
In relation to the election results our conclusion remains unchanged. There is no evidence of a
liberal advantage as a consequence of franchise extension. The increase in the franchise leads to a
relatively small and still statistically insignificant increase in the liberal advantage. For example, a
100% increase in the franchise leads to an increase in the Liberal vote share of around 15% though
this estimate is statistically insignificant.
The analysis in the previous sub-section highlighted an issue of concern in relation to the positive
relationship between the difference in incumbency rates in 1865-1859 and the magnitude of fran-
chise extension. As we predicted this was likely to bias downwards our estimates from Table 7.
Our instrumental variables estimate suggest now that a doubling of the franchise leads to a 68%
decrease in the share of seats contested by siting incumbents, of which around 62% is accounted
for by non-contestation amongst Liberal incumbents.
It is worth pointing out that in all cases, we cannot reject the overidentifying assumptions at a 10
per cent level of statistical significance.
7.4. Long run effects of the reform. In Table 13 we analyze the political outcomes of the 1874
election with respect to those of 1865 and their relation to the constituency level difference in
the voting population (1874-1865). This is a particularly interesting exercise not only because it
allows us to see long run effects of the reform but also because the 1874 election is the first after
the passing of the Secret Ballot Act (1872).
We find no effect, even in the longer term, of franchise extension on the Liberal share of the vote
and the Liberal share of constituency seats. However, whilst we are unable to find a direct effect on
our key indicators of Liberal strength, we again find evidence that the change in the electoral rules
did affect party and candidate competition at the constituency level: a doubling of the franchise
level lead to a 24% increase in the ratio of candidates to seats, a 20% reduction in contested seats
at the constituency level and a 19% reduction in the share of seats contested by incumbents.
In contrast to our findings for the 1868 election, it appears that most of the increase in the candidate
to seat ratio at the constituency level is driven by an increase in Conservative candidates. This
finding is in line with the way historians have characterized the reaction of the Conservative party
to the expansion of the voting population. As noted by St John (2006), in his biography of the
Conservative leader, Disraeli realized that extension of the franchise placed an onus on effective
party organization. He hired John Gorst to act as electoral agent of the party and as head of the
new Conservative Central Office which provided a central register from which local Conservative
associations could select candidates. In addition, local conservative associations were encouraged
to form under the umbrella of a National Conservative Union. The net result was that in the 1874

23
election the Conservatives were able to contest 63 previously uncontested Liberal seats. Indeed,
and as shown by (Hanham, 1959), a key effect of the Reform Act was the development of national
party organizations able to support country-wide candidacies and campaigning activities.
8. LEGISLATIVE BEHAVIOR AND FRANCHISE EXTENSION: THE CASE OF THE ABOLITION
OF CHURCH RATES BILL
Whilst we have found that Tory incumbents, unlike their Liberal counterparts, were not less likely
to run in those areas most affected by the extension of the franchise, electoral reform may have
impacted their behavior in other ways. In particular, Conservative incumbents may have adapted
their views in order to appeal to their new electorate. We should perhaps not overestimate the
strength of the link between parliamentary activity and constituency level electoral behavior. Nev-
ertheless, Mitchell and Cornford (1977) show that “the activities of MPs, particularly local MPs,
were closely monitored in the local press” and provide evidence that local voting in Cambridge did
reflect the parliamentary activities of representatives.
To explore this issue we turn our gaze away from our data concerning the electoral contest in 1868
and in previous years, to analyze the parliamentary voting behavior of Members of Parliament
(MPs) in this period. We ask whether differences in the constituency level electorate that were re-
lated to franchise extension are related to differences in parliamentary voting behavior.21 Different
empirical strategies could be deployed to detect changes in voting behavior that may, in turn, be
related to the extension of the franchise. We might, for example, analyze the roll-call behavior
of those Members of Parliament elected in both 1865 and 1868 to discern any differences across
time in their voting record. Doing so would, however, yield biased estimates since the retention
of incumbents in 1868 may reflect their voting record: a Conservative MP with a relatively liberal
voting record in the period between 1865 and 1868, may have been elected by his new constituents
because of his voting record. A related problem with analyzing voting behavior over different par-
liaments is that the historical record suggests that the agenda being voted on changed dramatically
between the premierships of Derby and Disraeli on the one hand, and Gladstone on the other. The
latter introduced a programme of reform in many areas of social and economic life far more rad-
ical than that of his predecessors. Differences in an MPs voting behavior may then simply reflect
differences in what was on offer, rather than changes in his immediate constituency.
An alternative empirical strategy, that gets round these problems, is to assess the voting records
of the same cohort of MPs before and after the introduction of the Second Reform Act and on
the same set of bills. To this end, we focus our attention on the Abolition of Church Rates Bill
introduced in the Parliamentary sessions of 1866 and 1867.
21A similar question is asked in recent work done on a different context by Gailmard and Jenkins (2009). They analyze
roll-call behavior of US senators prior to and after the introduction of the 17th Amendment.

24
Church rates were personal taxes on property owners that were used to support the established
church. There was popular agitation to abolish them and support for abolition divided along reli-
gious and class lines: wealthier property owners tended to be members of the Church of England,
vote Conservative, and supportive of the rates; by contrast, dissenters who opposed the tax tended
to be found in the poorer sectors of the population. These divisions were found in both boroughs
and Counties, with the latter described in following excerpt from Hansard:
“On the one side you have the supporters of the rate, the majority of the parishioners, including
the squire, the clergy of the parish, and other residents, who in the County Directory are called the
gentry. On the other side you have what, on the same authority, are called traders; you have the
small farmers, the small village shopkeepers, and other persons in a lower grade of society. It is
from this second class that the opponents of the church rate are mostly drawn.”
In the Commons, votes on the bill divided along party lines also. The proposal to abolish rates
had failed to pass second reading in 1865 under the Liberal government, with opposition from the
Conservatives and some members of the Whig gentry aligned with the Liberals. It was introduced
again in 1866 where it passed on second reading - by 285 votes to 252- despite Conservative
opposition. Due to the constraints of the parliamentary timetable, the bill was not pushed through
to third reading. The Abolition of Church Rates Bill was reintroduced in 1867, where it passed
second reading with a larger majority. 22
Two aspects are of immediate interest. The first is the difference in the outcome of the vote in
1866 and that of 1867.23In both cases the bill passed its second reading. However, in 1866 there
were 252 “Noes”, whereas, and by contrast, in 1867 there were only 187 (and 263 “Ayes”). A
further aspect of interest is the timing of the 1867 bill. The second reading of the Abolition of
Church Rates Bill was voted on in Parliament on March 15th, 1867, one month after the Queen’s
speech which anticipated a policy that “without unduly disturbing the balance of political power
shall freely extend the electoral franchise,” and Disraeli’s reading of the Second Reform Act on the
floor of the House.24 The question then arises whether MPs who had previously opposed abolition
changed their behavior, by either voting in favor or abstaining from the final vote, when faced with
an increase in opposition to the Bill amongst their constituents.
Table 14 tabulates the votes on the bill from our sample of 321 MPs that belong to boroughs who
appear in all elections from 1859 to 1874.25 Of the 100 who voted “No” in 1866, 38 abstained in
1867. Out of 183 MPs who voted “Aye” in 1866, only 37 members abstained in 1867. The largest
22The bill was rejected by the Lords and Church Rates were abolished by the new parliament in 1868.23Information for the 1866 and 1867 votes was obtained from http://hansard.millbanksystems.com/.24The second reading in 1866 was voted on March 7.25Of the 335 elected MPs in 1865 for our sample of 207 Boroughs, 14 members were either made peers, had their
election declared void, resigned, or passed away.

25
change is then in the number of MP’s who, though voting “No” in 1866, chose to abstain in 1867,
where we define abstention as neither voting “Aye” or “No” in each particular vote.
Does the forthcoming increase in the franchise lead to a decrease in the likelihood of voting “No”?
To answer this question, we coded a dummy variable 1 if the MP had voted “No” in 1866 and
zero otherwise, a similar variable is coded for 1867 and we use their difference as the outcome of
interest. As in our previous analysis we regress this outcome on the difference in (log) electorate
between 1868 and 1865 at the constituency level. Estimates of this model, that are presented in
Table 14, reveal in general negative but small and statistically insignificant effects of franchise
extension on the voting behavior of MPs. The results are independent of whether we include con-
trols for population change or look at samples that include constituencies that will suffer boundary
changes or changes in the number of seats.26
9. CONCLUSION
The Second Reform Act of 1867, a major turning point in British history, is associated with the
election of the first unequivocally Liberal government on a reforming agenda. The association
between the reform, on the one hand, and the immediate electoral outcome, on the other, plays an
important role as supporting evidence for an influential theory of electoral reform. Acemoglu and
Robinson (2000) suggest that franchise extension was introduced to ameliorate pressure for more
radical political and economic change. The fact that the reform was sponsored by the Conservative
Party despite their subsequent defeat, and, more importantly, introduced in such a way that the
vote increased by more in urban areas seen to be sympathetic to the Liberals, lends support to their
theory. And yet, a careful investigation of the data does not support the claim that the 1867 reform
benefited the Liberals in 1868 election and so casts doubt upon this evidence. Despite the signifi-
cance of the Act, when controlling for a trend towards the Liberals that affects all constituencies,
as well as local fixed traits, there is no evidence that the outcome of the 1868 election was in fact
related to the change in the franchise rules.
It is possible that this result reflects the imprecise way in which franchise reform translated into the
allocation of votes at the constituency level. Although the voting population increased dramatically
as a result of the 1867 reform, the constituency level variation in the impact of the reforms reflects
the workings of what Davis and Tanner (1996) call a “capricious system” that left many men
who, in principle, were entitled to vote, nevertheless unable to. We show that, even when taking
account of the uneven impact of the reforms that arose due to local difficulties in administrating the
new franchise rules, the reforms had little impact on the Liberal vote share in 1868. Of course it is
possible that the impact of the reforms was delayed. The full impact of the Second Reform Act may
26We condition on the difference in the number seats in columns (1) and (2). The results are similar when not condi-
tioning on this difference.

26
not have been felt until the administrative problems were ironed out and the number of registered
voters, in the Metropolitan boroughs in particular, more closely approximated the eligible voting
population. Our analysis casts doubt on this assertion: even when taking account of error in our
measure of franchise extension, there is no discernable effect of the change in the rules upon the
Liberal vote share.
It is implausible, however, that the Second Reform Act had no effect on the electoral and political
outcomes in 1868. Indeed Cox (1987) shows that a large number of factors affecting the electoral
connection between citizens and representatives changed in Victorian England. These included
amongst other things the number of contested seats and the percentage of incumbents standing.
We provide a similarly wide lense through which to investigate the effect of reforms and isolate the
specific effect of changes to the franchise rules from broader trends and other confounding factors.
The evidence clearly shows that the major impact of the franchise extension was in increasing
political competition at the constituency level: more seats became open to contestation and this
effect is causally related to a change in the franchise rules. Initially the Liberal party were well
placed to take advantage, running more candidates in those areas where the franchise increased
by the most. Over the longer term (1865-74) it was the Conservative Party that were quicker to
adapt, by developing their local organizations in those boroughs were the franchise effects were
largest. A key lesson for political scientists that emerges from our analysis is that the effect of
electoral reform, whilst not immediately observable in the subsequent electoral outcomes, operates
via different channels of party competition.
REFERENCES
Acemoglu, D. and J. A. Robinson (2000). Why did the west extend the franchise? democracy,
inequality, and growth in historical perspective. The Quarterly Journal of Economics 115(4),
1167–1199.
Aidt, T. S., M. Daunton, and J. Dutta (2009). The retrenchment hypothesis and the extension of
the franchise in england and wales. Forthcoming The Economic Journal.
Aidt, T. S. and P. S. Jensen (2009). The taxman tools up: an event history study of the introduction
of the personal income tax. Journal of Public Economics 1-2, 160–175.
Boix, C. (2001). Democracy, development and the public sector. The American Journal of Political
Science 45(1), 1–17.
Boix, C. (2003). Democracy and Redistribution. New York: Cambridge University Press.
Bowley, A. (1937). Wages and Income in the United Kingdom since 1860. Cambridge: Cambridge
University Press.
Cox, G. (1987). The Efficient Secret: The Cabinet and the Development of Political Parties in
Victorian England. Cambridge: Cambridge University Press.

27
Craig, F. (1989). British Parliamentary Election Results,1832-1885, 2nd edition. Aldershot: Par-
liamentary Research Services.
Davis, J. and D. Tanner (1996). The borough franchise after 1867. The Historical Journal 69(2),
306–327.
Gailmard, S. and J. D. Jenkins (2009). Agency problems, the 17th ammendment, and representa-
tion in the senate. American Journal of Political Science 53(2), 324–343.
Gash, N. (1953). Politics in the Age of Peel: A Study in the Technique of Parliamentray Represen-
tation. London: Longmans Green.
Hanham, H. (1959). Elections and party management. London: Longmans Green.
Himmelfarb, G. (1966). The politics of democracy: The english reform act of 1867. Journal of
British Studies 6, 97–138.
Husted, T. and L. Kenny (1997). The effect of the expansion of the voting franchise on the size of
government. Journal of Political Economy 105, 54–83.
Jenkins, R. (1996). Gladstone: A Biography. San Val.
Lindert, P. (2004). Growing Public: Social Spending and Economic Growth since the Eighteenth
Century, Volumes I and II. New York: Cambridge University Press.
Lindert, P. H. (1994). The rise of social spending, 1880 - 1930. Explorations in Economic His-
tory 31, 1–37.
Lizzeri, A. and N. Persico (2004). Why did the elites extend the suffrage? democracy and the
scope of government, with an application to britain’s age of reform. The Quarterly Journal of
Economics 119(2), 707–65.
Lloyd, T. (1965). Uncontested seats in british elections. The Historical Journal 8(2), 260–265.
Mackenzie, W. (1921). Changes in the standard of living in the uk, 1860-1914. Economica (3),
211–230.
Maclean, I. (2001). Rational Choice and British Politics. An Analysis of Rhetoric and Manipulation
from Peel to Blair. Oxford: Oxford University Press.
Mitchell, J. and J. Cornford (1977). The political demography of cambridge. Albion: A Quarterly
Journal Concerned with British Studies 9(3), 1832–1868.
Papke, L. E. and J. Wooldridge (1996). Econometric methods for fractional response variables with
an application to 401(k) plan participation rates. Journal of Applied Econometrics 11, 619–632.
Scheve, K. and D. Stasavage (2008). The conscription of wealth: Mass warfare and the demand
for progressive taxation. Working Paper.
Seymour, C. (1915). Electoral Reform in England and Wales. New Haven: Yale University Press.
St John, I. (2006). Disraeli and the Art of Victorian Politics. Anthem Press.
Vincent, J. (1968). Pollbooks: How Victorians Voted. Cambridge: Cambridge University Press.
Vincent, J. and M. Stenton (1971). McCalmont’s Parliamentray Poll Book, 8th edition. Harvester.
Whitfield, R. (2001). The Extension of the Franchise, 1832-1931. Oxford: Heineman.

Fig
ure
1: A
tim
elin
e of
Maj
or E
lect
oral
Ref
orm
s in
th
e U
K
First Reform
Act (1832):
Extended representation in
urban areas, elim
inated
“rotten boroughs” and
extended the qualifications for
voting
Ballot Act (1872): Introduced
the secret ballot
Corrupt and Illegal Practices
Prevention Act (1883):
Introduced campaign
spending limits
Reform
Act (1884): Allowed
people in counties to vote on
the same basis as those in
towns
Reform
Act (1918): Abolished
property qualifications for
men and introduced limited
female suffrage
1830
1840
1850
1860
1870
1880
1890
1900
1910
1920
1930
First Reform
Act (1832):
Extended representation in
urban areas, elim
inated
“rotten boroughs” and
extended the qualifications for
voting
Second Reform
Act (1867):
Widened the franchise and
adjusted representation to be
more equitable
Ballot Act (1872): Introduced
the secret ballot
Corrupt and Illegal Practices
Prevention Act (1883):
Introduced campaign
spending limits
Reform
Act (1884): Allowed
people in counties to vote on
the same basis as those in
towns
Reform
Act (1885): Split m
ost
multi-member constituencies
into m
ultiple single-m
ember
ones
Reform
Act (1918): Abolished
property qualifications for
men and introduced limited
female suffrage
Reform
Act (1928): W
idened
suffrage by giving women
electoral equality with m
en
1830
1840
1850
1860
1870
1880
1890
1900
1910
1920
1930

Fig
ure
2:
Cha
nge
s a
nd t
he L
eve
l of
Enf
ranc
hise
d P
opul
atio
n in
Bor
ough
s (1
865-
1868
)
0.51Density
0.5
11
.52
Pan
el A
: W
ithin
Co
nst
ituen
cy D
iffere
nce
in L
og(E
lect
ora
te),
186
8-1
86
5
0.51Density
0.5
11
.52
Pan
el A
: W
ithin
Co
nst
ituen
cy D
iffere
nce
in L
og(E
lect
ora
te),
186
8-1
86
5
05101520Density
0.1
.2.3
Pan
el B
: E
lect
ora
te/P
opu
latio
n
1
865
1
868

Fig
ure
3: L
iber
al E
lect
oral
Sup
port
Und
er th
e N
ew F
ranc
hise
(18
68-1
865)
-.20.2.4Difference in Share of Liberal Votes
Fig
ure
3: L
iber
al E
lect
oral
Sup
port
Und
er th
e N
ew F
ranc
hise
(18
68-1
865)
-.4-.20.2.4Difference in Share of Liberal Votes
0.5
11
.52
Diffe
rence
in
Lo
g(E
lect
ora
te)
No
te:
Ea
ch s
qu
are
re
pre
sen
ts a
dif
fere
nt
con
stit
ue
ncy
, th
e s
up
eri
mp
ose
d lin
e a
re
fitt
ed
va
lue
s fr
om
a lin
ea
r m
od
el a
nd
th
e g
rey
are
a is
a 9
5%
co
nfi
de
nce
in
terv
al o
f
the
pre
dic
ted
me
an
.

Yea
rE
ngla
ndS
cotla
ndW
ales
Bor
ough
sC
ount
ies
1859
900,
059
105,
608
56,0
3349
1,44
657
0,25
418
6597
0,07
610
5,06
961
,656
544,
661
592,
140
1868
1,88
0,36
823
1,37
612
7,38
51,
369,
848
869,
281
Cou
ntry
Loca
tion
Tab
le 1
: Reg
iste
red
Ele
ctor
ate
1868
1,88
0,36
823
1,37
612
7,38
51,
369,
848
869,
281
1874
2,09
7,20
627
1,24
013
7,14
31,
594,
732
910,
857
Tab
le 1
: Reg
iste
red
Ele
ctor
ate
Sou
rce:
Ow
n ca
lcul
atio
ns b
ased
on
data
from
Cra
ig(1
989)
.
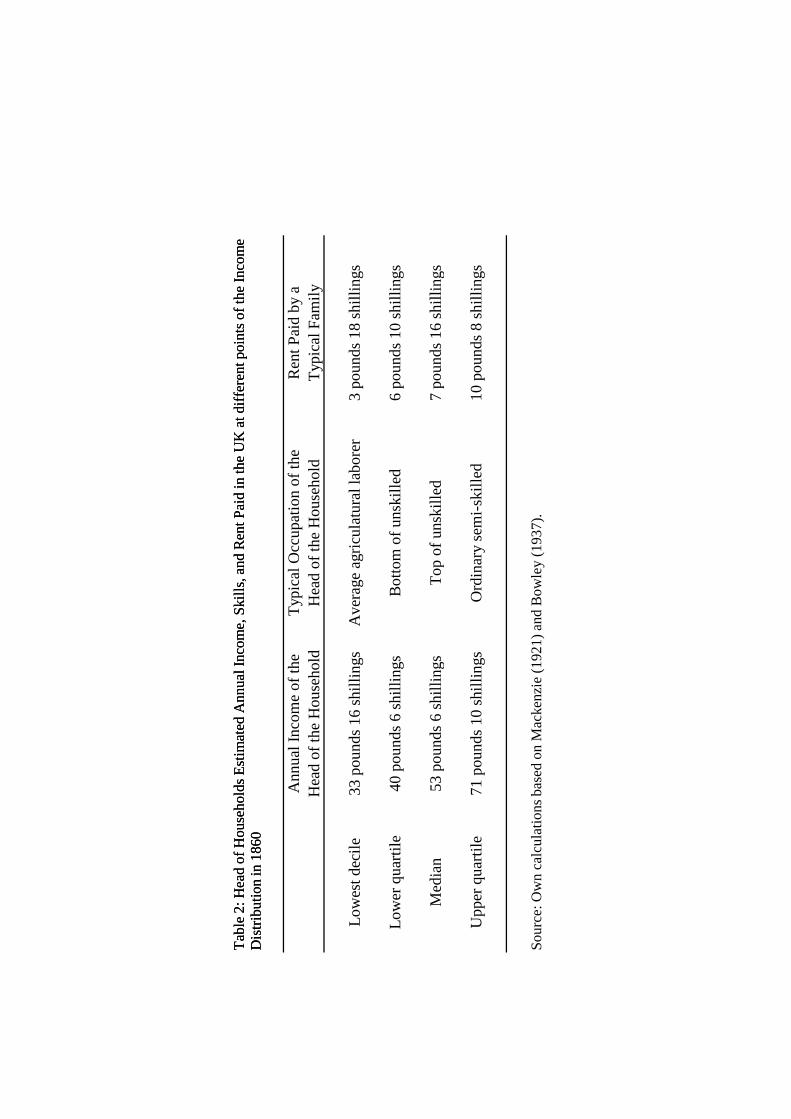
Ann
ual I
ncom
e of
the
Typ
ical
Occ
upat
ion
of th
eR
ent P
aid
by a
Hea
d of
the
Hou
seho
ldH
ead
of th
e H
ouse
hold
Typ
ical
Fam
ily
Low
est d
ecile
33 p
ound
s 16
shi
lling
sA
vera
ge a
gric
ula
tura
l lab
orer
3 po
unds
18
shill
ings
Low
er q
uart
ile40
pou
nds
6 sh
illin
gsB
otto
m o
f uns
kil
led
6 po
unds
10
shill
ings
Med
ian
53 p
ound
s 6
shill
ings
Top
of u
nski
lled
7 po
unds
16
shill
ings
Tab
le 2
: Hea
d of
Hou
seho
lds
Est
imat
ed A
nnua
l Inc
ome,
Ski
lls, a
nd R
ent P
aid
in th
e U
K a
t diff
eren
t poi
nts
of th
e In
com
e D
istr
ibut
ion
in 1
860
Med
ian
53 p
ound
s 6
shill
ings
Top
of u
nski
lled
7 po
unds
16
shill
ings
Upp
er q
uart
ile71
pou
nds
10 s
hilli
ngs
Ord
inar
y se
mi-s
kille
d10
pou
nds
8 sh
illin
gs
Tab
le 2
: Hea
d of
Hou
seho
lds
Est
imat
ed A
nnua
l Inc
ome,
Ski
lls, a
nd R
ent P
aid
in th
e U
K a
t diff
eren
t poi
nts
of th
e In
com
e D
istr
ibut
ion
in 1
860
Sou
rce:
Ow
n ca
lcul
atio
ns b
ased
on
Mac
kenz
ie(1
921)
and
Bow
ley
(193
7).

Con
stitu
enc
ies
Se
ats
Con
stitu
enc
ies
Se
ats
Tot
al i
n 18
59 e
lect
ion
220
356
111
189
Tot
al i
n 18
65 e
lect
ion
221
357
112
192
Tot
al i
n 18
68 e
lect
ion
222
327
127
219
Tot
al i
n 18
74 e
lect
ion
220
323
127
219
Tot
al i
n co
nstit
uenc
ies
tha
t a
ppe
ar
in 1
859,
186
5,
1868
& 1
874
207
308†
9716
6
Bor
ough
sC
ount
ies
Tab
le 3
: Tot
al N
umbe
r of
Con
stitu
enci
es a
nd S
eats
in E
ngla
nd,
Sco
tland
, and
Wal
es (
1859-1
874)
Tot
al i
n co
nstit
uenc
ies
tha
t a
ppe
ar
in 1
859,
186
5,
1868
& 1
874
207
308†
9716
6T
ota
l in
cons
titue
ncie
s w
ithou
t ch
ang
es
in s
ea
ts,
185
9-18
7416
425
297
166
Tot
al i
n co
nstit
uenc
ies
with
out
cha
nge
s in
se
ats
an
d no
bou
nda
ry c
hang
es,
185
9-18
7411
317
160
95
Tab
le 3
: Tot
al N
umbe
r of
Con
stitu
enci
es a
nd S
eats
in E
ngla
nd,
Sco
tland
, and
Wal
es (
1859-1
874)
Sou
rce:
Ow
n ca
lcul
atio
ns b
ased
on
data
fro
m C
raig
(19
89).
Not
es: †
The
num
ber
of s
eats
cor
resp
onds
to
the
1868
-187
4 pe
riod
. In
the
1859
-186
5 pe
riod
the
re w
ere
335
seat
s.

(1)
(2)
(3)
(4)
(5)
(6)
Log
(Ele
ctor
ate
1832
)-0
.138
***
-0.1
33**
*-0
.324
***
-0.29
6***
[0.0
28]
[0.0
26]
[0.0
53]
[0.0
53]
Log
(Pop
ulat
ion
1861
)-0
.053
-0.0
60*
0.20
5***
0.17
8***
[0.0
34]
[0.0
32]
[0.0
56]
[0.0
55]
F-t
est j
oint
sta
tistic
al s
igni
fican
ce o
f the
2 c
ont
rols
22.0
719
.78
p-va
lue
0.00
010.
0001
Dep
ende
nt v
aria
ble:
Log
(Ele
ctor
ate
1868
) -
Log(
Ele
ctor
ate
1865
)
Tab
le 4
: Exp
lain
ing
the
Cha
nge
in E
lect
orat
es in
Eng
lish,
Wel
sh a
nd S
cot
tish
Bor
ough
s, 1
868-
1865
p-va
lue
0.00
010.
0001
Obs
erva
tions
113
113
113
113
113
113
R-S
quar
ed0.
150.
213
0.02
50.
106
0.25
50.
288
Con
trol
Pop
ulat
ion
Cha
nge?
No
Yes
No
Yes
No
Yes
Sou
rce:
Cra
ig(1
989)
and
Vin
cent
and
Ste
nton
(19
71).
Not
es: O
LS r
egre
ssio
ns. A
ll re
gres
sion
s in
clud
e a
cons
tant
.***
indi
cat
es s
tatis
tical
sig
nific
ance
at 1
%, *
* at
5%
, and
* a
t 10%
. Rob
ust
stan
dard
err
ors
are
in p
aren
thes
es.
Tab
le 4
: Exp
lain
ing
the
Cha
nge
in E
lect
orat
es in
Eng
lish,
Wel
sh a
nd S
cot
tish
Bor
ough
s, 1
868-
1865

Yea
r:N
Mea
nS
DN
Mea
nS
DN
Mea
nS
DN
Mea
nS
D
Ele
cto
rate
11
32
41
84
22
31
13
26
28
46
65
11
35
71
57
32
21
13
65
86
82
37
Sh
are
Lib
eral
Sea
ts1
13
0.6
90
.42
11
30
.73
0.4
01
13
0.7
70
.37
11
30
.57
0.4
4S
har
e Li
ber
al V
ote
54
0.6
80
.22
71
0.6
30
.20
87
0.6
60
.19
98
0.5
50
.19
Vo
ter
Tu
rno
ut
54
0.7
30
.14
71
0.7
30
.14
87
0.7
40
.15
98
0.7
50
.1
4C
and
idat
e S
eat R
atio
11
31
.38
0.4
31
13
1.5
10
.47
11
31
.70
0.
49
11
31
.85
0.4
6S
har
e U
nco
nte
sted
Sea
ts1
13
0.5
20
.50
11
30
.37
0.4
91
13
0.2
30
.42
11
30
.13
0.3
4Li
ber
al C
and
idat
e S
eat R
atio
11
30
.88
0.5
11
13
0.9
70
.42
11
31
.12
0.4
31
13
1.0
60
.38
18
59
18
65
18
68
18
74
Ta
ble
5:D
esc
riptiv
e S
tatis
tics
Lib
eral
Can
did
ate
Sea
t Rat
io1
13
0.8
80
.51
11
30
.97
0.4
21
13
1.1
20
.43
11
31
.06
0.3
8S
har
e In
cum
ben
t1
13
0.7
70
.37
11
30
.57
0.4
51
13
0.6
70
.43
11
30.6
00
.42
Sh
are
Lib
eral
Incu
mb
ent
11
30
.59
0.4
31
13
0.4
00
.43
11
30
.53
0.4
51
13
0.4
30
.42
Sh
are
Lose
rs1
13
0.0
60
.18
11
30
.05
0.1
31
13
0.0
70
.15
11
30
.07
0.1
5S
har
e Li
ber
al L
ose
rs1
13
0.0
30
.12
11
30
.02
0.0
91
13
0.0
50
.1
31
13
0.0
30
.09
Ta
ble
5:D
esc
riptiv
e S
tatis
tics
So
urc
e: O
wn
ca
lcu
latio
ns
ba
sed
on
da
ta fr
om
Cra
ig (
19
89
) a
nd
Vin
cen
t an
d S
ten
ton
(1
97
1).

Sam
ple
:
p-v
alu
ep
-val
ue
NM
ean
SD
NM
ean
SD
diff
eren
ceN
Mea
nS
Dd
iffer
ence
Ele
ctor
ate
11
32
62
84
66
55
12
51
04
81
90
.88
43
24
89
54
14
0.8
8Lo
g(E
lect
orat
e 1
86
8)
- Lo
g(E
lect
orat
e 1
86
5)
11
30
.94
0.3
45
11
.06
0.4
60
.12
43
0.8
80
.35
0.2
9S
har
e Li
ber
al S
eats
11
30
.73
0.4
05
10
.70
0.4
00
.66
43
0.5
50
.42
0.0
2S
har
e Li
ber
al V
ote
71
0.6
30
.20
27
0.6
30
.17
0.9
72
60
.52
0.2
80
.06
Vot
er T
urn
out
71
0.7
30
.14
27
0.7
50
.11
0.3
82
60
.70
0.1
10
.33
Can
did
ate
Sea
t Rat
io1
13
1.5
10
.47
51
1.4
30
.46
0.2
94
31
.37
0.3
60
.05
No
bou
nd
ary
chan
ges-
Bou
nd
ary
chan
ges-
Ch
ange
in s
eat
sN
o ch
ange
in s
eats
No
chan
ge in
sea
ts
Tab
le 6
:Des
crip
tive
Sta
tistic
s fo
r d
iffer
ent
sam
ple
s in
18
65
Can
did
ate
Sea
t Rat
io1
13
1.5
10
.47
51
1.4
30
.46
0.2
94
31
.37
0.3
60
.05
Sh
are
Un
con
test
ed S
eats
11
30
.37
0.4
95
10
.47
0.5
00
.24
43
0.4
00
.49
0.7
9Li
ber
al C
and
idat
e S
eat R
atio
11
30
.97
0.4
25
10
.92
0.3
70
.4
64
30
.81
0.4
50
.05
Sh
are
Incu
mb
ent
11
30
.57
0.4
55
10
.60
0.4
20
.71
43
0.6
90
.33
0.0
8S
har
e Li
ber
al In
cum
ben
t1
13
0.4
00
.43
51
0.4
80
.45
0.2
74
30
.41
0.3
50
.90
Sh
are
Lose
rs1
13
0.0
50
.13
51
0.0
70
.18
0.4
34
30
.03
0.1
00
.24
Sh
are
Lib
eral
Los
ers
11
30
.02
0.0
95
10
.03
0.1
60
.64
43
0.0
30.1
00
.90
Tab
le 6
:Des
crip
tive
Sta
tistic
s fo
r d
iffer
ent
sam
ple
s in
18
65
So
urce
: Ow
n ca
lcul
atio
ns b
ased
on
dat
a fr
om
Cra
ig (
19
89
) an
d V
ince
nt a
nd S
tent
on
(19
71
).N
ote
s: p
-val
ue d
iffer
ence
are
th
e p
-val
ues
of
t-t
est
s fo
r d
iffer
ence
in m
eans
with
une
qua
l var
iana
ces
bet
wee
n th
e no
bo
und
ary-
cha
nge
s -n
o c
hang
e in
se
ats
sam
ple
and
th
e o
ther
two
sam
ple
s re
spec
tivel
y.

(1)
(2)
(3)
(4)
(5)
(6)
∆ lo
g(el
ecto
rate
)0.
358*
*0.
417*
**-0
.257
*-0
.312
**0.
359**
0.40
7***
[0.1
55]
[0.1
46]
[0.1
41]
[0.1
33]
[0.1
48]
[0.1
40]
Obs
erva
tions
113
113
113
113
113
113
R-S
quar
ed0.
047
0.06
30.
028
0.04
40.
065
0.08
seat
rat
ioun
cont
este
d se
ats
cand
idat
e se
at r
atio
Dep
ende
nt v
aria
ble:
∆
can
dida
te∆
sha
re∆
libe
ral
Tab
le 7
: Par
ty C
ompe
titio
nUnd
er th
e N
ew F
ranc
hise
(18
68-186
5)
R-S
quar
ed0.
047
0.06
30.
028
0.04
40.
065
0.08
Con
trol
Pop
ulat
ion
Cha
nge?
No
Yes
No
Yes
No
Yes
Tab
le 7
: Par
ty C
ompe
titio
nUnd
er th
e N
ew F
ranc
hise
(18
68-186
5)
Sou
rce:
Cra
ig(1
989)
and
Vin
cent
and
Ste
nton
(19
71).
Not
es: O
LS r
egre
ssio
ns.
All
regr
essi
ons
incl
ude
a co
nsta
nt t
erm
.***
indi
cate
s st
atis
tical
sig
nific
ance
at
1%, *
* at
5%
, an
d *
at 1
0%.
Rob
ust s
tand
ard
erro
rs a
re in
par
enth
eses
.

(1)
(2)
(3)
(4)
(5)
(6)
∆ lo
g(el
ecto
rate
)-0
.022
-0.0
530.
078
0.05
9-0
.076
-0.0
95*
[0.1
15]
[0.1
20]
[0.0
68]
[0.0
67]
[0.0
52]
[0.0
57]
Obs
erva
tions
113
113
6262
6262
R-S
quar
ed0.
001
0.01
0.03
10.
074
0.03
60.
094
of li
bera
l sea
tslib
eral
vot
etu
rnou
t
Dep
ende
nt v
aria
ble:
∆ s
hare
∆ s
hare
∆ v
oter
Tab
le 8
: Ele
ctor
al O
utco
mes
Und
er th
e N
ew F
ranc
hise
(18
68-1
865)
R-S
quar
ed0.
001
0.01
0.03
10.
074
0.03
60.
094
Con
trol
Pop
ulat
ion
Cha
nge?
No
Yes
No
Yes
No
Yes
Tab
le 8
: Ele
ctor
al O
utco
mes
Und
er th
e N
ew F
ranc
hise
(18
68-1
865)
Sou
rce:
Cra
ig(1
989)
and
Vin
cent
and
Ste
nton
(19
71).
Not
es: O
LS r
egre
ssio
ns. A
ll re
gres
sion
s in
clud
e a
cons
tant
term
. ***
indi
cate
s st
atis
tical
sig
nific
ance
at 1
%, *
* at
5%
, and
* a
t 10%
. Rob
ust s
tand
ard
erro
rs a
re in
par
enth
eses
.

(1)
(2)
(3)
(4)
(5)
(6)
(7)
(8)
∆ lo
g(el
ecto
rate
)-0
.320
*-0
.302
*-0
.225
-0.2
21-0
.053
-0.
031
-0.0
61-0
.058
[0.1
62]
[0.1
77]
[0.1
38]
[0.1
44]
[0.0
51]
[0.0
47]
[0.0
44]
[0.041
]
Obs
erva
tions
113
113
113
113
113
113
113
113
R-S
quar
ed0.
032
0.03
30.
023
0.02
30.
009
0.02
90.
016
0.01
7
Dep
ende
nt v
aria
ble:
incu
mbe
nts
liber
al in
cum
bent
s lo
sers
liber
al lo
sers
∆ s
hare
∆ s
hare
∆ s
hare
∆ s
hare
Tab
le 9
: Can
dida
te C
ompe
titio
nU
nder
the
New
Fra
nchi
se (
1868
-186
5)
R-S
quar
ed0.
032
0.03
30.
023
0.02
30.
009
0.02
90.
016
0.01
7
Con
trol
Pop
ulat
ion
Cha
nge?
No
Yes
No
Yes
No
Yes
No
Yes
Tab
le 9
: Can
dida
te C
ompe
titio
nU
nder
the
New
Fra
nchi
se (
1868
-186
5)
Sou
rce:
Cra
ig (
1989
) an
d V
ince
nt a
nd S
tent
on (
1971
).N
otes
: OLS
reg
ress
ions
. A
ll re
gres
sion
s in
clud
e a
cons
tant
term
.***
indi
cate
s st
atis
tical
sig
nific
ance
at 1
%, *
* at
5%
, and
* a
t 10%
. Rob
ust
stan
dard
err
ors
are
in p
aren
thes
es.

∆ c
and
idat
e ∆
sh
are
seat
s∆
lib
eral
∆ s
har
e se
ats∆
sh
are
∆ v
ote
r ∆
sh
are∆
sh
are
liber
al∆
sh
are∆
sh
are
liber
alse
at r
atio
un
con
test
edca
nd
idat
elib
eral
liber
al v
ote
turn
ou
tin
cum
ben
tin
cum
ben
tslo
sers
lose
rs(1
)(2
)(3
)(4
)(5
)(6
)(7
)(8
)(9
)(1
0)
Pan
el A
: Bo
rou
ghs
with
bo
un
dar
y ch
ange
s
∆ lo
g(el
ecto
rate
)0
.15
4-0
.06
90
.18
1-0
.10
60
.03
7-0
.05
5-0
.16
4-0
.08
00
.03
8-0
.01
1[0
.14
9]
[0.1
28
][0
.12
5]
[0.1
01
][0
.05
4]
[0.0
43
][0
.14
9]
[0.12
5]
[0.0
43
][0
.03
2]
∆ lo
g(el
ecto
rate
) X
Ch
ange
Bo
un
dar
ies
0.0
27
-0.1
00
-0.0
69
0.0
06
-0.0
50
0.0
28
0.0
12
-0.0
67
0.0
12
-0.0
03
[0.0
95
][0
.09
6]
[0.0
77
][0
.06
7]
[0.0
35
][0
.02
8]
[0.0
90
][0.0
83
][0
.03
3]
[0.0
31
]
Ob
serv
atio
ns
16
41
64
16
41
64
87
87
16
41
64
16
41
64
R-S
qu
ared
0.0
15
0.0
13
0.0
14
0.0
17
0.0
57
0.0
34
0.0
14
0.0
08
0.
01
60
.00
1
Pan
el B
: Bo
rou
ghs
with
bo
un
dar
y ch
ange
s an
d c
han
ge
of s
eats
∆ lo
g(el
ecto
rate
)0
.18
6-0
.10
10
.20
0*
-0.0
71
0.0
46
-0.0
49
-0
.17
6-0
.06
50
.02
9-0
.00
3[0
.13
8]
[0.1
25
][0
.11
7]
[0.0
94
][0
.05
6]
[0.0
38
][0
.13
9]
[0.11
6]
[0.0
40
][0
.03
0]
∆ lo
g(el
ecto
rate
) X
Ch
ange
Bo
un
dar
ies
-0.0
03
-0.0
93
-0.
05
80
.01
1-0
.06
6*
0.0
17
0.0
02
-0.0
38
0.0
06
-0.0
10
[0.0
85
][0
.08
6]
[0.0
69
][0
.06
0]
[0.0
36
][0
.02
6]
[0.0
85
][0.0
76
][0
.02
9]
[0.0
27
]∆
log(
elec
tora
te)
X C
han
ge S
eats
0
.19
5**
-0.1
75
*0
.02
7-0
.07
4-0
.07
00
.02
0-0
.10
2-0
.12
1-0
.02
0-0
.01
9
Dep
end
ent v
aria
ble
:
Ta
ble
10
: Ele
ctor
ate
Out
com
es, P
art
y a
nd C
and
ida
te C
omp
etiti
on
Und
er t
he N
ew F
ranc
hise
in D
iffer
ent S
am
ple
s (1
86
8-1
865)
∆ lo
g(el
ecto
rate
) X
Ch
ange
Sea
ts
0.1
95
**-0
.17
5*
0.0
27
-0.0
74
-0.0
70
0.0
20
-0.1
02
-0.1
21
-0.0
20
-0.0
19
[0.0
90
][0
.09
2]
[0.0
89
][0
.07
3]
[0.0
65
][0
.02
8]
[0.0
98
][0.0
78
][0
.01
9]
[0.0
18
]
Ob
serv
atio
ns
20
72
07
20
72
07
11
01
10
20
72
07
20
72
07
R-S
qu
ared
0.0
27
0.0
24
0.0
28
0.0
09
0.0
15
0.1
71
0.0
35
0.0
20
0.
00
90
.00
1
Pan
el C
: Co
un
ties
with
ou
t bo
un
dar
y o
r se
at c
han
ges
∆ lo
g(el
ecto
rate
)-0
.49
40
.56
3-0
.21
20
.33
30
.01
5-0
.08
5-0
.03
10
.02
3-0
.02
90
.00
1[0
.40
8]
[0.4
17
][0
.28
2]
[0.3
27
][0
.32
5]
[0.2
55
][0
.27
0]
[0.21
4]
[0.1
19
][0
.11
6]
Ob
serv
atio
ns
60
60
60
60
12
12
60
60
60
60
R-S
qu
ared
0.0
65
0.0
72
0.0
25
0.0
24
0.2
17
0.0
39
0.0
26
0.0
16
0.
01
0.0
01
Co
ntr
ol P
op
ula
tion
Ch
ange
?Y
esY
esY
esY
esY
esY
esY
esY
esY
esY
es
Ta
ble
10
: Ele
ctor
ate
Out
com
es, P
art
y a
nd C
and
ida
te C
omp
etiti
on
Und
er t
he N
ew F
ranc
hise
in D
iffer
ent S
am
ple
s (1
86
8-1
865)
Sou
rce:
Cra
ig(1
98
9)
and
Vin
cent
and
Ste
nton
(1
97
1).
Not
es: O
LS r
egre
ssio
ns.
All
regr
essi
ons
incl
ude
a c
ons
tant
term
. Reg
ress
ions
in P
ane
l B a
lso
cont
rol f
or
the
diff
eren
ce in
the
num
ber
of s
eats
. ***
ind
ica
tes
sta
tistic
al s
igni
fica
nce
at
1%
, **
at 5
%, a
nd *
at 1
0%
. Rob
ust s
tand
ard
err
ors
are
in p
are
nthe
ses.

∆ c
an
did
ate
∆ s
ha
re s
ea
ts∆
lib
era
l∆
sh
are
se
ats∆
sh
are
∆ v
ote
r ∆
sh
are
∆ s
ha
re li
be
ral∆
sh
are
∆ s
ha
re li
be
ral
sea
t ra
tiou
nco
nte
ste
dca
nd
ida
telib
era
llib
era
l vot
etu
rnou
tin
cum
be
nt
incu
mb
en
tslo
sers
lose
rs(1
)(2
)(3
)(4
)(5
)(6
)(7
)(8
)(9
)(1
0)
∆ lo
g(e
lect
ora
te)
-0.1
45
0.1
43
-0.1
18
0.0
72
0.0
22
0.0
22
0.2
73
*0
.30
5**
-0.0
63
0.0
01
(18
68
-18
65
diff
ere
nce
)[0
.16
3]
[0.1
68
][0
.11
0]
[0.0
90
][
0.0
73
][0
.07
1]
[0.1
39
][0
.13
8]
[0.0
52
][0
.03
2]
Ob
serv
atio
ns
11
31
13
11
31
13
43
43
11
31
13
11
31
13
R-S
qu
are
d0
.02
40
.02
40
.02
10
.00
90
.05
80
.00
80
.02
80
.03
80
.02
20
.01
7
De
pe
nd
en
t va
ria
ble
(1
86
5-1
85
9 d
iffe
ren
ce):
Tab
le 1
1: I
s ∆ lo
g(el
ecto
rate
) fo
r 18
68-1
865
Cor
rela
ted
with
Diff
eren
ces
in O
utco
me
s fo
r 18
65-1
859?
R-S
qu
are
d0
.02
40
.02
40
.02
10
.00
90
.05
80
.00
80
.02
80
.03
80
.02
20
.01
7
Con
trol
Pop
ula
tion
Ch
an
ge?
Ye
sY
es
Ye
sY
es
Ye
sY
es
Ye
sY
es
Ye
sY
es
Tab
le 1
1: I
s ∆ lo
g(el
ecto
rate
) fo
r 18
68-1
865
Cor
rela
ted
with
Diff
eren
ces
in O
utco
me
s fo
r 18
65-1
859?
Sou
rce:
Cra
ig(1
989)
and
Vin
cent
and
Ste
nton
(19
71).
Not
es: O
LS r
egre
ssio
ns.A
ll re
gres
sion
s in
clud
e a
cons
tant
term
. ***
indi
cate
s st
atis
tical
sig
nific
ance
at 1
%, *
* at
5%
, a
nd *
at 1
0%. R
obus
t sta
ndar
d er
rors
are
in p
aren
thes
es.

∆ c
andi
date
∆ s
hare
sea
ts∆
libe
ral∆
sha
re s
eats∆
sha
re∆
vot
er
∆ s
hare
∆ s
hare
libe
ral∆
sha
re∆
sha
re li
bera
lse
at r
atio
unco
ntes
ted
cand
idat
elib
eral
liber
al v
ote
turn
out
incu
mbe
ntin
cum
bent
slo
sers
lose
rs(1
)(2
)(3
)(4
)(5
)(6
)(7
)(8
)(9
)(1
0)
∆ lo
g(el
ecto
rate
)0.
648*
*-0
.911
***
0.54
6**
0.12
40.
213
0.031
-0.9
86**
*-0
.608
**-0
.055
-0.0
01[0
.291
][0
.282
][0
.273
][0
.203
][0
.161
][0
.113
][0
.326
][0.2
61]
[0.1
02]
[0.0
80]
Obs
erva
tions
113
113
113
113
6262
113
113
113
113
Ove
riden
tific
atio
n te
st (
p-va
lue)
0.83
50.
600
0.89
30.
553
0.74
50.
697
0.15
90.
591
0.52
10.
694
Dep
ende
nt v
aria
ble:
Tab
le 1
2: E
lect
ora
l Ou
tco
mes
, P
arty
, an
d C
and
idat
e C
om
pet
itio
n U
nd
er th
e N
ew F
ran
chis
e: In
stru
men
tal V
aria
ble
s E
stim
ates
Ove
riden
tific
atio
n te
st (
p-va
lue)
0.83
50.
600
0.89
30.
553
0.74
50.
697
0.15
90.
591
0.52
10.
694
Con
trol
Pop
ulat
ion
Cha
nge?
Yes
Yes
Yes
Yes
Yes
Yes
Yes
Yes
Yes
Yes
Tab
le 1
2: E
lect
ora
l Ou
tco
mes
, P
arty
, an
d C
and
idat
e C
om
pet
itio
n U
nd
er th
e N
ew F
ran
chis
e: In
stru
men
tal V
aria
ble
s E
stim
ates
So
urc
e: C
raig
(19
89
) an
d V
ince
nt a
nd
Ste
nto
n (
19
71
).N
ote
s: In
stru
men
talV
aria
ble
sre
gres
sio
ns.
All
regr
essi
on
s in
clu
de
a co
nst
ant t
erm
. F
irst s
tage
regr
essi
on
in T
able
4. I
nst
rum
ents
are
:Lo
g (E
lect
ora
te,
18
32
) an
d L
og
(Po
pu
latio
n, 1
86
1).
***
in
dic
ates
sta
tistic
al s
ign
ifica
nce
at
1%
, **
at
5%
, a
nd
* a
t 1
0%
. Ro
bu
st s
tan
dar
d e
rro
rs a
re in
par
ent
hes
es.

∆ c
andi
date
∆ s
hare
sea
ts∆
libe
ral∆
sha
re s
eats∆
sha
re∆
vot
er
∆ s
hare
∆ s
hare
libe
ral∆
sha
re∆
sha
re li
bera
lse
at r
atio
unco
ntes
ted
cand
idat
elib
eral
liber
al v
ote
turn
out
incu
mbe
ntin
cum
bent
slo
sers
lose
rs(1
)(2
)(3
)(4
)(5
)(6
)(7
)(8
)(9
)(1
0)
∆ lo
g(el
ecto
rate
)0.
345*
*-0
.284
**0.
077
-0.0
21-0
.001
0.01
3-0
.273
**-0
.266
*0.
053
0.01
7[0
.150
][0
.111
][0
.114
][0
.092
][0
.059
][0
.039
][0
.134
][0.1
44]
[0.0
56]
[0.0
30]
Obs
erva
tions
113
113
113
113
6767
113
113
113
113
Dep
ende
nt v
aria
ble:
Tab
le 1
3: E
lect
ora
te O
utco
mes
, Par
ty a
nd C
and
idat
e C
om
pet
itio
n U
nder
the
New
Fra
nchi
se (
18
74
-186
5)
Obs
erva
tions
113
113
113
113
6767
113
113
113
113
R-S
quar
ed0.
046
0.04
30.
007
0.01
0.00
30.
002
0.03
0.03
50.
016
0.06
Con
trol
Pop
ulat
ion
Cha
nge?
Yes
Yes
Yes
Yes
Yes
Yes
Yes
Yes
Yes
Yes
Tab
le 1
3: E
lect
ora
te O
utco
mes
, Par
ty a
nd C
and
idat
e C
om
pet
itio
n U
nder
the
New
Fra
nchi
se (
18
74
-186
5)
So
urce
: Cra
ig(1
98
9) a
nd V
ince
nt a
nd S
tent
on
(19
71
).N
ote
s: O
LS r
egre
ssio
ns. A
ll re
gres
sio
ns in
clud
e a
co
nsta
nt te
rm. *
** in
dic
ates
sta
tistic
al s
igni
fican
ce
at 1
%, *
* at
5%
, and
* a
t 10
%. R
ob
ust s
tand
ard
er
rors
are
in p
aren
thes
es.

Vot
e in
186
6A
bsta
inN
oY
esT
otal
Abs
tain
196
1338
No
3861
110
0
Yes
370
146
183
Vot
e in
186
7
Tab
le 1
4: V
otin
gP
atte
rns
in t
he S
econ
d R
eadi
ngs
of th
e 18
66 a
nd
1867
Abo
litio
n of
Chu
rch
Rat
es B
ill
Yes
370
146
183
Tot
al94
6716
032
1
Tab
le 1
4: V
otin
gP
atte
rns
in t
he S
econ
d R
eadi
ngs
of th
e 18
66 a
nd
1867
Abo
litio
n of
Chu
rch
Rat
es B
ill
Sou
rce:
Han
ssar
d.N
otes
: V
otes
are
for
the
sam
ple
of M
Ps
that
bel
ong
to b
orou
ghs
that
app
ear
over
all
the
sam
ple
we
stud
y (s
ee, T
able
3).

(1)
(2)
(3)
(4)
(5)
(6)
∆ lo
g(el
ecto
rate
)0.
001
0.00
6-0
.021
-0.0
32-0
.020
-0.0
23[0
.056
][0
.056
][0
.059
][0
.057
][0
.093
][0
.091
]
Obs
erva
tions
321
321
242
242
163
163
R-S
quar
ed0.
019
0.01
90.
001
0.00
30.
001
0.00
1
Sam
ple
Dep
ende
nt v
aria
ble:
∆
no
dum
my
Bou
ndar
y ch
ange
sB
ound
ary
chan
ges
No
boun
dary
cha
nges
Tab
le 1
5: N
oes
in th
e S
econ
d R
eadi
ng o
f the
186
6 an
d 18
67 A
bolit
ion
of C
hurc
h R
ates
Bill
Sam
ple
Con
trol
Pop
ulat
ion
Cha
nge?
No
Yes
No
Yes
No
Yes
and
chan
ge in
sea
tsan
d no
cha
nge
in s
eats
and
no c
hang
e in
sea
tsB
ound
ary
chan
ges
Bou
ndar
y ch
ange
sN
o bo
unda
ry c
hang
es
Tab
le 1
5: N
oes
in th
e S
econ
d R
eadi
ng o
f the
186
6 an
d 18
67 A
bolit
ion
of C
hurc
h R
ates
Bill
Sou
rce:
Cra
ig(1
989)
, Vin
cent
and
Ste
nton
(19
71)
and
Han
ssar
d.N
otes
: OLS
reg
ress
ions
.All
regr
essi
ons
incl
ude
a co
nsta
nt te
rm. R
egre
ssio
ns in
col
umns
(1)
and
(2)
als
o co
ntro
l fo
r th
e di
ffer
ence
in th
e nu
mbe
r of
sea
ts. *
** in
dica
tes
stat
istic
al
sign
ifica
nce
at 1
%, *
* at
5%
, and
* a
t 10%
.