Embed Size (px)
Citation preview
1
Phosphate fertilizer impacts on glyphosate sorption by soil 1
2
Sirajum Munira*1, Annemieke Farenhorst1, Don Flaten1 and Cynthia Grant2 3
4
1 Department of Soil Science, Faculty of Agricultural & Food Sciences, University of Manitoba, 5
362 Ellis Building, Winnipeg, MB, Canada, R3T 2N2 6
2Agriculture and Agri-Food Canada, Brandon, MB, Canada R7A 5Y3 7
8
* Corresponding author: 9
Sirajum Munira 10
E-mail address: [email protected] 11
+1 204 558 0504 12
13
Abstract 14
This research examined the impact of field-aged phosphate and cadmium (Cd) concentrations, and 15
fresh phosphate co-applications, on glyphosate sorption by soil. Soil samples were collected in 16
2013 from research plots that had received, from 2002 to 2009, annual applications of mono 17
ammonium phosphate (MAP) at 20, 40 and 80 kg P ha-1 and from products containing 0.4, 70 or 18
210 mg Cd kg-1 as an impurity. A series of batch equilibrium experiments were carried out to 19
quantify the glyphosate sorption distribution constant, Kd. Extractable Cd concentrations in soil 20
had no significant effect on glyphosate sorption. Glyphosate Kd values significantly decreased 21
with increasing Olsen-P concentrations in soil, regardless of the pH conditions studied. 22
Experiments repeated with a commercially available glyphosate formulation showed statistically 23
2
similar results as the experiments performed with analytical-grade glyphosate. Co-applications of 24
MAP with glyphosate also reduced the available sorption sites to retain glyphosate, but less so 25
when soils already contain large amounts of phosphate. Glyphosate Kd values in soils ranged from 26
173 to 939 L kg-1 under very strong to strongly acidic condition but the Kd was always < 100 L 27
kg-1 under moderately acidic to slightly alkaline conditions. The highest Olsen-P concentrations in 28
soil reduced Kd values by 25-44% relative to control soils suggesting that, under moderately acidic 29
to slightly alkaline conditions, glyphosate may become mobile by water in soils with high 30
phosphate levels. Otherwise, glyphosate residues in agricultural soils are more likely to be 31
transported off-site by wind and water-eroded sediments than by leaching or runoff. 32
Keywords: Glyphosate; Batch equilibrium experiment; Sorption distribution constant; Mono 33
ammonium phosphate; Cadmium; Competitive effect. 34
35
1. Introduction 36
37
Glyphosate [N-(phosphonomethyl) glycine] is a broad spectrum, non-selective systemic, post-38
emergent herbicide introduced for agricultural use in the 1970s. Glyphosate-tolerant crops were 39
commercialized in 1996 (Benbrook, 2012) and glyphosate now accounts for about one-fourth of 40
global herbicide sales (GSBR, 2011). The glyphosate molecule contains a phosphonic acid moiety 41
that facilitates molecule sorption by soil (Sprankle et al., 1975). With more than 40 million tons of 42
phosphate fertilizers applied on agricultural land around the world (FAO, 2012), a wide range of 43
studies have focused on phosphate and glyphosate interactions in soil (de Jonge et al., 2001, 44
Gimsing and Borggaard, 2007; Gimsing et al., 2007; Kanissery et al., 2015). Glyphosate and 45
inorganic phosphate have shown to compete for the same sorption sites (de Jonge and de Jonge, 46
3
1999) and hence phosphorus applications may influence the bioavailability and transport potential 47
of glyphosate in soil (Gimsing and Borggaard, 2002a). Phosphate fertilizers contain cadmium (Cd) 48
as an impurity and repeated application of phosphate fertilizer results in Cd accumulation in soil 49
(Lambert et al., 2007). The addition of Cd to glyphosate solutions in the laboratory has been shown 50
to enhance glyphosate sorption by soil because Cd and glyphosate form complexes that are 51
retained on the surface of negatively-charged soil colloids (Zhou et al., 2004). The effect of 52
impurities of Cd in phosphate fertilizers on glyphosate sorption in soil is not known. 53
The batch equilibrium procedure is a common method to examine the effect of phosphate additions 54
on glyphosate sorption. All researchers, except de Jonge et al. (2001), added phosphate to soil in 55
the laboratory prior to or during the batch equilibrium experiment, and hence exclusively studied 56
the effect of “fresh” phosphate on glyphosate sorption. Phosphate did compete with glyphosate 57
sorption in a wide range of soils (Sprankle et al., 1975; de Jonge and de Jonge 1999; de Jonge et 58
al., 2001; Kanissery et al., 2015), but not in other soils (Gimsing et al., 2004). Some research 59
demonstrates that phosphate is preferentially sorbed by clay minerals (Gimsing and Borggaard, 60
2001), for example because the phosphate molecule (0.25 nm) is smaller than the glyphosate 61
molecule (0.43 nm) (Cáceres-jensen et al., 2009). The impact of phosphate on reducing glyphosate 62
sorption was stronger for synthesized Fe and Al- oxides than for pure clay-minerals (Gimsing and 63
Borggaard, 2002b). All batch equilibrium studies utilized analytical-grade glyphosate, while 64
herbicide products applied on agricultural land contain other ingredients that could impact the 65
sorption of the active ingredient by soil (Farenhorst and Bowman 1998). Hence, in evaluations of 66
the impact of phosphate additions on glyphosate sorption, it is desired to include a commercially 67
available glyphosate formulation in the study. 68
4
Borggaard (2011) reported that the interaction of phosphate and glyphosate sorption remains 69
unclear, even though this interaction has been studied for four decades. de Jonge et al. (2001) is 70
the only study in these four decades to have examined the effect of “aged” phosphate on glyphosate 71
sorption. Utilizing soil from field plots that had received various amounts of phosphate and lime 72
fertilizers for more than 60 years, batch equilibrium studies indicated that less glyphosate was 73
sorbed in soils with greater Olsen-P concentrations. To the best of our knowledge, the combined 74
effect of fresh and aged phosphate on glyphosate sorption in soil has not been investigated. 75
The objective of this study was to examine under a range of pH conditions, the impact of field-76
aged phosphate and cadmium concentrations on glyphosate sorption by soil, with and without 77
phosphate co-applications in the laboratory. The pH conditions were chosen to include the range 78
of possible glyphosate speciations, as described by Wang et al. (2004). In general, studies have 79
reported that glyphosate sorption generally decreases with increasing soil pH (McConnel and 80
Hossner, 1985; de Jonge and de Jonge, 1999; Gimsing et al., 2004). 81
82
2. Materials and Methods 83
84
2.1. Experimental Design and Soil Characteristics 85
86
Soil samples (0-15cm) with a sandy clay loam texture were collected in the spring 2013 from 87
research plots situated under a durum wheat and flax rotation near Carman (49° 29.7’ N, 98° 2.4’ 88
W), Manitoba, Canada. The soil is classified as an Orthic Black Chernozem based on the Canadian 89
System of Soil Classification, which is approximately equivalent to the Udic Boroll subgroup in 90
the U.S. Soil Taxonomy (CSSC, 1998). The experimental plot was a randomized complete block 91
5
design with 10 treatments and 4 replicates per treatment. In each of the forty plots, the composite 92
soil sample consisted of ten samples collected in the plot using a Dutch augur. Treatments were a 93
control (neither phosphate nor Cd applications), and plots receiving from 2002 to 2009 annual 94
applications of mono ammonium phosphate (MAP) fertilizers that originated from three different 95
phosphate rock sources containing 0.4, 70 or 210 mg Cd kg-1, or low, medium and high Cd, 96
respectively (Grant et al., 2013). MAP from these three sources was applied to plots at 20, 40 and 97
80 kg P ha-1, or 20P, 40P and 80P, respectively. For all plots that received MAP, 20 kg P ha-1 was 98
placed near the seed to enhance fertilizer use efficiency, a common practice in Canadian Prairie 99
agriculture. For the 40 and 80 kg P ha-1 treatments, to avoid seedling toxicity, the additional MAP 100
was broadcasted and then incorporated in soil. From 2010 to 2013, the rotation was continued but 101
no phosphate or Cd was applied. Nitrogen fertilizer varied by year to optimize yields. The typical 102
rate of N applied was 90 kg N ha-1 in durum wheat and 50 kg N ha-1 in flax. 103
Soil samples were air-dried and sieved (<2mm) prior to soil properties analysis and sorption 104
studies. Soil was digested with nitric acid and total Cd was determined by inductively coupled 105
plasma (ICP) (U.S. EPA, 1996). Extractable Cd was extracted with diethylene triamine 106
pentaacetic acid (DTPA) following procedures as recommended by Lindsay and Norvell (1978), 107
and extracts were analyzed by ICP (Whitney, 2011). Various factors have been shown to influence 108
the efficiency of micronutrient extraction by DTPA, including extraction temperature and shaking 109
time (Lindsay and Norvell, 1978). 110
Available phosphate was extracted using Olsen (NaHCO3) phosphorus test (Frank et al., 2011). 111
Soil physical and chemical properties that are known to influence glyphosate and phosphate 112
sorption by soil, but did not significant vary across the plots by treatment, were also determined. 113
Soil organic carbon content was determined using combustion technique with a high temperature 114
6
induction furnace (Nelson and Sommers, 1996). Extractable Fe2O3 and Al2O3 were extracted with 115
DTPA (Whitney, 2011) and 0.01M CaCl2, (Barnhisel and Bertsch, 1982), respectively, and extracts 116
were analyzed by ICP. Extractable Ca was also measured by ICP using ammonium acetate as an 117
extractant (Warncke and Brown, 2011). Results were soil organic carbon content: 2.80% (mean) 118
± 0.04 (standard error) (n=16, number of plots analyzed); extractable Fe2O3: 246 ± 5 mg kg-1 119
(n=40), extractable Al2O3: 6.4 ± 0.65 mg kg-1 (n=16); and extractable Ca: 2,252 ± 40.57 mg kg-1 120
(n=16). Given that the study focused on Cd and P applications as treatments, the concentrations of 121
extractable and total Cd, as well as Olsen-P in all plots were determined. We did not expect to see 122
treatment differences for the other parameters that were measured (i.e., extractable Fe2O3, Al2O3, 123
and Ca). Fe2O3 was also measured in all plots as previous studies have demonstrated that there is 124
a strong positive association between Fe2O3 concentrations and phosphate or glyphosate sorption 125
in soils. Since our results indicated no treatment differences induced by Cd and P applications on 126
Fe2O3 concentrations extractable Al2O3, and Ca were quantified for 16 plots only (i.e., Control, 127
20P, 40P and 80P plots). 128
129
2.2. Sorption Studies 130
131
Chemicals used in the sorption studies were: analytical grade ammonium phosphate monobasic 132
(98% chemical purity) and glyphosate (99.9% purity) from Sigma-Aldrich Co., St. Louis, MO, 133
14C-labelled glyphosate [phosphonomethyl-14C] (99% radiochemical purity; specific activity 50 134
µCi), from American Radiolabeled Chemicals Inc. and Roundup Ultra 2 (49% active ingredient 135
and 51% other ingredients, CAS No. 70901-12-1) from Monsanto Chemical Company. Active 136
ingredient was potassium salt of N-(phosphonomehyl) glycine. 137
7
Glyphosate sorption was determined by batch equilibrium with the initial solution containing 1 mg 138
L-1 glyphosate and 6.67 X 10⁴ Bq L-1 14C-labelled glyphosate. Batch equilibrium procedures 139
followed the OECD guideline 106 using a soil/solution ratio of 1:5 and an equilibrium time of 24 140
h (OECD, 2000). Initial solution (10 mL) was added to soil (2 g) in 50-mL centrifuge Teflon tubes 141
(duplicates) and slurries were rotated in the dark at 5oC for 24 h. A constant 5°C temperature was 142
utilized to minimize risks for biodegradation. To our knowledge, there have been no studies on the 143
effect of temperature on glyphosate sorption. Studies using other herbicides have found that 2,4-144
D sorption decreases (Aksu and Kabasakal, 2005; Gupta et al. 2006) or increases (Gaultier et al., 145
2009) with increasing temperature. Regardless, the effect of temperature on sorption is small 146
because, between 5 and 25 oC, the 2,4-D sorption distribution coefficient only varied by 1 to 3% 147
(Gaultier et al., 2009). 148
Equilibrium solution was centrifuged (10,000 revmin-1 for 10 minutes) and subsamples (1 mL) of 149
supernatant were added in duplicated 7-mL scintillation vials containing 5 mL 30% Scintisafe 150
scintillation cocktail (Fisher Scientific, Fairlawn, NJ). Vials were lightly shaken and stored in the 151
dark for 24 h to disperse the chemiluminescence before the radioactivity was measured. 152
Radioactivity was quantified by Liquid Scintillation Counting (LSC) with automated quench 153
correction (#H method) (LS 6500 Beckman Instruments, Fullerton, CA). The glyphosate sorption 154
distribution constant, Kd (L kg-1) was calculated by Cs/Ce, whereby Cs = glyphosate sorption by 155
soil at equilibrium (mg kg-1), and Ce = glyphosate concentration of equilibrium solution (mg L-1). 156
The effects of field-aged phosphate and Cd concentrations on glyphosate sorption were examined 157
at pH conditions ranging from 3.6 to 7.3. This first experiment utilized soils from all forty plots 158
and the range in pH was induced using different types of ions in the initial solution (0.01M HCl, 159
0.01M CaCl2, 0.01M KCl, 0.01M KOH or dH2O). For the control and high Cd 80P plots, the 160
8
experiments were repeated but then using the Tier 2 parallel method (OECD, 2000) with tubes 161
being sampled at 1, 2, 4, 6, 8 and 24 h. The two subsequent experiments utilized soils from the 162
plots labeled as low Cd and with 20P, 40P or 80P levels. In one experiment, for slurry pH 163
conditions ranging from 3.6 to 7.3, batch equilibriums procedures were repeated but using 164
Roundup Ultra 2 in 0.01M HCl, 0.01M CaCl2, 0.01M KCl, 0.01M KOH or dH2O to verify 165
experimental results for a formulated product. In the other experiment, for slurry pH conditions 166
range from 4.7 to 5.4, the effect of fresh phosphate additions on glyphosate sorption by soil was 167
examined by adding analytical grade MAP to analytical glyphosate in 0.01M CaCl2, 0.01M KCl 168
and dH2O solutions. The amounts of MAP added was equivalent to 11, 22 and 44 mg P kg-1, or an 169
estimated 20, 40 and 80 P kg ha-1, respectively, assuming the fertilizer being present in the top 15 170
cm layer of a soil with a bulk density of 1,200 kg m-3. 171
Statistical analyses were completed using SAS software version 9.3 for Windows (SAS Institute 172
Inc. 2002-2010). Two-way analysis of variance (ANOVA) and multiple means comparison 173
(Tukey’s) tests were conducted to determine the effect of phosphate fertilizer (20P, 40P, 80P) and 174
Cd (low, medium, high) treatment on Olsen-P concentrations, extractable Cd concentrations and 175
total Cd concentrations in soil. For each pH (ionic solution), multiple linear regression analyses 176
were carried out to predict glyphosate Kd values by using Olsen-P and extractable Cd 177
concentrations as independent variables. Repeated measure analysis was used to determine the 178
effect of shaking time (0.5, 1, 2, 4, 6, 8 and 24 h) by using phosphate levels and time as independent 179
variables. Two-way ANOVA and multiple means comparison (Tukey’s) tests were utilized to 180
quantify the effects of field-aged (20P, 40P, 80P) and fresh phosphate additions (11, 22 and 44 mg 181
P kg-1) on glyphosate Kd values. One-way ANOVA and multiple means comparison (Tukey’s) 182
9
tests were applied to quantify the impact of using Roundup Ultra 2 versus analytical-grade 183
glyphosate on Kd values in soils. 184
185
3. Results and Discussion 186
187
Glyphosate Kd values ranged from 43 to 1,173 L kg-1 which is in agreement with glyphosate Kd 188
values reported in agricultural soils (Sørensen et al., 2006). There were no significant differences 189
in glyphosate sorption by soil when using either Roundup Ultra 2 or analytical-grade glyphosate, 190
suggesting that other ingredients in the commercial formulation had no impact on the sorption 191
behaviour of the active ingredient glyphosate in soil. 192
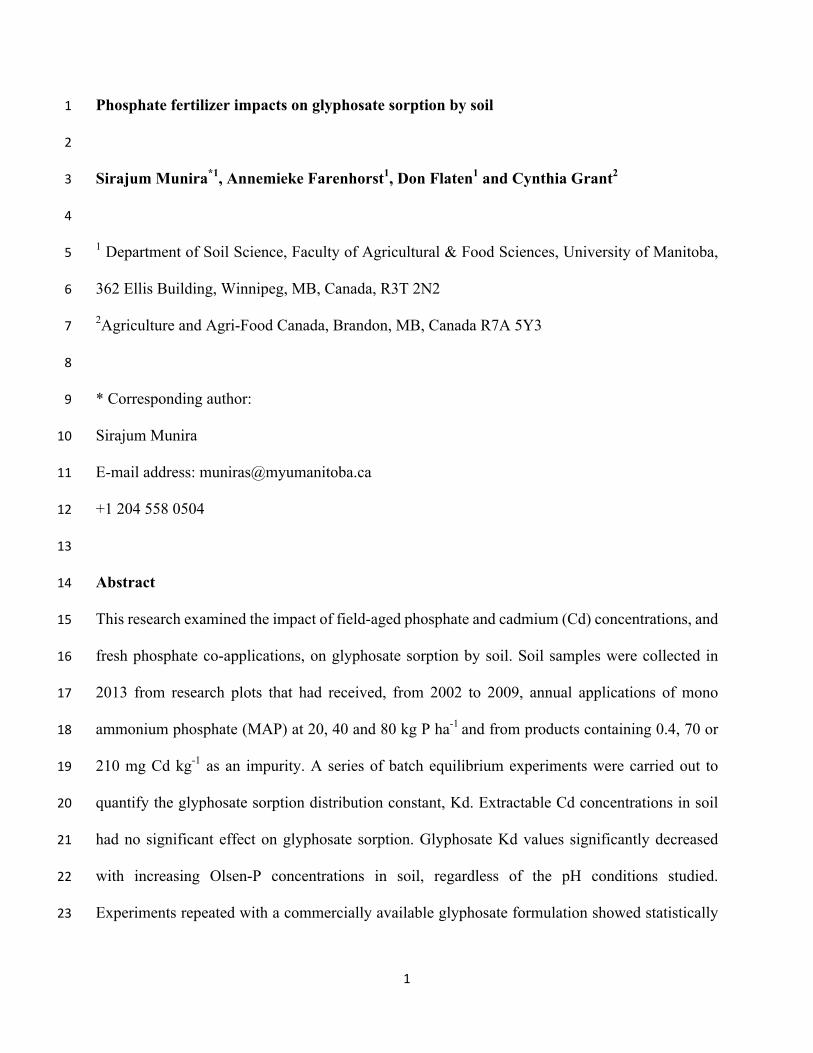
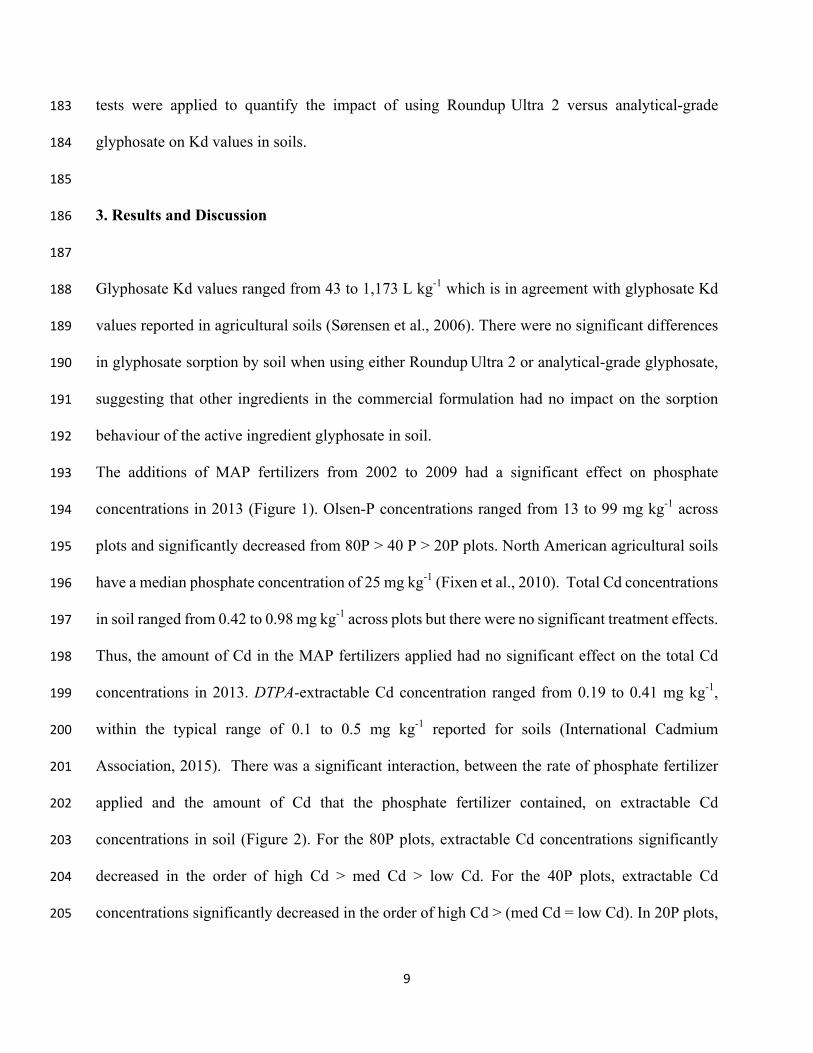
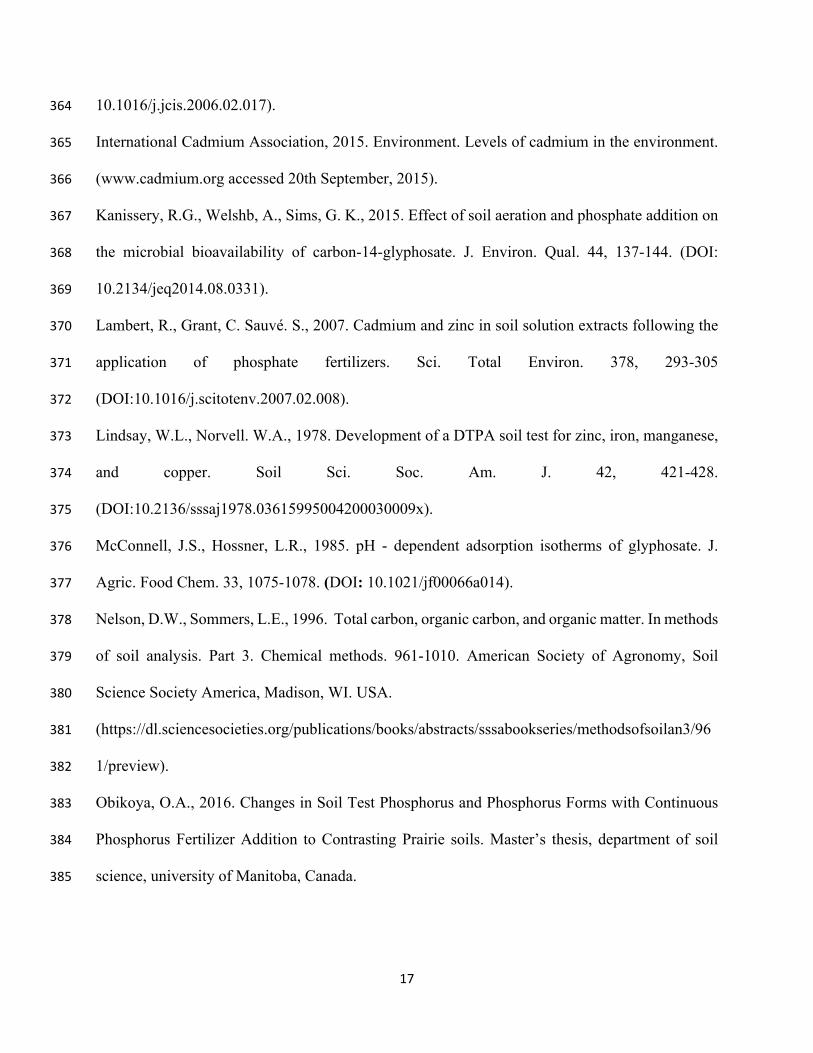
The additions of MAP fertilizers from 2002 to 2009 had a significant effect on phosphate 193
concentrations in 2013 (Figure 1). Olsen-P concentrations ranged from 13 to 99 mg kg-1 across 194
plots and significantly decreased from 80P > 40 P > 20P plots. North American agricultural soils 195
have a median phosphate concentration of 25 mg kg-1 (Fixen et al., 2010). Total Cd concentrations 196
in soil ranged from 0.42 to 0.98 mg kg-1 across plots but there were no significant treatment effects. 197
Thus, the amount of Cd in the MAP fertilizers applied had no significant effect on the total Cd 198
concentrations in 2013. DTPA-extractable Cd concentration ranged from 0.19 to 0.41 mg kg-1, 199
within the typical range of 0.1 to 0.5 mg kg-1 reported for soils (International Cadmium 200
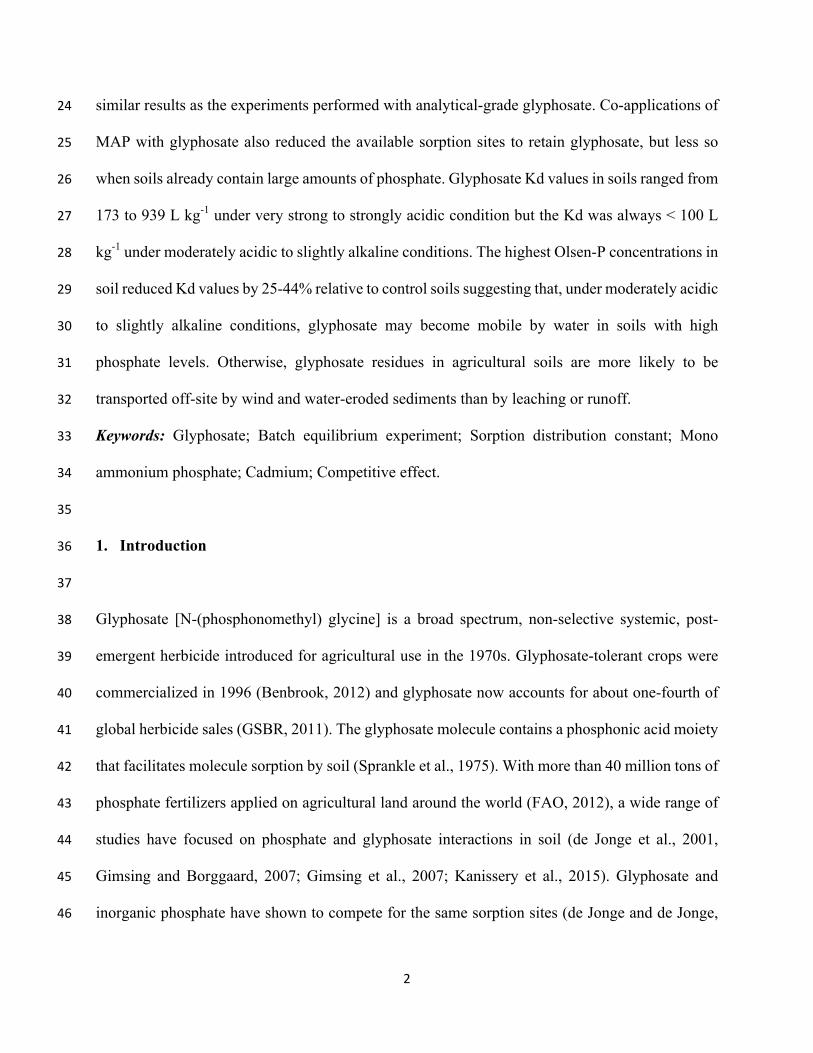
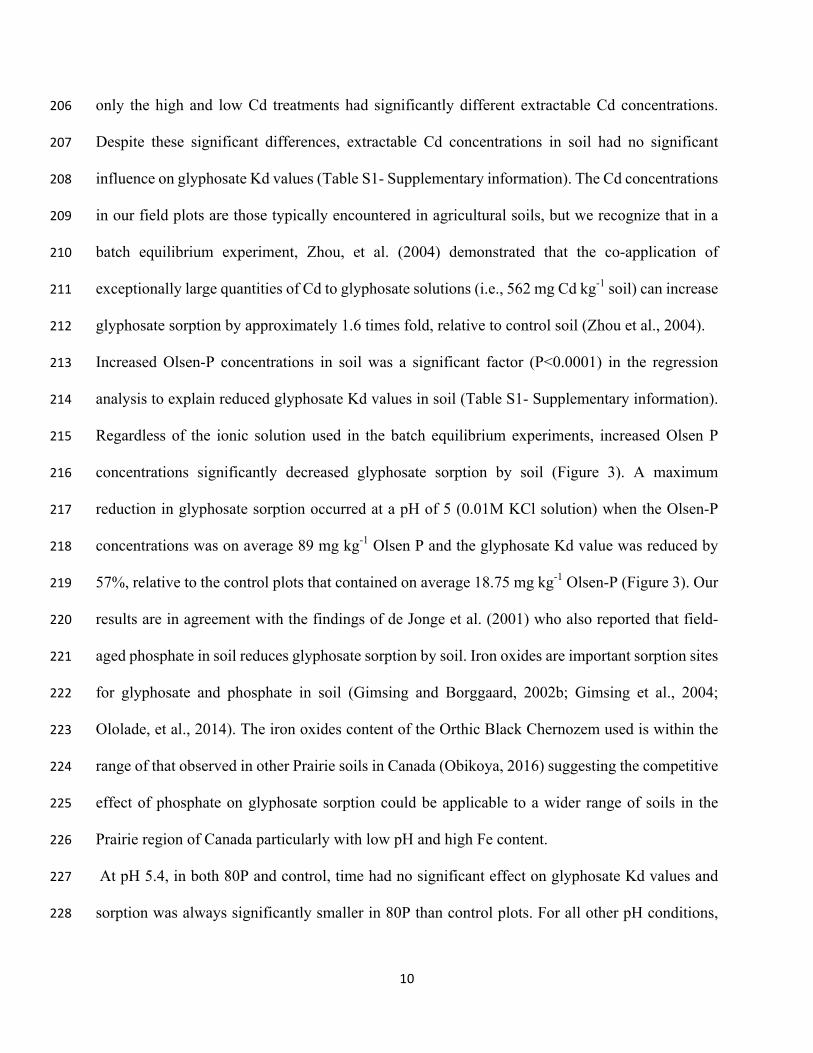
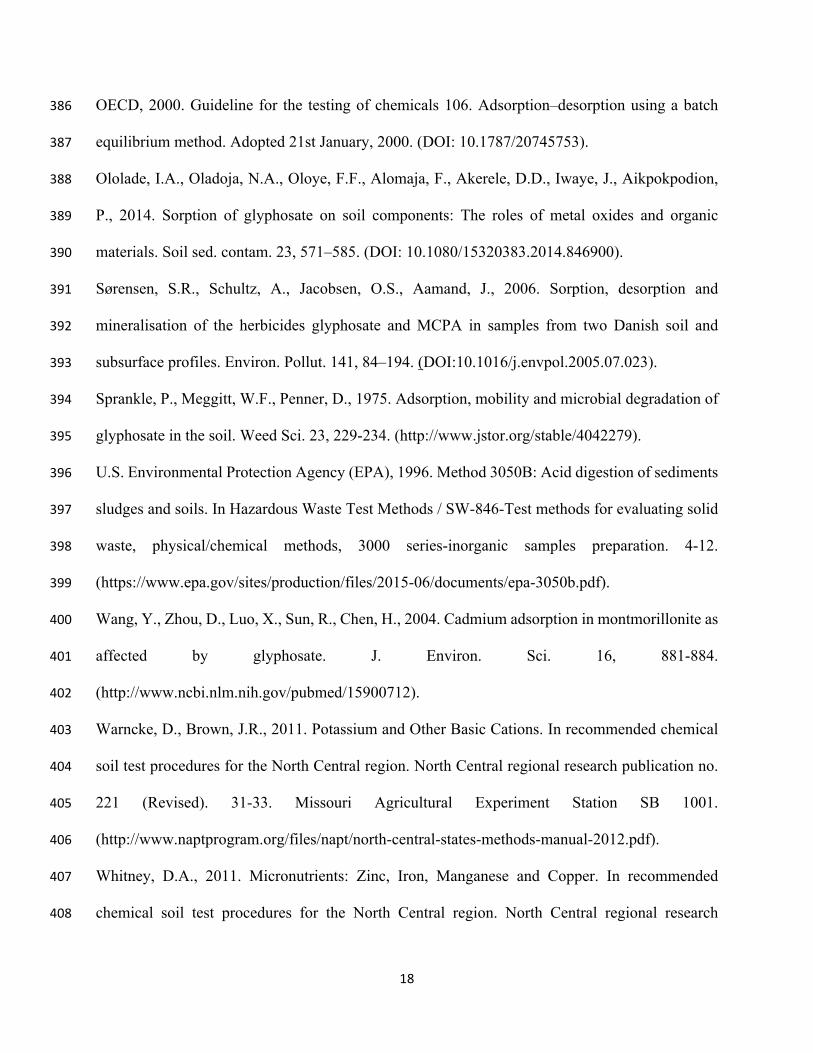
Association, 2015). There was a significant interaction, between the rate of phosphate fertilizer 201
applied and the amount of Cd that the phosphate fertilizer contained, on extractable Cd 202
concentrations in soil (Figure 2). For the 80P plots, extractable Cd concentrations significantly 203
decreased in the order of high Cd > med Cd > low Cd. For the 40P plots, extractable Cd 204
concentrations significantly decreased in the order of high Cd > (med Cd = low Cd). In 20P plots, 205
10
only the high and low Cd treatments had significantly different extractable Cd concentrations. 206
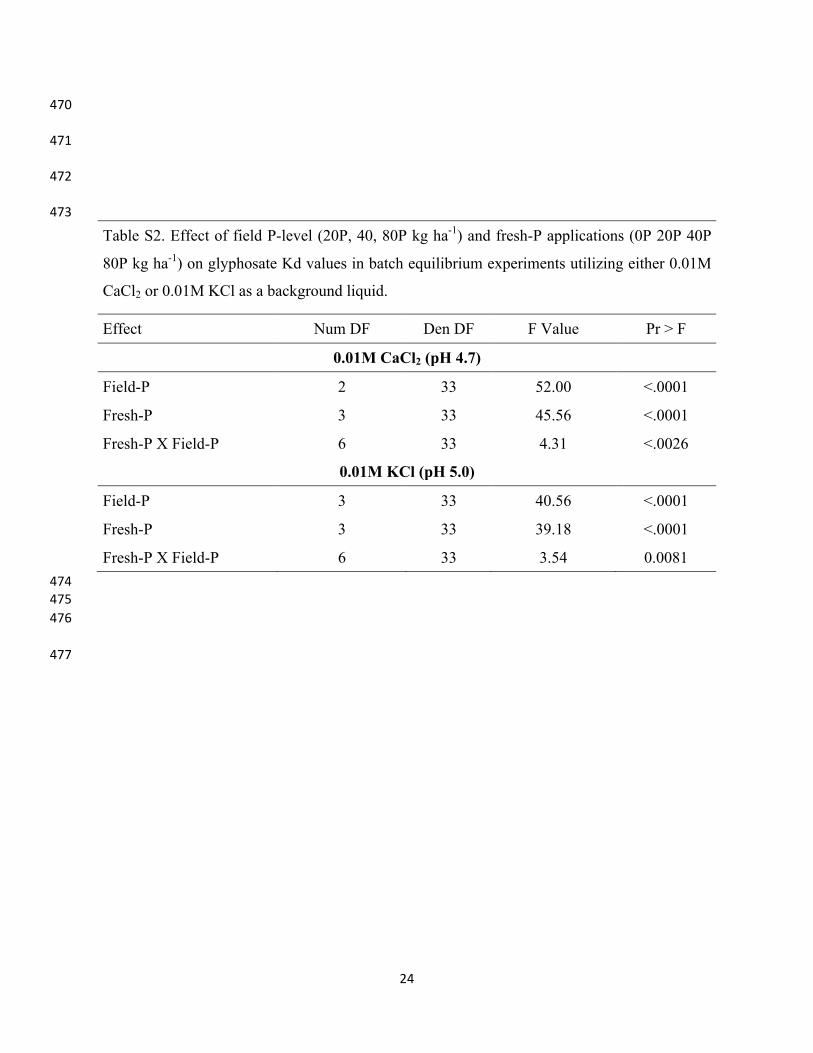
Despite these significant differences, extractable Cd concentrations in soil had no significant 207
influence on glyphosate Kd values (Table S1- Supplementary information). The Cd concentrations 208
in our field plots are those typically encountered in agricultural soils, but we recognize that in a 209
batch equilibrium experiment, Zhou, et al. (2004) demonstrated that the co-application of 210
exceptionally large quantities of Cd to glyphosate solutions (i.e., 562 mg Cd kg-1 soil) can increase 211
glyphosate sorption by approximately 1.6 times fold, relative to control soil (Zhou et al., 2004). 212
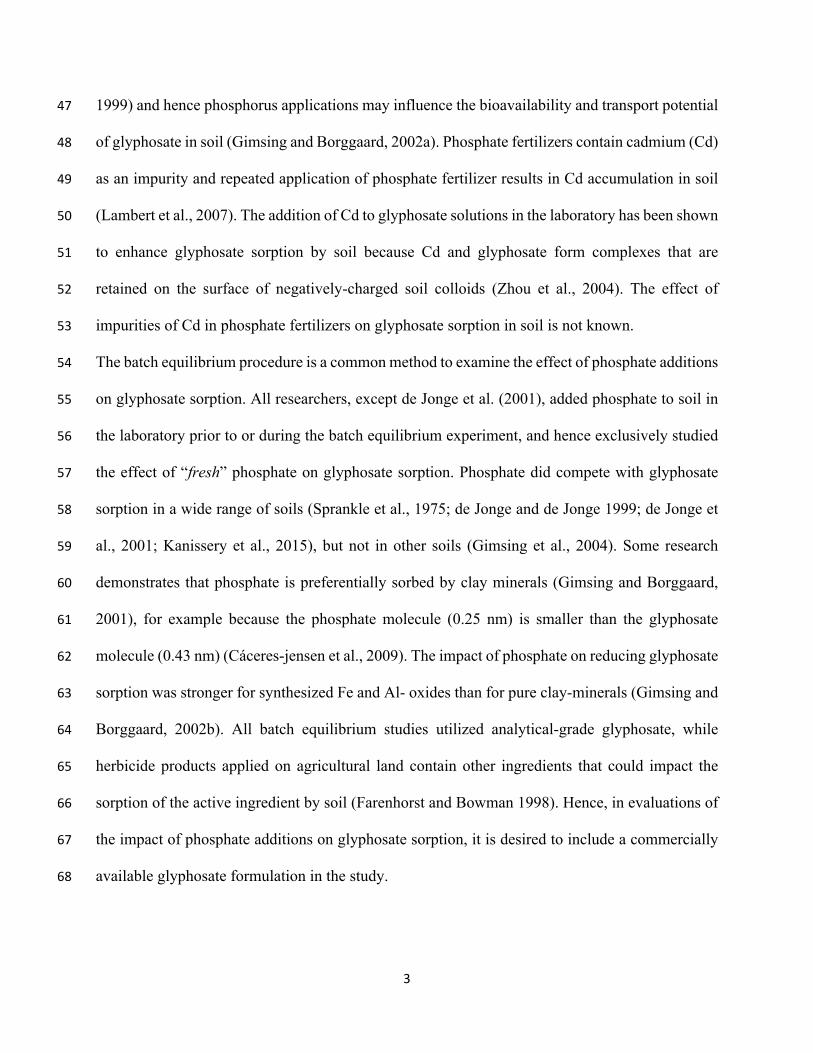
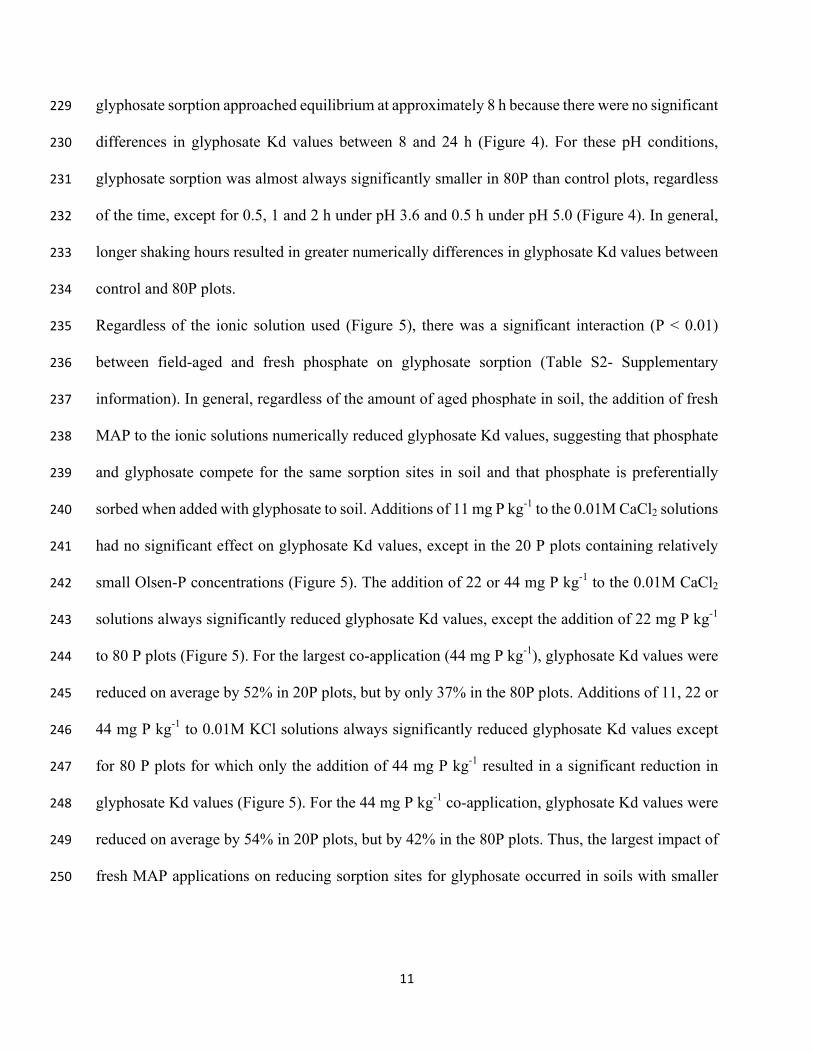
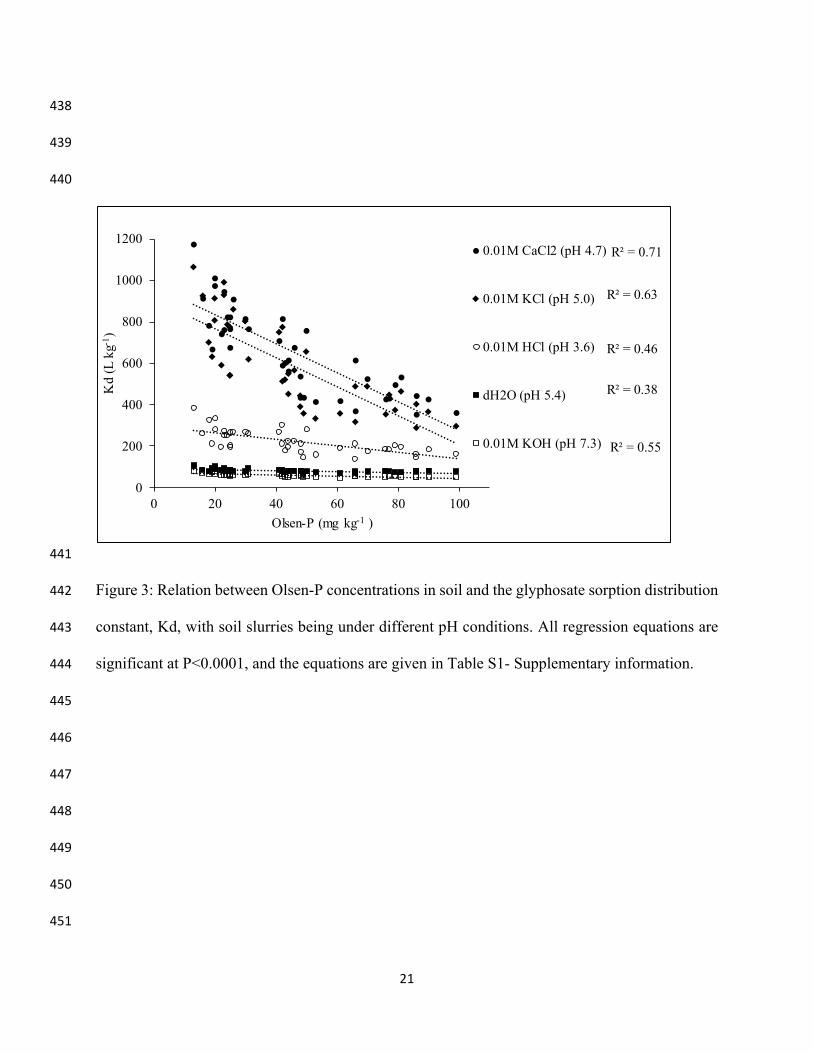
Increased Olsen-P concentrations in soil was a significant factor (P<0.0001) in the regression 213
analysis to explain reduced glyphosate Kd values in soil (Table S1- Supplementary information). 214
Regardless of the ionic solution used in the batch equilibrium experiments, increased Olsen P 215
concentrations significantly decreased glyphosate sorption by soil (Figure 3). A maximum 216
reduction in glyphosate sorption occurred at a pH of 5 (0.01M KCl solution) when the Olsen-P 217
concentrations was on average 89 mg kg-1 Olsen P and the glyphosate Kd value was reduced by 218
57%, relative to the control plots that contained on average 18.75 mg kg-1 Olsen-P (Figure 3). Our 219
results are in agreement with the findings of de Jonge et al. (2001) who also reported that field-220
aged phosphate in soil reduces glyphosate sorption by soil. Iron oxides are important sorption sites 221
for glyphosate and phosphate in soil (Gimsing and Borggaard, 2002b; Gimsing et al., 2004; 222
Ololade, et al., 2014). The iron oxides content of the Orthic Black Chernozem used is within the 223
range of that observed in other Prairie soils in Canada (Obikoya, 2016) suggesting the competitive 224
effect of phosphate on glyphosate sorption could be applicable to a wider range of soils in the 225
Prairie region of Canada particularly with low pH and high Fe content. 226
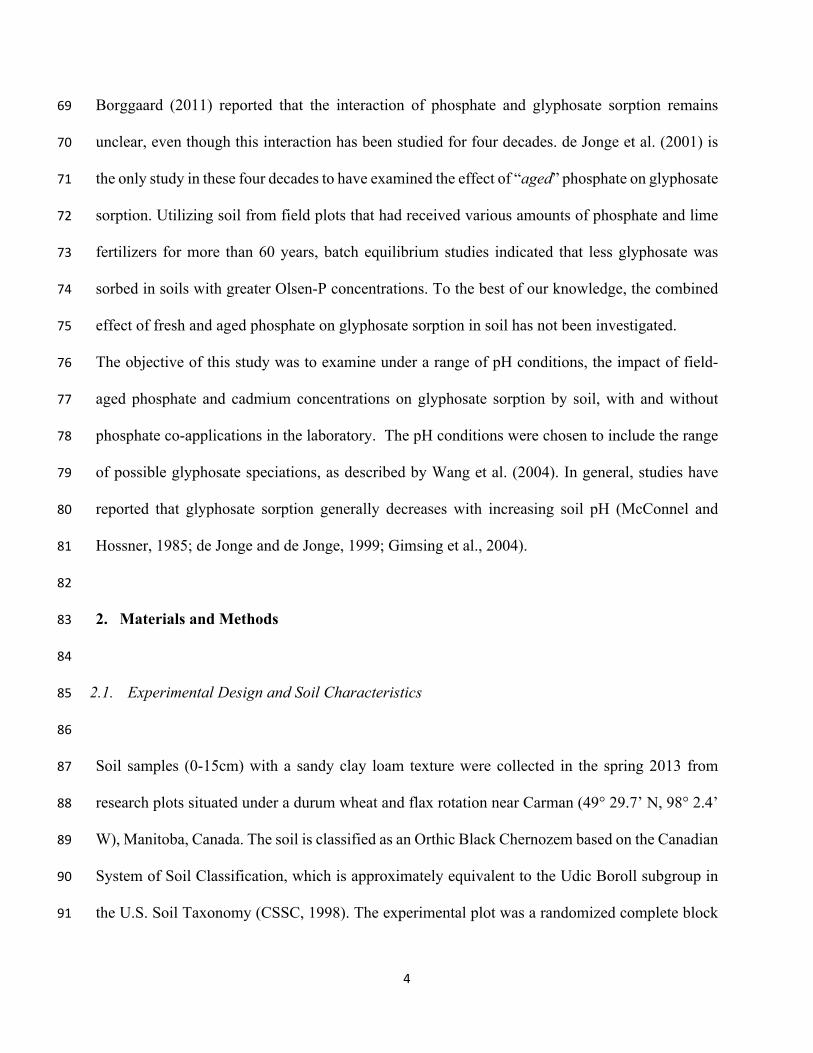
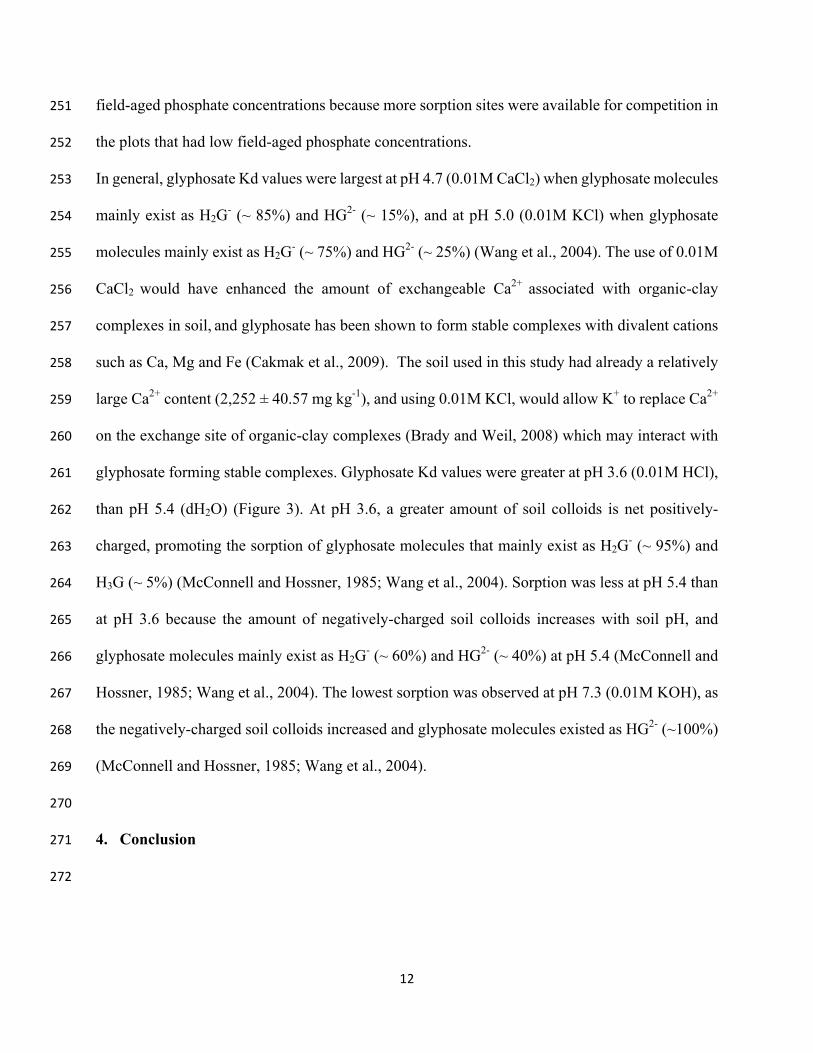
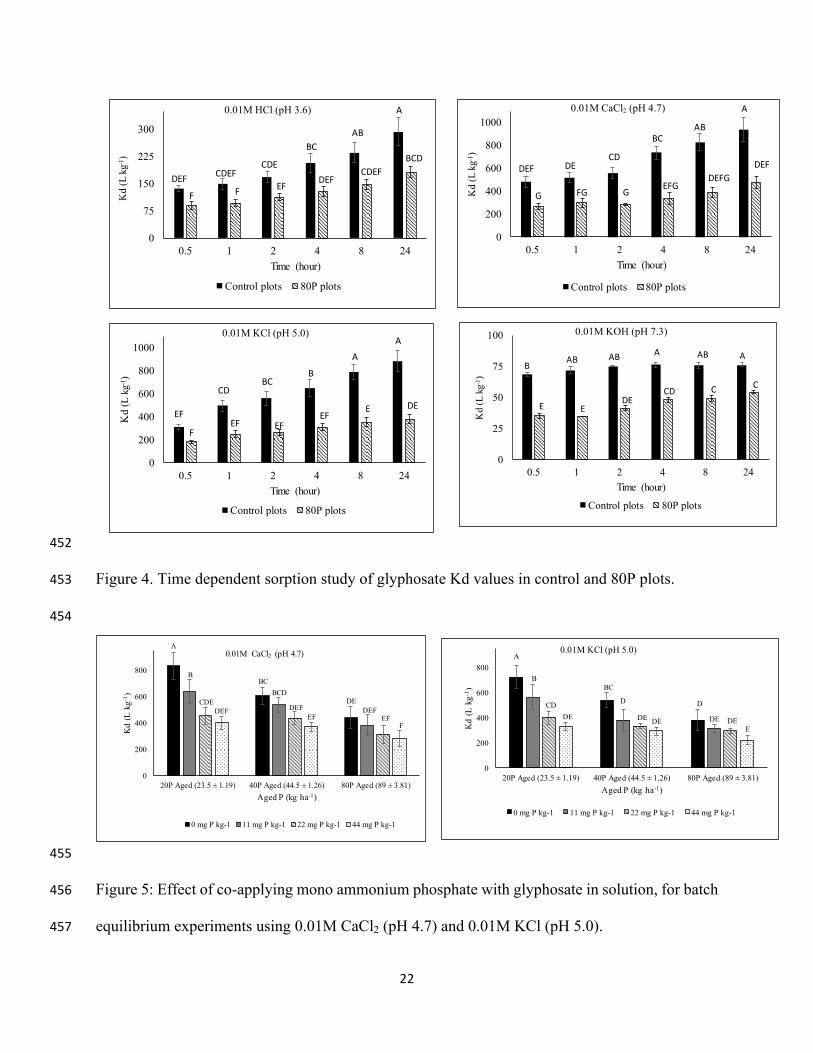
At pH 5.4, in both 80P and control, time had no significant effect on glyphosate Kd values and 227
sorption was always significantly smaller in 80P than control plots. For all other pH conditions, 228
11
glyphosate sorption approached equilibrium at approximately 8 h because there were no significant 229
differences in glyphosate Kd values between 8 and 24 h (Figure 4). For these pH conditions, 230
glyphosate sorption was almost always significantly smaller in 80P than control plots, regardless 231
of the time, except for 0.5, 1 and 2 h under pH 3.6 and 0.5 h under pH 5.0 (Figure 4). In general, 232
longer shaking hours resulted in greater numerically differences in glyphosate Kd values between 233
control and 80P plots. 234
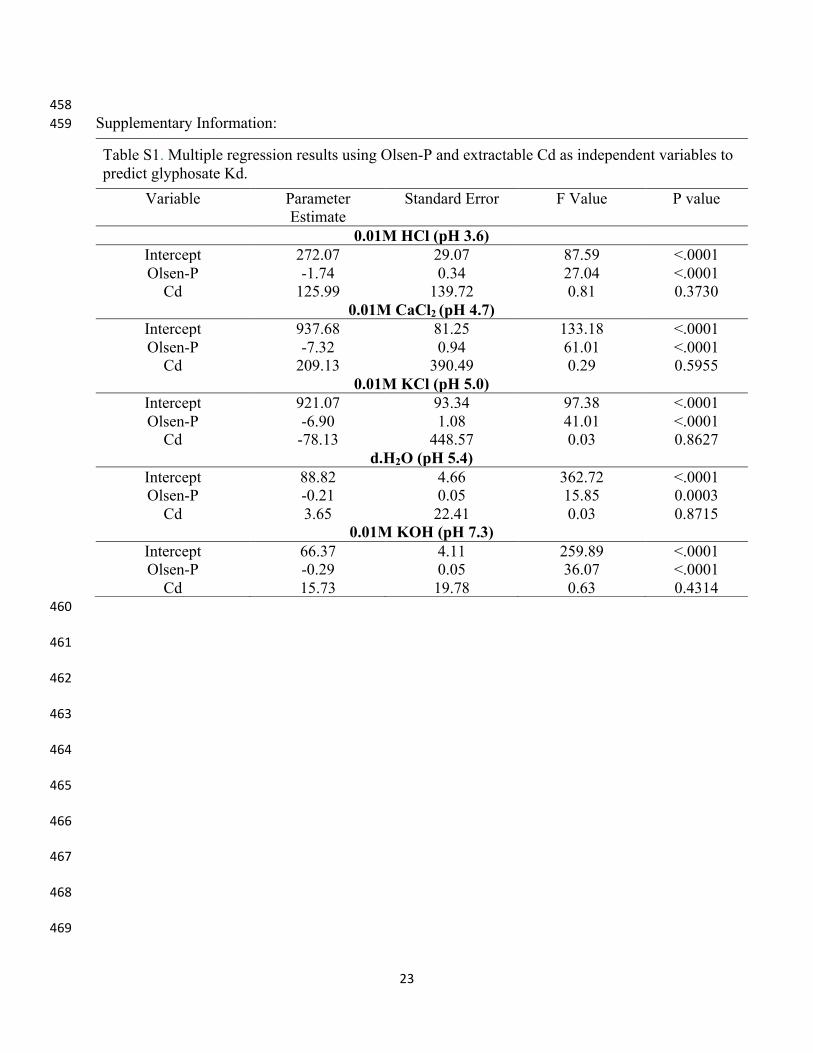
Regardless of the ionic solution used (Figure 5), there was a significant interaction (P < 0.01) 235
between field-aged and fresh phosphate on glyphosate sorption (Table S2- Supplementary 236
information). In general, regardless of the amount of aged phosphate in soil, the addition of fresh 237
MAP to the ionic solutions numerically reduced glyphosate Kd values, suggesting that phosphate 238
and glyphosate compete for the same sorption sites in soil and that phosphate is preferentially 239
sorbed when added with glyphosate to soil. Additions of 11 mg P kg-1 to the 0.01M CaCl2 solutions 240
had no significant effect on glyphosate Kd values, except in the 20 P plots containing relatively 241
small Olsen-P concentrations (Figure 5). The addition of 22 or 44 mg P kg-1 to the 0.01M CaCl2 242
solutions always significantly reduced glyphosate Kd values, except the addition of 22 mg P kg-1 243
to 80 P plots (Figure 5). For the largest co-application (44 mg P kg-1), glyphosate Kd values were 244
reduced on average by 52% in 20P plots, but by only 37% in the 80P plots. Additions of 11, 22 or 245
44 mg P kg-1 to 0.01M KCl solutions always significantly reduced glyphosate Kd values except 246
for 80 P plots for which only the addition of 44 mg P kg-1 resulted in a significant reduction in 247
glyphosate Kd values (Figure 5). For the 44 mg P kg-1 co-application, glyphosate Kd values were 248
reduced on average by 54% in 20P plots, but by 42% in the 80P plots. Thus, the largest impact of 249
fresh MAP applications on reducing sorption sites for glyphosate occurred in soils with smaller 250
12
field-aged phosphate concentrations because more sorption sites were available for competition in 251
the plots that had low field-aged phosphate concentrations. 252
In general, glyphosate Kd values were largest at pH 4.7 (0.01M CaCl2) when glyphosate molecules 253
mainly exist as H2G- (~ 85%) and HG2- (~ 15%), and at pH 5.0 (0.01M KCl) when glyphosate 254
molecules mainly exist as H2G- (~ 75%) and HG2- (~ 25%) (Wang et al., 2004). The use of 0.01M 255
CaCl2 would have enhanced the amount of exchangeable Ca2+ associated with organic-clay 256
complexes in soil, and glyphosate has been shown to form stable complexes with divalent cations 257
such as Ca, Mg and Fe (Cakmak et al., 2009). The soil used in this study had already a relatively 258
large Ca2+ content (2,252 ± 40.57 mg kg-1), and using 0.01M KCl, would allow K+ to replace Ca2+ 259
on the exchange site of organic-clay complexes (Brady and Weil, 2008) which may interact with 260
glyphosate forming stable complexes. Glyphosate Kd values were greater at pH 3.6 (0.01M HCl), 261
than pH 5.4 (dH2O) (Figure 3). At pH 3.6, a greater amount of soil colloids is net positively-262
charged, promoting the sorption of glyphosate molecules that mainly exist as H2G- (~ 95%) and 263
H3G (~ 5%) (McConnell and Hossner, 1985; Wang et al., 2004). Sorption was less at pH 5.4 than 264
at pH 3.6 because the amount of negatively-charged soil colloids increases with soil pH, and 265
glyphosate molecules mainly exist as H2G- (~ 60%) and HG2- (~ 40%) at pH 5.4 (McConnell and 266
Hossner, 1985; Wang et al., 2004). The lowest sorption was observed at pH 7.3 (0.01M KOH), as 267
the negatively-charged soil colloids increased and glyphosate molecules existed as HG2- (~100%) 268
(McConnell and Hossner, 1985; Wang et al., 2004). 269
270
4. Conclusion 271
272
13
Analytical-grade glyphosate showed similar results as a commercially-available glyphosate 273
formulation. Long-term additions of phosphate fertilizers to soils will reduce the capacity of the 274
soil to bind glyphosate under a wide range of pH conditions, but the impurities of Cd in these 275
fertilizers have no impact on glyphosate sorption. Fresh applications of phosphate fertilizers to 276
most soils will significantly reduce the availability of sorption sites for glyphosate. However, this 277
reduction in sorption site availability will be small in soils that have exceptionally high phosphate 278
levels and do not have many sorption sites available for phosphate or glyphosate. Cd 279
concentrations typically found in agricultural fields are not high enough to influence the binding 280
capacity of glyphosate in soil. 281
282
Acknowledgements 283
The authors would like to acknowledge the Natural Sciences and Engineering Research Council 284
of Canada (NSERC) for providing funds for the research, and the University of Manitoba Graduate 285
Fellowship (UMGF), Manitoba Graduate Scholarship (MGS) for stipend to Sirajum Munira. The 286
authors also acknowledge Dr. Francis Zvomuya, Associate professor, Department of Soil Science, 287
University of Manitoba for his support in statistical analysis. The authors would like to thank Md. 288
Mofizul Islam and Rob Ellis for their support. 289
290
References 291
292
Aksu, Z., Kabasakal, E., 2005. Adsorption characteristics of 2, 4-dichlorophenoxyacetic acid (2,4-293
D) from aqueous solution on powdered activated carbon. J. Environ. Sci. Health Part B 40, 545 –294
70. (DOI: 10.1081/PFC-200061533). 295
14
Barnhisel, R., Bertsch, P.M., 1982. Total Aluminum. In Methods of Soil Analysis. Part 2. 296
Chemical and Microbiological Properties, Agronomy 9, 2nd ed. 275–300. American Society of 297
Agronomy, Soil Science Society America, Madison, WI. USA. 298
Benbrook, C.M., 2012. Impacts of genetically engineered crops on pesticide use in the U.S. -- the 299
first sixteen years. Environ. Sci. Euro. 24, 24. (DOI: 10.1186/2190-4715-24-24). 300
Borggaard, O.K., 2011. Does phosphate affect soil sorption and degradation of glyphosate? – A 301
review. Trends Soil Sci. Plant. Nutr. J. 2, 16-27 302
(http://www.academyjournal.net/asj/index.php/TSPN/article/view/193/pdf_46). 303
Brady, N.C., Weil, R.R., 2008. Soil Phosphorous and Potassium. In The Nature and Properties of 304
Soils. 14th ed. 594-638. Pearson Education, Inc. Upper Saddle River, NJ. USA. 305
Cáceres-jensen, L., Gan, J., Báez, M., Fuentes, R., Escudey, M., 2009. Adsorption of glyphosate 306
on variable-charge volcanic ash-derived soils. J. Environ. Qual. 38, 1449-1457. (DOI: 307
10.2134/jeq2008.0146). 308
Cakmak I., Yazici, A., Tutus, Y., Ozturk, L., 2009. Glyphosate reduced seed and leaf 309
concentrations of calcium, manganese, magnesium, and iron in non-glyphosate resistant soybean. 310
Eur. J. Agronomy 31, 114–119. (DOI:10.1016/j.eja.2009.07.001). 311
CSSC, 1998. Correlation of Canadian taxonomy with their systems, chapter 6. In the Canadian 312
system of soil classification. 155. Agriculture and Agri-food Canada. 313
(http://sis.agr.gc.ca/cansis/publications/manuals/1998-cssc-ed3/cssc3_manual.pdf). 314
de Jonge, H., de Jonge, L.W., 1999. Influence of pH and solution composition of glyphosate and 315
prochloraz to a sandy loam soil. Chemosphere 39, 753-763. (DOI: 10.1016/S0045-316
6535(99)00011-9). 317
15
de Jonge, H., de Jonge, L.W., Jacobsen, O.H., Yamaguchi, T., Moldrup, P., 2001. Glyphosate 318
sorption in soils of different pH and phosphorus content. Soil Sci. 166, 230–238. 319
(DOI: 10.1097/00010694-200104000-00002). 320
FAO, 2012. The world fertilizer outlook, Supply, Phosphate. In current world fertilizer trends and 321
outlook to 2016, 18. Food and agriculture organization of the United Nations, Rome. 322
(ftp://ftp.fao.org/ag/agp/docs/cwfto16.pdf). 323
Farenhorst, A., Bowman, B.T., 1998. Pesticides, food contaminants, and agricultural wastes. J. 324
Environ. Sci. Health, Part B 33, 671-682. (DOI: 10.1080/03601239809373171). 325
Fixen, P.E., Bruulsema, T.W., Jensen, T.L., Mikkelsen, R., Murrell, T.S., Phillips, S.B., Rund, Q., 326
Stewart, W.M., 2010. The fertility of North American soils. Adapted from better crops with plant 327
food. 94. (Reference #10134/Nov. 2010) 328
(http://extension.umd.edu/sites/default/files/_docs/programs/anmp/IPNI_Fertility%20NA%20Soi329
ls%202010.pdf). 330
Frank, K., Beegle, D., Denning, J., 2011. Phosphorus. In recommended chemical soil test 331
procedures for the North Central region. North Central regional research publication no. 221 332
(Revised). 21-26. Missouri Agricultural Experiment Station, SB 1001, USA. 333
(http://msue.anr.msu.edu/uploads/234/68557/Rec_Chem_Soil_Test_Proce55c.pdf). 334
Gaultier, J., Farenhorst, A., Kim, S.M., Saiyed, I., Messing, P., Cessna, A.J., Glozier, N.E., 2009. 335
Sorption-desorption of 2,4-dichlorophenoxyacetic acid by wetland sediments. Wetlands 29, 837–336
844. (DOI: 10.1672/08-42.1). 337
Gimsing, A.L., Borggaard O.K., 2001. Effect of KCl and CaCl2 as background electrolytes on the 338
competitive adsorption of glyphosate and phosphate on goethite. Clays Clay Miner. 49, 270-275. 339
(http://ccm.geoscienceworld.org/content/49/3/270). 340
16
Gimsing, A.L., Borggaard O.K., 2002a. Effect of phosphate on the adsorption of glyphosate on 341
soils, clay minerals and oxides. Int. J. Environ. Anal. Chem. 82, 545-552. (DOI: 342
10.1080/0306731021000062964). 343
Gimsing, A.L., Borggaard O.K., 2002b. Competitive adsorption and desorption of glyphosate and 344
phosphate on clay silicates and oxides. Clay Miner. 37, 509-515. 345
(DOI:10.1180/0009855023730049). 346
Gimsing, A.L., Borggaard. O.K., Bang, M., 2004. Influence of soil composition on adsorption of 347
glyphosate and phosphate by contrasting Danish surface soils. Eur. J. Soil Sci. 55, 183-191. 348
(DOI: 10.1046/j.1365-2389.2003.00585.x). 349
Gimsing, A.L., Borggaard, O.K., 2007. Phosphate and glyphosate adsorption by hematite and 350
ferrihydrite and composition with other variable-charge minerals. Clays Clay Miner. 55, 108-114. 351
(DOI: http://dx.doi.org.uml.idm.oclc.org/10.1346/ccmn.2007.0550109). 352
Gimsing, A.L., Szilas, C., Borggaard, O.K., 2007. Sorption of glyphosate and phosphate by 353
variable-charge tropical soils from Tanzania. Geoderma 138, 127-132. (DOI: 354
10.1016/j.geoderma.2006.11.001). 355
Global strategic business report (GSBR), 2011. Glyphosate: A global strategic business report. 356
Global Industry Analysis, Inc., USA. 357
(http://www.strategyr.com/gia_new/strategyr_new/pressMCP-6447.asp). 358
Grant, C., Flaten, D., Tenuta, M., Malhi, S., Akinremi, W., 2013. The effect of rate and cd 359
concentration of repeated phosphate fertilizer applications on seed Cd concentration varies with 360
crop type and environment. Plant Soil. 372, 221–233 (DOI: 10.1007/s11104-013-1691-3). 361
Gupta, V.K., Imran, A., Suhas, Saini, V.K., 2006. Adsorption of 2,4-D and carbofuran pesticides 362
using fertilizer and steel industry wastes. J. Colloid Interface Sci. 299, 556-63. (DOI: 363
17
10.1016/j.jcis.2006.02.017). 364
International Cadmium Association, 2015. Environment. Levels of cadmium in the environment. 365
(www.cadmium.org accessed 20th September, 2015). 366
Kanissery, R.G., Welshb, A., Sims, G. K., 2015. Effect of soil aeration and phosphate addition on 367
the microbial bioavailability of carbon-14-glyphosate. J. Environ. Qual. 44, 137-144. (DOI: 368
10.2134/jeq2014.08.0331). 369
Lambert, R., Grant, C. Sauvé. S., 2007. Cadmium and zinc in soil solution extracts following the 370
application of phosphate fertilizers. Sci. Total Environ. 378, 293-305 371
(DOI:10.1016/j.scitotenv.2007.02.008). 372
Lindsay, W.L., Norvell. W.A., 1978. Development of a DTPA soil test for zinc, iron, manganese, 373
and copper. Soil Sci. Soc. Am. J. 42, 421-428. 374
(DOI:10.2136/sssaj1978.03615995004200030009x). 375
McConnell, J.S., Hossner, L.R., 1985. pH - dependent adsorption isotherms of glyphosate. J. 376
Agric. Food Chem. 33, 1075-1078. (DOI: 10.1021/jf00066a014). 377
Nelson, D.W., Sommers, L.E., 1996. Total carbon, organic carbon, and organic matter. In methods 378
of soil analysis. Part 3. Chemical methods. 961-1010. American Society of Agronomy, Soil 379
Science Society America, Madison, WI. USA. 380
(https://dl.sciencesocieties.org/publications/books/abstracts/sssabookseries/methodsofsoilan3/96381
1/preview). 382
Obikoya, O.A., 2016. Changes in Soil Test Phosphorus and Phosphorus Forms with Continuous 383
Phosphorus Fertilizer Addition to Contrasting Prairie soils. Master’s thesis, department of soil 384
science, university of Manitoba, Canada. 385
18
OECD, 2000. Guideline for the testing of chemicals 106. Adsorption–desorption using a batch 386
equilibrium method. Adopted 21st January, 2000. (DOI: 10.1787/20745753). 387
Ololade, I.A., Oladoja, N.A., Oloye, F.F., Alomaja, F., Akerele, D.D., Iwaye, J., Aikpokpodion, 388
P., 2014. Sorption of glyphosate on soil components: The roles of metal oxides and organic 389
materials. Soil sed. contam. 23, 571–585. (DOI: 10.1080/15320383.2014.846900). 390
Sørensen, S.R., Schultz, A., Jacobsen, O.S., Aamand, J., 2006. Sorption, desorption and 391
mineralisation of the herbicides glyphosate and MCPA in samples from two Danish soil and 392
subsurface profiles. Environ. Pollut. 141, 84–194. (DOI:10.1016/j.envpol.2005.07.023). 393
Sprankle, P., Meggitt, W.F., Penner, D., 1975. Adsorption, mobility and microbial degradation of 394
glyphosate in the soil. Weed Sci. 23, 229-234. (http://www.jstor.org/stable/4042279). 395
U.S. Environmental Protection Agency (EPA), 1996. Method 3050B: Acid digestion of sediments 396
sludges and soils. In Hazardous Waste Test Methods / SW-846-Test methods for evaluating solid 397
waste, physical/chemical methods, 3000 series-inorganic samples preparation. 4-12. 398
(https://www.epa.gov/sites/production/files/2015-06/documents/epa-3050b.pdf). 399
Wang, Y., Zhou, D., Luo, X., Sun, R., Chen, H., 2004. Cadmium adsorption in montmorillonite as 400
affected by glyphosate. J. Environ. Sci. 16, 881-884. 401
(http://www.ncbi.nlm.nih.gov/pubmed/15900712). 402
Warncke, D., Brown, J.R., 2011. Potassium and Other Basic Cations. In recommended chemical 403
soil test procedures for the North Central region. North Central regional research publication no. 404
221 (Revised). 31-33. Missouri Agricultural Experiment Station SB 1001. 405
(http://www.naptprogram.org/files/napt/north-central-states-methods-manual-2012.pdf). 406
Whitney, D.A., 2011. Micronutrients: Zinc, Iron, Manganese and Copper. In recommended 407
chemical soil test procedures for the North Central region. North Central regional research 408
19
publication no. 221 (Revised). 41-44. Missouri Agricultural Experiment Station, SB 1001, USA. 409
(http://msue.anr.msu.edu/uploads/234/68557/Rec_Chem_Soil_Test_Proce55c.pdf). 410
Zhou, D.M., Wang, Y.J., Cang, L., Hao, X.Z., Luo, X.S., 2004. Adsorption and cosorption of 411
cadmium and glyphosate on two soils with different characteristics. Chemosphere 57, 1237-1244. 412
(DOI:10.1016/j.chemosphere.2004.08.043). 413
414
415
416
417
418
419
420
421
422
423
424
425
426
427
428
20
429
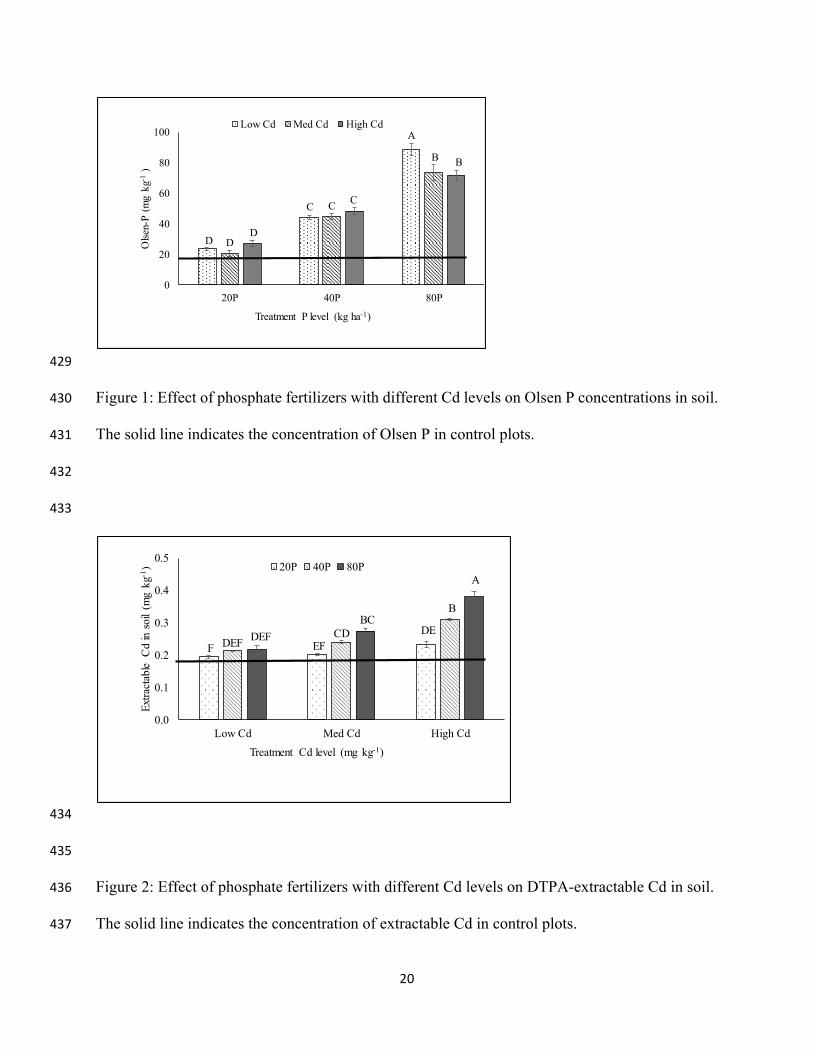
Figure 1: Effect of phosphate fertilizers with different Cd levels on Olsen P concentrations in soil. 430
The solid line indicates the concentration of Olsen P in control plots. 431
432
433
434
435
Figure 2: Effect of phosphate fertilizers with different Cd levels on DTPA-extractable Cd in soil. 436
The solid line indicates the concentration of extractable Cd in control plots. 437
0
20
40
60
80
100
20P 40P 80P
Olse
n-P
(mg
kg-1
)
Treatment P level (kg ha-1)
Low Cd Med Cd High CdA
B B
CCC
DDD
0.0
0.1
0.2
0.3
0.4
0.5
Low Cd Med Cd High Cd
Extra
ctab
le C
d in
soil
(mg
kg-1
)
Treatment Cd level (mg kg-1)
20P 40P 80PA
B
DEBC
CDEF
DEFDEFF
21
438
439
440
441
Figure 3: Relation between Olsen-P concentrations in soil and the glyphosate sorption distribution 442
constant, Kd, with soil slurries being under different pH conditions. All regression equations are 443
significant at P<0.0001, and the equations are given in Table S1- Supplementary information. 444
445
446
447
448
449
450
451
R² = 0.71
R² = 0.63
R² = 0.46
R² = 0.38
R² = 0.55
0
200
400
600
800
1000
1200
0 20 40 60 80 100
Kd
(L k
g-1)
Olsen-P (mg kg-1 )
0.01M CaCl2 (pH 4.7)
0.01M KCl (pH 5.0)
0.01M HCl (pH 3.6)
dH2O (pH 5.4)
0.01M KOH (pH 7.3)
22
452
Figure 4. Time dependent sorption study of glyphosate Kd values in control and 80P plots. 453
454
455
Figure 5: Effect of co-applying mono ammonium phosphate with glyphosate in solution, for batch 456
equilibrium experiments using 0.01M CaCl2 (pH 4.7) and 0.01M KCl (pH 5.0). 457
0
200
400
600
800
20P Aged (23.5 ± 1.19) 40P Aged (44.5 ± 1.26) 80P Aged (89 ± 3.81)
Kd
(L k
g-1)
Aged P (kg ha-1)
0 mg P kg-1 11 mg P kg-1 22 mg P kg-1 44 mg P kg-1
DEFDEF
A
DEFEF
F
BCDBC
CDE
B
DE
EF
0.01M CaCl2 (pH 4.7)
0
200
400
600
800
20P Aged (23.5 ± 1.19) 40P Aged (44.5 ± 1.26) 80P Aged (89 ± 3.81)
Kd
(L k
g-1)
Aged P (kg ha-1)
0 mg P kg-1 11 mg P kg-1 22 mg P kg-1 44 mg P kg-1
DE
BC
DE
D D
DE DEE
B
CD
DE
A0.01M KCl (pH 5.0)
0
200
400
600
800
1000
0.5 1 2 4 8 24
Kd
(L k
g-1 )
Time (hour)
Control plots 80P plots
EFEF
B
EF
A
E DE
EF
BCCD
F
A
0.01M KCl (pH 5.0)
0
25
50
75
100
0.5 1 2 4 8 24K
d (L
kg-
1 )Time (hour)
Control plots 80P plots
E
BA
CD
A
C CDE
ABAB
E
AB
0.01M KOH (pH 7.3)
0
75
150
225
300
0.5 1 2 4 8 24
Kd
(L k
g-1 )
Time (hour)
Control plots 80P plots
FDEF
BC
DEF
A
CDEFBCD
EF
CDECDEF
F
AB
0.01M HCl (pH 3.6)
0
200
400
600
800
1000
0.5 1 2 4 8 24
Kd
(L k
g-1 )
Time (hour)
Control plots 80P plots
FG
DEF
BC
EFG
A
DEFGDEF
G
CDDE
G
AB
0.01M CaCl2 (pH 4.7)
23
458Supplementary Information: 459
460
461
462
463
464
465
466
467
468
469
Table S1. Multiple regression results using Olsen-P and extractable Cd as independent variables to predict glyphosate Kd.
Variable Parameter Estimate
Standard Error F Value P value
0.01M HCl (pH 3.6) Intercept 272.07 29.07 87.59 <.0001 Olsen-P -1.74 0.34 27.04 <.0001
Cd 125.99 139.72 0.81 0.3730 0.01M CaCl2 (pH 4.7)
Intercept 937.68 81.25 133.18 <.0001 Olsen-P -7.32 0.94 61.01 <.0001
Cd 209.13 390.49 0.29 0.5955 0.01M KCl (pH 5.0)
Intercept 921.07 93.34 97.38 <.0001 Olsen-P -6.90 1.08 41.01 <.0001
Cd -78.13 448.57 0.03 0.8627 d.H2O (pH 5.4)
Intercept 88.82 4.66 362.72 <.0001 Olsen-P -0.21 0.05 15.85 0.0003
Cd 3.65 22.41 0.03 0.8715 0.01M KOH (pH 7.3)
Intercept 66.37 4.11 259.89 <.0001 Olsen-P -0.29 0.05 36.07 <.0001
Cd 15.73 19.78 0.63 0.4314
24
470
471
472
473
Table S2. Effect of field P-level (20P, 40, 80P kg ha-1) and fresh-P applications (0P 20P 40P
80P kg ha-1) on glyphosate Kd values in batch equilibrium experiments utilizing either 0.01M
CaCl2 or 0.01M KCl as a background liquid.
Effect Num DF Den DF F Value Pr > F
0.01M CaCl2 (pH 4.7)
Field-P 2 33 52.00 <.0001
Fresh-P 3 33 45.56 <.0001
Fresh-P X Field-P 6 33 4.31 <.0026
0.01M KCl (pH 5.0)
Field-P 3 33 40.56 <.0001
Fresh-P 3 33 39.18 <.0001
Fresh-P X Field-P 6 33 3.54 0.0081 474475 476
477