Embed Size (px)
Citation preview

Report
The Performance of Partially Selective Schools in England National Foundation for Educational Research (NFER)

The Performance of Partially Selective Schools in England Karen Wespieser Claudia Sumner Jennifer Garry Daniele Bernardinelli Louis Coiffait Published in March 2017 By the National Foundation for Educational Research, The Mere, Upton Park, Slough, Berkshire SL1 2DQ www.nfer.ac.uk
© 2017 National Foundation for Educational Research Registered Charity No. 313392 ISBN: 978-1-911039-41-9 How to cite this publication: Wespieser, K., Sumner, C., Garry, J., Bernardinelli, D. and Coiffait, L. (2017). The Performance of Partially Selective Schools in England. Slough: NFER.

Contents
1 Introduction ................................................................................ 1
2 At a glance .................................................................................. 1
3 Background ................................................................................ 2
4 Findings ..................................................................................... 5
5 Discussion ................................................................................ 10
6 Recommendations ................................................................... 10
7 References ............................................................................... 11
Appendix A: List of partially selective schools in England ..... 12
Appendix B: Methodology .......................................................... 14

The performance of partially selective schools in England 1
1 Introduction
In September 2016, the Department for Education (DfE) published the consultation paper Schools That Work for Everyone, which proposed ‘a case for relaxing restrictions on selective education, in order to provide more good school places within the system’. The consultation also suggested support for ‘proposals to establish new partially selective schools’ (DfE, 2016).
Partially selective schools are those that select a proportion of their intake (usually on the basis of academic ability) and the remainder on standard criteria.
There is very little research into partially selective schools or evidence about the impact they have on the students who attend them. NFER conducted new analysis to compare outcomes between those who attend partially selective schools and a matched comparison group of those who do not, in order to inform our response to the government’s consultation.
A summary of our consultation response can be found on the NFER website (NFER, 2016).
2 At a glance
We identified a total of 38 partially selective schools, which currently admit more than ten per cent of their students on the basis of ‘ability’ or ‘aptitude’ (but are not fully selective). Of these 38 schools, we found the largest proportion (20) selected on academic ability alone. Despite this, the student profile of partially selective schools is not comparable to that of grammar schools. For example, across the 38 schools an average of 11 per cent of pupils are eligible for free school meals (FSM) (compared to three per cent in fully selective secondary schools and 16 per cent in non-selective secondary schools nationally).
Our analysis revealed that, when compared to similar pupils in comparable schools, there were no significant effects of attending a partially selective school. Where significant differences are observable, they reveal small negative effects based on some outcome measures, particularly for pupils in partially selective schools with low prior attainment.1
The research also identified potential access issues in relation to the admission policies of some partially selective schools in our population. NFER suggests that it may be appropriate for these policies to be reviewed by the Office of the Schools Adjudicator.
1 The small number of partially selective schools available for study implies that results should be treated with some caution

The performance of partially selective schools in England 2
3 Background
What is partial selection?
Schools That Work for Everyone includes the following definition of partially selective schools:
Partially selective schools take a proportion of their places by ability or aptitude and a proportion without reference to aptitude or ability (DfE, 2016)
In addition, there are a sub-set of partially selective schools known as ‘bilateral schools’. These are schools which place the selected students in a dedicated stream within the school in question.
We used the DfE definition above in our research, with the following additional criteria:
A school that selects more than ten per cent of its intake, but less than 100 per cent.
What is currently permitted?
The proposal to extend selection within the state sector signifies a new policy direction which challenges a consensus that has prevailed across the mainstream political spectrum for decades.
Under current rules set out in the School Standards and Framework Act 1998 and the School Admissions Code, selection
Example 1: Reading Girls’ School2
Reading Girls’ School is a partially selective school for girls aged 11-16... We are a comprehensive school, welcoming students of all backgrounds and abilities, as we know that all students bring their own talents to our community. We value our students equally and take great care to make sure that every one of them is happy, secure and successful. We also have a Selective Stream which provides a more intensive academic education. It is designed to enable the most able girls to progress through an enhanced curriculum to achieve the highest grades of which they are capable.
Basis of selection: academic ability | Proportion selected: 25 per cent
by ability is prohibited for maintained schools, other than those whose admission arrangements were determined before 1998 or those schools which have arrangements to admit up to ten per cent of students on the basis of ‘aptitude’ in a specialist subject.
Maintained schools may select on the basis of aptitude if:
• they used such selection in 1997/1998 and have continued to use it since then without significant changes
• they have arrangements to select by aptitude, which must not allow for more than ten per cent of the total admissions intake to be allocated on the basis of such aptitude (even if the school has more than one specialism). The specialist subjects on which a school may select by aptitude are limited to:
2 All case study text is quoted directly from school website and/or admission policy

The performance of partially selective schools in England 3
− physical education or sport, or one or more sports
− the performing arts, or any one or more of those arts
− the visual arts, or any one or more of those arts
− modern foreign languages, or any such language
− design and technology and information technology (only schools which selected on either of these specialist subjects in the school year 2007/08 and every subsequent year may continue to do so) (DfE, 2014).
How many are there?
We identified a total of 38 partially selective schools. A full list can be found in Appendix A. This is in line with the DfE expectation as set out in Schools That Work for Everyone that ‘there are currently only a small number of [partially selective] schools, with levels of partial selection varying (most being between ten and 35 per cent)’ (DfE, 2016).
As far as we could ascertain, there is no official register of partially selective schools. Therefore, in order to identify our population, we conducted a thorough and systematic screening of the school admissions pages on the websites of all local authorities in England. In instances where the admission policies for individual schools were not available on the local authority website, the admissions policies were taken from the school website.
We excluded from the population of partially selective schools:
• schools that use arrangements currently permitted under the Admissions Code 2014 to select up to ten per cent of pupils by aptitude in a specialist subject
• grammar schools that are wholly selective
• maintained boarding schools.
Example 2: Kingsdale Foundation School
Kingsdale Foundation School is a co-educational academy in Southwark. Kingsdale is a former maintained school with pre-existing partially selective admissions. As such, it is permitted to maintain the proportion of selective admissions at the levels they were set in 1998 but not change these (unless it wishes to remove selection entirely). The school’s partially selective proportions are that a maximum of 15 per cent of the admissions number per year group will be designated for music or sports scholarships which qualify for entry to the school.
Basis of selection: music and sport | Proportion selected: 15 per cent
Why is partial selection important?
The Schools That Work for Everyone consultation proposed ‘support...to establish new partially selective schools’ (DfE, 2016). However it provided no evidence about the effectiveness of this type of school.
Media reports suggest that the likelihood of opening any new selective schools before 2020 is remote because of the extensive processes involved in starting a new, or converting an existing,
The performance of partially selective schools in England 4
school (e.g. Vaughan, 2016). Political expediency may, therefore, result in selection expanding initially through the introduction of ‘grammar streams’ at existing schools – the creation of new partially selective schools.
It is therefore, important that we understand as much as possible about partially selective schools to inform any new policies relating to expansion of the sector. There is not much evidence on these types of schools, so this research starts to fill this gap.
Example 3: King Edward VI Academy
King Edward VI, in Spilsby, Lincolnshire, converted to academy status in the autumn of 2012. The school was formerly a Humanities College. They are a bilateral academy – that is, a secondary school with a grammar stream in each year of entry.
Basis of selection: academic ability | Proportion selected: 32 per cent
Before expanding selection, we strongly recommend that further research is undertaken to understand critical issues around all forms of selection, in particular: the 11+ test, the impact of private tutoring, the impact on those that are either not put forward for the test or not selected, and the ‘value added’ by selective and partially selective institutions.
To enable such research, NFER suggests that the Government consider requiring all selective and partially selective schools and local authorities to make 11+ test results available for research purposes, since it is currently very difficult to analyse the basis of 11+ selection, or explore how this might compare to data from other
assessments, such as at Key Stage 2 (KS2) national curriculum tests.
The performance of partially selective schools in England 5
4 Findings
We identified 38 partially selective schools in England with levels of selection varying from 12 to 45 per cent of students on the basis of ‘ability’ or ‘aptitude’ (primarily in music or modern foreign languages). Partially selective schools are principally located in the south of England, with a predominance in the Home Counties (although there are notable exceptions in a number of London boroughs and Liverpool). A full list can be found in Appendix A.
How are pupils selected?
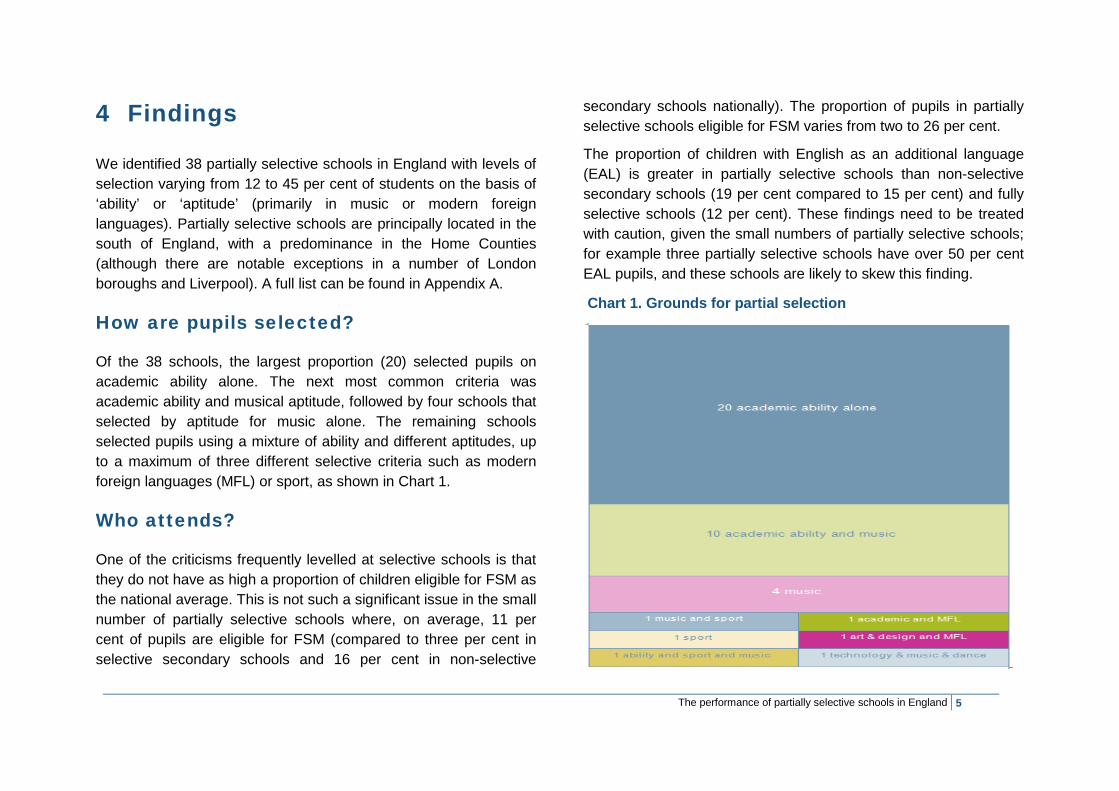
Of the 38 schools, the largest proportion (20) selected pupils on academic ability alone. The next most common criteria was academic ability and musical aptitude, followed by four schools that selected by aptitude for music alone. The remaining schools selected pupils using a mixture of ability and different aptitudes, up to a maximum of three different selective criteria such as modern foreign languages (MFL) or sport, as shown in Chart 1.
Who attends?
One of the criticisms frequently levelled at selective schools is that they do not have as high a proportion of children eligible for FSM as the national average. This is not such a significant issue in the small number of partially selective schools where, on average, 11 per cent of pupils are eligible for FSM (compared to three per cent in selective secondary schools and 16 per cent in non-selective
secondary schools nationally). The proportion of pupils in partially selective schools eligible for FSM varies from two to 26 per cent.
The proportion of children with English as an additional language (EAL) is greater in partially selective schools than non-selective secondary schools (19 per cent compared to 15 per cent) and fully selective schools (12 per cent). These findings need to be treated with caution, given the small numbers of partially selective schools; for example three partially selective schools have over 50 per cent EAL pupils, and these schools are likely to skew this finding.
Chart 1. Grounds for partial selection
The performance of partially selective schools in England 6
Pupil attainment
In order to identify the effect on attainment of being educated at a partially selective school, we compared the outcomes of pupils in partially selective schools with the outcomes of similar pupils in comparable non-selective schools.
The first step consisted of using propensity score matching (PSM) to identify a group of schools comparable to the partially selective schools in terms of prior attainment and deprivation. Overall the school level PSM resulted in 36 of the 38 partially selective schools being matched to a total of 153 non-selective schools (the remaining two partially selective schools failed to find a match in the comprehensive school population, principally due to their large proportion of high prior attainment pupils). We then matched pupils in partially selective schools to similar pupils in the comparison group of non-selective schools. The final analysis was carried out using pupil level data on attainment and pupil characteristics of the pupils identified by the second PSM stage. This analysis involved multi-level modelling and logistic regression analysis. A more detailed description of the methodology can be found in Appendix B.
Overall pupil performance
Overall, when compared to similar pupils in comparable schools, there were no significant effects of attending a partially selective school. Where significant differences are observable, they reveal small negative effects.
We looked for differences in five pupil performance measures based on 2015 attainment data:
• capped GCSE (and equivalents) point score
• five A* to C at GCSE (or equivalent) including English and mathematics
• five A* to C at GCSE (GCSE only) including English and mathematics
• pupil achieved expected progress in English
• pupil achieved expected progress in mathematics.
We found that pupil performance in partially selective schools (controlling for prior attainment and other pupil characteristics) is, at best, the same as the performance of similar pupils in non-selective schools. By some measures, performance of some pupils in partially selective schools is worse.
No significant difference was found between the capped GCSE point scores of pupils in either group of schools. Similarly, the average probability of a pupil achieving expected progress in both English and mathematics did not differ significantly between the partially selective and non-selective schools. This is true after accounting for prior attainment, FSM, English as an additional language (EAL) and ethnicity of the pupils. However, there is a lower probability of pupils obtaining five good GCSEs or equivalent, including English and mathematics in partially selective schools, although the difference varies substantially with pupil characteristics.

The performance of partially selective schools in England 7
Table 1 Difference in overall pupil performance
Achievement Indicator Estimated
Difference1 / Probability(%)2
Capped GCSE total point score1 -4.4 5 A*-C GCSE (or equivalent) inc English and maths2
-6.1% to -0.1%*
5 A*-C at GCSE (GCSE only) inc English and maths2
-6.5% to -0.2%*
Pupil achieved expected progress in English2 0.1% to 0.4% Pupil achieved expected progress in Maths2 -2.7% to -0.3% * Statistically significant
1. Estimated average difference in capped GCSE total point score between partially selective school pupils and similar non-selective school pupils.
2. Range of differences in the predicted probability of a pupil achieving the corresponding outcome between partially selective school pupils and non-selective school pupils. The estimated difference in probability depends on prior attainment.
Pupil performance by prior attainment
Whilst it is not possible to identify which pupils entered partially selective schools via the selection process, we can analyse the performance of pupils in relation to their prior attainment.
As with overall pupil performance, we found that, at all levels of prior attainment performance, the outcomes of pupils at Key Stage 4 (KS4) in partially selective schools was either similar or slightly worse than performance of similar pupils in non-selective schools. Low prior attaining pupils seem to be the most negatively
associated with attending a partially selective school as shown in Chart 2.
Chart 2. Pupil performance by prior attainment3
3 * statistically significant results
-7.3*
-8.4*
-3.4
-3.8
-3.7
-3.4
3
2.2
-1.4
-1.6
3.8
-4.9*
-9 -7 -5 -3 -1 1 3
5 A*-C GCSEs (or equivalents) including English and Math
5 A*-C GCSEs (GCSEs only) including English and Math
Progress in English
Progress in Math
High Average Low

The performance of partially selective schools in England 8
Low prior attaining pupils may actually be doing slightly worse The results suggest there may be a negative effect of attending a partially selective school based on some outcome measures, particularly for pupils with low prior attainment.
Pupils with low prior attainment who attend partially selective schools are up to eight percentage points less likely to achieve five A* to C GCSEs only (including English and mathematics) than their peers in non-selective schools. However, pupils with average or high prior attainment do not perform significantly better or worse on this outcome measure.
Similarly, low prior attainment pupils in partially selective schools are up to seven percentage points less likely to achieve five A* to C GCSEs or equivalent qualifications (including English and mathematics) than their non-selective school peers. Once again, pupils with average and high prior attainment do not perform significantly better or worse in relation to this outcome measure.
High prior attaining pupils may be negatively affected too Whilst there is no overall significant difference in the probability of achieving the expected progress in English between the two groups of schools, pupils with high prior attainment in partially selective schools are actually performing worse based on progress in mathematics. High prior attainment pupils in partially selective schools are up to five percentage points less likely to achieve their expected progress in mathematics compared to their non-selective school counterparts. Whilst the finding is statistically significant, the
difference in probability varies substantially with pupil characteristics.
Access and equity
Our research identified a number of access issues associated with the admissions policies of partially selective schools.
Allowing parents time to make an informed choice of school
The Admissions Code states that admission authorities must:
take all reasonable steps to inform parents of the outcome of selection tests before the closing date for secondary applications on 31 October so as to allow parents time to make an informed choice of school (DfE, 2014).
It is a requirement of the School Admission Code 2014 that parents are informed of the outcome of any selective test prior to submitting their child’s school application form (Common Application Form or CAF) to the local authority. Our research identified at least three instances of the selective test being held after the date by which parents should have been informed of the outcome. Failure to supply information on the outcome of the selective test prior to the 31 October CAF submission deadline limits the ability of parents to make an informed choice for their child’s secondary school.
Conversely, the deadline for submitting the Supplementary Information Form (SIF), which schools require for children to be eligible to apply for a selective place is, in some cases, much earlier

The performance of partially selective schools in England 9
than the 31 October deadline for submitting application forms. We identified examples of partially selective schools that require SIFs to be submitted in June of Year 5, four and a half months earlier than the date by which parents must submit their school application form to the local authority. This extra requirement could favour children with well-informed parents and discriminate against those without a high level of engagement.
Complex criteria that parents may find difficult to navigate and understand
The Admissions Code requires all admissions policies to be ‘written in a way that makes [them] clear and accessible to all parents’ (DfE, 2014). However, our analysis of the admissions policies of partially selective schools identified some lengthy and complex oversubscription criteria that parents may find difficult to navigate and understand. This could impair parental opportunity to state a meaningful school preference by making it harder to predict the outcome of any application.
There are potential equity implications in the range and diversity of admissions criteria at partially selective schools - which can include distance, banding, sibling, child of staff, complicated faith criteria and exceptional circumstances in addition to a selective test. These criteria, which can run for more than ten pages, make it very difficult for parents to assess their child’s chances of being awarded a place, since they could be eligible to apply under a number of criteria.
Not all partially selective schools state clearly on their website that they admit a proportion of pupils selectively. Consequently, if a school website is the primary or sole source of information, some parents will remain unaware that there is an additional route by which to access a place at the school.

The performance of partially selective schools in England 10
5 Discussion
Overall, the main message from this research is that partially selective schools are no better in terms of pupil outcomes than non-selective schools. According to some measures they are worse.
The implications of expanding selection through an increase in the number of partially selective schools needs to be looked at in greater detail than is contained in this report. Such schools are difficult to identify for both researchers and parents; we found no comprehensive list held by the DfE or the Office of the Schools Adjudicator.
The highly complex admission arrangements used by some partially selective schools have the potential to favour children with well-informed and fully-engaged parents. Partially selective schools, particularly if they admit a proportion of children according to faith criteria, have a multitude of over-subscription criteria that can run to many pages and are opaque and difficult to navigate. The Admissions Code stipulates that admissions policies must be ‘clear and accessible’ (DfE, 2014) so that parents can make an informed choice about the likelihood of their child’s application being successful. Examples identified in this research suggest this is not always the case.
There is a lack of research about the impact of partially selective schools on pupils who weren’t selected which we were not able to do in this study.
6 Recommendations
Given the lack of evidence about the impact of partially selective schools to date and the findings contained in this report, NFER recommends that the Government conduct further research before allocating public funds to the expansion of academic selection.
In order to enable evidence to be gathered on the effects of partial selection, as well as fully selective schools, the Government should consider requiring all selective and partially selective schools and local authorities to make 11+ test results available for research purposes, including results for those who do not pass and data on pupil characteristics.
Further research should also investigate selection and partial selection in relation to issues such as parental attitudes, understanding and behaviours, and the further education, higher education and employment destinations of pupils.

The performance of partially selective schools in England 11
7 References
Department for Education (2014). School Admissions Code. Statutory Guidance for Admission Authorities, Governing Bodies, Local Authorities, Schools Adjudicators and Admission Appeals Panels [online]. Available: https://www.gov.uk/government/uploads/system/uploads/attachment_data/file/389388/School_Admissions_Code_2014_-_19_Dec.pdf. [28 February, 2017].
Department for Education (2016). Schools That Work for Everyone: Government Consultation. Available: https://consult.education.gov.uk/school-frameworks/schools-that-work-for-everyone/supporting_documents/SCHOOLS%20THAT%20WORK%20FOR%20EVERYONE%20%20FINAL.PDF [1 March, 2017].
National Foundation for Educational Research (2016). Schools That Work for Everyone: DfE Consultation. Slough: NFER [online]. Available: https://www.nfer.ac.uk/publications/99961 [1 March, 2017].
Vaughan, R. (2016). ‘Theresa May’s grammar school plans ‘impossible before 2020 election,’’ i News The Essential Daily Briefing, 18 December [online]. Available: https://inews.co.uk/essentials/news/education/no-new-grammar-schools-2020-election/ [28 February, 2017].

The performance of partially selective schools in England 12
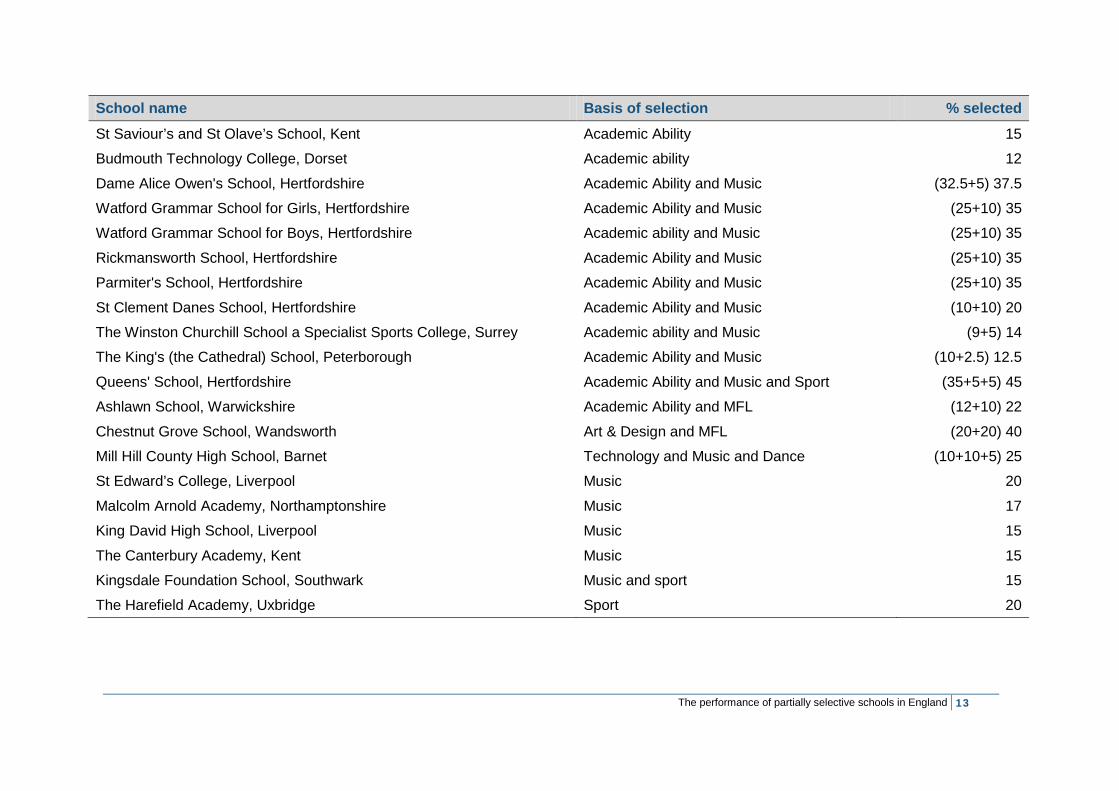
Appendix A: List of partially selective schools in England
School name Basis of selection % selected St Bernard's High School and Arts College, Southend Academic Ability 43 Ernest Bevin College, Wandsworth Academic Ability 33 King Edward VI Academy, Lincolnshire Academic Ability 32 The Spires College, Devon Academic ability 27 Burntwood School, Wandsworth Academic Ability 25 Graveney School, Wandsworth Academic Ability 25 Greenshaw High School, Sutton Academic Ability 25 The Howard School, Kent Academic Ability 25 Reading Girls' School, Berkshire Academic ability 25 Homewood School and Sixth Form Centre, Kent Academic Ability 20 St Thomas More High School for Boys, Southend Academic Ability 20 St Hilda's CE High School, Liverpool Academic ability 15 St Margaret's CE High School, Liverpool Academic Ability 15 The Archbishop's School, Kent Academic ability 15 The King John School, Essex Academic Ability 15 Shirley High School Performing Arts College, Croydon Academic Ability 15 Edenham High School, Croydon Academic Ability 15 Riddlesdown Collegiate, Surrey Academic Ability 15
The performance of partially selective schools in England 13
School name Basis of selection % selected St Saviour’s and St Olave’s School, Kent Academic Ability 15 Budmouth Technology College, Dorset Academic ability 12 Dame Alice Owen's School, Hertfordshire Academic Ability and Music (32.5+5) 37.5 Watford Grammar School for Girls, Hertfordshire Academic Ability and Music (25+10) 35 Watford Grammar School for Boys, Hertfordshire Academic ability and Music (25+10) 35 Rickmansworth School, Hertfordshire Academic Ability and Music (25+10) 35 Parmiter's School, Hertfordshire Academic Ability and Music (25+10) 35 St Clement Danes School, Hertfordshire Academic Ability and Music (10+10) 20 The Winston Churchill School a Specialist Sports College, Surrey Academic ability and Music (9+5) 14 The King's (the Cathedral) School, Peterborough Academic Ability and Music (10+2.5) 12.5 Queens' School, Hertfordshire Academic Ability and Music and Sport (35+5+5) 45 Ashlawn School, Warwickshire Academic Ability and MFL (12+10) 22 Chestnut Grove School, Wandsworth Art & Design and MFL (20+20) 40 Mill Hill County High School, Barnet Technology and Music and Dance (10+10+5) 25 St Edward’s College, Liverpool Music 20 Malcolm Arnold Academy, Northamptonshire Music 17 King David High School, Liverpool Music 15 The Canterbury Academy, Kent Music 15 Kingsdale Foundation School, Southwark Music and sport 15 The Harefield Academy, Uxbridge Sport 20

The performance of partially selective schools in England 14
Appendix B: Methodology
Identifying the population
The 38 partially selective schools analysed in this report were identified through a thorough and systematic screening of the school admissions pages on the websites of all local authorities in England.
In instances where the oversubscription criteria for individual schools (commonly schools that are their own admission authorities - foundation schools, voluntary aided schools and academies) were not available on the LA website, the admissions policies were taken from the school website.
Screening took place during January 2017 and the admission policies recorded are for pupil entry in September 2017.
A list was compiled of all secondary schools which admit children to Year 7 at age 11 using some form of ability or aptitude assessment to allocate 11 per cent to 99 per cent of places.
The list excludes:
• grammar schools that select 100% of pupils
• state boarding schools
• schools that use arrangements currently permitted under the Admissions Code (DfE, 2014)4 to select up to ten per cent of pupils by aptitude in a specialist subject.
NFER analysis compares the 38 identified partially selective schools with a comparison group of 153 schools, matched according to proportions of low, average and high prior attaining pupils, proportions of FSM pupils, and Government Office Region (GOR).
Quantitative analysis
In order to identify the effect on attainment of being educated at a partially selective school, we compared the outcomes of pupils in partially selective schools with the outcomes of pupils in comparable non-selective schools.
Comparison group
The first step consisted of using propensity score matching (PSM) to identify a group of schools comparable to the partially selective schools in terms of prior attainment and deprivation. We then
4 Selection by aptitude Schools that have arrangements to select by aptitude must not allow for more than ten per cent of the total admissions intake to be allocated on the basis of such aptitude (even if the school has more than one specialism). The only specialist subjects on which a school may select by aptitude are: a) physical education or sport, or one or more sports b) the performing arts, or any one or more of those arts c) the visual arts, or any one or more of those arts d) modern foreign languages, or any such language and e) design and technology and information technology. Only schools which selected on either of these specialist subjects in the school year 2007/08 and every subsequent year may continue to do so (DfE, 2014).

The performance of partially selective schools in England 15
matched pupils in partially selective schools to similar pupils in the comparison group of non-selective schools. The final analysis was carried out using pupil level data on attainment and pupil characteristics on the pupils identified by the second PSM stage. This analysis involved multi level modelling and logistic regression analysis.
Data
Several large data sources were used throughout the course of this research study. These include the NFER Register of Schools (ROS), School Performance Tables and the National Pupil Database (NPD).
NFER Register of Schools NFER’s Register of Schools (ROS) contains a wealth of information on school characteristics. These include:
• name of school
• geographical information (e.g. Local Authority, Government Office Region)
• school type (e.g. sponsor led academy, converter academy, community school)
• type of education provided (e.g. mainstream education, special education)
• phase of education
• school identifiers (URN)
• school level pupil characteristics
− percentage of pupils on free school meals (FSM)
− percentage of pupils with English as an additional language
− percentage of pupils with special educational needs.
ROS is updated regularly to include new statistical releases from DfE and to reflect changes in schools across England. Descriptive statistics on pupil composition refer to the 2014/15 academic year.
School Performance Tables The School Performance tables provide school level data on pupil attainment at Key Stages 2, 4 and 5, as well as information on the characteristics of the corresponding pupil cohorts. These variables include:
• percentage of low, average and high attainers at KS2 for the relevant KS4 cohort
• percentage of pupils achieving at least five A*-C GCSEs or equivalents, including English and Maths (also broken down by prior attainment)
• percentage of pupils achieving expected progress in English and maths between KS2 and KS4 (also broken down by prior attainment).
The school performance tables are published bi-annually by the Department for Education via a dedicated website. Data for this analysis was taken from the academic year 2014/15.

The performance of partially selective schools in England 16
National Pupil Database The NPD is the main source of pupil level data. The NPD is broken down into a number of datasets, including the annual school census data, containing details of pupils’ characteristics and attainment data, which track pupils throughout their time in education. These variables include:
• school census data (pupil characteristics)
− gender
− ethnicity
− FSM eligibility
− EAL
− schooling information (details of schools attended)
• attainment data
− prior attainment (KS2 achievement level)
− KS4 attainment (progress in English and maths, GCSE point score, 5 A* to C at GCSE).
For the purposes of this analysis, school census data was taken from the spring 2015 school census, whilst attainment data was taken from the 2015 KS4 data obtained through application to the DfE.
Propensity Score Matching
Propensity Score Matching (PSM) is a quasi-experimental technique used in observational policy evaluation studies to
approximate random-assignment, and is a widely used methodology in educational research. The aim of PSM, in this instance, is to generate sets of comparable pupils who attend comparable schools. Their comparability is based on the estimated probability of attending a partially selective school, based on their recorded individual characteristics. Pupils who actually attend partially selective schools are then matched to other pupils with similar estimated probabilities, who attend a comparable, but non-selective school.
School level PSM Overall the school level PSM resulted in 36 partially selective schools being matched to a total of 153 non-selective schools, based on a nearest neighbour matching approach, with up to five nearest neighbours and a 0.02 caliper5. The remaining two partially selective schools failed to find a match in the comprehensive school population, principally due to their large proportion of high prior attainment pupils. Given the characteristics of their pupil intake, these schools resembled grammar schools rather than non-selective schools and consequently did not find a suitable match.
The variables included in the PSM model were the following:
• identifier for a partially selective school
• percentage of cohort intake with low prior attainment
• percentage of cohort intake with average prior attainment
5 This is the maximum accepted difference in propensity score between a partially selective school pupil and a suitable match.

The performance of partially selective schools in England 17
• percentage of cohort intake with high prior attainment
• percentage of FSM pupils in KS4 cohort
• region (GOR).
Table B1 School level PSM outcome
Variable Mean Mean
Partially Selective Schools
Comparison Group
p-value of difference
% low prior attaining pupils 12.1 11.7 0.8
% average prior attaining pupils 46.7 46.3 0.9
% high prior attaining pupils 41.1 42.0 0.8
% pupils eligible for FSM 22.5 22.3 1.0
The school level PSM resulted in a comparison group containing 153 non-selective schools, from which pupils could be selected to make up the comparison group in the pupil level PSM.
Pupil level PSM The pupil level PSM resulted in 7,339 (out of 7,346) pupils in partially selective schools being matched to a comparison group of 9,657 pupils with similar characteristics from non-selective schools.
The variables included in the PSM model were the following:
• identifier for a partially selective school
• average point score at KS2 (KS2aps)
• gender
• FSM eligibility at any point in previous 6 years
• identifier for white British pupils (ethnicity)
• identifier for EAL (English as an additional language) pupils
Table B2 Pupil level PSM outcome
Variable Mean Mean
Partially Selective Schools
Comparison Group
p-value of difference
KS2aps 27.1 27.0 0.6
Gender 0.5 0.5 0.6
FSM 0.2 0.8 0.3
Ethnicity 0.6 0.6 0.8
EAL 0.1 0.2 0.7
Analysis of pupil outcomes
In order to measure the impact of attending a partially selective school, we compare the attainment of the pupils identified in the pupil level PSM using a number of outcome measures.
The measures of attainment used for the analysis were the following:

The performance of partially selective schools in England 18
• capped GCSE total point score
• pupil achieved five A* to C at GCSE (or equivalent) including English and mathematics
• pupil achieved five A* to C at GCSE (GCSE only) including English and mathematics
• pupil achieved expected progress in English
• pupil achieved expected progress in Mathematics.
The continuous outcome variable capped GCSE point score, was analysed using a linear multilevel mixed-effects model. This linear model was chosen due to its suitability to modelling continuous variables whilst accounting for interdependence among observations at different levels (i.e. school and pupil level) to make efficient and valid inference. Pupil-level weights were included in the model to account for differences in the size of the treatment and control groups.
All other outcome measures are binary variables, and were analysed using a logistic regression model with pupil weights. The maximum likelihood estimates for the parameters of the model, were in turn are used to calculate and compare predicted probabilities. One drawback of the logit model is the inability to apply a multi-level structure together with the matching weights. However, the process of propensity score matching at both the school and pupil level should minimise any school-level effect and we believe it was more important to include the matching weights to account for differences in the size of the treatment and control groups.
The following explanatory variables were controlled for in all regression models:
• KS2 average point score (KS2 aps)
• gender (1 for girls, 0 for boys)
• ethnicity (1 for white British, 0 otherwise)
• FSM (1 for pupils eligible for FSM in any of the current or previous 6 academic years, 0 otherwise)
• EAL (1 for pupils with English as an additional language, 0 otherwise)
Qualitative analysis
For each school in the population, the school website was reviewed for information about admissions and where available as a separate document the admission policy was scrutinised.
Limitations of the research
As noted in the body of the report, as there are currently only a small number of partially selective schools, this constrains the analysis to some extent. In addition, the approach of looking at pupil outcomes is in its nature a retrospective exercise, whereas the identification of admission policies is a current one.
Because selection test data is not available, we are unable to tell which pupils in the cohorts studied entered via a selective route. The best we can do is look by prior ability with an assumption that

The performance of partially selective schools in England 19
the high achievers are some that entered via the selection route, and look at the impact that having a selective route in general is having on the wider school population.
Sample size
The small number of partially selective schools implies that results should be treated with some caution, and it is difficult to infer what the results of a more widespread system might be.
Propensity Score Matching
A well known concern with PSM is that, in some instances, the outcome of the matching might be substantially different depending on the modelling strategy. We performed sensitivity analysis to assess how different matching strategies would impact on our final results and found that, while the magnitude of the estimated differences does change, the general pattern of pupils in partially selective schools having similar or lower levels of attainment at KS4, compared to their matched peers, was consistently confirmed.
Timeframe
Schools were identified to be in our population of partially selective schools according to their admissions policy for admissions in September 2017 as published in January 2017. However, the data that was analysed was for pupils who had concluded their study in July 2015 and who therefore entered the schools in question in September 2011.
During this timeframe schools may have reduced or maintained the proportion of selective admissions. However, they will not have increased them.

The performance of partially selective schools in England 20
NFER Ref: GRAM ISBN: 978-1-911039-41-9