Embed Size (px)
Citation preview
33
The Performance of Compliant Stocks during the
COVID-19 Crisis
Amel Farhat1 and Amal Hili2
1 Business School, University of Sherbrooke, Canada
2 ISG-University of Sousse, University of Carthage, ESSAI, L.R. MASE (LR21ES21), Tunisia
Abstract
The outbreak of the COVID-19 pandemic and the associated lockdowns across the world led to a
sharp decline in the market value of the global equity markets. The purpose of this paper i s to
answer the following question: Do Compliant firms outperform the Non-Compliant during the
COVID-19 pandemic? A compliant firm must satisfy the qualitative and quantitative criteria defined
by Islamic law. Previous research focused on the performance of Compliant mutual funds, banks, and
market indexes. Our paper stands out by sorting the cross-section of individual firms into Compliant
and Non-Compliant firms and by analyzing the stock performance of each group during the COVID-
19 crisis. Our empirical investigation is twofold: First, it includes quarterly cross-sectional regressions
during the first two quarters of 2020. We show that the effect of firms’ compliance on abnormal
returns is positive and significant during both quarters. Second, it uses difference-in-difference
regressions of daily abnormal returns and volatility on the interaction between the Compliant dummy
variable and Post-COVID dummy which equals 1 during the crisis period (February 24th to April
17th) and zero otherwise. We find that Compliant stocks outperform the non-Compliant peers during
the pandemic. We highlight that this out-performance is not associated with higher firm-specific or
total risk.
Keywords: Islamic finance, stock return, total risk, firm-specific risk, covid-19
34
Introduction
The outbreak of the COVID-19 pandemic and the associated lockdowns across the world led to
a sharp decline in the market value of the global equity markets. The global market levels reached a low
record in mid-March 2020, not observed since the Global Financial Crisis (GFC). The purpose of this
paper is to answer the following question: Do Compliant firms outperform their Non- Compliant peers
during the COVID-19 pandemic?
A Compliant firm must satisfy the qualitative and quantitative criteria defined by Islamic law.
Previous research concentrates mainly on Compliant mutual funds, banks, and stock market indexes
and proves that Islamic finance is more resilient during the GFC compared to conventional finance.
The Islamic finance resilience can be explained by its risk-bearing nature as it excludes high risk
profile companies through a detailed screening process; see for example (Kayed & Hassan, 2011;
Hasan & Dridi, 2011); Altarawneh & Lucas (2012); Bitar et al., 2017). Our paper compliments the
previous faith-based empirical finance literature and stands out by grouping the cross-section of
individual firms into Compliant and Non-Compliant firms according to the Islamic law and by
analyzing the stock performance of both groups during the COVID-19 crisis. To our knowledge, there
is no research paper conducted to sort the cross-section of stocks into Compliant and Non-Compliant
groups based on the qualitative and quantitative criteria defined by the Islamic law and to investigate
the resilience and performance of individual Compliant companies compared to their conventional
peers during a period of crisis.
The screening methodology we use is strict. We implement a two-step screening process with
two types of screening criteria: qualitative criteria related to business categories and quantitative
criteria related to financial ratios. This allows us to create the Compliment dummy variable which
equals to one if the firm satisfy the screening criteria and zero otherwise. Starting from 2274 firms
during the first quarter of 2020, only 672 firms are Compliant. As shown in Table 2, Compliant firms
in our sample, exhibit low leverage and high growth and investment opportunities.
Despite this thorough screening process, the COVID-19 pandemic exposes, both conventional
and Compliant stocks, to the same financial and economic shock as the pandemic led to the shutting down
of huge parts of the economy. The question is whether Compliant individual companies would exhibit
more resilience during the pandemic than their conventional counterparts.
Our empirical investigation is twofold: First, it includes quarterly cross-sectional regressions
during the first two quarters of 2020. We show that the effect of firms’ compliance on abnormal
returns is positive and significant at 0.1% level (respectively 5% level) during the first quarter
(respectively the second quarter) with and without including the control variables. Note that the effect
is less pronounced during the second quarter. This decline in the impact of the compliance status on
stock return can be explained by the major government actions to support the economy and the
financial system during the second quarter of 2020. We also provide evidence that the out-
performance of Compliant stock returns during the pandemic is not explained by a higher risk. Indeed,
the effect of the compliance status on firm-specific and total volatility is significantly negative at 0.1%
level. Second, it uses difference-in-difference regressions of daily abnormal returns and volatility on
the interaction between PostCOVID, and Compliant dummy variable. This allows to discern the effect
of compliance on the firm financial performance during the COVID-19 crisis. The COVID-19 crisis
35
is represented by the period between February 24th, 2020 to April 17th, 2020. Thus, PostCOVIDt equals
1 during the crisis period and zero otherwise. We find that Compliant stocks perform better during the
pandemic and that this out-performance is not associated with higher risk as Compliant stocks are
evidenced to be less volatile than their non-Compliant peers during the COVID-19 period.
The remainder of this paper is organized as follows: Section 2 provides a review of the finance
literature dealing with Islamic finance resilience under economic turmoil. Section 3 describes the data
along with the screening methodology to be used. Section 4 presents the descriptive statistics along
with the empirical methodology and findings. The last section concludes.
1. Literature review
Our paper is related to several articles and the closest stream of literature to ours is the one
dealing with the impact of covid19 on Islamic Financial Services Industry (IFSI) including three main
entities: funds, banks, and capital markets. To the best of our knowledge, few articles have dealt with
this current hot topic and most of them compare the resilience and performance of the three different
components of the IFSI to their conventional peers.
(Yarovaya et al. , 2020) show that Islamic equity funds exhibit more resilience to the COVID-
19 shock and outperform their conventional counterparts during the pandemic. (Hassan et al., 2020)
present the role of Islamic banking system and the new technological innovation (also known as
Fintech) in creating a more sustainable environment COVID-19 crisis. (Sherif, 2020) investigates the
impact of COVID-19 on the performance of the Dow Jones Islamic market index (DJIS) compared to
its UK counterpart and finds evidence of a negative relationship between the COVID-19 pandemic and
the DJIS. (Ashraf et al., 2020) question whether indices following Islamic investment principles
provide hedging benefits to the investors during the COVID-19 pandemic compared to the Pre-
COVID-19 period for global, US, and European markets. The authors prove that during market
downfalls, Islamic equity indices do not lose as much as their conventional peers and that this out-
performance comes with higher systematic risk. (Erdogan et al., 2020) show that Islamic stock
market indices are more stable to the pandemic shock than the conventional peers in Turkey. (Salisu
& Sikiru, 2020) provide evidence of the hedging effectiveness during the COVID-19 pandemic of the
DJIS Asia/Pacific index compared to the Standard and Poor Dow Jones Composite Average stock index
and find higher stock returns and lower volatility of Islamic stocks Indexes relative to their
counterparts during the pandemic.
Indices complying with Islamic investment criteria are not the only indices that outperform
during the pandemic. (Albuquerque et al., 2020) show that stocks with high Environmental and
Social ratings exhibit significantly higher returns, lower volatilities, and greater trading volumes than
other stocks during Covid-19 pandemic. (Acharya & Steffen, 2020) and (Ramelli & Wagner, 2020)
prove that respectively firms with committed access to sources of liquidity and those with greater cash
holdings and lower financial debt are less affected by the Covid-19 pandemic and the resulting stock
market crash. Likewise, (Mnif et al., 2020) prove that Covid19 has a positive effect on the efficiency
of the cryptocurrency market.
The Covid-19 pandemic is often compared to the GFC. It seems thus important to relate our
paper to some of the literature investigating the out-performance of Islamic investments during the
subprime crisis. To the best of our knowledge, (Tahir & Ibrahim, 2020) is the only empirical study
dealing with the out-performance of individual Compliant companies’ returns compared to
36
conventional companies rather than analyzing stock market indices performance during and after the
financial collapse period,. The authors use a Database from the Financial Times Stock Exchange
(FTSE) all world index to measure the individual companies’ accounting and market returns during
two periods of time: the financial recession of 2007-2010 and the post-recession years of 2011-
2014. The model used is an ordinary least square regression and the main finding states that Compliant
companies outperform the Non-Compliant companies, in terms of both accounting and market returns
during the recession period. This research is different from ours in many aspects. First, we construct
our database by filtering companies selected from CRSP and Compustat-Capital IQ, using both
quantitative and qualitative screening criteria. Second, the quantitative approach we use is more
elaborate as we conduct a difference in difference estimation using abnormal daily re- turns. Third, we
deal with the impact of the pandemic on Islamic companies returns rather than the subprime crisis and
these two worldwide crises are different in terms of origins and consequences.
In contrast to (Tahir & Ibrahim, 2020), most research is carried out on indices and focuses
on the comparison between the performance of Islamic and conventional indices during the GFC. ( Al-
Khazali et al., 2014) use stochastic dominance to show that nine DJIS indexes out- perform their
conventional peers’ indexes during the GFC. Milly & Sultan (2012) compare the performance of
investing in Islamic stocks and socially responsible stocks compared to conventional and find that
Islamic stock investment generates significantly higher Sharpe ratios especially during the GFC.
Arshad & Rizvi (2013) prove that Islamic indices testify more stable during the subprime crisis due to
their rigid screening criteria. Dewandaru et al. (2014) focus on excessive contagion effects and provide
evidence that Islamic stock markets are less affected by the GFC than their counterparts. Arouri et al.
(2013) use the Morgan Stanley Capital International closing prices to show that Islamic indexes offer
higher returns associated with lower volatility during global financial turmoil. Sukmana & Kolid
(2012), Miniaoui et al. (2015), and Abduh (2020) aim at investigating the volatility of conventional
and Islamic indices during the GFC in respectively Indonesia, the Gulf Cooperation Council countries
(GCC) and Malaysia using among others, GARCH model. Interestingly, Sukmana & Kolid (2012)
and Abduh (2020) show that Islamic index volatility is lower during the GFC whereas Miniaoui et al.
(2015) prove that investing in Islamic stock index is not less risky than investing in conventional one.
In the same vein, Hammoudeh et al. (2014) and Trabelsi et al. (2020) show that Islamic indices are
also exposed to the GFC and do not exhibit a statistically significant difference in performance
compared to their conventional peers.
Regarding the banking sector, (Bourkhis & Nabi, 2013 and Hasan & Dridi, 2011) show that
Islamic banks exhibit more resilience to the subprime crisis than conventional banks. These findings
are not in line with Amar et al. (2017) and Karim et al. (2012) who investigate the impact of the GFC
on Islamic banks respectively in three GCC countries and Malaysia. Evidence is provided that Islamic
banks in these countries are more vulnerable to the financial distress.
Merdad et al. (2010) focus rather on the risk-return profile and performance of Islamic and
conventional mutual funds managed by HSBC in Saudi Arabia. Their risk-adjusted performance
measures suggest that Islamic mutual funds outperform conventional ones during the GFC, offering
thus hedging benefits to investors. Ahmad et al. (2020) examine the impact of the GFC on a
Compliant capital protected fund called the Meezan Capital Protected Fund (MCPF) and find that
unlike conventional equity funds, the MCPF generates a small positive return.
The question that arises is how individual returns of Compliant companies react to the current
37
pandemic compared to non-Compliant companies.
2. Data description
This study includes firms listed in both the Center for Research in Securities Prices (CRSP)
daily file and the Compustat - Capital IQ quarterly during the Covid-19 crisis. Returns data is obtained
from CRSP and accounting data is obtained from Compustat. We include all stocks listed in New
York Stock Exchange (NYSE), American Stock Exchange (AMEX) and The Nasdaq Stock Market
with share code 10 or 11 (common stocks). In order to ensure that the illiquid stocks are not
considered in our analysis, we exclude penny stocks (price below $5) and micro-caps (stocks in the
bottom 2 deciles of the monthly size distribution). We end up with a sample of 2274 firms.
Next, we categorize stocks into Compliant and Non-Compliant based on qualitative and quan-
titative criteria described in detail below.
2.1 Screening Process
Our screening methodology consists of using a two-step screening process with two different
types of screening criteria: qualitative criteria related to business categories and quantitative criteria
related to financial ratios. We start by screening firms according to their business activities and then
further filter the remaining companies in accordance with their financial ratios.
2.1.1 Qualitative criteria.
Qualitative screening criteria are related to business activities. In all Shariah screening mainstreams,
the first qualitative criterion consists of excluding companies whose main business activity is not
permissible by Shariah. To that purpose, we use two filters: Security Industry Code (SIC) Filter and
Business Description Keyword Filter.
Security Industry Code (SIC) Filter. Most of the researchers use Security Industry Codes
(SICs) to identify companies within some specific industries. All companies with a financial activity
orientation are excluded from the sample of Compliant companies using the Security Industry Code
(SIC) Filter. Those financial companies are classified with SICs from 6000 to 6999. We start thus by
removing them from the sample. Other companies with a non-financial activity orientation but operating
some business activities prohibited by Shariah need as well, to be removed from the sample of
Compliant companies using the SIC description. We exclude companies if one of the following words
appears on their SIC description (COMPUSTAT item sicdescr): wines; wine and; toba; animal spec;
hogs; slaughtering; malt bev; liquor; cigarette; cigars; ammunition; small arms; ordnance; missiles;
tanks; music; beer; investor; motion; picture; video; dance; theatrical; band; entertainment.
38
Business Description Keyword Filter. According to this second filter, qualitative screening is
made based on the business activity description. Six international Islamic indexes (Dow Jones Islamic
Market Index, DJMI; Financial Times Stock Exchange, FTSE, Morgan Stanley Capital International
Global Islamic Index, MSCI; Thomson Reuters Ideal Rating Islamic indices; the STOXX Europe
Islamic Index and Standard and Poor’s Shariah Index) along with many Shariah service providers as
(Shariah Capital, SC; Al-Meezan and Azzad) provided a comprehensive list of Non- Compliant
business activities. Ho et al. (2012) breakdowns those impermissible business activities into five
classifications: Riba (interest in conventional banks) and Gharar (trading in uncertainty and risk),
gambling and gaming, non-halal products, immoral and other impermissible activities. We use these lists
to exclude in an exhaustive way all impermissible activities belonging to the five classifications. We
remove thus every firm if one of the following words appears on the business description
(COMPUSTAT item busdesc): adult; affiliate; album; alcohol; arms; artillery; assurance; attack;
bacon; bank; beef; beer; betting; blackjack; bond; bourbon; brandy; brewery; broker; bullet; cabletv;
carcass; casino; champagne; chicken; cigar; cigarette; cinema; cocktail; cognac; credit; disco; discount
house; distiller; draught; duty free; entertainment; fighter jet; finance; future; gambling; gaming; gun;
guns; ham; hellicopter; hock; hog; insurance; interest; investment; lager; landmines; lease; leasing;
lender; lending; lessors; liqueur; liquor; loan; lottery; machine gun; meat; military; missile; mortar;
music; nightclub; options; pig; playboy; poker; pork; port wine; poultry; quzuo; records; reinsurance;
rifle; roulette; rum; salami; sausage; scotch; slot machine; spirit; supermarket; sweepstakes; swine;
tank; tequila; tobacco; toto; vodka; war vessel; warthog; weapon; whiskey; whisky; wine; hotel; motel.
Many databases limit their screening process to the qualitative screening as the Eikon database
which flags companies as Compliant if the business activity is considered permissible by Islamic law
without taking into account financial ratios (Aziz et al. 2020).
2.1.2 Quantitative criteria: Financial Ratios.
The business activity screening process is followed by the quantitative screening, conducted to further
filter companies by using three financial ratios indicators related to debt, interest bearing assets and
liquidity (receivable). Following Ho et al. (2012), we consider that a firm is Compliant if:
𝐷𝑒𝑏𝑡 =𝑇𝑜𝑡𝑎𝑙 𝐷𝑒𝑏𝑡
𝑀𝑎𝑟𝑘𝑒𝑡 𝑣𝑎𝑙𝑢𝑒 < 33%
(1)
𝐶𝑎𝑠ℎ + 𝐼𝑛𝑡𝑒𝑟𝑒𝑠𝑡 𝑏𝑒𝑎𝑟𝑖𝑛𝑔 𝑠𝑒𝑐𝑢𝑟𝑖𝑡𝑖𝑒𝑠 = 𝐶𝑎𝑠ℎ+𝑆ℎ𝑜𝑟𝑡 𝑡𝑒𝑟𝑚 𝐼𝑛𝑣𝑒𝑠𝑡𝑚𝑒𝑛𝑡+𝑂𝑡ℎ𝑒𝑟 𝐼𝑛𝑣𝑒𝑠𝑡𝑚𝑒𝑛𝑡
𝑀𝑎𝑟𝑘𝑒𝑡 𝑣𝑎𝑙𝑢𝑒 < 33%
(2)
Cash +
Interest bearing
securities
𝑅𝑒𝑐𝑒𝑖𝑣𝑎𝑏𝑙𝑒𝑠 = 𝑁𝑒𝑡 𝑅𝑒𝑐𝑒𝑖𝑣𝑎𝑏𝑙𝑒 (+𝐶𝑎𝑠ℎ)
𝑀𝑎𝑟𝑘𝑒𝑡 𝑉𝑎𝑙𝑢𝑒 < 45% (3)
39
There is a consensus among International Islamic indexes and Islamic index providers
regarding the debt threshold of one third inspired by understandings from the Quran (Ashraf et al., 2020).
There seems also to be a consensus regarding the 33% as the standard benchmark and the maximum
threshold limit for Cash plus Interest bearing securities. Despite this consensus regarding the two first
screening ratios, the thresholds values for the liquidity screen ratio (Receivables) vary considerably
between 33% and 67% because of different Shariah jurisdictions operated by different users with
various screening objectives. We follow in our paper the recommendation made by (Ho et al., 2012)
regarding the liquidity ratio threshold. This recommendation is based on the analysis of the screening
processes practiced by 15 worldwide leading Islamic finance users.
It is also worth noticing that we use the market value when accounting for equity as practiced
by the DJMI, Standard and Poor’s Shariah Index and most of the international Islamic Indexes except
for the MSCI using the book value of equity.
Applying the screening process allows us to create a binary variable labeled Compliant and
which equals one if the firm satisfies the listed quantitative and qualitative criteria and qualifies as a
Compliant firm and equals zero otherwise.
3. Empirical Methodology and Findings
3.1 Distribution of the sample
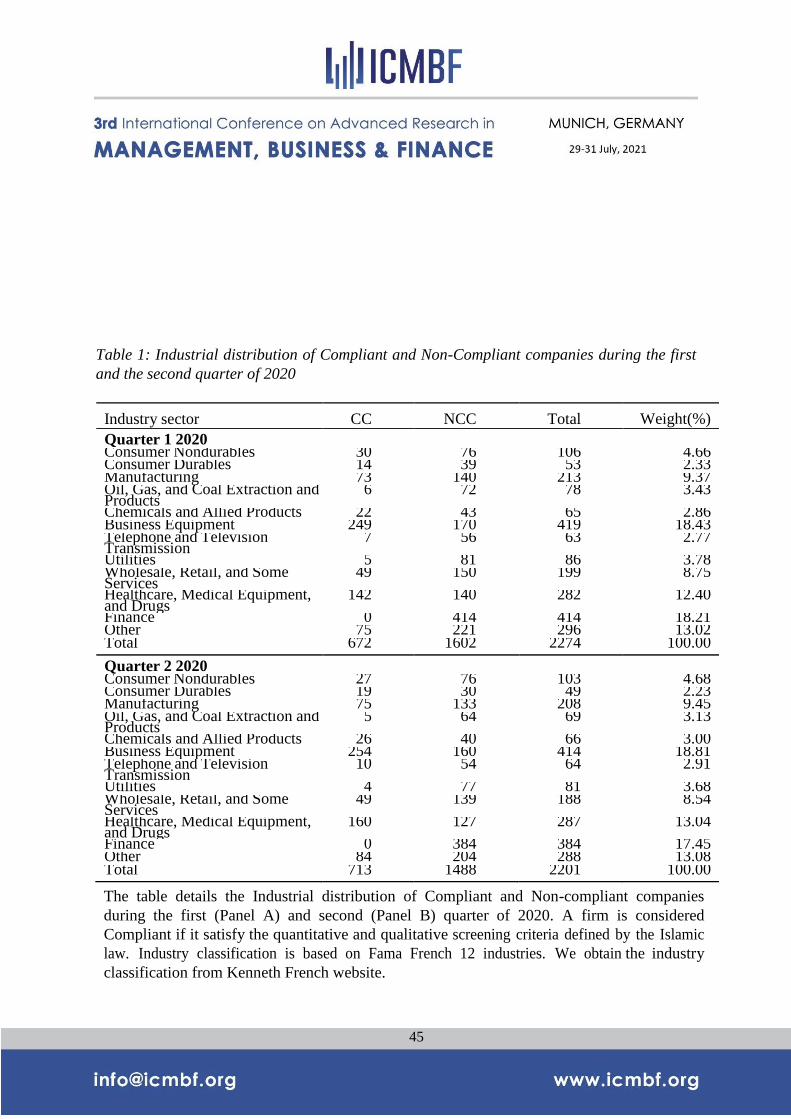
Table 1 shows the number of firms per industry during the first and the second quarter of 2020. The
Industry classification is based on the industry definition on Kenneth French website. Note that we
allow the firm to change the compliance status giving the change in the qualitative screening ratios.
This explains the difference in the number of Compliant firms each quarter.
We include 2274 companies in our sample in the first quarter of 2020. 30% are Compliant firms and
the remaining 70% are non-compliant. In the second quarter we include 2201 companies. 32% are
compliant firms and the remaining 68% are non-compliant. For both quarters, compliant firms are
concentrated on the Health care and business equipment industries, while the non-compliant firms are
mostly in the finance industry.
We report the summary statistics in Table 2 for Compliant and Non-compliant firms during the first
(Panel A) and second (Panel B) quarters of 2020. The numbers reported represent the mean across
firms as well as the standard deviation and the 10th to 90th percentile. A detailed definition of the
variables is found in Table A.1.
The comparison between Compliant and Non-Compliant firms from a descriptive perspective breaks
down into three steps. We start by the descriptive statistics of returns and volatility. We deal then with the
average ratios used in the quantitative screening process. We finally focus on control variables and
compare their summary statistics between compliant and non-compliant firms.

40
As we can see from Table 2-Panel A, the raw quarterly returns for both firms’ categories are
negative during the first quarter of 2020. Note that the negative returns are less pronounced for
Compliant companies. The quarterly returns equal −13% and −31% for Compliant and Non-
Compliant firms respectively. Turning our attention to the quarterly abnormal returns, we clearly
observe that Compliant firms outperform the non-Compliant ones. In fact, the quarterly abnormal
return is positive and equals to 6% for Compliant firms and is negative and equals to −12% for non-
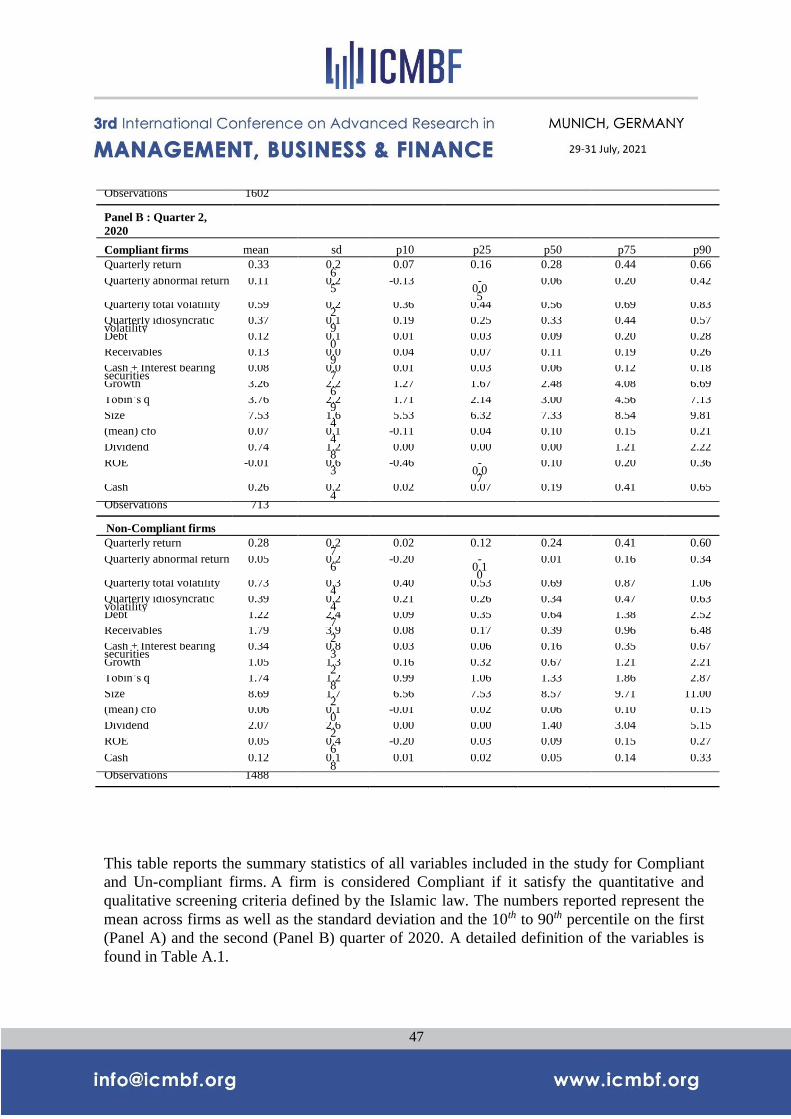
Compliant firms. Panel B of Table 2 shows that the average quarterly returns and abnormal returns
improve for both firms’ groups in the second quarter of 2020. Note that, again, the Compliant group is
performing better than the non-Compliant group. In fact, the quarterly average return (abnormal returns
equals to 33% (11%) for the Compliant firms and equals to 28% (5%) for the Compliant firms.
Despite the high returns detected for Compliant firms, we find that the risk, measured by the
quarterly total and idiosyncratic volatility, is lower for Compliant firms. During the first quarter of
2020 (Panel A) the quarterly total (idiosyncratic) volatility equals to 63% (37%) for the Compliant
firms compared to 68% (39%) for others. The second quarter of 2020 (Panel B) displays similar
results. The quarterly total (idiosyncratic) volatility equals to 59% (37%) for the Compliant firms
compared to 73% (39%) for others.
Table 2 also displays the average ratios used in our quantitative screening: the Debt, Receivable and
Cash + Interest bearing securities ratios. As expected, the values of the ratios listed are lower for
Compliant firms compared to the non-Compliant ones during both quarters.
We end our statistics’ comparison by focusing on control variables. We observe first that Com-
pliant firms present higher growth and Tobin’s q ratios than Non-compliant firms in the first and
second quarter of 2020. The Compliant (Non-compliant) growth ratio equals 3.36 (1.03) and 3.26
(1.05) during the first and second quarter respectively. The Compliant (Non-compliant) Tobin’s q
ratio equals 3.85 (1.71) and 3.76 (1.74) during the first and second quarter respectively. This
demonstrates that Compliant firms exhibit valuable investment and growth opportunities. Combining
the low leverage and high growth and Tobin’s q characteristic of the Compliant group, we confirm the
findings of (Lang et al., 1996). The authors show that there is a negative relation between leverage and
future growth and explain that leverage should have a negative effect on growth for firms doing poorly
(in our case COVID-19 crisis) because of a lack of recognized investment opportunities and poor
managerial performance.
By examining second, the size variable in Panels A and B, we find that the non-Compliant
firms are slightly larger than Compliant firms. The cash flows from operating activities, CFO, are then
slightly higher for Compliant firms during the first and second quarter of 2020. Contrary to
expectations, we see that the accounting performance measure, ROE, as well as the dividend are
higher for Non-Compliant firms for both quarters. The cash is finally found to be higher for Compliant
firms compared to others.
Although there are quite large difference between the 10th and 90th percentiles of the variables in
Table 2 for both firms categories, the standard deviation is fairly low suggesting low dispersion of the
data points.
These results motivate us to look more carefully at the effect of the compliance on the cross-
sectional quarterly stocks abnormal returns and to examine the link between the performance of
Compliant firms and the COVID-19 pandemic using differences-in-differences regressions for daily
abnormal returns.
41
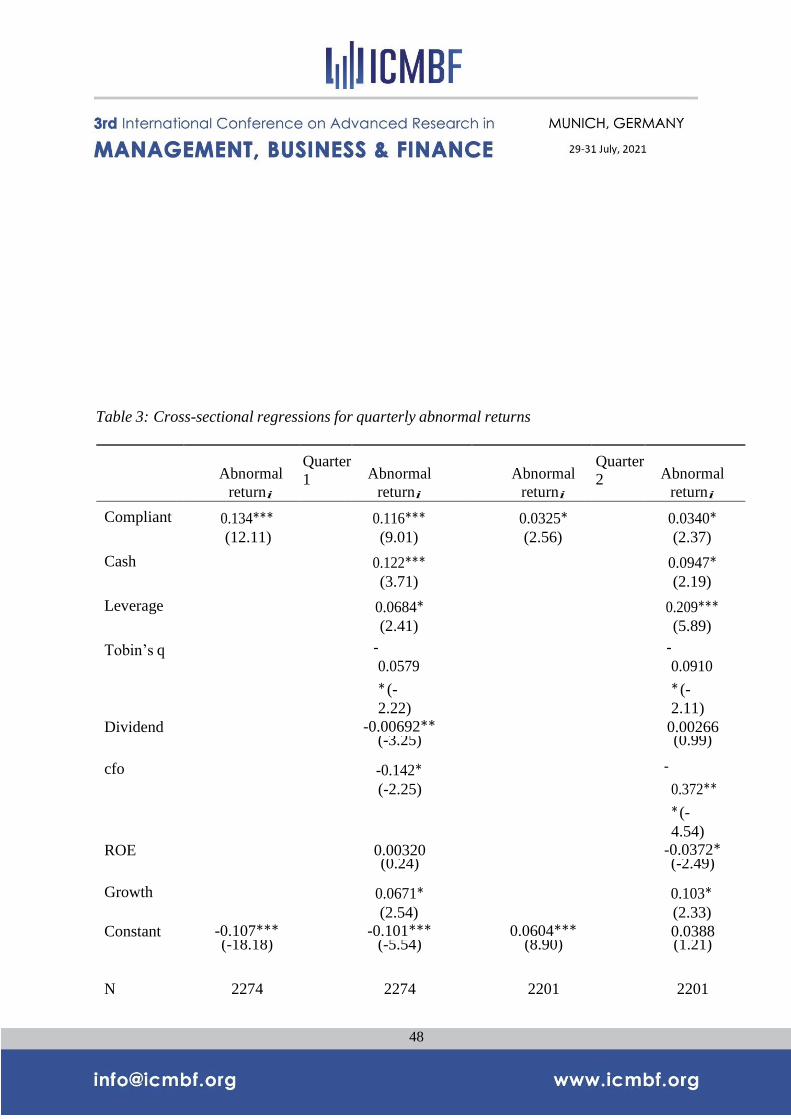
3.2 Quarterly Cross-sectional Regressions
We investigate the effect of compliance status on the quarterly firm performance during the
first and second quarter in 2020 by running the following quarterly regression:
Performancei = α + β1 Compliant + β2 Controlsi + β3 Industry FEi + ϵi (4)
The dependent variable Performancei is either the quarterly abnormal return of firm i, the
quarterly idiosyncratic volatility of firm i or the quarterly total volatility of firm i. Compliant as
defined previously, is the binary variable equal to one if the firm is compliant and to zero otherwise. All
Control variables are winsorized at the 1% and 99% levels. Tables 3, 4 and 5 present the regression
results of equation 4.
Giving that the first quarter of 2020 represents the outbreak of the COVID-19 virus, we hy-
pothesize that the effect will be more pronounced during the first quarter compared to the second one.
First, we estimate the cross-sectional regressions of quarterly abnormal returns. Table 3 dis-
plays the regression coefficients of the quarterly abnormal returns on companies’ compliance status,
represented by the variable Compliant during the two first quarters of 2020. In the first column of
quarter 1 and quarter 2, we include the compliant status dummy as the main independent variable. In
the second column we add cash, leverage, Tobin’s q, dividend, CFO, ROE and growth as control
variables. The control variables are described in detail is Table A.1. To make sure that our coefficients
are not driven by special industry characteristics, we control for industry fixed effect (Industry FE)
under all the specifications. Standard errors are robust for heteroscedasticity.
The effect of firms’ compliance on abnormal returns is positive and significant at 0.1% level
(respectively 5% level) during the first quarter (respectively the second quarter) with and without
including the control variables. As anticipated, the loading of the compliance status, β1, is smaller and
less significant during the second quarter of 2020. In particular, after adding the control variables, it is
equal to 0.116 with a t statistic of 6.27 in the first quarter and only 0.0.034 with a t statistic of 6.27 in
the second quarter. This decline in the effect of the compliance status, β1, might be explained by the
major government actions to support the economy and the financial system.
Second, to further document the resiliency of compliant companies’ stocks, we run the cross-
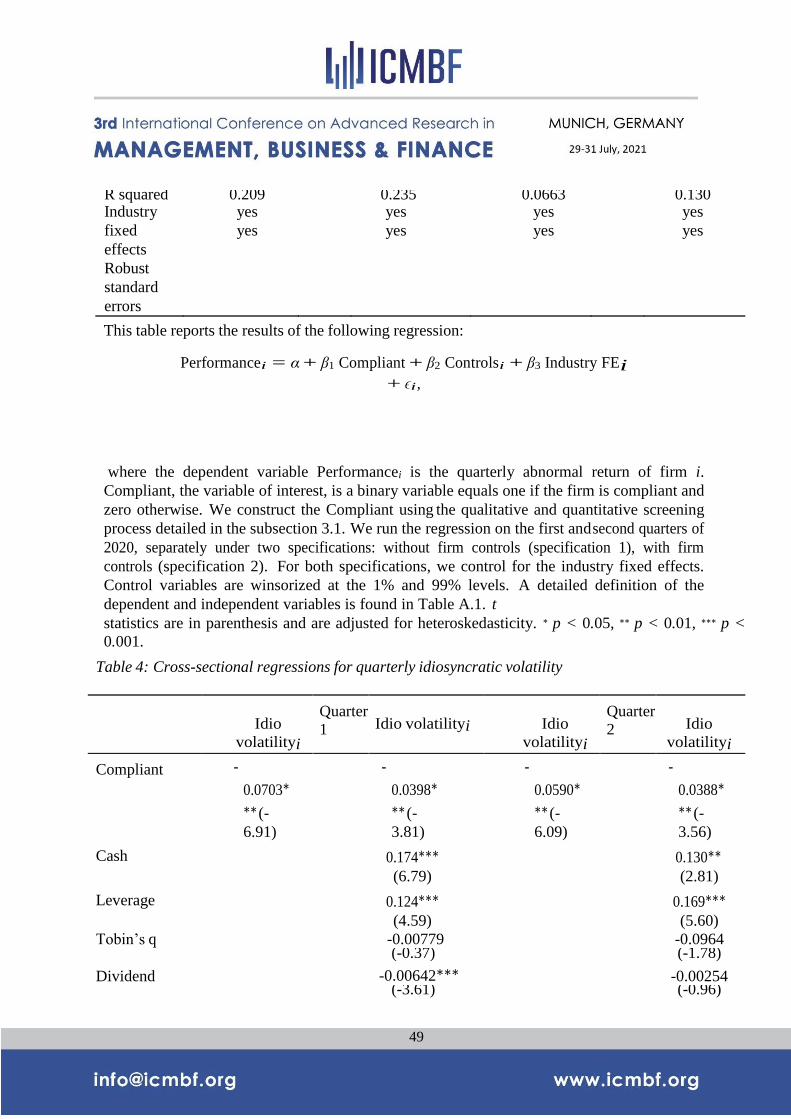
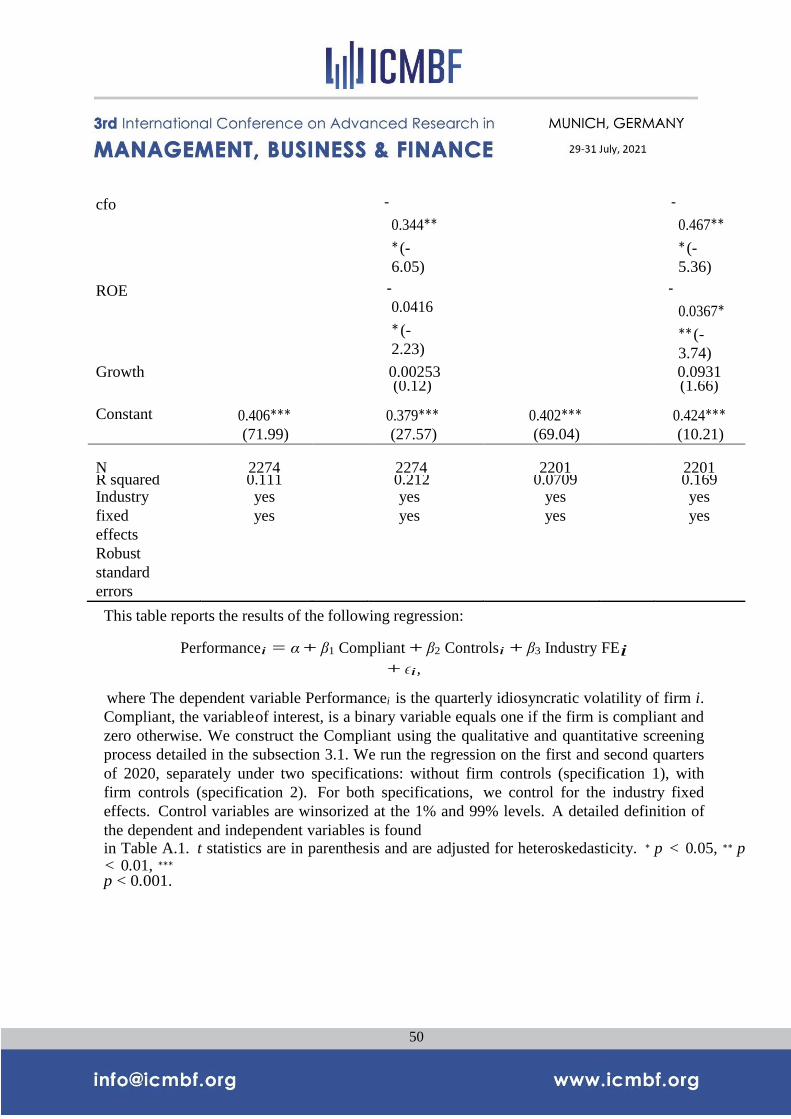
sectional regressions of equation 4 using as dependent variable the quarterly idiosyncratic volatility.
The construction of the quarterly unsystematic risk is described in Table A.1. Table 4 shows that the
effect of the compliance status on idiosyncratic volatility is significantly negative at 0.1%
level before and after including the control variables. This is true for both the first and second
quarters. During the first (second) quarter, the loading on the compliance status equals −0.0398
(−0.0388) with a t statistic of −3.81 (−3.56).
Thus, we conclude that compliant firms display lower firm-specific volatility of stock returns
during the first two quarters of 2020.
42
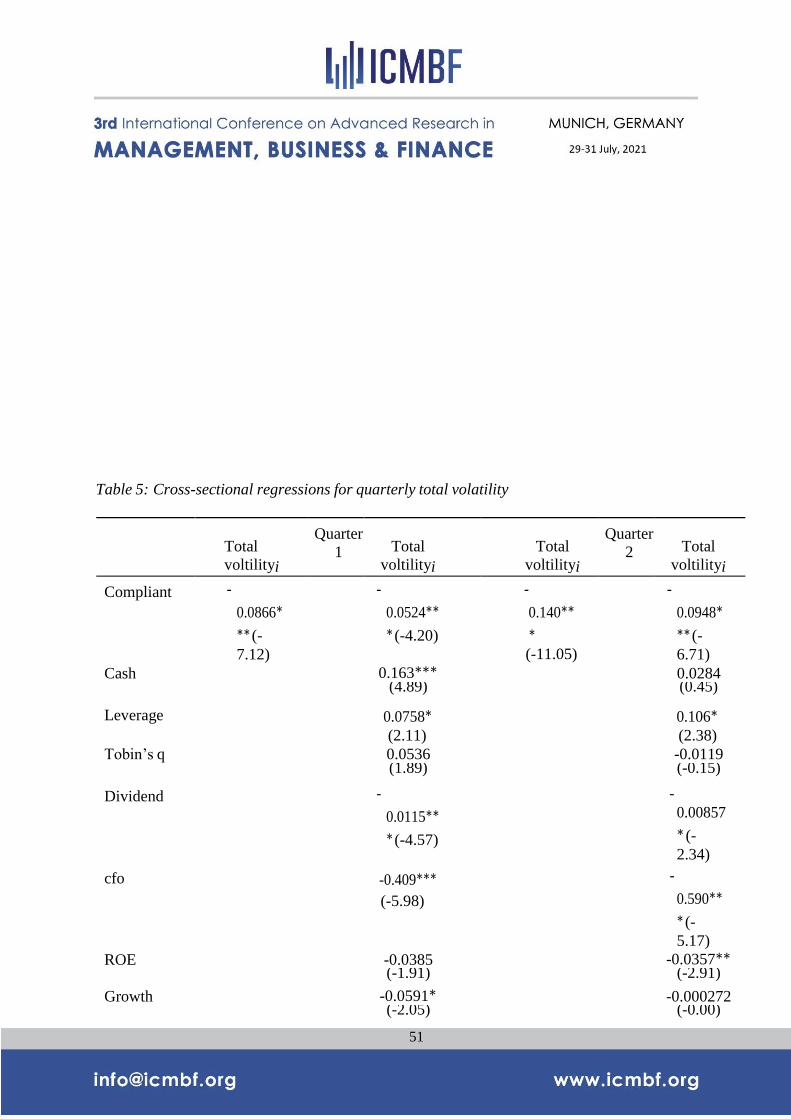
Third, we run the regressions described in equation 4 using the quarterly total volatility as inde-
pendent variable. The total volatility is the standard deviation of stock returns. Table A.1 provides the
detailed construction of the total volatility. Table 5 presents the regressions’ results, with and without
including the control variables. Similarly to Table 4, we find that the loading on the Com- pliant
variable, β1, is negative and highly significant during quarters 1 and 2 of 2020. Surprisingly, the
negative effect is more pronounced during the second quarter. Including the control variables, the
regression coefficients are shown in column 2 of both quarters: β1 is respectively equal to −0.0524
(t statistic = −4.20) and −0.0948 (t statistic = −6.71) during quarter 1 and quarter 2 respectively.
Our findings in Table 4 and Table 5 suggest that the out-performance of Compliant stock returns
during the pandemic is not explained by a higher risk. However, it might be explained by the low
leverage and the valuable investment and growth opportunities of compliant stocks as discussed in the
Table 2.
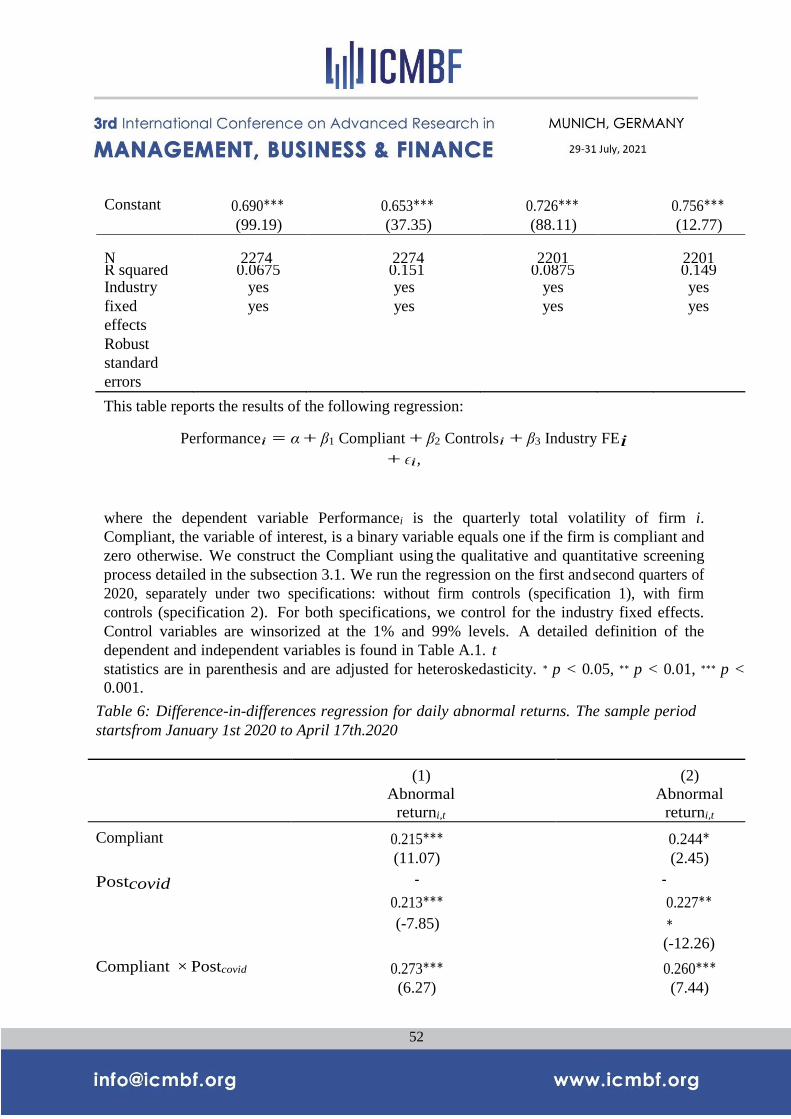
3.3 Daily difference-in-differences regressions
To better discern the effect of compliance on the firm financial performance, measured by the
daily abnormal returns and daily volatility, during the COVID-19 crisis, we employ the difference- in-
difference methodology. Giving that our study focuses on the COVID-19 period, we need to identify
precisely the beginning and the end of the crisis. To do so, we plot the daily S&P 500 index value in
Figure 1.
Figure 1 depicts first, that the stock market started to decline on February 24th, 2020 shown by
the first vertical line. This date marks the start of the fever period (Ramelli & Wagner, 2020 and
Albuquerque et al., 2020) and the first lock-down in European soil, specifically, Northern Italy.
Second, we observe that the stock market started to rebound on April 17th, 2020, shown by the second
vertical line. The rebound of the financial market corresponds to the date of the announcement made by
Trump regarding the three-stage process for the United States to end up the pandemic shutdown.
Therefore, February 24th and April, 17th correspond respectively, to the beginning and the end of the
COVID-19 crisis.
The difference-in-difference model is giving by the following regression:
Performancei,t = α + β1 Compliant i × PostCOV IDt + β2 Firm FEi + β3 Day FEt + ϵi,t (5)
where the dependent variable Performancei is either the daily abnormal return of firm i on day t or the
daily volatility of firm i on day t. The period of study is from January 1st, 2020 to April 17th, 2020.
PostCOV IDt is a dummy variable and equals 1 for each day from February 24 until April 17, and zero
otherwise.
43
First, we focus on the effect of compliance on the daily returns during the COVID-19 crisis.
Table 6 presents the results of the difference-in-difference regression where the dependent variable in
equation 5 is the daily abnormal return. The first column displays the regressions’ coefficients without
firm (Firm FE) and day (Day FE) fixed effects (specification (1)). The second column presents the
results taking on consideration both firm and day fixed effects (specification (2)). Standard errors are
clustered by day and firm under both specifications. The coefficient of interest is β1, which corresponds
to the interaction term between the PostCOVID, and the compliance status of the firm. This coefficient
measures whether Compliant firm experienced a greater increase in abnormal returns from February
24th to April 17th.
Table 6 shows the positive effect from companies compliant during the treatment period
(Covid-19 crisis). Under specification (1), we show that the estimated coefficient associated with the
interaction between PostCOVIDt and Compliant is positive (0.273) and significant (t statistic = 6.27).
This positive and significant coefficient suggests that compliant companies perform better than non-
compliant companies during the COVID-19 crisis period. In particular compliant firms earn an
average abnormal daily return of 0.273% relative to conventional firms from February 24th, 2020 to
April 17th, 2020. This corresponds to a cumulative abnormal return of 14.74% over the 54 days of
crisis. While suggestive, this specification is not entirely appropriate since it does not control for any
individual or day characteristics that might explain the rise in the daily abnormal returns for Compliant
firms. Therefore, under specification (2) where we control for firm and day fixed effect, the estimated
coefficient associated with the interaction between PostCOVIDt and Compliant is again positive (0.26)
and significant (t statistic = 7.44).
Second, we concentrate on the effect of firms’ compliance on the daily volatility during the
COVID-19 crisis. Following (Albuquerque et al., 2020), we use the daily price-range as a proxy for
the daily volatility. Table 7 presents the results of the difference-in-difference regression where the
dependent variable in equation 5 is the daily price-range. The first (second) column displays the
regressions coefficients without (with) firm and day fixed effects. Standard errors are clustered by day
and firm under both specifications. The coefficient of interest is β1 measures whether Compliant
firm experienced a greater increase in daily volatility from February 24th to April 17th. Column (1) in
Table 7 shows that the estimated coefficient associated with the interaction be- tween PostCOVID and
Compliant is negative (−0.0158) and significant (t statistic = −36.33). This model indicates that
there was a highly significant decrease in the daily volatility during the COVID-19 period for
compliant firms compared to others. In particular, compliant firms display an average daily volatility
of 0.0158% lower than Non-compliant firms from February 24th, 2020 to April 17th, 2020. This
corresponds to a 54 days cumulative daily volatility of 0.85%. We control for fixed firm and fixed day
effects in column (2) and obtain similar results. The estimated coefficient associated with the
interaction between PostCOVIDt and Compliant is negative (−0.0169) and significant with a t statistic
equal to −19.24. This finding means that compliant stocks are less volatile than non-compliant
44
companies during the COVID-19 period.
4. To conclude, we provide empirical evidence that the high performance of compliant firms is
well revealed through the higher daily abnormal returns and lower daily volatility compared to
non-compliant firms. Conclusion
The rapid spread of COVID-19 has tremendously affected stock markets all over the world.
Using compliant mutual funds and stock market Islamic indexes, Islamic finance formed a sustainable
form of finance that survived the consequences of previous financial crisis.
Our paper intends to address the question whether individual Compliant stocks would show
similar resilience during the coronavirus pandemic than their conventional counterparts. and pro- vides
an original empirical analysis as it stands out from the extant literature in many aspects.
First, while previous research focuses on Compliant mutual funds and Islamic stock market
indexes, we filter our sample of North American companies into Compliant and Non-compliant
groups. Compliant firm must satisfy the qualitative and quantitative screening process defined by
Islamic law, Second, our paper analyzes the quarterly stock performance using individual cross-
sectional regressions during the first two quarters of 2020. To better discern the effect of compliance
on the firm financial performance, measured by the daily abnormal returns and daily volatility, during the
COVID-19 crisis, we employ the difference-in-difference methodology. February 24th and April, 17th
correspond respectively, to the beginning and the end of the COVID-19 crisis.
We find that compliant stocks outperform their conventional counterparts during the pandemic
and that this outperformance is not associated with higher risk as compliant stocks are evidenced to be
less volatile than their non-Compliant peers during the covid-19 period.
While our article fills a gap in the existing literature related to the impact of COVID-19 pan-
demic on Islamic stocks performance, it also suggests new avenues for research. In the next step, we
will examine the compliance impact of the global financial market. To do so, we will expand the data
sample to include Middle Eastern, Asian and European Countries.
45
Table 1: Industrial distribution of Compliant and Non-Compliant companies during the first
and the second quarter of 2020
Industry sector CC NCC Total Weight(%)
Quarter 1 2020 Consumer Nondurables 30 76 106 4.66 Consumer Durables 14 39 53 2.33 Manufacturing 73 140 213 9.37 Oil, Gas, and Coal Extraction and Products
6 72 78 3.43
Chemicals and Allied Products 22 43 65 2.86 Business Equipment 249 170 419 18.43 Telephone and Television Transmission
7 56 63 2.77
Utilities 5 81 86 3.78 Wholesale, Retail, and Some Services
49 150 199 8.75
Healthcare, Medical Equipment, and Drugs
142 140 282 12.40
Finance 0 414 414 18.21 Other 75 221 296 13.02 Total 672 1602 2274 100.00
Quarter 2 2020 Consumer Nondurables 27 76 103 4.68 Consumer Durables 19 30 49 2.23 Manufacturing 75 133 208 9.45 Oil, Gas, and Coal Extraction and Products
5 64 69 3.13
Chemicals and Allied Products 26 40 66 3.00 Business Equipment 254 160 414 18.81 Telephone and Television Transmission
10 54 64 2.91
Utilities 4 77 81 3.68 Wholesale, Retail, and Some Services
49 139 188 8.54
Healthcare, Medical Equipment, and Drugs
160 127 287 13.04
Finance 0 384 384 17.45 Other 84 204 288 13.08 Total 713 1488 2201 100.00
The table details the Industrial distribution of Compliant and Non-compliant companies
during the first (Panel A) and second (Panel B) quarter of 2020. A firm is considered
Compliant if it satisfy the quantitative and qualitative screening criteria defined by the Islamic
law. Industry classification is based on Fama French 12 industries. We obtain the industry
classification from Kenneth French website.
46
Table 2: Summary statistics: Compliant and Non-Compliant companies during the first and
the second quarter of 2020
Panel A : Quarter 1,
2020
Compliant firms mean sd p10 p25 p50 p75 p90
Quarterly return -0.13 0.23
-0.38 -0.26
-0.13 -0.02 0.10
Quarterly abnormal return 0.06 0.22
-0.20 -0.07
0.05 0.17 0.29
Quarterly total volatility 0.63 0.20
0.45 0.51 0.60 0.72 0.86
Quarterly idiosyncratic volatility
0.37 0.17
0.22 0.26 0.34 0.43 0.56
Debt 0.12 0.10
0.01 0.03 0.10 0.20 0.27
Receivables 0.15 0.10
0.04 0.08 0.14 0.22 0.29
Cash + Interest bearing securities
0.09 0.08
0.01 0.03 0.07 0.14 0.21
Growth 3.36 2.29
1.29 1.74 2.61 4.25 6.98
Tobin’s q 3.85 2.31
1.73 2.18 3.06 4.71 7.42
Size 7.53 1.63
5.53 6.38 7.36 8.51 9.78
CFO 0.08 0.14
-0.06 0.05 0.11 0.16 0.21
Dividend 0.77 1.37
0.00 0.00 0.00 1.21 2.23
ROE 0.01 0.59
-0.39 -0.03
0.11 0.20 0.36
Cash 0.26 0.23
0.02 0.07 0.18 0.39 0.63
Observations 672
Non-Compliant firms
Quarterly return -0.31 0.26
-0.62 -0.47
-0.30 -0.14 -0.01
Quarterly abnormal return -0.12 0.23
-0.40 -0.25
-0.11 0.01 0.15
Quarterly total volatility 0.68 0.26
0.41 0.53 0.64 0.79 0.98
Quarterly idiosyncratic volatility
0.39 0.21
0.21 0.26 0.35 0.47 0.64
Debt 1.65 3.90
0.10 0.36 0.71 1.52 3.30
Receivables 1.99 4.34
0.08 0.19 0.43 1.18 6.96
Cash + Interest bearing securities
0.35 0.85
0.02 0.06 0.16 0.38 0.72
Growth 1.03 1.25
0.15 0.32 0.66 1.22 2.17
Tobin’s q 1.71 1.22
0.99 1.06 1.32 1.86 2.84
Size 8.62 1.70
6.48 7.46 8.52 9.66 10.85
CFO 0.05 0.10
-0.01 0.02 0.06 0.10 0.15
Dividend 2.11 2.76
0.00 0.00 1.34 2.99 5.27
ROE 0.04 0.47
-0.21 0.02 0.09 0.15 0.27
Cash 0.13 0.19
0.01 0.02 0.05 0.14 0.35
47
Observations 1602
Panel B : Quarter 2,
2020
Compliant firms mean sd p10 p25 p50 p75 p90
Quarterly return 0.33 0.26
0.07 0.16 0.28 0.44 0.66
Quarterly abnormal return 0.11 0.25
-0.13 -0.05
0.06 0.20 0.42
Quarterly total volatility 0.59 0.22
0.36 0.44 0.56 0.69 0.83
Quarterly idiosyncratic volatility
0.37 0.19
0.19 0.25 0.33 0.44 0.57
Debt 0.12 0.10
0.01 0.03 0.09 0.20 0.28
Receivables 0.13 0.09
0.04 0.07 0.11 0.19 0.26
Cash + Interest bearing securities
0.08 0.07
0.01 0.03 0.06 0.12 0.18
Growth 3.26 2.26
1.27 1.67 2.48 4.08 6.69
Tobin’s q 3.76 2.29
1.71 2.14 3.00 4.56 7.13
Size 7.53 1.64
5.53 6.32 7.33 8.54 9.81
(mean) cfo 0.07 0.14
-0.11 0.04 0.10 0.15 0.21
Dividend 0.74 1.28
0.00 0.00 0.00 1.21 2.22
ROE -0.01 0.63
-0.46 -0.07
0.10 0.20 0.36
Cash 0.26 0.24
0.02 0.07 0.19 0.41 0.65
Observations 713
Non-Compliant firms
Quarterly return 0.28 0.27
0.02 0.12 0.24 0.41 0.60
Quarterly abnormal return 0.05 0.26
-0.20 -0.10
0.01 0.16 0.34
Quarterly total volatility 0.73 0.34
0.40 0.53 0.69 0.87 1.06
Quarterly idiosyncratic volatility
0.39 0.24
0.21 0.26 0.34 0.47 0.63
Debt 1.22 2.47
0.09 0.35 0.64 1.38 2.52
Receivables 1.79 3.92
0.08 0.17 0.39 0.96 6.48
Cash + Interest bearing securities
0.34 0.83
0.03 0.06 0.16 0.35 0.67
Growth 1.05 1.32
0.16 0.32 0.67 1.21 2.21
Tobin’s q 1.74 1.28
0.99 1.06 1.33 1.86 2.87
Size 8.69 1.72
6.56 7.53 8.57 9.71 11.00
(mean) cfo 0.06 0.10
-0.01 0.02 0.06 0.10 0.15
Dividend 2.07 2.62
0.00 0.00 1.40 3.04 5.15
ROE 0.05 0.46
-0.20 0.03 0.09 0.15 0.27
Cash 0.12 0.18
0.01 0.02 0.05 0.14 0.33
Observations 1488
This table reports the summary statistics of all variables included in the study for Compliant
and Un-compliant firms. A firm is considered Compliant if it satisfy the quantitative and
qualitative screening criteria defined by the Islamic law. The numbers reported represent the
mean across firms as well as the standard deviation and the 10th to 90th percentile on the first
(Panel A) and the second (Panel B) quarter of 2020. A detailed definition of the variables is
found in Table A.1.
48
Table 3: Cross-sectional regressions for quarterly abnormal returns
Abnormal
returni
Quarter
1
Abnormal
returni
Abnormal
returni
Quarter
2
Abnormal
returni
Compliant 0.134∗∗∗
(12.11)
0.116∗∗∗
(9.01)
0.0325∗
(2.56)
0.0340∗
(2.37)
Cash 0.122∗∗∗
(3.71)
0.0947∗
(2.19)
Leverage 0.0684∗
(2.41)
0.209∗∗∗
(5.89)
Tobin’s q -
0.0579
∗ (-
2.22)
-
0.0910
∗ (-
2.11)
Dividend -0.00692∗∗ 0.00266
(-3.25) (0.99)
cfo -0.142∗
(-2.25)
-
0.372∗∗
∗ (-
4.54)
ROE 0.00320 -0.0372∗
(0.24) (-2.49)
Growth 0.0671∗
(2.54)
0.103∗
(2.33)
Constant -0.107∗∗∗ -0.101∗∗∗ 0.0604∗∗∗ 0.0388
(-18.18) (-5.54) (8.90) (1.21)
N
2274
2274
2201
2201
49
R squared Industry
fixed
effects
Robust
standard
errors
0.209 yes
yes
0.235 yes
yes
0.0663 yes
yes
0.130 yes
yes
This table reports the results of the following regression:
Performancei = α + β1 Compliant + β2 Controlsi + β3 Industry FEi
+ ϵi,
where the dependent variable Performancei is the quarterly abnormal return of firm i.
Compliant, the variable of interest, is a binary variable equals one if the firm is compliant and
zero otherwise. We construct the Compliant using the qualitative and quantitative screening
process detailed in the subsection 3.1. We run the regression on the first and second quarters of
2020, separately under two specifications: without firm controls (specification 1), with firm
controls (specification 2). For both specifications, we control for the industry fixed effects.
Control variables are winsorized at the 1% and 99% levels. A detailed definition of the
dependent and independent variables is found in Table A.1. t
statistics are in parenthesis and are adjusted for heteroskedasticity. ∗ p < 0.05, ∗∗ p < 0.01, ∗∗∗ p <
0.001.
Table 4: Cross-sectional regressions for quarterly idiosyncratic volatility
Idio
volatilityi
Quarter
1
Idio volatilityi
Idio
volatilityi
Quarter
2
Idio
volatilityi
Compliant -
0.0703∗
∗∗ (-
6.91)
-
0.0398∗
∗∗ (-
3.81)
-
0.0590∗
∗∗ (-
6.09)
-
0.0388∗
∗∗ (-
3.56)
Cash 0.174∗∗∗
(6.79)
0.130∗∗
(2.81)
Leverage 0.124∗∗∗
(4.59)
0.169∗∗∗
(5.60)
Tobin’s q -0.00779 -0.0964
(-0.37) (-1.78)
Dividend -0.00642∗∗∗ -0.00254
(-3.61) (-0.96)
50
cfo -
0.344∗∗
∗ (-
6.05)
-
0.467∗∗
∗ (-
5.36)
ROE -
0.0416
∗ (-
2.23)
-
0.0367∗
∗∗ (-
3.74)
Growth 0.00253 0.0931
(0.12) (1.66)
Constant 0.406∗∗∗
(71.99)
0.379∗∗∗
(27.57)
0.402∗∗∗
(69.04)
0.424∗∗∗
(10.21)
N
2274
2274
2201
2201
R squared Industry
fixed
effects
Robust
standard
errors
0.111 yes
yes
0.212 yes
yes
0.0709 yes
yes
0.169 yes
yes
This table reports the results of the following regression:
Performancei = α + β1 Compliant + β2 Controlsi + β3 Industry FEi
+ ϵi,
where The dependent variable Performancei is the quarterly idiosyncratic volatility of firm i.
Compliant, the variable of interest, is a binary variable equals one if the firm is compliant and
zero otherwise. We construct the Compliant using the qualitative and quantitative screening
process detailed in the subsection 3.1. We run the regression on the first and second quarters
of 2020, separately under two specifications: without firm controls (specification 1), with
firm controls (specification 2). For both specifications, we control for the industry fixed
effects. Control variables are winsorized at the 1% and 99% levels. A detailed definition of
the dependent and independent variables is found in Table A.1. t statistics are in parenthesis and are adjusted for heteroskedasticity. ∗ p < 0.05, ∗∗ p < 0.01, ∗∗∗ p < 0.001.
51
Table 5: Cross-sectional regressions for quarterly total volatility
Total
voltilityi
Quarter
1
Total
voltilityi
Total
voltilityi
Quarter
2
Total
voltilityi
Compliant -
0.0866∗
∗∗ (-
7.12)
-
0.0524∗∗
∗ (-4.20)
-
0.140∗∗
∗
(-11.05)
-
0.0948∗
∗∗ (-
6.71)
Cash 0.163∗∗∗ 0.0284
(4.89) (0.45)
Leverage 0.0758∗
(2.11)
0.106∗
(2.38)
Tobin’s q 0.0536 -0.0119
(1.89) (-0.15)
Dividend -
0.0115∗∗
∗ (-4.57)
-
0.00857
∗ (-
2.34)
cfo -0.409∗∗∗
(-5.98)
-
0.590∗∗
∗ (-
5.17)
ROE -0.0385 -0.0357∗∗
(-1.91) (-2.91)
Growth -0.0591∗ -0.000272
(-2.05) (-0.00)
52
Constant 0.690∗∗∗
(99.19)
0.653∗∗∗
(37.35)
0.726∗∗∗
(88.11)
0.756∗∗∗
(12.77)
N
2274
2274
2201
2201
R squared Industry
fixed
effects
Robust
standard
errors
0.0675 yes
yes
0.151 yes
yes
0.0875 yes
yes
0.149 yes
yes
This table reports the results of the following regression:
Performancei = α + β1 Compliant + β2 Controlsi + β3 Industry FEi
+ ϵi,
where the dependent variable Performancei is the quarterly total volatility of firm i.
Compliant, the variable of interest, is a binary variable equals one if the firm is compliant and
zero otherwise. We construct the Compliant using the qualitative and quantitative screening
process detailed in the subsection 3.1. We run the regression on the first and second quarters of
2020, separately under two specifications: without firm controls (specification 1), with firm
controls (specification 2). For both specifications, we control for the industry fixed effects.
Control variables are winsorized at the 1% and 99% levels. A detailed definition of the
dependent and independent variables is found in Table A.1. t
statistics are in parenthesis and are adjusted for heteroskedasticity. ∗ p < 0.05, ∗∗ p < 0.01, ∗∗∗ p <
0.001.
Table 6: Difference-in-differences regression for daily abnormal returns. The sample period
starts from January 1st 2020 to April 17th.2020
(1)
Abnormal
returni,t
(2)
Abnormal
returni,t
Compliant 0.215∗∗∗
(11.07)
0.244∗
(2.45)
Postcovid -
0.213∗∗∗
(-7.85)
-
0.227∗∗
∗ (-12.26)
Compliant × Postcovid 0.273∗∗∗
(6.27)
0.260∗∗∗
(7.44)
53
Constant -
0.139∗∗∗
(-13.43)
-
0.139∗∗
∗
(-4.36) N R squared
Firm fixed
effects Day
fixed effect Robust standard errors
179677 0.00161
no
no
yes
179677 0.000454
yes
yes
yes
This table reports the results of a difference-in-differences estimation of daily abnormal
returns during the period from January 1st, 2020 to April, 17th 2020. The difference-in-
difference model is giving by the following regression:
Performancei,t = α + β1 Compliant i × PostCOV IDt + β2 Firm FEi
+ β3 Day FEt + ϵi,t,
where the dependent variable Performancei is the daily abnormal return of firm i on day t.
PostCOV ID is a dummy variable and equals 1 for each day from February 24 until April 17,
and zero otherwise. Compliant, the variable of interest, is a binary variable equals one if the
firm is compliant and zero otherwise. We construct the Compliant using the qualitative and
quantitative screening process detailed in the subsection 3.1. A detailed definition of the
dependent and independent variables is found in Table A.1. We run the regression under two
specifications: without firm and day fixed effect (specification 1), without firm and day fixed
effect (specification 2). A detailed definition of the dependent and independent variables is
found in Table A.1. Standard errors are clustered by firm and day. t statistics are in
parenthesis. ∗ p < 0.05, ∗∗ p < 0.01, ∗∗∗ p < 0.001.
Table 7: Difference-in-differences regressions for the daily price range. The sample period
starts from January 1st 2020 to April 17th.2020
(1)
Price rangei,t
(2)
Price
rangei,t
Compliant 0.00277∗∗∗ 0.0000353
(14.97) (0.02)
Postcovid 0.0632∗∗∗
(226.55)
0.0640∗∗∗
(96.64)
Compliant × Postcovid -
0.0158∗∗∗
(-36.33)
-
0.0169∗∗
54
∗ (-
19.24)
Constant 0.0276∗∗∗
(278.76)
0.0282∗∗∗
(39.50) N R squared
Firm fixed
effects Day
fixed effect Robust standard errors
179677 0.273
no
no
yes
179677 0.318
yes
yes
yes
This table reports the results of a difference-in-differences estimation of the daily price range
during the period from January 1st, 2020 to April, 17th 2020. The difference-in-difference
model is giving by the following regression:
Performancei,t = α + β1 Compliant i × PostCOV IDt + β2 Firm FEi
+ β3 Day FEt + ϵi,t,
where the dependent variable Performancei is the daily the daily price range of firm i on
day t . PostCOVID is a dummy variable and equals 1 for each day from February 24 until
April 17, and zero otherwise. Compliant, the variable of interest, is a binary variable
equals one if the firm is compliant and zero otherwise. We construct the Compliant using
the qualitative and quantitative screening process detailed in the subsection 3.1. A detailed
definition of the dependent and independent variables is found in Table A.1. We run the
regression under two specifications: without firm and day fixed effect (specification 1),
without firm and day fixed effect (specification 2). Standard errors
are clustered by firm and day. t statistics are in parenthesis. ∗ p < 0.05, ∗∗ p < 0.01, ∗∗∗ p < 0.001.
55
Figure 1: Daily S&P 500 index value.
Figure 1 plots the daily observations from February 24th, 2020 to April 17th, 2020 represent
the COVID period in our analysis. This is the area represented by the two vertical lines.
An Appendix
Table A.1: Variables’ definitions
Variable Definition
Compliant Binary variable equals one if the firm is compliant and zero
otherwise. We construct the Compliant using the screening process
detailed in the subsection 3.1.
Quarterly return The quarterly raw returns for firm i is the sum of daily logarithm
returns during
the quarter for firm i. We obtain the daily returns from CRSP.
Daily Abnormal return The daily Abnormal return is the difference between daily logarithm
return of
a stock and the CAPM beta times the daily logarithm return of the
market. The CAPM beta is estimated by using daily returns from
2017 to 2020, where the market index is obtained from Kenneth
French website.
February 24th, 2020 April 17th, 2020
01jan2020 01mar2020 01may2020 01jul2020
date
01sep2020 01nov2020 01jan2021
2000
2500
56
Quarterly Abnormal returns The quarterly Abnormal return is measured over the whole period
of the first
and the second quarter of 2020.
Quarterly total volatility We first calculate the monthly total volatility by calculating the
standard deviation of daily returns for the month. It is then
annualized by multiplying by 252. The quarterly total volatility is
the average annualized monthly volatility for a giving quarter.
Quarterly idiosyncratic volatility We first find the monthly idiosyncratic volatility by the
linear regression of
daily stock returns on the Fama French factors and the Momentum
factor. The idiosyncratic volatility of stock i for a given month is
the square root of the sum of squared residuals of this regression for all days in the month. This value is annualized by multiplying by 252. The quarterly idiosyncratic volatility is
the average annualized monthly volatility for a giving quarter.
Growth Market value (CSHO* PRCC) over Book value (AT). Annual data
from Compustat (2019).
Table A.1: —Continued
Variable Definition
Tobin’s q Book value of assets (AT) minus the book value of equity
(CEQ) plus the market value of equity (CSHO*PRCC), all divided
by book value of assets (AT). Annual data from Compustat (2019).
Size Natural log of the book value of total asset (AT). Annual data from
Compustat (2019).
CFO Cash flows from operating activities (OANCF) divided by total
asset (AT).
Annual data from Compustat (2019).
Dividend Dividend per share (DVPSX) times 100 over stock price (PRCC).
Annual data from Compustat (2019).
ROE Net income (NI) over book equity (CEQ). Annual data from
√
57
Compustat (2019).
Cash Cash holdings (CHE) over book assets (AT). Annual data from
Compustat (2019).
PostCOV IDt Dummy variable equals one during the COVID period and zero
otherwise. Period from February 24th, 2020 to April 17th 2020
represents the COVID period in our analysis.
Daily price range Daily high-low price range of a stock (ASKHI -BIDLO) during the
first as well
as the second quarter of 2020, scaled by the midpoint of high and
low daily prices ( ASKHI+ BIDLO)/2. Daily date from CRSP.
The control variables in our study are defined following (Albuquerque et al., 2020 and Tahir &
Ibrahim, 2020).
References
Abduh, M., (2020). Volatility of Malaysian conventional and Islamic indices: does financial
crisis matter? Journal of Islamic Accounting and Business Research.
Acharya, V., and Steffen, S., (2020). Stress tests for banks as liquidity insurers in a time of COVID.
VoxEU. org, March 22.
Ahmad, F., Seyyed, F. J. and Ashfaq, H., (2020). Managing a Shariah-compliant capital
protected fund through turbulent times. Asian Journal of Management Cases, vol 17, pp.
S32–S41.
Al-Khazali, O., Lean, H. H. and Samet, A., (2014). Do Islamic stock indexes outperform
conven- tional stock indexes? A stochastic dominance approach. Pacific-Basin Finance
58
Journal pp. 28:29– 46.
Albuquerque, R. A., Koskinen, Y., Yang, S. and Zhang, C., (2020). Love in the time of
COVID-19: The resiliency of environmental and social stocks.
Altarawneh, G., and Lucas, M., (2012). Understanding the dominance of Western accounting
and neglect of Islamic accounting in Islamic countries. Journal of Islamic Accounting and
Business Research.
Amar, A., Slimane, I. B. and Bellalah, M., (2017). Are Non-Conventional Banks More
Resilient than Conventional Ones to Financial Crisis?.
Arouri, M., Ben Ameur, H., Jawadi, N., Jawadi, F. and Louhichi, W., (2013). Are Islamic
finance innovations enough for investors to escape from a financial downturn? Further
evidence from portfolio simulations. Applied Economics, vol. 45, pp.3412–3420.
Arshad, S., and Rizvi, S. A. R., (2013). The impact of global financial shocks to Islamic
indices: speculative influence or fundamental changes? Journal of Islamic Finance 2.
Ashraf, D., Rizwan, M. S. and Ahmad, G., (2020). Islamic Equity Investments and the
COVID-19 Pandemic. Available at SSRN 3611898.
Aziz, S., Jalan, A., Matkovskyy, R. and Bouraoui, T., (2020). Does religious philosophy
affect investor behaviour in the COVID-19 times: Evidence from herding in (non-) Shariah
compliant energy firms. Available at ResearchGate. net .
Bitar, M., Madies, P. and Taramasco, O., (2017). What makes Islamic banks different? A
multivariate approach. Economic Systems, vol 41, pp. 215–235.
Bourkhis, K., and Nabi, M. S., (2013). Islamic and conventional banks’ soundness during the
2007– 2008 financial crisis. Review of Financial economics, vol 22, pp. 68–77.
59
Dewandaru, G., Rizvi, S. A. R. Masih, R., Masih, M. and Alhabshi, S. O. (2014). Stock
market co-movements: Islamic versus conventional equity indices with multi-timescales
analysis. Eco- nomic Systems, vol 38, pp. 553–571.
Erdogan, S., Gedikli, A. and Cevik E. I., (2020). The effects of the covid-19 pandemic on
conventional and Islamic stock markets in Turkey. Bilimname 2020:89–110.
Hammoudeh, S., W. Mensi, Reboredo, J. C. and Nguyen, D. K., (2014). Dynamic
dependence of the global Islamic equity index with global conventional equity market
indices and risk factors. Pacific-Basin Finance Journal, vol 30, pp. 189–206.
Hasan, M., and Dridi, J., (2011). The effects of the global crisis on Islamic and conventional
banks: A comparative study. Journal of International Commerce, Economics and Policy vol.
2, pp.163–200.
Hassan, M. K., Rabbani, M. R. and Ali, M., (2020). Challenges for the Islamic Finance and
banking in post COVID era and the role of Fintech. J. Econ. Coop. Dev. 43.
Ho, C. S. F., Masood, O., Rehman, A. A. and Bellalah, M., (2012). Syariah accounting and
compliant screening practices. Qualitative Research in Financial Markets.
Karim, B. A., Lee, W. S., Karim, Z. A. and Jais, M., (2012). The impact of subprime
mortgage crisis on Islamic banking and Islamic stock market. Procedia-Social and
Behavioral Sciences, vol. 65, pp. 668–673.
Kayed, R. N., and Hassan, M. K. (2011). The global financial crisis and Islamic finance.
Thunderbird International Business Review, vol. 53, pp.551–564.
Lang, L., Ofek, E. and Stulz, R., (1996). Leverage, investment, and firm growth. Journal of
financial Economics, vol. 40, pp.3–29.
60
Merdad, H., Hassan, M. K. and Alhenawi, Y., (2010). Islamic versus conventional mutual
funds performance in Saudi Arabia: a case study. JKAU: Islamic Econ, vol, 23, pp.157–
193.
Milly, M., and Sultan, J., (2012). Portfolio diversification during financial crisis: Analysis of
faith-based investment strategies. building bridges across the financial communities: The
global financial crisis, social responsibility, and faith-based finance. Harvard Law School,
Islamic finance project pp. 334–352.
Miniaoui, H., Sayani, H. and Chaibi, A., (2015). The impact of financial crisis on Islamic and
conven- tional indices of the GCC countries. Journal of Applied Business Research (JABR),
vol.31, pp. 357–370.
Mnif, E., Jarboui, A. and Mouakhar, K., (2020). How the cryptocurrency market has
performed during COVID 19? A multifractal analysis. Finance research letters, vol. 36,
pp. 101-647.
Ramelli, S., and Wagner, A. F., (2020). Feverish stock price reactions to COVID-19. The
Review of Corporate Finance Studies, vol. 9, pp. 622–655.
Salisu, A. A., and Sikiru, A. A., (2020). Pandemics and the Asia-Pacific Islamic stocks. Asian
Economics Letters, vol 1, pp. 17-413.
Sherif, M., (2020). The impact of Coronavirus (COVID-19) outbreak on faith-based
investments: An original analysis. Journal of Behavioral and Experimental Finance
28:100403.
Sukmana, R., and Kolid, M., (2012). Impact of global financial crisis on Islamic and
conventional stocks in emerging market: an application of ARCH and GARCH method. Asian
Academy of Management Journal of Accounting & Finance, vol, 31, pp. 357–370.
61
Tahir, M., and Ibrahim, S., (2020). The performance of Shariah-compliant companies during and
after the recession period–evidence from companies listed on the FTSE All World Index.
Journal of Islamic Accounting and Business Research.
Trabelsi, L., Bahloul, S. and Mathlouthi, F., (2020). Performance analysis of Islamic and
conven- tional portfolios: The emerging markets case. Borsa Istanbul Review, vol. 20, pp.
48–54.
Yarovaya, L., Elsayed, A. H. and Hammoudeh, S. M., (2020). Searching for Safe Havens
during the COVID-19 Pandemic: Determinants of Spillovers between Islamic and
Conventional Financial Markets. Available at SSRN 3634114.