Embed Size (px)
Citation preview
Nat. Hazards Earth Syst. Sci., 8, 243–266, 2008www.nat-hazards-earth-syst-sci.net/8/243/2008/© Author(s) 2008. This work is licensedunder a Creative Commons License.
Natural Hazardsand Earth
System Sciences
The Papua New Guinea tsunami of 17 July 1998: anatomy of acatastrophic event
D. R. Tappin1, P. Watts2, and S. T. Grilli 3
1British Geological Survey, Kingsley Dunham Centre, Keyworth, Nottingham, NG12 5GG, UK2Applied Fluids Engineering, Inc., Private Mail Box #237, 6216 E. Pacific Coast Highway, Long Beach, CA 90803, USA3Department of Ocean Engineering, University of Rhode Island, Narragansett, RI 02882, USA
Received: 30 August 2005 – Revised: 24 May 2007 – Accepted: 21 February 2008 – Published: 26 March 2008
Abstract. The Papua New Guinea (PNG) tsunami of July1998 was a seminal event because it demonstrated that rela-tively small and relatively deepwater Submarine Mass Fail-ures (SMFs) can cause devastating local tsunamis that strikewithout warning. There is a comprehensive data set thatproves this event was caused by a submarine slump. Yet,the source of the tsunami has remained controversial. Thiscontroversy is attributed to several causes. Before the PNGevent, it was questionable as to whether SMFs could causedevastating tsunamis. As a result, only limited modelling ofSMFs as tsunami sources had been undertaken, and these ex-cluded slumps. The results of these models were that SMFsin general were not considered to be a potential source ofcatastrophic tsunamis. To effectively model a SMF requiresfairly detailed geological data, and these too had been lack-ing. In addition, qualitative data, such as evidence fromsurvivors, tended to be disregarded in assessing alternativetsunami sources. The use of marine geological data to iden-tify areas of recent submarine failure was not widely applied.
The disastrous loss of life caused by the PNG tsunamiresulted in a major investigation into the area offshore ofthe devastated coastline, with five marine expeditions takingplace. This was the first time that a focussed, large-scale, in-ternational programme of marine surveying had taken placeso soon after a major tsunami. It was also the first time thatsuch a comprehensive data set became the basis for tsunamisimulations. The use of marine mapping subsequently ledto a larger involvement of marine geologists in the studyof tsunamis, expanding the knowledge base of those study-ing the threat from SMF hazards. This paper provides anoverview of the PNG tsunami and its impact on tsunamiscience. It presents revised interpretations of the slump ar-
Correspondence to:D. R. Tappin([email protected])
chitecture based on new seabed relief images and, usingthese, the most comprehensive tsunami simulation of thePNG event to date. Simulation results explain the measuredrunups to a high degree. The PNG tsunami has made a ma-jor impact on tsunami science. It is one of the most studiedSMF tsunamis, yet it remains the only one known of its type:a slump.
1 Introduction
When the Papua New Guinea (PNG) tsunami struck on theevening of 17 July 1998, devastating three villages with theloss of over 2200 lives, the potential hazard from tsunamiscaused by Submarine Mass Failures (SMFs) was recog-nised, but not fully grasped (e.g. Ward, 2001; Bardet et al.,2003). There was limited appreciation that the magnitudeof tsunamis generated by SMFs was dependent upon themode of failure. SMFs include all forms of seabed sedi-ment movement that may be regarded by their end membersas ranging from translational sediment flows with long run-outs, formed most often by sands and silts and soft mud, torotational slumps which, by comparison to sediment flows,have restricted horizontal movement and are formed mainlyin cohesive mud. Thus before 1998, although there had beenprevious research on SMFs, this work was not generally inthe context of their potential to generate destructive tsunamiswhich would have a major coastal impact. The PNG tsunamichanged this perspective. It illustrated that SMFs can causedevastating local tsunamis. It led to a fundamental reap-praisal of the hazard from SMFs. It also illustrated that thespecific mechanism of SMF (rotation or translation) is a ma-jor control on tsunami magnitude (Grilli and Watts, 2005;Watts et al., 2005a).
Published by Copernicus Publications on behalf of the European Geosciences Union.
244 D. R. Tappin et al.: The PNG tsunami of 1998 – a catastrophic event
Although the PNG event has had a major impact ontsunami science, the cause of the local tsunami has remainedcontroversial (e.g. Geist, 2000; Imamura et al., 2003; Satakeet al., 2003). This controversy continues despite the compre-hensive data set acquired while researching the disaster, andthe large number of publications addressing the event. Over40 scientific papers have been published on the tsunami (e.g.Synolakis et al., 2002; Tappin et al., 1999, 2001, 2002, 2003).The event was the subject of special workshops, as well asnumerous sessions at international scientific meetings (e.g.Hebenstreit, 2001; Bardet et al., 2003; Tappin, 2004). Thefar field tsunami was probably caused by the earthquake, butfor many scientists an earthquake source for the local tsunamiis still considered a likely alternative or, at the very least, acontributory factor (e.g. Geist, 2000; Satake et al., 2003).
The purpose of this paper is therefore threefold. 1) Topresent new interpretations of multibeam bathymetric andseismic data from which we readily identify a slump fea-ture offshore of northern PNG. 2) That new modelling basedon these interpretations proves the 1998 PNG tsunami inthe near field was caused by an underwater sediment slump,probably triggered by an earthquake, and not by the earth-quake itself. Models based on the slump source recreate thetsunami wave to an acceptable degree of precision. 3) Fi-nally, to gain a better understanding of why the tsunami wassuch a seminal event and why its source has remained con-troversial.
2 Background
The potential for SMFs to generate tsunamis has been knownfor over 100 years (Milne, 1898; de Ballore, 1907; Guten-berg, 1939). Of the more recent SMF events, most have in-volved some degree of controversy, at least initially. Oneexample is the Grand Banks event of 1929 (Heezen and Ew-ing, 1952; Heezen et al., 1954; Terzaghi, 1956; Piper andMcCall, 2003). Other tsunamis that may involve SMFs suchas Unimak, Alaska, 1946, and Sanriku, 1896, were consid-ered primarily in the context of their earthquake source (e.g.Abe, 1979; Johnson and Satake, 1997). It is only recentlythat a SMF was shown to be a likely cause of the 1946Alaska event, almost certainly locally and possibly in thefar-field as well (Fryer et al., 2004; Lopez and Okal, 2006;Waythomas et al., 20081). The Flores Island tsunami of 1992has been largely neglected, even though it is likely that, aswith Alaska, 1946, both earthquake and landslide sourcescontributed to the event (Imamura and Gica, 1996; Imamuraet al., 1995).
Previous to the PNG tsunami, simulations of tsunami gen-eration were mainly confined to earthquake sources (e.g.
1Waythomas, C. F., Watts, P., Shi, F., and Kirby, J. T.: Pacificbasin tsunami hazards associated with mass flows in the AleutianArc of Alaska, Quat. Sci. Rev., in review, 2008.
Hammack, 1973). Earthquake sources were based on the as-sumption that the initial water surface deformation was in-stantaneous and equal to that at the seabed. Seabed deforma-tion was calculated from earthquake fault parameters (e.g.Okada, 1985). Underwater landslides were considered to beineffective at generating significant tsunamis because of theirlonger source generation times, smaller areas of seabed dis-turbance, and the directivity of the tsunami produced (Ham-mack, 1973; LeBlond and Jones, 1995). Modelling of SMFswas mainly confined to translational events (e.g. Jiang andLeBlond, 1992, 1994) such as those defined by Hampton(1972). A complication in understanding tsunamis generatedby SMFs is the variety of their failure mechanisms, whichmay be classified according to morphology, sediment type,or kinematics (see Hampton et al., 1996; Turner and Schus-ter, 1996; Keating and McGuire, 2000; O’Grady et al., 2000).The type of SMF is determined mainly by its sediment com-position, which controls SMF morphology and kinematics.Tsunami generation models were based on depth-averagedwave equations that represented immiscible liquids, or waterwith a Bingham plastic (e.g. Jiang and LeBlond, 1992, 1994).Whereas depth averaging accurately applies to tsunami gen-eration from earthquakes, it is questionable when applied tolandslide tsunamis, because it does not allow for vertical fluidaccelerations, which are important during SMF motion andtsunami generation (Grilli et al., 2002). In 1998, the land-slide constitutive equations used in modelling were largelyuntested by laboratory experiments or case studies. SMFmodels were not based on geological data, but idealised SMFmorphologies. There was no established method of merginggeological data with SMF models. In total, there was littleappreciation of the complexity of modelling tsunamis gener-ated by different SMF mechanisms.
3 The Papua New Guinea tsunami of 1998
The basic facts relating to the PNG event are well estab-lished. An earthquake of magnitude 7.1 struck the north-ern coast at 08:49 GMT (18:49 local time) on 17 July 1998(Fig. 1; Davies, 1998; Kawata et al., 1999). The earth-quake magnitude was small in comparison to the 10–15 mhigh tsunami that devastated the coast around Sissano La-goon. There was no evidence to suggest that the earthquakewas a “tsunami earthquake” (Kanimori, 1972) and, basedon Newman and Okal’s (1998b) discriminant ofE/M0, theearthquake did not possess “slow” source characteristics.(These authors define “slowness” using the ratio betweenhigh-frequency energyE and low-frequency seismic mo-mentM0. Compared to an average value of−4.98, the mainshock was computed at−5.67, indicating a moderate de-ficiency in E, and the aftershock at−4.72, a normal rup-ture speed, neither of which indicates a tsunami earthquake.)Simulations of the tsunami based on a shallow dipping thrust(the most probable earthquake failure mechanism) did not
Nat. Hazards Earth Syst. Sci., 8, 243–266, 2008 www.nat-hazards-earth-syst-sci.net/8/243/2008/
D. R. Tappin et al.: The PNG tsunami of 1998 – a catastrophic event 245
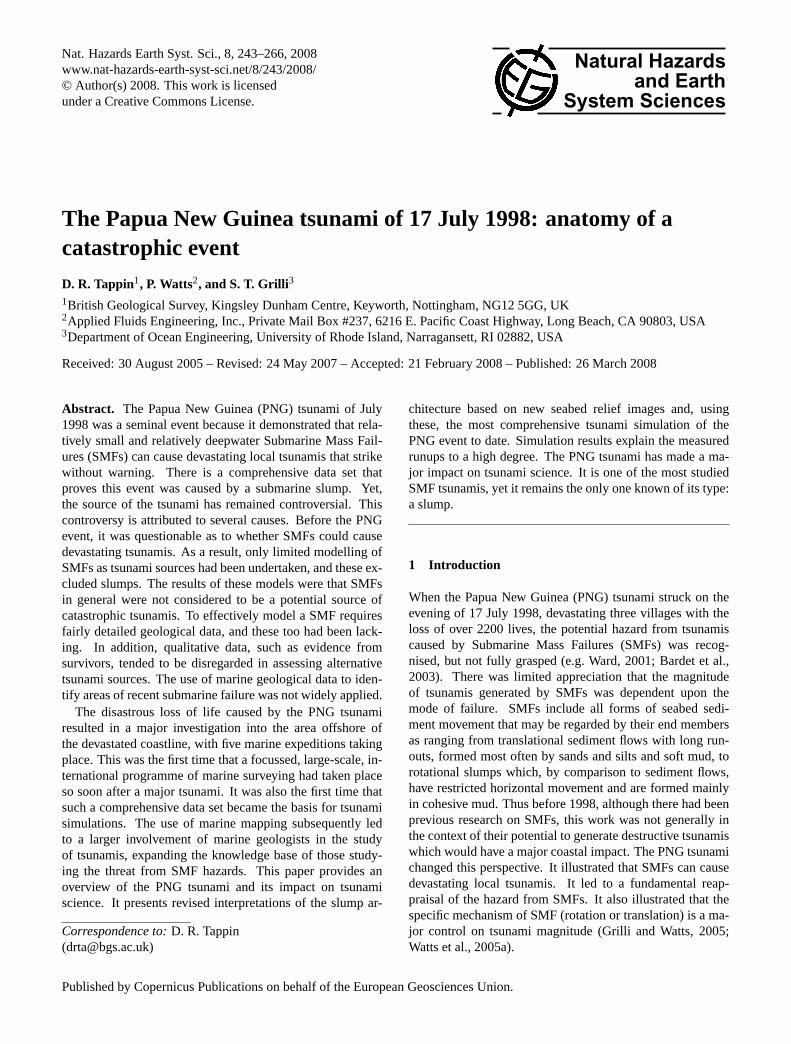
Fig. 1. Location map of the northern PNG coast struck by the tsunami of July, 1998 and bathymetry from the 1999Kairei survey. Alsoshown is the earthquake epicentre (Green star), the aftershocks of 09:09:30 and 09:10:00 (pink stars), the T-phase slump signal of 09:02(blue star – with error ellipse in blue from Synolakis et al., 2002), the main villages destroyed (red dots), the slump area, and main seabedfeatures. Water depths are in metres.
approach the runup measured during the onshore field sur-veys, or match the wave arrival times from eyewitness ac-counts (e.g. Titov and Gonzalez, 1998; Davies, 1998; Kawataet al., 1999; Matsuyama et al., 1999). The location of theearthquake epicentre just offshore and to the northwest ofSissano would have resulted in an almost immediate waveimpact, not corresponding to the∼20 min delay reported bysurvivors. The peaked runup distribution along the coast didnot indicate a presumably broad earthquake source. Fromthe outset it was likely that a tsunami source other than anearthquake was involved, the most likely alternative being aSMF (e.g. Newman and Okal, 1998a, b; Titov and Gonzalez,1998; Geist, 1998a; Takahashi and Kawata, 1998).
Without data from offshore, there would have been noopportunity to confirm or refute the suggestion that a SMFmay have caused or contributed to the tsunami. However,in early 1999, the Japanese government funded, through theJapan Marine Science and Technology Center (JAMSTEC)two marine surveys to investigate the seabed off the northcoast of PNG. The objective was to discover whether therewas a SMF offshore of Sissano Lagoon and, if so, whether
it could have generated the tsunami. The first two surveyswere followed in September of the same year by a surveyled by the University of California at Santa Cruz (UCSC). In2000 and 2001, there were two additional surveys funded byJapan and again sponsored by JAMSTEC and SOPAC. Thefirst published results of the offshore surveys and preliminarymodelling concluded that an offshore slump was the mostlikely source of the local tsunami (Tappin et al., 1999), aninterpretation confirmed by subsequent marine geology re-search (Tappin et al., 2001, 2002, 2003; Sweet and Silver,1999, 2003).
Notwithstanding the initial results of the offshore surveys,the debate over the source of the tsunami continued (e.g.Matsuyama et al., 1999; Satake and Tanioka, 1999; Tanioka,1999; Geist, 2000). Far-field earthquake evidence was usedto justify a steeply-dipping thrust as the rupture mechanism(Kikuchi et al., 1999), despite the fact that this was unlikelybecause the aftershock distribution indicated a shallow dip-ping rupture (McCue, 1998). In addition, the marine surveysshowed that almost all major faults offshore were dip-slip(Tappin et al., 1999). Simulations based on a tsunami source
www.nat-hazards-earth-syst-sci.net/8/243/2008/ Nat. Hazards Earth Syst. Sci., 8, 243–266, 2008
246 D. R. Tappin et al.: The PNG tsunami of 1998 – a catastrophic event
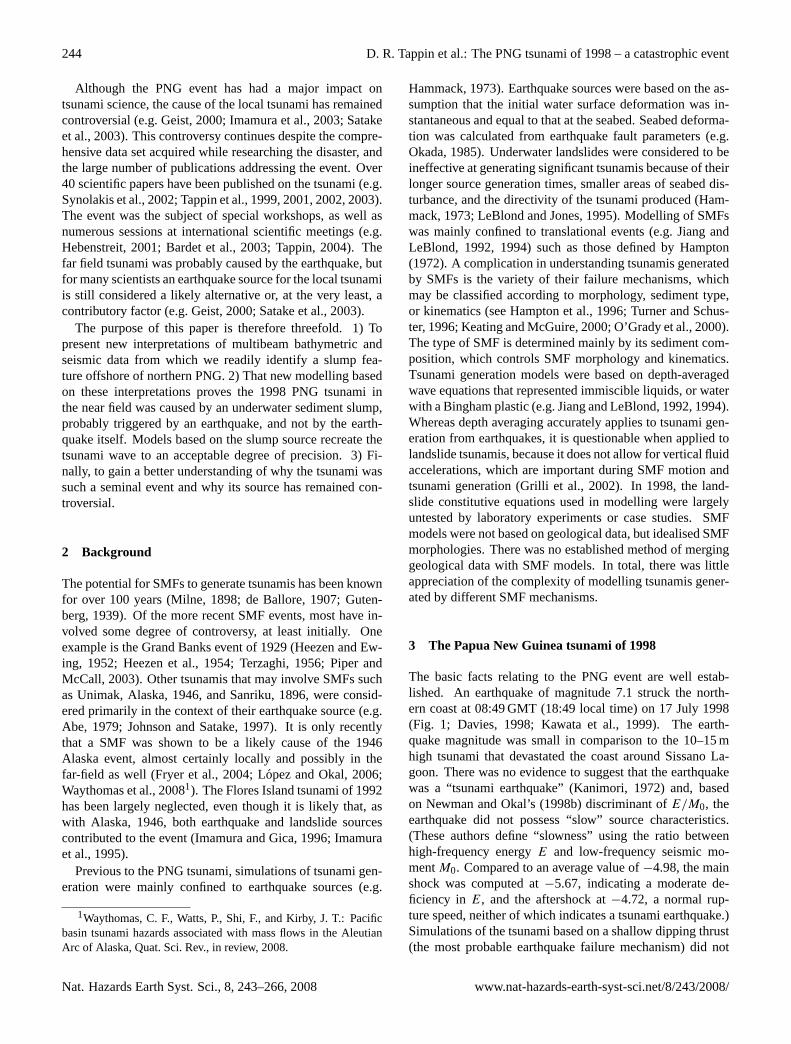
Fig. 2. 3-D image of the Amphitheatre viewed from the northwest.The three slumps (A, B and C, labelled by decreasing age) are iden-tified together with the control fault at the base of the headscarp.Note the change in seabed morphology from the heavily gullied areain the right of the image (slump A) to that to the left (slumps B andC), where gullies are absent. Water depths are in metres. Verticalexaggeration 3×. See text for discussion.
from translational landslides (e.g. Hampton, 1972) could notreproduce the measured runup (see papers presented at theIUGG meeting in July, 1999 and published in Hebenstreit,2001). Although the first published results of the marine sur-veys identified a slump as the likely source (Tappin et al.,1999), translational landslide sources were still consideredto be the most likely mechanism of failure and tsunami gen-eration (e.g. Matsuyama et al., 1999; Geist, 2000). Withno local tide gauge data, the reports from survivors on the20 min time lag between the earthquake and tsunami werediscounted (e.g. Geist, 2000). Despite the additional evi-dence from the marine surveys of late 1999 (Sweet and Sil-ver, 1999) and early 2000 (Tappin et al., 2001), together withthe preliminary numerical simulations (Watts et al., 1999)that confirmed an offshore sediment slump as the most likelytsunami source, arguments on the source mechanism contin-ued (Geist, 2001; Imamura and Hashi, 2003; Okal and Syn-olakis, 2001; Satake and Tanioka, 2003; Tappin et al., 2001;Synolakis et al., 2002; papers in Bardet et al., 2003).
4 Marine geology
During the marine surveys, a comprehensive geophys-ical data set was acquired off northern PNG, withover 19 000 km2 of multibeam bathymetry, 4.2 kHz high-resolution sub-bottom seismic lines (SBSL), and both single(SCS) and multichannel seismic (MCS) data. In the region
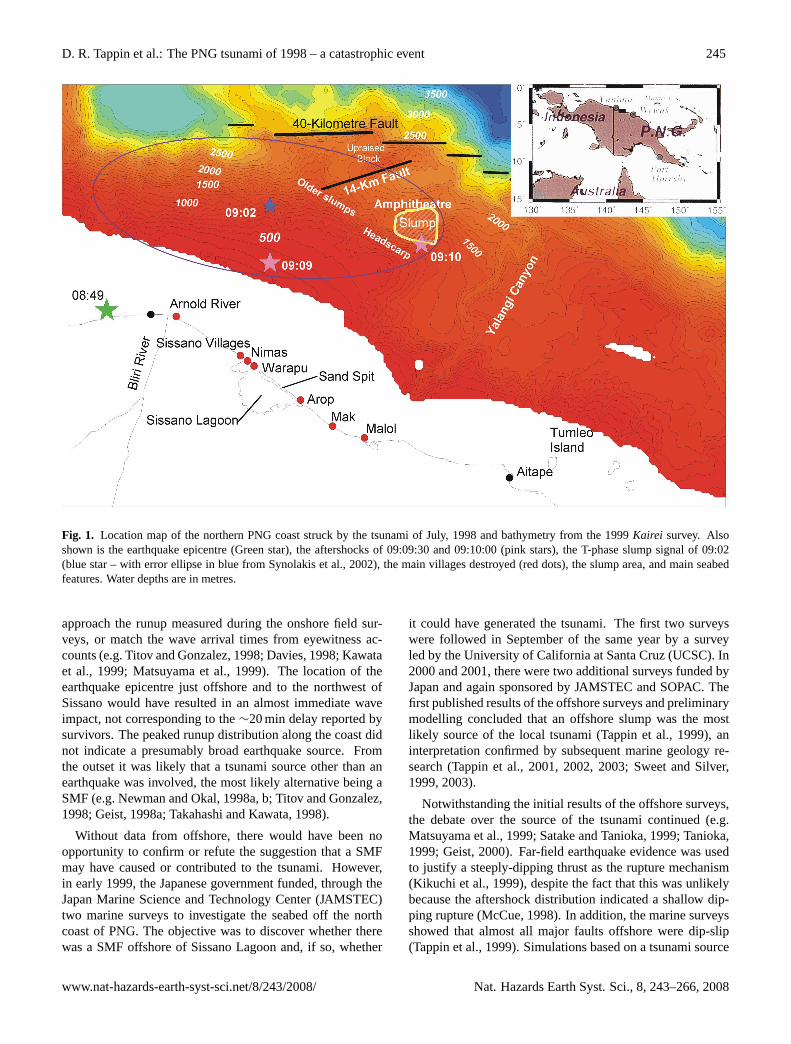
Fig. 3. 3-D image of the Amphitheatre, including seismic cutawayof slump C, viewed from the northeast. The headwall of the slumpcoincides with a control fault. This fault channelled artesian waterpumped up from depth to the slump failure surface, triggering theslump itself around 12 min after the main shock. Vertical exaggera-tion 3×. See text for discussion.
of the slump, four 7 m long sediment piston cores were re-covered together with numerous shallow (30 cm) push coresof sediment, rock samples, and marine organisms. Still andvideo photography of the seabed were acquired by a tetheredRemotely Operated Vehicle (ROV) and Manned Submersible(MS). This data set has been fully reported on (Tappin et al.,1999, 2001, 2002, 2003; Sweet and Silver, 2003). It hascontributed to PNG tsunami analysis by providing a compre-hensive understanding of: (i) the background tectonics andsedimentation regime of the area; (ii) the slump and its archi-tecture; and (iii) the relative timing of slump failure. Here,we focus on the area termed the ‘Amphitheatre’, in whichlies the slump, considered as the most likely source of the1998 tsunami (Fig. 1). Our new interpretations are based onvisualisations of seabed relief integrated with seismic reflec-tion profiles usingFledermaus, an interactive visualisationsoftware (Figs. 2 and 3).
The arcuate shape of the Amphitheatre indicates a likelyformation by submarine slope failure along a control faultlocated along the base of the headscarp (Figs. 1, 2 and3). Integration and reinterpretation of the multibeambathymetry with the SCS and MCS, usingFledermaus, hasresulted in improved interpretations of slumping within the
Nat. Hazards Earth Syst. Sci., 8, 243–266, 2008 www.nat-hazards-earth-syst-sci.net/8/243/2008/
D. R. Tappin et al.: The PNG tsunami of 1998 – a catastrophic event 247
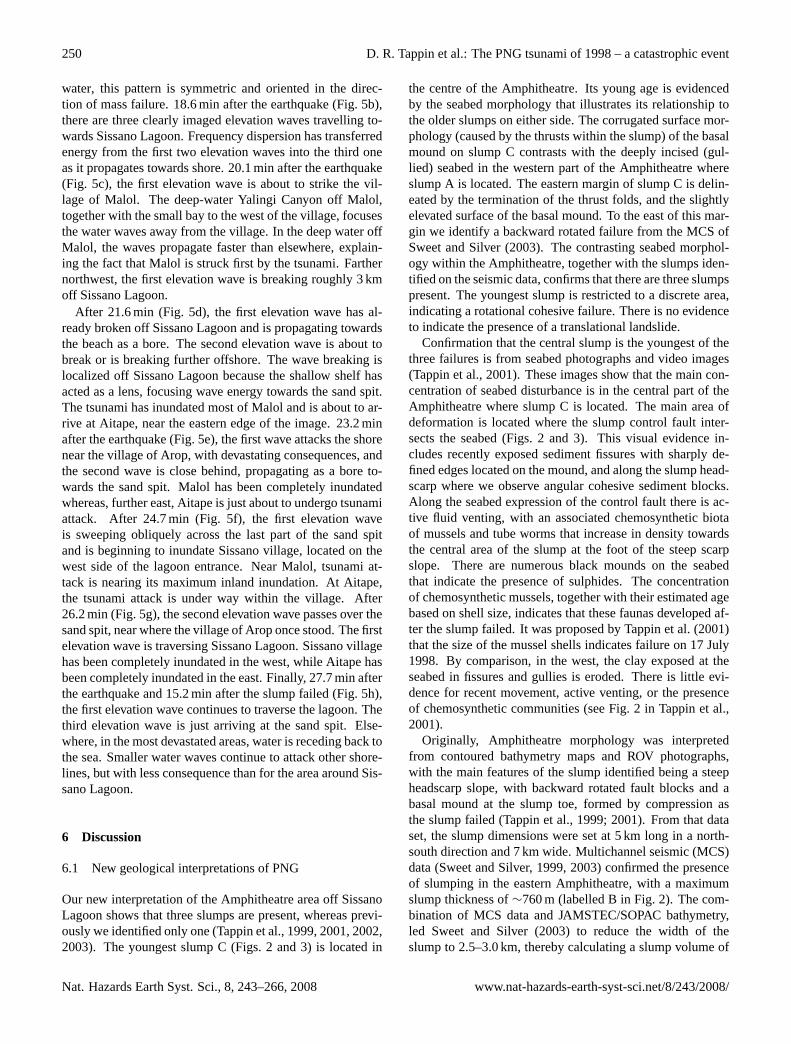
Amphitheatre (Figs. 2 and 3). The new interpretation showsthat there are three phases of slumping. There are two olderslumps (A and B) located in the east and west of the Am-phitheatre, that are both cut by the youngest slump (C) thatlies in the centre and is interpreted as failing on 17 July1998. The western slump (A) is identified by its heavilygullied surface with arcuate thrust ridges and a headscarptraced upward to the foot of the subsided reef (Fig. 2). Theeastern slump (B), (described by Sweet and Silver, 2003) isprobably younger than slump A in the west, as its surfaceis not as heavily gullied. Both A and B are truncated byslump C. On the surface of slump C, on the elevated moundbelow the headscarp, there are curvilinear, but generally east-west trending ridges and furrows, that are convex towardsthe north and clearly terminate at the eastern and westernboundaries of the slump. These features are the surface ex-pression of small thrust faults (or pressure ridges) that areimaged on the seismic data and which formed during downs-lope movement of the slump. On the seismic surveys, theslump toe overrides the underlying strata, a relationship typi-cal of slumping in cohesive sediments (Fig. 3). The youngestslump terminates the thrust ridges of older slumps A and Bto both the east and west. The data confirms previous inter-pretations that there is downslope sediment movement in theAmphitheatre and that this movement is of limited horizontalextent. There is no further sediment runout below the moundthat would indicate a translational failure, such as landslideor sediment flow. The new interpretation also confirms thatthe failures in the Amphitheatre are slumps. The youngestcentral slump has a width of∼4.2 km, a length of∼4.5 km,and a thickness of∼750 m. The slump volume is estimatedto be around 6.4 km3.
5 Tsunami modelling
Modelling of the PNG tsunami source based on a slump inthe Amphitheatre took place in three phases. Preliminarymodelling took place onboard theKairei in January 1999as the first data were acquired (published in Tappin et al.,1999). A subsequent phase of modelling took place after thefirst two marine surveys (Tappin et al., 2001; Watts et al.,2003). More recent modelling has been undertaken over thepast three years. The results of these phases are shown inFig. 4a–c.
Our most recent modelling results (Fig. 4d) are based onthe revised slump architecture presented above. The newmodelling also benefits from recent advances made in under-standing tsunami generation from SMFs, that have now clar-ified and/or validated assumptions made previously (Grilli etal., 2005; Watts et al., 2005a; Enet and Grilli, 2007). We havealso refined the grid spacing, and in place of the previous100×100 m grid we have now used a uniform 50×50 m grid.For the tsunami propagation and inundation model (see Wattset al., 2003), we use FUNWAVE, a fully nonlinear and dis-
persive (so-called “Boussinesq”) long wave model that sim-ulates the more dispersive SMF tsunamis far better than tra-ditional nonlinear shallow water (NSW) wave models. FUN-WAVE also includes well-calibrated dissipation models forwave breaking and bottom friction (Wei and Kirby, 1995;Wei et al. 1995; Chen et al., 2000; Kennedy et al., 2000). Fi-nally, we now use the actual time of slump failure (to withinapproximately 45 s) as identified by themb=4.4 aftershock at09.02 (GMT), as well as T-phase records made at the sametime (Okal et al., 1999; Synolakis et al., 2002). (There isa 45-s error bar in the timing of the T-Phase because of un-certainty between the relationship of the T-Phase signals andthe roughly 100-s duration of slump failure. To account forthese uncertainties, we have assumed that the two kinds ofsignals correlate with the middle period of slump movement,when seismic waves and T-phase sounds would presumablybe strongest.)
With regard to tsunami generation, based on the reviseddimensions for slump C, we calculate a basal shear strengthof Su≈0.8 MPa, with a corresponding Coulomb friction co-efficient of Cn≈0.11. Using the equations of motion de-tailed in Grilli and Watts (2005), which are similar to thoseof Watts et al. (1999), we calculate a characteristic time ofslump motion,to=32 s, an initial accelerationao=0.47 m/s2,and a maximum velocityumax=15 m/s, occurring approxi-mately 50 s after slump failure. The slump comes to rest af-ter ∼100 s, at which time its centre of mass has advanced∼980 m downslope towards an azimuth of 349◦. The initialwater depth over the middle of the slump is 1420 m. Theseresults are the tsunami source parameters. In our simulations,the transformation of a 2-D into a 3-D tsunami source usesmass conservation considerations along the third dimension(Watts et al. 2005a; Grilli et al., 2002; Enet et al., 2005,2007). In the most recent simulations, both the free surfaceshape and horizontal velocities of the 3-D slump tsunamisource calculated at timet=to are specified as initial con-ditions in FUNWAVE.
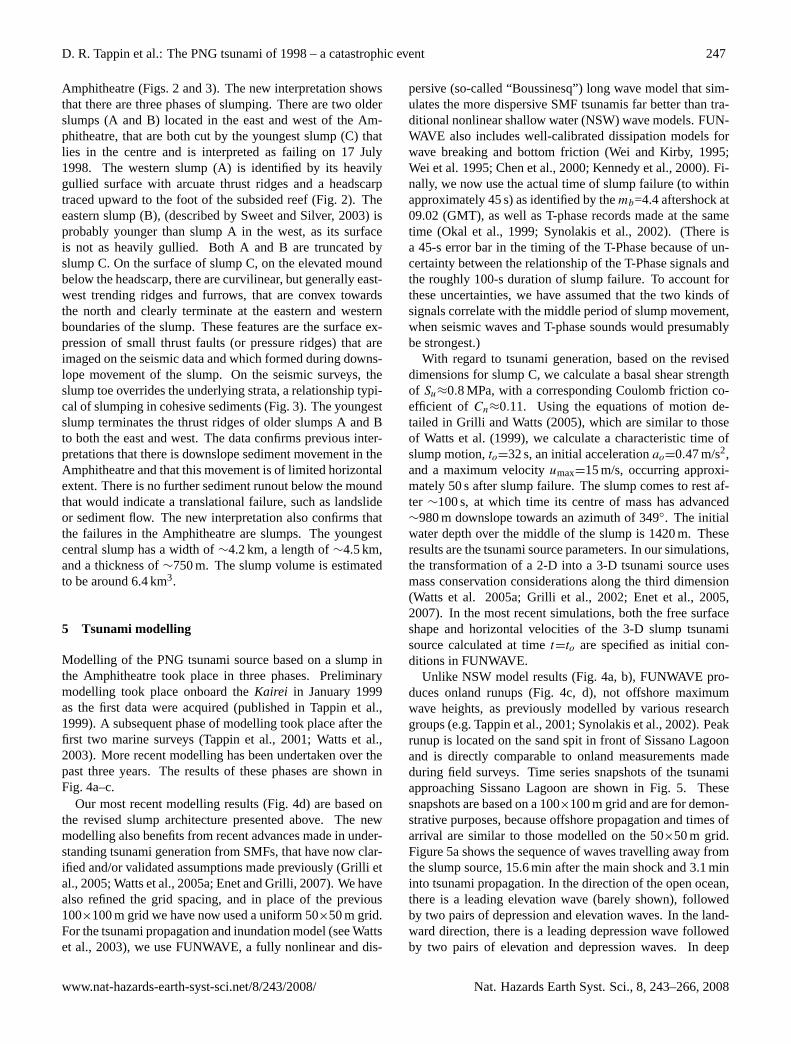
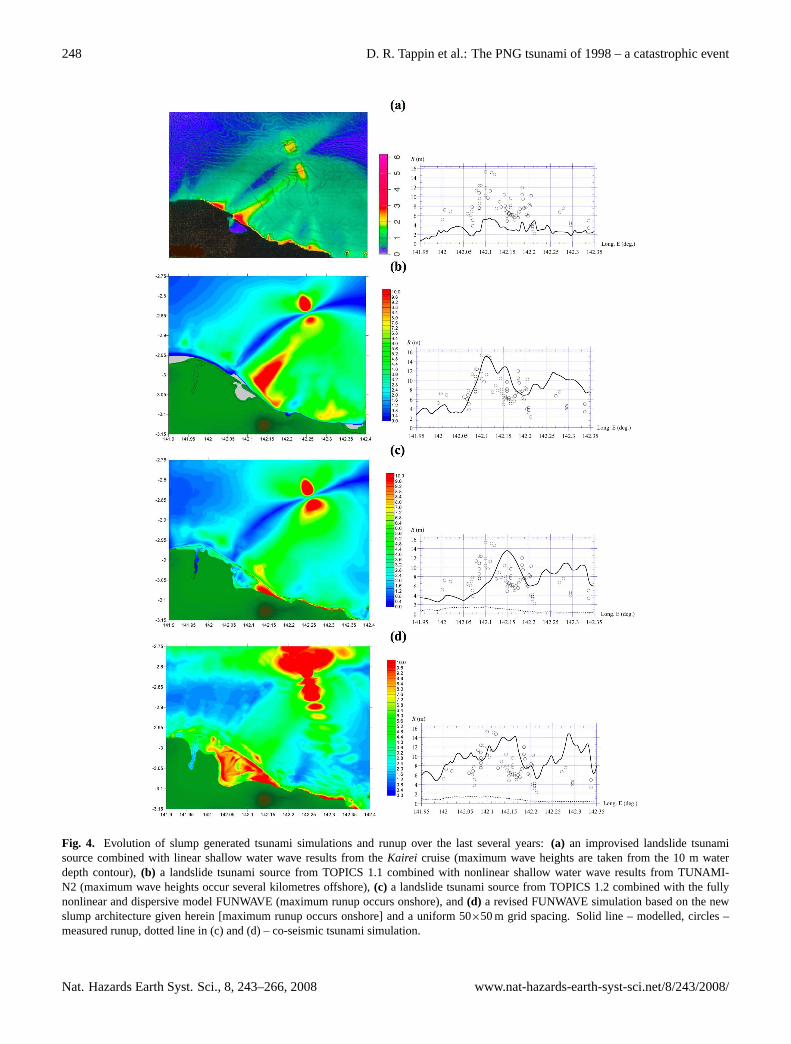
Unlike NSW model results (Fig. 4a, b), FUNWAVE pro-duces onland runups (Fig. 4c, d), not offshore maximumwave heights, as previously modelled by various researchgroups (e.g. Tappin et al., 2001; Synolakis et al., 2002). Peakrunup is located on the sand spit in front of Sissano Lagoonand is directly comparable to onland measurements madeduring field surveys. Time series snapshots of the tsunamiapproaching Sissano Lagoon are shown in Fig. 5. Thesesnapshots are based on a 100×100 m grid and are for demon-strative purposes, because offshore propagation and times ofarrival are similar to those modelled on the 50×50 m grid.Figure 5a shows the sequence of waves travelling away fromthe slump source, 15.6 min after the main shock and 3.1 mininto tsunami propagation. In the direction of the open ocean,there is a leading elevation wave (barely shown), followedby two pairs of depression and elevation waves. In the land-ward direction, there is a leading depression wave followedby two pairs of elevation and depression waves. In deep
www.nat-hazards-earth-syst-sci.net/8/243/2008/ Nat. Hazards Earth Syst. Sci., 8, 243–266, 2008
248 D. R. Tappin et al.: The PNG tsunami of 1998 – a catastrophic event
Fig. 4. Evolution of slump generated tsunami simulations and runup over the last several years:(a) an improvised landslide tsunamisource combined with linear shallow water wave results from theKairei cruise (maximum wave heights are taken from the 10 m waterdepth contour),(b) a landslide tsunami source from TOPICS 1.1 combined with nonlinear shallow water wave results from TUNAMI-N2 (maximum wave heights occur several kilometres offshore),(c) a landslide tsunami source from TOPICS 1.2 combined with the fullynonlinear and dispersive model FUNWAVE (maximum runup occurs onshore), and(d) a revised FUNWAVE simulation based on the newslump architecture given herein [maximum runup occurs onshore] and a uniform 50×50 m grid spacing. Solid line – modelled, circles –measured runup, dotted line in (c) and (d) – co-seismic tsunami simulation.
Nat. Hazards Earth Syst. Sci., 8, 243–266, 2008 www.nat-hazards-earth-syst-sci.net/8/243/2008/
D. R. Tappin et al.: The PNG tsunami of 1998 – a catastrophic event 249
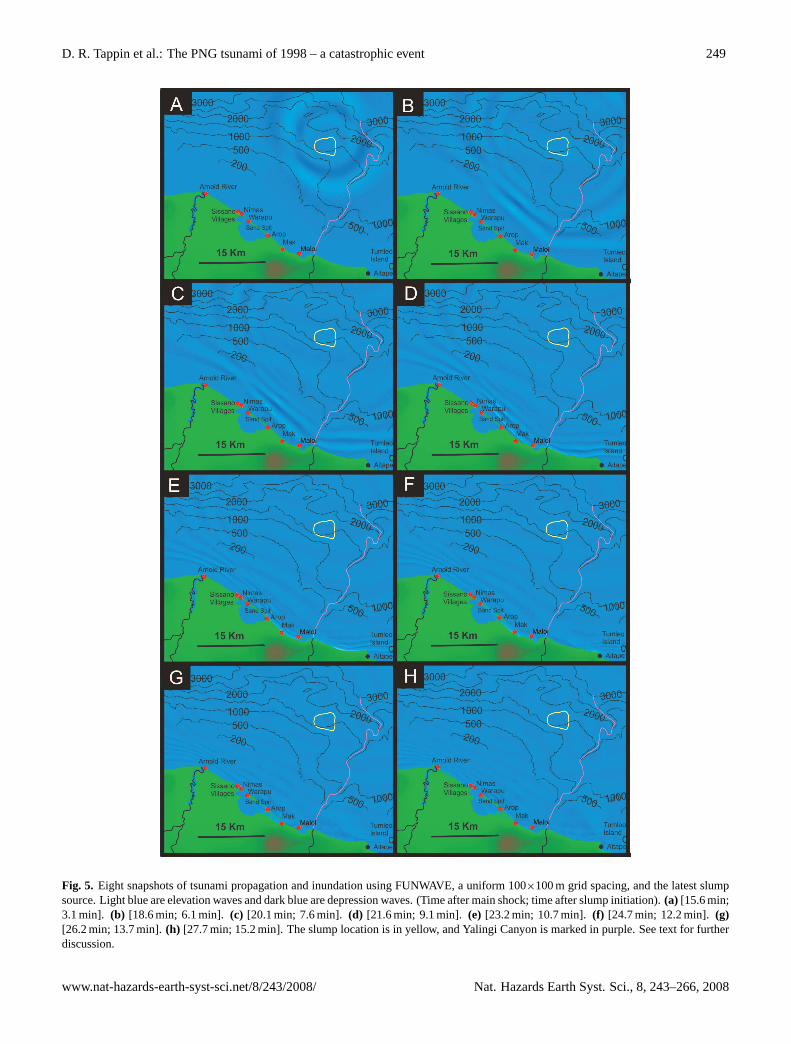
Fig. 5. Eight snapshots of tsunami propagation and inundation using FUNWAVE, a uniform 100×100 m grid spacing, and the latest slumpsource. Light blue are elevation waves and dark blue are depression waves. (Time after main shock; time after slump initiation).(a) [15.6 min;3.1 min]. (b) [18.6 min; 6.1 min]. (c) [20.1 min; 7.6 min]. (d) [21.6 min; 9.1 min]. (e) [23.2 min; 10.7 min].(f) [24.7 min; 12.2 min].(g)[26.2 min; 13.7 min].(h) [27.7 min; 15.2 min]. The slump location is in yellow, and Yalingi Canyon is marked in purple. See text for furtherdiscussion.
www.nat-hazards-earth-syst-sci.net/8/243/2008/ Nat. Hazards Earth Syst. Sci., 8, 243–266, 2008
250 D. R. Tappin et al.: The PNG tsunami of 1998 – a catastrophic event
water, this pattern is symmetric and oriented in the direc-tion of mass failure. 18.6 min after the earthquake (Fig. 5b),there are three clearly imaged elevation waves travelling to-wards Sissano Lagoon. Frequency dispersion has transferredenergy from the first two elevation waves into the third oneas it propagates towards shore. 20.1 min after the earthquake(Fig. 5c), the first elevation wave is about to strike the vil-lage of Malol. The deep-water Yalingi Canyon off Malol,together with the small bay to the west of the village, focusesthe water waves away from the village. In the deep water offMalol, the waves propagate faster than elsewhere, explain-ing the fact that Malol is struck first by the tsunami. Farthernorthwest, the first elevation wave is breaking roughly 3 kmoff Sissano Lagoon.
After 21.6 min (Fig. 5d), the first elevation wave has al-ready broken off Sissano Lagoon and is propagating towardsthe beach as a bore. The second elevation wave is about tobreak or is breaking further offshore. The wave breaking islocalized off Sissano Lagoon because the shallow shelf hasacted as a lens, focusing wave energy towards the sand spit.The tsunami has inundated most of Malol and is about to ar-rive at Aitape, near the eastern edge of the image. 23.2 minafter the earthquake (Fig. 5e), the first wave attacks the shorenear the village of Arop, with devastating consequences, andthe second wave is close behind, propagating as a bore to-wards the sand spit. Malol has been completely inundatedwhereas, further east, Aitape is just about to undergo tsunamiattack. After 24.7 min (Fig. 5f), the first elevation waveis sweeping obliquely across the last part of the sand spitand is beginning to inundate Sissano village, located on thewest side of the lagoon entrance. Near Malol, tsunami at-tack is nearing its maximum inland inundation. At Aitape,the tsunami attack is under way within the village. After26.2 min (Fig. 5g), the second elevation wave passes over thesand spit, near where the village of Arop once stood. The firstelevation wave is traversing Sissano Lagoon. Sissano villagehas been completely inundated in the west, while Aitape hasbeen completely inundated in the east. Finally, 27.7 min afterthe earthquake and 15.2 min after the slump failed (Fig. 5h),the first elevation wave continues to traverse the lagoon. Thethird elevation wave is just arriving at the sand spit. Else-where, in the most devastated areas, water is receding back tothe sea. Smaller water waves continue to attack other shore-lines, but with less consequence than for the area around Sis-sano Lagoon.
6 Discussion
6.1 New geological interpretations of PNG
Our new interpretation of the Amphitheatre area off SissanoLagoon shows that three slumps are present, whereas previ-ously we identified only one (Tappin et al., 1999, 2001, 2002,2003). The youngest slump C (Figs. 2 and 3) is located in
the centre of the Amphitheatre. Its young age is evidencedby the seabed morphology that illustrates its relationship tothe older slumps on either side. The corrugated surface mor-phology (caused by the thrusts within the slump) of the basalmound on slump C contrasts with the deeply incised (gul-lied) seabed in the western part of the Amphitheatre whereslump A is located. The eastern margin of slump C is delin-eated by the termination of the thrust folds, and the slightlyelevated surface of the basal mound. To the east of this mar-gin we identify a backward rotated failure from the MCS ofSweet and Silver (2003). The contrasting seabed morphol-ogy within the Amphitheatre, together with the slumps iden-tified on the seismic data, confirms that there are three slumpspresent. The youngest slump is restricted to a discrete area,indicating a rotational cohesive failure. There is no evidenceto indicate the presence of a translational landslide.
Confirmation that the central slump is the youngest of thethree failures is from seabed photographs and video images(Tappin et al., 2001). These images show that the main con-centration of seabed disturbance is in the central part of theAmphitheatre where slump C is located. The main area ofdeformation is located where the slump control fault inter-sects the seabed (Figs. 2 and 3). This visual evidence in-cludes recently exposed sediment fissures with sharply de-fined edges located on the mound, and along the slump head-scarp where we observe angular cohesive sediment blocks.Along the seabed expression of the control fault there is ac-tive fluid venting, with an associated chemosynthetic biotaof mussels and tube worms that increase in density towardsthe central area of the slump at the foot of the steep scarpslope. There are numerous black mounds on the seabedthat indicate the presence of sulphides. The concentrationof chemosynthetic mussels, together with their estimated agebased on shell size, indicates that these faunas developed af-ter the slump failed. It was proposed by Tappin et al. (2001)that the size of the mussel shells indicates failure on 17 July1998. By comparison, in the west, the clay exposed at theseabed in fissures and gullies is eroded. There is little evi-dence for recent movement, active venting, or the presenceof chemosynthetic communities (see Fig. 2 in Tappin et al.,2001).
Originally, Amphitheatre morphology was interpretedfrom contoured bathymetry maps and ROV photographs,with the main features of the slump identified being a steepheadscarp slope, with backward rotated fault blocks and abasal mound at the slump toe, formed by compression asthe slump failed (Tappin et al., 1999; 2001). From that dataset, the slump dimensions were set at 5 km long in a north-south direction and 7 km wide. Multichannel seismic (MCS)data (Sweet and Silver, 1999, 2003) confirmed the presenceof slumping in the eastern Amphitheatre, with a maximumslump thickness of∼760 m (labelled B in Fig. 2). The com-bination of MCS data and JAMSTEC/SOPAC bathymetry,led Sweet and Silver (2003) to reduce the width of theslump to 2.5–3.0 km, thereby calculating a slump volume of
Nat. Hazards Earth Syst. Sci., 8, 243–266, 2008 www.nat-hazards-earth-syst-sci.net/8/243/2008/
D. R. Tappin et al.: The PNG tsunami of 1998 – a catastrophic event 251
3.8–4.6 km3. The closely spaced grid of SCS data acquiredin 2001 in the region of the Amphitheatre further delineatedthe 3-D architecture of the area (Tappin et al., 2003). Basedon the SCS dataset, Tappin et al. (2003) increased the slumpwidth to 6 km, with a corresponding increase in slump vol-ume. However, we now recognise that the slump identifiedby Sweet and Silver (2003) in the east (B) is not part of thecentral, youngest, failure identified here as C. The seabedmorphology proves that slump C truncates slump B on itswestern margin (Fig. 2). In addition, Tappin et al. (2003)included all three slumps as a single failure in their inter-pretation of the SCS data, hence the increase in width overthat calculated previously. From our new interpretation wenow recognise that within the Amphitheatre there are threeslumps of different ages (A, B, and C) and that they are dif-ferent failures.
Interpretation of the marine data set not only provides themorphology of the slump tsunami source and its relativeage, it also allows us to explain the mechanism of failure.By inference, we can also account for the time lag betweenthe earthquake and slumping. We have reported elsewherethat the slump may have been triggered by fluids driven up-ward by the main shock along secondary faults (Tappin etal., 2002). We hypothesise here that the most likely con-duit for the water would have been the controlling normalfault, clearly imaged on the seismic data, which runs beneaththe slump headscarp. The strongly reflective character of thefault on the MCS data suggests long-term active fluid move-ment leading to authigenic carbonate deposition along thefault plane (Fig. 3). This contrasts with the headwall faultimaged on adjacent MCS lines where the fault plane is notso sharply imaged suggesting a reduced level of authigeniccarbonate precipitation (see Sweet and Silver, 2003). Authi-genic carbonates were commonly observed on the surface ofthe central slump at the seabed intersection with the controlfault under the headscarp (see Fig. 2, Tappin et al., 2001).The control fault is one of many along the inner trench wall,and is formed by subduction erosion, clearly a significantprocess acting along the margin (Tappin et al., 2001). Onour new 3-D imagery, we locate the slump on the hangingwall of the control fault, across which we propose a pressuredifferential that acted as a pump for artesian water. The after-shocks, 20 min after the main shock, lie within the same gen-eral area as the control fault and slump. These may well havebeen caused by a similar differential pressure mechanism, al-though a shift in overburden pressure, caused by slumping,may have contributed. It is well documented that large land-slides can generate earthquakes, a phenomenon called in-duced seismicity (e.g. Simpson, 1986). Slump displacementmay have played a role in triggering the two aftershocks, es-pecially because the shift in slump potential energy is muchlarger than the release of seismic energy by the two after-shocks.
6.2 New modelling of PNG
New simulation results (Fig. 4d), based on the new slumparchitecture, confirm the control of seabed morphology on atsunami sourced from a location in the Amphitheatre. Theresults are in reasonable agreement with field observations.Generation and propagation of the tsunami as well as theresulting coastal runup are both controlled by the morphol-ogy of the Amphitheatre together with wave interactions withthe Upraised Block. The Amphitheatre topography exertsan immediate influence on tsunami formation and propaga-tion because of its similar size to the slump: the Amphithe-atre is 10 km wide, compared to the tsunami wavelengthof around 7.6 km. Consequently, the new slump architec-ture we identify here also has an important control on thetsunami source dimensions and, because of the Amphitheatregeometry, the runup results as well. Thus, it is important toidentify the precise positioning of the tsunami source withinthe Amphitheatre. Different tsunami source positions withinthe Amphitheatre change where slump/Amphitheatre inter-actions initially occur, resulting in variations in the locationand size of onshore runup (see Fig. 6 and Sect. 6.4.1). Theseresults were produced on a uniform 100×100 m grid for thepurpose of relative comparison.
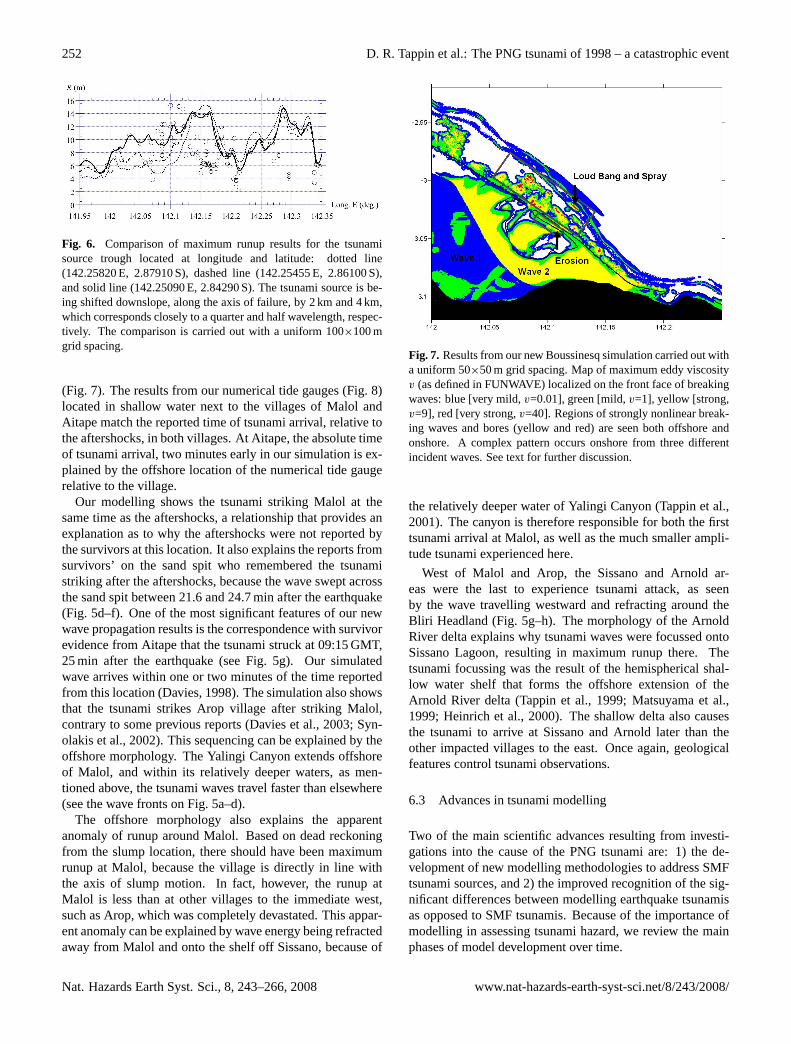
The new tsunami simulations, based on a slump sourcetimed from themb=4.4 aftershock at 09:02 and the T-phaserecords, are in good agreement (especially at Aitape) withaccounts from survivors on timing, wave impact, and num-ber of water waves (i.e. three) approaching the shore. Theyalso explain the reports of the first wave breaking offshore,the simultaneous arrival of the wave with the aftershocks atMalol, and the wave converging onto Sissano Lagoon (seeDavies, 1998). Figure 7 provides some specific examples ofreproducing tsunami observations. One way to characterizesimulation results is through wave breaking, as measured bythe eddy viscosity localized on the front face of a breakingwave (see Chen et al., 2000). The maximum eddy viscosity isa measure of the strength of wave breaking, as well as a mea-sure of wave nonlinearity. Strong wave breaking offshore(Fig. 7) explains the timing and location (3 km offshore) ofthe loud bang, and the northern horizon lit by the setting sunas reported by eyewitnesses on the sand spit before tsunamiattack. Wave breaking also explains the highly localized ero-sional features observed on the lagoon side of the sand spit(Gelfenbaum and Jaffe, 2003). Figure 7 indicates that thefirst wave occurred more as a flood inundation, whereas thesecond wave was highly nonlinear throughout much of its in-undation. These observations accord with the reports of sur-vivors’ located on the sand spit at the time of tsunami attack(Davies, 1998). The first wave propagated across Sissano La-goon and entered the mangrove forest landward of the lagoonas a deep inundation by a large volume of water. The sec-ond wave did not penetrate the mangrove forest as far inland,but maintained strong wave breaking throughout inundation,as reported by survivors carried into the forest by that wave
www.nat-hazards-earth-syst-sci.net/8/243/2008/ Nat. Hazards Earth Syst. Sci., 8, 243–266, 2008
252 D. R. Tappin et al.: The PNG tsunami of 1998 – a catastrophic event
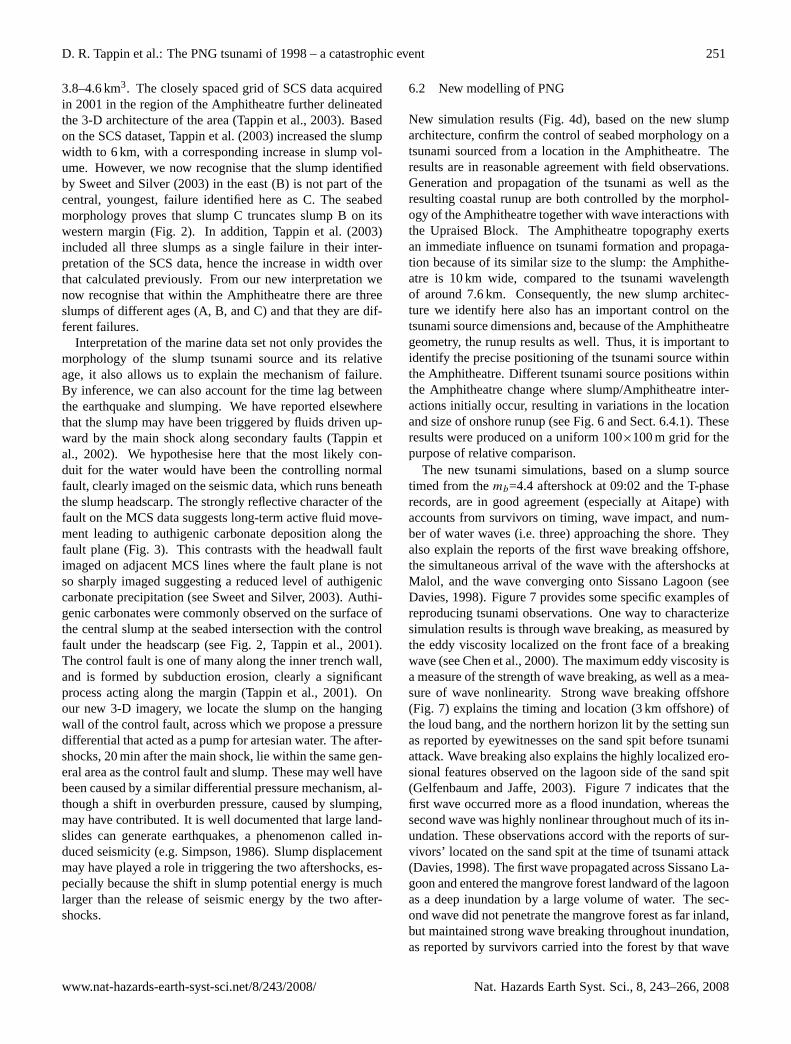
Fig. 6. Comparison of maximum runup results for the tsunamisource trough located at longitude and latitude: dotted line(142.25820 E, 2.87910 S), dashed line (142.25455 E, 2.86100 S),and solid line (142.25090 E, 2.84290 S). The tsunami source is be-ing shifted downslope, along the axis of failure, by 2 km and 4 km,which corresponds closely to a quarter and half wavelength, respec-tively. The comparison is carried out with a uniform 100×100 mgrid spacing.
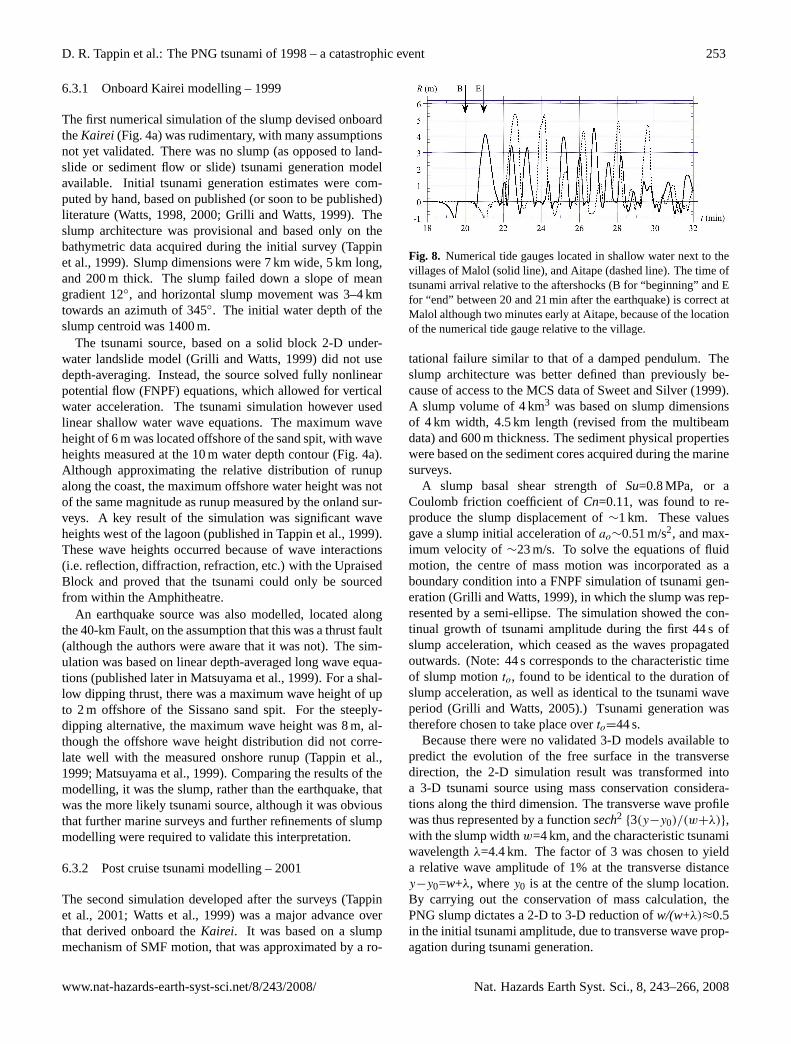
(Fig. 7). The results from our numerical tide gauges (Fig. 8)located in shallow water next to the villages of Malol andAitape match the reported time of tsunami arrival, relative tothe aftershocks, in both villages. At Aitape, the absolute timeof tsunami arrival, two minutes early in our simulation is ex-plained by the offshore location of the numerical tide gaugerelative to the village.
Our modelling shows the tsunami striking Malol at thesame time as the aftershocks, a relationship that provides anexplanation as to why the aftershocks were not reported bythe survivors at this location. It also explains the reports fromsurvivors’ on the sand spit who remembered the tsunamistriking after the aftershocks, because the wave swept acrossthe sand spit between 21.6 and 24.7 min after the earthquake(Fig. 5d–f). One of the most significant features of our newwave propagation results is the correspondence with survivorevidence from Aitape that the tsunami struck at 09:15 GMT,25 min after the earthquake (see Fig. 5g). Our simulatedwave arrives within one or two minutes of the time reportedfrom this location (Davies, 1998). The simulation also showsthat the tsunami strikes Arop village after striking Malol,contrary to some previous reports (Davies et al., 2003; Syn-olakis et al., 2002). This sequencing can be explained by theoffshore morphology. The Yalingi Canyon extends offshoreof Malol, and within its relatively deeper waters, as men-tioned above, the tsunami waves travel faster than elsewhere(see the wave fronts on Fig. 5a–d).
The offshore morphology also explains the apparentanomaly of runup around Malol. Based on dead reckoningfrom the slump location, there should have been maximumrunup at Malol, because the village is directly in line withthe axis of slump motion. In fact, however, the runup atMalol is less than at other villages to the immediate west,such as Arop, which was completely devastated. This appar-ent anomaly can be explained by wave energy being refractedaway from Malol and onto the shelf off Sissano, because of
Fig. 7. Results from our new Boussinesq simulation carried out witha uniform 50×50 m grid spacing. Map of maximum eddy viscosityv (as defined in FUNWAVE) localized on the front face of breakingwaves: blue [very mild,v=0.01], green [mild,v=1], yellow [strong,v=9], red [very strong,v=40]. Regions of strongly nonlinear break-ing waves and bores (yellow and red) are seen both offshore andonshore. A complex pattern occurs onshore from three differentincident waves. See text for further discussion.
the relatively deeper water of Yalingi Canyon (Tappin et al.,2001). The canyon is therefore responsible for both the firsttsunami arrival at Malol, as well as the much smaller ampli-tude tsunami experienced here.
West of Malol and Arop, the Sissano and Arnold ar-eas were the last to experience tsunami attack, as seenby the wave travelling westward and refracting around theBliri Headland (Fig. 5g–h). The morphology of the ArnoldRiver delta explains why tsunami waves were focussed ontoSissano Lagoon, resulting in maximum runup there. Thetsunami focussing was the result of the hemispherical shal-low water shelf that forms the offshore extension of theArnold River delta (Tappin et al., 1999; Matsuyama et al.,1999; Heinrich et al., 2000). The shallow delta also causesthe tsunami to arrive at Sissano and Arnold later than theother impacted villages to the east. Once again, geologicalfeatures control tsunami observations.
6.3 Advances in tsunami modelling
Two of the main scientific advances resulting from investi-gations into the cause of the PNG tsunami are: 1) the de-velopment of new modelling methodologies to address SMFtsunami sources, and 2) the improved recognition of the sig-nificant differences between modelling earthquake tsunamisas opposed to SMF tsunamis. Because of the importance ofmodelling in assessing tsunami hazard, we review the mainphases of model development over time.
Nat. Hazards Earth Syst. Sci., 8, 243–266, 2008 www.nat-hazards-earth-syst-sci.net/8/243/2008/
D. R. Tappin et al.: The PNG tsunami of 1998 – a catastrophic event 253
6.3.1 Onboard Kairei modelling – 1999
The first numerical simulation of the slump devised onboardtheKairei (Fig. 4a) was rudimentary, with many assumptionsnot yet validated. There was no slump (as opposed to land-slide or sediment flow or slide) tsunami generation modelavailable. Initial tsunami generation estimates were com-puted by hand, based on published (or soon to be published)literature (Watts, 1998, 2000; Grilli and Watts, 1999). Theslump architecture was provisional and based only on thebathymetric data acquired during the initial survey (Tappinet al., 1999). Slump dimensions were 7 km wide, 5 km long,and 200 m thick. The slump failed down a slope of meangradient 12◦, and horizontal slump movement was 3–4 kmtowards an azimuth of 345◦. The initial water depth of theslump centroid was 1400 m.
The tsunami source, based on a solid block 2-D under-water landslide model (Grilli and Watts, 1999) did not usedepth-averaging. Instead, the source solved fully nonlinearpotential flow (FNPF) equations, which allowed for verticalwater acceleration. The tsunami simulation however usedlinear shallow water wave equations. The maximum waveheight of 6 m was located offshore of the sand spit, with waveheights measured at the 10 m water depth contour (Fig. 4a).Although approximating the relative distribution of runupalong the coast, the maximum offshore water height was notof the same magnitude as runup measured by the onland sur-veys. A key result of the simulation was significant waveheights west of the lagoon (published in Tappin et al., 1999).These wave heights occurred because of wave interactions(i.e. reflection, diffraction, refraction, etc.) with the UpraisedBlock and proved that the tsunami could only be sourcedfrom within the Amphitheatre.
An earthquake source was also modelled, located alongthe 40-km Fault, on the assumption that this was a thrust fault(although the authors were aware that it was not). The sim-ulation was based on linear depth-averaged long wave equa-tions (published later in Matsuyama et al., 1999). For a shal-low dipping thrust, there was a maximum wave height of upto 2 m offshore of the Sissano sand spit. For the steeply-dipping alternative, the maximum wave height was 8 m, al-though the offshore wave height distribution did not corre-late well with the measured onshore runup (Tappin et al.,1999; Matsuyama et al., 1999). Comparing the results of themodelling, it was the slump, rather than the earthquake, thatwas the more likely tsunami source, although it was obviousthat further marine surveys and further refinements of slumpmodelling were required to validate this interpretation.
6.3.2 Post cruise tsunami modelling – 2001
The second simulation developed after the surveys (Tappinet al., 2001; Watts et al., 1999) was a major advance overthat derived onboard theKairei. It was based on a slumpmechanism of SMF motion, that was approximated by a ro-
Fig. 8. Numerical tide gauges located in shallow water next to thevillages of Malol (solid line), and Aitape (dashed line). The time oftsunami arrival relative to the aftershocks (B for “beginning” and Efor “end” between 20 and 21 min after the earthquake) is correct atMalol although two minutes early at Aitape, because of the locationof the numerical tide gauge relative to the village.
tational failure similar to that of a damped pendulum. Theslump architecture was better defined than previously be-cause of access to the MCS data of Sweet and Silver (1999).A slump volume of 4 km3 was based on slump dimensionsof 4 km width, 4.5 km length (revised from the multibeamdata) and 600 m thickness. The sediment physical propertieswere based on the sediment cores acquired during the marinesurveys.
A slump basal shear strength ofSu=0.8 MPa, or aCoulomb friction coefficient ofCn=0.11, was found to re-produce the slump displacement of∼1 km. These valuesgave a slump initial acceleration ofao∼0.51 m/s2, and max-imum velocity of∼23 m/s. To solve the equations of fluidmotion, the centre of mass motion was incorporated as aboundary condition into a FNPF simulation of tsunami gen-eration (Grilli and Watts, 1999), in which the slump was rep-resented by a semi-ellipse. The simulation showed the con-tinual growth of tsunami amplitude during the first 44 s ofslump acceleration, which ceased as the waves propagatedoutwards. (Note: 44 s corresponds to the characteristic timeof slump motionto, found to be identical to the duration ofslump acceleration, as well as identical to the tsunami waveperiod (Grilli and Watts, 2005).) Tsunami generation wastherefore chosen to take place overto=44 s.
Because there were no validated 3-D models available topredict the evolution of the free surface in the transversedirection, the 2-D simulation result was transformed intoa 3-D tsunami source using mass conservation considera-tions along the third dimension. The transverse wave profilewas thus represented by a functionsech2 {3(y−y0)/(w+λ)},with the slump widthw=4 km, and the characteristic tsunamiwavelengthλ=4.4 km. The factor of 3 was chosen to yielda relative wave amplitude of 1% at the transverse distancey−y0=w+λ, wherey0 is at the centre of the slump location.By carrying out the conservation of mass calculation, thePNG slump dictates a 2-D to 3-D reduction ofw/(w+λ)≈0.5in the initial tsunami amplitude, due to transverse wave prop-agation during tsunami generation.
www.nat-hazards-earth-syst-sci.net/8/243/2008/ Nat. Hazards Earth Syst. Sci., 8, 243–266, 2008
254 D. R. Tappin et al.: The PNG tsunami of 1998 – a catastrophic event
The 3-D tsunami source predicted at 44 s provided the ba-sis for simulations of propagation and inundation performedwith TUNAMI-N2 (see Imamura and Goto, 1988). Themathematical expression of the sea surface shape at timetowas given by:
η(x, y)=sech2(3(y−y0)8.4 )
(−35.71 exp(−0.1013(x−29.07−x0))
2
+25.14 exp(−0.05169(x−31.71−x0))2
)which transferred the tsunami source from the generationmodel to the propagation model. Water velocities were ne-glected, because there was no numerical interface availableto link the two models at that time. The bathymetry was acompilation of theKairei swath data at depths greater than400 m, and data from the shoreline to 150 m interpolatedfrom the Aus. 389 chart. Intervening depths between 150–400 m were merged by linear interpolation. Onland topog-raphy around Sissano Lagoon was based on transects ac-quired by the field surveys (Kawata et al., 1999). Because ofthe poor resolution of the nearshore bathymetry, and the un-certainty of the effects of the interactions between shoalingwaves with the shallowest regions fronting Sissano Lagoon,a uniform grid spacing of 200 m was used for the bathymetry.The correlation between the measured runup and simulatedwave heights was, however, found to be quite good (Fig. 4band Tappin et al., 2001), although the highest waves occurredseveral kilometres offshore. Because of limitations of thewave propagation model TUNAMI-N2 this second simula-tion still only yielded offshore wave heights, instead of ac-tual onland runup. We return to this below. There were manyassumptions made in deriving the tsunami source based onFNPF simulations, and then transforming the source from 2-D to 3-D. (These techniques were validated later (see Wattset al., 2003, 2005a; Grilli and Watts, 2005; Enet and Grilli,2003, 2005, 2007).)
Heinrich et al. (2000) may have been the only other earlypublication on the tsunami source to apply methods compa-rable to those of Watts et al. (1999) and Tappin et al. (2001).Their landslide simulation was based on a translational SMFof cohesionless granular material, not a slump. Using theKairei bathymetry and a landslide volume of 4 km3, theyachieved a close correlation with the measured runup alongthe coast. Modelling of the alternative earthquake sources(shallow or steeply dipping thrusts) could not explain themeasured runup. Synolakis et al. (2002) applied a simi-lar methodology to that of Watts et al. (1999) and Tappinet al. (2001). They discounted the steeply dipping thrustmechanism on seismological grounds, and modelling of theshallow dipping thrust as a tsunami source yielded maxi-mum wave heights of 40 cm. The only significant differ-ence to the modelling of Tappin et al. (2001) is their useof the MOST model of tsunami propagation and inundation,which solves the same nonlinear shallow water wave equa-tions as TUNAMI-N2, but with the method of characteristics(Titov and Synolakis, 1998). Following Tappin et al. (2001),they concluded that the slump in the central region of the
Amphitheatre was the source of the local tsunami. As withother simulation models, using MOST gave offshore maxi-mum wave heights, because onland runup was minimal ornot present in the simulation. This fact motivated our newsimulations of the PNG event with a Boussinesq water wavemodel.
6.3.3 Recent modelling
The first of our Boussinesq simulations used our previousslump dimensions and was published in Watts et al. (2003)(Fig. 4c). A uniform 100×100 m bathymetry grid spacingwas used. The second of our Boussinesq simulations, pre-pared for this paper, is based on the new slump architecturedescribed above (Figs. 2 and 3). Compared with earlier mod-elling work, these simulations benefited from a validated andbetter understood 3-D tsunami source (Grilli et al., 2002),and the use of a finer 50×50 m grid spacing for wave propa-gation and inundation (Fig. 4d).
Much of the early work on slumps has since been validatedand verified. With regard to tsunami generation, the previ-ously assumed slump basal shear strength ofSu≈0.8 MPa,and Coulomb friction coefficient ofCn≈0.11, were consid-ered to be unrealistically high compared to available pub-lished values (e.g. Imran et al., 2001). These shear and fric-tion values are now validated for slumps (Watts and Grilli,2003; Watts et al., 2005a) even though the values are greaterby one to two orders of magnitude than those of most trans-lational landslides. The equation of SMF motion previouslyapplied (see Watts et al., 1999, 2002) was fully derived,experimentally validated, and the secondary effect of SMFdeformation on tsunami generation quantified (Grilli et al.,2005; Watts et al., 2005a; Enet and Grilli, 2007). The trans-formation of a 2-D to a 3-D tsunami source, using mass con-servation considerations along the third dimension, was fullysupported by 3-D numerical experiments, and validated bylarge-scale 3-D laboratory experiments (Watts et al. 2005a;Grilli et al., 2002; Enet et al., 2003, 2005, 2007). Theimproved 3-D tsunami source incorporates both transversepropagation and initial water velocities.
With regard to tsunami propagation and inundation, FUN-WAVE is a fully nonlinear and dispersive long wave “Boussi-nesq” model that features an accurate moving shoreline al-gorithm and energy dissipation terms (Wei and Kirby, 1995;Wei et al. 1995; Chen et al., 2000; Kennedy et al., 2000).The use of FUNWAVE for tsunami simulations has beenwell validated by case studies, based on a pyroclastic flow(Waythomas and Watts, 2003), underwater landslides (Wattset al., 2003; Day et al., 2005; Greene et al., 2005), earth-quake generated tsunamis (Day et al., 2005; Grilli et al.,2007; Ioualalen et al., 2006, 2007), and a debris flow (Walderet al., 2005). The inclusion of both nonlinear and disper-sive terms in Boussinesq models eliminates the excessiveshallow water steepening, and corresponding early offshorewave breaking and dissipation, that take place in NSW wave
Nat. Hazards Earth Syst. Sci., 8, 243–266, 2008 www.nat-hazards-earth-syst-sci.net/8/243/2008/
D. R. Tappin et al.: The PNG tsunami of 1998 – a catastrophic event 255
models (such as TSUNAMI-N2 or MOST) and hence allowsfor tsunami runup to occur onshore. The frequency disper-sion in the model is also necessary to account for the shorterwavelengths of SMF tsunamis, which have horizontal watervelocity profiles that vary with depth. The improvements inmodelling resulting from the use of FUNWAVE led, for thefirst time, to tsunami runup occurring onland in the simula-tions, rather than as offshore wave heights.
6.4 Uncertainty in simulated tsunami runup
Our new work raises fundamental questions about some ofthe many factors that affect the alongshore runup distributionpredicted in numerical simulations, their correlation with ob-servations on runup, and controls on the incidence of tsunamiwaves striking the coast. These factors include the tsunamisimulation itself, the reliability of the onshore measurements,and our understanding of wave interactions with other wavesand with the shoreline.
6.4.1 Grid refinement
Comparison of our latest simulated runup with measuredrunup still shows some differences that remain unexplained(Fig. 4d). To demonstrate the sensitivity in the positioning ofthe tsunami source in relation to the Amphitheatre morphol-ogy and location of the Upraised Block, we simulated severaldifferent tsunami source positions along the slump axis offailure on a 100×100 m uniform grid (Fig. 6). The slumpcentroid is located at longitude and latitude (142.2582 E,2.8791 S) and, based on experimental results (e.g. Enet andGrilli, 2007), the deepest trough of the tsunami source is usu-ally positioned above this location. We also ran simulationswith the deepest trough located at (142.2546 E, 2.8610 S),and (142.2509 E, 2.8429 S), respectively downslope at, 2 kmor one-quarter wavelength, and 4 km or a half wavelength.As the tsunami source moves towards the Upraised Block,more wave energy is directed to the west side of SissanoLagoon and the region of highest runup is extended fartherwest. The simulated runup could potentially converge onto aunique slump location that reproduces measured runup (seeHeinrich et al., 2000), but we do not carry that process anyfurther here.
We should note, however, that the runup measurementsthemselves may be suspect. Borrero (2001) questioned whatrunup actually represents, and discussed the inherent prob-lems in its measurement (e.g. differentiating between flowdepth, runup, and wave splash). On the one hand, observersof the PNG event indicate that many trees were bent overby the tsunami waves, which would thereby increase theheight of the apparent runup measured during post-tsunamisurveys, by the location of objects caught in trees, as well asby the stripping of foliage. It was reported that water forceswere strong enough to strip almost all branches offCasurinatrees along the coastline below a certain height (Kawata et
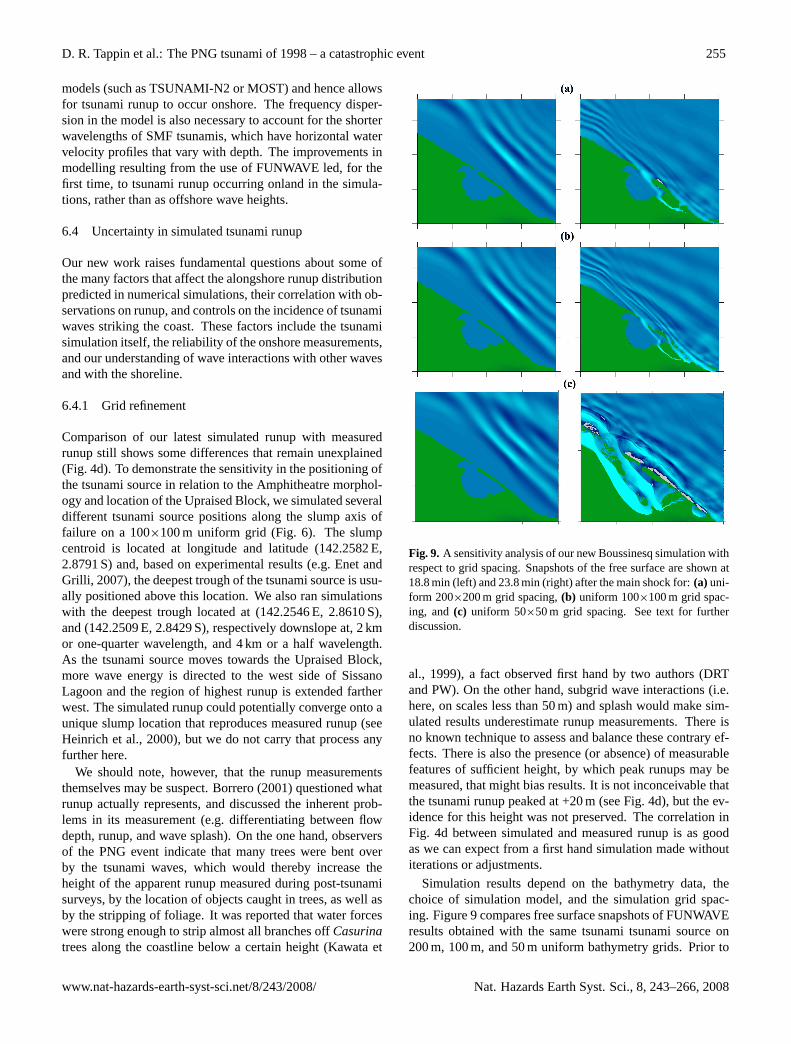
Fig. 9. A sensitivity analysis of our new Boussinesq simulation withrespect to grid spacing. Snapshots of the free surface are shown at18.8 min (left) and 23.8 min (right) after the main shock for:(a) uni-form 200×200 m grid spacing,(b) uniform 100×100 m grid spac-ing, and(c) uniform 50×50 m grid spacing. See text for furtherdiscussion.
al., 1999), a fact observed first hand by two authors (DRTand PW). On the other hand, subgrid wave interactions (i.e.here, on scales less than 50 m) and splash would make sim-ulated results underestimate runup measurements. There isno known technique to assess and balance these contrary ef-fects. There is also the presence (or absence) of measurablefeatures of sufficient height, by which peak runups may bemeasured, that might bias results. It is not inconceivable thatthe tsunami runup peaked at +20 m (see Fig. 4d), but the ev-idence for this height was not preserved. The correlation inFig. 4d between simulated and measured runup is as goodas we can expect from a first hand simulation made withoutiterations or adjustments.
Simulation results depend on the bathymetry data, thechoice of simulation model, and the simulation grid spac-ing. Figure 9 compares free surface snapshots of FUNWAVEresults obtained with the same tsunami tsunami source on200 m, 100 m, and 50 m uniform bathymetry grids. Prior to
www.nat-hazards-earth-syst-sci.net/8/243/2008/ Nat. Hazards Earth Syst. Sci., 8, 243–266, 2008
256 D. R. Tappin et al.: The PNG tsunami of 1998 – a catastrophic event
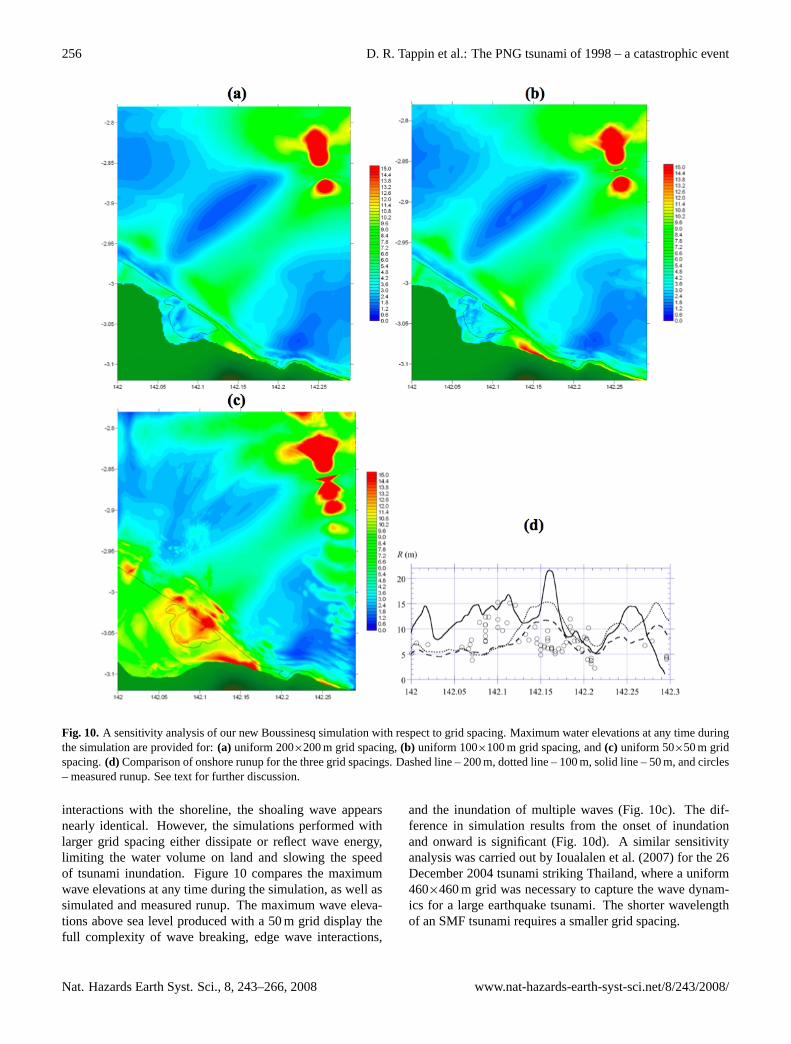
Fig. 10. A sensitivity analysis of our new Boussinesq simulation with respect to grid spacing. Maximum water elevations at any time duringthe simulation are provided for:(a) uniform 200×200 m grid spacing,(b) uniform 100×100 m grid spacing, and(c) uniform 50×50 m gridspacing.(d) Comparison of onshore runup for the three grid spacings. Dashed line – 200 m, dotted line – 100 m, solid line – 50 m, and circles– measured runup. See text for further discussion.
interactions with the shoreline, the shoaling wave appearsnearly identical. However, the simulations performed withlarger grid spacing either dissipate or reflect wave energy,limiting the water volume on land and slowing the speedof tsunami inundation. Figure 10 compares the maximumwave elevations at any time during the simulation, as well assimulated and measured runup. The maximum wave eleva-tions above sea level produced with a 50 m grid display thefull complexity of wave breaking, edge wave interactions,
and the inundation of multiple waves (Fig. 10c). The dif-ference in simulation results from the onset of inundationand onward is significant (Fig. 10d). A similar sensitivityanalysis was carried out by Ioualalen et al. (2007) for the 26December 2004 tsunami striking Thailand, where a uniform460×460 m grid was necessary to capture the wave dynam-ics for a large earthquake tsunami. The shorter wavelengthof an SMF tsunami requires a smaller grid spacing.
Nat. Hazards Earth Syst. Sci., 8, 243–266, 2008 www.nat-hazards-earth-syst-sci.net/8/243/2008/
D. R. Tappin et al.: The PNG tsunami of 1998 – a catastrophic event 257
6.4.2 Beach slope
With regard to the beach slope (in a 2-D vertical plane),NSW wave theory predicts that this is an important controlon tsunami wave runup (e.g. Kanoglu and Synolakis, 1998).Using Boussinesq modelling for the PNG event, we can actu-ally model onshore runup rather than offshore tsunami waveheights. Hence, we had an opportunity to investigate whetherthis prediction is borne out. A constraint on our modelling isundoubtedly the poor nearshore bathymetric control in waterdepths shallower than 400 m that may compromise any con-clusions we can draw on this subject. However, for PNG,we do know that runup involved short wavelength breakingwaves and bores. For example, most eyewitness accountsfrom the sand spit describe either a wave breaking on thebeach, or a vertical wall of water that was probably a bore.Our latest simulation shows that some waves broke severalkilometres offshore, again near the shoreline, and once moreon the landward side of the sand spit (Fig. 7). In this kindof dynamic wave environment, with rapid evolution of rel-atively short wavelength waves, we consider it unlikely thatrunup predictions based on NSW wave theory are relevantto tsunami runup during the PNG event. We therefore ques-tion the relevance of beach slope effects on the runup resultsand, in the instance of PNG, consider it not as important aspreviously predicted.
6.4.3 Edge waves
Numerical simulations of other tsunami events using FUN-WAVE (e.g. Day et al., 2005; Greene et al., 2005; Ioualalenet al., 2007) suggest that maximum inundation and maxi-mum runup may be caused at some locations by collisions(or interactions) of edge waves travelling in opposing direc-tions along the shoreline (Watts et al., 2003; Waythomas andWatts, 2003). Despite being present in our previous simu-lation results, edge wave interactions have received little at-tention in the context of tsunami hazards, specifically withregard to maximum runup. Whereas, during the PNG event,most of the sand spit experienced oblique wave attack, edgewaves appear to have played a role in causing maximumrunup around Aitape, the entrance to Sissano Lagoon, andthe mouth of the Arnold River. In all of these locations, sim-ulations show that edge waves travelling in opposite direc-tions interact with each other thereby producing peaked waveheights and maximum runup long after most other locationsalong the coast had ceased experiencing dangerous wave ac-tivity (see Figs. 4d, 7, and 9c). Clearly, the tsunami hazardfrom edge wave interactions is very local. However, the lo-cations of such interactions remain unpredictable without de-tailed modelling, and the interactions themselves are highlythree-dimensional. In the presence of interacting edge waves,there can be no simple 2-D estimates of maximum tsunamirunup, based on vertical planar transects. The runup hazardis intrinsically three-dimensional for all tsunamis.
6.4.4 The important choice of wave equations
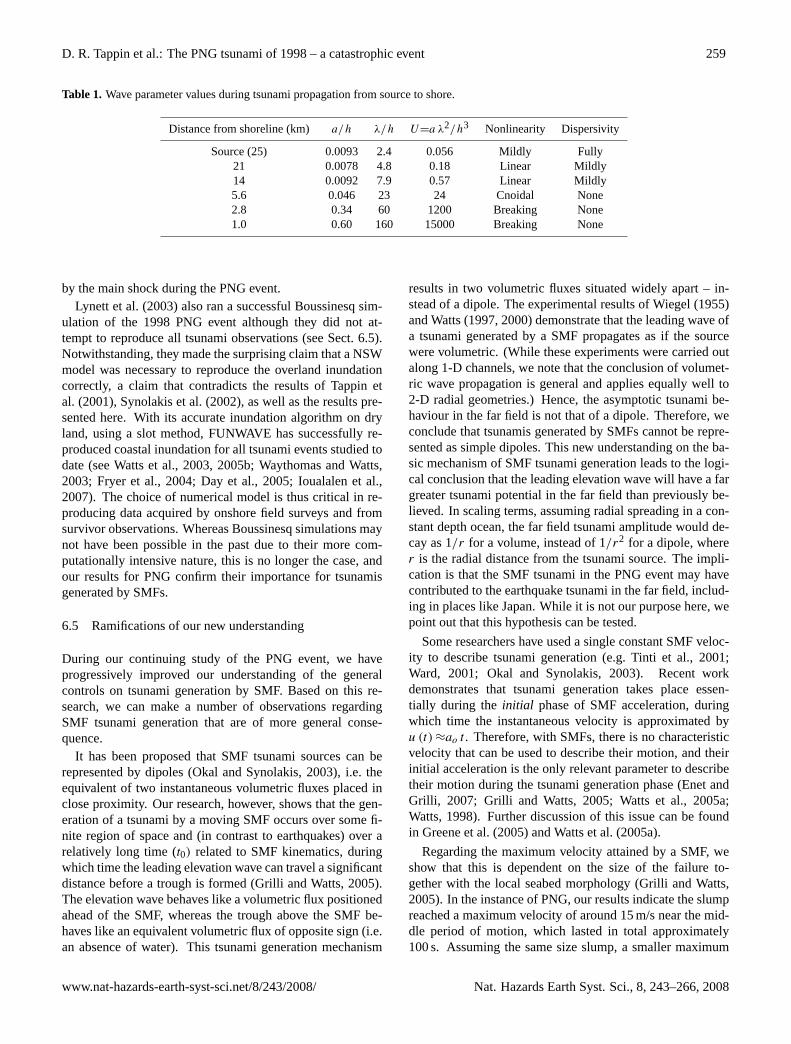
A method of assessing the relative importance of nonlinearand dispersive effects during water wave propagation is theUrsell number; the ratio of nonlinear to dispersive effects ofa water wave. Table 1 shows ratios of tsunami amplitudea
to depthh, and tsunami wavelengthλ to depthh, as well asthe Ursell numberU=a λ2/h3 for selected locations along astraight transect from the slump to the sand spit in front ofSissano Lagoon. Based on these values, especially the Ursellnumber, wave breaking could have been expected duringtsunami propagation on the shallow shelf in front of SissanoLagoon (Watts et al., 2003). The values in Table 1 suggestthat all modelling capabilities of FUNWAVE were required ifwe were committed to reproducing all of the tsunami obser-vations, from generation through propagation to inundation.While the numbers in Table 1 were derived from our simula-tion, they can be estimated from engineering approximationsprior to an event (Watts, 1998, 2000; Watts et al., 2005), andclearly guide the choice of an appropriate simulation model.Enet and Grilli (2007) used similar estimates to design 3-DSMF experiments.
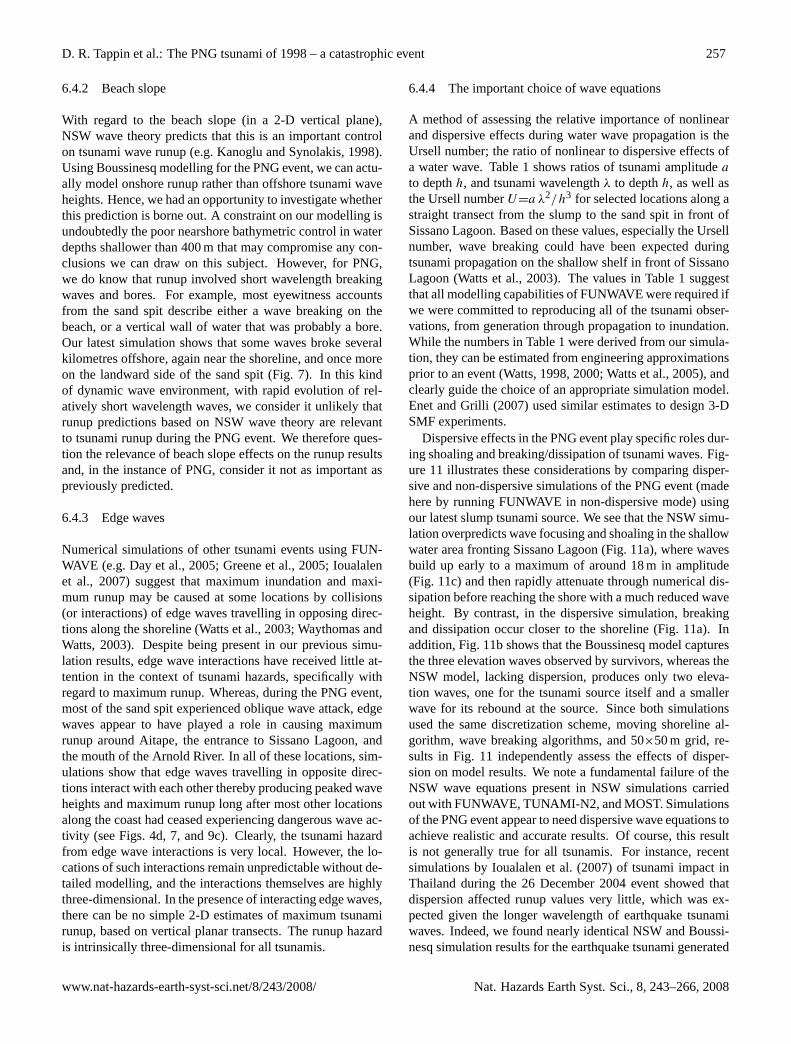
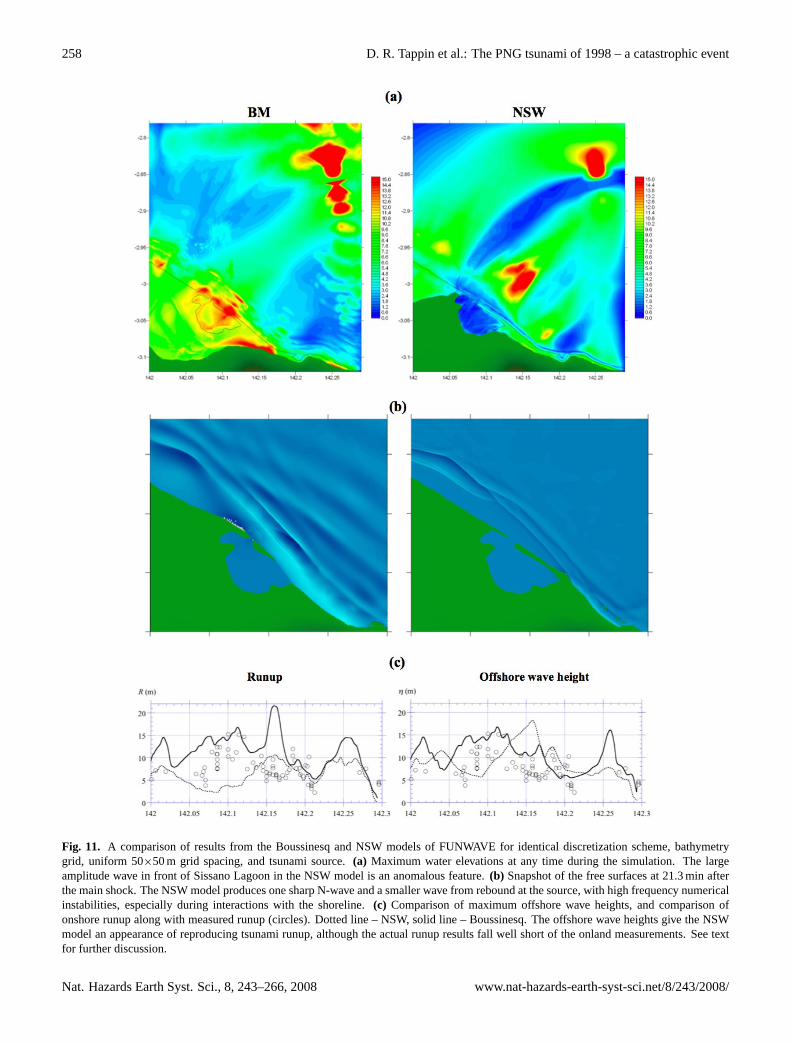
Dispersive effects in the PNG event play specific roles dur-ing shoaling and breaking/dissipation of tsunami waves. Fig-ure 11 illustrates these considerations by comparing disper-sive and non-dispersive simulations of the PNG event (madehere by running FUNWAVE in non-dispersive mode) usingour latest slump tsunami source. We see that the NSW simu-lation overpredicts wave focusing and shoaling in the shallowwater area fronting Sissano Lagoon (Fig. 11a), where wavesbuild up early to a maximum of around 18 m in amplitude(Fig. 11c) and then rapidly attenuate through numerical dis-sipation before reaching the shore with a much reduced waveheight. By contrast, in the dispersive simulation, breakingand dissipation occur closer to the shoreline (Fig. 11a). Inaddition, Fig. 11b shows that the Boussinesq model capturesthe three elevation waves observed by survivors, whereas theNSW model, lacking dispersion, produces only two eleva-tion waves, one for the tsunami source itself and a smallerwave for its rebound at the source. Since both simulationsused the same discretization scheme, moving shoreline al-gorithm, wave breaking algorithms, and 50×50 m grid, re-sults in Fig. 11 independently assess the effects of disper-sion on model results. We note a fundamental failure of theNSW wave equations present in NSW simulations carriedout with FUNWAVE, TUNAMI-N2, and MOST. Simulationsof the PNG event appear to need dispersive wave equations toachieve realistic and accurate results. Of course, this resultis not generally true for all tsunamis. For instance, recentsimulations by Ioualalen et al. (2007) of tsunami impact inThailand during the 26 December 2004 event showed thatdispersion affected runup values very little, which was ex-pected given the longer wavelength of earthquake tsunamiwaves. Indeed, we found nearly identical NSW and Boussi-nesq simulation results for the earthquake tsunami generated
www.nat-hazards-earth-syst-sci.net/8/243/2008/ Nat. Hazards Earth Syst. Sci., 8, 243–266, 2008
258 D. R. Tappin et al.: The PNG tsunami of 1998 – a catastrophic event
Fig. 11. A comparison of results from the Boussinesq and NSW models of FUNWAVE for identical discretization scheme, bathymetrygrid, uniform 50×50 m grid spacing, and tsunami source.(a) Maximum water elevations at any time during the simulation. The largeamplitude wave in front of Sissano Lagoon in the NSW model is an anomalous feature.(b) Snapshot of the free surfaces at 21.3 min afterthe main shock. The NSW model produces one sharp N-wave and a smaller wave from rebound at the source, with high frequency numericalinstabilities, especially during interactions with the shoreline.(c) Comparison of maximum offshore wave heights, and comparison ofonshore runup along with measured runup (circles). Dotted line – NSW, solid line – Boussinesq. The offshore wave heights give the NSWmodel an appearance of reproducing tsunami runup, although the actual runup results fall well short of the onland measurements. See textfor further discussion.
Nat. Hazards Earth Syst. Sci., 8, 243–266, 2008 www.nat-hazards-earth-syst-sci.net/8/243/2008/
D. R. Tappin et al.: The PNG tsunami of 1998 – a catastrophic event 259
Table 1. Wave parameter values during tsunami propagation from source to shore.
Distance from shoreline (km) a/h λ/h U=a λ2/h3 Nonlinearity Dispersivity
Source (25) 0.0093 2.4 0.056 Mildly Fully21 0.0078 4.8 0.18 Linear Mildly14 0.0092 7.9 0.57 Linear Mildly5.6 0.046 23 24 Cnoidal None2.8 0.34 60 1200 Breaking None1.0 0.60 160 15000 Breaking None
by the main shock during the PNG event.Lynett et al. (2003) also ran a successful Boussinesq sim-
ulation of the 1998 PNG event although they did not at-tempt to reproduce all tsunami observations (see Sect. 6.5).Notwithstanding, they made the surprising claim that a NSWmodel was necessary to reproduce the overland inundationcorrectly, a claim that contradicts the results of Tappin etal. (2001), Synolakis et al. (2002), as well as the results pre-sented here. With its accurate inundation algorithm on dryland, using a slot method, FUNWAVE has successfully re-produced coastal inundation for all tsunami events studied todate (see Watts et al., 2003, 2005b; Waythomas and Watts,2003; Fryer et al., 2004; Day et al., 2005; Ioualalen et al.,2007). The choice of numerical model is thus critical in re-producing data acquired by onshore field surveys and fromsurvivor observations. Whereas Boussinesq simulations maynot have been possible in the past due to their more com-putationally intensive nature, this is no longer the case, andour results for PNG confirm their importance for tsunamisgenerated by SMFs.
6.5 Ramifications of our new understanding
During our continuing study of the PNG event, we haveprogressively improved our understanding of the generalcontrols on tsunami generation by SMF. Based on this re-search, we can make a number of observations regardingSMF tsunami generation that are of more general conse-quence.
It has been proposed that SMF tsunami sources can berepresented by dipoles (Okal and Synolakis, 2003), i.e. theequivalent of two instantaneous volumetric fluxes placed inclose proximity. Our research, however, shows that the gen-eration of a tsunami by a moving SMF occurs over some fi-nite region of space and (in contrast to earthquakes) over arelatively long time (t0) related to SMF kinematics, duringwhich time the leading elevation wave can travel a significantdistance before a trough is formed (Grilli and Watts, 2005).The elevation wave behaves like a volumetric flux positionedahead of the SMF, whereas the trough above the SMF be-haves like an equivalent volumetric flux of opposite sign (i.e.an absence of water). This tsunami generation mechanism
results in two volumetric fluxes situated widely apart – in-stead of a dipole. The experimental results of Wiegel (1955)and Watts (1997, 2000) demonstrate that the leading wave ofa tsunami generated by a SMF propagates as if the sourcewere volumetric. (While these experiments were carried outalong 1-D channels, we note that the conclusion of volumet-ric wave propagation is general and applies equally well to2-D radial geometries.) Hence, the asymptotic tsunami be-haviour in the far field is not that of a dipole. Therefore, weconclude that tsunamis generated by SMFs cannot be repre-sented as simple dipoles. This new understanding on the ba-sic mechanism of SMF tsunami generation leads to the logi-cal conclusion that the leading elevation wave will have a fargreater tsunami potential in the far field than previously be-lieved. In scaling terms, assuming radial spreading in a con-stant depth ocean, the far field tsunami amplitude would de-cay as 1/r for a volume, instead of 1/r2 for a dipole, wherer is the radial distance from the tsunami source. The impli-cation is that the SMF tsunami in the PNG event may havecontributed to the earthquake tsunami in the far field, includ-ing in places like Japan. While it is not our purpose here, wepoint out that this hypothesis can be tested.
Some researchers have used a single constant SMF veloc-ity to describe tsunami generation (e.g. Tinti et al., 2001;Ward, 2001; Okal and Synolakis, 2003). Recent workdemonstrates that tsunami generation takes place essen-tially during the initial phase of SMF acceleration, duringwhich time the instantaneous velocity is approximated byu (t) ≈ao t . Therefore, with SMFs, there is no characteristicvelocity that can be used to describe their motion, and theirinitial acceleration is the only relevant parameter to describetheir motion during the tsunami generation phase (Enet andGrilli, 2007; Grilli and Watts, 2005; Watts et al., 2005a;Watts, 1998). Further discussion of this issue can be foundin Greene et al. (2005) and Watts et al. (2005a).
Regarding the maximum velocity attained by a SMF, weshow that this is dependent on the size of the failure to-gether with the local seabed morphology (Grilli and Watts,2005). In the instance of PNG, our results indicate the slumpreached a maximum velocity of around 15 m/s near the mid-dle period of motion, which lasted in total approximately100 s. Assuming the same size slump, a smaller maximum
www.nat-hazards-earth-syst-sci.net/8/243/2008/ Nat. Hazards Earth Syst. Sci., 8, 243–266, 2008
260 D. R. Tappin et al.: The PNG tsunami of 1998 – a catastrophic event
velocity would require less displacement down the slope,whereas a greater maximum velocity would require more dis-placement. The slump displacement therefore constrains theslump velocity. Maximum SMF velocity is highly sensitiveto the geology, downslope displacement, and the SMF size.Large translational slides on long continental slopes can havemuch higher centre of mass velocities (e.g. Fryer et al., 2004;Waythomas et al., 20081).
6.6 Earthquake versus SMF Tsunami Sources
Our work also has important ramifications for understand-ing the differences between tsunamis generated by SMFs andearthquakes, an understanding that has in large part been val-idated by work since 1998. Both earthquakes and SMFsinvolve vertical sea floor movement that affects the watercolumn and results in gravity driven displacements of thesea surface that spread out as waves from the source. Foran earthquake source, the initial tsunami wave field is de-termined primarily from the vertical coseismic displacementfield of the seafloor, which is a measure of earthquake mag-nitude (Hammack, 1973; Geist, 1998). For the rise time ofmost earthquakes, the long-wave phase velocity in the oceanis slow enough so that the displacement is usually consideredinstantaneous. (In this respect, the 9.3 magnitude earthquakeof 26 December 2004 in the Indian Ocean, which had anextremely large rupture/source area, was an exception; e.g.Grilli et al., 2007.) Because of the relatively large source areaof most earthquakes, the resulting vertical seafloor deforma-tion usually (but not always) generates a tsunami with longerwavelengths and longer periods compared to those generatedby SMFs (Hammack, 1973; Watts, 1998, 2000). The tsunamigenerated is thus mainly dependent on the earthquake mag-nitude, together with centroid mechanism and depth (Ham-mack, 1973; Geist, 1998b), except in instances where theearthquake is “slow” (Kanamori, 1972; Newman and Okal,1998b). Coseismic displacement generates tsunami ampli-tudes that rarely exceed 10 m at the source (which was thecase for the 26 December 2004 tsunami; e.g. Grilli et al.,2007).
In contrast to earthquakes, SMFs usually take place moreslowly and at slower dislocation velocities (Grilli and Watts,2005; Watts et al., 2005a). The longer source time reducesthe efficiency with which a tsunami is generated, and allowsthe source to spread in area during tsunami generation. How-ever, a relatively shallow depth SMF (i.e. submergence tolength ratio) can more than compensate for the longer sourcetime in terms of tsunami generation (Grilli and Watts, 2005).Given the potential for large SMF displacement and size,tsunami amplitude does not have atheoreticalupper boundother than the water depth itself. Despite spreading duringgeneration, the tsunami source area above a SMF is usu-ally much smaller than that of an earthquake source. Thereis also a strong directivity along the SMF axis of motion(Iwasaki, 1997; Fryer et al., 2004; Enet et al., 2003, 2005,
2007; Waythomas et al., 20081) that often results in focusedlocal runup (Imamura and Gica, 1996; Imamura et al., 1995),the magnitude of which is a function of tsunami source loca-tion, initial wave amplitude, and wavelength.
Another complication in the generation of tsunami bySMF is the variety of their failure mechanisms. As a simpli-fication for modelling purposes, two end members of SMFwere recognised (Grilli and Watts, 2005): (1) slumps, whichfail while largely maintaining their structural integrity; and(2) landslides, which are translational and often evolve mor-phologically during failure. The composition of the SMF de-termines its law of motion, from which the tsunami sourceis derived. The law of motion therefore controls tsunamigeneration and tsunami magnitude (Grilli and Watts, 2005).Landslides initiated in shallow water and travelling downthe continental slope can be tsunamigenic over consider-able distances. In contrast, slumps typically do not travelas far as landslides because of basal friction, thereby reduc-ing their potential in generating tsunamis. Thus, SMFs mayresult in tsunamis with amplitudes limited only by the verti-cal extent of their centre of mass displacement (Murty, 1979;Watts, 1998), which can potentially reach several kilometresin magnitude, as in large-scale volcano flank failure (e.g. Mc-Murtry et al., 2004). Hence, despite the smaller SMF sourcearea, both mass failure centre of mass motion and the sub-sequent tsunami amplitude at the source can surpass thoseof coseismic displacement by several orders of magnitude(Schwab et al., 1993; Watts, 1998).
6.7 The controversy
The roots of the controversy over the source of the PNGtsunami stem from the fact that in 1998 SMFs were mainlyconsidered in terms of translational events. The modellingof translational events either did not produce tsunamis withsignificant local runup, and/or with simulated runup thatmatched measured runups. Thus, for some scientists, a SMFmechanism was ruled out, and the earthquake was, almostby default, considered the only possible tsunami source. Itwas on the basis of such an argument that the steeply dip-ping thrust mechanism was identified by some authors (e.g.Kikuchi et al., 1999) as the preferable earthquake rupturemechanism and thus used to explain the tsunami. This choiceof rupture was made even though the earthquake mechanismwas more likely to be a shallow dipping thrust (McCue, 1998;Heinrich et al., 2000). Key to the slump tsunami source is therunup west of Sissano Lagoon that can only be explained bya source located within the Amphitheatre, as reported earlyon by Tappin et al. (1999).
Submarine slumps are rare, at least compared to otherSMFs. Thus, even when the marine data identified a slumpoffshore of Sissano (Tappin et al., 1999), this geologicalfact was ignored (e.g. Matsuyama et al., 1999; Geist, 2000;Iwasaki and Satake, 2001; Satake et al., 2003). Authors us-ing an earthquake source usually located the thrust at the
Nat. Hazards Earth Syst. Sci., 8, 243–266, 2008 www.nat-hazards-earth-syst-sci.net/8/243/2008/
D. R. Tappin et al.: The PNG tsunami of 1998 – a catastrophic event 261
40-km Fault (e.g. Matsuyama et al., 2000), although move-ment along this fault was clearly dip-slip to the north, withthe only active fault segment to the west of the Amphithe-atre. Other combinations of faulting, such as a steeply dip-ping fault and/or a splay fault off a blind thrust, are not sup-ported by the marine data (e.g. Satake et al., 2003; Imamuraand Hashi, 2003). These interpretations are not only in con-flict with the evidence from the marine data but, as alternativetsunami sources, they do not reproduce the arrival time of thetsunami from the earthquake. Alternative slumps (e.g. Satakeet al., 2003) located on the Upraised Block are too small tosource the measured tsunami and would not produce a LDNwave on the PNG coast. To fully utilise the marine data set(comprising bathymetry, seismic, images, and samples) oneneeds interpretations and integration in their entirety. Thebathymetry and sampling evidence from the Amphitheatreindicate a submarine slump of recent origin located near thecentre of the Amphitheatre. Each individual feature observedin isolation might well be attributed to another cause, such asan earthquake (e.g. Matsuyama et al., 1999; Satake et al.,2003). However, it is the use of all the marine data thatdemonstrates the slump as the most likely tsunami source.
With regard to the timing of tsunami impact on the shore,this is normally identified from tide gauge data. Without tidegauge data, the quantitative approach of seismologists couldnot be followed, and in this context the evidence from sur-vivors on the delay between main shock and tsunami strikewas discounted (e.g. Geist, 2000). There is no doubt thatcontradictory reporting of tsunami arrival times contributedto survivor’s evidence being ignored. There are good reasonswhy the reports varied. 1) The survivors would have beentraumatised, and their reporting confused. 2) Felt effects ofthe earthquake would have varied along the coast because ofchanges in composition of the substrate. On the sand spit,earthquake energy would have been absorbed and dissipated,and here we know of significant fluid expulsion and sedimentliquefaction (McSaveny et al., 2000). Farther east, at Maloland Aitape, the presence of hard limestone resulted in fargreater felt effects. 3) There is also evidence that at somelocations (such as Malol) the tsunami may have struck at thesame time as the aftershocks. 4) There are significant varia-tions in tsunami attack along the shoreline found from mod-elling results. However, not all of the reports were ‘relative’and timed according to the earthquake or the aftershocks. Inthe east, at Aitape, accurate reporting on the tsunami arrivaltime was based on watches, clocks, and radios that give anabsolute time (Davies, 1999). These showed the tsunami ar-riving there 5 min after the aftershocks and approximately25 min after the main shock. This evidence is as accurate asthe timing from most tide gauge records.
7 Conclusions
The PNG tsunami has resulted in the development of newand improved models of tsunami generation that more real-istically represent SMF tsunami sources. Additionally, it hasstimulated the development of propagation and runup mod-els that may be applied to all tsunami sources. Although con-troversial, the event has resulted in a global re-evaluation ofthe tsunami hazard from SMFs and of anomalous tsunamievents, where earthquake magnitude does not correlate withmeasured runup. Since 1999, the west coast of the USAhas received a great deal more focussed attention on SMFtsunami hazard (e.g. Eichhubl et al., 2002; Lee et al., 2003,2004; Bohannon and Gardner, 2004; Locat et al., 2004; Nor-mark et al., 2004; Greene et al., 2005). One of the largestmarine survey programmes ever carried out over a SMF hasbeen off Norway to investigate the potential hazard from afuture failure in the area of the Storegga Landslide, althoughthe motivation for the research was mainly to do with the safeextraction of gas from the underlying Ormen Lange Gasfield(e.g. Bondevik et al., 2005; Løvholt et al., 2005; Solheim etal., 2005). The Storegga Landslide, dated at 8200 years BP,resulted in a tsunami with significant runup along the NWEuropean coastline.
Although several recent tsunamis (e.g. Grand Banks,1929; Seward, 1964) were known to be sourced by SMFs,and these events indicated their potential hazard, the PNGtsunami was largely unexpected. It was a “wake-up” callwith regard to the tsunami hazard from SMFs triggered bymodest size earthquakes. The initial motivation for the re-search on the PNG tsunami was undoubtedly due to thescale of the catastrophe that resulted in the funding, at veryshort notice, of costly marine scientific investigations into thecause of the disaster.
The controversy over the source of the PNG tsunami,now accepted by most scientists as a submarine slump, wasmainly because SMFs were not considered a source of catas-trophic tsunamis before 1998. In addition, the modellingof SMF tsunami sources was almost exclusively confined totsunami generation by thin, translational landslides or sedi-ment flows. As a consequence, there were no validated mod-els for SMFs formed of thick, cohesive, rotational slumps.Early consideration of the cause of the tsunami tended todiscount qualitative evidence, such as that from survivors.All these factors contributed to the mistaken identificationby many scientists of an earthquake source for the tsunami.
The marine surveys carried out in 1999 were the first or-ganised specifically to identify the offshore cause of a recenttsunami. They have led to marine geologists becoming moreactively involved in tsunami research, thereby providing anew approach to researching tsunami hazards. The appli-cation of swath bathymetry (a recent technological develop-ment in marine science) together with other more traditionaltechnologies used in marine surveying, such as sub-bottomseismic, seabed photography, and sediment coring, provide
www.nat-hazards-earth-syst-sci.net/8/243/2008/ Nat. Hazards Earth Syst. Sci., 8, 243–266, 2008
262 D. R. Tappin et al.: The PNG tsunami of 1998 – a catastrophic event
data essential to the identification of SMFs. However, tomaximise their effectiveness, the marine data acquired haveto be fully integrated, thereby providing a powerful tool fortsunami hazard assessment. Marine data is a requisite forSMF modelling. It also informs on the background geologyand the dating of events. Although laboratory based stud-ies underpin our understanding of tsunami generation fromSMFs, field examples are essential in validating theoreticalanalyses and numerical models.
Since 1998, modelling of SMF tsunamis has advancedto the stage where integrated models, based on SMF ar-chitecture, can account for the complete tsunami processfrom tsunami source through wave generation and propaga-tion to tsunami runup and inundation, similar to co-seismictsunamis. The direct result of PNG is our increased aware-ness of how SMFs cause tsunamis in both the near and farfield. They are not dipoles (as earthquakes are), they cannotbe modelled using a constant velocity, their maximum veloc-ity scales with SMF size, and wave amplitude decay in the farfield is an order of magnitude less than previously supposed.A lot has been learned over the last decade.
It should be cautioned however, that current SMF tsunamisource models still require many simplifications and assump-tions, and that more work is needed to refine existing modelsof failure from all types of SMF (e.g. Greene et al., 2005;Waythomas et al., 2006). In 1998, there was little apprecia-tion of the importance of centre of mass motion on tsunamigeneration. For the same size and density SMF, tsunami am-plitudes and wavelengths can differ by up to a factor of fivedepending on the centre of mass motion (Grilli and Watts,2005). The most important measure of centre of mass mo-tion is the SMF initial acceleration.
At present, PNG remains the only tsunami clearly iden-tified as caused by a submarine slump. It is a bench-mark case. By contrast with translational landslides, SMFtsunamis caused by slumps are still a largely unknown haz-ard for coastal communities. Notwithstanding, the method-ologies developed to study the PNG event now provide thebasis for assessing other vulnerable areas.
Acknowledgements.This paper was funded in part by the USNational Science Foundation through grant CMS-0100223 made toS. Grilli. Funding was also provided by Applied Fluids Engineer-ing, Inc. and the British Geological Survey. We thank A. Simpson,the Director of the Pacific Applied Geosciences Commission(SOPAC) for his foresight in stimulating the JAMSTEC/SOPACsurveys, JAMSTEC for their organisation and provision of theships and personnel, and the Government of Japan for funding thesurveys. Our shipboard colleagues on the marine expeditions areacknowledged for their many conversations regarding the sourceof the PNG tsunami. Thanks go to D. Mosher and an anonymousreviewer for reading and commenting on the original manuscriptdraft that resulted in significant improvements. D. Tappin publisheswith the permission of the Executive Director, British GeologicalSurvey, (NERC) United Kingdom. Mention of trade names is foridentification purposes only and does not constitute endorsement.
Edited by: S. TintiReviewed by: D. Mosher and another anonymous referee
References
Abe, K.: Size of great earthquakes of 1837–1974 inferred fromtsunami data, J. Geophys. Res., 84, 1561–1568, 1979.
Ammon, C. J., Kanimori, H., Lay, T., and Velasc, A. A.: The 17 July2006 Java tsunami earthquake, Geophys. Res. Lett., 33, L24308,doi:10.1029/2006GL028005, 2006.
Bardet, J.-P., Synolakis, C. E., Davies, H. L., Imamura, F., andOkal, E. A.: Landslide tsunamis: Recent findings and re-search directions, Pure Appl. Geophys., 160(2003) 1793–1809,doi:10.1007/s00024-003-2406-0, 2003.
Bohannon, R. G. and Gardner, J. V.: Submarine landslides of SanPedro Escarpment, southwest of Long Beach, California, Mar.Geol., 203, 261–268, 2004.
Bondevik, S., Løvholt, A., Harbitz, C. B., Mangerud, J., Dawson,A., and Svendsen, J. I.: The Storegga Slide tsunami – comparingfield observations with numerical simulations, Mar. PetroleumGeology, 22, 195–208, 2005.
Borrero, J. C.: Changing field data gives better model results; anexample from Papua New Guinea, Proc. Int. Tsunami Symp.,397–405, 2001.
Chen, Q., Kirby, J. T., Dalrymple, R. A., Kennedy, A. B., andChawla, A.: Boussinesq study of wave transformation, break-ing, and runup. II: 2-D, J. Wtrwy, Port, Coast, and Oc. Engrg.,ASCE, 126, 1, 48–56, 2000.
Davies, H. L.: The Sissano tsunami 1998, University of Papua NewGuinea Press, Port Moresby, Papua New Guinea, 1998.
Davies, H. L., Davies, J. M., Perembo, R. C. B., and Lus, W. Y.:The Aitape 1998 tsunami: Reconstructing the event from inter-views and field mapping, edited by: Bardet, J.-P., Synolakis, C.,and Okal, E. A., Pure Appl. Geophys., 160(2003) 1895–1922,doi:10.1007/s00024-003-2413-1, 2003.
Day, S. J., Watts, P., Grilli, S. T., and Kirby, J. T.: Mechanical mod-els of the 1975 Kalapana, Hawaii earthquake and tsunami, Mar.Geol., 215, 59–92, 2005.
Edwards, B. D., Lee, H. J., and Field, M. E.: Mudflow generatedby retrogressive slope failure, Santa Barbara Basin, CaliforniaContinental Borderland, J. Sed. Res., A65, 57–68, 1995.
Eichhubl, P., Greene, H. G., and Maher, N.: Physiography of anactive transpressive margin basin; high-resolution bathymetry ofthe Santa Barbara Basin, southern California continental border-land, Mar. Geol., 184, 95–120, 2002.
Enet, F., Grilli, S. T., and Watts, P.: Laboratory experiments fortsunamis generated by underwater landslides: Comparison withnumerical modeling, Proc. 13th Int. Offshore and Polar Engi-neering Conference, ISOPE03, Honolulu, Hawaii, 3, 372–379,2003.
Enet, F. and Grilli, S. T.: Tsunami landslide generation: Modellingand experiments, in: Proc. 5th Intl. on Ocean Wave Measurementand Analysis (WAVES 2005, Madrid, Spain, July 2005), ASCEPublication, paper 88, 10 pp, 2005.
Enet, F. and Grilli, S. T.: Experimental study of tsunami generationby three-dimensional rigid underwater landslides, J. Wtrwy, Port,Coast, and Oc. Engrg., 133(6), 442–454, 2007.
Nat. Hazards Earth Syst. Sci., 8, 243–266, 2008 www.nat-hazards-earth-syst-sci.net/8/243/2008/
D. R. Tappin et al.: The PNG tsunami of 1998 – a catastrophic event 263
Fryer, G. J., Watts, P., and Pratson, L. F.: Source of the great tsunamiof 1 April 1946: a landslide in the upper Aleutian forearc, Mar.Geol., 203, 201–218, 2004.
Geist, E. L.: Source characteristics of the July 17, 1998 Papua NewGuinea Tsunami, (abs.), Eos Trans. Am. Geophys. Union, 79,Fall Meeting. Suppl. F571-2, 1998a.
Geist, E. L.: Local tsunamis and earthquake source parameters,Adv. Geophys., 39, 117–209, 1998b.
Geist, E. L.: Origin of the 17 July, 1998 Papua New Guineatsunami: Earthquake or landslide?, Seis. Res. Lett., 71, 344–351,2000.
Geist, E. L.: Reply to comment by E. A. Okal and C. E. Syno-lakis on “Origin of the 17 July 1998 Papua New Guinea tsunami:Earthquake or landslide?” by E. L. Geist, Seis. Res. Lett., 72(3),367–389, 2001.
Gelfenbaum, G. and Jaffe, B. E.: Erosion and sedimentation of thePapua New Guinea tsunami, edited by: Bardet, J.-P., Synolakis,C., and Okal, E. A., Pure Appl. Geophys., 160(2003), 1969–1999, doi:10.1007/s00024-003-2416-y, 2003.
Greene, H. G., Murai, L. Y., Watts, P., Maher, N. A., Fisher, M. A.,Paull, C. E., and Eichhubl, P.: Submarine landslides of the SantaBarbara Basin: Potential tsunami generators, Nat. Hazards EarthSyst. Sci., 6, 63–88, 2005,http://www.nat-hazards-earth-syst-sci.net/6/63/2005/.
Grilli, S. T., Ioualalen, M., Asavanant, J., Shi, F., Kirby, J.,and Watts, P.: Source constraints and model simulation of theDecember 26, 2004 Indian Ocean tsunami, J. Waterway PortCoastal and Ocean Engineering, 133(6), 414–428, 2007.
Grilli, S. T. and Watts, P.: Modelling of waves generated by a mov-ing submerged body: Applications to underwater landslides, En-grg. Analysis with Boundary Elements, 23(8), 645–656, 1999.
Grilli, S. T., Vogelmann, S., and Watts, P.: Development of a 3Dnumerical wave tank for modelling tsunami generation by un-derwater landslides, Engrg. Analysis with Boundary Elements,26(4), 301–313, 2002.
Grilli, S. T. and Watts, P.: Tsunami generation by submarine massfailure part I: Modeling, experimental validation, and sensitivityanalyses, J. Wtrwy, Port, Coast, and Oc. Engrg., ASCE, 131(6),283–297, 2005.
Gutenberg, B.: Tsunamis and earthquakes, B. Seismol. Soc. Am.,29, 517–526, 1939.
Hammack, J. L.: A note on tsunamis: Their generation and propa-gation in an ocean of uniform depth, J. Fluid Mech., 60, 769–799,1973.
Hampton, M.: The role of subaqueous debris flow in generatingturbidity currents, J. Sed. Petrol., 42, 775–993, 1972.
Hampton, M. A., Lee, H. J., and Locat, J.: Submarine landslides,Rev. Geophys., 34(1), 33–59, 1996.
Heezen, B. C. and Ewing, M.: Turbidity currents and submarineslumps, and the 1929 Grand Banks Earthquake, Am. J. Sci., 250,849–873, 1952.
Heezen, B. C., Ericsson, D. B., and Ewing, M.: Further evidence ofa turbidity current following the 1929 Grand Banks earthquake,Deep Sea Res., 1, 193–202, 1954.
Hebenstreit, G. T. (Ed.): Tsunami research at the end of a criticaldecade, Adv. Nat. Technol. Res., Kluwer Academic Publishers,282 pp, 2001.
Heinrich, P.: Nonlinear water waves generated by submarine andaerial landslides, J. Wtrwy, Port, Coast, and Oc. Engrg., ASCE,
118(3), 249–266, 1992.Heinrich, P., Piatanesi, A., Hebert, H., and Okal, E. A.: Near-field
modelling of the July 17, 1998 event in Papua New Guinea, Geo-phys. Res. Lett., 27, 3037–3040, 2000.
Hurakawa, N.: A fault plane of the 1998 Papua New Guinea earth-quake estimated from relocated aftershocks using data of theInternational Data Center of CTBT, Zisin, 52, 95–99, 1998 (inJapanese).
Imamura, F. and Goto, C.: Truncation error in numerical tsunamisimulation by the finite difference method, Coastal Engrg. Japan,31(2), 245–263, 1998.
Imamura, F., Gica, E., Takahashi, T., and Shuto, N.: Numericalsimulation of the 1992 Flores tsunami: Interpretation of tsunamiphenomena in northeastern Flores Island and damage at Babi Is-land, Pure Appl. Geophys., 144, 555–568, 1995.
Imamura, F. and Gica, E. C.: Numerical model for tsunami gen-eration due to subaqueous landslide along a coast, Sci. TsunamiHazards, 14, 13–28, 1996.
Imamura, F. and Hashi, K.: Re-examination of the tsunami sourceof the 1998 PNG earthquake tsunami, Eos, Trans. Am. Geophys.Union, (abstract), 81, 143, 2000.
Imamura, F., Hashi, K., and Imteaz, M. A.: Modelling for tsunamisgenerated by landsliding and debris flow, in: Tsunami researchat the end of a critical decade, edited by: Hebenstreit, G., KluwerAcademic Publishers, Dordrecht, 209–228, 2001.
Imamura, F. and Hashi, K.: Re-examination of the sourcemechanism of the 1998 Papua New Guinea earthquakeand tsunami, Pure Appl. Geophys., 160(2003), 2071–2086,doi:10.1007/s00024-003-2420-2, 2003.
Imran, J., Parker, G., Locat, J., and Lee, H.: 1D numerical modelof muddy subaqueous and subaerial debris flow, J. Hyd. Eng.,ASCE, 127(11), 959–968, 2001.
Ioualalen, M., Pelletier, B., Regnier, M., and Watts, P.: Numericalmodeling of the 26th November 1999 Vanuatu tsunami, J. Geo-phys. Res., 111, C06030, doi:10.1029/2005JC003249, 2006.
Ioualalen, M., Asavanant, J., Kaewbanjak, N., Grilli, S. T., Kirby,J. T., and Watts, P.: Modeling the 26th December 2004 IndianOcean tsunami: Case study of impact in Thailand, J. Geophys.Res., 112, C07024, doi:10.1029/2006JC003850, 2007.
Iwasaki, S.: The wave forms and directivity of a tsunami generatedby an earthquake and a landslide, Sci. Tsunami Hazards, 15, 23–40, 1997.
Iwasaki, S. and Satake, K.: Numerical study of the source of theJuly 1998 Papua New Guinea tsunami, in: Tsunami research atthe end of a critical decade, edited by: Hebenstreit, G., KluwerAcademic Publishers, Dordrecht, 2001.
Jaffe, B. E. and Gelfenbaum, G.: Using tsunami deposits to improveassessment of tsunami risk, Solutions to Coastal Disasters ’02Conference Proceedings, 836–847, 2000.
Jiang, L. and LeBlond, P. H.: The coupling of a submarine slideand the surface wave which it generates, J. Geophys. Res., 97,12 731–12 744, 1992.
Jiang, L. and LeBlond, P. H.: Three dimensional modelling oftsunami generation due to submarine mudslide, J. Phys. Ocean.,24, 559–573, 1994.
Johnson, J. M. and Satake, K.: Estimation of seismic moment andslip distribution of the April 1, 1946 Aleutian tsunami earth-quake, J. Geophys. Res., 102, 11 765–11 774, 1997.
Kanoglu, U. and Synolakis, C. E.: Long wave runup on piecewise
www.nat-hazards-earth-syst-sci.net/8/243/2008/ Nat. Hazards Earth Syst. Sci., 8, 243–266, 2008
264 D. R. Tappin et al.: The PNG tsunami of 1998 – a catastrophic event
linear topographies, J. Fluid Mech., 374, 1–28, 1998.Kanamori, H.: Mechanisms of tsunami earthquakes, Phys. Earth
Planet. Inter., 6, 346–359, 1972.Kawata, Y., Benson, B. C., Borrero, J. L., Davies, H. L., de Lange,
W. P., Imamura, F., Letz, H., Nott, J., and Synolakis, C. E.:Tsunami in Papua New Guinea was as intense as first thought,Eos, Trans. Amer. Geophys. Union, 80(9), 101, 104–105, 1999.
Keating, B. H. and McGuire, W. J.: Island edifice failures and as-sociated tsunami hazards, Pure Appl. Geophys., 157, 899–955,2000.
Kennedy, A. B., Chen, Q., Kirby, J. T., and Dalrymple, R. A.:Boussinesq modelling of wave transformation, breaking, andrunup. I: 1D, J. Wtrwy, Port, Coast, and Oc. Engrg., ASCE,126(1), 39–47, 2000.
Kikuchi, M., Yamanaka, Y., Abe, K., and Morita, Y.: Source ruptureprocess of the Papua New Guinea earthquake of July 17th, 1998inferred from teleseismic body waves, Earth Planets Space, 51,1319–1324, 1999.
LeBlond, P. H. and Jones, A.: Underwater landslides ineffective attsunami generation, Sci. Tsunami Hazards, 13, 25–26, 1995.
Lee, H. J., Kayen, R. E., Gardner, J. V., and Locat, J.: Characteris-tics of several tsunamigenic submarine landslides, in: SubmarineMass Movements and their Consequences, edited by: Locat, J.and Mienert, J., Kluwer, The Netherlands, 357–366, 2003.
Lee, H. J., Normark, W. R., Fisher, M. A., Greene, H. G., Edwards,B. D., and Locat, J.: Timing and extent of submarine landslidesin Southern California, Proceedings, Offshore Technology Con-ference, Houston TX, OTC Paper 16744, 2004.
Lee, H. J.: Undersea landslides: Extent and significance in the Pa-cific Ocean, an update, Nat. Hazards Earth Syst. Sci., 5, 877–892,2005,http://www.nat-hazards-earth-syst-sci.net/5/877/2005/.
Liu, P. L.-F., Yeh, H., Lin, P., Chang, K.-T., and Cho, Y.-S.: Gen-eration and evolution of edge-wave packets, Phys. Fluids, 10(7),1635–1657, 1998.
Locat, J., Lee, H. J., Locat, P., and Imran, J.: Numerical analysisof the mobility of the Palos Verdes debris avalanche, California,and its implication for the generation of tsunamis, Mar. Geol.,203, 269–280, 2004.
Lopez, A. M. and Okal, E. A.: A seismological reassessment of thesource of the 1946 Aleutian “tsunami” earthquake, Geophys. J.Intl., 165, 835–849, 2006.
Løvholt, F., Harbitz, C. B., and Haugen, K. B.: A parametricstudy of tsunamis generated by submarine slides in the OrmenLange/Storegga area off western Norway Marine and Petroleum,Geology, 22, 219–231, 2005.
Lynett, P. J., Borrero, J. C., Liu, P. L-F., and Synolakis, C. E.: Fieldsurvey and numerical simulations: A review of the 1998 PapuaNew Guinea tsunami, Pure Appl. Geophys., 160, 2119–2146,doi:10.1007/s00024-003-2422-0, 2003.
Matsumoto, T., Tappin, D. R., and SOS Shipboard Party: NT99-02Cruise Report – Papua New Guinea, JAMSTEC, 102 pp, 1999.
Matsumoto, T., Tappin, D. R., and SOS Shipboard Party.: Possiblecoseismic large-scale landslide off the northern coast of PapuaNew Guinea in July 1998: Geophysical and geological resultsfrom the SOS cruises, edited by: Bardet, J,-P,, Synolakis, C.mand Okal, E. A., Pure Appl. Geophys., 160(2003), 1923–1943,doi:10.1007/s00024-003-2414-0, 2003.
Matsuyama, M., Walsh, J. P., and Yeh, H.: The effect of
bathymetry on tsunami characteristics at Sissano Lagoon, PapuaNew Guinea, Geophys. Res. Lett., 26, 3513–3516, 1999.
McCue, K. F.: An AGSO perspective of PNG’s tsunamagenic earth-quake of 17 July 1998, AusGeo Int., 9, 1998.
McMurtry, G. M., Fryer, G. J., Tappin, D. R., Wilkinson, I. P.,Williams, M., Fietzke, J., Garbe-Schoenberg, D., and Watts, P.:Megatsunami deposits on Kohala Volcano, Hawaii from flankcollapse of Mauna Loa, Geology, 32(9), 741–744, 2004.
McSaveny, M. J., Goff, J. R., Darby, D. J., Goldsmith, P., Barnett,A., Elliot, S., and Nongkas, M.: The 17 July, 1998 tsunami,Papua New Guinea: Evidence and initial interpretation, Mar.Geol., 170, 81–92, 2000.
Milne, J.: Earthquakes and other earth movements, Paul, Trench,Trubner & Co., London, U.K., 1898.
Montessus de Ballore, F.: La science seismologique, Colin, Paris,France, 1907.
Murty, T. S.: Submarine slide-generated water waves in KitimatInlet, British Columbia, J. Geophys. Res., 84(C12), 7777–7779,1979.
Newman, A. V. and Okal, E. A.: Moderately slow character of theJuly 17, 1998 Sandaun earthquake as studied by teleseismic en-ergy estimates, (abs.), Eos Transactions, American GeophysicalUnion, 79, Fall Meeting, Supplement F564, 1998a.
Newman, A. V. and Okal, E. A.: Teleseismic estimates of radi-ated seismic energy: TheE/M0 discriminant for tsunami earth-quakes, J. Geophys. Res., 103, 26 885–26 898, 1998b.
Normark, W. R., McGann, M., and Sliter, R.: Age of Palos Verdessubmarine debris avalanche, southern California, Mar. Geol.,203, 247–260, 2004.
O’Grady, D. B., Syvitski, J. P. M., Pratson, L. F., and Sarg, J. F.:Categorizing the morphologic variability of siliciclastic passivecontinental margins, Geology, 28(3), 207–210, 2000.
Okal, E. A.: The probable source of the 1998 Papua New Guineatsunami as expressed in oceanic T waves, Eos, Trans. Amer. Geo-phys. Un., 80(46), F750, 1999.
Okal, E. A.: T waves from the 1998 Sandaun PNG sequence:Definitive timing of the slump, Eos, Trans. Am. Geophys. Union,(abstract), 81(48), 142, 2000.
Okal, E. A. and Synolakis, C. E.: Comment on “Origin of the17 July 1998 Papua New Guinea tsunami: Earthquake or land-slide?” by E. L. Geist, Seis. Res. Lett., 72(3), 363–366, 2001.
Okal, E. A. and Synokalis C. E.: A Theoretical Comparison ofTsunamis from Dislocations and Landslides, Pure Appl. Geo-phys., 160, 2177–2188, doi:10.1007/s00024-003-2425-x, 2003.
Piper, D. J. W. and McCAll, C.: A synthesis of the distribution ofsubmarine mass movements on the eastern Canadian Margin, in:Submarine mass movements and their consequences, edited by:Locat, J. and Mienert, J., Kluwer Academic Publishers, 291–298,2003.
Prior, D. B. and Coleman, J. M.: Submarine landslides: Geometryand nomenclature, Z. Geomorph. N. F., 23(4), 415–426, 1979.
Satake, K. and Tanioka, Y.: The July 1998 Papua New Guinea earth-quake and tsunami: A generation model consistent with variousobservations, Eos, Trans. Am. Geophys. Union, 80, 750, 1999.
Satake, K. and Tanioka, Y.: The July 1998 Papua New Guineaearthquake: mechanism and quantification of unusual tsunamigeneration, Pure Appl. Geophys., 160(2003), 2087–2118,doi:10.1007/s00024-003-2421-1, 2003.
Schwab, W. C., Lee, H. J., and Twichell, D. C.: Submarine land-
Nat. Hazards Earth Syst. Sci., 8, 243–266, 2008 www.nat-hazards-earth-syst-sci.net/8/243/2008/
D. R. Tappin et al.: The PNG tsunami of 1998 – a catastrophic event 265
slides: Selected studies in the U.S. exclusive economic zone,U.S. Geol. Surv. Bull. 2002, US, Dept. of Interior, Washington,D.C., 1993.
Simpson, D. W.: Triggered earthquakes, 14 Ann. Rev. Earth Plane-tary Sciences, 21, 1986.
Solheim, A., Bryn, P., Berg, K., and Mienert, J. (Eds): OrmenLange – an integrated study for the safe development of a deep-water gas field within the Storegga Slide Complex, NE Atlanticcontinental margin, Mar. Petrol. Geol., 22, 1–318, 2005.
Sweet, S., Silver, E., Davies, H., Matsumoto, T., Watts, P., and Syn-olakis, C. E.: Seismic reflection images of the source region ofthe Papua New Guinea tsunami of July 17, 1998, Eos, Trans. Am.Geophys. Union, Fall Meeting Suppl., Abstract S51C-02, 1999.
Sweet, S. and Silver, E. A.: Tectonics and slumping in the sourceregion of the 1998 Papua New Guinea tsunami from seismic re-flection images, Pure Appl. Geophys., 160(2003), 1945–1968,doi:10.1007/s00024-003-2415-z, 2003.
Synolakis, C. E., Bardet, J. P., Borrero, J. C., Davies, H. L., Okal,E. A., Silver, E. A., Sweet, S., and Tappin, D. R.: The slumporigin of the 1998 Papua New Guinea tsunami, Proc. Royal. Soc.,London, 458(2020), 763–790, 2002.
Takahashi, T. and Kawata, Y.: Energy concentration and recur-rence of the 1998 Papua New Guinea tsunami, Eos Transactions,American Geophysical Union, 79, Fall Meeting, Supplement,F572, 1998.
Tanioka, Y.: Analysis of the far-field tsunami generated by the 1998PNG earthquake, Geophys. Res. Lett., 22, 3393–3396, 1999.
Tappin, D. R., Matsumoto, T., Watts, P., Satake, K., McMurtry, G.M., Matsuyama, M., Lafoy, Y., Tsuji, Y., Kanamatsu, T., Lus,W., Iwabuchi, Y., Yeh, H., Matsumotu, Y., Nakamura, M., Ma-hoi, M., Hill, P., Crook, K., Anton, L., and Walsh, J. P.: Sed-iment slump likely caused 1998 Papua New Guinea Tsunami,EOS, Transactions of the American Geophysical Union, 80, p.329, 334, 340, 1999.
Tappin, D. R., Watts, P., McMurtry, G. M., Lafoy, Y., and Mat-sumoto, T.: The Sissano, Papua New Guinea tsunami of July1998 – Offshore evidence on the source mechanism, Mar. Geol.,175, 1–23, 2001.
Tappin, D. R., Watts, P., McMurtry, G. M., Lafoy, Y., and Mat-sumoto, T.: Prediction of slump generated tsunamis: The July17th 1998 Papua New Guinea event, Sci. Tsunami Hazards,20(4), 222–238, 2002.
Tappin, D. R., Watts, P., and Matsumoto, T.: Architecture and fail-ure mechanism of the offshore slump responsible for the 1998PNG tsunami, in: Submarine mass movements and their conse-quences, edited by: Locat, J. and Meinert, J., Kluwer AcademicPublishers, pp. 383–392, 2003.
Tappin, D. R. (Ed): Special Issue; submarine slump generatedtsunamis, Mar. Geol., 203(3–4), 199–380, 2004.
Terzaghi, K.: Varieties of submarine slope failures: 8th Tex. Conf.of Soil Mech. and Found. Eng., Proc., Special Publication 29,Bureau Eng. Research, Tex. University, p. 1–41, 1956.
Tinti, S., Bortolucci, E., and Chiavettieri, C.: Tsunami excitationby submarine slides in shallow-water approximation, Pure Appl.Geophys., 158, 759–797, 2001.
Titov, V. and Gonzalez, F.: Numerical study of the source of the July1998 PNG earthquake (abs.), Eos Transactions. Am. Geophys.Union, 79, Fall Meeting, Supplement, F564, 1998.
Titov, V. and Synolakis, C. E.: Numerical modelling of tidal wave
runup, J. Wtrwy., Port, Coast, and Oc. Engnrg., 124, 157–171,1998.
Turner, A. K. and Schuster, R. L.: Landslides: Investigation andmitigation. Special Report 247, Trans. Res. Board, NationalAcademy Press, Washington, D.C., 1996.
von Huene, R, Ranero, C. R., and Watts, P.: Tsunamigenic slopefailure along the Middle America Trench in two tectonic settings,Mar. Geol., 203, 303–317, 2004.
Ward, S. N.: Landslide tsunami, J. Geophys. Res., 106(6), 11 201–11 215, 2001.
Watts, P.: Water waves generated by underwater landslides, PhDthesis, California Inst. of Technol., Pasadena, CA., 1997.
Watts, P.: Wavemaker curves for tsunamis generated by underwaterlandslides, J. Wtrwy, Port, Coast, and Oc. Engrg., ASCE, 124(3),127–137, 1998.
Watts, P., Borrero, J. C., Tappin, D. R., Bardet, J.-P., Grilli, S. T.,and Synolakis, C. E.: Novel simulation technique employed onthe 1998 Papua New Guinea tsunami, in: Proceedings of 22ndGeneral Assembly IUGG, Birmingham, UK JSS42, Abstract,1999.
Watts, P.: Tsunami features of solid block underwater landslides,J. Wtrwy, Port, Coast, and Oc. Engrg., ASCE, 126(3), 144–152,2000.
Watts, P., Imamura, F., and Grilli, S. T.: Comparing model simula-tions of three benchmark tsunami generation cases, Sci. TsunamiHazards, 18(2), 107–124, 2000.
Watts, P.: Some opportunities of the landslide tsunami hypothesis,Sci. Tsunami Hazards, 19(3), 126–149, 2001.
Watts, P.: The need for underwater landslide hazards prediction,Sci. Tsunami Hazards, 20(2), 95–101, 2002.
Watts, P.: Probabilistic predictions of landslide tsunamis off South-ern California, Mar. Geol., 203, 281–301, 2004.
Watts, P. and Grilli, S. T.: Underwater landslide shape, motion, de-formation, and tsunami generation. Proceedings of the 13th Inter-national Offshore and Polar Engineering Conference, ISOPE03,Honolulu, Hawaii, 3, 364–371, 2003.
Watts, P., Grilli, S. T., Kirby, J. T., Fryer, G. J., and Tappin, D. R.:Landslide tsunami case studies using a Boussinesq model anda fully nonlinear tsunami generation model, Nat. Hazards EarthSyst. Sci., 3, 391–402, 2003,http://www.nat-hazards-earth-syst-sci.net/3/391/2003/.
Watts, P., Grilli, S. T., Tappin, D. R., and Fryer, G. J.: Tsunami gen-eration by submarine mass failure part II: Predictive equationsand case studies, J. Wtrwy, Port, Coast, and Oc. Engrg., ASCE,131(6), 298–310, 2005a.
Watts, P., Ioualalen, M., Grilli, S. T., Kirby, J. T., and Shi, F.:Numerical simulation of the December 26, 2004 Indian Oceantsunami using a higher-order Boussinesq model, Proc. 5th Intl.Symp. on Ocean Wave Measurement and Analysis (Waves 2005,Madrid, Spain, July 2005), IAHR Publication, paper 221, 10 pp,2005b.
Waythomas, C. F. and Watts, P.: Numerical Simulation of TsunamiGeneration by Pyroclastic Flow at Aniakchak Volcano, Alaska,Geophys. Res. Lett., 30(14), 1751–1755, 2003.
Waythomas, C. F., Watts, P., and Walder, J. S.: Numerical simula-tion of tsunami generation by cold volcanic mass flows at Augus-tine Volcano, Alaska, Nat. Hazards Earth Syst. Sci., 6, 671–685,2006,http://www.nat-hazards-earth-syst-sci.net/6/671/2006/.
www.nat-hazards-earth-syst-sci.net/8/243/2008/ Nat. Hazards Earth Syst. Sci., 8, 243–266, 2008
266 D. R. Tappin et al.: The PNG tsunami of 1998 – a catastrophic event
Wei, G. and Kirby, J. T.: Time-dependent numerical code for ex-tended Boussinesq equations, J. Wtrwy, Port, Coast, and Oc. En-grg., ASCE, 121(5), 251–261, 1995.
Wei, G., Kirby, J. T., Grilli, S. T., and Subramanya, R.: A fully non-linear Boussinesq model for free surface waves. Part 1: Highlynonlinear unsteady waves, J. Fluid Mech., 294, 71–92, 1995.
Wiegel, R. L.: Laboratory studies of gravity waves generated by themovement of a submarine body, Trans. Am. Geophys. Union,36(5), 759–774, 1955.
Nat. Hazards Earth Syst. Sci., 8, 243–266, 2008 www.nat-hazards-earth-syst-sci.net/8/243/2008/


![Gameboy Advance: iss-de - Deutsch...Gameboy Advance: iss-de German manual [Index] [1] DSCN0949.JPG DSCN0950.png DSCN0954.png DSCN0955.png DSCN0956.png DSCN0957.png DSCN0958.png DSCN0959.png](https://img.pdfslide.us/doc/110x75/5f266ceceb0d265fef10f12f/gameboy-advance-iss-de-deutsch-gameboy-advance-iss-de-german-manual-index.jpg)