Embed Size (px)
Citation preview

The Padre Miguel Ignimbrite Suite, central Honduras: Paleomagnetism,geochronology, and tectonic implications
Roberto S. Molina Garza, Douwe J.J. van Hinsbergen, Rob Rogers,Morgan Ganerød, Mark J. Dekkers
PII: S0040-1951(12)00490-8DOI: doi: 10.1016/j.tecto.2012.08.013Reference: TECTO 125573
To appear in: Tectonophysics
Received date: 2 February 2012Revised date: 3 July 2012Accepted date: 8 August 2012
Please cite this article as: Garza, Roberto S. Molina, van Hinsbergen, Douwe J.J., Rogers,Rob, Ganerød, Morgan, Dekkers, Mark J., The Padre Miguel Ignimbrite Suite, cen-tral Honduras: Paleomagnetism, geochronology, and tectonic implications, Tectonophysics(2012), doi: 10.1016/j.tecto.2012.08.013
This is a PDF file of an unedited manuscript that has been accepted for publication.As a service to our customers we are providing this early version of the manuscript.The manuscript will undergo copyediting, typesetting, and review of the resulting proofbefore it is published in its final form. Please note that during the production processerrors may be discovered which could a!ect the content, and all legal disclaimers thatapply to the journal pertain.

ACCE
PTED
MAN
USCR
IPT
ACCEPTED MANUSCRIPT
1
The Padre Miguel Ignimbrite Suite, central Honduras: Paleomagnetism, geochronology, and tectonic implications
Roberto S. Molina Garza1, Douwe J.J. van Hinsbergen2, Rob Rogers3, Morgan
Ganerød4, and Mark J. Dekkers5
1 Centro de Geociencias, Universidad Nacional Autónoma de México, Blvd.
Juriquilla 3001, Querétaro, Mexico
2 Physics of Geological Processes, University of Oslo, Sem Saelands vei 24,
0316 Oslo, Norway
3 Department of Geology, California State University, Stanislaus, 801 W.
Monte Vista Ave. Turlock CA, USA
4 Geological Survey of Norway NGU, Leiv Eirikssons Vei 39, 7491
Trondheim, Norway
5 Paleomagnetic Laboratory Fort Hoofddijk, Utrecht University, Budapestlaan
17, 3584 CD Utrecht, Netherlands
Revised for: Tectonophysics July 2102

ACCE
PTED
MAN
USCR
IPT
ACCEPTED MANUSCRIPT
2
Abstract The Padre Miguel Group in western Honduras is a silicic volcanic sequence of
that form part of the Central American Miocene volcanic arc built on the Chortis
continental fragment. We report new 40Ar/39Ar data of 16.1±0.2 Ma and 14.42±0.08
Ma for the Padre Miguel Group, and present paleomagnetic data for 36 cooling units
(mainly ignimbrites) from localities north and northeast of the capital city of
Tegucigalpa. These rocks are characterized by univectorial characteristic
magnetization carried mainly by low-Ti titanomagnetites, or two component
magnetizations with a minor secondary overprint. Dual polarity magnetizations
suggest that it is a primary thermo-remanence and the obtained data scatter can
straightforwardly explained by paleosecular variation. The overall mean of 33
selected sites (14.39N, 87.14W) defines a paleomagnetic pole at lat = 80.0ºN, lon =
142.9ºE (K = 24.5, A95 = 5.2º). The overall mean compared with the North America
expected direction indicates statistically insignificant rotation and inclination anomaly
(R=-4.1º±6.1º and an F=-8.6º±11.3º). Restoring 255 km of sinistral slip in the
Polochic-Motagua fault system, as suggested by Cayman Trough reconstructions
since 15 Ma, brings the mid-Miocene arcs of southern Mexico (Oaxaca) and the
Central America ignimbrite province into alignment; this is consistent with a
derivation of the Chortis Block from southern Mexico. Our paleomagnetic and
geochronological study hence support models that explain the offset of the Miocene
ignimbrite belt of Central America by post-Middle Miocene displacement of the
Chortis Block relative to North America.
Key words: Honduras, Paleomagnetism, Caribbean, strike-slip deformation, 40Ar/39Ar
geochronology
1. Introduction
It has been recognized for some time that regional inter-plate domains, such as
the Caribbean and the Mediterranean, are regions of the world where rigid-body plate
motions fail to describe much of the tectonic processes. In these settings,

ACCE
PTED
MAN
USCR
IPT
ACCEPTED MANUSCRIPT
3
paleomagnetism is a useful tool for determining intra-plate deformation and regional
block rotations. The Chortis Block, which includes southern Guatemala, Honduras, El
Salvador, northern Nicaragua, and the Nicaragua rise, is a large fragment of
continental crust in the western Caribbean plate (Figure 1; Dengo, 1969; Case and
Holcombe, 1980). A Pacific origin for the Caribbean plate is well documented
(Wadge and Burke, 1983; Pindell et al., 1988; Pindell and Kennan, 2009), but the
Chortis Block did not become part of the Caribbean plate until some time in the
Paleogene (Pindell et al., 1988; 2011).
It is generally accepted that oblique plate convergence and subduction of the
Kula-Farallon and Farallon-Pacific spreading centers resulted in complex plate
interactions in the western margin of North America in the Cenozoic (e.g.,
Engebretson et al., 1985; Mammerickx and Klitgord, 1982). In turn, changes in plate
boundary forces caused fragmentation of continental crust and truncation of the
southwest margin of North America. Various authors have thus proposed that
Farallon plate convergence, evolution of the Caribbean, and deformation in the
southwest Mexico margin are closely linked processes (e.g., Wadge and Burke, 1983;
Pindell and Barrett, 1990; Herrmann et al., 1994; Meschede and Frisch, 1998).
Several authors support the hypothesis that the Chortis Block was originally
part of the southern Mexico continental assemblage, and its present position in the
Caribbean plate resulted from the fragmentation and plate reorganization process in
the western margin of the continent described above (Malfait and Dinkelman, 1972;
Karig-Cordwell et al., 1978; Schaaf et al., 1995). The plate boundary of the Caribbean
and North American plates is formed by a left-lateral transform boundary that
contains the Cayman pull-apart basin and the Swan Island transform. This transform
boundary between the Chortis block and the Maya block of the North American plate
includes the Polochic-Motagua fault system, which is linked to the Swan Island fault
zone (Guzmán-Speziale and Meneses-Rocha, 2000; Rogers and Mann, 2007; Demets
et al., 2007; Figure 1, inset). An earlier westward continuation of the Polochic-
Motagua fault zone that accommodated motion of Chortis away from southern
Mexico probably became reactivated as subduction zone, now occupied by the
Middle America Trench (e.g. Wadge and Burke, 1983; Pindell and Barrett 1990;
Pindell et al., 2011). The transfer of the Chortis Block from the North American plate

ACCE
PTED
MAN
USCR
IPT
ACCEPTED MANUSCRIPT
4
to the Caribbean plate probably occurred in the Paleogene, and resulted in internal
deformation of the crustal blocks involved (Wadge and Burke, 1983; Pindell and
Barrett, 1990). Alternative models (e.g. Keppie and Morán-Zenteno, 2005) suggest
that the Chortis continental block is not genetically linked to southern Mexico, but
was in an ill-defined, intra-Pacific position instead until the Paleogene. Nevertheless,
Silva-Romo and Mendoza-Rosales (2009) discuss the evidence for alternative models,
concluding that detachment of Chortis from southern Mexico is the most viable.
Recently, Rogers et al. (2007) demonstrated that the Chortis block is composed of a
nuclear Central Chortis terrane with Precambrian-Paleozoic basement, an Eastern
Chortis terrane characterized by Jurassic metasedimentary rocks, and the Siuna
terrane composed of oceanic island arc rocks in the east. Rogers et al. (2007) also
recognize a Northern Chortis terrane, which is characterized by magmatic overprint of
the Eastern and Central Chortis terranes assemblages, and the Southern Chortis
terrane characterized by oceanic island arc rocks. This collage was apparently
assembled by Late Cretaceous time. Chortis shares with southern Mexico similar
Grenvillian and Paleozoic poly-metamorphic basement (Ratschbacher et al., 2009;
Manton, 1996), Jurassic-Cretaceous stratigraphy, and alignement of magnetic and
structural features (Rogers et al., 2007). Nonetheless, the reconstruction of Chortis to
its pre Cenozoic position is not straightforward, and several models have been
proposed (e.g., Rogers et al., 2007; Silva-Romo, 2008; Figure 2). Previous authors
have noted that refining the models requires additional paleomagnetic and isotopic
age data from Chortis. Ortega Gutiérrez et al. (2007) recognize fault-bounded
geologic entities in the region generally referred to as Chortis and its northern
boundary with the Maya Block. These authors recognize that the tectonic domain
between Chortis proper and the Maya Block is a series of crustal slices composed of
metamorphic basement assemblages located between the Polochic-Cuilco-Chixoy
fault system in the north, and the Jocotán-Chamalecón-La Ceiba faults in the south
(Figure 1).
In this paper we present new 40Ar/39Ar geochronological and paleomagnetic
data for the Miocene Padre Miguel Group of central Honduras, and discuss the
implications of these data for the Neogene evolution of the Chortis Block and its
relationship with southern Mexico.

ACCE
PTED
MAN
USCR
IPT
ACCEPTED MANUSCRIPT
5
2. Geological setting
The Padre Miguel Group is part of the Central America Ignimbrite Province,
which extends from Guatemala to Nicaragua east of and nearly parallel to the modern
Central America arc (Figure 1). This unit was first defined in southeastern Guatemala
(Williams et al., 1964; Burkart and Clemons, 1973), and blankets a large area of the
Central America highlands (Williams and McBirney, 1969). Jordan et al. (2007)
report two major magmatic pulses in this province, one of Eocene age and a larger
one of Middle Miocene age. The silicic ignimbrites show clear subduction
geochemistry, with ample evidence of continental crust influence. Rogers et al. (2002)
suggest voluminous ignimbrite emplacement is related to an episode of fast
convergence at the Middle America trench between 10 and 18 Ma. Heiken et al.
(1991) reported two K-Ar ages of ca. 14 Ma for biotite separates from two welded
ignimbrites near the base of this unit in northwestern Honduras. Elming et al. (2001)
report K-Ar and 40Ar/39Ar ages for Miocene volcanic rocks in Nicaragua, assigned to
El Coyol Group of ~18 Ma. Published and unpublished K-Ar ages for the Padre
Miguel Group (PMG) in Honduras and Nicaragua were compiled by Rogers (2003).
They range from 10.4 to 18.9 Ma, with a clear concentration of ages at about 14 and
18 Ma (Emmet, 1983; Ehrenborg, 1986).
The Padre Miguel Group covers an area of approximately 70,000 km2 in
Honduras, and is well exposed in the Honduras highlands between Tegucigalpa and
Talanga (Figure 3). The Padre Miguel Group in the field area consists mostly of
rhyolitic pyroclastic flow deposits and minor epiclastic rocks and lavas, covered by
younger basaltic and andesitic rocks. The sequence has an estimated maximum
thickness of ~2000 m (Williams and McBirney, 1969; Heiken et al., 1991). It overlies
Cretaceous clastic and carbonate strata or Paleozoic (?) metamorphic rocks with a
pronounced angular unconformity. The ignimbrite succession is affected by a system
of inactive nearly N-S trending faults, causing variable, but gentle tilt of the sequence
(Rogers and Mann, 2007). Extension has been explained as the result of distributed
strain caused by relative motion of the Caribbean plate with respect to Chortis, which
remained pinned to the Cocos and North America plates (Plafker, 1976); a model of
rotation of the trailing edge of the Caribbean plate (Chortis block) around the
Polochic-Motagua fault system has also been proposed (Burkart and Self, 1985). In

ACCE
PTED
MAN
USCR
IPT
ACCEPTED MANUSCRIPT
6
central Honduras, Rogers et al. (2002) recognize an active western horst and graben
province, a central tectonically stable province, and a mountainous heavily dissected
eastern province. This is supported by GPS (Rodriguez et al., 2009) and
geomorphologic observations (Rogers et al., 2002).
3. Sampling Samples for this study were collected from the Honduras highlands mostly
along the main road from Tegucigalpa to Catacamas, north and northeast of
Tegucigalpa (Figure 3), in what is considered the central tectonically stable region of
the Chortis block (Rogers et al., 2002). Sites 1 through 8 were sampled using a
portable water-cooled drill, and samples were oriented in-situ with an orientation
device. Hand samples were collected in the remaining 33 sites, oriented with a
Brunton compass. The study includes a total of 188 samples in 41 sites, in three main
areas around the small city of Talanga. Each site corresponds to a road cut, or a fresh
natural outcrop, in a single cooling unit over an area 10 to 20 m2. Care was taken in
the field to ensure each site is a different unit. Block-sample sites consist of 3 to 5
samples, drilled sites contain 6 to 8 samples. Where possible, sun compass
orientations were determined and geographic azimuths calculated; no systematic
differences in orientations were observed. Standard paleomagnetic specimens
(cylinders 2.5 cm in diameter and 2.1 cm tall) were prepared in the laboratory from
each sample. Sites 1-17 are integrated in a western area, sites 21-28 and 36-41 in a
central area, and sites 18-20 and 29-35 in an eastern area (Figure 3). Samples from
paleomagnetic sites TT17 and TT31 were used for 40Ar/39Ar geochronology.
4. 40Ar/39Ar geochronology 4.1 Analytical protocol
The samples were crushed and sieved to isolate grains of 180-250 µm. The mineral
separates were washed in acetone several times and rinsed with distilled water, and
finally fresh inclusion-free feldspar grains were handpicked under the binocular
microscope. The samples were packed in aluminum capsules together with the Taylor
Creek rhyolite (TC) flux monitor standard (between each 5th sample, every ~8mm)
and zero aged K2SO4 and CaF2, and the transformation 39K(n, p) 39Ar was performed

ACCE
PTED
MAN
USCR
IPT
ACCEPTED MANUSCRIPT
7
during irradiation at the IFE nuclear facility located in Kjeller, Norway. The
correction factors for the production of isotopes from Ca were determined to be
(39Ar/37Ar)Ca = (6.2523 ± 0.4856)*10-4, (36Ar/37Ar)Ca = (5.9112 ± 1.7343)*10-4 and
(40Ar/39Ar)K = (1.7005302 ± 0.3251701)*10-1 for the production of K. The samples
were step heated in the 40Ar/39Ar lab at the Geological Survey of Norway using a
double-vacuumed resistance furnace (Heine type). The extracted gases were gathered
(SAES GP-10 pumps) for the first 2 minutes, then for 9 minutes in a separate part of
the extraction line (SAES GP-10 pumps). The gas was analyzed with an MAP 215-50
mass spectrometer. The peaks were determined during peak hopping (at least 8
cycles) on the different masses (41-35Ar) on a Balzers electron multiplier. The blanks
were measured at temperatures 450, 700, 1000, 1130 and 1280C, the blanks and
associated errors for the respective temperature steps for the unknowns were
determined using linear interpolation. Subtraction for blanks, correction for mass
fractionation, 37Ar and 39Ar decay, and neutron-induced interference reactions
produced in the reactor were done using in-house software (AgeMonster 2010,
written by M. Ganerød). It implements the equations of McDougall and Harrison
(1999), and the total decay constant for 40K after Renne et al. (2010). We calculated J-
values relative to an age of 28.619 ± 0.034 Ma for the TC monitor (Renne et al.
2010). The mass fractionation was determined using an air pipette mounted within the
extraction line, and the mass discrimination value is based on the 40Ar/36Ar ratio from
Lee et al. (2006) using a power law function. We calculated weighted mean plateau
ages (WMPA), weighting on the inverse of the variance at locations where
consecutive steps were within the abs(agen – agen+1) < 1.96*((n)2+(n+1)2)0.5 error
envelope. Uncertainties from inlet intensities, blanks, mass discrimination value, salts,
trapped constants and every mass balance calculation are propagated into the final age
uncertainty.
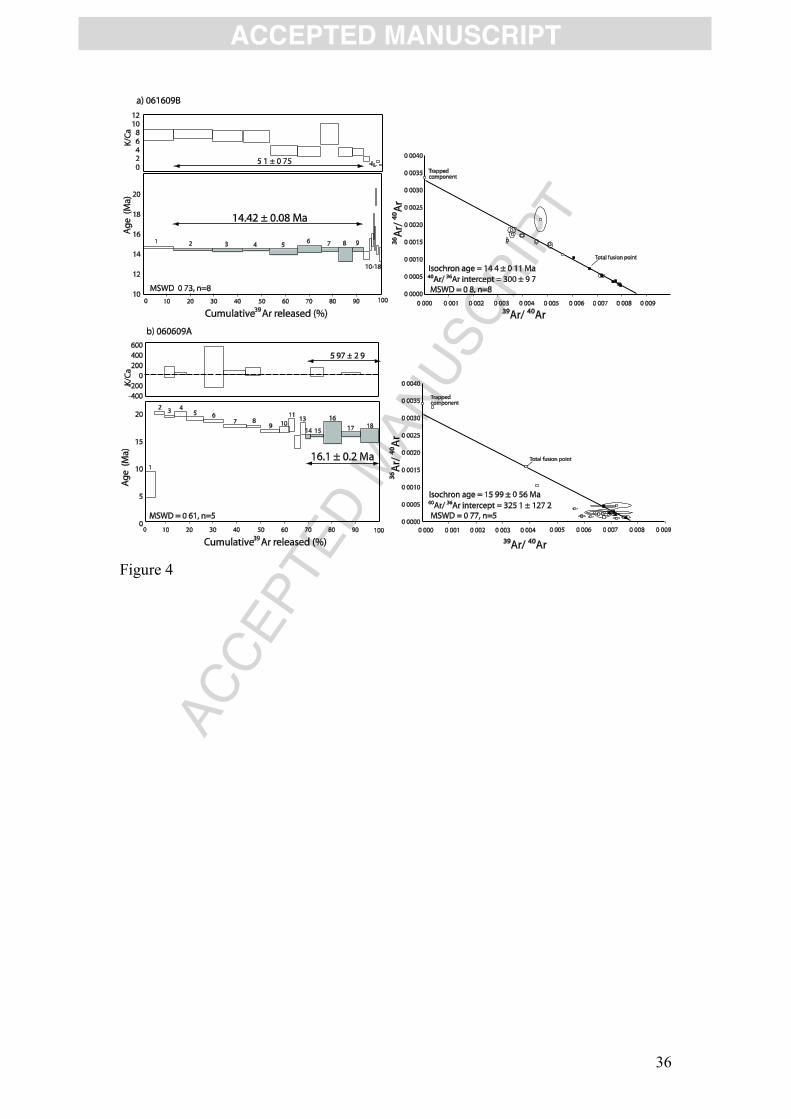
4.2. Results
K-feldspar separates from the two ignimbrites, samples 061609B and
061709B, were analyzed by the furnace step-heating method, and corresponds to
paleomagnetic sampling sites TT17 (crystal rich ignimbrite) and TT31, respectively.
The spectrum, K/Ca ratio (calculated from 39Ark/37ArCa) and inverse isochron results
are shown in figure 4a and b, and the main results are summarized in Table 1. The

ACCE
PTED
MAN
USCR
IPT
ACCEPTED MANUSCRIPT
8
raw experimental results can be found in a supplemental data file. All ages are
reported at the 1.96 confidence level.
Sample 061609B gives concordant apparent ages for most of the released
cumulative %39Ar and yields a weighed mean plateau age of 14.42 ± 0.08 Ma. The
inverse isochron result gives an intercept through the modern atmospheric value, and
the age is within error of the plateau age. Nonetheless, the confidence interval for this
result is entirely within an interval of normal polarity in the geomagnetic polairty time
scale (Cande and Kent, 1995), and the characteristic magnetization of the unit
samples is of reverse polarity. This suggest a more likely age of ~14.6 Ma, within
chron C5ADr. The release spectrum from sample 061709B shows a decline in
apparent ages in the first part of the experiment, a typical pattern for excess Ar,
however, overlapping apparent ages are found at higher temperature steps. From those
steps we calculated a weighted mean age of 16.1 ± 0.2 Ma, but consist only of 31.5%
of cumulative 39Ar and are not a strict plateau. The same steps yield an inverse
isochron age of 15.99 ± 0.56 Ma and the intercept overlaps with modern atmospheric
value. Due to a high radiogenic part of total 40Ar, the 36Ar/40Ar intercept is poorly
defined and has a large uncertainty, and therefore cannot exclude whether there might
be excess 40Ar in the aforementioned weighted mean age. However, the
correspondence between the isochron age and the weighted mean age seem to militate
against an excess component, and we interpret that the trapped air component in the
weighted mean age as successfully corrected for and we use that in the following
discussion.
5. Paleomagnetic analysis 5.1 Sampling and methods
To constrain the paleomagnetic interpretation, and to shed light on the
magnetic mineralogy, several rock magnetic experiments were carried out on selected
samples. These include measurement of hysteresis loops and back-field curves at
room temperature, determination of acquisition curves of the isothermal remanent
magnetization (IRM) also at room temperature, measurement of the temperature
dependence of the low-field susceptibility, and finally measurements of magnetization
ACCE
PTED
MAN
USCR
IPT
ACCEPTED MANUSCRIPT
9
versus temperature in a Curie balance. The temperature dependent measurements
were carried out in air. Samples from sites TT9, TT17, TT25, TT36 and TT41 were
selected for rock magnetic measurements.
The susceptibility versus temperature data was measured with a CS2-3 high-
temperature attachment to a KLY-3 susceptometer (AGICO, Brno, Czech Republic),
the sensitivity of the instrument is 4e-8 SI for a nominal volume of 10 cc, the heating
and cooling rates were set to ‘medium’, equivalent to ~8°C/minute. To check for
chemical alteration during annealing runs to 400°C and cooling back to room
temperature were followed by a run up to 700°C (and cooling back to room
temperature). Magnetization versus temperature measurements (thermomagnetic
analysis) were performed with a modified horizontal translation Curie balance that
employs a sinusoidally cycling field rather then a fixed field (Mullender et al., 1993).
This ensures a very good drift correction resulting in a high sensitivity of
(instrumental noise level ~5e-9 Am2). Again, to check for chemical alteration during
heating, the so-called segmented run protocol was adopted in which the sample is
stepwise heated to increasingly elevated temperatures with intermittent cooling to
100°C lower than the maximum temperature of each segment. Heating and cooling
rates are 10°C/minute; maximum temperatures (°C) of subsequent heating cycles are
(cooling temperature in °C indicated between brackets): 250 (150), 380 (280), 460
(360), 540 (440), 620 (500) and 700 (room temperature).
Hysteresis loops and back-field demagnetization curves were measured with a
Princeton MicroMag Model 2900 alternating gradient magnetometer. Instrumental
noise level is approximately 2e-9 Am2 and typical signals were at least two orders of
magnitude higher. The back-field demagnetization curve was measured up 100 mT
back field which is well beyond the remanent coercive force (Bcr) with an increment
of 2 mT. For the hysteresis loops, the applied maximum field was 2 Tesla and the
field increment 2 mT, correction for pole shoe saturation was applied for data higher
than 1.5 Tesla on the basis of a linear slope between 1 and 1.5 Tesla. After this
correction the hysteresis loops were corrected for the paramagnetic slope by forcing
the high-field slope to become horizontal using the data from 1.4 Tesla upwards.
From the slope-corrected loop the coercive force (Bc), the saturation magnetization
(Ms) and remanent saturation magnetization (Mrs) were determined. This enables
ACCE
PTED
MAN
USCR
IPT
ACCEPTED MANUSCRIPT
10
calaculation of the Mrs/Ms and Bcr/Bc ratios that are indicative of magnetic grain size
(Day et al., 1977). Further IRM acquisition curves were determined with the robotized
2G SQUID magnetometer system with in-line alternating field demagnetization
equipment, and equipment for the acquisition anhysteretic remanent magnetization
(ARM) and IRM, developed in the Utrecht paleomagnetic laboratory. The
instrumental noise level is ~3e-12 Am2 and IRM signals were at least 5 orders of
magnitude higher. The IRM acquisition curves were fitted with the sofware developed
by Kruiver et al. (2001) that allows fitting of cumulative log-Gaussian distributions to
the measured data. It was experimentally shown by Robertson and France (1994) that
IRM acquisition curves can reasonably well be approximated by cumulative log-
Gaussian distributions. Each coercivity distribution is characterized by three
parameters: the saturation IRM (SIRM or Mrs) indicating the amount of the
component, the remanent acquisition coercive force (B1/2) indicating the mid-point of
the coercivity distribution (or switching field distribution), which can be tied to the
mineral minerals involved, and the dispersion parameter (DP) indicating the width of
the coercivity distribution that provides information on the crystallinity of the
magnetic minerals involved. Deviations from the log-normal distributions are caused
by thermal activation processes in very small magnetic particles and/or by magnetic
interaction (Egli et al., 2004; Heslop et al., 2004). These deviations are minimized
when the alternating field demagnetized starting state is adopted (Heslop et al., 2004).
This was done here: prior to the IRM acquisition the samples were statically AF
demagnetized at 300 mT in three orthogonal directions with the last demagnetization
axis parallel to the IRM acquisition direction. IRM acquisition was done in 61 steps
up to 700 mT with the 2G long-core pulse magnetizer attached to the robotized
magnetometer system. Because the rhyolites are not strongly magnetic, magnetic
interaction is considered less important, and deviations from log-normality are
primarily interpreted in terms of small magnetic particles.
The natural remanent magnetization (NRM) of one group of samples was
measured with a 2G Enterprise cryogenic magnetometer at the Paleomagnetic
Laboratory Fort Hoofddijk (University of Utrecht). These samples were subjected to
stepwise alternating field (AF) demagnetization using the “on line” AF demagnetizing
coils of the 2G Enterprise system. For a second set of samples we used a JR5 spinner
magnetometer (AGICO, Brno, Czech Republic) for NRM measurements, and samples
ACCE
PTED
MAN
USCR
IPT
ACCEPTED MANUSCRIPT
11
were subjected to stepwise thermal demagnetization using a non-inductive ASC TD-
48-SC furnace. These measurements were conducted at the paleomagnetic laboratory
of the Centro de Geociencias (Universidad Nacional Autónoma de México).
Orthogonal demagnetization diagrams (Zijderveld, 1967) were visually
inspected to determine the vector composition of the remanent magnetization;
principal component analysis (Kirschvink, 1980) was used to determine the direction
of the characteristic magnetization (ChRM). Site means and the overall mean were
determined using Fisher statistics (Fisher, 1953), and also using the method proposed
by Deenen et al. (2011) who suggest instead the use of the distribution of virtual
geomagnetic poles (VGPs).
5.2 Rock magnetism: results and interpretation
After correction for the contribution of the empty furnace and sample tube, the
signal in the susceptibility versus temperature appeared to be very close to the limit of
detection of the instrument, resulting in noisy curves that are difficult to interpret
unambigously. During the cycling up to 400°C reversible behaviour is measured,
whilst thermal cycling up to 700°C indicates some chemical alteration (curves not
shown here). Thermomagnetic analyses yield well-interpretable results (typical
signal-to-noise ratio at least two orders of magnitude above noise level). In two
samples a ferromagnetic component of the signal could not be resolved reliably
(material from TT9 and 25). In samples TT17.2z, TT36.2z and TT41.1y a meaningful
ferromagnetic component is measured. These thermomagnetic curves are very similar
in behavior (Figure 5) and indicate no alteration up to 380°C (completely reversible
curves) while minute alteration to a less magnetic phase is measured after annealing
to 460°C. This alteration is more pronounced after heating to 540°C and 620°C. This
makes it impossible to detect a formal Curie temperature; the oxidation creates a
magnetization ‘tail’ to temperatures > 600°C indicative of partially oxidized
(maghemitized) magnetite. The notable decay in magnetization only at temperatures
over 500°C points to a titanium-poor or titanium-free magnetite perfectly compatible
with the rhyolitic rocks under study. After heating to 700°C the cooling branch

ACCE
PTED
MAN
USCR
IPT
ACCEPTED MANUSCRIPT
12
indicates a much lower magnetic ordering temperature than the heating segments
possibly related to a disordered crystal structure.
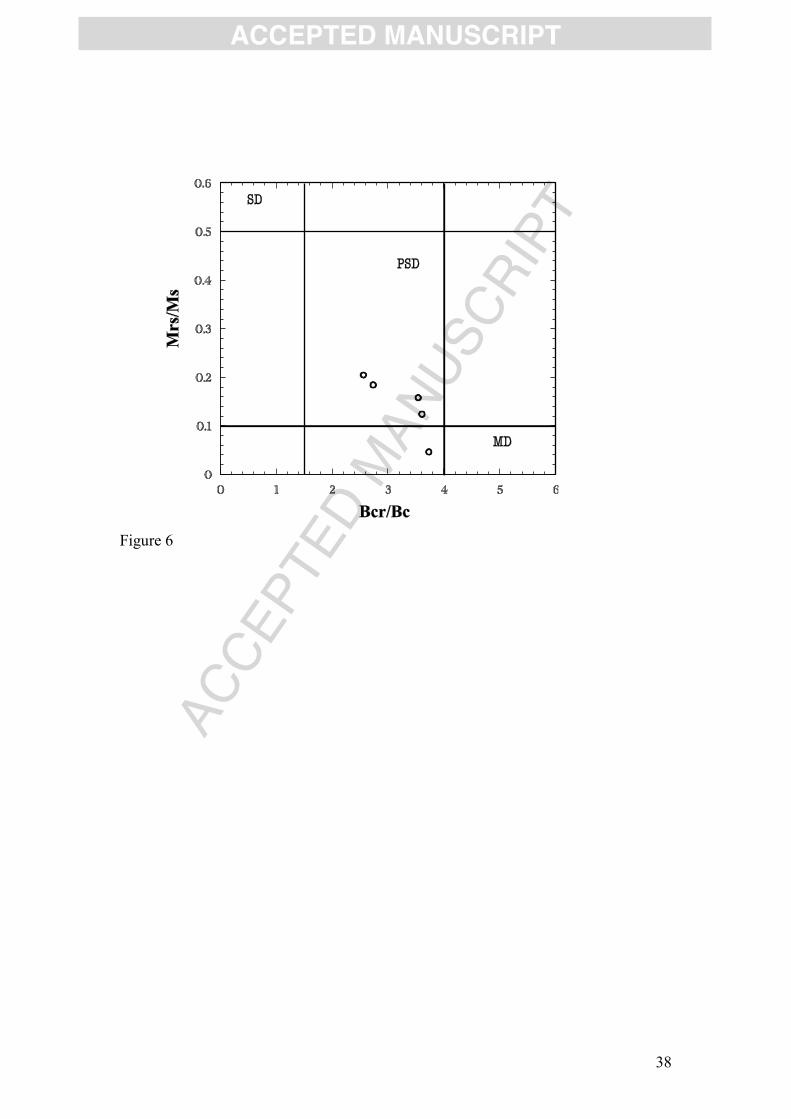
The shape of the hysteresis loops is regular with a large paramagnetic
contribution, no wasp-waisting is observed. Ms values range from ~0.8*10-3 to
~15*10-3 Am2/kg; visibly the slightly weathered material appears to have lowest
mineral magnetic content. Bc and Bcr values are in good agreement with those
expected for fine-grained ferrimagnetic oxides. Sites TT9 and TT25 seem to be
affected by incipient weathering, they have the highest coercivities. All samples plot
in the lower part of the pseudo-single-domain (PSD) region (Day et al., 1977)
pointing at paleomagnetically stable NRMs (Figure 6).
IRM acquisition curves are close to saturation with inductions of 300 mT
(Figure 7), but in some of the samples there is a contribution from a high coercivity
phase. IRM component fits (not shown) concurr with the hysteresis loop data; IRM
acquisition curves are dominated by a low-coercivity component, referred to as
component 1. Its contribution is at least 70% of the total IRM, but more typically is
85 to 90%. It has B1/2 values ranging between 65 and 85 mT indicating fine-grained
ferrimagnetic oxides (the incipiently weathered samples have lower B1/2 and slightly
larger DP than the others). DP values of ~0.26 (log units) point to a grain-size
distribution in line with crystallization from a magma (biogenic particles with a very
narrow size distribution have a distinctly lower DP of < 0.18). Component 2 that
occurs in amounts up to ~14%, has a lower coercivity than component 1 (B1/2 ~20
mT); it is considered an artifact of a skewed-to-the-left coercivity distribution due to
thermal activation (Egli, 2004; Heslop et al., 2004) that has to be fitted with an extra
IRM component in the software package utilized. So, component 2 has no physical
meaning, the amount can be added to that of component 1. Component 3, the high
coercivity component is rather variable in its properties, in part related to its low
proportional occurrence. It is as much as 26% of the IRM in the sample from site
TT25. B1/2 values of ~250 mT are typical. This could be small contribution of an
antiferromagnetic magnetic mineral. This component may be considered to be
associated with fluid movement through the rock that has resulted in a high-coercivity
partially maghemitized titanomagnetite, but also to deuteric oxidation. The two sites

ACCE
PTED
MAN
USCR
IPT
ACCEPTED MANUSCRIPT
13
showing incipient weathering have the highest proportional contribution of
component 3.
5.3 Demagnetization behavior
Samples from the Padre Miguel ignimbrites are characterized by NRM
intensities ranging from a 0.7 mA/m in the weakly magnetized samples to 2.4 A/m in
the strongly magnetized samples. Nearly all sites respond well to AF and thermal
demagnetization. In about 90% of the sites, the magnetization is univectorial with
well-defined linear trends to the origin (e.g., Figure 8a, b and c). Samples with this
behaviour exhibit relatively high median destructive fields of 40 to 55 mT, and
maximum coercivities of the NRM in excess of 100 mT (e.g., Figure 8c, 8f and 8m).
Thermal demagnetization of samples from the same sites show distributed unblocking
temperatures between 400 and 570ºC (Figures 8a, 8b and 8n). Maximum unblocking
temperatures at nearly all sites are 570ºC; higher values were observed in sites TT11,
TT25, TT27 and TT28. The magnetization unblocked between 400 and 570ºC (or 25-
100 mT) is considered the ChRM; it is north directed and has a moderately shallow
positive inclination, or its antipode. Maximum angular deviation values in the PCA of
the ChRM are typically less than 2º.
In a smaller percentage of sites there are low-stability secondary
magnetizations considered overprints of recent origin, viscous or isothermal
(lightning induced). Examples such as Figure 8d and 8e show that these secondary
magnetizations are easily removed with inductions of 10 to 20 mT or heating to
300ºC. But occasionaly, these magnetizations are of high intensity, preventing
complete isolation of the ChRM (e.g., Figure 8i and 8k; for sites TT11 and TT8,
respectively). In cases such as sites TT8 and TT5 the overprint is north directed and
appears to be of viscous origin. Demagnetization trajectories define great circles and
these converge to define a ChRM. In cases such as site TT23 (figure 8g) the overprint
is east directed and steep, more likely induced by lighting. The behavior observed in
site TT11 is relatively complex. Most samples show multivectorial magnetization
with low coercivity randomly oriented magnetization, an intermediate coercivity
northwest directed magnetization (Figure 8i), and a magnetization not resolved by AF
demagnetization - which appears to lie in the SE quadrant. Thermal demagnetization
experiments confirm that the magnetization not resolved by AF on site TT11 is south

ACCE
PTED
MAN
USCR
IPT
ACCEPTED MANUSCRIPT
14
directed and shallow, but the ChRM in this site is considered the intermediate
coercivity north directed magnetization; the high coercivity compenent is considered
an overprint, perhaps related to weathering.
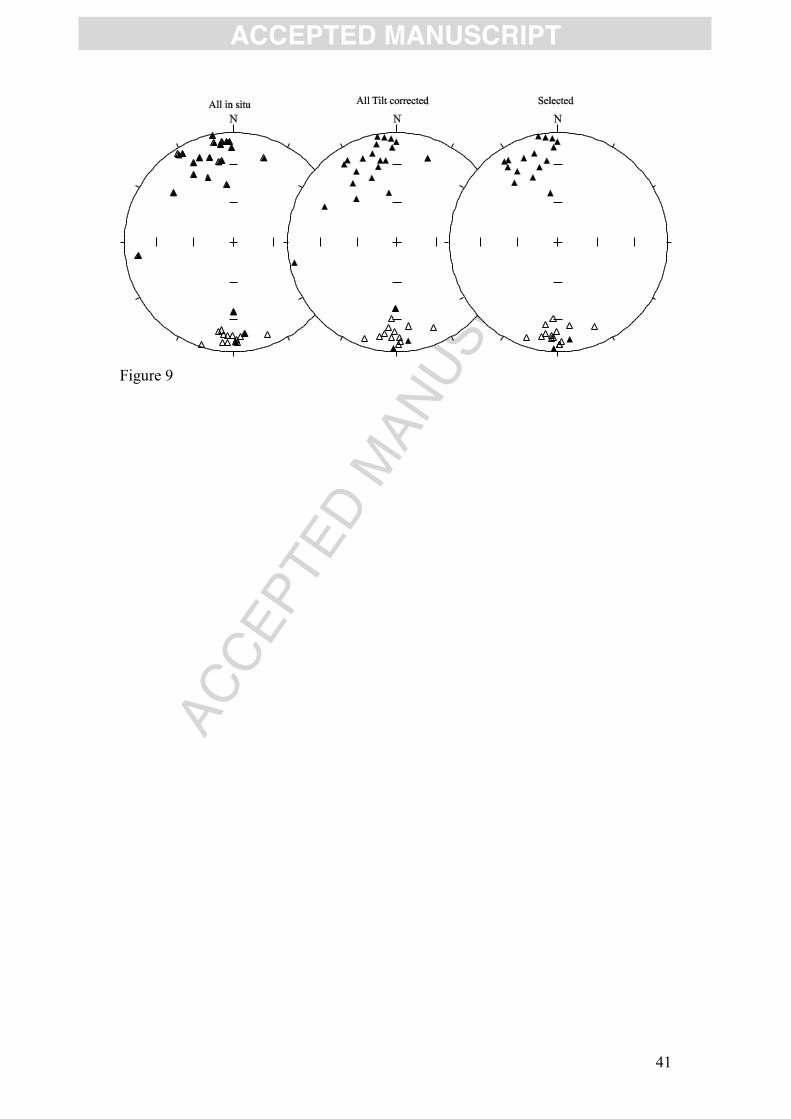
Sample directions are relatively well grouped at the site level. Whilst at all 41
sites we obtained a mean direction, after final comparison of the site means, visual
inspection of hand samples, and their demagnetization behavior it was determined
that the pair of sites TT12-TT13 represent statistically indistinguishable results and
probably represent the same cooling unit; these site pairs were combined (Figure 9;
Table 1). This yields a total of 40 spot readings of the Middle Miocene geomagnetic
field. The site means of 4 sites are represented by only one or two samples, the rest
were lost during transport, and three more yield poor statistics (k<30 and 95>20º)
and were excluded from the final calculations. This leaves a total of 33 sites, 16 of
normal polarity and 17 of reverse polarity. Although no attempt was made to build a
magnetic polarity zonation, sites 1 through 17 appears to define a continuous
stratigraphic section that includes two magnetozones of normal polarity and two of
reverse polarity.
The distribution of virtual geomagnetic poles (VGP’s) fits well a Fisher
distribution providing an overall mean direction (tilt corrected) of D±Dx =352.5 ±
5.2º and I±Ix =15.0 ± 9.8º (n=33, Kvgp=24.5, and 95(vgp)=5.2º Table 1, see Deenen et
al., 2011 for an explanation of this nomenclature). If we compare this result to the n-
dependent reliability envelope of Deenen et al. (2011), we conclude that scatter of our
data can be straightforwardly explained by paleosecular variation (PSV): 95, observed =
5.2º, which falls between the A95min (4.2) and A95max (9.1) values for n=33. In other
words, there is no statistical need to infer sources of scatter besides PSV (such as
internal rotations) to explain our dataset. We note, however, that comparing the
normal and reversed directions yields a negative reversal test. Shallower inclinations
in the reverse polarity magnetization suggest that incomplete removal of a normal
polarity overprint could explain a negative test, but the bulk of the difference is in
declination and this is further discussed below. If a similar overprint acts on the
normal and reverse polarity sets, its effect is likely canceled. The elongation observed
in the distribution of sample directions (E=1.584) is lower than expected for this

ACCE
PTED
MAN
USCR
IPT
ACCEPTED MANUSCRIPT
15
latitude (~14º) according to paleosecular variation (PSV) models that consider a
systematic variation of dispersion with latitude (e.g., Tauxe and Kent, 2004).
Elongation-Inclination analysis suggest that the f factor that adequates the distribution
to the expected field model is 0.55+-.17/-0.14. However, this analysis is typically applied
to sedimentary rocks, not to igneous rocks and requires much larger (n>100) datasets
than we obtained. The angular standard deviation of the VGP distribution (~16.5º)
suggest that sampling of PSV is sufficient (for the paleolatitude of the sampling area).
Nonetheless, a lower value for reverse polarity magnetizations (13º), as well as an A95
value (5.3) slightly below A95min (5.5 at n=17) in turn suggests that the reversed
population does not sufficiently average PSV (Deenen et al., 2011).
Comparing of the mean directions for the three geographic areas may suggest
internal vertical axis rotations within our study area, but the data sets for individual
areas are not sufficiently robust. The western and central areas, with 13 and 11 sites
respectively, yield statistically north-directed indistinguishable means. The eastern
area with only five sites yields a distinct northwest-directed mean, but this may reflect
insufficient average of PSV at this level. We therefore explain the negative reversal
test by insufficient averaging of paleosecular variation in the normal and reversed
data sets alone and because the combined data set yields statistical values that are
perfectly in line with PSV, we consider our combined pole reliable, at lat = 80.0ºN,
lon = 142.9ºE, K = 24.5, A95 = 5.2º.
6. Discussion To determine relative motion between the studied area in the Chortis Block
and the North American plate, we compared the Miocene grand mean direction we
obtained from the Padre Miguel Group with the expected direction at 15 Ma
(interpolated between 10 and 20 Ma using the global apparent polar wander path of
Torsvik et al (2008)) for the North American plate at a central reference location in
the study area (14.39N, 87.14W). The integrated mean pole for North America at 15
Ma is 85.92ºN/146.8ºE, A95=3.16º, yielding an expected North American direction for
the reference site of D±Dx = 356.6±3.2, I±Ix =23.1±5.6. We calculated rotation
(R) and flattening (F) estimates, obtaining R±R=4.1º±6.1º and an F±F =-
ACCE
PTED
MAN
USCR
IPT
ACCEPTED MANUSCRIPT
16
8.1º±11.3º. These indicate insignificant rotations and paleolatitudinal motions since
middle Miocene time. This shows that the nearly west to east motion of Chortis
relative to North America along the Polochic-Motagua-Cayman fault zone did not
lead to significant vertical axis rotations of the central Honduras highlands (and by
extrapolation the stable portion of the Chortis Block) since Middle Miocene time.
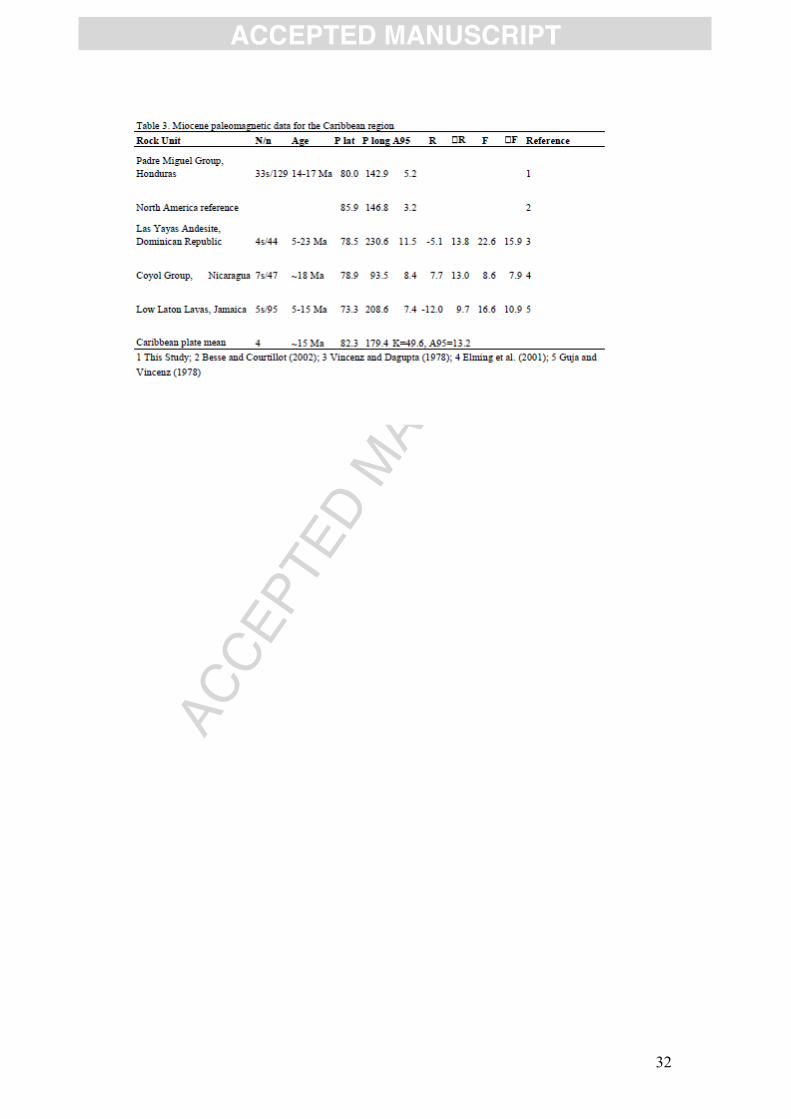
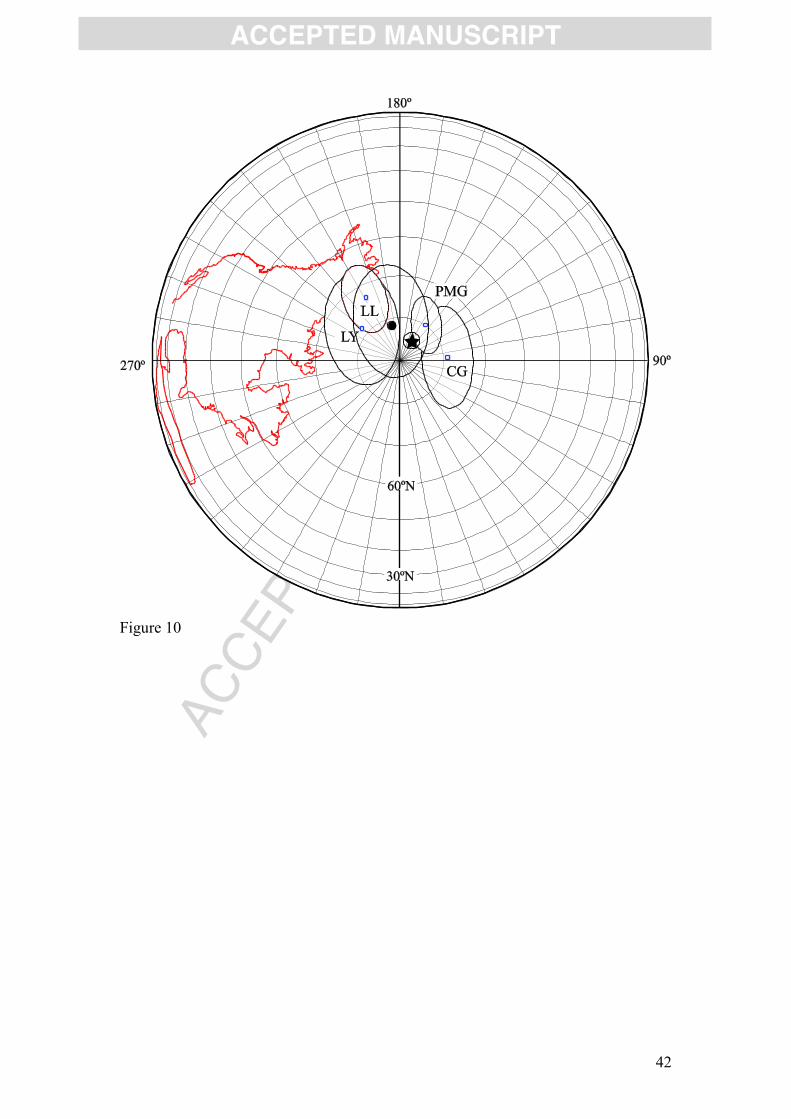
The Caribbean plate lacks high quality paleomagnetic data for the Neogene.
Available studies commonly include a small number of sites in uncertain tectonic
setting (Elming et al., 2001; Vincenz and Dagupta, 1978; Guja and Vincenz, 1978:
Table 3 and Figure 10). A critical view of the data sets from Jamaica, Dominican
Republic, and the Nicaragua highlands, suggests that these data pass minimum
reliability criteria (Q=3; Van der Voo, 1990). But the data from Jamaica and
Dominican Republic (LL and LY) include only reverse polarity magnetizations, and
all three locations studied lack good structural control, particularly sites in the
Nicaragua Higlands. The poles LL and LY are near-sided, whilst the Nicaragua pole
is far-sided. The average of these three poles (82.1ºN-194.3ºE) is indistinguishable
from the Padre Miguel grand mean (80.0º-142.9ºE), but carries a large A95 of ~20º.
Our first approach to the Caribbean paleomagnetic data set for the mid-
Miocene was to estimate rotation and flattening paramaters for the Jamaica,
Dominican Republic, and Nicaragua highlands with respect to central Chortis (Table
3). The results do not provide consistent information. Large latitudinal displacements
are suggested by F values, both northward and southward. Such displacements are not
warranted by plate tectonic models (e.g. Pindell and Kennan, 2009). Most likely,
paleosecular variation may not be sufficiently averaged in those studies. Our
conclusion is that additional paleomagnetic data form the Antilles islands is required
to evaluate intra-plate deformation, or determine if deformation in the islands
involves significant rotations about vertical axes.
As a second approximation, we combined all four poles, so we can define a
Middle Miocene pole (~15 Ma) for the Caribbean plate; the pole is located at 82.3ºN-
179.4ºE (K=49.6 and A95=13.2º). The pole predicts, for instance, a paleolatitude of
11.1º±6.6º for ODP Site 999 (12.74ºN/281.26ºE), which has been studied
paleomagnetically by Acton et al. (2000). This paleolatitude suggests that the net rate

ACCE
PTED
MAN
USCR
IPT
ACCEPTED MANUSCRIPT
17
of poleward motion of the Caribbean plate since the Middle Miocene is negligible
(less than one degree); although including the Miocene data in the regression line
adjusted by Acton et al. (2000) for the northward drift of the Caribbean since about 80
Ma to present is well within their estimated rate of about 18 km/my, data for Miocene
volcanic rocks around the Caribbean suggest a faster rate of northward motion for the
Paleocene-Early Miocene interval (21 km/my, Figure 11), and very small northward
motion since the Middle Miocene. Because Miocene northward displacement of a
point on the southern edge of the North America plate is small (on the order of 200
km), a similar small displacement on the Caribbean plate during the Miocene does not
require significant compression along the Cayman trough. Although our Miocene data
improves the estimates of Miocene to recent poleward motion of the Caribbean, for
earlier times more data are required. Overall, the constant northward drift for
Paleocene-Oligocene time of Figure 11, which is based on Acton et al. (2000), cannot
be confirmed by quality paleomagnetic data for Cretaceous-Oligocene time from
elsewhere in the Caribbean plate and may be questioned on tectonic grounds.
Burkart et al. (1983) suggested that the Polochic fault system accommodated
~130 km of sinistral displacement in the Neogene. They suggested that displacement
is supported by the correlation of geologic features on both sides of the fault, most
notably the Paleozoic cored Chicomuselo uplift in Chiapas and the Tactic-Santa Rosa
anticlinorium in Guatemala, and the Miocene volcanic arcs of southern Mexico and
Central America. The Cayman Trough (CT) accomodated the motion between the
Caribbean and North America between 49 Ma and the present (Leroy et al., 2000;
Rosencrantz et al., 1988).
The rate of spreading in the CT has been estimated at ~20 mm/yr in the last 2
My, but the older opening rates are controversial. Leroy et al. (2000) modeled marine
magnetic anomalies in the CT using a half-spreading rate of 8.5 mm/yr from the
present to about 20 Ma. We thus restored the Chortis Block 255 km along the
Polochic-Motagua system, to its position 15 Ma. This places the northwest end of the
Chortis Block in the area of the Gulf of Tehuantepec (Figure 12). The reconstruction
aligns, as Burkart (1983) had already noted, the Central America ignimbrite province
with the Miocene ignimbrite province of east-central Oaxaca, for which published
ages range between about 13 and 20 Ma (Morán-Zenteno et al., 2000), i.e. similar to

ACCE
PTED
MAN
USCR
IPT
ACCEPTED MANUSCRIPT
18
our findings (Figure 4, Table 1). In this reconstruction there is no overlap between the
northern termination and the Tehuantepec basin. The Tehuantepec basin is a NW-SE
depocenter between the southeast moving Chortis Block and the Chiapas Massif, and
it probably opened as a pull-appart basin controlled by the Tonalá shear zone on the
north (Wawrzyniec et al., 2005) and the Polochic system on the south. The
Tehuantepec basin contains a thick record of coarse-grained Miocene continental
sedimentation, and it is bounded by a major normal fault on the north and first order
strike-slip faults on the east and west (Sánchez-Barreda, 1981; Silva-Romo and
Mendoza-Rosales, 2009). Our paleomagnetic and geochronological study hence
support models proposing that ~250 km of post-middle Miocene displacement of the
Chortis block relative to north America explains the offset of the Miocene ignimbrite
belt of central America. This motion was not associated with wholesale rotation or
paleolatitudinal displacement of Chortis.
7. Conclusions We present new 40Ar/39Ar age constraints from the Padre Miguel ignimbrites
covering the Chortis Block of central Honduras of 16.1 ± 0.2 Ma and 14.42 ± 0.08
Ma. These ignimbrites carry dual polarity magnetizations. Rock magnetic data are
consistent with a thermoremanent magnetization residing primarily in a cubic phase
such as Ti-poor magnetite. The complete set of 33 spot observations (reference
location 14.39N, 87.14W) of the Middle Miocene field direction defines a
paleomagnetic pole at 80.0N/142.9E (K = 24.5, A95 = 5.2). The observed mean
direction is not statistically distinguishable from the expected direction of the North
America craton, R and F parameters R=-4.1º±6.1º and an F=-8.6º±11.3º indicate
insignificant rotation or latitudinal displacement. We present new 40Ar/39Ar ages
showing that the Padre Miguel ignimbrites in the sampling area were emplaced
between about 14 and 17 Ma. Restoring ~250 km of eastward motion of the Chortis
Block following Cayman trough reconstructions brings the Padre Miguel ingimbrites
into alignment with the Miocene volcanic arc rocks of southern Mexico (Oaxaca). We
conclude that the offset of the Middle American volcanic arc resulted from
Caribbean-North American plate motions, and that these motions did not lead to local
or regional vertical axis rotations.

ACCE
PTED
MAN
USCR
IPT
ACCEPTED MANUSCRIPT
19
Acknowledgements This research was partially supported by PAPIIT-UNAM grant IN106807 to
RSMG. DJJvH acknowledges Statoil for financial support (SPlates Model project).
We thank the journal editor Mian Liu, Ruben Somoza and an anonymous reviewer for
the comments to the manuscript.
References Acton, G.D., Galbrun, B., King, J.W., 2000. Paleolatitude of the Caribbean plate since
the Late Cretaceous, in: Leckie, R.M., Sigurdsson, H., Acton, G.D., and Draper, G.
(Eds.), Proceedings of the Ocean Drilling Program, Scientific Results. 165, 149-173.
Burkart, B., Clemons, R.E., 1973. Mesozoic and Cenozoic Stratigraphy of
Southeastern Guatemala. AAPG Bulletin. 57, DOI: 10.1306/819A4248-16C5-11D7-
8645000102C1865D.
Burkart, B., Self S., 1985,Extension and rotation of crustal blocks in northern Central
America and effect on the volcanic arc. Geology. 13, 22-26.
Cande S.C., Kent, D.V., 1995. A revised calibration of the geomagnetic polarity
timescale for the Late Cretaceous and Cenozoic. J. Geophys. Res. 100, 6093-6095.
Case, J. E., Holcombe, T. L., 1980, Geologic-tectonic map of the Caribbean region,
Reston, Va. United States Geological Survey, 1980.
Day, R., Fuller, M. Schmidt, V.A., 1977, Hysteresis properties of titanomagnetites:
grain-size and compositional dependence. Phys. Earth planet. Inter. 13, 260–267.
Deenen, M.H.L., Langereis, C.G., van Hinsbergen, D.J.J., Biggin, A.J., 2011.
Geomagnetic secular variation and the statistics of palaeomagnetic directions.
Geophysical Journal International. 186, 509-520.

ACCE
PTED
MAN
USCR
IPT
ACCEPTED MANUSCRIPT
20
Dengo, G., 1969, Problems of tectonic relations between Central America and the
Caribbean. GCAGS Transactions. 19, DOI: 10.1306/A1ADF38F-0DFE-11D7-
8641000102C1865D.
Egli, R., 2004. Characterization of individual rock magnetic components by analysis
of remanence curves. 2. Fundamental properties of coercivity distributions. Phys.
Chem. Earth. 29, 851-867.
Ehrenborg, J., 1986. A new stratigraphy for the Tertiary volcanic rocks of the
Nicaraguan Highland. Geolog. Soc. Am. Bull. 108, 830-842.
Elming, S. A., Layer, P., Ubieta, K., 2001. A palaeomagnetic study and age
determinations of Tertiary rocks in Nicaragua, Central America. Geophys. J. Int. 147,
294–309.
Emmet, P.A., 1983. Geology of the Algateca quadrangle, Honduras, Central America,
unpubl. MA thesis, University of Texas, Austin, TX, USA, pp. 201.
Engebreston, D.C., Cox, A., Gordon, R.G., 1985. Relative motions between oceanic
and continental plates in the Pacific Basin. Geological Society of America Special
Paper. 206, pp. 59.
Fisher, R.A., 1953. Dispersion on a sphere. Proc. R. Soc. London. A 217, 295-305.
Guja, N.H., Vincenz, S.A., 1978. Paleomagnetism of some Late Cretaceous and
Miocene igneous rocks on Jamaica. Geophys. J. Roy. Astr. Soc. 52, 97-115.
Guzmán-Speziale, M., Meneses-Rocha, J. J., 2000. The North America–Caribbean
plate boundary west of the Motagua–Polochic fault system: a fault jog in Southeastern
Mexico. Journal of South American Earth Sciences. 13, 459-468.
Heiken, G., Ramos, N., Duffield, W., Musgrave, J., Wohletz, K., Priest, S., Aldrich,
J., Flores, W., Ritchied, A., Goff, F., Eppler, D., Escobar, C., 1991. Geology of the

ACCE
PTED
MAN
USCR
IPT
ACCEPTED MANUSCRIPT
21
platanares geothermal area, Departamento de Copán, Honduras. Journal of
Volcanology and Geothermal Research. 45, 41-58.
Herrmann, U.R., Nelson, B.K., Ratschbacher, L., 1994. The origin of a terrane: U Pb
zircon geochronology and tectonic evolution of the Xolapa complex (southern
Mexico). Tectonics. 13, 455-474.
Heslop, D., McIntosh, G. Dekkers, M.J., 2004. Using time- and temperature-
dependent Preisach models to investigate the limitations of modelling isothermal
remanent magnetization acquisition curves with cumulative log Gaussian functions.
Geophys. J. Int. 157, 55-63.
Jordan, B. R., Sigurdsson, H., Carey, S., Lundin, S., Rogers, R. D., Singer, B.,
Barquero-Molina, M., 2007. Petrogenesis of Central American Tertiary ignimbrites
and associated Caribbean Sea tephra. Geological Society of America Special Papers.
428, 151-179.
Karig-Cordwell, D. E., Moore, G F., Moore, D. G., 1978. Late Cenozoic subduction
and continental margin truncation along the Middle America Trench. Geological
Society of America Bulletin. 89, 251-272.
Keppie, J. D., Moran-Zenteno, D. J., 2005. Tectonic Implications of Alternative
Cenozoic Reconstructions for Southern Mexico and the Chortis Block. International
Geology Review. 47, 473-491.
Kirschvink, J.L., 1980. The least-squares line and plane and the analysis of
paleomagnetic data: examples from Siberia and Morroco. Geophys. J. Roy. Astr. Soc.
62, 699-718.
Koppers, A.A.P., 2002, ArArCALC—software for 40Ar/39Ar age calculations.
Computers & Geosciences. 28, 605-619.

ACCE
PTED
MAN
USCR
IPT
ACCEPTED MANUSCRIPT
22
Kruiver, P.P., Dekkers, M.J., Heslop, D., 2001. Quantification of magnetic coercivity
components by the analysis of acquisition curves of isothermal remanent
magnetisation. Earth Planet. Sci. Lett. 189, 269-276.
Lee, J. Y., Marti, K., Severinghaus, J. P., Kawamura, K., Yoo, H. S., Lee, J. B., Kim,
J. S., 2006, A redetermination of the isotopic abundances of atmospheric Ar, Geochim
Cosmochim Acta. 70, 4507-4512.
Leroy, S., Mauffret, A., Patriat, P., Mercier de Lépinay, B., 2000. An alternative
interpretation of the Cayman trough evolution from a reidentification of magnetic
anomalies. Geophys. J. Int. 141, 539-557.
Malfait, B. T., Dinkelman, M. G., 1972. Circum-Caribbean Tectonic and Igneous
Activity and the Evolution of the Caribbean Plate. Geological Society of America
Bulletin. 83, 251-272.
Mammerickx, J., Klitgord, D.K., 1982. Northern East Pacific Rise: Evolution from 25
my B.P. to the present. Journal of Geophysical Research. 87, 6751-6759.
Manton, W., 1996. The Grenville of Honduras. Geological Society of America
Abstracts with Programs. 28, p. A-493.
McDougall, I., Harrison, T.M., 1999. Geochronology and thermochronology by
the 40Ar/39Ar method. Oxford University Press, New York.
Meschede, M., Frisch, W., 1998. A plate-tectonic model for the Mesozoic and Early
Cenozoic history of the Caribbean plate. Tectonophysics. 296, 269-291.
Morán-Zenteno, D. J., Martiny, B., Tolson, G., Solís-Pichardo, G., Alba-Aldave, L.,
Hernández-Bernal, M. S., Marcías-Romo, C., Martínez-Serrano, R. G., Schaaf, P.
Geocronología y características geoquímicas de las rocas magmáticas terciarias de la
Sierra Madre del Sur. Boletín de la Sociedad Geológica Mexicana. 53, 27-58.
ACCE
PTED
MAN
USCR
IPT
ACCEPTED MANUSCRIPT
23
Mullender, T.A.T., Van Velzen, A.J. and Dekkers, M.J., 1993. Continuous drift
correction and separate identification of ferromagnetic and paramagnetic
contributions in thermomagnetic runs. Geophys. J. Int. 114, 663-672.
Nier, A.O., 1950. A Redetermination of the Relative Abundances of the
Isotopes of Carbon, Nitrogen, Oxygen, Argon, and Potassium. Physical Review.
77, 789.
Ortega-Gutiérrez, F., Solari, L.A., Ortega-Obregón, C. Elías-Herrera, M., Martens,
U., Morán-Icálc, S., Chiquínc, M., Keppie, J.D., Torres De León, R., Schaaf, P., 2007.
The Maya-Chortís Boundary: A Tectonostratigraphic Approach. International
Geology Review. 49, 996-1024.
Pindell, J. L., Cande, S. C., Pitman, W. C., III, Rowley, D. B., Dewey, J. F.,
LaBrecque, J. L., and Haxby, W. F., 1988. A plate-kinematic framework for models
of Caribbean evolution, in: Scotese, C.R., Sager, W. W. (Eds.), Mesozoic and
Cenozoic plate reconstructions. Tectonophysics. 155, 121-138.
Pindell, J. L., Barrett, S. F., 1990. Geological evolution of the Caribbean region; a
plate-tectonic perspective, Boulder, Geological Society of America, The geology of
North America. H, 405-432.
Pindell, J., Kennan, L., 2009. Tectonic evolution of the Gulf of Mexico, Caribbean
and northern South America in the mantle reference frame: an update, in: James, K.,
Lorente, M.A., and Pindell, J., (Eds), The geology and evolution of the region
between North and South America, Geological Society of London, Special
Publication 328, 1-57.
Pindell, J.L., Maresch, W.V., Martens, U., Stanek, K.P., 2011. The Greater Antillean
Arc: Early Cretaceous origin and proposed relationship to Central American
subduction mélanges: implications for models of Caribbean evolution. International
Geology Review. 54, 131-143.

ACCE
PTED
MAN
USCR
IPT
ACCEPTED MANUSCRIPT
24
Plafker, G., 1976, Tectonic Aspects of the Guatemala Earthquake of 4 February 1976,
Science 24, 193, 1201-1208.
Ratschbacher, L., Franz, L., Min, M.,Bachmann, R., Martens, U., Stanek, K., Stübner,
K., Nelson, B. K., Herrmann, U., Weber, B., López-Martínez, M., Jonckheere, R.,
Sperner, B., Tichomirowa, M., Mcwilliams, M. O., Gordon, M., Meschede, M., Bock,
P., 2009. The North American-Caribbean Plate boundary in Mexico-Guatemala-
Honduras, Geological Society, London, Special Publication 328, 219-293.
Renne, P. R., Mundil, R., Balco, G., Min, K. W., Ludwig, K. R., 2010, Joint
determination of K-40 decay constants and Ar-40*/K-40 for the Fish Canyon sanidine
standard, and improved accuracy for Ar-40/Ar-39 geochronology. Geochim
Cosmochim Acta. 74, 5349-5347.
Robertson, D.J. and France, D.E., 1994. Discrimination of remanence-carrying
minerals in mixtures, using isothermal remanent magnetisation acquisition curves.
Phys. Earth Planet. Inter. 82, 223-234.
Rodriguez, M. DeMets, C., Rogers, R., Tenorio, C., Hernandez, D., 2009, A GPS and
modelling study of deformation in northern Central America. Geophysical Journal
International. 178, 1733-1754.
Rogers, R., 2003. Jurassic-recent tectonic and stratigraphic history of the Chortis
block of Honduras and Nicaragua (northern Central America), unpubl. Ph.D.
dissertation, University of Texas, Austin, 94 p.
Rogers, R. D., Kárason, H., and van der Hilst, R. D., 2002, Epeirogenic uplift above a
detached slab in northern Central America. Geology. 30, 1031-1034.
Rogers, R. D., Mann, P., and Emmet, P. A., 2007. Tectonic terranes of the Chortis
block based on integration of regional aeromagnetic and geologic data, Boulder,
Geological Society of America, Special Paper 428, 65-88.

ACCE
PTED
MAN
USCR
IPT
ACCEPTED MANUSCRIPT
25
Sánchez-Barreda, L. A., 1981. Geologic evolution of the continental margin of the
Gulf of Tehuantepec on southern Mexico: Ph.D. Thesis, University of Texas, Austin,
Texas, pp. 192.
Schaaf, P., Morán-Zenteno, D., Hernández-Bernal, M. S., 1995. Paleogene
continental margin truncation in southwestern Mexico: Geochronological evidence.
Tectonics. 14, 1229-1350.
Silva-Romo, G., 2008. Guayape-Papalutla fault system: A continuous Cretaceous
structure from southern Mexico to the Chortís block? Tectonic implications. Geology.
36, 75-78.
Silva-Romo, G., Mendoza-Rosales, C., 2009. Evaluación geológica de los modelos
para el truncamiento Cenozoico del sur de México: erosión por subducción y
detachment del bloque Chortis. Revista Mexicana de Ciencias Geológicas. 26, 165-
176.
Tauxe, L., Kent, D.V., 2004. A simplified statistical model for the geomagnetic field
and the detection of shallow bias in paleomagnetic inclinations: Was the ancient
magnetic field dipolar. Geophys. Monogr. 145, 1-15.
Torsvik, T.H., Müller, R.D., Van der Voo, R., Steinberger, B. Gaina, C., 2008. Global
plate motion frames: toward a unified model. Reviews of Geophysics. 41, RG3004,
doi:10.1029/2007RG000227.
Vincenz, S. A., and Dasgupta, S. N., 1978. Paleomagnetic study of some Cretaceous
and tertiary rocks on Hispaniola. Pure and applied geophysics. 116, 1200-1210.
Van der Voo, R., 1990. Reliability of paleomagnetic data. Tectonophysics. 184, 1-9.
Wadge, G., and Burke, K., 1983. Neogene Caribbean Plate rotation and associated
Central American tectonic evolution. Tectonics. 2, 633-643.

ACCE
PTED
MAN
USCR
IPT
ACCEPTED MANUSCRIPT
26
Wawrzyniec, T., Molina-Garza, R. S., Geissman, J.W., Iriondo, A., 2005. A newly
discovered relic, transform plate boundary – the Tonala shear zone and paleomagnetic
evolution of the western Maya Block, SW Mexico, Geological Society of America
Abstract with Programs. 37, 68.
Williams, H., McBirney, A.R., 1969. Volcanic history of Honduras. Univ. Calif.,
Berkeley, Publ. Geol. Sci. 85, 1-101.
Williams, H., McBirney, A.R., Dengo, G., 1964. Geologic reconnaissance of
southeastern Guatemala. Univ. Calif. Berkeley, Publ. Geol. Sci. 50, 62 pp.
Zijderveld, J. D. A., 1967. A. C. demagnetization of rocks: Analysis of results, in:
Collinson, D. W., Creer, K. M., and Runcorn S. K. (Eds.), Methods in Rock
Magnetism and Paleomagnetism: Elsevier, Amsterdam, p. 254-286.

ACCE
PTED
MAN
USCR
IPT
ACCEPTED MANUSCRIPT
27
Figure Captions
Figure 1- a) Simplified tectonic map of the Chortis block showing distribution of the
Central America Cenozoic ignimbrite province (gray). Triangles indicate the modern
volcanic arc. PCCFZ= Polochic-Cuilco-Chixoy fault zone; JChCFZ=Jocotán-
Chamalecón-La Ceiba fault zone; SIFZ=Swan Island fault zone; MFZ=Motagua fault
zone; GFZ=Guayape fault zone. The box marks the study area. b) Inset: Schematic
map of the Caribbean plate showing location of the Chortis Block. SMT=Southern
Mexico Terranes; NR= Nicaragua Rise; YB=Yucatán Basin; GB=Guayana basin;
LAT= Lesser Antilles trench; CB= Colombian basin; GoM= Gulf of México.
Figure 2. Alternative reconstructions of the Chortis Block relative to southern Mexico
terranes, after A) Rogers et al. (2007) and B) Silva-Romo (2008). Rogers et al. (2007)
notice the alignement of the a magnetic features (dotted line), whilst Silva-Romo
(2008) aligns the Guayape (GFZ) and Papalutla faults (PF). Other symbols are:
M=Mexico City; A=Acapulco; O=Oaxaca; T=Tegucigalpa; Ac=Acatlán Complex;
Xo=Xolapa terrane; Gro=Guerrero terrane; Si= Siuna terrane.
Figure 3. Simplified map of central Honduras showing distribution of the Padre
Miguel Group (gray shading) and paleomagnetic sampling sites.
Figure 4. 40Ar/39Ar age spectrums (below) and K/Ca ratios (above) for furnace step
heating experiments from sample a) 061609B and b) 061709B. The error bars at each
step and the calculated ages are shown at the 95% confidence level (1.96). The

ACCE
PTED
MAN
USCR
IPT
ACCEPTED MANUSCRIPT
28
numbers above each bar represent the experiment number in the supplemental data
file.
Figure 5. Thermomagnetic curves of selected ignimbrite samples. The heating curve
is the thin line.
Figure 6. Day plot (Day et al., 1977) of selected samples of the Padre Miguel Group
ignimbrites.
Figure 7. IRM acquisition curves of selected samples of the Padre Miguel Group
ignimbrites.
Figure 8. Orthogonal demagnetization diagrams (Zijderveld, 1967) of selected
ignimbrite samples of the Padre Miguel Group. Solid (open) symbols are projections
of the horizontal (vertical) plane. Steps marked in ºC or mT.
Figure 9. Stereographic projections of site mean in situ and tilt corrected. Solid (open)
symbols are projections on the lower (upper) hemisphere. Selected sites correspond to
sites with k>30 and 95<20º (tilt corrected).
Figure 10. Miocene paleomagnetic poles for the Caribbean plate compared to the (~15
Ma) North America reference (star) poles. Symbols are: LY=Las Yayas Andesite
(Vincenz and Dagupta, 1978); LL= Low Laton Lavas (Guja and Vincenzm 1978);
CG= Coyol Group (Elming et al., 2001); PMG= Padre Miguel Group. Poles include
their 95% confidence interval. The average of these four poles is shown as a solid
circle. All poles are listed in Table 3.
Figure 11. Estimate of northward motion of the Caribbean plate, modified from Acton
et al. (2000), calculated for ODP site 999. Data for Padre Miguel Group gray square.
Paleolatitide calculated for a mid-Miocene paleopole is a white square.
Figure 12. Reconstruction of the Chortis Block relative to southern Mexico 15 Ma.
Dark gray pattern shown the distribution of mid-Miocene rhyolitic volcanism. Also

ACCE
PTED
MAN
USCR
IPT
ACCEPTED MANUSCRIPT
29
the present-day coastal outlines, structural features, and some basement elements are
provided (O=Oaxaca; T=Tegucigalpa; TG=Tuxtla Gutiérrez; Oc Oaxaca Complex;
Ac=Acatlan complex).

ACCE
PTED
MAN
USCR
IPT
ACCEPTED MANUSCRIPT
30

ACCE
PTED
MAN
USCR
IPT
ACCEPTED MANUSCRIPT
31
ACCE
PTED
MAN
USCR
IPT
ACCEPTED MANUSCRIPT
32

ACCE
PTED
MAN
USCR
IPT
ACCEPTED MANUSCRIPT
33
Figure 1

ACCE
PTED
MAN
USCR
IPT
ACCEPTED MANUSCRIPT
34
Figure 2

ACCE
PTED
MAN
USCR
IPT
ACCEPTED MANUSCRIPT
35
Figure 3
ACCE
PTED
MAN
USCR
IPT
ACCEPTED MANUSCRIPT
36
Figure 4

ACCE
PTED
MAN
USCR
IPT
ACCEPTED MANUSCRIPT
37
Figure 5
ACCE
PTED
MAN
USCR
IPT
ACCEPTED MANUSCRIPT
38
Figure 6

ACCE
PTED
MAN
USCR
IPT
ACCEPTED MANUSCRIPT
39
Figure 7

ACCE
PTED
MAN
USCR
IPT
ACCEPTED MANUSCRIPT
40
Figure 8
ACCE
PTED
MAN
USCR
IPT
ACCEPTED MANUSCRIPT
41
Figure 9
ACCE
PTED
MAN
USCR
IPT
ACCEPTED MANUSCRIPT
42
Figure 10

ACCE
PTED
MAN
USCR
IPT
ACCEPTED MANUSCRIPT
43
Figure 11

ACCE
PTED
MAN
USCR
IPT
ACCEPTED MANUSCRIPT
44
Figure 12

ACCE
PTED
MAN
USCR
IPT
ACCEPTED MANUSCRIPT
45
Highlights The Miocene (14-17 Ma) Padre Miguel ignimbrites yield a palepole at lat = 80.0ºN, lon = 142.9ºE. Paleomagnetic data indicate statistically insignificant rotation and latitudinal displacement. Restoring 255 km of slip aligns the mid-Miocene arcs of Oaxaca and Central America.