Embed Size (px)
Citation preview
The Overview Of Indonesia Aquaculture Issues
Christopher Ongko; Cut Desyana, S.Si., M.Mar
Agribusiness, Surya University Indonesia
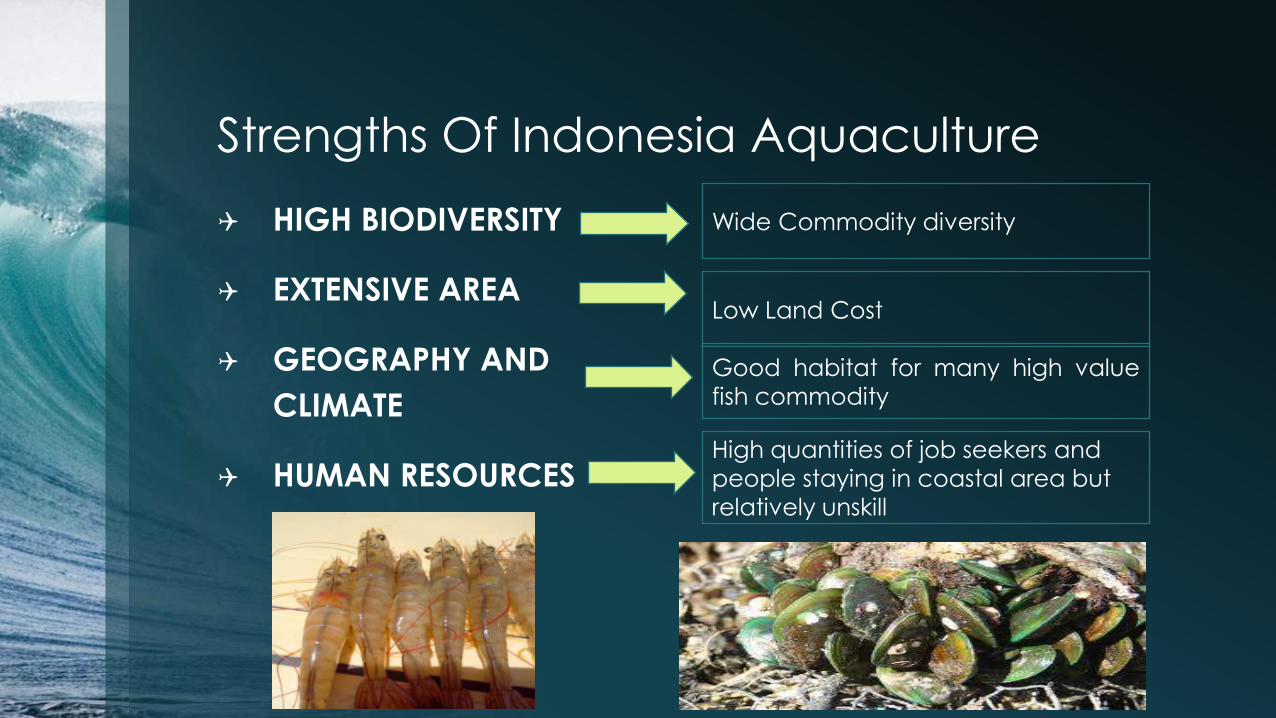
Strengths Of Indonesia Aquaculture
HIGH BIODIVERSITY
EXTENSIVE AREA
GEOGRAPHY AND
CLIMATE
HUMAN RESOURCES
High quantities of job seekers and
people staying in coastal area but
relatively unskill
Wide Commodity diversity
Low Land Cost
Good habitat for many high value
fish commodity
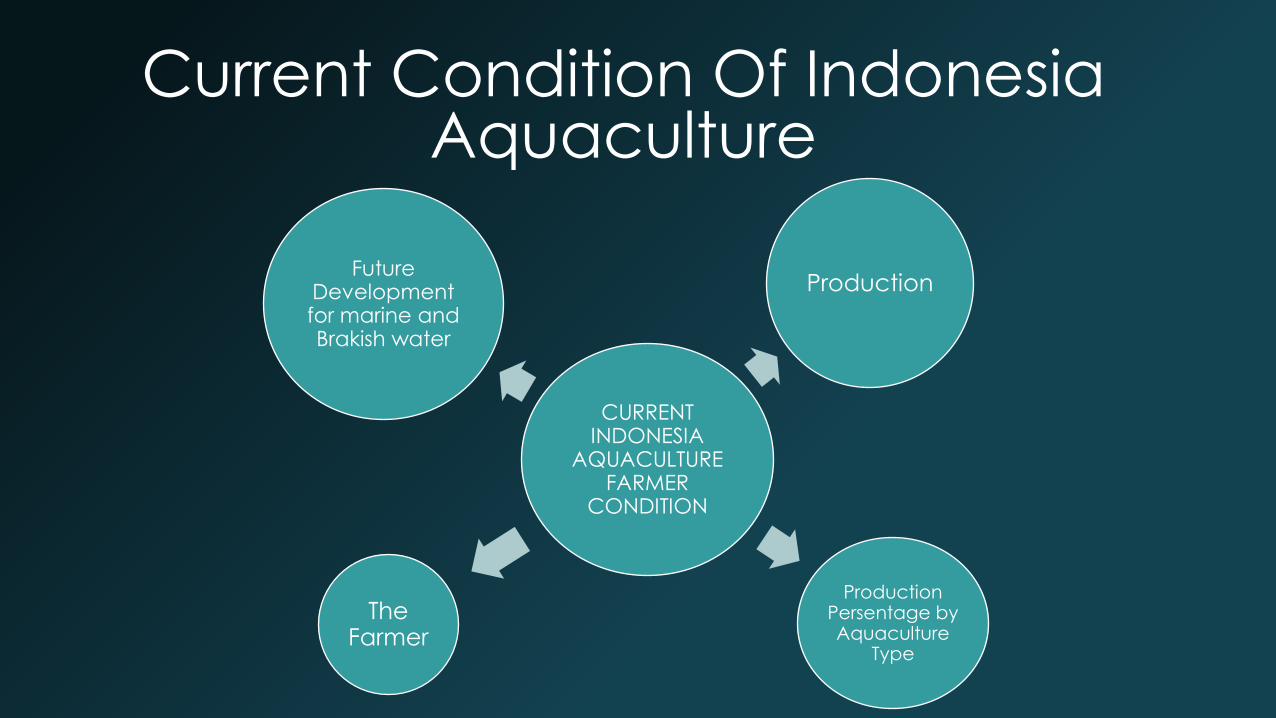
Current Condition Of Indonesia Aquaculture
CURRENT INDONESIA
AQUACULTURE FARMER
CONDITION
Production
Production Persentage by Aquaculture
Type
The Farmer
Future Development for marine and Brakish water
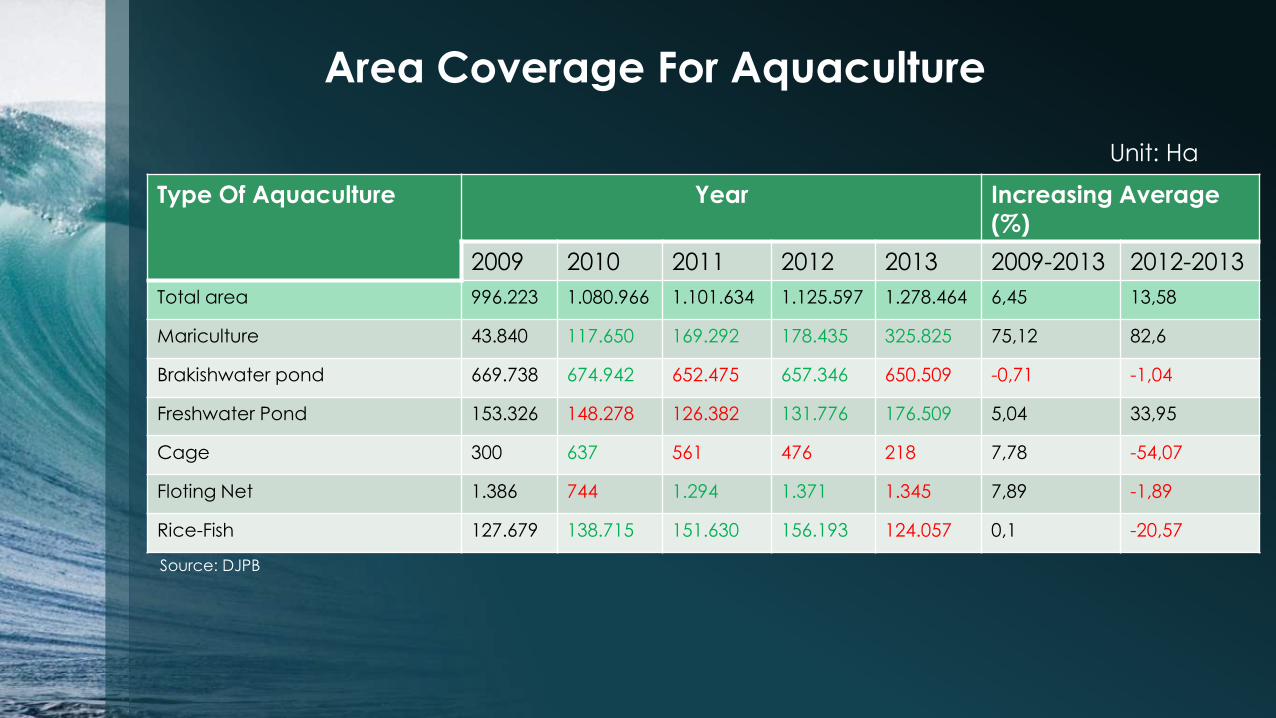
Area Coverage For Aquaculture
Type Of Aquaculture Year Increasing Average
(%)
2009 2010 2011 2012 2013 2009-2013 2012-2013
Total area 996.223 1.080.966 1.101.634 1.125.597 1.278.464 6,45 13,58
Mariculture 43.840 117.650 169.292 178.435 325.825 75,12 82,6
Brakishwater pond 669.738 674.942 652.475 657.346 650.509 -0,71 -1,04
Freshwater Pond 153.326 148.278 126.382 131.776 176.509 5,04 33,95
Cage 300 637 561 476 218 7,78 -54,07
Floting Net 1.386 744 1.294 1.371 1.345 7,89 -1,89
Rice-Fish 127.679 138.715 151.630 156.193 124.057 0,1 -20,57
Unit: Ha
Source: DJPB
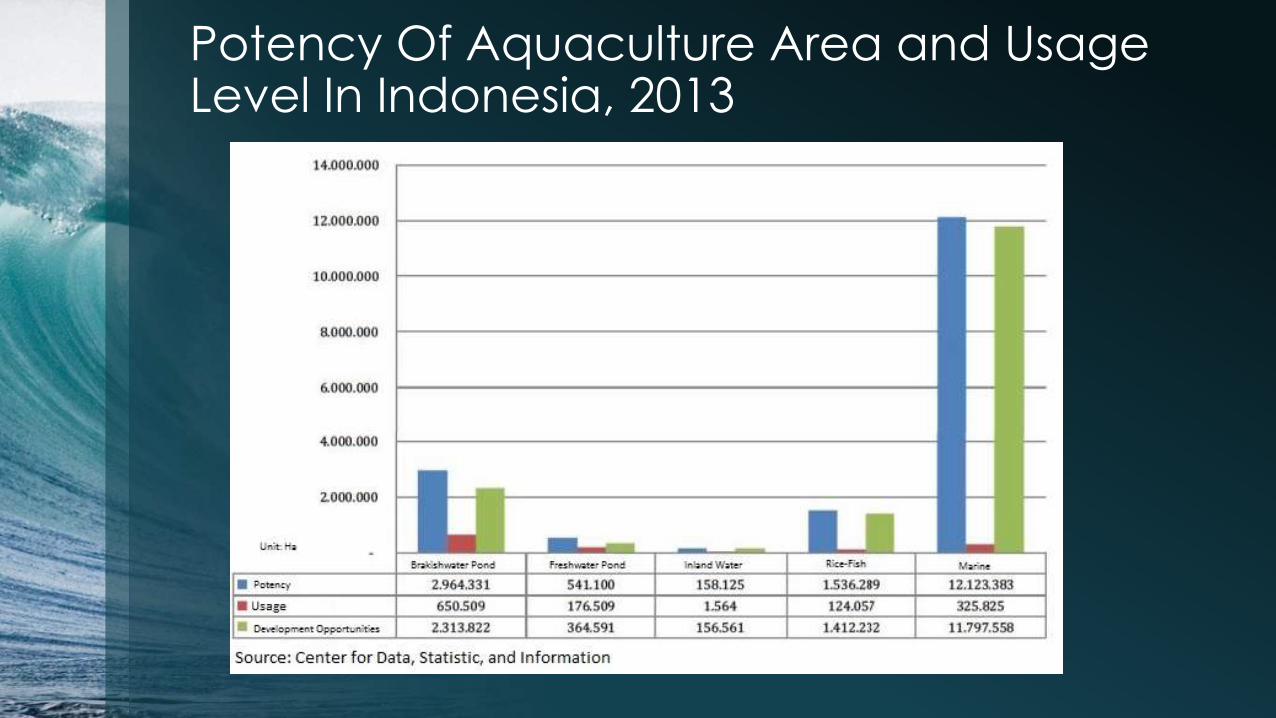
Potency Of Aquaculture Area and Usage Level In Indonesia, 2013
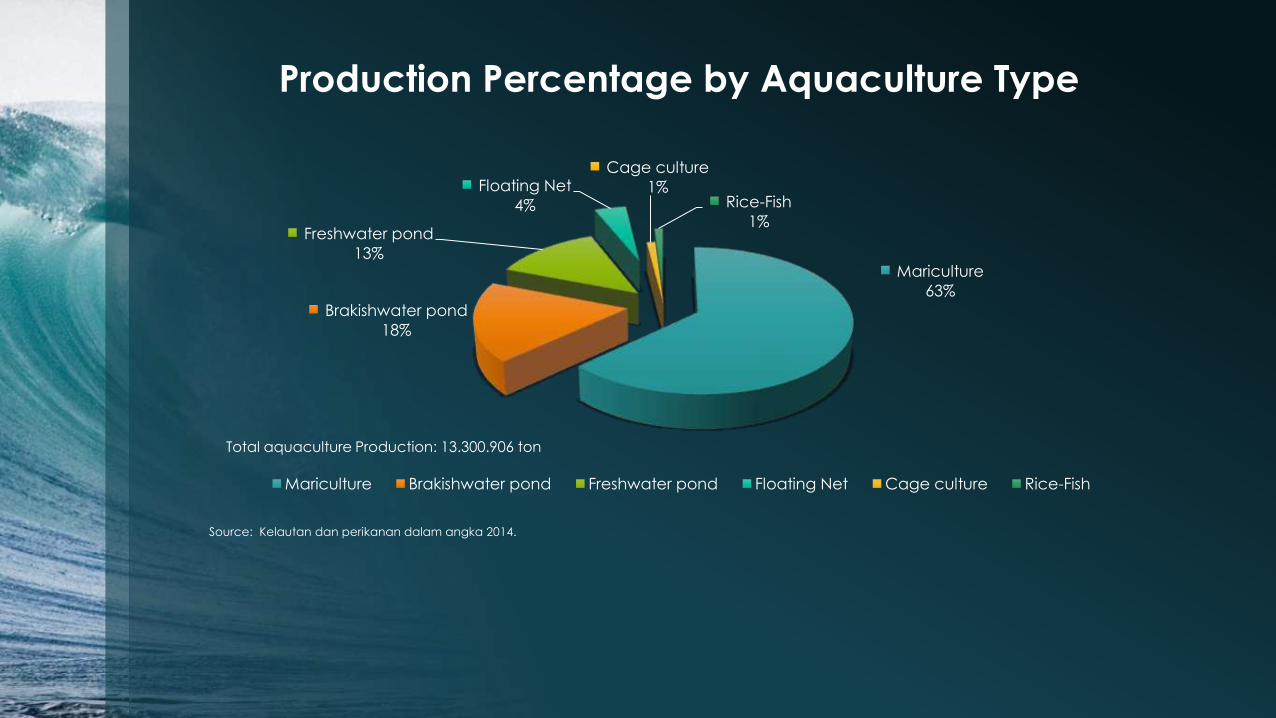
Mariculture
63%
Brakishwater pond
18%
Freshwater pond
13%
Floating Net
4%
Cage culture
1% Rice-Fish
1%
Mariculture Brakishwater pond Freshwater pond Floating Net Cage culture Rice-Fish
Total aquaculture Production: 13.300.906 ton
Source: Kelautan dan perikanan dalam angka 2014.
Production Percentage by Aquaculture Type
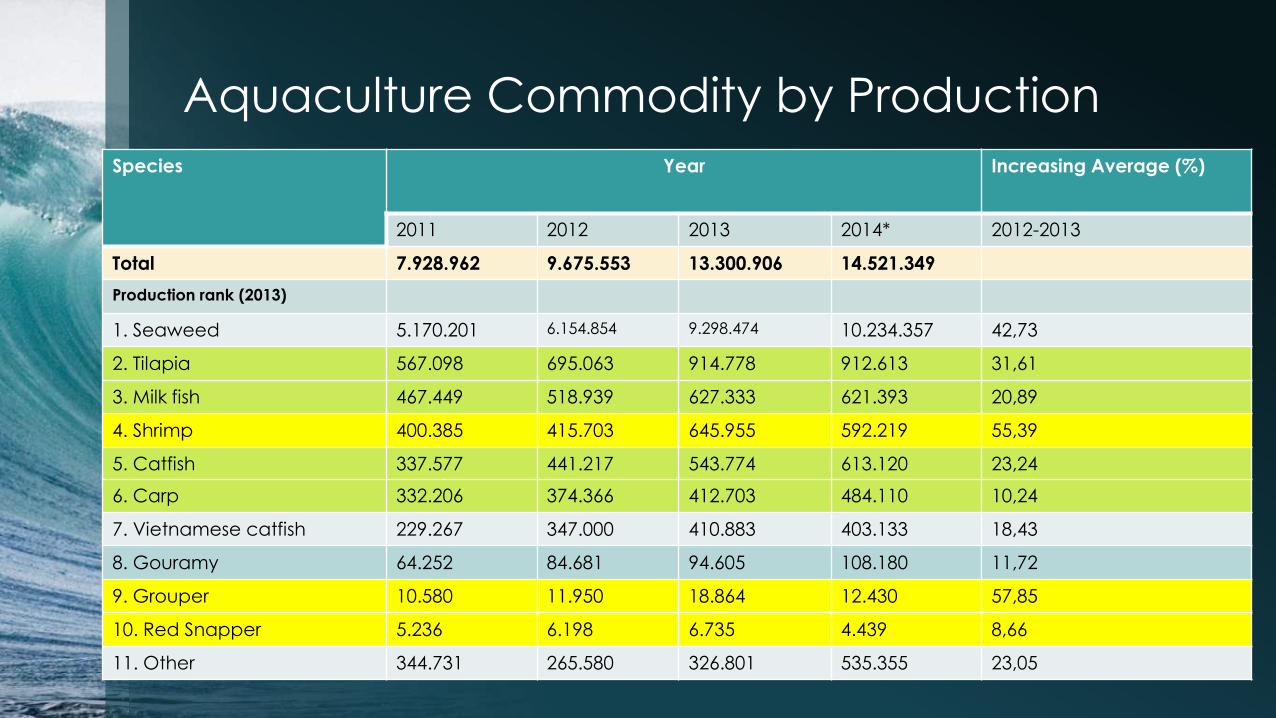
Aquaculture Commodity by Production
Species Year Increasing Average (%)
2011 2012 2013 2014* 2012-2013
Total 7.928.962 9.675.553 13.300.906 14.521.349
Production rank (2013)
1. Seaweed 5.170.201 6.154.854 9.298.474 10.234.357 42,73
2. Tilapia 567.098 695.063 914.778 912.613 31,61
3. Milk fish 467.449 518.939 627.333 621.393 20,89
4. Shrimp 400.385 415.703 645.955 592.219 55,39
5. Catfish 337.577 441.217 543.774 613.120 23,24
6. Carp 332.206 374.366 412.703 484.110 10,24
7. Vietnamese catfish 229.267 347.000 410.883 403.133 18,43
8. Gouramy 64.252 84.681 94.605 108.180 11,72
9. Grouper 10.580 11.950 18.864 12.430 57,85
10. Red Snapper 5.236 6.198 6.735 4.439 8,66
11. Other 344.731 265.580 326.801 535.355 23,05
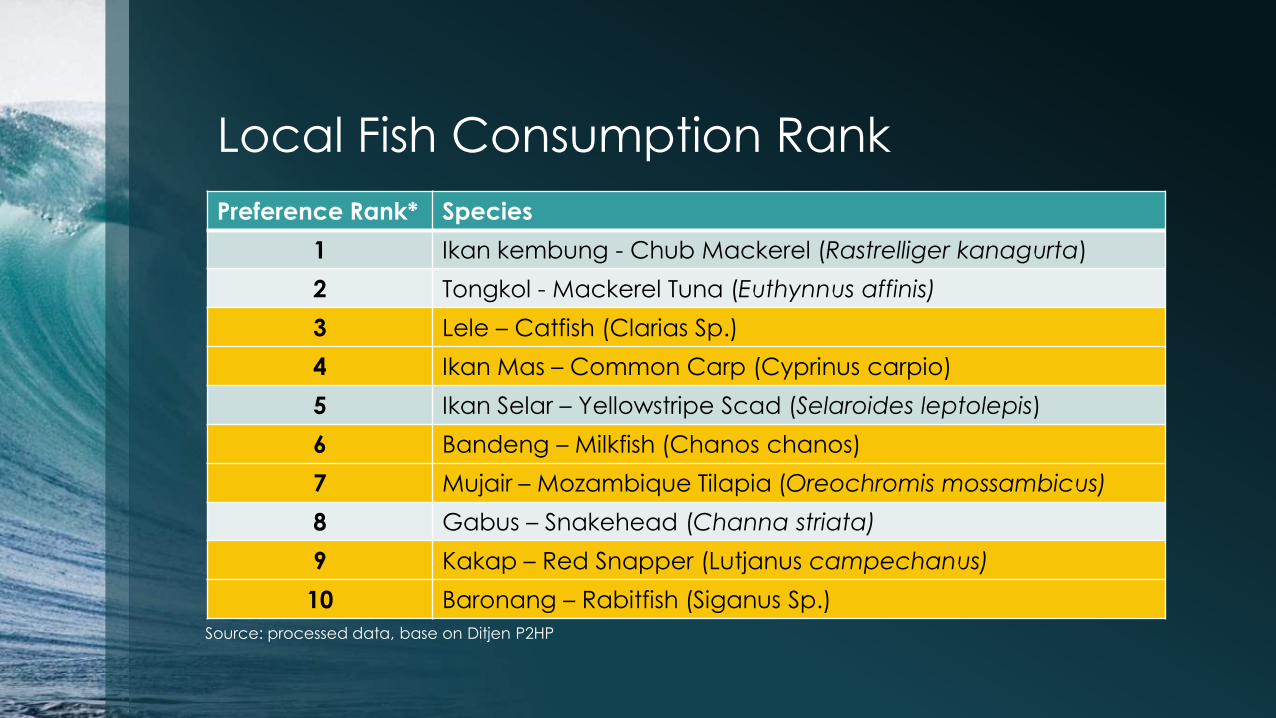
Local Fish Consumption Rank
Preference Rank* Species
1 Ikan kembung - Chub Mackerel (Rastrelliger kanagurta)
2 Tongkol - Mackerel Tuna (Euthynnus affinis)
3 Lele – Catfish (Clarias Sp.)
4 Ikan Mas – Common Carp (Cyprinus carpio)
5 Ikan Selar – Yellowstripe Scad (Selaroides leptolepis)
6 Bandeng – Milkfish (Chanos chanos)
7 Mujair – Mozambique Tilapia (Oreochromis mossambicus)
8 Gabus – Snakehead (Channa striata)
9 Kakap – Red Snapper (Lutjanus campechanus)
10 Baronang – Rabitfish (Siganus Sp.)
Source: processed data, base on Ditjen P2HP
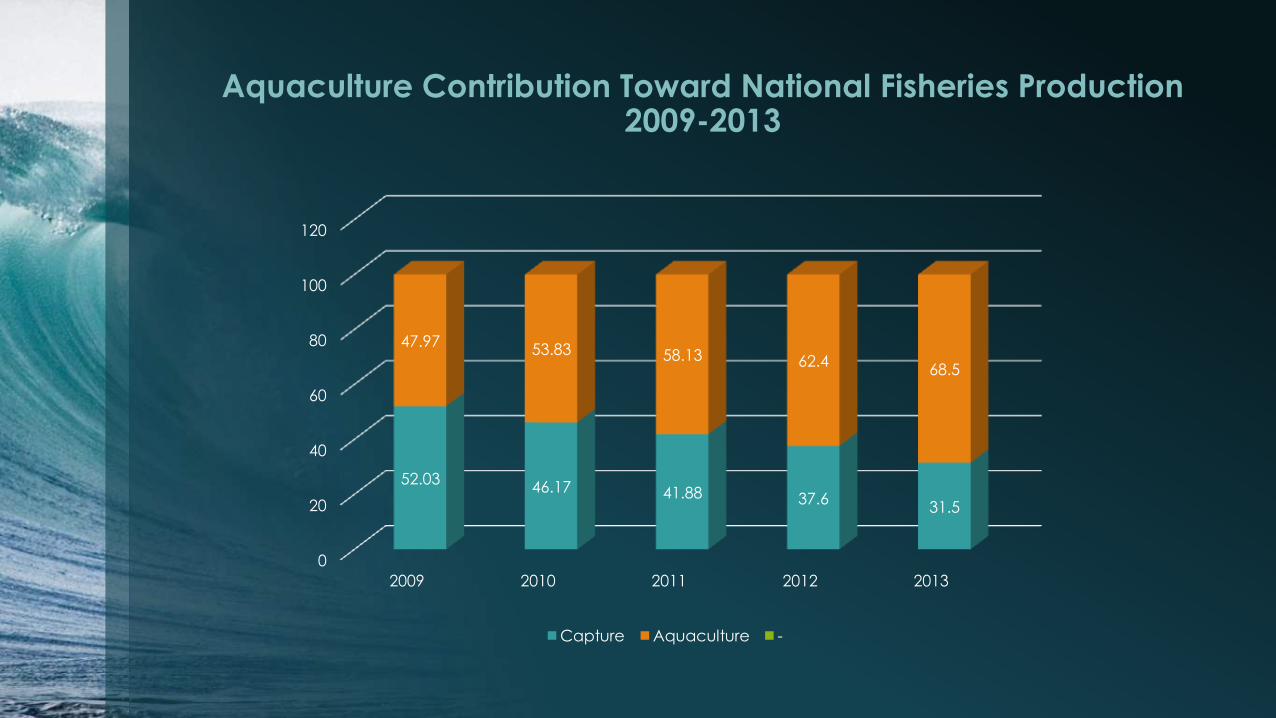
Aquaculture Contribution Toward National Fisheries Production 2009-2013
0
20
40
60
80
100
120
2009 2010 2011 2012 2013
52.03 46.17 41.88 37.6
31.5
47.97 53.83 58.13 62.4
68.5
Capture Aquaculture -
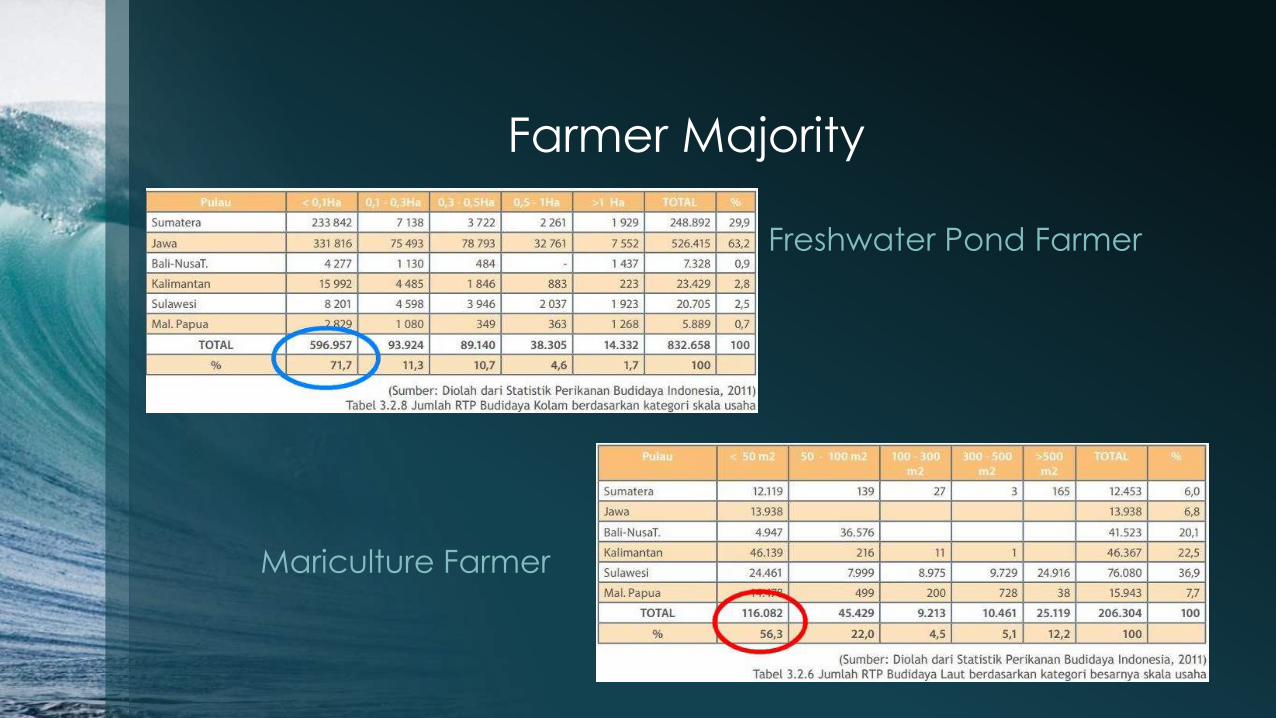
Farmer Majority
Freshwater Pond Farmer
Mariculture Farmer
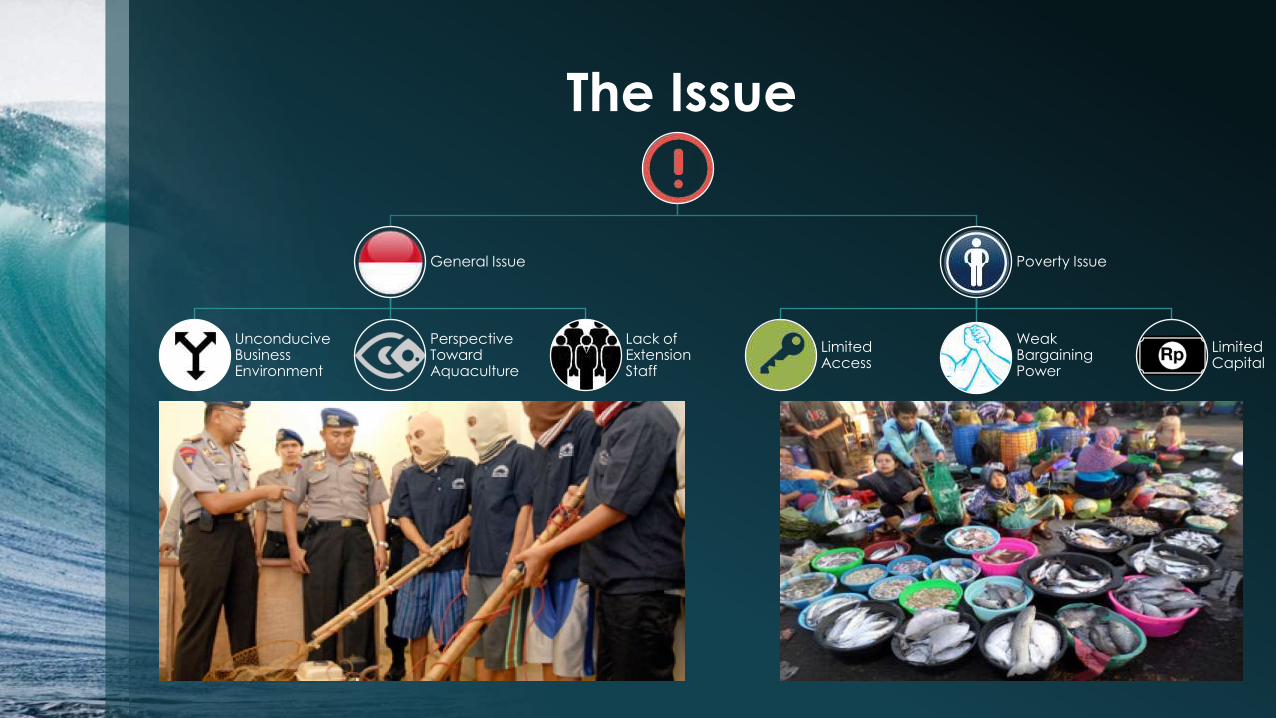
The Issue
General Issue
Unconducive Business Environment
Perspective Toward Aquaculture
Lack of Extension Staff
Poverty Issue
Limited Access
Weak Bargaining Power
Limited Capital
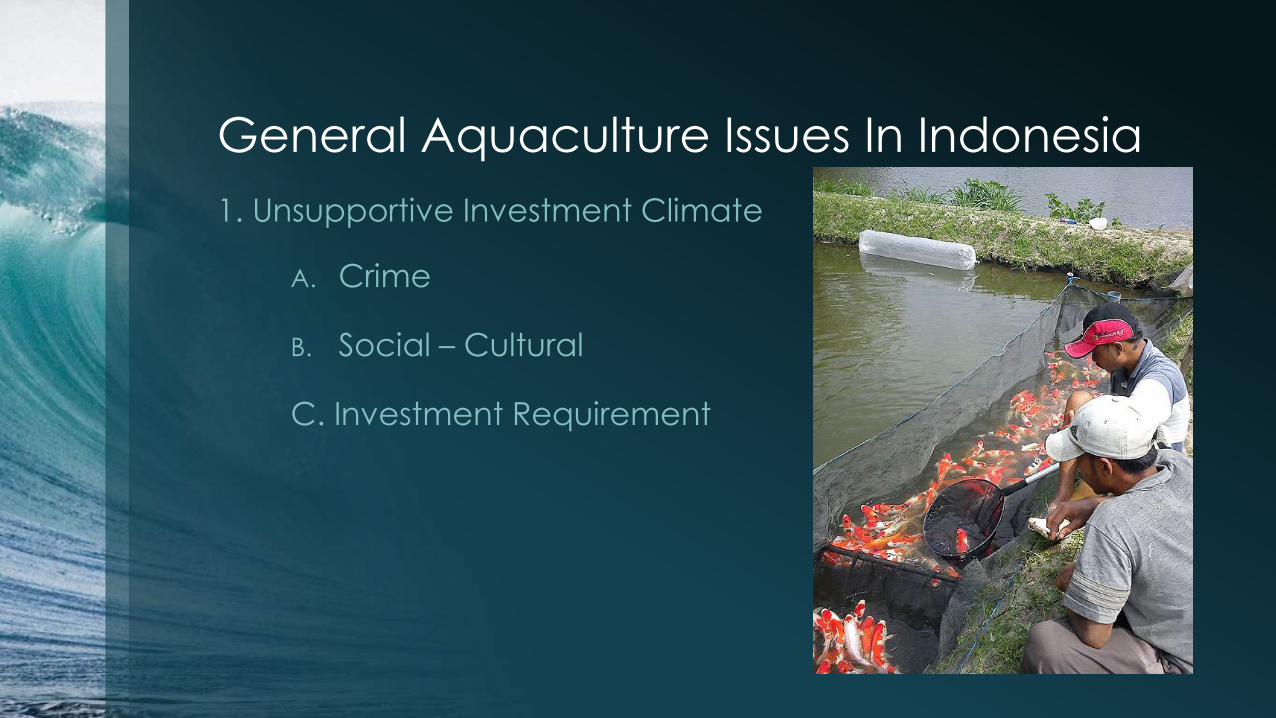
General Aquaculture Issues In Indonesia
A. Crime
B. Social – Cultural C. Investment Requirement
1. Unsupportive Investment Climate
2. Perspective Toward Aquaculture
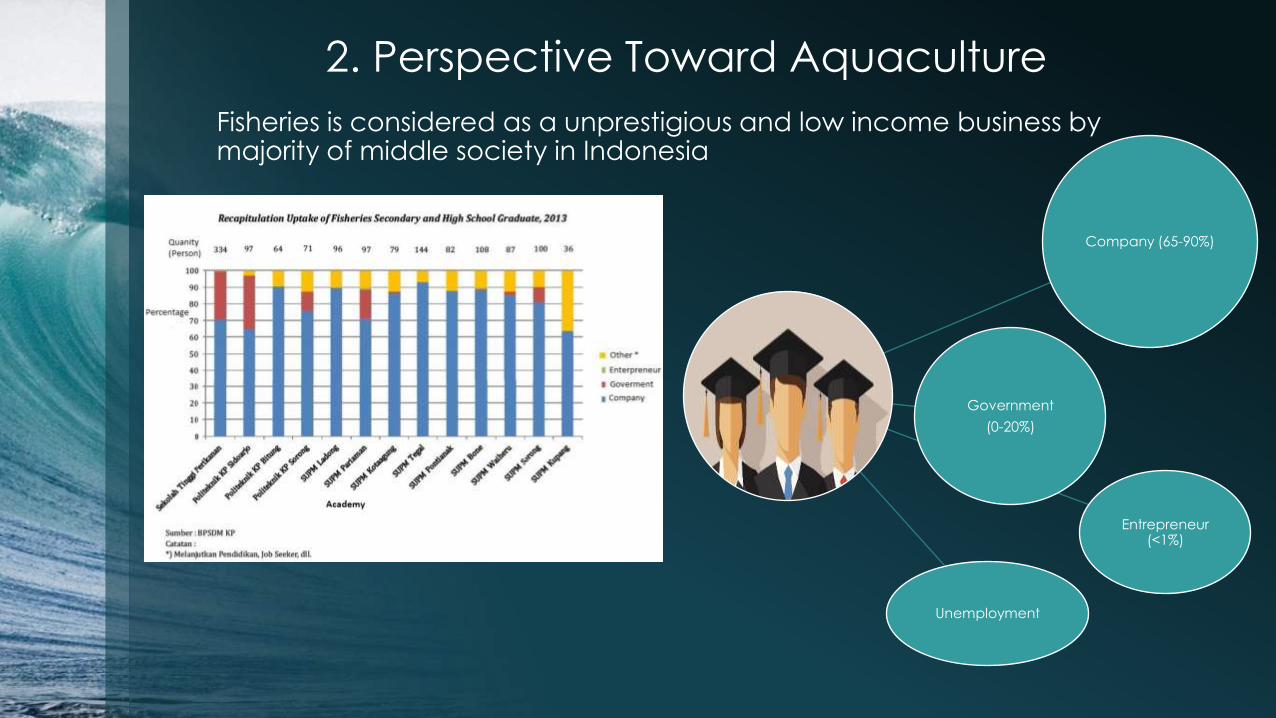
Fisheries is considered as a unprestigious and low income business by majority of middle society in Indonesia
Company (65-90%)
Government
(0-20%)
Entrepreneur (<1%)
Unemployment
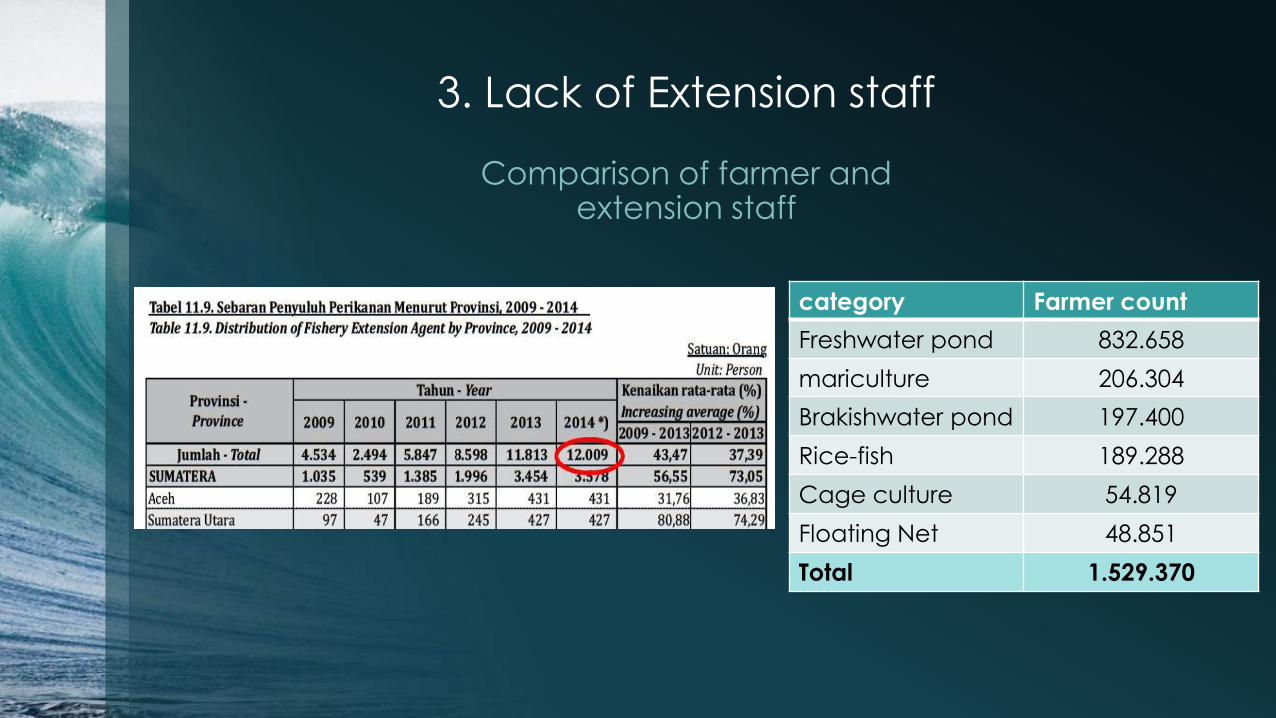
3. Lack of Extension staff
Comparison of farmer and extension staff
category Farmer count
Freshwater pond 832.658
mariculture 206.304
Brakishwater pond 197.400
Rice-fish 189.288
Cage culture 54.819
Floating Net 48.851
Total 1.529.370
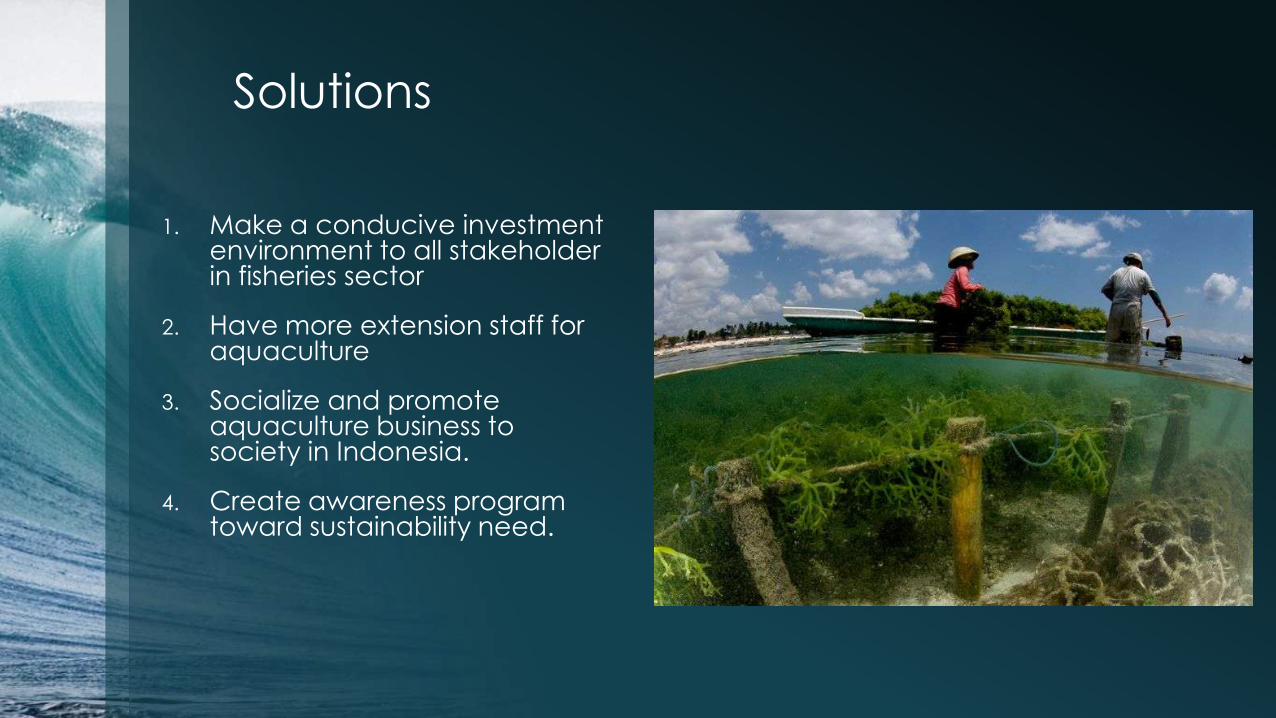
Solutions
1. Make a conducive investment environment to all stakeholder in fisheries sector
2. Have more extension staff for aquaculture
3. Socialize and promote aquaculture business to society in Indonesia.
4. Create awareness program toward sustainability need.
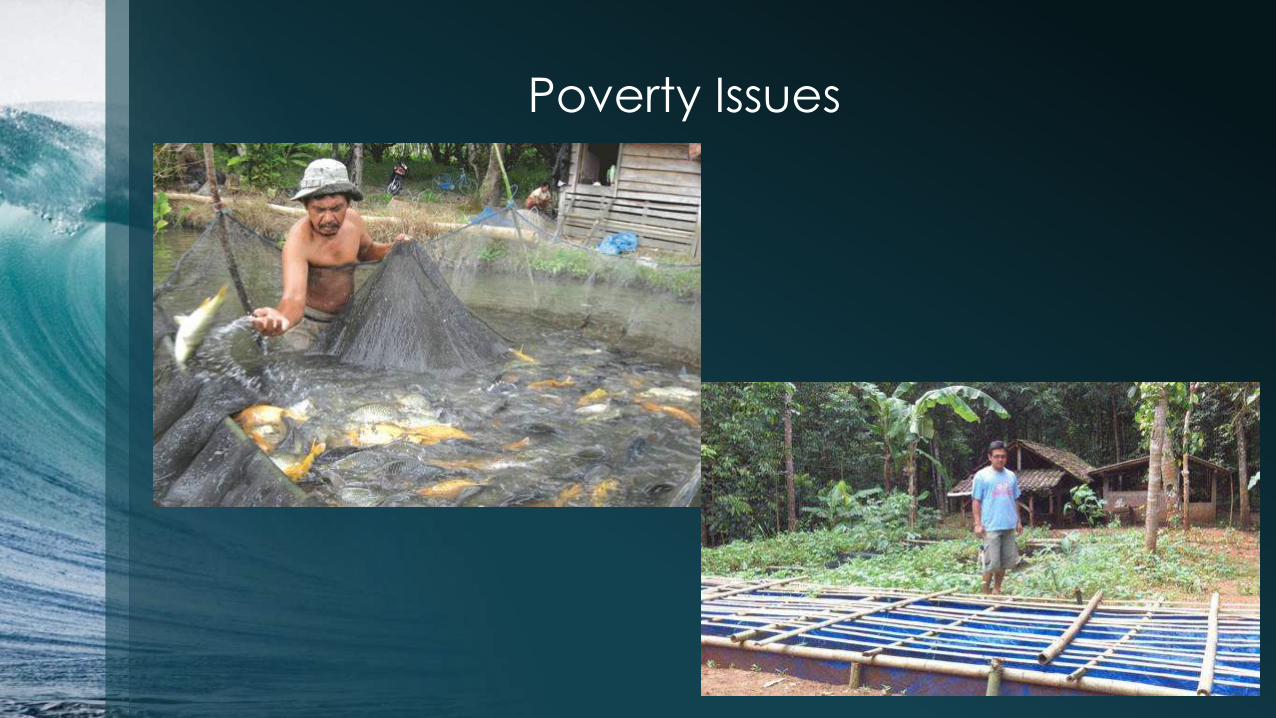
Poverty Issues
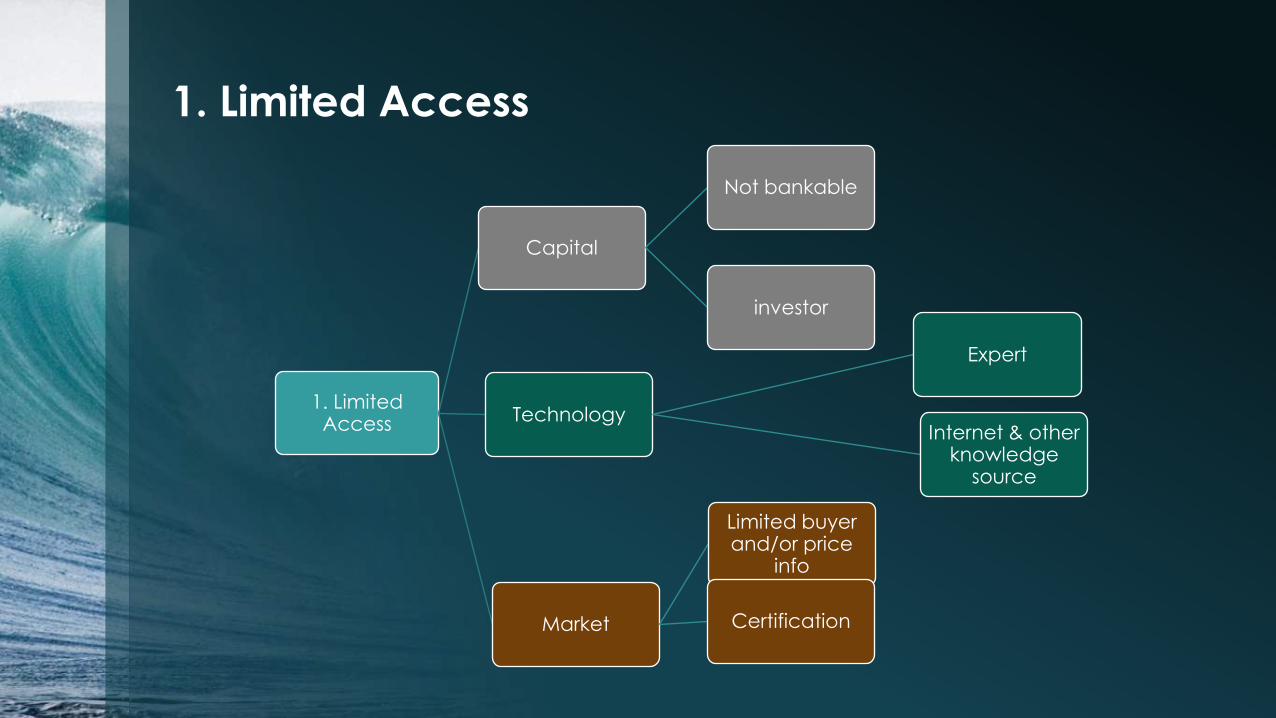
1. Limited Access
Capital
Not bankable
investor
Technology
Expert
Internet & other knowledge
source
Market
Limited buyer and/or price
info
Certification
1. Limited Access
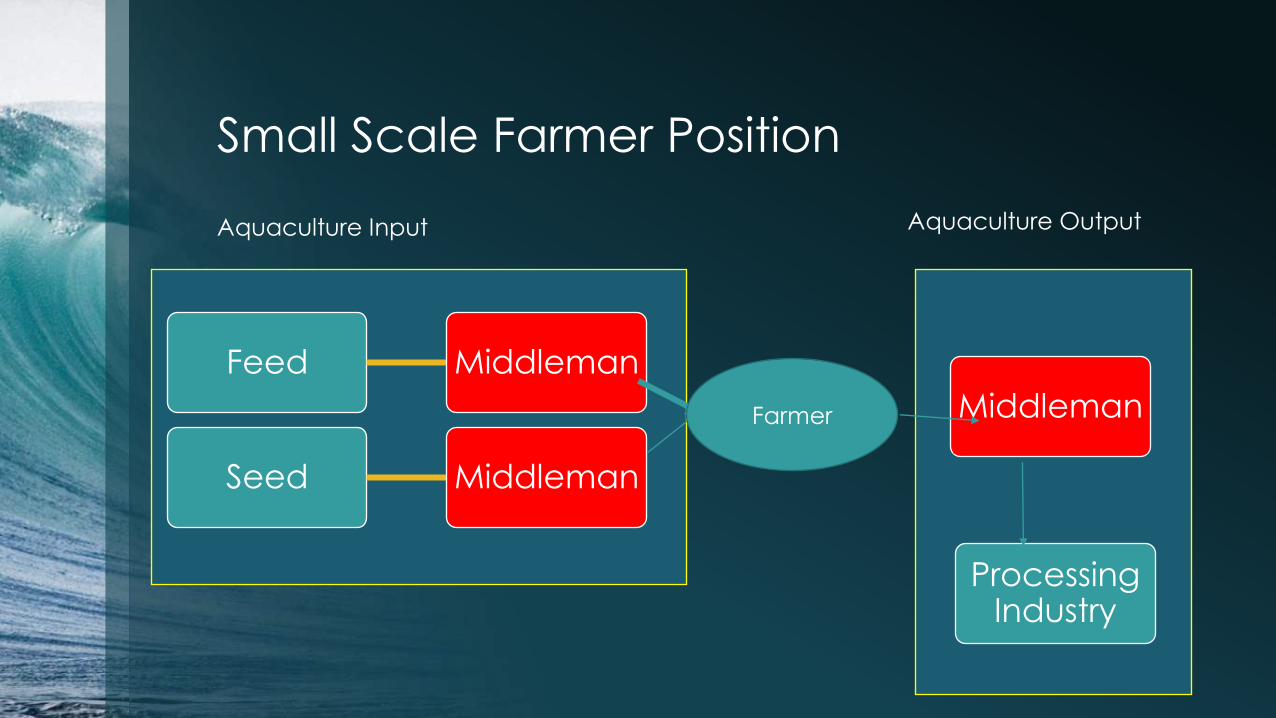
Small Scale Farmer Position
Feed Middleman
Seed Middleman
Farmer Middleman
Processing Industry
Aquaculture Input Aquaculture Output
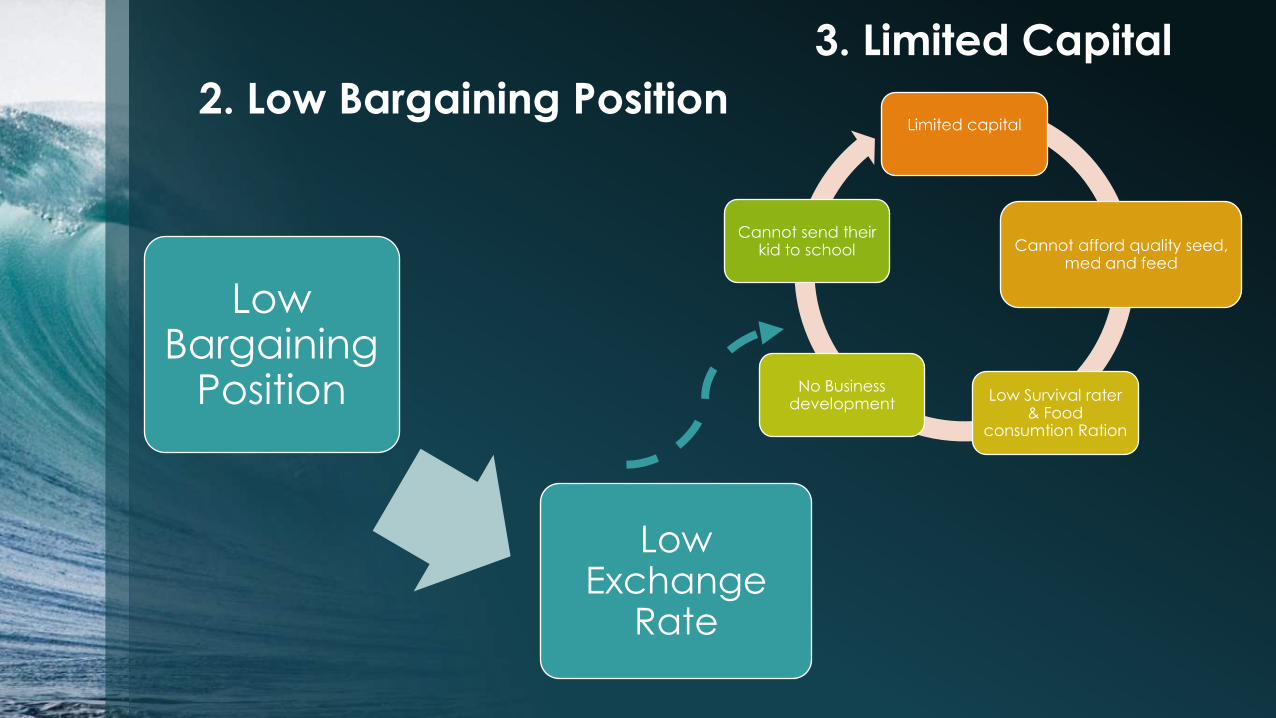
2. Low Bargaining Position
Low Bargaining
Position
Low Exchange
Rate
Limited capital
Cannot afford quality seed, med and feed
Low Survival rater & Food
consumtion Ration
No Business development
Cannot send their kid to school
3. Limited Capital
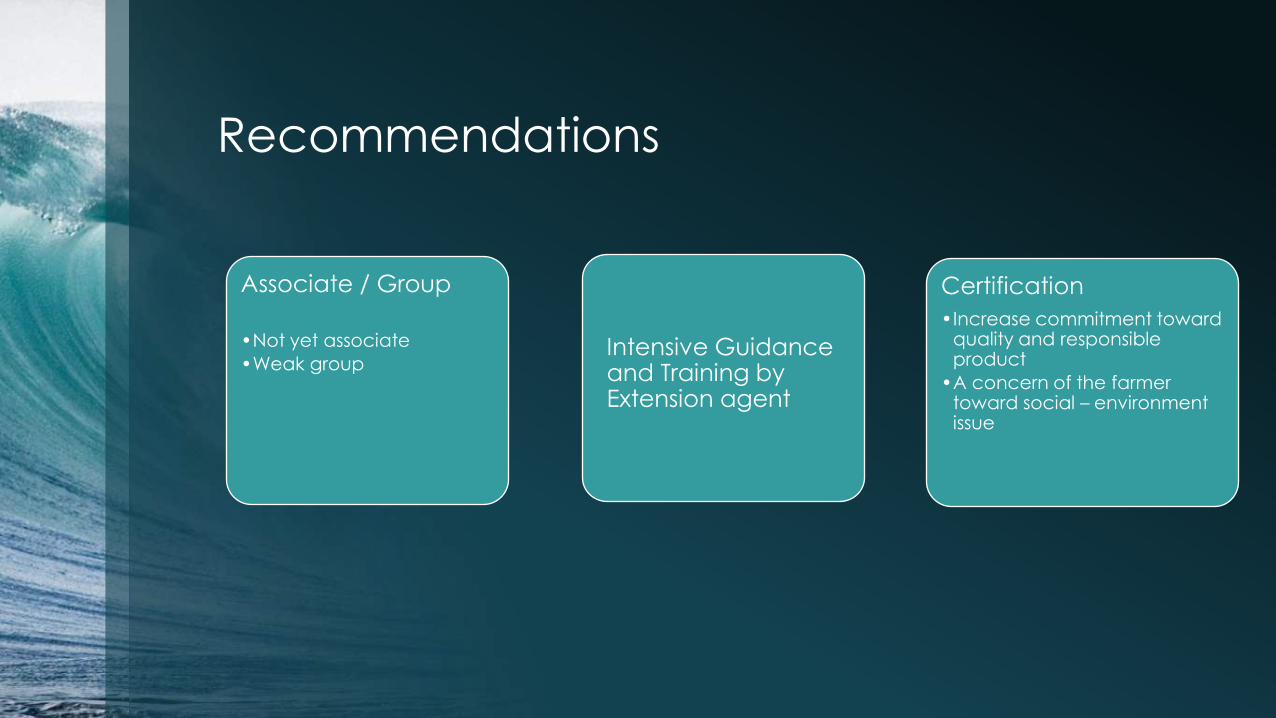
Recommendations
Associate / Group
•Not yet associate
•Weak group
Certification
•Increase commitment toward quality and responsible product
•A concern of the farmer toward social – environment issue
Intensive Guidance and Training by Extension agent
Credits
Special gratitude and appreciation for:
• Cut Desyana, S.Si., M.Mar.
• Farzah Sari, Phd.
who act as an exellent mentor and tutor for me.