Embed Size (px)
Citation preview
This is a repository copy of The Over-Education of UK Immigrants: Evidence from the Labour Force Survey.
White Rose Research Online URL for this paper:http://eprints.whiterose.ac.uk/9936/
Monograph:Lindley, J. (2006) The Over-Education of UK Immigrants: Evidence from the Labour Force Survey. Working Paper. Department of Economics, University of Sheffield ISSN 1749-8368
Sheffield Economic Research Paper Series 2006001
[email protected]://eprints.whiterose.ac.uk/
Reuse Unless indicated otherwise, fulltext items are protected by copyright with all rights reserved. The copyright exception in section 29 of the Copyright, Designs and Patents Act 1988 allows the making of a single copy solely for the purpose of non-commercial research or private study within the limits of fair dealing. The publisher or other rights-holder may allow further reproduction and re-use of this version - refer to the White Rose Research Online record for this item. Where records identify the publisher as the copyright holder, users can verify any specific terms of use on the publisher’s website.
Takedown If you consider content in White Rose Research Online to be in breach of UK law, please notify us by emailing [email protected] including the URL of the record and the reason for the withdrawal request.

Sheffield Economic Research Paper Series
SERP Number: 2006001
Jo Lindley* and Pam Lenton
The Over-Education of UK Immigrants: Evidence from the Labour Force Survey.
January 2006.
* Corresponding author:
Department of Economics
University of Sheffield
9 Mappin Street
Sheffield
S1 4DT
United Kingdom
www.shef.ac.uk/economics
1

Abstract
We investigate the incidence of over-education, as well as the effect on earnings, for
immigrants and natives drawn from the Labour Force Survey between 1993 and 2003.
This paper investigates whether immigrants are more or less likely to be over and under-
educated than are natives and if there is any evidence of economic assimilation in such
propensity differences. In addition we examine whether immigrants exhibit a larger or
smaller earnings for over-education compared to natives. We find that native born non-
whites and immigrants are more likely to be over-educated, even after conditioning on all
other socio-economic factors (including ethnicity and English speaking country of
origin). However, we also find evidence of assimilation in the incidence of immigrant
over-education towards that of natives. Finally, we find that over-education implies a
lower return to earnings for immigrants and non-white natives, compared to native born
whites. The largest loss in earnings due to over-education actually applies to white
education entrants, moreover we find no significant return to over-education for non-
white labour market entrants, once we distinguish between these two immigrant groups.
Keywords: over-education, earnings, immigrants, assimilation.
JEL Codes: J24, J7.
2

1. Introduction
A recent report by the Home Office suggested that the UK policy on immigration
�will introduce a simpler, clearer, more effective scheme for those wishing to come and
work here, focusing on the highly skilled migrants that can help us build our economy.�1
Indeed recent empirical evidence suggests that on average, immigrants do perform better
in the UK labour market in terms of higher employment and earnings than their native
born counterparts (Bell 1997; Clark and Lindley 2005). However ethnic differences still
exist, with non-white immigrants tending to perform worse, compared to both white
natives and white immigrants (Clark and Lindley 2005). Disadvantaged workers may
possess higher levels of education than is the requirement of their job simply because
they do not find employment in inappropriately skilled occupations. The basic
assumption of the human capital model is that individuals invest in education up to the
point where the marginal costs of and the benefits to education are equalized. However,
the amount of education required to maximize these returns are not so clear-cut for
immigrants because the returns to education are not apparent at the time of investment.
As a consequence immigrants may disproportionately experience over-education. This is
evident through a process of economic assimilation, whereby immigrants initially
experience higher over-education although this is eroded as they enhance their levels of
country specific human capital with time spent in the host country. Employers may not
value foreign qualifications equally to those attained in the UK. This provides a further
barrier to immigrants trying to attain employment (see Friedberg 2000 for a discussion).
Also immigrants may experience racial discrimination within the labour market.
Of course we may observe over-education without necessarily attributing this to
economic inefficiency. For example, there may be differences in the quality of schooling
between workers so that workers have the same level of schooling but some took longer
than others to acquire it. Also, some workers may have lower levels of schooling but
higher levels of job experience to compensate, so that it is skills rather than schooling that
should be compared. Finally, over-education may be a consequence of career mobility,
since some higher educated workers may be in the early stages of their career and
awaiting accelerated progression.
Previous evidence suggests that the consequences of over-education on earnings are
mostly negative. Empirical studies find that the returns to over-education, whilst positive,
are generally less than the returns to required education (Sicherman 1991; Sloane et al 1999; Dolton and Vignoles 2000; Hartog 2000). Hence there is a negative earnings effect
associated with not utilizing education fully. However, there have been few studies
investigating over-education amongst immigrant workers. One exception is the study by
Battu and Sloane (2004) who focus on ethnic differences. They find that workers from
different ethnic groups have varying levels of mismatch between education and
occupation and also that the holding of foreign qualifications increases the likelihood of
mismatch for members of some ethnic groups but reduce it for others. For non-whites,
1 The Home Secretary�s five year strategy for reform on immigration: `Controlling our Borders: Making
migration work for Britain� made in February 2005 available at
http://www.official-documents.co.uk/document/cm64/6472/6472.htm
3
they find evidence that the effect of an over-education on earnings is larger for
immigrants compared to those born in the UK.2
We add to this literature by focusing specifically on the over-education of immigrants.
This is undertaken in two ways. First, we investigate whether immigrants are more likely
to be over and under-educated than are natives and if there is any evidence of economic
assimilation towards that for natives. Second, we examine whether immigrants exhibit a
larger or smaller earnings differences as a consequence of over-education compared to
natives. A further novelty here is that our data set allows us to examine whether
differences exist between the returns to ethnic groups of immigrant workers. To do this
both over/under-education and earnings equations for immigrants and natives are
estimated paying particular attention to racial differences between ethnic minority
groups.
The paper proceeds as follows. The next section provides an overview of the data and
presents some descriptive statistics to compare the average schooling of immigrants and
natives. Section 3 describes the econometric models used in the paper, whilst sections 4
and 5 provide the empirical results for the incidence of over and under-education, as well
as the determinants of earnings, respectively. The final section concludes.
2. Data and descriptive statistics
The data are drawn from the Labour Force Survey (LFS), conducted by the Office for
National Statistics (ONS), and represent pooled cross-sections over the period 1993-
2003.3 One advantage of using the LFS is that is provides adequate sample sizes for
analyzing immigrant and ethnic minority groups. The LFS collects information on
earnings, employment and socio-economic characteristics such as age and martial status.
The survey also collects human capital information in the form of years of schooling and
the type of qualification held by the respondent. However, all foreign qualifications are
coded into the one category of `other� qualification regardless of the level. It is therefore
not possible to compare foreign qualifications to UK qualifications using this data set.
As a consequence, years of schooling are used as a measure for human capital throughout
this paper. This is defined here as `year left full time education� minus 5 years.
The sample consists of male and female full-time workers aged between 16 and 65 at
the time of interview.4 Despite the large sample size of the LFS, there is still a need in
some cases to combine ethnic groups. Black Caribbean and Black Other groups generally
both share a Caribbean background (see Holdsworth and Dale 1999). Accordingly, the
ethnicity categories used in this paper are: `White�, `Black Caribbean and Black Other�,
`Black African�, `Indian�, `Pakistani and Bangladeshi�, `Chinese and Other groups�. The
numbers of Chinese are too small to be reliable in most analyses and we therefore
2 Battu and Sloane (2004) estimate a separate wage equations for non-white immigrants and natives. They
do not include white immigrants as a separate group. They measure of over-education using a binary
variable based on the modal level of qualification by occupation. 3 Since 1992 the Quarterly LFS (QLFS) has been based on a systematic random sample design, which
makes it representative of the whole of Great Britain. Further details on the sampling methodology and
questionnaires are available from the ONS at http://www.ons.gov.uk. 4 All earnings data were deflated to a common year. All models are estimated using hourly wages and
obtained qualitatively similar results.
4

exclude them from our discussion. Overall after excluding observations with missing data
and trimming outliers the sample is made up of 242,617 native and 16,956 immigrant
men and women.5
Table 1 shows mean levels of schooling for immigrants and natives by ethnicity. The
final row shows that on average both natives and immigrants have around 15 years of
schooling. However, there are notable differences between ethnic groups. For natives,
most non-white groups possess higher levels of schooling than whites, with the exception
being Caribbean men who have the same average of 13 years. The same can be said for
immigrants where average schooling levels again exceed those of white natives.
Comparing non-white immigrants to their native counterparts shows that Indian men and
other ethnicity (which includes Chinese) tend to have more schooling on average. One
explanation is that higher levels of education are a consequence of disproportionately
higher unemployment propensities experienced by non-whites during the early 1990s
recession (see Lindley 2005). Table 1 also supports the need for the distinction between
white natives and white immigrants since the latter tend to have much higher schooling
levels.
Given that immigrants and non-white natives tend to possess more schooling on
average than white natives, it is interesting to see whether they are more or less likely to
be over-educated. Following the existing literature, a distributional measure of over and
under-education is used in this paper.6 A comparison is made between the mean level of
education for an occupation and that level actually attained. That is, required education is
equal to the mean level of schooling for that individual�s three-digit occupation.7 This is
calculated separately for a younger age group (16-35) and an older age group (36-65), as
well as by survey year in order to minimise bias associated with occupational skill
upgrading. Over-education is defined as one standard deviation above required education.
Similarly under-education is one standard deviation below required education.
The measure of over-education used throughout the paper has its drawbacks. First,
information on years of schooling is derived from the year that the individual left full
time education, although the year they started education is unknown. Also, a more
accurate measure for over-education could be attained if occupation data were available
at a more detailed level than the 3 digit. One advantage of this data however, is that it is
one of the only UK data sets that allows the comparison of immigrant schooling to that of
natives.
Table 2 shows the percentage of educational mismatch for immigrants and natives
again by ethnicity. The top panel refers to men and the lower panel to women. The final
rows show that male natives tend to be over-educated (37 percent) or have the required
level of schooling (36 percent), rather than under-educated (26 percent). Compared to
men, there are more females under-educated (38 percent) and less with the required
education (29 percent).
Clearly, immigrants are more likely to be over-educated (63 percent compared to 37
percent for native men) and less likely to be have the required schooling and under-
5 Trimming the top and bottom 1 percent of the earnings distribution involved a loss of 7624 observations
from our sample. 6 A self assessed measure for over-education is not available from the QLFS. 7 All models are estimated using a modal measure of required education and obtained qualitatively similar
results.
5

educated compared to white natives. Furthermore, immigrants are generally more likely
to be over-educated than their own ethnic native-born counterparts, with non-whites
displaying very high percentages. At the other end of the spectrum most immigrants are
less likely to be under-educated. In short, Table 2 suggests that immigrants generally
have a much higher incidence of over-education compared to natives, although there is an
extra negative effect associated with being non-white.
3. The econometric modelling
Following the existing literature on mismatch between education and occupation, our
econometric model incorporates a three-regime multinomial logit specification.8 The base
category consists of full time workers who have the required level of schooling for their
own occupation. That is their actual schooling level is equal to the mean schooling level
for their own three-digit occupation. In addition there are workers who have more
schooling (over-educated) and workers who have less schooling (under-educated), than
the mean for their own three-digit occupation. These three alternative regimes are of
course mutually exclusive.
The latent variable represents the worker being in any one regime. This takes one
of the three discrete values, 0, 1 and 2 for required, over-educated and under-educated
respectively. A set of typical controls are included (size of firm, region of residence,
marital status, presence of children and age), as well as ethnicity and immigrant
assimilation variables such as arrival cohort and years since migration.
*
mS
9 A foreign
schooling dummy variable is also included, as well as a dummy variable indicating
whether English is generally spoken in the country of origin.10
We also include the
national unemployment rate at the time of entry into the UK labour market in order to
detect any economic scarring effects on the incidence of over and under required
schooling. For natives and immigrants who arrived in the UK as children (and therefore
directly into the UK education system) this is the unemployment rate for the year the
worker left full time education. For immigrants who arrived directly into the UK labour
market this is the unemployment rate during the year of arrival.
To compare the likelihood of required, under and over-education between immigrants
and natives our multinomial equation is first estimated on a pooled sample of immigrants
and natives, although separately for whites and non-whites as well as for men and
women. Following this, separate equations are estimated for immigrants and natives so
that parameters can be compared across immigrant groups.
To assess the effect of schooling on earnings, the following earnings equation is
estimated:
(1) iUOR
kiki SSSXY εγγγβ ++++= 321
8 We find that our results are qualitatively robust to the choice of error structure implied by the multinomial
logit model when compared to an ordered logit. A full set of estimates are available from the authors on
request. 9 See Dolton and Silles (2001) for a discussion on the determinants of over-education. 10 See http://www.aneki.com/english.html for a list of English speaking countries.
6

where Yi are log gross weekly earnings and Xik is a vector of k covariates containing the
usual socio-economic characteristics (size of firm, region of residence, occupation,
marital status, age, ethnicity, English speaking country of origin and immigrant arrival
cohorts). This is referred to as the over-required and under-required (ORU) specification
by Hartog 1997; Groeneveld and Hartog 2004, where human capital is measured using
required education (namely the mean schooling years per three digit occupation of
employment) denoted here as SR, as well as variables to measure the extent of over-
required SO and under-required SU
education. Actual years of schooling S is decomposed
into its composite demand side components
S = SR + SO - SU (2)
and SO = S - SR
if S > SR and SO
= 0 otherwise (3)
and SU = SR
� S if S < SR and SU
= 0 otherwise (4)
Hence け1 measures the return to required education and therefore the return to an extra
year of schooling for an individual with the required level of schooling. In addition, け2
measures the return to an extra year of schooling for an over-educated individual. If け2 >0
this suggests that an over-educated worker will exhibit a higher return than a worker with
required schooling employed in their own occupation. If け1 > け2 then an over-educated
worker will have a smaller return than a worker with required schooling and the same
level of schooling as themselves employed elsewhere. Similarly, け3 measures the return to
schooling for an under-educated person. One would expect け3 <0 since such a worker will
exhibit lower returns than all workers with the required level (within their own
occupation and those who have the same level as schooling as themselves).11
One-digit
occupation dummies are also included in the specification and equation (1) is estimated
separately for white natives, white immigrants, non-white natives and also non-white
immigrants.
We also compare immigrants who enter the UK labour market, having completed
their education at some time in the past, with those who arrive to complete their
education in the UK and subsequently enter the labour market. We call this first group
�labour market entrants� and the latter group �education entrants�.12
Note that the group
of education entrants includes foreign-born children who arrive with their parents as well
as adults who arrive to undertake education in the UK. Again all equations are estimated
separately for men and women.
Finally, we make no attempt to correct for employment selection bias for two reasons.
First, corrected estimates tend to rely heavily upon, often arbitrary, instruments used to
11 The ORU model provides an alternative to the Mincer `human capital� approach. The Mincer approach
assumes that only the human capital variables matter (ie actual schooling). The ORU approach
accommodates the Mincer equation as a special case when け1 = け2 = -け3 in equation (1). When these
equalities do not hold this allows for demand side variables to play a role through required schooling. An
extreme case would be when only required schooling would be valued regardless of the specific schooling
attainment of the worker; け2 = け3 = 0 in equation (1). This case has been linked to the `job competition�
model where marginal productivity resides in the job rather than the worker (productivity and wages are
assumed fixed in relation to specific jobs). 12 A labour market entrant arrived in the UK after or during the year they left full time education.
Contrariwise an education entrant entered the UK before they left full time education.
7
identify the earnings equations. Second the component of the immigrant-native earnings
differential that can be attributed to differences in employment selectivity is likely to be
negligible.13
Similarly, we make no attempt to control for endogenous education choices.
A valuable literature has emerged that evaluates the accuracy of OLS coefficients against
results derived from careful elimination of a range of biases, including measurement error
and endogenous education shocks, Dearden (1999a, 1999b). The conclusion of this
literature is that failure to control for ability and family background characteristics that
influence education choices will bias OLS estimated upwards, while measurement error
leads to a downward bias. Hence OLS estimates provide quite reasonable estimates of the
true returns to education.
4. The Determinants of Required, Over and Under-Edcuation.
The key coefficients and marginal effects for the multinomial logits are contained in
Tables 3 and 4, for men and women separately.14
A full set of estimates are available
from the authors on request. Table 3 estimates a single multinomial equation whilst Table
4 estimates the multinomial model separately for immigrants and natives. The default
category consists of white natives with only British attained schooling, unmarried, has no
children, employed in a firm with less than 25 employees, lives in the South East and is
not employed in the manufacturing sector.
In Table 3, all non-whites, with the exception of black Caribbean�s, are more likely to
be over-educated than whites. The largest effect is found for African males who are 28
percent more likely to be over-educated than white males. Possessing some foreign
schooling also has a positive effect on being overeducated. Conditioning on all other
socio-economic variables, including ethnicity, immigrants are more likely to be over-
educated, with cohort effects providing most of the explanatory power in the model. Men
who arrived in the UK in 2000-3 are found to be 29 percent more likely to be over-
educated than the base, an increase of 11 percentage points higher than in the previous
decade and some 19 percentage points higher than in the 1980s. The `years since
migration� variable indicates that immigrants, although more likely to be over-educated
than natives on entry to the UK labour market, exhibit an erosion of this differential with
time spent in the UK. Hence there is some evidence here of assimilation in over-
education and that higher skilled immigrant workers reduce their likelihood of over-
education with duration in the UK. The unemployment rate on entry to the labour
market has the expected positive sign, which provides some evidence of detrimental
scarring on over-education incidence.
For under-education, only Caribbean men and Indians are significantly less likely
to be under-educated compared to whites. Furthermore, immigrant cohort effects are
13 Blackaby et al. (2002) correct for selectivity bias and observe changes in the white/non-white earnings
differential of around one percent. 14 A likelihood ratio test (test statistic of 1301.55) rejects the null hypothesis of common slope coefficients
between men and women. Hence the structural determinants of mismatch are gender specific. The
Hausman test for the independence of irrelevant alternatives (IIA) rejects the null that the difference in
coefficients across the three outcomes is significantly equal to zero. Hence the IIA assumption is not
violated.
8
generally not significant with only immigrants arriving before the 1950s being more
likely to be under-educated, compared to natives. The `years since migration� variable is
not statistically significant which suggests that observed immigrant differentials are not
eroded over time.
Turning now to the separate equation estimates for immigrants and natives, contained
in Table 4.15
Men are detailed in the first panel and therefore are discussed first.
Comparing the parameters across the two equations, the ethnicity variables show
Caribbean men to be less likely, whilst all other non-whites are more likely, to be over-
educated compared to whites. The immigrant arrival cohort variables are again positive
and significant which supports the existence of detrimental immigrant cohort quality
effects to those who arrived later than 1959. To say something about assimilation, we can
compare the effect of age.16
Immigrants demonstrate a slightly steeper profile than
natives that reaches a maximum at 58 years old, compared to 32 for natives. This
suggests that the initial immigrant-native differential observed in Table 3 may not be
eroded over time because age profiles are generally flatter for natives. Immigrants that
arrived into the UK labour market are 18 percent less likely to be over-educated
compared to those who arrived into the education system, whilst having some degree of
foreign schooling and arriving in a period of high unemployment has a positive effect of
around 3 percent.
For under-education, only native born Caribbean men are less likely to be under-
educated compared to white native men. All non-white immigrants, with the exception of
Africans, are less likely to be under-educated compared to their white counterparts. The
arrival cohort and age variables are now statistically insignificant for immigrant males.
Immigrants that arrived into the UK labour market are 12 percent more likely to be over-
educated compared to those who arrived into the education system.
The second panel in Table 4 reveals that for female natives, non-white women are
generally more likely to be over-educated compared to whites. However, for immigrant
women, being from the Caribbean reduces the probability of being overeducated whilst
being Indian or from the �other ethnic� group increases the probability of being under-
educated compared to white immigrants.
As with men, immigrant arrival cohort effects indicate higher incidence of over-
education to the more recent arrival cohorts and there is little evidence of assimilation,
since age is barely statistically significant for immigrants. For under-education, only
immigrants indicate significant ethnicity effects (negative for Indian women), as well as
immigrant cohort effects that suggest detrimental effects for those who arrived more
recently (except for those who arrived 2000-3), compared to those who arrived before
1959. Being labour market entrant decreases (increases) the likelihood of over-education
15 Likelihood ratio tests (test statistics of 269.53 for men and 120.38 for women) reject the null hypotheses
of common slope coefficients between immigrants and natives. Hence the structural determinants of
mismatch are immigrant status specific. Again Hausman tests show that the IIA assumption is not violated
in both the native and immigrant equations. 16 Given that there is a linear relationship between survey year (Y), arrival cohort (C) and years since
migration (M), whereby Y=C+M, the years since migration variable is now excluded from the immigrant
equation. In the separate equation model assimilation can be measured by comparing the respective age
profiles of immigrants and natives. This definition of economic assimilation is preferred since it allows
immigrants and natives to be compared at the same point in their life cycle.
9

(under-education) and there is evidence from the unemployment on entry of detrimental
scarring effects.
5. The effect of over and under-education on earnings.
To assess the effect of over and under-education on earnings, standard earnings
equations are estimated with human capital measured through required education (mean
schooling at the three-digit occupation level), as well as over-required education and
under-required education as defined in equations (2) to (4). Equation (1) is estimated
separately for white natives, non-white natives, white immigrants and non-white
immigrants.17
The default category consists of an unmarried, non-home owner, who has
no children, is employed in a firm with less than 25 employees, lives in the South East
and is not employed in the manufacturing sector. There are the added defaults of being
Caribbean in the non-white equations, arriving in the UK before 1959 in the immigrant
equations and being born in Europe in the white immigrant equation.
The estimates are presented in Table 5 and only the key results concerning returns to
schooling and English language are discussed. For men, over and above all other
characteristics (including occupation, ethnicity and English spoken in the country of
origin) the returns to required education are higher for non-white immigrants (8 percent)
and lower for white immigrants (5 percent), compared to natives (7 percent).18
The effect
of over- education is positive and significant across all groups, although the coefficients
are smaller than for required education in all cases as we expect. Therefore, an over-
educated worker earns more than a worker with the required schooling level (employed
in their own occupation) but less than they could earn should their actual and required
schooling be equalized.
Comparing across groups, the over-education return is largest for white natives at 2.5
percent which is consistent with previous studies (Sloane et al 1999; Groot and Maassen
van den Brink 2000). The return is smaller for non-white natives (1.5 percent) and the
smallest return for immigrants (0.9 percent for both white and non-white immigrants).
Over-educated immigrants therefore do not earn that much more than those immigrants
with the required schooling within their own occupation, although they could earn
substantially more should they attain a match between required and actual schooling.
The negative earnings effect associated with being under-educated is around 4 percent for
all groups.
For women we find that all returns to all levels of schooling are larger than those for
men. However, the returns to required education are larger for white women (9 percent)
than for non-whites (5.5 percent). Comparing over-education returns across the groups,
the largest return is for white natives (3.2 percent), whilst the smallest is for non-white
immigrants (0.8 percent). Non-white natives and white immigrants exhibit similar over-
education penalties (2.5 and 0.2 percent respectively). Hence the over-education returns
to white immigrants and non-white natives are similar to those of white natives. It is
17 Chow tests (test statistics of 69.22 for men and 23.60 for women) reject the null hypotheses of common
slope coefficients between white natives, white immigrants, non-white immigrants and non-white natives.
Hence the structural determinants of earnings differ across immigrant status and for whites and non-whites. 18 Where the percentages are calculated using [exp(く)-1] x 100. We acknowledge that some differences are
small and therefore may not be statistically significant.
10

female non-white immigrants that exhibit the smallest returns (similar to those of
immigrant men). The lower earnings associated with being under-educated is generally
smaller for non-white natives and immigrants than for white native females.
Including whether English is spoken in the country of origin shows a positive return
on earnings of around 4 percent for white men and women, although this effect is not
statistically significant for non-white immigrants.
In short, compared to matched immigrants employed in their own three-digit
occupation, the return to over-educated immigrants is not that much more (0.9 percent for
male white and non-white immigrants). Over-educated natives earn comparatively more
in this regard (around 2.5 percent for white native men). However this implies that non-
white immigrants could increase their return to schooling by up to 6.9 percentage points,
compared to 4.4 percentage points for white native men if they could obtain a job
appropriate to their education.19
So over-education involves a larger loss of earnings for
non-white natives and immigrants (except non-white native females) in terms of what
they would earn should they match actual and required schooling.
For white immigrant men (women) the wage loss associated with over-education is
4.6 (6.5) percentage points relative to when they equalise required and actual schooling.
This is lower than that for non-white immigrants and around the same as that for white
natives at 4.4 (6.1) percentage points for men (women). Given that non-white native men
have been educated in the UK and still experience lower earnings for over-education of
6.8 percentage points, this provides some evidence of discriminatory factors over and
above those picked up from the conventional ethnic controls.
Finally, Table 6 presents the key results for white and non-white immigrants
distinguishing between `labour market� entrants who possess no formal British schooling
and `education entrants� who arrive into the UK education system and subsequently enter
into the labour market with some British schooling.20
The sample of immigrants is made
up of around 50 percent of each.
Comparing the required education returns across groups, these are generally higher
for non-white men and all women. The high return to required education of 7.8 percent
for non-white immigrant men, seen in Table 5, is being driven by non-white labour
market entrants who in fact have no formal British schooling (8.5 percent in Table 6).
Speaking English in the country of origin only has a significant positive return of
around 8 percent for white labour market entrants and surprisingly has a negative return
of 1 percent for white female education entrants.
Comparing the difference between over-education and required education, white
labour market entrants could increase a higher return to schooling should they attain a
match (4.1 and 6.1 percent for men and women), compared to non-white education
entrants (3.8 percent for men and women). Therefore, white immigrants may be
experiencing a large over-education effect as a consequence perhaps of under-valued
foreign qualifications, but this does not apply to non-whites. It is only non-whites with
some British schooling that demonstrate significant over-education penalties. Non-whites
who arrived directly into the labour market in fact obtain no return to their extra years of
19 For non-white immigrant men the return to required schooling is 0.78, whilst the return to over-required
schooling is 0.009. Hence the increase in the return from an over-educated non-white immigrant to a one
with the required level of schooling is 6.9 percent. 20 A full set of results is available from the authors on request.
11

education at all. For women, white education entrants experience the largest over-
education effects (6.9 percent).
6. Conclusions
In this paper we firstly investigate whether immigrants are more or less likely to be
over and under-educated in the labour market and whether there is evidence of economic
assimilation. Our data allow us to distinguish between ethnic groups within our
immigrant sample. Secondly, we analyse the earnings return to required, over and under-
education levels and for separate ethnic groups within our immigrant set. Finally, we
further divide our immigrants into those with and without time spent in the British
education system. The results in this paper show that ceteris paribus, non-white natives and all
immigrants are more likely to be over-educated compared to white natives, especially
Africans and Indians of both genders along with Pakistani/Bangladeshi women. The
single equation estimates of required, under and over-education suggest that immigrants
initially experience higher over-education but that this difference is eroded with time
spent in the UK. Hence imposing the restriction that the determinants of the model are the
same for immigrants and natives provides the optimistic picture of immigrant
assimilation in over-education.
If we are to assume that the determinants of required, over and under-education differ
for immigrants and natives, as the statistical tests undertaken in this paper suggest, then a
less optimistic picture emerges. Comparing age profiles across groups suggests a flatter
curve for natives and therefore that there is little assimilation in the initial over-education
propensities over time. Furthermore, ethnic differences between immigrants are still
apparent, with Africans and Indians still demonstrating higher probabilities of over-
education compared to white immigrants. In terms of the effect of over-education on earnings, returns to required schooling are
generally higher for immigrant men and white immigrant women. This implies that the
negative return associated with being over-educated is larger for immigrants compared to
that for native white men. There is some evidence that these lower returns may be
because of under-valued foreign schooling for white immigrants, but not for non-white
immigrants. Non-whites who arrived directly into the labour market in fact obtain no
return to their extra years of education at all, once immigrants are analysed separately
from those who arrived directly into the British education system.
12

REFERENCES
Battu et al (2000), Over-Education and Crowding Out in Britain, in L Boghans and A. de
Grip (eds), The Overeducated Worker, Edward Elgar, Cheltenham, 157-174.
Battu H. and Sloane, P.J. (2004), Over-Education and Ethnic Minorities in Britain, The
Manchester School, 72, No 4, 535-559.
Bell, B.D. (1997), The Performance of Immigrants in the United Kingdom: Evidence
from the GHS, Economic Journal, 107, 333-345.
Blackaby, D.H., D.G. Leslie, P.D. Murphy and N.C. O�Leary (2002), White/Ethnic
Minority Earnings and Employment Differentials in Britain: Evidence from the LFS,
Oxford Economic Papers, 54, 270-279.
Clark K. and Lindley, J. (2005), Immigrant Labour Market Assimilation and Arrival
Effects: Evidence from the Labour Force Survey, University of Sheffield, Department of
Economics working paper 2005/05.
Dearden, L. (1999a), The effects of Families and Ability on Men�s Education and
Earnings in Britain Labour Economics, Vol. 6, pp. 551-567.
Dearden, L. (1999b), Qualifications and Earnings in Britain: How Reliable are
Conventional OLS estimates of the Returns to Education, IFS Working Paper No 99/7.
13

Dolton and Silles (2001), Overeducation in the UK Graduate Labour Market: Some
evidence using Alumni data, CEE discussion Paper 9, London School of Economics.
Dolton and Vignoles (2000), Incidence and Effects of Overeducation in the UK Graduate
Labour Market, Economics of Education Review, 19, 2, 179-198.
Friedberg, R. (2000), You can�t take it with you? Immigrant Assimilation and the
Portability of Human Capital, Journal of Labor Economics, 18, No 2, 221-251.
Groeneveld S and Hartog J (2004) Overeducation, wages and promotions within the firm
Labour economics, 11, 701-14
Groot and Maassen van den Brink (2000) Overeducation in the Labour Market: A Meta
Analysis, in: H. Oosterbeek ed. The Economics of Over- and Underschooling. Special
issue of Economics of Education Review, 19, 2, 149-158.
Hartog, J. (1997), On the returns to education: wandering along the hills of our land,
Paper presented at Applied Econometrics Association, Maastricht.
Hartog, J. (2000), Over-education and Earnings: Where Are We, Where should we Go?
Economics of Education Review, 19, 131-147.
14

Holdsworth, C. and Dale, A. (1999) Ethnic homogeneity and family formation: Evidence
from the 1991 Household SAR, University of Manchester, CCSR Occasional Paper No 7.
Lindley, J.K., (2005), Explaining Ethnic Unemployment and Economic Activity:
Evidence from the Labour Force Survey, Bulletin of Economic Research, 57.
McFadden (1973), Conditional Logit Analysis of Qualitative Choice Behavior, in P.
Zarembka (ed.), Frontiers in Econometrics, 105-142, Academic Press: New York.
Sicherman (1991) Overeducation in the Labour Market, Journal of Labour Economics, 9,
No 2, 101-122.
Sloane, P, Battu, H. and Seaman, P. (1999), Over-education, Under-education and the
British Labour Market, Applied Economics, 31, No 11, 1437-1454.
15

Table 1. Mean schooling levels for immigrants and natives by ethnic group
Men Women Native Immigrant Native Immigrant White 13 15 13 15
(148,343) (5,542) (90,825) (4,684)
Car/oth 13 13 14 13
(657) (473) (678) (501)
African 17 17 16 16
(109) (379) (83) (321)
Indian 15 16 15 15
(427) (1,427) (356) (915)
PB 15 15 15 15
(215) (681) (143) (162)
Other 14 16 15 16
(432) (1,011) (349) (860)
Total 15 15 15 15
(150,183) (9,513) (92,434) (7,443)
159696 99,877
Notes: Data are unweighted. Sample size in parentheses
Table 2. Educational mismatch (percent).
Men
Over-Educated
Required
Under-Educated
N
Natives Immigrants Natives Immigrants Natives Immigrants
White 37 56 36 21 26 23 153,885
Car/oth 41 63 31 22 28 15 1,130
African 79 84 12 8 9 9 488
Indian 66 74 20 15 14 11 1,854
PB 61 63 24 19 15 18 896
Other 54 74 21 13 25 14 1,443
Total 37 63 36 19 26 19 159,696
Women
Over-Educated
Required
Under-Educated
N
Natives Immigrants Natives Immigrants Natives Immigrants
White 38 61 29 18 33 21 95,509
Car/oth 47 53 23 23 30 24 1,179
African 61 77 18 13 20 11 404
Indian 63 70 17 17 20 13 1,271
PB 52 58 29 18 19 24 305
Other 56 72 18 14 26 14 1,209
Total 38 63 29 18 33 19 99,877
Notes: Data are unweighted.
16
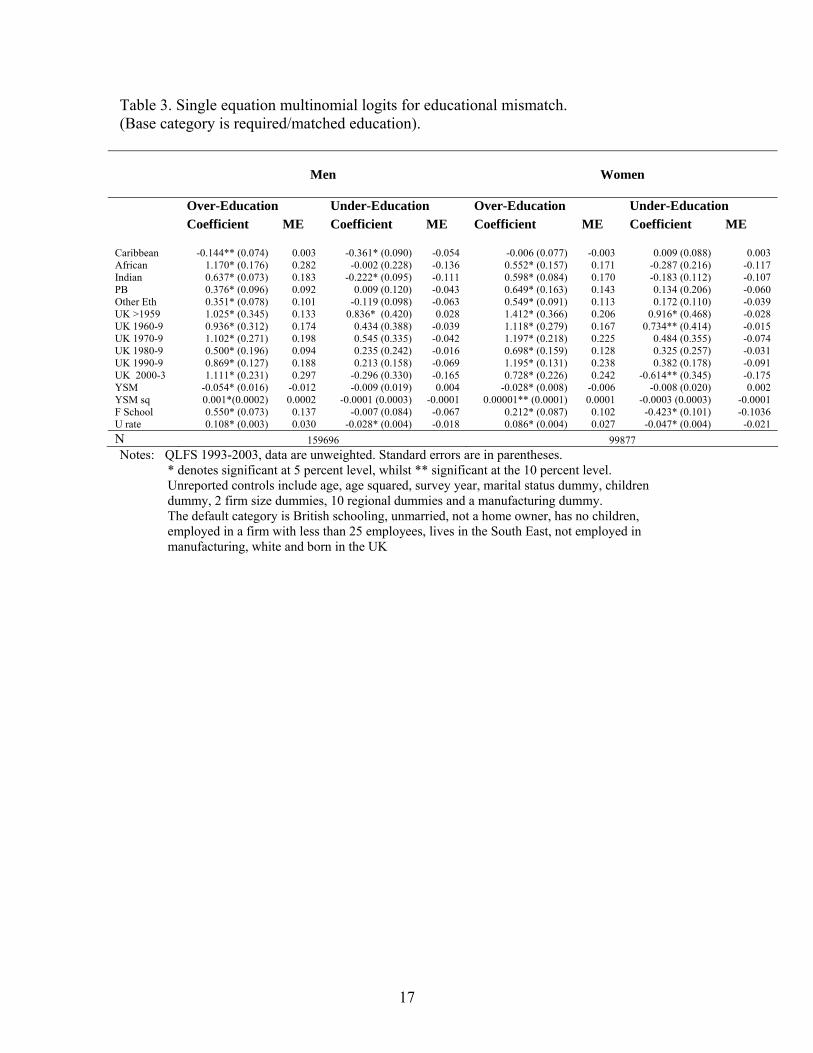
Table 3. Single equation multinomial logits for educational mismatch.
(Base category is required/matched education).
Men
Women
Over-Education Under-Education Over-Education Under-Education
Coefficient ME Coefficient ME Coefficient ME Coefficient ME
Caribbean -0.144** (0.074) 0.003 -0.361* (0.090) -0.054 -0.006 (0.077) -0.003 0.009 (0.088) 0.003
African 1.170* (0.176) 0.282 -0.002 (0.228) -0.136 0.552* (0.157) 0.171 -0.287 (0.216) -0.117
Indian 0.637* (0.073) 0.183 -0.222* (0.095) -0.111 0.598* (0.084) 0.170 -0.183 (0.112) -0.107
PB 0.376* (0.096) 0.092 0.009 (0.120) -0.043 0.649* (0.163) 0.143 0.134 (0.206) -0.060
Other Eth 0.351* (0.078) 0.101 -0.119 (0.098) -0.063 0.549* (0.091) 0.113 0.172 (0.110) -0.039
UK >1959 1.025* (0.345) 0.133 0.836* (0.420) 0.028 1.412* (0.366) 0.206 0.916* (0.468) -0.028
UK 1960-9 0.936* (0.312) 0.174 0.434 (0.388) -0.039 1.118* (0.279) 0.167 0.734** (0.414) -0.015
UK 1970-9 1.102* (0.271) 0.198 0.545 (0.335) -0.042 1.197* (0.218) 0.225 0.484 (0.355) -0.074
UK 1980-9 0.500* (0.196) 0.094 0.235 (0.242) -0.016 0.698* (0.159) 0.128 0.325 (0.257) -0.031
UK 1990-9 0.869* (0.127) 0.188 0.213 (0.158) -0.069 1.195* (0.131) 0.238 0.382 (0.178) -0.091
UK 2000-3 1.111* (0.231) 0.297 -0.296 (0.330) -0.165 0.728* (0.226) 0.242 -0.614** (0.345) -0.175
YSM -0.054* (0.016) -0.012 -0.009 (0.019) 0.004 -0.028* (0.008) -0.006 -0.008 (0.020) 0.002
YSM sq 0.001*(0.0002) 0.0002 -0.0001 (0.0003) -0.0001 0.00001** (0.0001) 0.0001 -0.0003 (0.0003) -0.0001
F School 0.550* (0.073) 0.137 -0.007 (0.084) -0.067 0.212* (0.087) 0.102 -0.423* (0.101) -0.1036
U rate 0.108* (0.003) 0.030 -0.028* (0.004) -0.018 0.086* (0.004) 0.027 -0.047* (0.004) -0.021
N 159696 99877 Notes: QLFS 1993-2003, data are unweighted. Standard errors are in parentheses.
* denotes significant at 5 percent level, whilst ** significant at the 10 percent level.
Unreported controls include age, age squared, survey year, marital status dummy, children
dummy, 2 firm size dummies, 10 regional dummies and a manufacturing dummy.
The default category is British schooling, unmarried, not a home owner, has no children,
employed in a firm with less than 25 employees, lives in the South East, not employed in
manufacturing, white and born in the UK
17
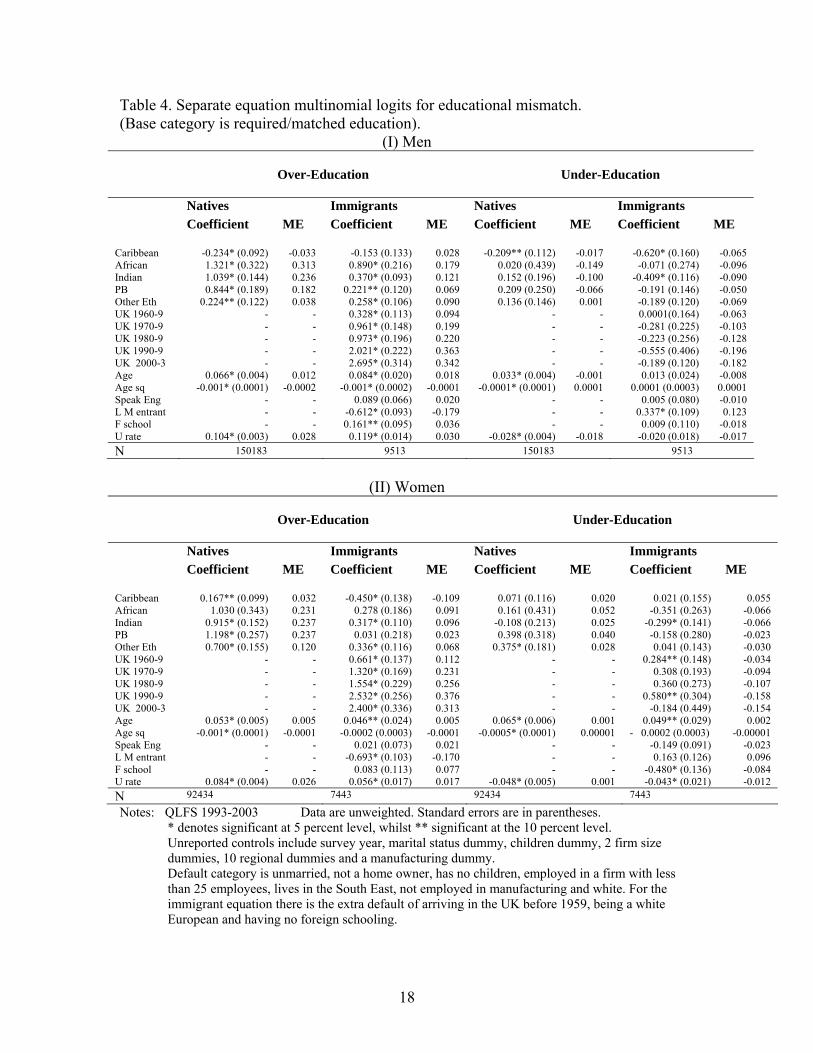
Table 4. Separate equation multinomial logits for educational mismatch.
(Base category is required/matched education).
(I) Men
Over-Education
Under-Education
Natives Immigrants Natives Immigrants
Coefficient ME Coefficient ME Coefficient ME Coefficient ME
Caribbean -0.234* (0.092) -0.033 -0.153 (0.133) 0.028 -0.209** (0.112) -0.017 -0.620* (0.160) -0.065
African 1.321* (0.322) 0.313 0.890* (0.216) 0.179 0.020 (0.439) -0.149 -0.071 (0.274) -0.096
Indian 1.039* (0.144) 0.236 0.370* (0.093) 0.121 0.152 (0.196) -0.100 -0.409* (0.116) -0.090
PB 0.844* (0.189) 0.182 0.221** (0.120) 0.069 0.209 (0.250) -0.066 -0.191 (0.146) -0.050
Other Eth 0.224** (0.122) 0.038 0.258* (0.106) 0.090 0.136 (0.146) 0.001 -0.189 (0.120) -0.069
UK 1960-9 - - 0.328* (0.113) 0.094 - - 0.0001(0.164) -0.063
UK 1970-9 - - 0.961* (0.148) 0.199 - - -0.281 (0.225) -0.103
UK 1980-9 - - 0.973* (0.196) 0.220 - - -0.223 (0.256) -0.128
UK 1990-9 - - 2.021* (0.222) 0.363 - - -0.555 (0.406) -0.196
UK 2000-3 - - 2.695* (0.314) 0.342 - - -0.189 (0.120) -0.182
Age 0.066* (0.004) 0.012 0.084* (0.020) 0.018 0.033* (0.004) -0.001 0.013 (0.024) -0.008
Age sq -0.001* (0.0001) -0.0002 -0.001* (0.0002) -0.0001 -0.0001* (0.0001) 0.0001 0.0001 (0.0003) 0.0001
Speak Eng - - 0.089 (0.066) 0.020 - - 0.005 (0.080) -0.010
L M entrant - - -0.612* (0.093) -0.179 - - 0.337* (0.109) 0.123
F school - - 0.161** (0.095) 0.036 - - 0.009 (0.110) -0.018
U rate 0.104* (0.003) 0.028 0.119* (0.014) 0.030 -0.028* (0.004) -0.018 -0.020 (0.018) -0.017
N 150183 9513 150183 9513
(II) Women
Over-Education
Under-Education
Natives Immigrants Natives Immigrants
Coefficient ME Coefficient ME Coefficient ME Coefficient ME
Caribbean 0.167** (0.099) 0.032 -0.450* (0.138) -0.109 0.071 (0.116) 0.020 0.021 (0.155) 0.055
African 1.030 (0.343) 0.231 0.278 (0.186) 0.091 0.161 (0.431) 0.052 -0.351 (0.263) -0.066
Indian 0.915* (0.152) 0.237 0.317* (0.110) 0.096 -0.108 (0.213) 0.025 -0.299* (0.141) -0.066
PB 1.198* (0.257) 0.237 0.031 (0.218) 0.023 0.398 (0.318) 0.040 -0.158 (0.280) -0.023
Other Eth 0.700* (0.155) 0.120 0.336* (0.116) 0.068 0.375* (0.181) 0.028 0.041 (0.143) -0.030
UK 1960-9 - - 0.661* (0.137) 0.112 - - 0.284** (0.148) -0.034
UK 1970-9 - - 1.320* (0.169) 0.231 - - 0.308 (0.193) -0.094
UK 1980-9 - - 1.554* (0.229) 0.256 - - 0.360 (0.273) -0.107
UK 1990-9 - - 2.532* (0.256) 0.376 - - 0.580** (0.304) -0.158
UK 2000-3 - - 2.400* (0.336) 0.313 - - -0.184 (0.449) -0.154
Age 0.053* (0.005) 0.005 0.046** (0.024) 0.005 0.065* (0.006) 0.001 0.049** (0.029) 0.002
Age sq -0.001* (0.0001) -0.0001 -0.0002 (0.0003) -0.0001 -0.0005* (0.0001) 0.00001 - 0.0002 (0.0003) -0.00001
Speak Eng - - 0.021 (0.073) 0.021 - - -0.149 (0.091) -0.023
L M entrant - - -0.693* (0.103) -0.170 - - 0.163 (0.126) 0.096
F school - - 0.083 (0.113) 0.077 - - -0.480* (0.136) -0.084
U rate 0.084* (0.004) 0.026 0.056* (0.017) 0.017 -0.048* (0.005) 0.001 -0.043* (0.021) -0.012
N 92434 7443 92434 7443
Notes: QLFS 1993-2003 Data are unweighted. Standard errors are in parentheses.
* denotes significant at 5 percent level, whilst ** significant at the 10 percent level.
Unreported controls include survey year, marital status dummy, children dummy, 2 firm size
dummies, 10 regional dummies and a manufacturing dummy.
Default category is unmarried, not a home owner, has no children, employed in a firm with less
than 25 employees, lives in the South East, not employed in manufacturing and white. For the
immigrant equation there is the extra default of arriving in the UK before 1959, being a white
European and having no foreign schooling.
18

Table 5. Key results for the effect of mismatch on earnings.
(I) Men
Natives
Immigrants
Whites Non-Whites Whites Non-Whites
Coefficient SE Coefficient SE Coefficient SE Coefficient SE
R education 0.069* 0.001 0.070* 0.011 0.054* 0.005 0.078* 0.007
O education 0.025* 0.001 0.015* 0.005 0.009* 0.003 0.009* 0.003
U education -0.036* 0.001 -0.037* 0.016 -0.044* 0.007 -0.037* 0.007
Speak Eng - - - - 0.040* 0.013 0.012 0.018
N 148343 1840 5542 3971
(II) Women
Natives
Immigrants
Whites Non-Whites Whites Non-Whites
Coefficient SE Coefficient SE Coefficient SE Coefficient SE
R education 0.093* 0.002 0.055* 0.012 0.085* 0.007 0.060* 0.008
O education 0.032* 0.001 0.025* 0.005 0.020* 0.003 0.008* 0.003
U education -0.054* 0.002 -0.001 0.014 -0.031* 0.007 -0.015* 0.007
Speak Eng - - - - 0.037* 0.013 -0.002 0.017
N 148343 1840 5542 3971
Notes: QLFS 1993-2003. Data are unweighted.
* denotes significant at 5 percent level, whilst ** significant at the 10 percent level.
Unreported controls include survey year, marital status dummy, children dummy, 2 firm size
dummies, 10 regional dummies, a manufacturing dummy, eight occupational dummies, four
ethnicity dummies, age, age squared and five immigrant arrival cohort dummies.
The default category is unmarried, employed in a firm with less than 25 employees, lives in the
South East, not employed as a manager in manufacturing. For the non-white equations there is the
extra default of being Caribbean and for the white immigrant equation being European white. For
the immigrant equation there is the extra default of arriving in the UK before 1959.
19

Table 6. Key results for the effect of mismatch on immigrant earnings.
(I) Men
Labour Market Entrants:
Arrived UK>=Year left Full Time Education
Education Entrants:
Arrived UK<Year left Full Time Education
White
Non-White
White
Non-White
Coefficient SE Coefficient SE Coefficient SE Coefficient SE
R education 0.052* 0.009 0.085* 0.010 0.057* 0.007 0.060* 0.010
O education 0.011* 0.004 -0.002 0.004 0.005 0.004 0.022* 0.004
U education -0.034* 0.010 -0.053* 0.011 -0.057* 0.010 -0.029* 0.009
Speak Eng 0.077* 0.020 -0.001 0.025 0.010 0.016 0.037 0.026
N 2480 2219 3062 1752
(II) Women
Labour Market Entrants:
Arrived UK>=Year left Full Time Education
Education Entrants:
Arrived UK<Year left Full Time Education
White
Non-White
White
Non-White
Coefficient SE Coefficient SE Coefficient SE Coefficient SE
R education 0.075* 0.009 0.064* 0.011 0.099* 0.010 0.050* 0.012
O education 0.014* 0.004 0.004 0.005 0.030* 0.004 0.011* 0.005
U education -0.034* 0.010 -0.020** 0.011 -0.028* 0.011 -0.019* 0.009
Speak Eng 0.078* 0.019 -0.022 0.022 -0.010* 0.018 0.022 0.028
N 2433 1636 2251 1123
Notes: QLFS 1993-2003. Data are unweighted. Standard errors are in parentheses.
* denotes significant at 5 percent level, whilst ** significant at the 10 percent level.
Unreported controls include survey year, marital status dummy, children dummy, 2 firm size
dummies, 10 regional dummies, a manufacturing dummy, eight occupational dummies, four
ethnicity dummies, age, age squared and five immigrant arrival cohort dummies.
The default category is unmarried, employed in a firm with less than 25 employees, lives in the
South East, not employed as a manager in manufacturing and arriving in the UK before 1959. For
the non-white equations there is the extra default of being Caribbean and for the white immigrant
equation being European white.
20