Embed Size (px)
Citation preview
ARTICLE
Received 1 May 2015 | Accepted 6 Aug 2015 | Published 22 Sep 2015
The outer mucus layer hosts a distinct intestinalmicrobial nicheHai Li1,*, Julien P. Limenitakis1,*, Tobias Fuhrer2, Markus B. Geuking1, Melissa A. Lawson1, Madeleine Wyss1,
Sandrine Brugiroux3, Irene Keller1, Jamie A. Macpherson1, Sandra Rupp1, Bettina Stolp4, Jens V. Stein4,
Barbel Stecher3, Uwe Sauer2, Kathy D. McCoy1 & Andrew J. Macpherson1
The overall composition of the mammalian intestinal microbiota varies between individuals:
within each individual there are differences along the length of the intestinal tract related to
host nutrition, intestinal motility and secretions. Mucus is a highly regenerative protective
lubricant glycoprotein sheet secreted by host intestinal goblet cells; the inner mucus layer is
nearly sterile. Here we show that the outer mucus of the large intestine forms a unique
microbial niche with distinct communities, including bacteria without specialized mucolytic
capability. Bacterial species present in the mucus show differential proliferation and resource
utilization compared with the same species in the intestinal lumen, with high recovery of
bioavailable iron and consumption of epithelial-derived carbon sources according to their
genome-encoded metabolic repertoire. Functional competition for existence in this intimate
layer is likely to be a major determinant of microbiota composition and microbial molecular
exchange with the host.
DOI: 10.1038/ncomms9292 OPEN
1 Maurice Muller Laboratories (DKF), Universitatsklinik fur Viszerale Chirurgie und Medizin Inselspital, University of Bern, Murtenstrasse 35, 3010 Bern,Switzerland. 2 Institute of Molecular Systems Biology, Swiss Federal Institute of Technology (ETH) Zurich, Auguste-Piccard-Hof 1, 8093 Zurich, Switzerland.3 Max-von-Pettenkofer Institute, German Center for Infection Research (DZIF), Pettenkoferstrasse 9a, Partner site LMU Munich, D-80336 Munich, Germany.4 Theodor Kocher Institute, Freiestrasse 1, University of Bern, 3012 Bern, Switzerland. * These authors contributed equally to this work. Correspondence andrequests for materials should be addressed to A.J.M. (email: [email protected]).
NATURE COMMUNICATIONS | 6:8292 | DOI: 10.1038/ncomms9292 | www.nature.com/naturecommunications 1
& 2015 Macmillan Publishers Limited. All rights reserved.
Mucus is known to be a highly dynamic matrix, largelyconsisting of mucin glycoproteins sheets, secreted byintestinal goblet cells, which lubricates the transit of
intestinal contents. In the small intestine the mucus isdiscontinuous, but in the stomach and large intestine (colon)there are two layers1. Tight stacking of polymeric glycoproteinsadjacent to the epithelium forms a compact inner layer that islargely sterile2. Following proteolytic dispersion of mucinpolymers, the outer layer is looser and contains intestinalbacteria1. Goblet cell secretion of mucin is orchestrated byinflammasome activity3, and mucus thickens as the microbiotabecomes more diverse4.
Mucus therefore forms an important intestinal compartment,and the glycoprotein is itself a microbial carbon source. Onlysome bacterial species have a sufficient repertoire of genome-encoded catabolic glycosidic enzymes to disassemble complexmucus glycans as a sufficient carbon source, so relatively fewmicrobes can be considered as mucolytic specialists. For thesemucolytic bacteria, mucus is a potentially distinct microbiologicalniche on the basis of the available carbon source. Mucusoxygen levels at atmospheric pressures are also low enough toallow the presence of anaerobes5. For example, Bacteroidesthetaiotaomicron has been shown to forage on mucus glycans inthe caecum when plant polysaccharides are absent from thediet6,7. The ability of B. thetaiotaomicron in the caecum to usemucus as an alternative carbon source is consistent with theconcept that the outer layer of mucus is a separatemicrobiological niche for such mucolytic bacteria. However,this interpretation is indirect, because mucus is being constantlyshed into the intestinal lumen2, so overall metabolic alterationsunder conditions of nutrient restriction do not necessarily showthe extent of differences in resource utilization between the outermucus layer and the intestinal contents under normalphysiological and dietary conditions.
Aside from the utilization of mucus glycans as a niche carbonsource, mucus is also known to retain non-mucolytic bacterialspecies8,9. For example, commensal Escherichia coli was foundto replicate preferentially in the mucus during regrowthafter antibiotic treatment on the basis of ribosomal contentassessments10.
If the outer mucus layer is a generally separate microbiologicalniche for mucolytic non-specialists and specialists alike, threeoutstanding questions need to be addressed11–13. (i) Is the outermucus layer a physical habitat sufficiently separate for microbesto assemble into distinct communities? (ii) Is there differentialresource utilization of constituents other than mucin glycoproteinor oxygen? (iii) Do microbes in the mucus adopt specialstrategies for population persistence, such as generaltranscriptional and metabolic differences, compared with thesame species in an adjacent compartment (in this case, theintestinal lumen)?
There is certainly evidence of minor differences between thecomposition of microbial communities in the outer layer ofmucus of the large intestine and the luminal intestinal contents.This is on a background of considerable variability between themicrobiota of mouse colonies, even between different rooms ofthe same vivarium, that changes the structure and functionalproperties of the mucus layer4. The dynamics of rapid mucusshedding into the lumen14 also mean that luminal bacteria willinevitably be contaminated with any bacterial species that havereplicated in the mucus layer, so composition assessments per sedo not reveal whether there are metabolic patterns thatpotentially define the general differences within individualspecies in resource utilization or strategies for populationpersistence within the mucus compared with the intestinalcontents.
The very intimacy between microbial populations in the outermucus layer and host intestinal tissues makes the existence of anouter mucus niche of intestinal microbes extremely important, asmicrobial metabolites are known to determine the differentiationand function of epithelial and immune cells in the intestinalmucosa15,16. Put the other way around, the host intestinalepithelial layer is being constantly shed14, giving scope for thehost to succor different microbial species in their race to replicateand avoid extinction from the microbiota.
In this paper, we analyse the spatial distribution, functionalmetabolic and proliferative adaptation and fitness of differentintestinal bacteria in the outer layer of colonic mucus in simpledefined microbiotas. To understand the scope of niche differencesin these parameters, we analyse the contrasting situations ofmonocolonization with two genetically well-defined intestinalmicrobes: B. thetaiotaomicron (a mucolytic symbiont, which is anabundant member of the healthy intestinal microbiota6,7) andE. coli (a minor constituent that blooms under conditionsof infectious and non-infectious inflammation with limitedglycoside hydrolase activity for mucus metabolism17–22).In these defined model gnotobiotic mice, we show that theouter mucus niche concept applies to resource utilization rangingbeyond mucus metabolism, to mineral harvesting and utilizationof shed host phospholipids. These differences in resourceutilization reflect the specific bacterial genomic repertoires andestablish distinct strategies for population persistence in themucus compared with the luminal intestinal contents undernormal fed physiological conditions.
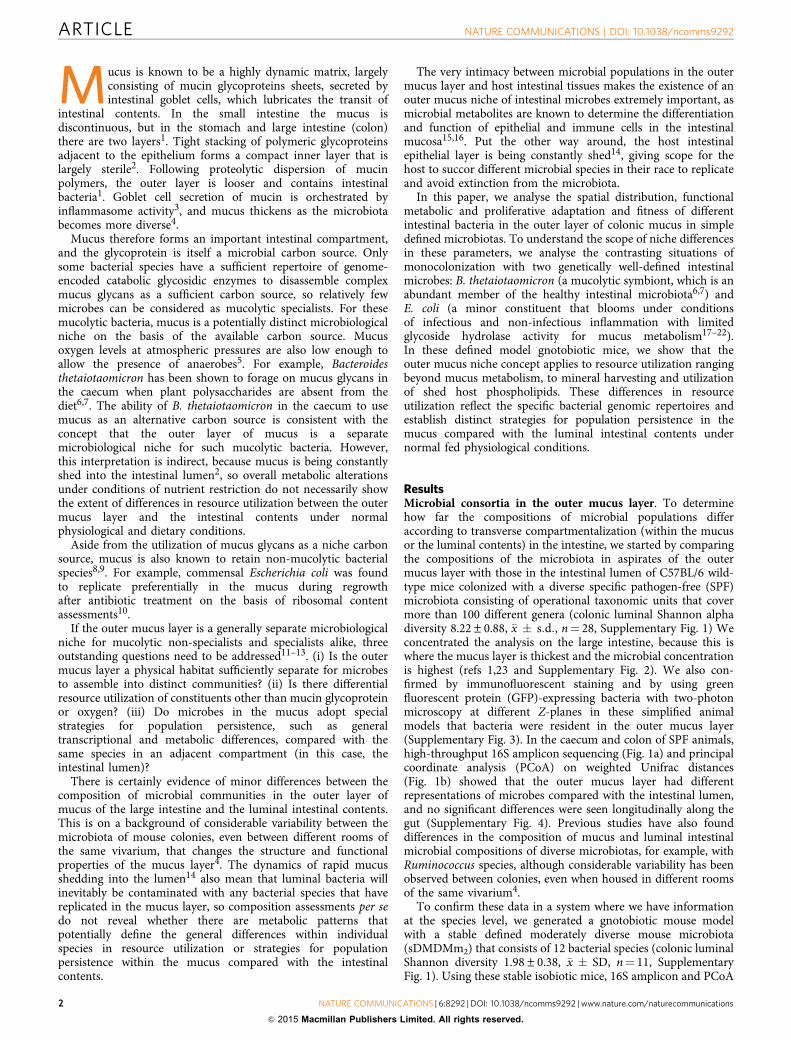
ResultsMicrobial consortia in the outer mucus layer. To determinehow far the compositions of microbial populations differaccording to transverse compartmentalization (within the mucusor the luminal contents) in the intestine, we started by comparingthe compositions of the microbiota in aspirates of the outermucus layer with those in the intestinal lumen of C57BL/6 wild-type mice colonized with a diverse specific pathogen-free (SPF)microbiota consisting of operational taxonomic units that covermore than 100 different genera (colonic luminal Shannon alphadiversity 8.22±0.88, �x � s:d:, n¼ 28, Supplementary Fig. 1) Weconcentrated the analysis on the large intestine, because this iswhere the mucus layer is thickest and the microbial concentrationis highest (refs 1,23 and Supplementary Fig. 2). We also con-firmed by immunofluorescent staining and by using greenfluorescent protein (GFP)-expressing bacteria with two-photonmicroscopy at different Z-planes in these simplified animalmodels that bacteria were resident in the outer mucus layer(Supplementary Fig. 3). In the caecum and colon of SPF animals,high-throughput 16S amplicon sequencing (Fig. 1a) and principalcoordinate analysis (PCoA) on weighted Unifrac distances(Fig. 1b) showed that the outer mucus layer had differentrepresentations of microbes compared with the intestinal lumen,and no significant differences were seen longitudinally along thegut (Supplementary Fig. 4). Previous studies have also founddifferences in the composition of mucus and luminal intestinalmicrobial compositions of diverse microbiotas, for example, withRuminococcus species, although considerable variability has beenobserved between colonies, even when housed in different roomsof the same vivarium4.
To confirm these data in a system where we have informationat the species level, we generated a gnotobiotic mouse modelwith a stable defined moderately diverse mouse microbiota(sDMDMm2) that consists of 12 bacterial species (colonic luminalShannon diversity 1.98±0.38, �x � SD, n¼ 11, SupplementaryFig. 1). Using these stable isobiotic mice, 16S amplicon and PCoA
ARTICLE NATURE COMMUNICATIONS | DOI: 10.1038/ncomms9292
2 NATURE COMMUNICATIONS | 6:8292 | DOI: 10.1038/ncomms9292 | www.nature.com/naturecommunications
& 2015 Macmillan Publishers Limited. All rights reserved.
also showed that the compositions in the large intestinal outermucus and the intestinal lumen were significantly different,although all constituents of the isobiotic microbiota wereconsistently present at some level in both compartments(Supplementary Fig. 5). A limitation in applying microbiotacomposition analysis alone to substantiate the recess concept of aseparate microbiological niche in the outer mucus layer comparedwith the luminal contents is that functional differences maybe underestimated. Rapid turnover of mucus (ref. 14 andSupplementary Fig. 6a) causes shedding of its microbialconstituents, which are then detected in the intestinal lumen,even though they may not form a stable regenerative communityin the luminal contents.
A generally distinct niche in the outer mucus would imply thatbacterial mobility is restricted, even where the strain is motile.To assess this, we studied C57BL/6 mice that had beenmonocolonized with a motile strain of E. coli (SupplementaryFig. 6b–d). Two-photon imaging confirmed that the bacteria wereimmobile up to the 5 min recording time in the outer mucus,whereas tumbling was observed in PBS media and swimming inluminal intestinal fluid (Supplementary Movies 1–3). This doesnot exclude a slower exchange between luminal and mucuscompartments over the period of hours required for mucusregeneration and we cannot exclude the possibility that lack ofvisualized microbial motility in the mucus compartment could bedue to technical imaging factors such as coverslip compression orthe preparation of the tissue for imaging. Nevertheless, the
morphology of the bacteria argued for replication rather thanreplacement as the mechanism of sustaining the mucus E. colipopulation in this monocolonized system. The mucus containedelongated bacilli and some forms at the end stage of binary fission(Supplementary Fig. 6e and f). This provided the first of threelines of evidence that, at least for E. coli, regeneration of thepopulation in the mucus layer during mucus turnover occursselectively through mucus bacterial cell division rather thanrepopulation from the luminal contents.
Distinct transcriptional profiles of mucus layer microbes.Distinct bacterial niches in the outer mucus layer and theintestinal luminal contents also would imply that these areseparate metabolic compartments with differential resourceutilization, including, but not limited to, host mucus glycanconstituents or increased oxygen availability in the mucus as anelectron acceptor5. To address potential niche compartment-alization of bacterial metabolism, we initially studied C57BL/6wild-type mice monocolonized either with B. thetaiotaomicron orE. coli. Both monocolonizations are rapidly progressing, achievinga high steady-state biomass of the monocolonizing bacteriumwithin 18 h following a calculated inoculation dose of as little as1–10 bacteria (Supplementary Fig. 7 and Supplementary Table 1).B. thetaiotaomicron is also known to be capable of both mucusand dietary glycan breakdown7,24, whereas E. coli has a restrictedglycoside hydrolase repertoire (Supplementary Fig. 8), making
a
bCaecum Colon
ContentMucus
P =10–4***
Content Mucus
P =10–4 ***
PC1 (70.92%)PC1 (54.50%)
PC
2 (5
%)
PC
2 (1
0.67
%)
1 2 3 1 2 3 1 2 3 4 5 1 2 3 4 5Segment:(proximal-> distal)
Caecum Colon
Muc MucCon Con1 2 3 1 2 3 1 2 3 4 5 1 2 3 4 5
Caecum Colon
Muc MucCon Con
BacteroidetesDeferribacteresFirmicutes
ProteobacteriaTenericutes
BacteroidalesBacteroidesPrevotellaRikenellaceaeBacteroidales S24-7ParaprevotellaceaeMucispirillumLactobacilliaceaeLactobacillusLachnospiraceaeRuminococcusRuminococcaceaeOscillospiraRuminococcusSutterellaDesulfovibrio
16S microbial amplicon sequencingPhylum Genus
Figure 1 | Microbial communities in the mucus layer and content vary in the intestine. (a) The microbial composition within the mucus layer (Muc) and
luminal content (Con) of different segments along the caecum and colon of SPF mice was determined by 16S amplicon analysis. Representative bar graphs
from one mouse out of four to six mice per group are shown. (b) Principal coordinates analysis on weighted UniFrac distances was performed on all
operational taxonomic units. P-values to determine the statistical significance of clustering were calculated using the Adonis method. Analysis was
performed using QIIME 1.8.0.
NATURE COMMUNICATIONS | DOI: 10.1038/ncomms9292 ARTICLE
NATURE COMMUNICATIONS | 6:8292 | DOI: 10.1038/ncomms9292 | www.nature.com/naturecommunications 3
& 2015 Macmillan Publishers Limited. All rights reserved.
them suitable contrasting models to study differential resourceutilization under conditions where the mucus architecturemeasurements were not significantly different from micepermanently colonized for over 30 generations with an alteredSchaedler flora (ASF; Supplementary Fig. 2b). These aresimplified models, and the mucus structure does thicken inmice with very diverse colonization as shown for SPF animals(Supplementary Figs 1 and 2b). These monocolonizations didallow us to compare bacterial densities, transcriptional activitiesand metabolism in separate compartments for each individualmicrobial species independently of cross-feeding events,competition or inter-microbial exchange of vitamins, mineralsor electron donors/acceptors, which can occur in mice that arecolonized by multiple organisms.
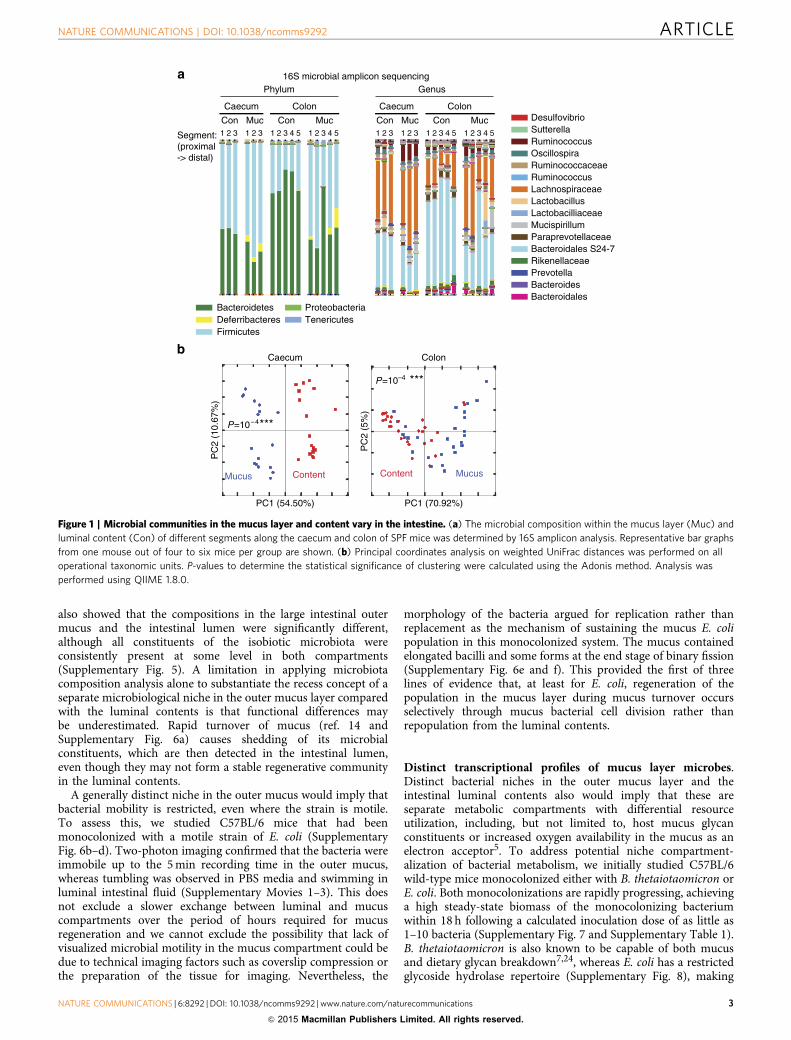
We first carried out transcriptomic analyses of parallel luminalor outer mucus isolates. In both B. thetaiotaomicron (Fig. 2) andE. coli monocolonized mice (Fig. 3), we observed distincttranscriptional patterns in unsupervized analyses of replicatesamples from the mucus, that differed from the transcriptionalpatterns of the same bacteria in the luminal contents (seealso Supplementary Data 1 and 2 for further details). Todetermine the specifics of the niche transcriptional patterns, weapplied a network analysis using STRING25. We improved thetranscript annotation for B. thetaoiotaomicron available inSTRING by using the SEED tools. The annotations also includethe latest studies regarding the glycan utilization pathways inB. thetatiotaomicron26,27. For both of the model bacteriastudied under monocolonization conditions, there were distinct
metabolic pathway clusters depending on whether thetranscriptome had been derived from the outer layer of mucusor the intestinal contents. For example, B. thetaiotaomicron hadincreased N-linked glycosidase transcription in the mucuscompared with the intestinal contents (Fig. 2c), compatible withdigestion of glycan side chains of mucus in this compartment andfrom shed dead host cells. However, luminal B. thetaiotaomicronexpressed a distinct repertoire of glycoside hydrolases consistentwith metabolism of dietary starch, mannans, arabinogalactans,xylose and galactose (Fig. 2c and Supplementary Data 3). Weconcluded that this transcriptional evidence was consistent withB. thetaiotaomicron selectively utilizing particular members of itsrich repertoire of glycoside hydrolases to degrade host complexcarbohydrates in the outer layer of mucus or complex dietarycarbohydrates resistant to host digestion in the luminal intestinalcontents. We also found relatively increased expression ofcapsular polysaccharide synthesis loci in B. thetaiotaomicronresiding in the intestinal lumen. This may be a result of increasedbiofilm formation on particulate luminal material, such asundigested plant wall fragments as previously suggested fromchemostat transcriptional profile studies28.
Iron harvesting dictates E. coli transcriptional regulation.Given that the abundant glycoside hydrolase repertoire ofB. thetaiotaomicron allows it to exploit a wide range of host-secreted or dietary-derived complex carbohydrates, depending onits exact niche in the intestine, we next asked how E. coli as afacultative anaerobe with its limited glycoside hydrolase
2 6 10 14
a b
c
Colour key
–Log
10 (
padj
)
0
20
40
60
−5.0 −2.5 0.0 2.5
Read counts/gene10,00020,00030,000
40,000Arbitrary expressionlevel
Arabinogalactanand pectin
degradation
BT_1536
BT_1533 BT_1530
BT_1532BT_1535
BT_3855BT_3790BT_3856
BT_1534BT_3854 BT_3791
BT_3789BT_1029
BT_3792
BT_2621BT_2622
BT_1028
BT_3519
BT_1010
BT_1013
BT_4120
BT_4121BT_0985
BT_2254
BT_3701BT_0997 BT_0066BT_4670
BT_3700
BT_0064
BT_0065
BT_0068BT_4669
BT_4668BT_0059
BT_0060
BT_3963
BT_0058
BT_3964
BT_0061BT_3079
BT_3080 BT_0057 Capsular polysaccharidesynthesis (CPS n°8)
Starch degradation
α-Mannan degradation (PUL n°68)
ABC-mediated transportBT_1044BT_1045
BT_3991
BT_1043BT_1042
BT_3990
BT_1036
BT_3992
BT_1040
BT_1037 BT_3983
BT_1038 BT_1039 BT_3984
BT_3986
BT_3987
BT_3988BT_3985BT 4659
BT_0154 BT_0153BT_4660
BT_4656
BT_2171BT_2170BT_4657
BT_4655
BT_4652
BT_4653
BT_4654
Mucin N-linkedglycans
degradation(PUL n°14)
MucinN-glycans
degradation(PUL n°72)
α-Mannan degradation (PUL n°36)
Host glycansdegradation(PUL n°27)
Glycosaminoglycansdegradation(PUL n°85)
2 31 1 2 3
Mucus Contents
(Log2 fold change)Contents Mucus
Colonic contents Colonic mucus
Pectinmetabolism
Upregulated in contents
Upregulated in mucus
Figure 2 | B. thetaiotaomicron in colonic mucus and contents has different transcriptional patterns. (a) A heat map of gene expression values
shows differentially expressed genes identified by RNA-seq in bacteria isolated from colonic mucus and contents of B. thetaiotaomicron monocolonized
C57BL/6 mice. Data shown are three experimental repeats from the two compartments. (b) The gene expression levels of B. thetaiotaomicron in colonic
mucus were compared with colonic contents and the log2 transformed fold change was plotted against log10 transformed P-value adjusted (padj).
Red-coloured dots indicate genes with log2 FoldChange Z2 and padj r0.05. (c) A network analysis was performed on genes highlighted in red in
b according to translated protein–protein interactions using STRING database. The formed gene clusters were differentially coloured and functional
definitions were provided to according clusters. Original transcriptomic data with annotations are given in Supplementary Data 1.
ARTICLE NATURE COMMUNICATIONS | DOI: 10.1038/ncomms9292
4 NATURE COMMUNICATIONS | 6:8292 | DOI: 10.1038/ncomms9292 | www.nature.com/naturecommunications
& 2015 Macmillan Publishers Limited. All rights reserved.
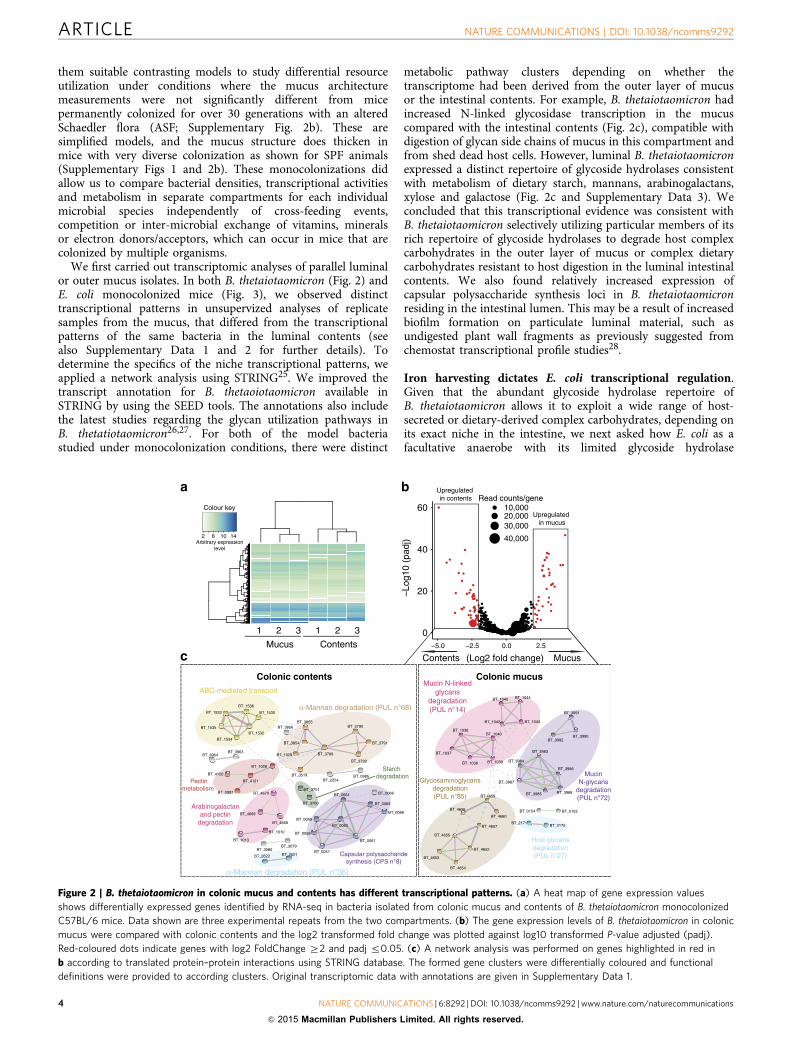
repertoire (Supplementary Fig. 8) would adapt to life in theseniches. We carried out comparative STRING analyses on thetranscriptomes from the mucus or the large intestinal contents ofE. coli monocolonized C57BL/6 mice that had been fed anidentical diet used in B. thetaiotaomicron experiments. Thepredominant difference between E. coli residing in the mucus andin the intestinal contents was a notably increased expression ofthe ferric iron uptake pathway (Fig. 3c and SupplementaryData 3). In support of these transcriptional data for critical ironharvesting in the mucus, we found lower total iron levels incolonic mucus (26.99±22.16 ng g� 1, �x � s:d:, n¼ 3 mice)compared with the luminal contents (120.64±35.07 ng g� 1).
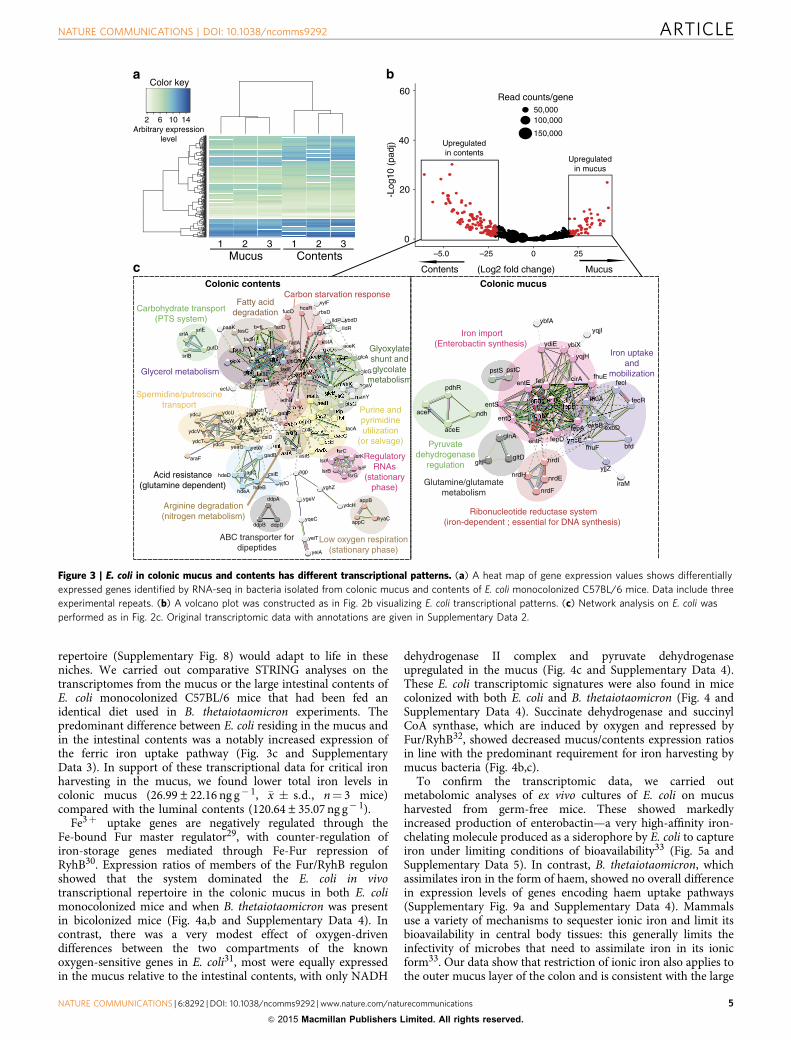
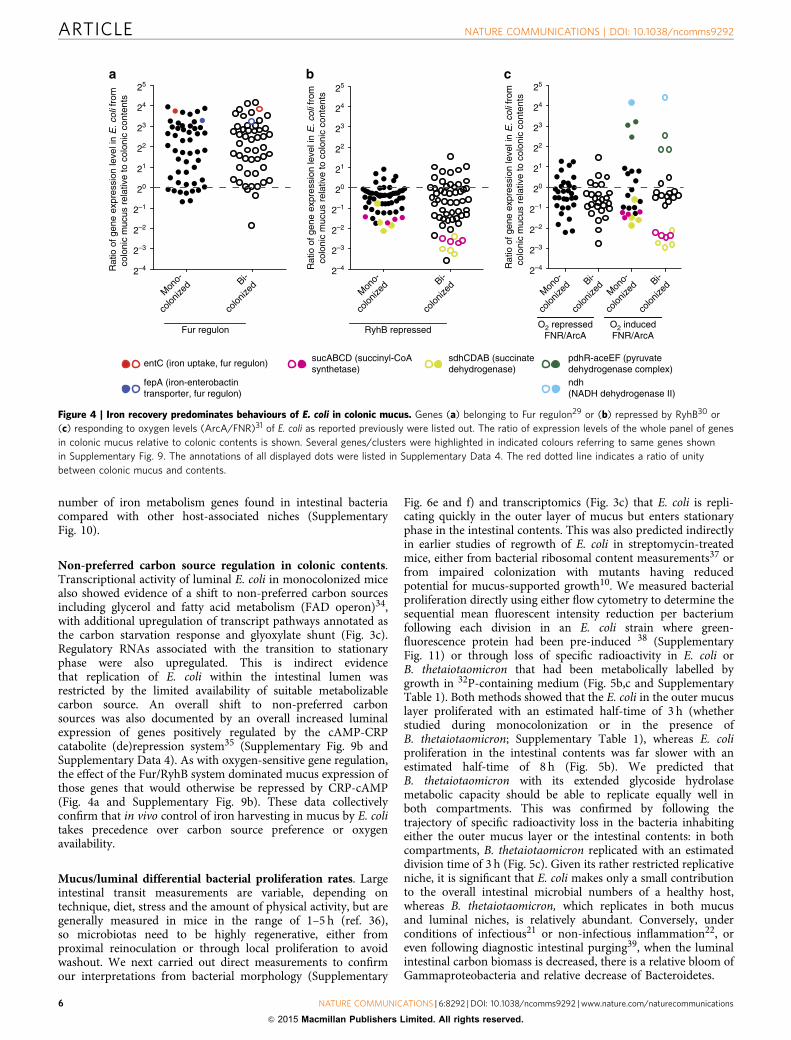
Fe3þ uptake genes are negatively regulated through theFe-bound Fur master regulator29, with counter-regulation ofiron-storage genes mediated through Fe-Fur repression ofRyhB30. Expression ratios of members of the Fur/RyhB regulonshowed that the system dominated the E. coli in vivotranscriptional repertoire in the colonic mucus in both E. colimonocolonized mice and when B. thetaiotaomicron was presentin bicolonized mice (Fig. 4a,b and Supplementary Data 4). Incontrast, there was a very modest effect of oxygen-drivendifferences between the two compartments of the knownoxygen-sensitive genes in E. coli31, most were equally expressedin the mucus relative to the intestinal contents, with only NADH
dehydrogenase II complex and pyruvate dehydrogenaseupregulated in the mucus (Fig. 4c and Supplementary Data 4).These E. coli transcriptomic signatures were also found in micecolonized with both E. coli and B. thetaiotaomicron (Fig. 4 andSupplementary Data 4). Succinate dehydrogenase and succinylCoA synthase, which are induced by oxygen and repressed byFur/RyhB32, showed decreased mucus/contents expression ratiosin line with the predominant requirement for iron harvesting bymucus bacteria (Fig. 4b,c).
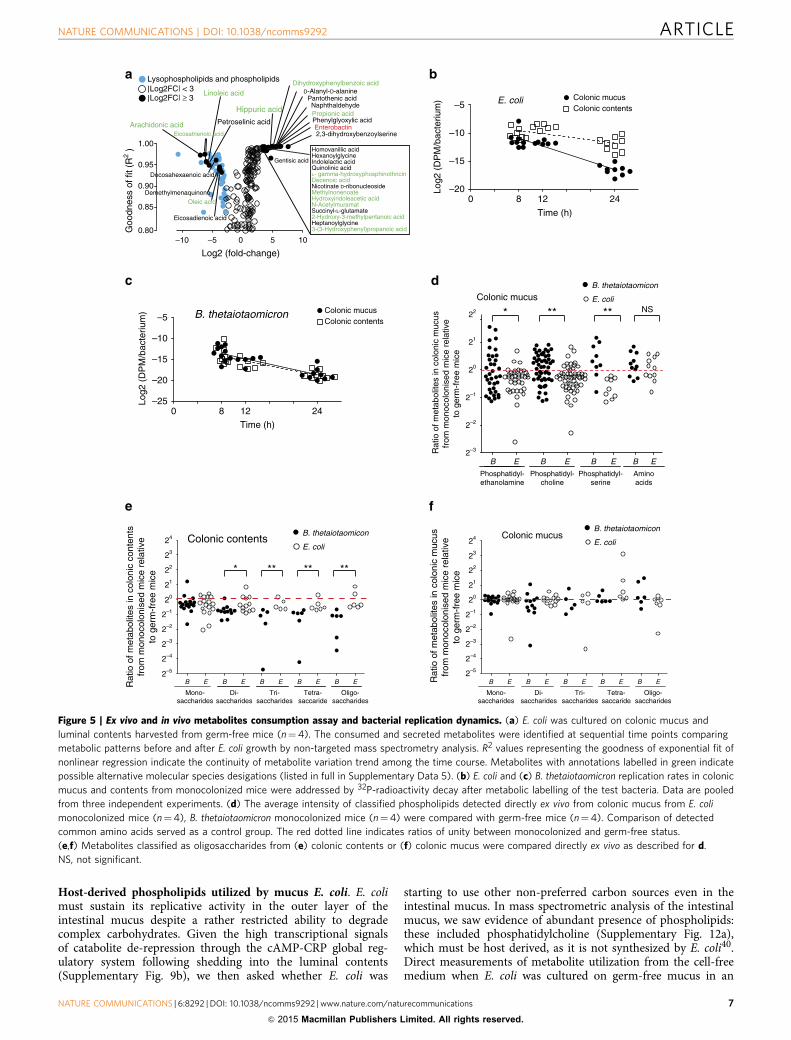
To confirm the transcriptomic data, we carried outmetabolomic analyses of ex vivo cultures of E. coli on mucusharvested from germ-free mice. These showed markedlyincreased production of enterobactin—a very high-affinity iron-chelating molecule produced as a siderophore by E. coli to captureiron under limiting conditions of bioavailability33 (Fig. 5a andSupplementary Data 5). In contrast, B. thetaiotaomicron, whichassimilates iron in the form of haem, showed no overall differencein expression levels of genes encoding haem uptake pathways(Supplementary Fig. 9a and Supplementary Data 4). Mammalsuse a variety of mechanisms to sequester ionic iron and limit itsbioavailability in central body tissues: this generally limits theinfectivity of microbes that need to assimilate iron in its ionicform33. Our data show that restriction of ionic iron also applies tothe outer mucus layer of the colon and is consistent with the large
0
20
40
60
0 25
(Log2 fold change)
a b
c
2 31 1 2 3
-Log
10 (
padj
)
50,000100,000
150,000
Read counts/gene
2 6 10 14Arbitrary expression
level
Color key
Upregulatedin contents
Upregulatedin mucus
Iron import(Enterobactin synthesis)
Ribonucleotide reductase system(iron-dependent ; essential for DNA synthesis)
RegulatoryRNAs
(stationaryphase)
Spermidine/putrescinetransport
Acid resistance(glutamine dependent)
Carbohydrate transport(PTS system)
ABC transporter fordipeptides
Fatty aciddegradation
Carbon starvation response
Arginine degradation(nitrogen metabolism)
Purine andpyrimidineutilization
(or salvage)
Glyoxylateshunt andglycolate
metabolism
Pyruvatedehydrogenase
regulation
Iron uptakeand
mobilization
Glutamine/glutamatemetabolism
Low oxygen respiration(stationary phase)
Glycerol metabolism
xylFhcaR
rbsDfucO
ybdDlldPfadD lldDpaaK lldRfadL
tesCsrlEmglAsrlA
cstAfadAfadH
dhaK aceKpaaJ
srlB
gutDglpCfadI
glcDglcA
mglB glcFglpFfadJaceB
glpX glpQglcEfadE gatYglpB glcGfadB aldA aceA
yjcH acsglpK agaVactPmanX
glcBecfJ
sdhBmanYyfiQmalE
dadAptsGmalT
gabT udpydcU gabPygaF lacZ ftsIydcJ
ygaEydcW gabDlacAydcV yeaH astEaldB
deoAastD deoCcsiDydcS
ydcT cddyeaG rmfyebV
astA astBdadX
araFgadB
lsrClsrK
lsrAlsrF
lsrBagpgadC csiEhdeD lsrG
hdeByjfO
hdeAyghZ
ygeVddpA appBydcH
appChyaC
ddpB ddpDyqeC
yeiT
yeiA
ybfAyqjI
ydiE ybiX
yqjH
pstCpstScirA fhuE
fes fecIentEpdhR
entCentB fhuAentS
aceF
fecRfepB
ndh entA
exbBentD
exbDfepAaceEfepDentF
glnA
bfdyncE
fhuF
gltD nrdIyjjZ
gltF
nrdHiraM
nrdE
nrdF
cspD
Mucus Contents
Colonic contents Colonic mucus
Contents Mucus
–5.0 –25
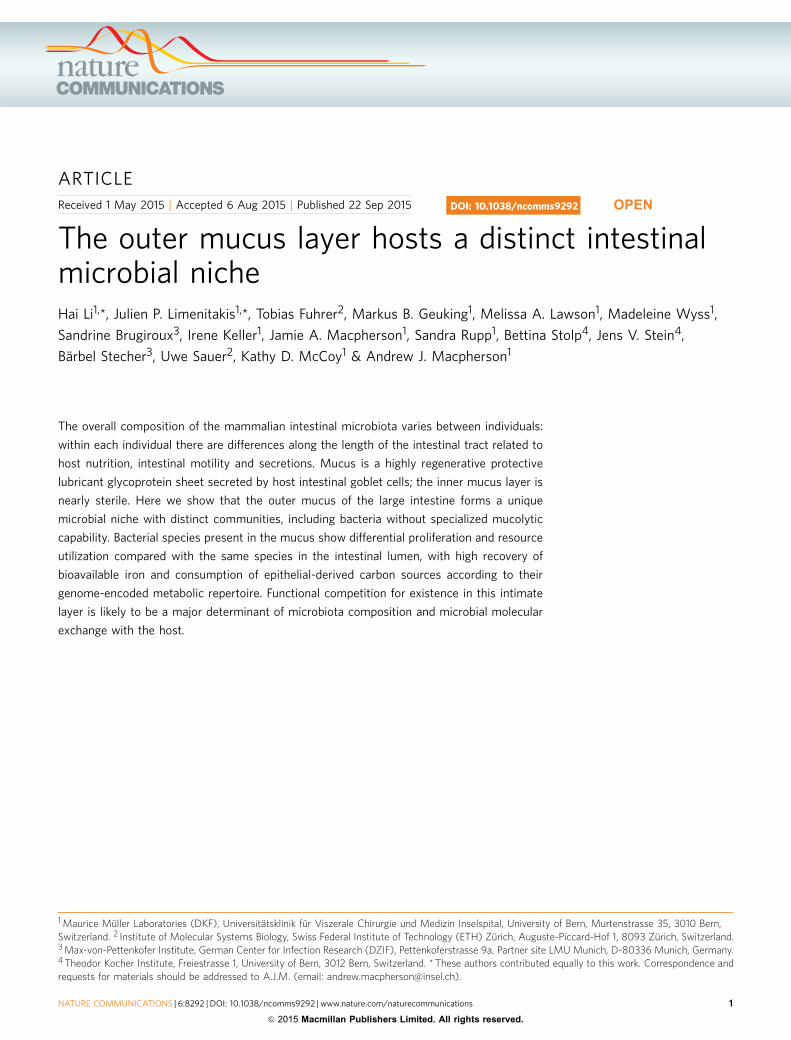
Figure 3 | E. coli in colonic mucus and contents has different transcriptional patterns. (a) A heat map of gene expression values shows differentially
expressed genes identified by RNA-seq in bacteria isolated from colonic mucus and contents of E. coli monocolonized C57BL/6 mice. Data include three
experimental repeats. (b) A volcano plot was constructed as in Fig. 2b visualizing E. coli transcriptional patterns. (c) Network analysis on E. coli was
performed as in Fig. 2c. Original transcriptomic data with annotations are given in Supplementary Data 2.
NATURE COMMUNICATIONS | DOI: 10.1038/ncomms9292 ARTICLE
NATURE COMMUNICATIONS | 6:8292 | DOI: 10.1038/ncomms9292 | www.nature.com/naturecommunications 5
& 2015 Macmillan Publishers Limited. All rights reserved.
number of iron metabolism genes found in intestinal bacteriacompared with other host-associated niches (SupplementaryFig. 10).
Non-preferred carbon source regulation in colonic contents.Transcriptional activity of luminal E. coli in monocolonized micealso showed evidence of a shift to non-preferred carbon sourcesincluding glycerol and fatty acid metabolism (FAD operon)34,with additional upregulation of transcript pathways annotated asthe carbon starvation response and glyoxylate shunt (Fig. 3c).Regulatory RNAs associated with the transition to stationaryphase were also upregulated. This is indirect evidencethat replication of E. coli within the intestinal lumen wasrestricted by the limited availability of suitable metabolizablecarbon source. An overall shift to non-preferred carbonsources was also documented by an overall increased luminalexpression of genes positively regulated by the cAMP-CRPcatabolite (de)repression system35 (Supplementary Fig. 9b andSupplementary Data 4). As with oxygen-sensitive gene regulation,the effect of the Fur/RyhB system dominated mucus expression ofthose genes that would otherwise be repressed by CRP-cAMP(Fig. 4a and Supplementary Fig. 9b). These data collectivelyconfirm that in vivo control of iron harvesting in mucus by E. colitakes precedence over carbon source preference or oxygenavailability.
Mucus/luminal differential bacterial proliferation rates. Largeintestinal transit measurements are variable, depending ontechnique, diet, stress and the amount of physical activity, but aregenerally measured in mice in the range of 1–5 h (ref. 36),so microbiotas need to be highly regenerative, either fromproximal reinoculation or through local proliferation to avoidwashout. We next carried out direct measurements to confirmour interpretations from bacterial morphology (Supplementary
Fig. 6e and f) and transcriptomics (Fig. 3c) that E. coli is repli-cating quickly in the outer layer of mucus but enters stationaryphase in the intestinal contents. This was also predicted indirectlyin earlier studies of regrowth of E. coli in streptomycin-treatedmice, either from bacterial ribosomal content measurements37 orfrom impaired colonization with mutants having reducedpotential for mucus-supported growth10. We measured bacterialproliferation directly using either flow cytometry to determine thesequential mean fluorescent intensity reduction per bacteriumfollowing each division in an E. coli strain where green-fluorescence protein had been pre-induced 38 (SupplementaryFig. 11) or through loss of specific radioactivity in E. coli orB. thetaiotaomicron that had been metabolically labelled bygrowth in 32P-containing medium (Fig. 5b,c and SupplementaryTable 1). Both methods showed that the E. coli in the outer mucuslayer proliferated with an estimated half-time of 3 h (whetherstudied during monocolonization or in the presence ofB. thetaiotaomicron; Supplementary Table 1), whereas E. coliproliferation in the intestinal contents was far slower with anestimated half-time of 8 h (Fig. 5b). We predicted thatB. thetaiotaomicron with its extended glycoside hydrolasemetabolic capacity should be able to replicate equally well inboth compartments. This was confirmed by following thetrajectory of specific radioactivity loss in the bacteria inhabitingeither the outer mucus layer or the intestinal contents: in bothcompartments, B. thetaiotaomicron replicated with an estimateddivision time of 3 h (Fig. 5c). Given its rather restricted replicativeniche, it is significant that E. coli makes only a small contributionto the overall intestinal microbial numbers of a healthy host,whereas B. thetaiotaomicron, which replicates in both mucusand luminal niches, is relatively abundant. Conversely, underconditions of infectious21 or non-infectious inflammation22, oreven following diagnostic intestinal purging39, when the luminalintestinal carbon biomass is decreased, there is a relative bloom ofGammaproteobacteria and relative decrease of Bacteroidetes.
pdhR-aceEF (pyruvatedehydrogenase complex)
sucABCD (succinyl-CoAsynthetase)
sdhCDAB (succinatedehydrogenase)
Mon
o-
colon
ized Bi-
colon
ized
Fur regulon
Rat
io o
f gen
e ex
pres
sion
leve
l in
E. c
oli f
rom
colo
nic
muc
us r
elat
ive
to c
olon
ic c
onte
nts
a
ndh(NADH dehydrogenase II)
Mon
o-
colon
ized Bi-
colon
ized
RyhB repressed
b
Rat
io o
f gen
e ex
pres
sion
leve
l in
E. c
oli f
rom
colo
nic
muc
us r
elat
ive
to c
olon
ic c
onte
nts
Mon
o-
colon
ized Bi-
colon
ized
Mon
o-
colon
ized Bi-
colon
ized
O2 repressedFNR/ArcA
O2 inducedFNR/ArcA
2–4
2–3
2–2
2–1
20
21
22
23
24
25
2–4
2–3
2–2
2–1
20
21
22
23
24
25
2–4
2–3
2–2
2–1
20
21
22
23
24
25c
Rat
io o
f gen
e ex
pres
sion
leve
l in
E. c
oli f
rom
colo
nic
muc
us r
elat
ive
to c
olon
ic c
onte
nts
entC (iron uptake, fur regulon)
fepA (iron-enterobactintransporter, fur regulon)
Figure 4 | Iron recovery predominates behaviours of E. coli in colonic mucus. Genes (a) belonging to Fur regulon29 or (b) repressed by RyhB30 or
(c) responding to oxygen levels (ArcA/FNR)31 of E. coli as reported previously were listed out. The ratio of expression levels of the whole panel of genes
in colonic mucus relative to colonic contents is shown. Several genes/clusters were highlighted in indicated colours referring to same genes shown
in Supplementary Fig. 9. The annotations of all displayed dots were listed in Supplementary Data 4. The red dotted line indicates a ratio of unity
between colonic mucus and contents.
ARTICLE NATURE COMMUNICATIONS | DOI: 10.1038/ncomms9292
6 NATURE COMMUNICATIONS | 6:8292 | DOI: 10.1038/ncomms9292 | www.nature.com/naturecommunications
& 2015 Macmillan Publishers Limited. All rights reserved.
Host-derived phospholipids utilized by mucus E. coli. E. colimust sustain its replicative activity in the outer layer of theintestinal mucus despite a rather restricted ability to degradecomplex carbohydrates. Given the high transcriptional signalsof catabolite de-repression through the cAMP-CRP global reg-ulatory system following shedding into the luminal contents(Supplementary Fig. 9b), we then asked whether E. coli was
starting to use other non-preferred carbon sources even in theintestinal mucus. In mass spectrometric analysis of the intestinalmucus, we saw evidence of abundant presence of phospholipids:these included phosphatidylcholine (Supplementary Fig. 12a),which must be host derived, as it is not synthesized by E. coli40.Direct measurements of metabolite utilization from the cell-freemedium when E. coli was cultured on germ-free mucus in an
c
b
Goo
dnes
s of
fit (
R2 )
Colonic mucusColonic contents
Time (h)
Log2
(D
PM
/bac
teriu
m)
0 8 12 24–25
–20
–15
–10
–5
|Log2FC| < 3Lysophospholipids and phospholipids
|Log2FC| ≥ 3
–10 –5 0 5 10
0.85
0.90
0.95
1.00
0.80
Arachidonic acidEicosatrienoic acid
Petroselinic acid
Linoleic acid
Docosahexaenoic acid
DemethylmenaquinoneOleic acid
Eicosadienoic acid
2,3-dihydroxybenzoylserineEnterobactin
Phenylglyoxylic acid
NaphthaldehydePropionic acid
Pantothenic acidD-Alanyl-D-alanine
Gentisic acid
Dihydroxyphenylbenzoic acid
Hippuric acid
Homovanillic acidHexanoylglycineIndolelactic acidQuinolinic acidL- gamma-hydroxyphosphinothricin
Nicotinate D-ribonucleosideDecenoic acid
MethylnonenoateHydroxyindoleacetic acidN-AcetylmuramatSuccinyl-L-glutamate2-Hydroxy-3-methylpentanoic acidHeptanoylglycine3-(3-Hydroxyphenyl)propanoic acid
a
Log2 (fold-change)
Log2
(D
PM
/bac
teriu
m)
0 8 12 24–20
–15
–10
–5
Time (h)
Colonic mucusColonic contents
E. coli
B. thetaiotaomicron
2–5
2–4
2–3
2–2
2–1
20
21
22
23
24
Rat
io o
f met
abol
ites
in c
olon
ic c
onte
nts
from
mon
ocol
onis
ed m
ice
rela
tive
to g
erm
-fre
e m
ice
Mono-saccharides
Di-saccharides
Oligo-saccharides
Tetra-saccaride
Tri-saccharides
B E B E B E B E B E
e
** *****
Colonic contentsB. thetaiotaomicon
E. coli
d
2–1
20
21
22
Rat
io o
f met
abol
ites
in c
olon
ic m
ucus
from
mon
ocol
onis
ed m
ice
rela
tive
to g
erm
-fre
e m
ice
B E B E B E B E
Phosphatidyl-ethanolamine
Phosphatidyl-choline
Phosphatidyl-serine
Aminoacids
2–2
2–3
* ** ** NS
f
Mono-saccharides
Di-saccharides
Oligo-saccharides
Tetra-saccaride
Tri-saccharides
2–5
2–4
2–3
2–2
2–1
20
21
22
23
24
Rat
io o
f met
abol
ites
in c
olon
ic m
ucus
from
mon
ocol
onis
ed m
ice
rela
tive
to g
erm
-fre
e m
ice
B E B E B E B E B E
Colonic mucus
Colonic mucus
B. thetaiotaomicon
E. coli
B. thetaiotaomicon
E. coli
Figure 5 | Ex vivo and in vivo metabolites consumption assay and bacterial replication dynamics. (a) E. coli was cultured on colonic mucus and
luminal contents harvested from germ-free mice (n¼4). The consumed and secreted metabolites were identified at sequential time points comparing
metabolic patterns before and after E. coli growth by non-targeted mass spectrometry analysis. R2 values representing the goodness of exponential fit of
nonlinear regression indicate the continuity of metabolite variation trend among the time course. Metabolites with annotations labelled in green indicate
possible alternative molecular species desigations (listed in full in Supplementary Data 5). (b) E. coli and (c) B. thetaiotaomicron replication rates in colonic
mucus and contents from monocolonized mice were addressed by 32P-radioactivity decay after metabolic labelling of the test bacteria. Data are pooled
from three independent experiments. (d) The average intensity of classified phospholipids detected directly ex vivo from colonic mucus from E. coli
monocolonized mice (n¼4), B. thetaiotaomicron monocolonized mice (n¼4) were compared with germ-free mice (n¼4). Comparison of detected
common amino acids served as a control group. The red dotted line indicates ratios of unity between monocolonized and germ-free status.
(e,f) Metabolites classified as oligosaccharides from (e) colonic contents or (f) colonic mucus were compared directly ex vivo as described for d.
NS, not significant.
NATURE COMMUNICATIONS | DOI: 10.1038/ncomms9292 ARTICLE
NATURE COMMUNICATIONS | 6:8292 | DOI: 10.1038/ncomms9292 | www.nature.com/naturecommunications 7
& 2015 Macmillan Publishers Limited. All rights reserved.
ex vivo culture system showed progressive consumption of over42 different phospholipids (Fig. 5a and Supplementary Fig. 12band Supplementary Data 5), suggesting that these (largelyhost-derived carbon sources) could be potentially exploitedduring growth in mucus. Neither such significant phospholipidconsumption nor metabolomic signatures of iron salvage weredetected during equivalent experiments where either E. coliwas cultured in intestinal fluid (Supplementary Fig. 12c andSupplementary Data 6) or where B. thetaiotaomicron was grownon germ-free mucus (Supplementary Fig. 12d and SupplementaryData 7). The lack of B. thetaiotaomicron consumption of hostphospholipids can be understood in terms of its genome-encodedmetabolic repertoire, as it is one of the bacterial genera lackingthe genes of the fatty acid (b-oxidation) operon (SupplementaryFig. 13).
To substantiate these phospholipid consumption data from theex vivo culture system in vivo, we compared measurements of thesteady-state levels of phospholipids in the cell-free mucusfractions of either E. coli-colonized or B. thetaiotaomicron-colonized mice with germ-free controls. These showed that thereare lower steady-state levels of phosphatidylcholine, phosphati-dlyethanolamine and phosphatidylserine in the dynamicallyregenerating mucus of E. coli monocolonized mice, but notin B. thetaiotaomicron monocolonized mice (Fig. 5d andSupplementary Data 8). Given that phosphatidylcholine is notsynthesized by E. coli40, this is consistent with the consumptionof host-derived phospholipids as a non-essential contributorycarbon source in the outer mucus layer. In contrast, we foundthat B. thetaiotaomicron monocolonization, but not E. colimonocolonization, reduced oligosaccharides levels selectively inthe intestinal luminal contents compared with germ-free mice(Fig. 5e,f and Supplementary Data 8 and 9). Whereasmonosaccharide levels are equivalently very low for bothorganisms in the mucus and the intestinal contents, E. coli incontrast to B. thetaiotaomicron lacks the necessary metabolicpathways to harvest more complex oligosaccharides in theintestinal lumen: this is consistent with the carbon starvationtranscriptional signature observed for E. coli in the luminalcompartment (Fig. 3c).
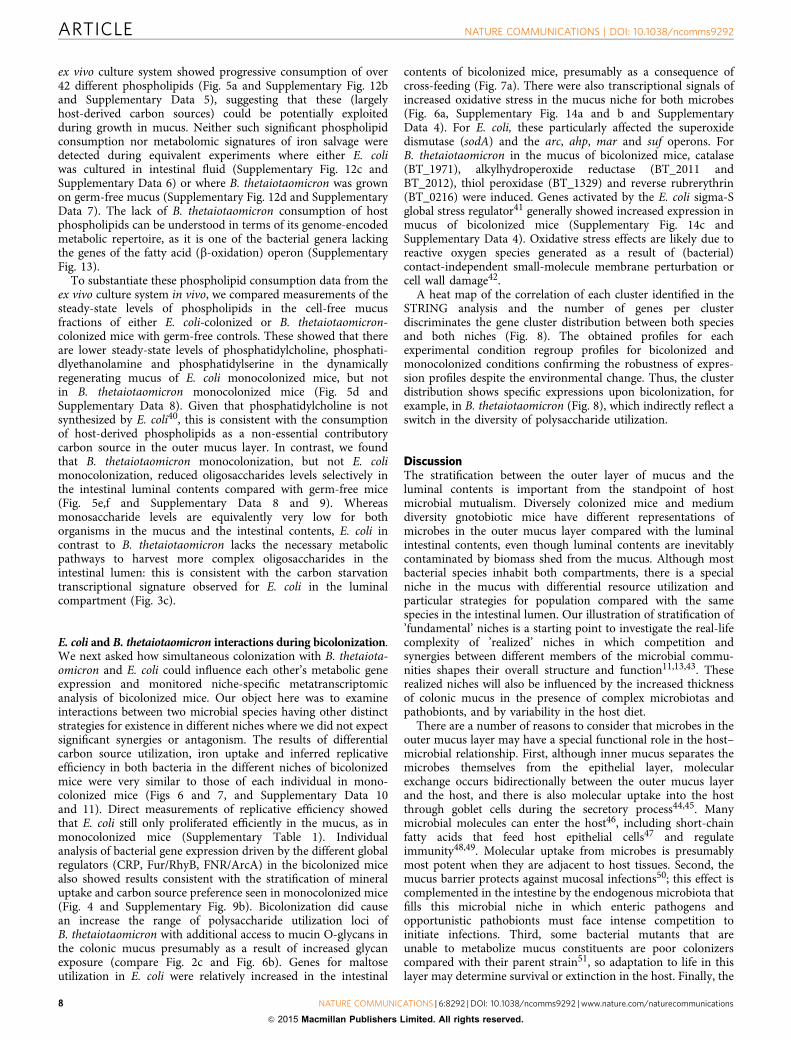
E. coli and B. thetaiotaomicron interactions during bicolonization.We next asked how simultaneous colonization with B. thetaiota-omicron and E. coli could influence each other’s metabolic geneexpression and monitored niche-specific metatranscriptomicanalysis of bicolonized mice. Our object here was to examineinteractions between two microbial species having other distinctstrategies for existence in different niches where we did not expectsignificant synergies or antagonism. The results of differentialcarbon source utilization, iron uptake and inferred replicativeefficiency in both bacteria in the different niches of bicolonizedmice were very similar to those of each individual in mono-colonized mice (Figs 6 and 7, and Supplementary Data 10and 11). Direct measurements of replicative efficiency showedthat E. coli still only proliferated efficiently in the mucus, as inmonocolonized mice (Supplementary Table 1). Individualanalysis of bacterial gene expression driven by the different globalregulators (CRP, Fur/RhyB, FNR/ArcA) in the bicolonized micealso showed results consistent with the stratification of mineraluptake and carbon source preference seen in monocolonized mice(Fig. 4 and Supplementary Fig. 9b). Bicolonization did causean increase the range of polysaccharide utilization loci ofB. thetaiotaomicron with additional access to mucin O-glycans inthe colonic mucus presumably as a result of increased glycanexposure (compare Fig. 2c and Fig. 6b). Genes for maltoseutilization in E. coli were relatively increased in the intestinal
contents of bicolonized mice, presumably as a consequence ofcross-feeding (Fig. 7a). There were also transcriptional signals ofincreased oxidative stress in the mucus niche for both microbes(Fig. 6a, Supplementary Fig. 14a and b and SupplementaryData 4). For E. coli, these particularly affected the superoxidedismutase (sodA) and the arc, ahp, mar and suf operons. ForB. thetaiotaomicron in the mucus of bicolonized mice, catalase(BT_1971), alkylhydroperoxide reductase (BT_2011 andBT_2012), thiol peroxidase (BT_1329) and reverse rubrerythrin(BT_0216) were induced. Genes activated by the E. coli sigma-Sglobal stress regulator41 generally showed increased expression inmucus of bicolonized mice (Supplementary Fig. 14c andSupplementary Data 4). Oxidative stress effects are likely due toreactive oxygen species generated as a result of (bacterial)contact-independent small-molecule membrane perturbation orcell wall damage42.
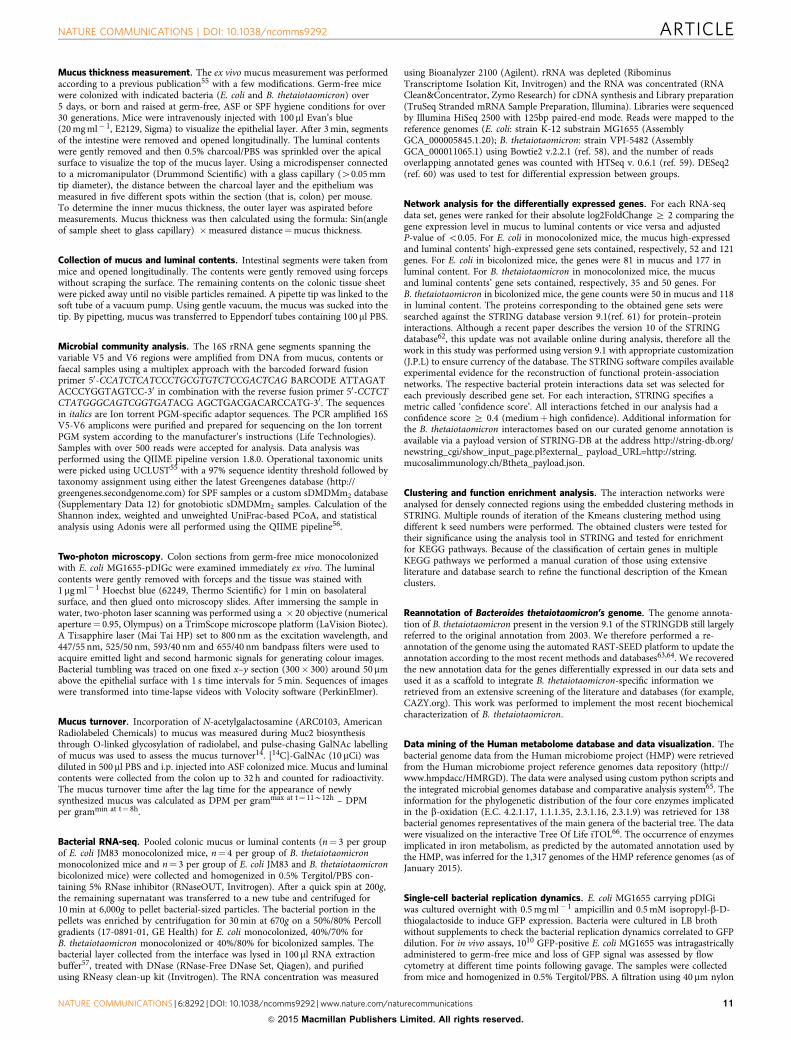
A heat map of the correlation of each cluster identified in theSTRING analysis and the number of genes per clusterdiscriminates the gene cluster distribution between both speciesand both niches (Fig. 8). The obtained profiles for eachexperimental condition regroup profiles for bicolonized andmonocolonized conditions confirming the robustness of expres-sion profiles despite the environmental change. Thus, the clusterdistribution shows specific expressions upon bicolonization, forexample, in B. thetaiotaomicron (Fig. 8), which indirectly reflect aswitch in the diversity of polysaccharide utilization.
DiscussionThe stratification between the outer layer of mucus and theluminal contents is important from the standpoint of hostmicrobial mutualism. Diversely colonized mice and mediumdiversity gnotobiotic mice have different representations ofmicrobes in the outer mucus layer compared with the luminalintestinal contents, even though luminal contents are inevitablycontaminated by biomass shed from the mucus. Although mostbacterial species inhabit both compartments, there is a specialniche in the mucus with differential resource utilization andparticular strategies for population compared with the samespecies in the intestinal lumen. Our illustration of stratification of’fundamental’ niches is a starting point to investigate the real-lifecomplexity of ’realized’ niches in which competition andsynergies between different members of the microbial commu-nities shapes their overall structure and function11,13,43. Theserealized niches will also be influenced by the increased thicknessof colonic mucus in the presence of complex microbiotas andpathobionts, and by variability in the host diet.
There are a number of reasons to consider that microbes in theouter mucus layer may have a special functional role in the host–microbial relationship. First, although inner mucus separates themicrobes themselves from the epithelial layer, molecularexchange occurs bidirectionally between the outer mucus layerand the host, and there is also molecular uptake into the hostthrough goblet cells during the secretory process44,45. Manymicrobial molecules can enter the host46, including short-chainfatty acids that feed host epithelial cells47 and regulateimmunity48,49. Molecular uptake from microbes is presumablymost potent when they are adjacent to host tissues. Second, themucus barrier protects against mucosal infections50; this effect iscomplemented in the intestine by the endogenous microbiota thatfills this microbial niche in which enteric pathogens andopportunistic pathobionts must face intense competition toinitiate infections. Third, some bacterial mutants that areunable to metabolize mucus constituents are poor colonizerscompared with their parent strain51, so adaptation to life in thislayer may determine survival or extinction in the host. Finally, the
ARTICLE NATURE COMMUNICATIONS | DOI: 10.1038/ncomms9292
8 NATURE COMMUNICATIONS | 6:8292 | DOI: 10.1038/ncomms9292 | www.nature.com/naturecommunications
& 2015 Macmillan Publishers Limited. All rights reserved.
mucus layer is a very challenging habitat as it is undergoing rapidrenewal with a timescale of several hours. This means thatmicrobes must be fit enough to be renewed or replenished at thesame rate while competing with each other for resources topersist within this especially intimate and stressful niche of thehost–microbial intestinal biomass.
Much of the current literature, which seeks to relate intestinalmicrobiotas to host phenotypes or diet, is dominated bycomposition assessments of the microbes and their genomiccomposition in the luminal contents or in the excreta of humanand animal hosts. Although such assessments can provide a firstapproximation of the microbiota biomass and metabolicpotential, they do not capture actual metabolic variations alongthe length of the intestine or—as we now show—the differenttransverse niches. The colonic mucus niche harbours microbesthat adapt their metabolism to the availability of shedhost compounds, according to their genome-encoded repertoire.These functional differences, presented from studies in
gnotobiotic mice, provide an insight into the likely complexityof metabolic interactions, both within consortia, and betweenconsortia and their host. The functional interactions withinmicrobial members of natural complex microbiota and their hostare likely to vary not only according to community compositionand diet, but also with position transversely and longitudinally inthe intestinal tract.
MethodsMice and hygiene status. C57BL/6 mice were re-derived to germ-free status52.Gnotobiotic C57BL/6 mice colonized with ASF or sDMDMm2 containing 12defined bacterial strains (called the Oligo-Mouse-Microbiota, see ‘Bacterial strains’)were generated and maintained at the clean mouse facility of the Universityof Bern. SPF mice (on a C57BL/6 background) were purchased from HarlanLaboratories. Monocolonization was performed by intragastric administrationof 1010 colony-forming units (CFU; if not otherwise specified) of E. coli orB. thetaiotaomicron into 8- to 16-week-old mixed-sex germ-free mice.Bicolonization was established in 8- to 16-week-old mixed-sex germ-free mice byorally gavaging with 1010 CFU of E. coli and 1010 CFU of B. thetaiotaomicron. Mice
BT_0620BT_1295BT_1274BT_1298BT_1276 BT_0622
BT_1297 BT_0619BT_1277 BT_0416
BT_1296
BT_4703
BT_1156
BT_0621BT_4704BT_1273BT_1444
BT_1155BT_0460
BT_0415BT_1446
BT_0506BT_1445 BT_0507
BT_0370BT_0461
BT_3330
BT_4050
BT_3328
BT_3329
BT_0224
BT_4654
BT_0225
BT_1359
BT_4653
BT_3602
BT_4657
BT_1360BT_2454BT_3572
BT_4658
BT_3573
BT_2824
BT_4652
BT_2451BT_2452
BT_2820BT_2968 BT_2825BT_2809
BT_4660
BT_4659 BT_2819BT_2818
BT_2823 BT_2807
BT_1553BT_3984
BT_2808BT_4294
BT_4299
BT_2805BT_4297
BT_3280 BT_2804BT_3796 BT_4298
BT_4295
BT_4296BT_2919 BT_4240
BT_3469 BT_4244BT_1047
BT_3620
BT_1934BT_2394BT_4246
BT_0273BT_1440 BT_4245BT_1045
BT_3618BT_3619
BT_1040
BT_0275BT_1042
BT_1049 BT_1039
BT_1439BT_1043BT_3983 BT_0274
BT_1035BT_1044BT_1048
BT_1036BT_3985
BT_1037BT_3987
BT_1038BT_3986
ATP synthesisFucose
degradation
Biotinsynthesis
Sodium translocation
Chondroitinsulfate
degradation(PUL n°57)
Mucin O-glycansdegradation(PUL n°80)
Mucin N-glycansdegradation(PUL n°14)
Mucin N-glycansdegradation (PUL n°72)
Mucin N-glycansdegradation (PUL n°14)
Mucin O-glycansdegradation(PUL n°78)
Mucin O-glycansdegradation (PUL n°38)
Glycosaminoglycans degradation(PUL n°85)
Arabinogalactandegradation (PUL n°5)
Host glycansdegradation
Iron import(enterobactin synthesis)
Iron uptakeand
mobilization
pdhRgpmI ndh
lysU eno gapA yeeXentD
fepGfepD
ahpCfhuC ompA
sodA marR
fhuDmarA
marBompX
fhuEfecR yhjRydiE
yncEfecIiraM
yjjZyqjH
yjcBfhuF ybaN
bfd
glnG nrdHglnL yqjI
yhhKsufB sufC
proV yjgH
ybfE
yjgJ
gcvPproP
fldAgcvT
mscS
fhuA
fepA
yedR
fepB
fesexbB
entCexbD
ybiX
entEentF
cirA
Glycolysis
Oxidative stressresponse
Electron transfer(oxidative stress)
cnu
Glutaminemetabolism
Glycine degradation
Glycine betaine/proline uptake
Fe-S clusterformation(low iron;
oxidative stress)
a
b
E. coli in bicolonized colonic mucus
B. thetaiotaomicron in bicolonized colonic mucus
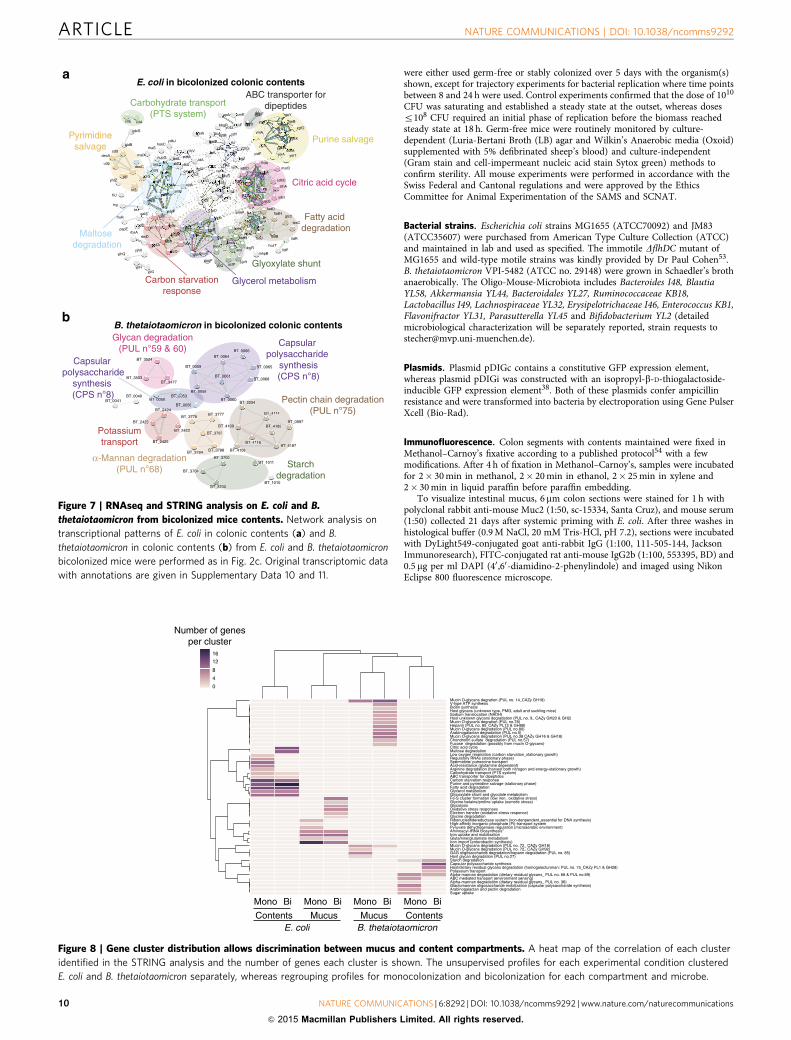
Figure 6 | RNAseq and STRING analysis on E. coli and B. thetaiotaomicron from bicolonized mice mucus. Network analysis on transcriptional
patterns of E. coli in colonic mucus (a) and B. thetaiotaomicron in colonic mucus (b) from E. coli and B. thetaiotaomicron bicolonized mice were
performed as in Fig. 2c. Original transcriptomic data with annotations are given in Supplementary Data 10 and 11.
NATURE COMMUNICATIONS | DOI: 10.1038/ncomms9292 ARTICLE
NATURE COMMUNICATIONS | 6:8292 | DOI: 10.1038/ncomms9292 | www.nature.com/naturecommunications 9
& 2015 Macmillan Publishers Limited. All rights reserved.
were either used germ-free or stably colonized over 5 days with the organism(s)shown, except for trajectory experiments for bacterial replication where time pointsbetween 8 and 24 h were used. Control experiments confirmed that the dose of 1010
CFU was saturating and established a steady state at the outset, whereas dosesr108 CFU required an initial phase of replication before the biomass reachedsteady state at 18 h. Germ-free mice were routinely monitored by culture-dependent (Luria-Bertani Broth (LB) agar and Wilkin’s Anaerobic media (Oxoid)supplemented with 5% defibrinated sheep’s blood) and culture-independent(Gram stain and cell-impermeant nucleic acid stain Sytox green) methods toconfirm sterility. All mouse experiments were performed in accordance with theSwiss Federal and Cantonal regulations and were approved by the EthicsCommittee for Animal Experimentation of the SAMS and SCNAT.
Bacterial strains. Escherichia coli strains MG1655 (ATCC70092) and JM83(ATCC35607) were purchased from American Type Culture Collection (ATCC)and maintained in lab and used as specified. The immotile DflhDC mutant ofMG1655 and wild-type motile strains was kindly provided by Dr Paul Cohen53.B. thetaiotaomicron VPI-5482 (ATCC no. 29148) were grown in Schaedler’s brothanaerobically. The Oligo-Mouse-Microbiota includes Bacteroides I48, BlautiaYL58, Akkermansia YL44, Bacteroidales YL27, Ruminococcaceae KB18,Lactobacillus I49, Lachnospiraceae YL32, Erysipelotrichaceae I46, Enterococcus KB1,Flavonifractor YL31, Parasutterella YL45 and Bifidobacterium YL2 (detailedmicrobiological characterization will be separately reported, strain requests [email protected]).
Plasmids. Plasmid pDIGc contains a constitutive GFP expression element,whereas plasmid pDIGi was constructed with an isopropyl-b-D-thiogalactoside-inducible GFP expression element38. Both of these plasmids confer ampicillinresistance and were transformed into bacteria by electroporation using Gene PulserXcell (Bio-Rad).
Immunofluorescence. Colon segments with contents maintained were fixed inMethanol–Carnoy’s fixative according to a published protocol54 with a fewmodifications. After 4 h of fixation in Methanol–Carnoy’s, samples were incubatedfor 2� 30 min in methanol, 2� 20 min in ethanol, 2� 25 min in xylene and2� 30 min in liquid paraffin before paraffin embedding.
To visualize intestinal mucus, 6 mm colon sections were stained for 1 h withpolyclonal rabbit anti-mouse Muc2 (1:50, sc-15334, Santa Cruz), and mouse serum(1:50) collected 21 days after systemic priming with E. coli. After three washes inhistological buffer (0.9 M NaCl, 20 mM Tris-HCl, pH 7.2), sections were incubatedwith DyLight549-conjugated goat anti-rabbit IgG (1:100, 111-505-144, JacksonImmunoresearch), FITC-conjugated rat anti-mouse IgG2b (1:100, 553395, BD) and0.5 mg per ml DAPI (40 ,60-diamidino-2-phenylindole) and imaged using NikonEclipse 800 fluorescence microscope.
BT_0066BT_0064
BT_3524
BT_0065BT_0059
BT_0068BT_0061BT_3503
BT_3477
BT_0058BT_0053
BT_0050 BT_0060BT_0040
BT_0056BT_0041 BT_2254
BT_3777BT_3778
BT_4114BT_2424
BT_0997BT_4109
BT_2423BT_4185
BT_2422BT_3787
BT_4116BT_2425BT_4187
BT_4108BT_3788BT_3784
BT_1011BT_3703
BT_3704
BT_1010BT_3702
Capsular polysaccharide
synthesis(CPS n°8)
Pectin chain degradation(PUL n°75)
Starchdegradation
Glycan degradation(PUL n°59 & 60)
Potassiumtransport
α-Mannan degradation(PUL n°68)
Glyoxylate shunt
dppFccmE ygeYnapA
srlE srlA yqeBdppDnapFabgR
ycdZ ygfOydcS
melA tdcAygeX
eptB yjfY yniA
melR yjfNygeW
aldB
ssnA
ydbJ
ybhQcsiEhokC
yebVivbL yjfOyfeK yidF
rhaScdd
nupGyeiA
mtfAtnaLdeoA
agpyeiT
gldAmalX
malMtsx yaiZaraC ptsAudpydbC lsrAecfJ msrB
ydeN sdhA
deoCrseAtnaB ompW
sdhD
yghZ bssRyjjI ptsGsdhCecfGmalTyhfZ ydcHycbJ
flhD
aspAtnaAychH sthA
ecfI uspFlamBsucAmalEfliJ
yeaYrmf ydcIglgS sucBmalB
sucCtrgaer fadDcspDmalF
mglBgalS
glpK
paaK fadHfruR glcC
glpTybdD dctAcstAgatYtesC
glpQpspE aceKglpBhcaR
fadBglpCrbsA
glpF aceA lldRaldA aceB
rbsD
fucAppsAmhpR
hcaTacs lldP
puuC
fucO puuEyjhX
glpAyjhQ
yjcHactP
puuPyfiQyjiH
yjiG
ygfM
xdhD
ygfK
fadE
yqeF
fadJpaaJ
fadAfadI
sdhBfumA
sucD
frdA
Carbon starvationresponse
Glycerol metabolism
Fatty acid degradation
Maltose degradation
Carbohydrate transport(PTS system)
Citric acid cycle
Pyrimidinesalvage
Purine salvage
ABC transporter fordipeptides
a
b
mhpB
ygeV
E. coli in bicolonized colonic contents
B. thetaiotaomicron in bicolonized colonic contents
Capsular polysaccharide
synthesis (CPS n°8) B
BT_0053BT_0050
BT_00562424
BT_BT_3703
04
BT_3702
BT_33778
BT422
BT_3787
BT_37T_3784
BT_2424
23
BT_
BT 2425
_3524
03BT_34
BT_2254
BT_4114
BT_09 BT_4185
BT_4116BT_41
08
BT_0066BT_0064
BT0059
BTBT_0061
BT_0058
BT_0060
BT_0
T
053TT
TT
0
B
_
_05
TT
00
_
0
053
03
BTTT
T 37
T 00T 00T 0000000000
T 00
T 24
B
Figure 7 | RNAseq and STRING analysis on E. coli and B.
thetaiotaomicron from bicolonized mice contents. Network analysis on
transcriptional patterns of E. coli in colonic contents (a) and B.
thetaiotaomicron in colonic contents (b) from E. coli and B. thetaiotaomicron
bicolonized mice were performed as in Fig. 2c. Original transcriptomic data
with annotations are given in Supplementary Data 10 and 11.
16
12
8
4
0
Number of genesper cluster
Mono Bi Mono Bi Mono Bi Mono Bi
Contents ContentsMucus MucusE. coli B. thetaiotaomicron
Mucin O-glycans degration (PUL no. 14_CAZy GH18)
Mucin O-glycans degration (PUL no.78)Heparin (PUL no. 85_CAZy PL12 & GH88)Mucin O-glycans degradation (PUL no.80)Arabinogalactan degradation (PUL no.5)Mucin O-glycans degradation (PUL no.38 CAZy GH16 & GH18)Chondroitin sulfate degradation (PUL no.57)Fucose degradation (possibly from mucin O-glycans)Citric acid cycleMaltose degradationLow oxygen respiration (carbon starvation_stationary growth)Regulatory RNAs (stationary phase)Spermidine/ putrescine transportAcid-resistance (glutamine dependent)Arginine degradation (harvest both nitrogen and energy-stationary growth)Carbohydrate transport (PTS system)ABC transporter for dipeptidesCarbon starvation responsePurine and pyrimidine salvage (stationary phase)Fatty acid degradation
Glycoxylate shunt and glycolate metabolismFe-S cluster formation (low iron_ oxidative stress)
GlycolysisOxidative stress responsesElectron transfer (oxidative stress responce)Glycine degradation
Iron import (enterobactin synthesis)
Host/dietary residual glycans degradation (homogalacturonan: PUL no. 75_CAZy PL1 & GH28)
Sugar uptakeArabinogalactan and pectin degradationGlactomannan oligosaccharide mobilization (capsular polysaccharide synthesis)Alpha-mannan degradation (dietary residual glycans_ PUL no. 36)ABC mediated transport (environment sensing)Alpha-mannan degradation (dietary residual glycans_ PUL no. 68 & PUL no.69)Potassium transport
Capsular polysaccharide synthesisStarch degradationHost glycan degradation (PUL no.27)GAG oligosaccharide degradation/heparin degradation (PUL no. 85)Mucin O-glycans degradation (PUL no. 72_ CAZy GH92)Mucin O-glycans degradation (PUL no. 72_ CAZy GH18)
Glutamine/glutamate metabolismIron uptake and mobilisationAminoacyl-tRNA biosynthesis*Pyruvate dehydrogenase regulation (microaerobic environment)High-affinity inorganic phosphate (Pi)-transport systemRibonucleotidereductase system (iron-denpendent_essential for DNA synthesis)
Glycine betaine/proline uptake (osmotic stress)
Glycerol metabolism
V-type ATP synthesisBiotin synthesisHost glycans (unknown type, PMG, adult and suckling mice)Sodium translocation (NADH)Host unknown glycans degradation (PUL no. 9_ CAZy GH20 & GH2)
Figure 8 | Gene cluster distribution allows discrimination between mucus and content compartments. A heat map of the correlation of each cluster
identified in the STRING analysis and the number of genes each cluster is shown. The unsupervised profiles for each experimental condition clustered
E. coli and B. thetaiotaomicron separately, whereas regrouping profiles for monocolonization and bicolonization for each compartment and microbe.
ARTICLE NATURE COMMUNICATIONS | DOI: 10.1038/ncomms9292
10 NATURE COMMUNICATIONS | 6:8292 | DOI: 10.1038/ncomms9292 | www.nature.com/naturecommunications
& 2015 Macmillan Publishers Limited. All rights reserved.
Mucus thickness measurement. The ex vivo mucus measurement was performedaccording to a previous publication55 with a few modifications. Germ-free micewere colonized with indicated bacteria (E. coli and B. thetaiotaomicron) over5 days, or born and raised at germ-free, ASF or SPF hygiene conditions for over30 generations. Mice were intravenously injected with 100 ml Evan’s blue(20 mg ml� 1, E2129, Sigma) to visualize the epithelial layer. After 3 min, segmentsof the intestine were removed and opened longitudinally. The luminal contentswere gently removed and then 0.5% charcoal/PBS was sprinkled over the apicalsurface to visualize the top of the mucus layer. Using a microdispenser connectedto a micromanipulator (Drummond Scientific) with a glass capillary (40.05 mmtip diameter), the distance between the charcoal layer and the epithelium wasmeasured in five different spots within the section (that is, colon) per mouse.To determine the inner mucus thickness, the outer layer was aspirated beforemeasurements. Mucus thickness was then calculated using the formula: Sin(angleof sample sheet to glass capillary) �measured distance¼mucus thickness.
Collection of mucus and luminal contents. Intestinal segments were taken frommice and opened longitudinally. The contents were gently removed using forcepswithout scraping the surface. The remaining contents on the colonic tissue sheetwere picked away until no visible particles remained. A pipette tip was linked to thesoft tube of a vacuum pump. Using gentle vacuum, the mucus was sucked into thetip. By pipetting, mucus was transferred to Eppendorf tubes containing 100 ml PBS.
Microbial community analysis. The 16S rRNA gene segments spanning thevariable V5 and V6 regions were amplified from DNA from mucus, contents orfaecal samples using a multiplex approach with the barcoded forward fusionprimer 50-CCATCTCATCCCTGCGTGTCTCCGACTCAG BARCODE ATTAGATACCCYGGTAGTCC-30 in combination with the reverse fusion primer 50-CCTCTCTATGGGCAGTCGGTGATACG AGCTGACGACARCCATG-30 . The sequencesin italics are Ion torrent PGM-specific adaptor sequences. The PCR amplified 16SV5-V6 amplicons were purified and prepared for sequencing on the Ion torrentPGM system according to the manufacturer’s instructions (Life Technologies).Samples with over 500 reads were accepted for analysis. Data analysis wasperformed using the QIIME pipeline version 1.8.0. Operational taxonomic unitswere picked using UCLUST55 with a 97% sequence identity threshold followed bytaxonomy assignment using either the latest Greengenes database (http://greengenes.secondgenome.com) for SPF samples or a custom sDMDMm2 database(Supplementary Data 12) for gnotobiotic sDMDMm2 samples. Calculation of theShannon index, weighted and unweighted UniFrac-based PCoA, and statisticalanalysis using Adonis were all performed using the QIIME pipeline56.
Two-photon microscopy. Colon sections from germ-free mice monocolonizedwith E. coli MG1655-pDIGc were examined immediately ex vivo. The luminalcontents were gently removed with forceps and the tissue was stained with1 mg ml� 1 Hoechst blue (62249, Thermo Scientific) for 1 min on basolateralsurface, and then glued onto microscopy slides. After immersing the sample inwater, two-photon laser scanning was performed using a � 20 objective (numericalaperture¼ 0.95, Olympus) on a TrimScope microscope platform (LaVision Biotec).A Ti:sapphire laser (Mai Tai HP) set to 800 nm as the excitation wavelength, and447/55 nm, 525/50 nm, 593/40 nm and 655/40 nm bandpass filters were used toacquire emitted light and second harmonic signals for generating colour images.Bacterial tumbling was traced on one fixed x–y section (300� 300) around 50mmabove the epithelial surface with 1 s time intervals for 5 min. Sequences of imageswere transformed into time-lapse videos with Volocity software (PerkinElmer).
Mucus turnover. Incorporation of N-acetylgalactosamine (ARC0103, AmericanRadiolabeled Chemicals) to mucus was measured during Muc2 biosynthesisthrough O-linked glycosylation of radiolabel, and pulse-chasing GalNAc labellingof mucus was used to assess the mucus turnover14. [14C]-GalNAc (10 mCi) wasdiluted in 500ml PBS and i.p. injected into ASF colonized mice. Mucus and luminalcontents were collected from the colon up to 32 h and counted for radioactivity.The mucus turnover time after the lag time for the appearance of newlysynthesized mucus was calculated as DPM per grammax at t¼ 11B12h – DPMper grammin at t¼ 8h.
Bacterial RNA-seq. Pooled colonic mucus or luminal contents (n¼ 3 per groupof E. coli JM83 monocolonized mice, n¼ 4 per group of B. thetaiotaomicronmonocolonized mice and n¼ 3 per group of E. coli JM83 and B. thetaiotaomicronbicolonized mice) were collected and homogenized in 0.5% Tergitol/PBS con-taining 5% RNase inhibitor (RNaseOUT, Invitrogen). After a quick spin at 200g,the remaining supernatant was transferred to a new tube and centrifuged for10 min at 6,000g to pellet bacterial-sized particles. The bacterial portion in thepellets was enriched by centrifugation for 30 min at 670g on a 50%/80% Percollgradients (17-0891-01, GE Health) for E. coli monocolonized, 40%/70% forB. thetaiotaomicron monocolonized or 40%/80% for bicolonized samples. Thebacterial layer collected from the interface was lysed in 100 ml RNA extractionbuffer57, treated with DNase (RNase-Free DNase Set, Qiagen), and purifiedusing RNeasy clean-up kit (Invitrogen). The RNA concentration was measured
using Bioanalyzer 2100 (Agilent). rRNA was depleted (RibominusTranscriptome Isolation Kit, Invitrogen) and the RNA was concentrated (RNAClean&Concentrator, Zymo Research) for cDNA synthesis and Library preparation(TruSeq Stranded mRNA Sample Preparation, Illumina). Libraries were sequencedby Illumina HiSeq 2500 with 125bp paired-end mode. Reads were mapped to thereference genomes (E. coli: strain K-12 substrain MG1655 (AssemblyGCA_000005845.1.20); B. thetaiotaomicron: strain VPI-5482 (AssemblyGCA_000011065.1) using Bowtie2 v.2.2.1 (ref. 58), and the number of readsoverlapping annotated genes was counted with HTSeq v. 0.6.1 (ref. 59). DESeq2(ref. 60) was used to test for differential expression between groups.
Network analysis for the differentially expressed genes. For each RNA-seqdata set, genes were ranked for their absolute log2FoldChange Z 2 comparing thegene expression level in mucus to luminal contents or vice versa and adjustedP-value of o0.05. For E. coli in monocolonized mice, the mucus high-expressedand luminal contents’ high-expressed gene sets contained, respectively, 52 and 121genes. For E. coli in bicolonized mice, the genes were 81 in mucus and 177 inluminal content. For B. thetaiotaomicron in monocolonized mice, the mucusand luminal contents’ gene sets contained, respectively, 35 and 50 genes. ForB. thetaiotaomicron in bicolonized mice, the gene counts were 50 in mucus and 118in luminal content. The proteins corresponding to the obtained gene sets weresearched against the STRING database version 9.1(ref. 61) for protein–proteininteractions. Although a recent paper describes the version 10 of the STRINGdatabase62, this update was not available online during analysis, therefore all thework in this study was performed using version 9.1 with appropriate customization(J.P.L) to ensure currency of the database. The STRING software compiles availableexperimental evidence for the reconstruction of functional protein-associationnetworks. The respective bacterial protein interactions data set was selected foreach previously described gene set. For each interaction, STRING specifies ametric called ‘confidence score’. All interactions fetched in our analysis had aconfidence score Z 0.4 (mediumþ high confidence). Additional information forthe B. thetaiotaomicron interactomes based on our curated genome annotation isavailable via a payload version of STRING-DB at the address http://string-db.org/newstring_cgi/show_input_page.pl?external_ payload_URL=http://string.mucosalimmunology.ch/Btheta_payload.json.
Clustering and function enrichment analysis. The interaction networks wereanalysed for densely connected regions using the embedded clustering methods inSTRING. Multiple rounds of iteration of the Kmeans clustering method usingdifferent k seed numbers were performed. The obtained clusters were tested fortheir significance using the analysis tool in STRING and tested for enrichmentfor KEGG pathways. Because of the classification of certain genes in multipleKEGG pathways we performed a manual curation of those using extensiveliterature and database search to refine the functional description of the Kmeanclusters.
Reannotation of Bacteroides thetaiotaomicron’s genome. The genome annota-tion of B. thetaiotaomicron present in the version 9.1 of the STRINGDB still largelyreferred to the original annotation from 2003. We therefore performed a re-annotation of the genome using the automated RAST-SEED platform to update theannotation according to the most recent methods and databases63,64. We recoveredthe new annotation data for the genes differentially expressed in our data sets andused it as a scaffold to integrate B. thetaiotaomicron-specific information weretrieved from an extensive screening of the literature and databases (for example,CAZY.org). This work was performed to implement the most recent biochemicalcharacterization of B. thetaiotaomicron.
Data mining of the Human metabolome database and data visualization. Thebacterial genome data from the Human microbiome project (HMP) were retrievedfrom the Human microbiome project reference genomes data repository (http://www.hmpdacc/HMRGD). The data were analysed using custom python scripts andthe integrated microbial genomes database and comparative analysis system65. Theinformation for the phylogenetic distribution of the four core enzymes implicatedin the b-oxidation (E.C. 4.2.1.17, 1.1.1.35, 2.3.1.16, 2.3.1.9) was retrieved for 138bacterial genomes representatives of the main genera of the bacterial tree. The datawere visualized on the interactive Tree Of Life iTOL66. The occurrence of enzymesimplicated in iron metabolism, as predicted by the automated annotation used bythe HMP, was inferred for the 1,317 genomes of the HMP reference genomes (as ofJanuary 2015).
Single-cell bacterial replication dynamics. E. coli MG1655 carrying pDIGiwas cultured overnight with 0.5 mg ml� 1 ampicillin and 0.5 mM isopropyl-b-D-thiogalactoside to induce GFP expression. Bacteria were cultured in LB brothwithout supplements to check the bacterial replication dynamics correlated to GFPdilution. For in vivo assays, 1010 GFP-positive E. coli MG1655 was intragastricallyadministered to germ-free mice and loss of GFP signal was assessed by flowcytometry at different time points following gavage. The samples were collectedfrom mice and homogenized in 0.5% Tergitol/PBS. A filtration using 40 mm nylon
NATURE COMMUNICATIONS | DOI: 10.1038/ncomms9292 ARTICLE
NATURE COMMUNICATIONS | 6:8292 | DOI: 10.1038/ncomms9292 | www.nature.com/naturecommunications 11
& 2015 Macmillan Publishers Limited. All rights reserved.
filter was done on samples before flow cytometric acquisition. After sampleacquisition on a FACSArray (BD), the results are analysed by Flowjo(Version 9.5.3).
Bacterial in vivo replication assay by radioactivity. Bacteria were radiolabelledby supplementing [32P] phosphate (NEX011002MC, PerkinElmer), to cultures at5 mCi per 30 ml for each mouse for E. coli and 10 mCi per 50 ml for each mouse forB. thetaiotaomicron. After oral gavage of 1010 CFU [32P] bacteria to germ-freemice, the colonic mucus and contents were isolated at 8, 12 and 24 h after gavage.Bacterial CFU was determined by culture of half of each sample on LB plates(E. coli) or blood agar plates (B. thetaiotaomicron). The other half of each samplewas homogenized in 1 ml of NCS II Tissue solubilizer (GE Healthcare) for aminimum of 1 h at 56 �C. Once solubilized, 100 ml of glacial acetic acid and 18 ml ofULTIMA Gold liquid scintillation cocktail (PerkinElmer) was added and the levelof 32P radioactivity was measured in disintegrations per minute (DPM) using aTRI-Carb 2300TR Liquid Scintillation Analyzer (Packard). Colorimetric quenchcurves were created using caecal contents to ensure accurate measuring of 32P inbiological samples. Baseline levels of 32P were determined by measuring the levelsof radioactivity in germ-free mice. The replication rate of bacteria was determinedby calculating 1 slope� 1 of linear regression of DPM bacterium� 1.
Ex vivo and in vivo metabolic consumption assay. For the ex vivo consumptionassay, colonic mucus and contents were collected from germ-free mice andhomogenized in M9 minimal media. After removal of particulate material from thehomogenate, the supernatants were transferred to 96-deep-well bacterial cultureplates. 104 CFU of E. coli or B. thetaiotaomicron (B. thetaiotaomicron cultures werealso supplemented with 1 mM vitamin B6 and 5.8 mM vitamin K3) were inoculatedinto each well and cultured at 37 �C anaerobically. Aliquots of the culture werecollected at 0, 1, 2, 3, 6, 9 and 24 h. Bacteria were removed by centrifugation andthe supernatants were subjected to mass spectrometry (MS) after precipitation ofthe MS undetectable large molecules by adding four volumes of methanol.
For the in vivo metabolites assay, 1010 CFU E. coli or B. thetaiotaomicron weregavaged into germ-free mice. Colonic mucus and contents were collected frommonocolonized mice and control germ-free mice. Hot water extraction wasperformed on samples by continuous heavy shaking at 80 �C for 3 min. Particleswere pelleted by centrifugation and supernatants were subjected to analysis on MS.
A 6550 Agilent Q-TOF mass spectrometer was used for measuring metabolitesby untargeted flow injection analysis as described previously67. Profile spectra withhigh mass accuracy were recorded from 50 to 1,000 m/z in negative ionizationmode. Ions were annotated based on accurate mass comparison using 5 mDa masstolerance against 9,261 unique metabolites present in the Human MetabolomeDatabase68.
Statistics. Graphpad Prism 6 software was used for both statistical analysis andto perform linear and nonlinear regression analysis. Statistical tests used wereMann–Whitney test (P o 0.05) and paired/unpaired Student’s t-test. Adonisstatistics were performed using QIIME56.
References1. Atuma, C., Strugala, V., Allen, A. & Holm, L. The adherent gastrointestinal
mucus gel layer: thickness and physical state in vivo. Am. J. Physiol.Gastrointest. Liver Physiol. 280, G922–G929 (2001).
2. Johansson, M. E. et al. The inner of the two Muc2 mucin-dependent mucuslayers in colon is devoid of bacteria. Proc. Natl Acad Sci. USA 105,15064–15069 (2008).
3. Wlodarska, M. et al. NLRP6 inflammasome orchestrates the colonichost-microbial interface by regulating goblet cell mucus secretion. Cell 156,1045–1059 (2014).
4. Jakobsson, H. E. et al. The composition of the gut microbiota shapes the colonmucus barrier. EMBO Rep. 16, 164–177 (2015).
5. Albenberg, L. et al. Correlation between intraluminal oxygen gradient andradial partitioning of intestinal microbiota. Gastroenterology 147, 1055–1063e1058 (2014).
6. Bjursell, M. K., Martens, E. C. & Gordon, J. I. Functional genomic andmetabolic studies of the adaptations of a prominent adult human gut symbiont,Bacteroides thetaiotaomicron, to the suckling period. J. Biol. Chem. 281,36269–36279 (2006).
7. Sonnenburg, J. L. et al. Glycan foraging in vivo by an intestine-adapted bacterialsymbiont. Science 307, 1955–1959 (2005).
8. Miranda, R. L. et al. Glycolytic and gluconeogenic growth of Escherichia coliO157:H7 (EDL933) and E. coli K-12 (MG1655) in the mouse intestine. Infect.Immun. 72, 1666–1676 (2004).
9. Conway, P. L., Welin, A. & Cohen, P. S. Presence of K88-specific receptors inporcine ileal mucus is age dependent. Infect. Immun. 58, 3178–3182 (1990).
10. Wadolkowski, E. A., Laux, D. C. & Cohen, P. S. Colonization of thestreptomycin-treated mouse large intestine by a human fecal Escherichia colistrain: role of growth in mucus. Infect. Immun. 56, 1030–1035 (1988).
11. Putman, R. W., S. D. in Principles of Ecology, 105–126 (Univ. California, 1984).
12. Schoener, T. W. in The Princeton Guide to Ecology, 3–13 (Princeton Univ.,2012).
13. Chase, J. M. L., M. A. in Ecological Niches: Linking Classical and ContemporaryApproaches (Univ. Chicago, 2003).
14. Johansson, M. E. Fast renewal of the distal colonic mucus layers by the surfacegoblet cells as measured by in vivo labeling of mucin glycoproteins. PLoS ONE7, e41009 (2012).
15. Shan, M. et al. Mucus enhances gut homeostasis and oral tolerance bydelivering immunoregulatory signals. Science 342, 447–453 (2013).
16. Kawamoto, S. et al. Foxp3(þ ) T cells regulate immunoglobulin a selection andfacilitate diversification of bacterial species responsible for immunehomeostasis. Immunity 41, 152–165 (2014).
17. Winter, S. E. et al. Host-derived nitrate boosts growth of E. coli in the inflamedgut. Science 339, 708–711 (2013).
18. Frank, D. N. et al. Molecular-phylogenetic characterization of microbialcommunity imbalances in human inflammatory bowel diseases. Proc. NatlAcad. Sci. USA 104, 13780–13785 (2007).
19. Garrett, W. S. et al. Enterobacteriaceae act in concert with the gut microbiota toinduce spontaneous and maternally transmitted colitis. Cell Host Microbe 8,292–300 (2010).
20. Fabich, A. J. et al. Comparison of carbon nutrition for pathogenic andcommensal Escherichia coli strains in the mouse intestine. Infect. Immun. 76,1143–1152 (2008).
21. Molloy, M. J. et al. Intraluminal containment of commensal outgrowth inthe gut during infection-induced dysbiosis. Cell Host Microbe 14, 318–328(2013).
22. Peterson, D. A., Frank, D. N., Pace, N. R. & Gordon, J. I. Metagenomicapproaches for defining the pathogenesis of inflammatory bowel diseases. CellHost Microbe 3, 417–427 (2008).
23. Ge, Z. et al. Colonization dynamics of altered Schaedler flora is influenced bygender, aging, and Helicobacter hepaticus infection in the intestines of SwissWebster mice. Appl. Environ. Microbiol. 72, 5100–5103 (2006).
24. Martens, E. C., Chiang, H. C. & Gordon, J. I. Mucosal glycan foraging enhancesfitness and transmission of a saccharolytic human gut bacterial symbiont. CellHost Microbe 4, 447–457 (2008).
25. Szklarczyk, D. et al. The STRING database in 2011: functional interactionnetworks of proteins, globally integrated and scored. Nucleic Acids Res. 39,D561–D568 (2011).
26. Cuskin, F. et al. Human gut Bacteroidetes can utilize yeast mannan through aselfish mechanism. Nature 517, 165–169 (2015).
27. Nihira, T. et al. Discovery of beta-1,4-D-mannosyl-N-acetyl-D-glucosaminephosphorylase involved in the metabolism of N-glycans. J. Biol. Chem. 288,27366–27374 (2013).
28. TerAvest, M. A. et al. Regulated expression of polysaccharide utilizationand capsular biosynthesis loci in biofilm and planktonic Bacteroidesthetaiotaomicron during growth in chemostats. Biotechnol. Bioeng. 111,165–173 (2014).
29. McHugh, J. P. et al. Global iron-dependent gene regulation in Escherichia coli.A new mechanism for iron homeostasis. J. Biol. Chem. 278, 29478–29486(2003).
30. Masse, E. & Gottesman, S. A small RNA regulates the expression of genesinvolved in iron metabolism in Escherichia coli. Proc. Natl Acad. Sci. USA 99,4620–4625 (2002).
31. Trotter, E. W. et al. Reprogramming of Escherichia coli K-12 metabolismduring the initial phase of transition from an anaerobic to a micro-aerobicenvironment. PLoS ONE 6, e25501 (2011).
32. Hantke, K. Selection procedure for deregulated iron transport mutants (fur) inEscherichia coli K 12: fur not only affects iron metabolism. Mol. Gen. Genet.210, 135–139 (1987).
33. Raymond, K. N., Dertz, E. A. & Kim, S. S. Enterobactin: an archetype formicrobial iron transport. Proc. Natl Acad. Sci. USA 100, 3584–3588 (2003).
34. Clark, D. Regulation of fatty acid degradation in Escherichia coli: analysis byoperon fusion. J. Bacteriol. 148, 521–526 (1981).
35. Shimada, T., Fujita, N., Yamamoto, K. & Ishihama, A. Novel roles of cAMPreceptor protein (CRP) in regulation of transport and metabolism of carbonsources. PLoS ONE 6, e20081 (2011).
36. Padmanabhan, P., Grosse, J., Asad, A. B., Radda, G. K. & Golay, X.Gastrointestinal transit measurements in mice with 99mTc-DTPA-labeledactivated charcoal using NanoSPECT-CT. EJNMMI Res. 3, 60 (2013).
37. Poulsen, L. K., Licht, T. R., Rang, C., Krogfelt, K. A. & Molin, S.Physiological state of Escherichia coli BJ4 growing in the large intestines ofstreptomycin-treated mice. J. Bacteriol. 177, 5840–5845 (1995).
38. Helaine, S. et al. Dynamics of intracellular bacterial replication at the single celllevel. Proc. Natl Acad. Sci. USA 107, 3746–3751 (2010).
39. Jalanka, J. et al. Effects of bowel cleansing on the intestinal microbiota. Gut.64, 1562–1568 (2015).
40. Sohlenkamp, C., Lopez-Lara, I. M. & Geiger, O. Biosynthesis ofphosphatidylcholine in bacteria. Prog. Lipid Res. 42, 115–162 (2003).
ARTICLE NATURE COMMUNICATIONS | DOI: 10.1038/ncomms9292
12 NATURE COMMUNICATIONS | 6:8292 | DOI: 10.1038/ncomms9292 | www.nature.com/naturecommunications
& 2015 Macmillan Publishers Limited. All rights reserved.
41. Weber, H., Polen, T., Heuveling, J., Wendisch, V. F. & Hengge, R.Genome-wide analysis of the general stress response network in Escherichiacoli: sigmaS-dependent genes, promoters, and sigma factor selectivity.J. Bacteriol. 187, 1591–1603 (2005).
42. Dong, T. G. et al. Generation of reactive oxygen species by lethal attacks fromcompeting microbes. Proc. Natl Acad. Sci. USA 112, 2181–2186 (2015).
43. Fischbach, M. A. & Sonnenburg, J. L. Eating for two: how metabolismestablishes interspecies interactions in the gut. Cell Host Microbe 10, 336–347(2011).
44. McDole, J. R. et al. Goblet cells deliver luminal antigen to CD103þ dendriticcells in the small intestine. Nature 483, 345–349 (2012).
45. Knoop, K. A., McDonald, K. G., McCrate, S., McDole, J. R. & Newberry, R. D.Microbial sensing by goblet cells controls immune surveillance of luminalantigens in the colon. Mucosal Immunol. 8, 198–210 (2015).
46. Holmes, E., Li, J. V., Athanasiou, T., Ashrafian, H. & Nicholson, J. K.Understanding the role of gut microbiome-host metabolic signal disruption inhealth and disease. Trends Microbiol. 19, 349–359 (2011).
47. Roediger, W. E. Role of anaerobic bacteria in the metabolic welfare of thecolonic mucosa in man. Gut. 21, 793–798 (1980).
48. Arpaia, N. et al. Metabolites produced by commensal bacteria promoteperipheral regulatory T-cell generation. Nature 504, 451–455 (2013).
49. Furusawa, Y. et al. Commensal microbe-derived butyrate induces thedifferentiation of colonic regulatory T cells. Nature 504, 446–450 (2013).
50. Zarepour, M. et al. The mucin Muc2 limits pathogen burdens and epithelialbarrier dysfunction during Salmonella enterica serovar Typhimurium colitis.Infect. Immun. 81, 3672–3683 (2013).
51. Sweeney, N. J., Laux, D. C. & Cohen, P. S. Escherichia coli F-18 and E. coli K-12eda mutants do not colonize the streptomycin-treated mouse large intestine.Infect. Immun. 64, 3504–3511 (1996).
52. Smith, K., McCoy, K. D. & Macpherson, A. J. Use of axenic animals in studyingthe adaptation of mammals to their commensal intestinal microbiota. Semin.Immunol. 19, 59–69 (2007).
53. Leatham, M. P. et al. Mouse intestine selects nonmotile flhDC mutants ofEscherichia coli MG1655 with increased colonizing ability and better utilizationof carbon sources. Infect. Immun. 73, 8039–8049 (2005).
54. Johansson, M. E. & Hansson, G. C. Preservation of mucus in histologicalsections, immunostaining of mucins in fixed tissue, and localization of bacteriawith FISH. Methods Mol. Biol. 842, 229–235 (2012).
55. Edgar, R. C. Search and clustering orders of magnitude faster than BLAST.Bioinformatics 26, 2460–2461 (2010).
56. Caporaso, J. G. et al. QIIME allows analysis of high-throughput communitysequencing data. Nat. Methods 7, 335–336 (2010).
57. Stead, M. B. et al. RNAsnap: a rapid, quantitative and inexpensive, method forisolating total RNA from bacteria. Nucleic Acids Res. 40, e156 (2012).
58. Langmead, B. & Salzberg, S. L. Fast gapped-read alignment with Bowtie 2. Nat.Methods 9, 357–359 (2012).
59. Anders, S. Analysing high-throughput sequencing data with Python ohttp: //www-huber.embl.de/users/anders/HTSeq4 (2011).
60. Love, M. I., Huber, W. & Anders, S. Moderated estimation of fold change anddispersion for RNA-seq data with DESeq2. Genome Biol. 15, 550 (2014).
61. Franceschini, A. et al. STRING v9.1: protein-protein interaction networks, withincreased coverage and integration. Nucleic Acids Res. 41, D808–D815 (2013).
62. Szklarczyk, D. et al. STRING v10: protein-protein interaction networks,integrated over the tree of life. Nucleic Acids Res. 43, D447–D452 (2015).
63. Overbeek, R. et al. The SEED and the Rapid Annotation of microbial genomesusing Subsystems Technology (RAST). Nucleic Acids Res. 42, D206–D214(2014).
64. Aziz, R. K. et al. The RAST Server: rapid annotations using subsystemstechnology. BMC Genomics 9, 75 (2008).
65. Markowitz, V. M. et al. IMG 4 version of the integrated microbialgenomes comparative analysis system. Nucleic Acids Res. 42, D560–D567(2014).
66. Letunic, I. & Bork, P. Interactive Tree Of Life (iTOL): an online tool forphylogenetic tree display and annotation. Bioinformatics 23, 127–128 (2007).
67. Fuhrer, T., Heer, D., Begemann, B. & Zamboni, N. High-throughput, accuratemass metabolome profiling of cellular extracts by flow injection-time-of-flightmass spectrometry. Anal. Chem. 83, 7074–7080 (2011).
68. Wishart, D. S. et al. HMDB 3.0--The Human Metabolome Database in 2013.Nucleic Acids Res. 41, D801–D807 (2013).
AcknowledgementsWe thank D. Holden and S. Helaine for the pDiGc and pDiGi plasmids, T. Leeb,M. Ackermann, F. Blank, M. Fragniere and A. Ozga for technical and informaticssupport. We thank P.S. Cohen for motile and immotile E. coli strains. The Clean MouseFacility is supported by the Genaxen Foundation, Inselspital and the University of Bern.This work was funded by the Swiss National Science Foundation (grants SNSF310030_140700 and SNF Sinergia CRS113_154414) to A.J.M. K.D.M is supported byfunding from the Swiss National Science Foundation (SNSF310030_134902) andthe European Research Council (ERC) grant 281785. B.S. is funded by BMBFInfektionsgenomik and the DFG SPP1656 (DFG STE1971/4-1). T.F. was funded by theSystemsX.ch ohttp://SystemsX.ch4 project MetaNetX. J.P.L. was funded by a transitionPost-Doc grant from SytemsX.ch TPdf 2013/139.
Author contributionsA.J.M. conceived and designed the project. A.J.M., K.D.M., U.S. and J.V.S. designed andsupervised the experiments. H.L., T.F., M.A.L., M.W., J.A.M., S.R., B.Stolp performed theexperiments. A.J.M., H.L., M.A.L. and T.F. analysed the experimental data. J.P.L., I.K.,M.B.G and H.L. performed the bioinformatic analysis. S.B. and B.Stecher provided theOligo-Mouse-Microbiota (strain requests to [email protected]). A.J.M.wrote the manuscript.
Additional informationAccession codes: The 16S sequence data have been deposited in Figshare and can beaccessed through the following link: http://dx.doi.org/10.6084/m9.figshare.1499145.
Supplementary Information accompanies this paper at http://www.nature.com/naturecommunications
Competing financial interests: The authors declare no competing financial interests.
Reprints and permission information is available online at http://npg.nature.com/reprintsandpermissions/
How to cite this article: Li, H. et al. The outer mucus layer hosts a distinct intestinalmicrobial niche. Nat. Commun. 6:8292 doi: 10.1038/ncomms9292 (2015).
This work is licensed under a Creative Commons Attribution 4.0International License. The images or other third party material in this
article are included in the article’s Creative Commons license, unless indicated otherwisein the credit line; if the material is not included under the Creative Commons license,users will need to obtain permission from the license holder to reproduce the material.To view a copy of this license, visit http://creativecommons.org/licenses/by/4.0/
NATURE COMMUNICATIONS | DOI: 10.1038/ncomms9292 ARTICLE
NATURE COMMUNICATIONS | 6:8292 | DOI: 10.1038/ncomms9292 | www.nature.com/naturecommunications 13
& 2015 Macmillan Publishers Limited. All rights reserved.


![[PPT]OBSTRUCCION INTESTINAL - semio2013 | This … · Web viewOBSTRUCCION INTESTINAL OBSTRUCCION INTESTINAL OBSTACULO AL TRANSITO DEL CONTENIDO INTESTINAL Adinámico o paralítico](https://img.pdfslide.us/doc/110x75/5b36ceb57f8b9a4a728b5103/pptobstruccion-intestinal-semio2013-this-web-viewobstruccion-intestinal.jpg)