Embed Size (px)
Citation preview

The Other Ex-Ante Moral Hazard in Health�
Jay Bhattacharyay Mikko Packalenz
December 17, 2010
Abstract
It is well known that pooled insurance coverage can induce a form of ex-ante moralhazard: people make ine¢ ciently low investments in self-protective activities. This pa-per identi�es another ex-ante moral hazard that runs in the opposite direction: it causespeople to choose ine¢ ciently high levels of self-protection. This other ex-ante moralhazard arises through the impact that self-protective activities have on the reward forinnovation. Lower levels of self-protection and the associated chronic conditions andbehavioral patterns such as obesity, smoking, and malnutrition increase the incidenceof many diseases for an individual. This increases the individual�s consumption oftreatments to those diseases, which increases the reward for innovation that an innova-tor receives. By the induced innovation hypothesis, which has broad empirical support,the increase in the reward for innovation in turn increases the rate of innovation, whichbene�ts all consumers. As individuals do not take these positive externalities on theinnovator and other consumers into account when deciding the level of self-protectiveactivities, they each invest an ine¢ ciently high level in self-protective activities. Inthe quantitative part of our analysis we show that for obesity the magnitude of thispositive innovation externality roughly coincides with the magnitude of the negativeMedicare-induced health insurance externality of obesity. The other ex-ante moralhazard that we identify can thus be as important as the ex-ante moral hazard that hasbeen a central concept in health economics for decades. The quantitative �nding alsoimplies that the current Medicare-induced subsidy for obesity is approximately opti-mal. Thus the presence of this obesity subsidy is not a su¢ cient rationale for �sodataxes�, �fat taxes�or other penalties on obesity.
Keywords: self-protection; prevention; moral hazard; innovation; induced innova-
tion; reward for innovation; obesity; health insurance; Medicare.
JEL Classi�cation Codes: I10, I18, D62, H23�We thank Tyler Cowen, Steven Levitt, Neeraj Sood, an anonymous referee, and participants at the
NBER Health Care 2008 meeting for helpful comments and discussions. We are responsible for all remainingerrors. Bhattacharya thanks the National Institute on Aging for funding his work on this project.
yStanford University School of Medicine, CHP/PCOR, 117 Encina Commons, Stanford, CA 94305-6019.Email: [email protected].
zUniversity of Waterloo, Department of Economics, 200 University Avenue West, Waterloo, ON N2L3G1. Email: [email protected].

1 Introduction
Within economics, it is well-known that pooled insurance coverage can create a disincentive
for the insured individual to invest in self-protective activities�a form of ex-ante moral hazard
(Ehrlich and Becker, 1972). In health economics it is also well understood that insurance
coverage can create also an ex-post moral hazard (Pauly, 1968; Manning et al., 1987). Both
the ex-ante moral hazard and the ex-post moral hazard lead to a negative externality: the
former causes people to invest insu¢ ciently in self-protection, while the latter causes people
to consume health care resources at an ine¢ ciently high level.
In this paper, we identify a distinct second form of ex-ante moral hazard that runs in the
opposite direction from the one examined by Ehrlich and Becker (1972). It causes people to
devote an ine¢ ciently high level of resources to self-protective activities.
This other ex-ante moral hazard arises through the impact that self-protection has on
the reward for innovation. Lower levels of self-protective activities such as exercise and
healthy diet and the associated chronic conditions and behavioral patterns such as obesity,
smoking, and malnutrition increase the incidence of many diseases for an individual. This
increases the individual�s consumption of treatments to those diseases, which increases the
reward for innovation that an innovator receives. By the induced innovation hypothesis,
which has broad empirical support (see below), the increase in the reward for innovation
in turn increases the rate of innovation of treatments to those diseases. Because consumers
capture some of the surplus created by pharmaceutical and other medical innovation, this
additional innovation bene�ts all people who are a icted with any of those diseases.
A lower level of self-protection thus has two positive external impacts: it directly increases
the reward for innovation which bene�ts the innovator, and it indirectly induces additional
innovation which bene�ts other consumers. Because people do not account for these positive
externalities when they decide their levels of self-protection, this mechanism�the other ex-
ante moral hazard�causes people choose ine¢ ciently high levels of self-protection.
We refer to the combined external e¤ect from a lower level of self-protective activities
through the increase in the reward for innovation and through induced innovation as the
�innovation externality�. As our formal analysis shows, the presence of a positive innovation
externality does not rely on the assumption that there is an underinvestment in innovation
from the perspective of total surplus, holding the level of self-protective activities constant.1
1The only case when there is no positive innovation externality is when there is a large enough overin-vestment in innovation that the increase in the reward for innovation leads to a decrease in total surplus.Given the empirical evidence on private vs. social returns to R&D (see e.g. Jones and Williams, 1998, andBloom et al., 2007) it seems very unlikely that this special case applies in practice.
1

Our analysis concerns the innovation of new goods for which the reward for innovation
from each consumer is increasing in the consumer�s consumption of the good. Accordingly,
the innovator�s marginal revenue from any consumer, including the consumer who is marginal
in terms of the consumer�s level of self-protective activities, is always above the marginal
social cost. This gap between marginal revenue and social cost, together with the presence
of self-protective activities that in�uence the intensity of demand, is the impetus for the
existence of the other ex ante moral hazard and the associated optimal subsidy for lower
levels of self-protective activities. This gap between marginal revenue and social cost is also
the reason why our analysis di¤ers from the famously erroneous analysis of pecuniary external
economies and diseconomies of scale in the production of existing goods by Pigou (1912).
Contrary to what Pigou asserted, taxes or subsidies for consumption are not warranted in
the cases he examined because the producer�s revenue from the marginal consumer is equal
to the marginal social cost (see Young, 1913, and e.g. Liebowitz and Margolis, 1995). In
contrast, for newly invented goods this marginal revenue and the marginal social cost are
di¤erent.
The central role of the reward for innovation in our analysis is also a reason why we focus
our analysis of the other ex-ante moral hazard on health. As is well known, the share of
revenue that is reward for innovation (i.e. in excess of marginal costs) is much greater in
the pharmaceutical industry than in most if not even all other industries. The potential of
the innovation externality to drive a large wedge between the privately and socially optimal
levels of self-protective activities is thus greater in health than in any other context.
The economic e¢ ciency consequences of the ex-ante moral hazard examined by Ehrlich
and Becker (1972) depend on what extent marginal health care costs are shared through
insurance and on how elastic self-protective activities are with respect to the associated
bene�ts. Similarly, the economic e¢ ciency consequences of the ex-ante moral hazard that
we identify depend on the size of the innovation externality and on how elastic self-protective
activities are with respect to the associated bene�ts. Unfortunately, it is very hard to obtain
reliable measures of how elastic self-protective activities are with respect to the associated
bene�ts and, consequently, the evidence on this central concept in health economics is scant.
For this reason, in terms of quantitative analysis, we limit the scope of this paper to the
measurement of the magnitude of the innovation externality and how large it is in comparison
with the pooled health insurance externality. The comparison provides an assessment of the
relative importance of the two forms of ex-ante moral hazard in health. Moreover, in most
economic models of externalities�including the model that we present�the optimal policy
depends only on the magnitude of the external e¤ect and is independent of the relevant
2

behavioral elasticity. Quantifying the innovation externality thus goes a long way toward
determining the optimal policy. Measurement of the extent to which marginal health care
costs are shared and measurement of the size of the innovation externality are also su¢ cient
to capture the distributional consequences of the two opposing externalities which are also
of interest.
While the innovation externality and the associated other ex-ante moral hazard apply to
health behavior in general, we present the analysis in the context of obesity, which is known to
increase the prevalence of many diseases and the associated medical expenditures. This focus
enables us to keep the analysis concrete and e¢ ciently quantify the innovation externality of
obesity to demonstrate that the other ex-ante moral hazard is also quantitatively important.
In the theoretical part of our analysis we present a model which allows us to character-
ize the magnitude of the innovation externality of obesity in terms of straightforward and
empirically malleable economic concepts. The quantitative part of our analysis shows that
the magnitude of the positive innovation externality of obesity roughly coincides with the
negative Medicare-induced health insurance externality of obesity. From a theoretical per-
spective this �nding implies that the other ex-ante moral hazard that we identify can be
quantitatively as important as the ex-ante moral hazard examined by Ehrlich and Becker
(1972) which has been a central concept in health economics for decades. From a policy
perspective this �nding implies that in the U.S. the current (Medicare-induced) subsidy for
obesity is approximately optimal for people who are covered with private insurance before
old-age, and thus the presence of this subsidy is not a su¢ cient rationale for imposing �fat
taxes�, �soda taxes�or other penalties on obesity.
The balance of this paper proceeds in the standard order�literature review, theory, data,
quantitative application, and conclusion.
2 Related Literature
2.1 Obesity, Disease, and Health Expenditures
Americans are increasingly overweight or obese. The proportion of adults classi�ed as obese
increased from 12.0% in 1991 to 20.9% in 2001 (Mokdad et al., 1999, 2003; Wang and
Beydoun, 2007).
Obesity is associated with an increased risk of a range of chronic conditions, including
diabetes, hypertension, heart disease, and stroke (Kasper et al., 2004). In some cases, there
are solid biochemical and physiological reasons to suppose that the association is causal,
3

such as in the case of diabetes. In other cases, the evidence is murkier. Here, we do not
attempt to settle (nor are we capable of settling) the debate over which of these relationships
are causal. Instead, our aim is to show that if the e¤ect of obesity on disease prevalence is
causal and obesity therefore has a negative Medicare-induced health insurance externality
then obesity has also a positive innovation externality of roughly equal magnitude. Because
either externality is present only for diseases for which the relationship is causal, the extent to
which the relationships are causal is unlikely to signi�cantly change the relative comparison
of the two opposing externalities of obesity. For this reason we are comfortable with limiting
the scope of our analysis to not include an analysis of to what extent the associations between
obesity and disease prevalence represent causal e¤ects.
Not surprisingly, also expected health care expenditures are higher for obese individuals
than for normal weight individuals. A large number of studies document this fact. The
vast majority of these studies use convenience samples consisting of individuals from a single
employer or a single insurer (Elmer et al., 2004; Bertakis and Azari, 2005; Burton et al.,
1998; Raebel et al., 2004). There are a few studies that use nationally representative data.
Finkelstein et al. (2003) use data from the linked National Health Interview Survey (NHIS)
and Medical Expenditure Panel Survey (MEPS) to estimate that annual medical expendi-
tures are $732 higher for obese than normal weight individuals.2 Sturm (2002), using data
from the Health Care for Communities (HCC) survey, �nds that obese individuals spend
$395 per year more than non-obese individuals on medical care.
This is a large literature, which space constraints prevent us from surveying in more
detail. The many studies that we do not discuss here vary considerably in generality but
they all reach the same qualitative conclusion that obesity is associated with higher medical
care costs.3 None of this literature attempts to address whether the relationship between
obesity and associated health care expenditures are causal. We do not attempt to settle this
issue here and, for the same reasons outlined above on the link between obesity and disease
2On an aggregate level, approximately half of the estimated $78.5 billion in medical care spending in 1998attributable to excess body weight was �nanced through private insurance (38%) and patient out-of-pocketpayments (14%). Thorpe et al. (2004) use MEPS data to estimate how much of the $1,100 increase between1987 and 2000 in per-capita medical expenditures is attributable to obesity. Using a regression model tocalculate what per-capita medical expenditures would have been had 1987 obesity levels persisted to 2000,they conclude that about $300 of the $1,100 increase is due to the rise in obesity prevalence.
3Some of the studies we reviewed, but arbitrarily do not discuss here include Bungam et al. (2003),Musich et al. (2004), Quesenberry et al. (1998), Thompson et al. (2001) and Wang et al. (2003). There arealso studies of obesity-related medical expenditure di¤erences in an international setting. Both Sander andBergemann (2003), in a German setting, and Katzmarzyk and Janssen (2004), in a Canadian setting, �ndhigher medical expenditures for obese people. The analysis by Michaud et al. (2009) takes also into accountthe impact of obesity on longevity.
4
prevalence, we do not need to settle it.
2.2 Health Insurance, Ex Ante Moral Hazard, Induced Innovation
That obesity is associated with higher health care expenditures is only a necessary �rst step in
establishing the traditional ex-ante welfare loss from obesity through health insurance. In the
case of employer-provided health insurance, for instance, Bhattacharya and Bundorf (2005)
show that di¤erences in wages between obese and non-obese workers with employer-provided
health insurance undo nominal risk pooling between the workers. Without pooling, there
is no health insurance externality from obesity. This argument does not extend to public
insurance, such as Medicare, where there is clearly pooling and the associated transfer from
thinner to heavier individuals and no wage mechanism to undo it. Even in the case of
public insurance, though, obese individuals are likely to pay higher out-of-pocket medical
expenditures because of cost-sharing in insurance coverage. Being obese therefore imposes
costs on the person holding the weight.
Bhattacharya and Sood (2007) show that, in pooled health insurance, if the elasticity
of body weight with respect to the transfer from thinner to heavier individuals (induced by
insurance) is zero, there is no welfare loss from the ex-ante externality. Unless the subsidy
induced by insurance causes someone to become heavier, the insurance transaction is a
costless transfer. With the exception of Rashad and Markowitz (2006), there has been little
work attempting to measure the size of this key elasticity.
We are not aware of any work that has identi�ed the other ex-ante moral hazard that we
examine or has attempted to estimate the size of the associated innovation externality. The
closest related study is Lakdawalla and Sood (2007) who examine the e¤ect of extending drug
insurance on welfare through induced innovation. In comparison, we focus on the ex-ante
moral hazard e¤ect of induced innovation.
The induced innovation hypothesis was �rst examined by Hicks (1932) and Schmookler
(1966). Empirical investigations of this hypothesis in the pharmaceutical industry include
Acemoglu and Linn (2004), Finkelstein (2004), Lichtenberg and Waldfogel (2003), and Yin
(2008), which all �nd support for the hypothesis. Moreover, in Bhattacharya and Packalen
(2008a), in which the main focus is on the determinants of the direction of academic medical
research, we �nd evidence of obesity-induced pharmaceutical innovation: obesity-epidemic
induced increases in the prevalence of diseases is associated with increases in the introduc-
tion of pharmaceutical drugs that treat those diseases. Support for the induced innovation
hypothesis is not limited to health care, as Newell et al. (1999) and Popp (2002) �nd support
5

for the induced innovation hypothesis in the energy sector.4
3 Theory
In this section we �rst present the model and characterize the equilibrium. We then determine
the optimal subsidy implied by the innovation externality from a lower level of self-protection.
Optimal policy is solved in terms of both consumer and total surplus. In the former case the
optimal subsidy re�ects only the indirect induced innovation e¤ect. In the latter case the
optimal subsidy re�ects also the direct impact on the reward for innovation. In Section 3.4
we discuss several aspects which are not included in the model but are taken into account
in the quantitative application.
3.1 The Model
Agents in the model consist of an innovator and N consumers. Decisions are made in three
stages. In stage 1 consumers simultaneously and non-cooperatively choose their level of
prevention (self-protective activities). In stage 2 �rst the innovator chooses the level of its
R&D investments which determines the probability � that the innovator is successful in
developing a new medical care technology. Subsequently in stage 2 the success of these R&D
investments and the health status of each consumer is revealed. In stage 3 consumers choose
the level of medical care.
3.1.1 Consumers
In stage 1 each consumer faces a trade-o¤ between prevention and leisure, which we denote
by S and L, respectively. The consumer resource constraint in stage 1 is
S + L = H; (1)
where H is the resource endowment in stage 1. For expositional convenience we assume
that there are only two levels of prevention, high and low, which we denote by SNORMAL
4Our analysis is also related to the studies on preference externalities by Waldfogel (2003) and Georgeand Waldfogel (2003), which build on the theoretical contributions by Hotelling (1929), Spence (1976a,b)and Dixit and Stiglitz (1977), and which these examine the impacts of (racial) population characteristics onproduct variety (in newspapers and radio programming) through a market size e¤ect. In contrast, we examinethe e¤ects of population characteristics on welfare through the innovation externality. Furthermore, in ourcase the preference externality is determined by consumers�decisions rather than inherent characteristics (toextent that body weight is in fact a decision).
6

and SOBESE, respectively, and that the opportunity cost of increasing the level of prevention
from low to high is one unit of leisure, which is formally stated as5
SNORMAL � SOBESE = 1: (2)
We denote the number of individuals who choose the low level of prevention by nOBESE:
Choosing the lower level of prevention leads to chronic conditions and behavioral patterns
such as obesity, smoking, or malnutrition, which increase the probability of illness. We
assume that prevention only in�uences each consumer�s own probability of illness. Consumers
who choose the high level of prevention have the probability of illness �NORMAL: Consumers
who choose the low level of prevention have the elevated probability of illness �OBESE >
�NORMAL. The average probability of illness in the population (disease prevalence) is
�AV ERAGE = �NORMAL +nOBESEN
� (�OBESE � �NORMAL) : (3)
Consumers who choose the low level of prevention and thereby have the elevated proba-
bility of illness �OBESE receive a subsidy t:We refer to the subsidy t as the �obesity subsidy�
in part to emphasize the fact that subsidizing lower levels of prevention requires the presence
of an observable proxy variable for the level of prevention. The subsidy t is �nanced through
a lump-sum tax T on all consumers. The budget balancing condition is
nOBESE � t = N � T: (4)
The obesity subsidy t and the lump-sum tax T enter the stage 3 resource constraint.
Let W denote the resource endowment in stage 3. In stage 3 consumers face a trade-o¤
between consumption of medical care and consumption of other goods, which we denote by
M and C, respectively. For illl consumers who purchase medical care and choose the low
level of prevention the resource constraint in stage 3 is
M + C = W � T + t: (5)
5In the model we do not include the possibility of innovations that decrease the relative cost of prevention.While some such preventative innovation does occur in the form of lower-calorie foods, diets, nutritionalsupplements, exercise machines, and so forth, we are not aware of arguments that would place the qualitativeimportance of such preventative innovation anywhere near the importance of the type of disease-driventreatment innovation that we model. Dranove (1988) observes that for many forms of prevention innovationpatents are unavailable and property rights are unde�ned, and conjectures that in the U.S. preventioninnovation receives only a tiny percentage of medical R&D dollars. Accordingly, we conjecture that innovationexternality from the consumption of such preventative innovations are likely small relative to the innovationexternality from the consumption of the type of disease-driven treatment innovations that we model.
7

For ill consumers who purchase medical care and choose the high level of prevention the
resource constraint in stage 3 is
M + C = W � T: (6)
For healthy consumers the corresponding budget constraints are simply
C = W � T + t (7)
and
C = W � T: (8)
To simplify the analysis, we rely on assumptions which imply that all ill consumers purchase
medical care. These assumptions are introduced next.
Consumer utility is in�uenced in part by the consumer�s choices in stages 1 and 3 and
health status in stage 3. The relative cost of prevention is captured by the parameter �,
which measures the marginal utility of leisure and is heterogenous across consumers. For
each consumer the value of the parameter � is drawn from the distribution represented by the
cumulative distribution function F (�) for which F 0 (�) > 0 for all � 2 [0; ��); where �� 2 R+.Denoting the utility loss from illness by D, the utility function is
U (L;C;D) = �L+ C +D:
For healthy consumers D = 0 and the utility is
U (L;C;D) = �L+ C: (9)
When the innovator is unsuccessful, consumers can only purchase old medical care technol-
ogy, which reduces the utility loss from illness to D0. Hence, for ill consumers who purchase
the old medical care technology the utility is
U (L;C;D) = �L+ C �D0: (10)
When the innovator is successful, consumers can alternatively purchase the new medical
care technology which further reduces the utility loss from illness to D1 < D0. Hence, for ill
consumers who purchase the new medical care technology the utility is
U (L;C;D) = �L+ C �D1: (11)
8

For expositional convenience we assume that the price of the old technology is zero, and
that the innovator�s production costs�unlike its R&D costs�are zero. Hence, subtracting
the right-hand side of the expression (10) from the right-hand side of the expression (11)
reveals that each ill consumer�s willingness to pay for the new technology is D0 � D1, and
this willingness to pay is also the ex-post surplus from innovation. We denote the innovator�s
share of this surplus by s. The price of the new medical care technology is thus
M = s (D0 �D1) : (12)
We assume that consumers are risk-neutral.6 Combining expression (12), the de�nitions
of the probability of innovation � and the probability of illness �OBESE, the stage 1 resource
constraint (1), the stage 3 resource constraints (5) and (7) for consumers who choose the low
level of prevention, and expressions (9), (10) and (11) for utility yields the expression
� (H � SOBESE) +W � �OBESE [D0 � � (1� s) (D0 �D1)] + t� T (13)
for the expected utility of a consumer with the low level of prevention. Similarly, combining
expression (12), the de�nitions of � and �NORMAL, the stage 1 resource constraint (1), the
stage 3 resource constraints (6) and (8) for consumers who choose the high level of prevention,
and expressions (9), (10) and (11) for utility yields the expression
� (H � SNORMAL) +W � �NORMAL [D0 � � (1� s) (D0 �D1)]� T (14)
for the expected utility of a consumer with the high level of prevention.
In the above expressions (13) and (14) for expected utility the �rst term represents the
utility from leisure, and the rest of each expression represents the impacts of consumption and
illness on utility. The factor D0 � � (1� s) (D0 �D1) in the third term in both expressions
(13) and (14) measures the utility loss from an illness. We denote this cost of illness by
CILLNESS � D0 � � (1� s) (D0 �D1) : (15)
6This increases the tractability of the analysis and the ease of exposition. Moreover, this assumptionenables us to abstract from insurance and the associated potential for ex-post moral hazard. There are tworeasons why we believe that abstracting from the ex-post moral hazard induced by obesity is innocuoushere. First, the elasticity of demand for health care is larger (in absolute value) for those without chronicconditions (Manning et al., 1987; Bajari et al., 2006). Second, Lakdawalla and Sood (2006) show that whenit comes to pharmaceutical expenditures�which we examine in our empirical application�there may not beany ex-post moral hazard at all as co-payments make out-of-pocket prices close to marginal cost.
9

Subtracting expression (14) from expression (13) and substituting SNORMAL�SOBESE =1 shows that a consumer chooses the high level of prevention if and only if the condition
�� � t+ (�OBESE � �NORMAL)� CILLNESS � 0 (16)
holds.7 The �rst two terms in this expression (16) represent the cost of the high level of
prevention in terms of e¤ort and the loss of the obesity subsidy, respectively. The third term
measures the bene�t from the high level of prevention in the form of a lower probability of
illness.
We denote the combined illness bene�t and monetary penalty from the high level of
prevention by
BNORMAL � (�OBESE � �NORMAL)� CILLNESS � t: (17)
Comparing this de�nition (17) of BNORMAL with the condition (16) for the optimal preven-
tion choice shows that individuals with � � BNORMAL choose the high level of prevention.
The share of consumers nOBESEN
who choose the low level of prevention is therefore given by8
nOBESEN
= 1� F (BNORMAL) : (19)
To measure the responsiveness of the share of consumers nOBESEN
who choose the low level
of prevention to changes in the cost BNORMAL of choosing the low level of prevention, we
employ the concept the cost-elasticity of obesity, which is de�ned as
"OBESE � �dnOBESEdBNORMAL
BNORMAL
nOBESE: (20)
7Analogous to most analyses of externalities, we assume that the number of consumers N is large enoughso that the impact that each consumer�s own prevention decision has on its own expected utility throughthe impact on the probability of innovation � can be ignored in deriving the condition (16) for the optimalprevention decision. The total induced innovation bene�t of a single consumer�s prevention decision, whichis dispersed across all consumers, is still non-negligible provided that s 2 (0; 1).
8We assume that the number of consumers N is large enough so that the distribution function F (�) isa good approximation of the distribution of the actual realizations of the parameter �; which allows us toemploy the distribution function F (�) in the consumer optimum condition (19).To avoid discussion of boundary equilibria in which either nOBESEN = 0 or nOBESEN = 1 without any obesity
subsidy, we assume that the cumulative distribution F (�) is such that when there is no subsidy, t = 0, theshare of consumers who choose the low level of prevention is always positive but less than one regardless ofthe values s and �. Formally, we assume that the conditions
1� F [(�OBESE � �NORMAL)D0] > 0 and 1� F [(�OBESE � �NORMAL)D1] < 1 (18)
hold.
10
Combining the condition � � BNORMAL for the optimal prevention choice and expressions
(13) and (14) for expected utility with low and high levels of prevention, respectively, as well
as the budget balancing condition (4), yields the expression
A�N �Z BNORMAL
0
�F 0 (�) d� �N � �AV ERAGE � CILLNESS (21)
for total expected consumer surplus, where A � N�(H � SOBESE)
R��F 0 (�) d� +W
�is a
constant. The parameters t and s thus only in�uence consumer welfare through the utility
loss from the high level of prevention and the utility loss from illness, which are re�ected by
the second and third terms in expression (21), respectively.
3.1.2 The Innovator
The innovator can increase its probability of success � by increasing its R&D expenditures.
One possible representation of the innovator�s R&D cost function C (�) is
C (�) = cF + a�+b
2�2; (22)
where cF , a; and b are parameters with a > 0 and b > 0. The assumption a > 0 implies that
the marginal cost of increasing the probability of success is positive and captures the notion
that increasing the probability of success requires additional resources. The assumption
b > 0 implies that also the marginal cost of increasing the probability of success is increasing
in the probability of success and captures the notion that it is increasingly more di¢ cult to
increase the probability of success due to the scarcity of fertile research ideas.
Given the expression (12) for the price of the new medical care technology and the
expression (3) for the average probability of illness �AV ERAGE, the innovator�s expected
reward for success, which we denote by R, is
R = N �h�NORMAL +
nOBESEN
� (�OBESE � �NORMAL)i� s� (D1 �D0) : (23)
The innovator chooses the level of its R&D investment to maximize its expected pro�t
�(�) = �R� C (�) : (24)
11

Given the cost function (22), the innovator�s optimal probability of innovation is
� =a
b+1
bR; (25)
provided that for the optimal � given in this expression (25) the properties �(�) � �(0)
and � 2 [0; 1] hold. This result (25) shows that for the quadratic cost function (22) theprobability of innovation is increasing in the reward for success R. This result of course
holds for cost functions more generally. Accordingly, below we rely on the more general
reduced-form relationship
� = G (R) ; (26)
where G (R) is a di¤erentiable function with G0 (R) > 0, to capture the positive relationship
between the probability of innovation � and the reward for innovation R.9
A key determinant of the size of the induced innovation e¤ect from self-protective ac-
tivities is how responsive the rate of innovation is to changes in the reward for innovation.
Accordingly, we frequently rely on the concept the reward-elasticity of innovation, which is
de�ned as
"� �d�
dR
R
�: (30)
The use of the reward-elasticity of innovation concept has two advantages. First, it is a more
intuitive concept than a speci�c cost function. Second, the reward-elasticity of innovation is
the parameter of interest in the empirical analyses of induced innovation.
9To avoid discussion of boundary equilibria in which the reward for innovation is either so small or solarge that the probability of innovation is unresponsive to changes in the reward for innovation we assumethat
G0 (R) > 0 for all R � 0 and G(�OBESE (D1 �D0)) < 1; (27)
where �OBESE (D1 �D0) is the highest possible value of the reward for innovation R when t = 0.To avoid discussion of equilibria in which the probability of innovation is high enough without any reward
for innovation so that the consumer surplus maximizing optimum is to set s = 0, we assume that
G (0) 2 [0; �), (28)
where � is a small enough positive constant.To avoid discussion of cases in which it is optimal from the total surplus perspective to set the obesity
subsidy so high that all consumers choose the low level of prevention we assume that
~�� (1 + "~�)�D0 �D1D0
< 1 (29)
where ~� denotes the probability of innovation when all consumers choose the low level of prevention, i.e.nOBESE
N = 1; and "~� denotes the reward-elasticity of innovation when � = ~�. This condition (29) holds if thisprobability of innovation ~� is su¢ ciently small, or if reward-elasticity of innovation "~� is su¢ ciently small,or if the innovation is incremental enough so that D0�D1
D0is small enough.
12

3.2 Equilibrium
The endogenous variables are the probability of innovation � and the share of consumersnOBESE
Nwith the low level of prevention. A Subgame-Perfect Nash Equilibrium satis�es the
innovator optimum condition (26) and the consumer optimum condition (19), which can be
rewritten as
� = G�N �
h�NORMAL +
nOBESEN
(�OBESE � �NORMAL)i� s� (D1 �D0)
�(31)
andnOBESEN
= 1� F [(�OBESE � �NORMAL)� [D0 � � (1� s) (D0 �D1)]� t] ; (32)
respectively.
Assumptions (18), (27), and (28) imply that when there is no obesity subsidy, t = 0, the
consumer and innovator optimum conditions (31) and (32) intersect, and there thus exists
an equilibrium that satis�es both conditions. Assumptions (18), (27), and (28) are also
su¢ cient for there to exist an equilibrium that satis�es conditions (31) and (32) when the
obesity subsidy t is set optimally because there is no gain from increasing this subsidy past
the point at which all consumers choose the low level of prevention and the conditions (31)
and (32) still hold.
A su¢ cient condition for the equilibrium to be unique and stable is that in any equilibrium
the product of the slopes of the consumer and innovator optimum conditions (31) and (32)
is less than one. In the appendix we show that this su¢ cient condition holds if
"� � "OBESE ��OBESE � �NORMAL
�AV ERAGE� D0 �D1
D0
< 1 (33)
holds in any equilibrium. This condition (33) holds if either of the two elasticities�the
reward-elasticity of innovation "� or the cost-elasticity of obesity "OBESE�is small enough,
or if the impact of obesity on disease prevalence, �OBESE��NORMAL
�AVERAGE, is small enough, or if the
innovation is incremental enough in the sense that D0�D1D0
is small enough. In what follows
we assume that condition (33) holds so that the equilibrium is unique, stable, and given by
the equilibrium conditions (31) and (32).
3.3 Optimal Policy
We determine the optimal obesity subsidy t� for the lower level of prevention both using the
consumer surplus maximizing approach and the total surplus maximizing approach. In the
13

consumer surplus maximizing approach we assume that also the parameter s, which governs
the division of ex-post surplus from innovation, is set to maximize consumer welfare. One
important policy instrument that can be used to in�uence the parameter s in practice is
patent duration. In the total surplus maximizing approach the lower bound for the optimal
obesity subsidy is independent of the parameter s: In the total surplus maximizing approach
we solve for the optimal obesity subsidy t� for an arbitrary value of the parameter s.
The conclusion from both approaches is consistent with the conclusion that the optimal
obesity subsidy t should be set no lower than the impact that choosing the lower level of
prevention has on the reward for innovation. Formally, this derived lower bound for the
optimal obesity subsidy t� in the model is
t� = �� (�OBESE � �NORMAL)� s� (D1 �D0) : (34)
We base our quantitative analysis of the optimal obesity subsidy on this lower bound (34) for
the optimal subsidy rather than on the exact total surplus maximizing obesity subsidy for
three reasons. First, because the lower bound (34) for the optimal subsidy is also the con-
sumer surplus maximizing obesity subsidy the quantitative results obtained using expression
(34) are robust to the selection of the welfare criterion.
Second, from the perspective of total surplus the optimal obesity subsidy t� is always at
least (34) regardless of one�s beliefs about how the parameter s is set. Thus, the analysis of
the optimal obesity subsidy t� is applicable even if one believes that the parameter s is not
set to maximize total surplus due to, for example, political economy considerations.
Third, use of the exact expression for the total surplus maximizing obesity subsidy in the
quantitative analysis would require calibrating values of the reward-elasticity of innovation "�and the ratio of consumer and innovator surplus from innovation 1�s
s. However, reliable and
comprehensive estimates of these two parameters are not available. In terms of calibrating
the parameter "� it is important to keep in mind that empirical studies of induced innovation
generally rely on a di¤erence-in-di¤erence methodology which yields estimates of the reward-
elasticity of the composition of innovation rather than the parameter "� which measures the
reward-elasticity of the total extent of innovation. The point that the two reward-elasticities
can be very di¤erent has been emphasized by Acemoglu and Linn (2004).
14

3.3.1 Consumer Surplus Maximizing Policy
Given expression (21) for consumer welfare, the consumer surplus maximizing approach
solves
maxs;t
��N �
Z BNORMAL
0
�F 0 (�) d� �N � �AV ERAGE � CILLNESS�: (35)
The following result describes the optimum, which we denote by (s�CS; t�CS).
Proposition 1. In the consumer surplus maximizing solution, neither consumers nor theinnovator capture all of the ex-post surplus from innovation, and the optimal obesity subsidy
is equal to the increase in the reward for innovation from the lower level of prevention.
Formally, s�CS 2 (0; 1) and t�CS = �� (�OBESE � �NORMAL)� s� (D1 �D0) :
Proof. See the appendix.
To explain the intuition for the result on the optimal obesity subsidy t�CS we �rst need
to discuss the optimum condition for s�CS.
Holding the probability of innovation constant, an increase in the innovator�s share s
of the ex-post surplus from innovation decreases expected consumer surplus.10 An increase
in the parameter s also in�uences consumer welfare through its impact on the probability
of innovation. The parameter s in�uences the probability of innovation because it in part
determines the reward for innovation.
Generally, an increase in the parameter s has both a direct and an indirect impact on the
the reward for innovation. The direct impact is represented by the presence of the parameter
s in expression (23) for the reward for innovation. The indirect impact arises through the
impact that a change in the parameter s has on the number of individuals nOBESE who
choose the low level of prevention. This indirect impact is represented by the presence of the
variable nOBESE in expression (23) for the reward for innovation. However, because the cost
of an illness is minimized at the consumer surplus maximizing optimum s�CS, and because
the cost of an illness determines how many consumers choose the low level of prevention,
at the optimum s�CS small changes in s have only a second-order impact on the number of
consumers nOBESE who choose the low level of prevention. The indirect e¤ect of an increase
in the parameter s on the reward for innovation can therefore be ignored when considering
the optimum condition for s�CS:10The property s�CS > 0, which means that consumers do not capture all of the ex-post surplus from
innovation, follows directly from assumption (28) according to which the probability of innovation is smallenough (or even zero) when the reward for innovation is zero. The property s�CS < 1; which means thatconsumers capture at least some of the ex-post surplus from innovation, follows from the fact that consumersbene�t from innovation whenever s 2 (0; 1) but do not bene�t from innovation at all when s = 1.
15

Hence, at the consumer surplus maximizing optimum for the parameter s, a marginal
increase �s in the parameter s decreases consumer surplus by �s1�s percent, holding the
probability of innovation constant. The marginal increase �s in the parameter s simulta-
neously increases the reward for innovation by �sspercent, which increases the probability
of innovation�and thereby also the bene�t from innovation, holding the consumer�s share
(1� s) of the ex-post surplus from innovation constant�by "� � �sspercent, where "� is the
reward-elasticity of innovation de�ned in expression (30). At the optimum s�CS these two
impacts are equal,
"� �1
s�CS=
1
1� s�CS: (36)
Intuitively, at the optimum s�CS any transfer from consumers to the innovator in the form of
an increase in the reward for innovation must bring the consumers an equal bene�t in the
form of the bene�t from additional innovation.
To derive the intuition for the optimal obesity subsidy t�CS, we now consider the external
impact of a marginal increase in the number of consumers nOBESE who choose the low level
of prevention. When one consumer switches to the low level of prevention, the reward for
innovation increases by�OBESE � �NORMAL
N � �AV ERAGE(37)
percent. By the de�nition (30) of the reward-elasticity of innovation "� this increase in the
reward for innovation increases the extent of innovation by
"� ��OBESE � �NORMAL
N � �AV ERAGE(38)
percent. As the expected total consumer surplus from innovation is
N � �AV ERAGE � �� (1� s)� (D0 �D1) ; (39)
the impact of the increase in innovation on the expected consumer surplus is
"��OBESE � �NORMAL
N � �AV ERAGE�N � �AV ERAGE � �� (1� s)� (D0 �D1) ; (40)
which can be rewritten as
"� �1� ss
� �� (�OBESE � �NORMAL)� s� (D0 �D1) : (41)
16

Applying the property (36) of the optimal s�CS allows us to rewrite this expression (41) as
�� (�OBESE � �NORMAL)� s� (D0 �D1) : (42)
This expression (42) for the external e¤ect of a marginal increase in the number of individuals
nOBESE who choose the low level of prevention is the same as the expression for the optimal
obesity subsidy t�CS in Proposition 1. As expected, because the parameter s was set optimally,
an increase in the reward for innovation from the marginal consumer who switches to the
low level of prevention brings an equal increase in total expected consumer surplus to all
consumers in the form of the bene�t from additional innovation.
3.3.2 Total Surplus Maximizing Policy
We �rst solve for the optimal obesity subsidy t for an arbitrary value of the parameter s,
and then brie�y discuss the optimal value of the parameter s: Given the expression (21)
for consumer welfare and the expression (24) for the innovator�s expected pro�t, the total
surplus maximizing approach solves
maxt
��R� C (�)�N �
Z BNORMAL
0
�F 0 (�) d� �N � �AV ERAGE � CILLNESS�: (43)
The following result describes the optimum, which we denote by t�TS:
Proposition 2. In the total-surplus maximizing solution, the optimal obesity subsidy islarger than the increase in the reward for innovation from the lower level of prevention if
consumers and the innovator both capture a strictly positive share of the ex-post surplus
from innovation, and the optimal obesity subsidy is equal to the increase in the reward for
innovation from the lower level of prevention if the innovator captures the entire ex-post
surplus from innovation. Formally, t�TS = �� (�OBESE � �NORMAL)� s� (D1 �D0)+ "��1�ss� �� (�OBESE � �NORMAL)� s� (D1 �D0).
Proof. See the appendix.
The �rst term in the expression for the optimal obesity subsidy t�TS in Proposition 2 is
the externality on the innovator. The size of this externality from a marginal increase in
the number of consumers nOBESE who choose the low level of prevention is equal to the
associated increase in the reward for innovation from the consumer to the innovator. The
second term in the expression for the optimal obesity subsidy t�TS in Proposition 2 is the
17

externality on other consumers. As expected, the expression for this part of the externality
is the same as the expression (41) for the externality on other consumers in the consumer
surplus maximizing case, which was derived before placing the restriction s = s�CS on the
parameter s.
Consider now the total surplus maximizing value s�TS of the parameter s. In our model
s�TS < 1 so that in the optimum the innovator does not capture all of the ex-post surplus
from innovation. This is in contrast with most models of innovation which typically do not
consider the impact that the division of ex-post surplus from innovation has on prevention
or other consumer investments that in�uence consumer demand. The intuition for the result
s�TS < 1 is the following. When s = 1 consumers do not receive any surplus and thus a
marginal decrease in parameter s does not decrease consumer surplus through its negative
impact on the probability of innovation. Instead, at s = 1, a marginal decrease in the
parameter s merely redistributes surplus from the innovator to consumers and, in addition,
increases consumer surplus through the e¤ect that the decrease in s has on the number of
consumers nOBESE who choose a low level of prevention. This implies that s�TS < 1.
It can also be shown that s�TS > s�CS, although we omit the formal proof here. The
intuition for the result s�TS > s�CS is the following. At s = s�CS, a small change in the
parameter s has only a second-order impact on consumer surplus. Moreover, as was discussed
above in Section 3.3.1, at s = s�CS a small change in the parameter s has only a second-
order impact on the number of consumers nOBESE who choose the low level of prevention.
Consequently, at s = s�CS an increase always increases the reward for innovation. The
innovator�s surplus is obviously increasing in the reward for innovation and, therefore, at s�CSthe total surplus is increasing in s: This is, intuitively, the reason for the result s�TS > s
�CS.
The result s�TS 2 (s�CS; 1) and Proposition 2 together imply that when both policy pa-rameters s and t are set to maximize total surplus, the optimal obesity subsidy t is strictly
larger than the impact that a marginal increase in the number of individuals nOBESE that
choose the low level of prevention has on the reward for innovation.
3.4 Estimation of the Optimal Obesity Subsidy
The expression (34) for the lower bound of the optimal obesity subsidy is equal to the impact
of obesity on expected medical expenditures. The optimal obesity subsidy is thus
t� = E (obese)� E (normal) ; (44)
18

where E (obese) and E (normal) denote the medical expenditures for an obese person and
for a normal weight person, respectively. This formulation (44) of the optimal subsidy is also
advantageous because it allows obesity to impact both disease incidence and the intensity of
medical expenditures for an illness.
3.4.1 Incorporating Marginal Costs
For expositional convenience in the formal model we have ignored marginal production and
marketing costs as well as the fact that not all medical expenditures are spent on patent
protected goods. A consideration of these aspects lowers the impact that a marginal increase
in obesity has on the reward for innovation and the associated lower bound for the optimal
obesity subsidy from expression (44) to
t� = [E (obese)� E (normal)]�RPATENT � (1�RMC) ; (45)
where RPATENT is the share of medical care expenditures that are spent on patent protected
(and previously patent protected brand-name) goods and RMC is the share of medical care
expenditures that covers marginal production and marketing costs.11
3.4.2 Age-Speci�c Medical Expenditures and Obesity Impacts
As is well known, health expenditures vary greatly by age. Moreover, as can be seen from
our quantitative application below, also the impact of obesity on health care expenditures
varies greatly by age. We thus calculate the optimal subsidy separately for each age group
using the expression
t�t = [Et (obese)� Et (normal)]�RPATENT � (1�RMC) ; (46)
where the subscript t denotes a speci�c age group. In Section 4 we use this expression
(46), calibrated values of the parameters RPATENT and RMC , and estimates of the impact
Et (obese) � Et (normal) of obesity on pharmaceutical expenditures for each age group to11Provided that both parameters s and t are set optimally (in terms of either consumer or total surplus),
the result (34) for the lower bound of the optimal obesity subsidy does not change if one also takes intoaccount the fact that while medical care innovation has world-wide bene�ts, the objective in U.S. policyis more likely set in terms of U.S. welfare as opposed to world-wide welfare (see the earlier version of thispaper (Bhattacharya and Packalen, 2008b)). The parameter s is still set at the value for which a marginalincrease in the reward for innovation from the relevant sub-population yields an equal increase in the bene�tfrom innovation to this sub-population and, consequently, the optimal obesity subsidy t is still equal to (inthe consumer surplus maximizing case) or greater than (in the total surplus maximizing case) to the impactthat a marginal increase in obesity has on the reward for innovation.
19

obtain an estimate of the lower bound for the innovation externality of obesity from pharma-
ceutical innovation at di¤erent ages. Our empirical speci�cation allows medical expenditures
and the impact of obesity on medical expenditures to vary also across other characteristics
such as race and gender (see Section 4).
3.4.3 Extent of Causal Impact on Expenditures, Individual-Speci�c Causality
Ideally, the optimal obesity would be calculated from the causal impact of obesity on medical
expenditures. However, the question of to which extent the increase in medical expenditures
that is attributed to obesity is causal is not important when the objective is to compare the
relative sizes of the positive innovation externality of obesity and the negative health insur-
ance externality of obesity: this relative comparison is unlikely to be signi�cantly a¤ected by
to which extent the estimated increase in medical expenditures that is attributed to obesity
is causal (see Section 2.1). Notice also that as long as there are some marginal individuals
for whom the lack of preventative activities associated with obesity is a choice, expression
(44) gives the optimal subsidy even if obesity is genetic for some people (and for whom an
obesity subsidy is thus only a transfer).
3.4.4 Variation in Impact of Obesity across Diseases
In an earlier version of this paper (Bhattacharya and Packalen, 2008b) we also examined the
impacts of variation in the e¤ect that obesity has on disease incidence across diseases. This
variation does not in�uence the total innovation externality of obesity and the associated
optimal obesity subsidy but this variation does in�uence the size of the induced innovation
externality of obesity on di¤erent sub-populations such as the normal weight and the obese.
These externalities on di¤erent sub-populations depend on an unknown parameter, namely
the ratio of the reward-elasticity of the composition of innovation and the reward-elasticity
of the total extent of innovation. The results in Bhattacharya and Packalen (2008b) show
that unless this ratio is very high, also the external e¤ect of obesity is positivee both on the
obese and on the normal weight.
4 Application: Innovation vs. Insurance Externalities
In this section we �rst calculate the innovation externality of obesity by age using the ex-
pression (46) for the lower bound of the optimal obesity subsidy. We only estimate the size
of this externality from pharmaceutical innovation because of the relative di¢ culty of cali-
20

brating the parameters RPATENT and RMC for other forms of medical innovation. We then
compare the cumulative innovation externality of obesity from pharmaceutical innovation
with the cumulative Medicare-induced pooled health insurance externality of obesity from
all health care expenditures.
4.1 Data
We use the Medical Expenditure Panel Survey (MEPS) data from years 2002-2005 to mea-
sure pharmaceutical expenditures and total health care expenditures by age and Body-Mass
Index (BMI) group.12 While MEPS data is available beginning from 1996, we only use the
MEPS data from years 2002-2005 to eliminate concern over possible time e¤ects in the phar-
maceutical expenditures data. We use the following age groups: 0-18, 18-25, 25-30, 30-35,
35-40, 40-45, 45-50, 50-55, 55-60, 60-65, 65-70, 70-75, 75-80, 80+, and the following BMI
groups: 18.5-25 (normal weight) and 30-50 (obese). For each age and body weight combi-
nation we allow expenditures to vary by sex and race (black/non-black). Accordingly, in
calculating the innovation and insurance externalities of obesity we use the estimate of the
average impact of obesity on expenditures within each age group.
4.2 Innovation Externality by Age
We �rst calibrate the parameters RPATENT and RMC for pharmaceutical innovation. Berndt
(2001) reports that the share of o¤-patent generics is approximately 50% of dispensed drug
units. Because brand-name drugs cost more than generics we calibrate the share of the mar-
ginal pharmaceutical revenue that goes to brand-name drugs at RPATENT = 0:80: Reinhardt
(2001) cites estimates for the pharmaceutical industry that place marketing and general ad-
ministration costs at 35% of revenue and manufacturing costs at 27% of revenue, but notes
that �rms in the pharmaceutical industry often manufacture also other goods besides brand-
name drugs. Estimating the share 1�RMC of the marginal revenue from brand-name drugs
that is in excess of marginal costs is therefore di¢ cult. We calibrate it at 1�RMC = 0:66:
To calculate the external e¤ect of obesity from pharmaceutical innovation using the
expression (46) for the lower bound of the optimal obesity subsidy, we also estimate the
impact Et (obese) � Et (normal) of obesity on annual pharmaceutical expenditures by agegroup using the MEPS data. Of course, to quantify the two externalities more precisely
12BMI is the standard measure used to determine an appropriate weight in the medical literature. BMIis weight, measured in kilograms, divided by height, measured in meters, squared. Individuals with a BMIabove 30 are considered obese and individuals with a BMI between 25 and 30 are considered overweight(National Institute on Health, 1998).
21

it would be necessary to sort out which of the associations between obesity and disease
prevalence are causal. However, as we have argued above in Section 2.1, because either of
the two opposing externalities of obesity (the innovation externality and the health insurance
externality) is present only for diseases for which the relationship is causal, the extent to
which the relationships are causal is unlikely to signi�cantly change the relative comparison
of the two opposing externalities of obesity, and for this reason we are comfortable with
limiting the scope of our analysis to not include an analysis of to what extent the associations
represent causal e¤ects.
Our later objective is to compare the innovation externality of obesity with the Medicare-
induced health insurance externality of obesity for individuals who are covered by private
insurance before old-age. Accordingly, for ages 0-65 we estimate pharmaceutical expenditures
using only data on individuals who are covered by private insurance, and for ages 65+ we
estimate pharmaceutical expenditures using data on individuals who are covered by either
public or private insurance.
The results are shown in Figure 1. The estimate of the innovation externality of obesity
010
020
030
040
050
0E
xter
nalit
y in
Dol
lars
20 40 60 80Age of Obese Person
Innovation Externality of Obesity by Age
Figure 1: Innovation Externality of Obesity by Age.
increases sharply between age 40 and age 55. This is because the estimated impact of
obesity on pharmaceutical expenditures increases sharply between age 40 and age 55, and
22

the innovation externality of obesity is calculated as a �xed percentage of the increase in a
person�s annual pharmaceutical expenditures that is attributed to obesity. The results also
imply that the average and cumulative magnitudes of the innovation externality of obesity
from pharmaceutical innovation over a lifetime are substantial.
4.3 Innovation vs. Insurance Externalities of Obesity
We now calculate the present value of the cumulative innovation externality of obesity from
pharmaceutical innovation and compare it with the present value of the cumulative Medicare-
induced health insurance externality of obesity from total health care expenditures.
The present value of the cumulative innovation externality of obesity from the initial age
t0 to the terminal age T is
TXt=t0
�t�t0 � Innovation_Externalityt; (47)
where � is the discount factor and Innovation_Externalityt is the innovation externality
of obesity at age t from pharmaceutical innovation which is given by the expression (46)
for the lower bound of the optimal obesity subsidy. The present value of the cumulative
Medicare-induced public health insurance externality of obesity from the initial age t0 to the
terminal age T is
TXt=minft0;65g
�t�t0 �m� [Tt (obese)� Tt (normal)] ; (48)
where m is the share of the marginal health care expenditures paid by Medicare, and
Tt (normal) and Tt (obese) are the average annual health care expenditures at age t for the
normal weight and for the obese, respectively, and are estimated from the MEPS data. We
also calculate the present value of the cumulative Medicare-induced public health insurance
externality of obesity from pharmaceutical expenditures alone.13
We calibrate the discount factor at � = 0:97 and set the initial age at t0 = 18.14 The share
of health care expenditures covered by Medicare for people aged 65 and over is approximately
13The Medicare-induced insurance expenditure for pharmaceutical expenditures alone is calculated asPTt=minft0;65g �
t�t0 �m� [Et (obese)� Et (normal)] ; where Et (obese) and Et (normal) denote the annualpharmaceutical expenditures at age t for the obese and for the normal weight, respectively.14We calibrate the initial age at 18 both because the impact of obesity on health expenditures is very
small before age 18 and because we do not want to examine the additional implications of imposing taxesor subsidies on the behavior of minors.
23

50% in the MEPS data.15 While this average rate may not coincide with the marginal rate,
we assume that for people aged 65 and over medicare pays 50% of the increase in health care
expenditures that is caused by obesity by setting m = 0:5. We calculate the two cumulative
externalities as a function of the terminal age T:
The results are shown in Figure 2. For a person with terminal age 80, which roughly0
1000
2000
3000
4000
5000
Ext
erna
lity
in D
olla
rs
20 40 60 80Terminal Age of Obese Person
Cumulative Innovation Externality from Pharmaceutical Expenditures
Cumulative Medicare Insurance Externality from all Health Care Expenditures
Cumulative Medicare Insurance Externality from Pharmaceutical Expenditures
Present Value of Cumulative Innovation and Health Insurance Externalities of Obesity
Figure 2: Present Value of Cumulative Innovation and Insurance Externalities of Obesity.
equals life expectancy, the present value of the (positive) cumulative innovation external-
ity of obesity from pharmaceutical innovation is much larger than the present value of the
(negative) Medicare-induced public health insurance externality from pharmaceutical ex-
penditures and is similar in magnitude to the present value of the (negative) cumulative
Medicare-induced public health insurance externality from all health care expenditures.16
This result is important for two reasons. First, it demonstrates that the other moral
hazard in health that we identify can be quantitatively as important as the ex-ante moral15Medicare is an old-age public insurance program and does not cover people aged 64 or younger. The
proportion is presumably now higher than 50% since in 2006 Medicare started to cover pharmaceuticalexpenditures through its Part D program.16To the extent that obesity reduces life expectancy (see e.g. Michaud et al., 2009), these reductions
obviously have a larger impact on health expenditures at ages 65 years and older than at younger ages.Reductions in life expectancy that can be attributed to obesity therefore decrease the size of the Medicare-induced insurance externality of obesity more than the size of the innovation externality of obesity.
24

hazard examined by Ehrlich and Becker (1972) which has been a central concept in health
economics for decades. Second, it implies that the magnitude of the Medicare-induced im-
plicit pooled health insurance subsidy for obesity is roughly equal to the optimal subsidy for
obesity that is implied by the innovation externality of obesity from pharmaceutical innova-
tion. Accordingly, the presence of the Medicare-induced public health insurance externality
of obesity is not a su¢ cient rationale for �soda taxes�, �fat taxes�or other penalties aimed
increasing the personal costs of obesity.
Of course, the exact value of the innovation externality of obesity is sensitive to the
assumptions about the parameters. However, we believe that the conclusion that the magni-
tudes of the two opposing externalities of obesity are the same is robust. One reason why our
estimate of the innovation externality of obesity likely underestimates the true magnitude
of the externality is that in the above analysis we have ignored the innovation externality of
obesity from all other medical expenditures than pharmaceutical expenditures which is also
likely to be large. Another reason why our estimate of the innovation externality of obesity
likely underestimates the true magnitude of the externality is that for reasons discussed in
the beginning of Section 3.3 we have relied on the derived lower bound for the innovation
externality rather than on the derived expression for the exact innovation externality.
5 Conclusion
In this paper we argue that an analysis of the ex-ante moral hazard should not stop at
the disincentive e¤ects of insurance on self-protective activities. To demonstrate that our
argument is also quantitatively important we examine obesity as an example. A commonly
held view is that since obesity is at least to some degree the result of an individual�s decisions
and an individual does not bear the full costs of obesity, public policies aimed at increasing
the costs of obesity for an individual may be justi�ed. Our analysis challenges this perspective
on obesity.
Our theoretical argument is the following. Lower levels of prevention (self-protective
activities) and the associated chronic conditions and behavioral patterns such as obesity,
smoking, and malnutrition increase the incidence of many diseases. This increases the con-
sumer�s demand for treatments to those diseases, which increases an innovator�s reward for
innovation of treatments to those diseases. By the induced innovation hypothesis, which has
broad empirical support, the increase in the reward for innovation increases the innovation
of treatments to those diseases, which in turn bene�ts all consumers. Because individuals
do not take these positive externalities on the innovator and other consumers into account
25

when deciding the level of preventative activities such as exercise and healthy diet, they
invest too much in prevention. In other words, absent a policy intervention, individuals are
too healthy.
Our quantitative application shows that the innovation externality of obesity from phar-
maceutical expenditures alone roughly coincides with the Medicare-induced health insurance
externality of obesity from total health care expenditures. This �nding implies that the other
ex-ante moral hazard that we identify can be quantitatively as important as the ex-ante moral
hazard examined by Ehrlich and Becker (1972) which has been a central concept in health
economics for decades. This quantitative result also implies that the Medicare-induced sub-
sidy for obesity is roughly optimal and thus the presence of this subsidy is not an adequate
justi�cation for �soda taxes�, �fat taxes�or other penalties on obesity.
References
Acemoglu, D. and J. Linn (2004), �Market Size in Innovation Theory and Evidence from
the Pharmaceutical Industry.�Quarterly Journal of Economics, 119, 1049�90.
Bajari, P., H. Hong, and A. Khwaja (2006), �Moral Hazard, Adverse Selection and Health
Expenditures: A Semiparametric Analysis.�Working Paper 12445, National Bureau of
Economic Research.
Berndt, E. R. (2001), �The U.S. Pharmaceutical Industry: Why Major Growth in Times of
Cost Containment?�Health A¤airs, 20, 100�14.
Bertakis, K. D. and R. Azari (2005), �Obesity and the Use of Health Care Services.�Obesity
Research, 13, 372�9.
Bhattacharya, J. and K. Bundorf (2005), �Incidence of the Health Care Costs of Obesity.�
Working Paper 11303, National Bureau of Economic Research.
Bhattacharya, J. and M. Packalen (2008a), �Is Medicine an Ivory Tower? Induced Inno-
vation, Technological Opportunity, and For-Pro�t vs. Non-Pro�t Innovation.�Working
Paper 13682, National Bureau of Economic Research.
Bhattacharya, J. and M. Packalen (2008b), �The Other Ex-Ante Moral Hazard in Health.�
Working Paper 13683, National Bureau of Economic Research.
Bhattacharya, J. and N. Sood (2007), �Health Insurance and the Obesity Externality.�
Advances In Health Economics And Health Services Research, 17, 279�318.
26

Bloom, N., M. Schankerman, and J. Van Reenen (2007), �Identifying technology spillovers
and product market rivalry.�Working Paper 13060, National Bureau of Economic Re-
search.
Bungam, T., M. Satterwhite, A. W. Jackson, and J. R. Morrow (2003), �The Relationship
of Body Mass Index, Medical Costs, and Job Absenteeism.�American Journal of Health
Behavior, 27, 456�62.
Burton, W. N., C. Y. Chen, A. B. Schultz, and D. W. Edington (1998), �The Economic
Costs Associated with Body Mass Index in a Workplace.� Journal of Occupational and
Environmental Medicine, 40, 786�92.
Dixit, A. K. and J. E. Stiglitz (1977), �Monopolistic Competition and Optimum Product
Diversity.�American Economic Review, 67, 297�308.
Ehrlich, I. and G. S. Becker (1972), �Market Insurance, Self-Insurance, and Self-Protection.�
Journal of Political Economy, 80, 623�48.
Elmer, P. J., J. B. Brown, G. A. Nichols, and G. Oster (2004), �E¤ects of Weight Gain on
Medical Care Costs.� International Journal of Obesity Related Metabolic Disorders, 28,
1365�73.
Finkelstein, A. (2004), �Static and Dynamic E¤ects of Health Policy: Evidence from the
Vaccine Industry.�Quarterly Journal of Economics, CXIX, 527�64.
Finkelstein, E. A., I. C. Flebelkorn, and G. Wang (2003), �National Medical Spending At-
tributable to Overweight and Obesity: How Much, and Who�s Paying?� Health A¤airs,
W3:219�26.
George, L. and J. Waldfogel (2003), �Who A¤ects Whom in Daily Newspaper Markets?�
Journal of Political Economy, 111, 765�84.
Hicks, J. R. (1932), Theory of Wages. Macmillan, London.
Hotelling, H. (1929), �Stability in Competition.�Economic Journal, 39, 41�57.
Jones, C. and J. Williams (1998), �Measuring the Social Rate of Return to R&D.�Quarterly
Journal of Economics, 113, 119�35.
27

Kasper, D. L., E. Braunwald, S. Hauser, D. Longo, J. L. Jameson, and A. S. Fauci (2004),
Harrison�s Principles of Internal Medicine, 16 edition. McGraw-Hill Professional, New
York.
Katzmarzyk, P. T. and I. Janssen (2004), �The Economic Costs Associated with Physical
Inactivity and Obesity in Canada: An Update.�Canadian Journal of Applied Physiology,
29, 90�115.
Lakdawalla, D. and N. Sood (2006), �Health Insurance as a Two-Part Pricing Contract.�
Working Paper 12681, National Bureau of Economic Research.
Lakdawalla, D. and N. Sood (2007), �TheWelfare E¤ects of Public Drug Insurance.�Working
Paper 13501, National Bureau of Economic Research.
Lichtenberg, F. R. and J. Waldfogel (2003), �Does Misery Love Company? Evidence from
Pharmaceutical Markets Before and After the Orphan Drug Act.�Working Paper 9750,
National Bureau of Economic Research.
Liebowitz, S. J. and S. E. Margolis (1995), �Are network externalities a new source of market
failure?�Research In Law And Economics, 17, 1�22.
Manning, W. G., J. P. Newhouse, N. Duan, E. B. Keeler, and A. Leibowitz (1987), �Health
Insurance and the Demand for Medical Care: Evidence from a Randomized Experiment.�
American Economic Review, 77, 251�77.
Michaud, P.-C., D. Goldman, D. Lakdawalla, Y. Zheng, and A. Gailey (2009), �Understand-
ing the Economic Consequences of Shifting Trends in Population Health.�Working Paper
15231, National Bureau of Economic Research.
Mokdad, A. H., E. S. Ford, B. A. Bowman, W. H. Dietz, F. Vinicor, V. S. Bales, and
J. S. Markes (2003), �Prevalence of Obesity, Diabetes, and Obesity-Related Health Risk
Factors, 2001.�JAMA, 289, 76�9.
Mokdad, A. H., M. K. Serdula, W. H. Dietz, B. A. Bowman, J. S. Marks, and J. P. Koplan
(1999), �The Spread of the Obesity Epidemic in the United States, 1991-1998.�JAMA,
282, 1519�22.
Musich, S., C. Lu, T. McDonald, L. J. Champagne, and D. W. Edington (2004), �Association
of Additional Health Risks on Medical Charges and Prevalence of Diabetes within Body
Mass Index Categories.�American Journal of Health Promotion, 18, 264�8.
28

National Institute on Health (1998), �Clinical Guidelines on the Identi�cation, Evaluation,
and Treatment of Overweight and Obesity in Adults: The Evidence Report.� Report,
National Heart, Lung and Blood Institute in Cooperation with The National Istitute of
Diabetes and Digestive and Kidney Diseases.
Newell, R. A., A. Ja¤ee, and R. Stavins (1999), �The Induced Innovation Hypothesis and
Energy-Saving Technological Change.�Quarterly Journal of Economics, CXIV, 907�40.
Pauly, M. V. (1968), �The Economics of Moral Hazard: Comment.�American Economic
Review, 58, 531�7.
Pigou, A. C. (1912), Wealth and Welfare. MacMillan Company, London.
Popp, D. (2002), �Induced Innovation and Energy Prices.�American Economics Review,
XCII, 160�80.
Quesenberry, Jr., C. P., B. Caan, and A. Jacobson (1998), �Obesity, Health Services Use,
and Health Care Costs among Members of a Health Maintenance Organization.�Archives
of Internal Medicine, 158, 466�72.
Raebel, M. A., D. C. Malone, D. A. Conner, S. Xu, J. A. Porter, and F. A. Lanty
(2004), �Health Services Use and Health Care Costs of Obese and Non-obese Individ-
uals.�Archives of Internal Medicine, 164, 2135�40.
Rashad, I. and S. Markowitz (2006), �Incentives in Obesity and Health Insurance.�Working
Paper 13113, National Bureau of Economic Research.
Reinhardt, U. E. (2001), �Perspectives on the Pharmaceutical Industry.�Health A¤airs, 20,
136�49.
Sander, B. and R. Bergemann (2003), �Economic Burden of Obesity and its Complications
in Germany.�European Journal of Health Economics, 4, 248�53.
Schmookler, J. (1966), Invention and Growth. Harvard University Press, Cambridge, MA.
Spence, A. M. (1976a), �Product Di¤erentiation and Welfare.�American Economic Review,
66, 407�14.
Spence, A. M. (1976b), �Product Selection, Fixed Costs, and Monopolistic Competition.�
Review of Economic Studies, 43, 217�35.
29

Sturm, R. (2002), �The E¤ects of Obesity, Smoking, and Drinking on Medical Problems and
Costs.�Health A¤airs, 21, 245�53.
Thompson, D., J. B. Brown, G. A. Nichols, P. J. Elmer, and G. Oster (2001), �Body Mass
Index and Future Healthcare Costs: A Retrospective Cohort Study.�Obesity Research, 9,
210�18.
Thorpe, K. E., C. S. Florence, D.H. Howard, and P. Joski (2004), �The Impact of Obesity
on Rising Medical Spending.�Health A¤airs, W4:480�6.
Waldfogel, J. (2003), �Preference Externalities: An Empirical Study of Who Bene�ts Whom
in Di¤erentiated Product Markets.�Rand Journal of Economics, 34, 557�68.
Wang, F., A. B. Schultz, S. Musich, T. McDonald, D. Hirschland, and D.W. Edington (2003),
�The Relationship between National Heart, Lung, and Blood Institute Weight Guidelines
and Concurrent Medical Costs in a Manufacturing Population.� American Journal of
Health Promotion, 17, 183�9.
Wang, Y. and M. A. Beydoun (2007), �The Obesity Epidemic in the United States�Gender,
Age, Socioeconomic, Racial/Ethnic, and Geographic Characteristics: A Systematic Re-
view and Meta-Regression Analysis.�Epidemiologic Reviews, 29, 6�28.
Yin, W. (2008), �Market Incentives and Pharmaceutical Innovation.� Journal of Health
Economics, 27, 1060�77.
Young, A. A. (1913), �Pigou�s Wealth and Welfare.�Quarterly Journal of Economics, 27,
672�86.
30

Appendix: Proofs
A.1 Proof of the Stability Condition (33)
The slopes of the innovator and consumer optimum conditions (31) and (32) are
d�
dnOBESEN
=d�
dR�N � (�OBESE � �NORMAL)� s� (D1 �D0) (49)
anddnOBESE
N
d�= F 0 (BNORMAL)� (�OBESE � �NORMAL)� (1� s) (D0 �D1) ; (50)
respectively. Applying the de�nition (30) of "� and the expression (23) for R, expression
(49) can be written as
d�
dnOBESEN
= "� � ���OBESE � �NORMAL
�AV ERAGE: (51)
Applying the de�nition (20) of "OBESE and the expression (17) for BNORMAL, expression
(50) can be written as
dnOBESEN
d�= "OBESE �
nOBESEN
� (1� s) (D0 �D1)
D0 � � (1� s) (D0 �D1): (52)
Substituting these expressions (51) and (52) into the stability condition d�
dnOBESE
N
� dnOBESE
N
d�<
1; the stability condition becomes
"� � ���OBESE � �NORMAL
�AV ERAGE� "OBESE �
nOBESEN
� (1� s) (D0 �D1)
D0 � � (1� s) (D0 �D1)< 1: (53)
Because � � 1 and nOBESEN
� 1 by de�nition, and because
(1� s) (D0 �D1)
D0 � � (1� s) (D0 �D1)� D0 �D1
D0
(54)
holds for all s and �, condition (33) is a su¢ cient condition for the stability condition (53)
to hold.
31

A.1.2 Proof of Proposition 1
A.1.2.1 First-order condition for s
The �rst-order condition (FOC) for the optimal s in the optimization problem (35) is
�BNORMALF0 (BNORMAL)
dBNORMAL
ds� d�AV ERAGE
dsCILLNESS ��AV ERAGE
dCILLNESSds
= 0
(55)
Substituting the result
d�AV ERAGEds
= (�OBESE � �NORMAL)dnOBESE
N
ds(56)
for d�AVERAGEds
in the FOC (55) yields
�BNORMALF0 (BNORMAL)
dBNORMAL
ds� (�OBESE � �NORMAL)
dnOBESEN
dsCILLNESS
��AV ERAGEdCILLNESS
ds= 0: (57)
The consumer optimum condition (19) implies that
dnOBESEN
ds= �F 0 (BNORMAL)
dBNORMAL
ds: (58)
Substituting this result (58) for dnOBESE
N
dsin the FOC (57) yields
F 0 (BNORMAL)dBNORMAL
ds[�BNORMAL + (�OBESE � �NORMAL)CILLNESS]
��AV ERAGEdCILLNESS
ds= 0: (59)
Applying the de�nition (17) of BNORMAL allows us to rewrite this FOC as
F 0 (BNORMAL)dBNORMAL
dst� �AV ERAGE
dCILLNESSds
= 0: (60)
Substituting the result
dBNORMAL
ds= (�OBESE � �NORMAL)
dCILLNESSds
(61)
32

for dBNORMAL
dsallows us to rewrite the FOC (59) as
[F 0 (BNORMAL) (�OBESE � �NORMAL) t� �AV ERAGE]�dCILLNESS
ds= 0: (62)
Given the FOC (77) for the optimal t below, the factor in the brackets in the FOC (62)
above for the optimal s is non-zero whenever the FOC (77) for the optimal t holds. Thus,
the relevant FOC for the optimal s is
dCILLNESSds
= 0: (63)
Applying the de�nition (15) of CILLNESS allows us to rewrite this FOC as
�d�ds(1� s) + � = 0: (64)
Given the de�nitions (15) and (17) for CILLNESS and BNORMAL; respectively, the conditiondCILLNESS
ds= 0 implies that the property dBNORMAL
ds= 0 holds. Moreover, given the de�nition
(17) of BNORMAL and the expression (58) fordnOBESE
N
ds, the property dBNORMAL
ds= 0 implies
that the property dnOBESE
N
ds= 0 holds. Hence, the condition dCILLNESS
ds= 0 implies that the
property dnOBESE
N
ds= 0 holds. Thus, while in general the derivative d�
dsis given by
d�
ds=d�
dR
�@R
@s+
@R
@ nOBESEN
dnOBESEN
ds
�; (65)
at the optimum s�CS, for which the conditiondCILLNESS
ds= 0 and the property d
nOBESEN
ds= 0
hold, the derivatived�dsis given by
d�
ds=d�
dR
@R
@s(66)
holds. Substituting this result (66) for d�dsallows us to rewrite the FOC (64) as
� d�dR
@R
@s(1� s) + � = 0: (67)
Using the de�nition (23) of R yields@R
@s=R
s: (68)
Substituting this result (68) for @R@sallows us to rewrite the FOC (67) as
� d�dR
R
s(1� s) + � = 0: (69)
33

Applying the de�nition (30) of "� allows us to rewrite this FOC as
"� �1
s� 1
1� s = 0: (70)
A.1.2.2 First-order condition for t
The FOC for the optimal t in the optimization problem (35) is
�BNORMALF0 (BNORMAL)
dBNORMAL
dt� d�AV ERAGE
dtCILLNESS��AV ERAGE
dCILLNESSdt
= 0:
(71)
Substituting the result
d�AV ERAGEdt
=dnOBESE
N
dt(�OBESE � �NORMAL)CILLNESS (72)
for d�AVERAGEdt
allows us to rewrite the FOC (71) as
�BNORMALF0 (BNORMAL)
dBNORMAL
dt�dnOBESE
N
dt(�OBESE � �NORMAL)CILLNESS
��AV ERAGEdCILLNESS
dt= 0: (73)
Substituting the result
dnOBESEN
dt= �F 0 (BNORMAL)
dBNORMAL
dt(74)
for dnOBESE
N
dtallows us to rewrite the FOC (73) as
F 0 (BNORMAL)dBNORMAL
dt[(�OBESE � �NORMAL)CILLNESS �BNORMAL]
��AV ERAGEdCILLNESS
dt= 0: (75)
Applying the de�nition (17) of BNORMAL allows us to rewrite this FOC as
F 0 (BNORMAL)dBNORMAL
dtt� �AV ERAGE
dCILLNESSdt
= 0: (76)
34

Applying the result dBNORMAL
dt= (�OBESE � �NORMAL)
dCILLNESSdt
� 1 allows us to rewritethe FOC (76) as
[F 0 (BNORMAL) (�OBESE � �NORMAL) t� �AV ERAGE]dCILLNESS
dt� tF 0 (BNORMAL) = 0:
(77)
This formulation of the FOC for the optimal t is used after expression (62) above to solve
for the relevant FOC for the optimal s. Applying the result (74) again allows us to rewrite
the earlier FOC (76) for the optimal t as
�dnOBESE
N
dtt� �AV ERAGE
dCILLNESSdt
= 0: (78)
Substituting the result
dCILLNESSdt
= �d�dt(1� s) (D0 �D1) (79)
for dCILLNESSdt
allows us to rewrite the FOC (78) as
�dnOBESE
N
dtt� �AV ERAGE
��d�dt(1� s) (D0 �D1)
�= 0: (80)
Substituting the expression d�dt= d�
dRdRdtfor d�
dtand substituting the result
dR
dt=dnOBESE
N
dt(�OBESE � �NORMAL) s (D0 �D1) (81)
for dRdtallows us to rewrite the FOC (80) as
�AV ERAGE
�d�
dR(�OBESE � �NORMAL) s (D0 �D1)
dnOBESEN
dt(1� s) (D0 �D1)
�
�dnOBESE
N
dtt = 0: (82)
Applying the de�nition (23) of R allows us to rewrite this FOC as
�dnOBESE
N
dtt+
�d�
dRR (�OBESE � �NORMAL)
dnOBESEN
dt(1� s) (D0 �D1)
�= 0: (83)
35

Applying the FOC (69) for the optimal s allows us to rewrite this FOC (83) for the optimal
t asdnOBESE
N
dt[� (�OBESE � �NORMAL) s (D0 �D1)� t] = 0: (84)
This FOC for the optimal t yields the expression
t�CS = � (�OBESE � �NORMAL) s (D0 �D1) (85)
for the consumer surplus maximizing obesity subsidy t�CS:
A.1.2.3 Second-Order Condition
We �rst show that s�CS 2 (0; 1) : Obviously, s�CS < 1 as consumers do not receive any bene�tfrom innovation if s = 1: If s = 0 then t�CS = 0 as a positive t would not induce any
innovation. Therefore, a su¢ cient condition for the result s�CS > 0 is that the �rst derivative
of the objective function in the relevant maximization problem (35) with respect to s is
positive when s = 0 and t = 0: Substituting t = 0 into the expression on the left-hand side
of the FOC (62) for the optimal s, this condition can be written as
��AV ERAGE �dCILLNESS
ds> 0 (86)
when s = 0. Applying the de�nition (15) of CILLNESS allows us to rewrite this condition
(86) as
��AV ERAGE��d�ds(1� s) + �
�(D0 �D1) > 0; (87)
which holds at s = 0 by assumption (28) according to which the probability of innovation �
is small enough (or zero) when the reward for innovation is zero, R = 0; Hence, s�CS 2 (0; 1),which in turn implies that the FOC for the optimal s yields the optimal s.
To show that the FOC for the optimal subsidy t yields the optimal subsidy t we show
that when the FOC for the optimal t holds, we prove two results. First we show that the
second derivative of the objective function in the relevant maximization problem (35) with
respect to the subsidy t is negative. We then show that when the subsidy t is given by
the expression (34) for the subsidy tCS, the share of individuals who choose the low level of
prevention is less than one, nOBESEN
< 1. Together these two results imply that the FOC for
the optimal t yields the optimal t:
Given the expression for the �rst derivative of the objective function with respect to
the subsidy t on the left-hand side of the FOC (84) for the optimal subsidy t, the second
36

derivative of the objective function is negative when the FOC holds if the condition
d2 nOBESEN
dt2[0] +
dnOBESEN
dt
�d�
dt(�OBESE � �NORMAL) s (D0 �D1)� 1
�< 0 (88)
holds when the FOC holds. Because dnOBESE
N
dt> 0 this condition (88) can be rewritten as
d�
dt(�OBESE � �NORMAL) s (D0 �D1) < 1; (89)
which can be rewritten as
d�
dR
dR
dnOBESEN
dnOBESEN
dt(�OBESE � �NORMAL) s (D0 �D1) < 1: (90)
Substituting the result
dR
dnOBESEN
= (�OBESE � �NORMAL) s (D0 �D1) (91)
for dRdnOBESE
N
allows us to rewrite condition (90) as
d�
dR(�OBESE � �NORMAL) s (D0 �D1)
dnOBESEN
dt(�OBESE � �NORMAL) s (D0 �D1) < 1:
(92)
Applying the de�nitions (30) and (20) for "� and "OBESE, respectively, allows us to rewrite
this condition as
"��(�OBESE � �NORMAL) s (D0 �D1)
R"OBESE
nOBESEN
(�OBESE � �NORMAL) s (D0 �D1)
BNORMAL
< 1:
(93)
Substituting the de�nitions (23) and (17) for R and BNORMAL; respectively, allows us to
rewrite this condition as
"���OBESE � �NORMAL
�AV ERAGE"OBESE
nOBESEN
(�OBESE � �NORMAL) s (D0 �D1)
(�OBESE � �NORMAL)� [D0 � � (1� s) (D0 �D1)]� t< 1
(94)
Substituting the expression (34) for the optimal obesity subsidy t�CS for the obesity subsidy
t allows us to rewrite the condition (94) as
"��(�OBESE � �NORMAL)
�AV ERAGE"OBESE
nOBESEN
(D0 �D1) s
D0 � � (D0 �D1)< 1: (95)
37

Because � � 1 and nOBESEN
� 1 by de�nition, and because the property (54) holds for all sand �, a su¢ cient condition for this condition (95) to hold is that the condition
"� � "OBESE ��OBESE � �NORMAL
�AV ERAGE� D0 �D1
D0
< 1 (96)
holds. This condition (96) is the same as the stability condition (33), and hence holds by
assumption.
We now show that when the subsidy t is given by the expression (34) for the subsidy tCS,
the share of individuals who choose the low level of prevention is less than one, nOBESEN
< 1.
Substituting the expression (34) for the subsidy t�CS for t in the expression (32) for the share
of individuals nOBESEN
who choose the low level of prevention yields
nOBESEN
= 1� F [(�OBESE � �NORMAL)� [D0 � � (1� s) (D0 �D1)] (97)
��� s� (�OBESE � �NORMAL) (D0 �D1)]
= 1� F [(�OBESE � �NORMAL)� [D0 � � (D0 �D1)]] (98)
< 1� F [(�OBESE � �NORMAL)� [D0 � 1 (D0 �D1)]] (99)
= 1� F [(�OBESE � �NORMAL)�D1] (100)
< 1; (101)
where the �rst equality follows from the second part of assumption (27) and the last inequality
follows from the second part of assumption (18).
A.1.3 Proof of Proposition 2
The �rst-order condition to the maximization problem (43) is
d [�R� C (�)]d�
d�
dt+ �
dR
dt
�N �BNORMALF0 (BNORMAL)
dBNORMAL
dt
�N d�AV ERAGEdt
CILLNESS �N�AV ERAGEdCILLNESS
dt= 0: (102)
Because the probability of innovation � is chosen optimally by the innovator, the propertyd[�R�C(�)]
d�= 0 holds, which implies that the �rst term on the �rst line of the FOC (102) is
zero. Aside from the presence of the factor N , the combined second and third line of the
38
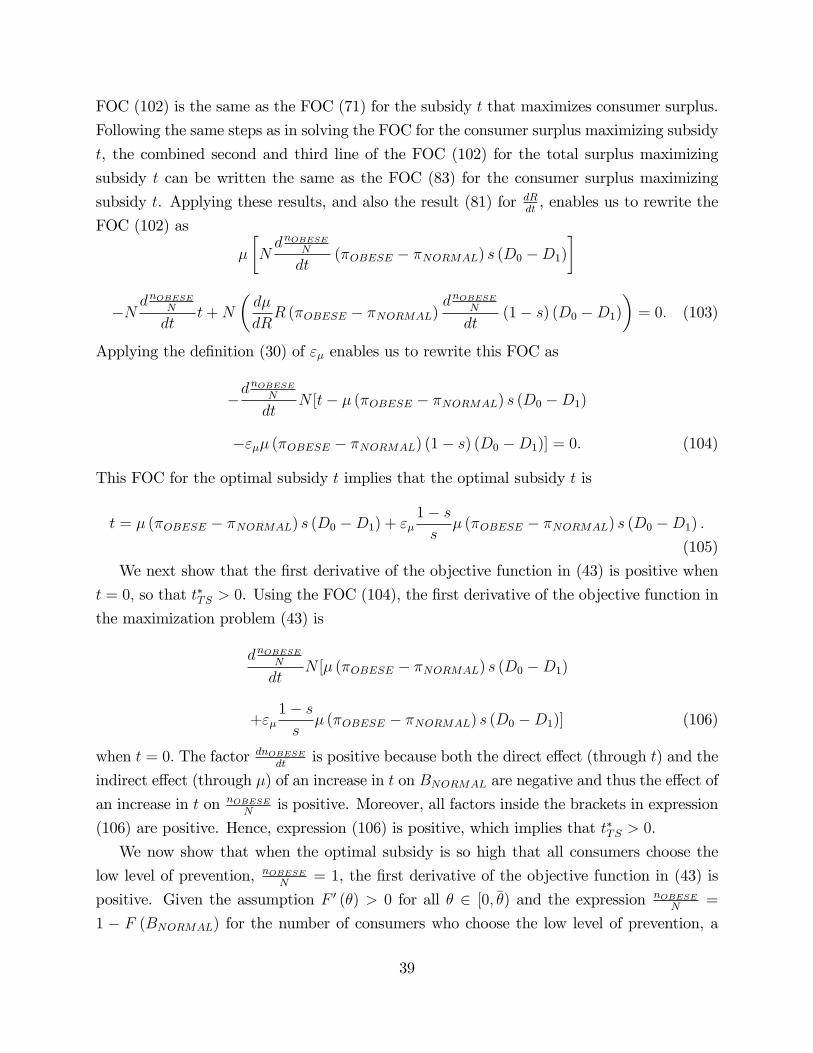
FOC (102) is the same as the FOC (71) for the subsidy t that maximizes consumer surplus.
Following the same steps as in solving the FOC for the consumer surplus maximizing subsidy
t, the combined second and third line of the FOC (102) for the total surplus maximizing
subsidy t can be written the same as the FOC (83) for the consumer surplus maximizing
subsidy t. Applying these results, and also the result (81) for dRdt, enables us to rewrite the
FOC (102) as
�
�NdnOBESE
N
dt(�OBESE � �NORMAL) s (D0 �D1)
�
�NdnOBESE
N
dtt+N
�d�
dRR (�OBESE � �NORMAL)
dnOBESEN
dt(1� s) (D0 �D1)
�= 0: (103)
Applying the de�nition (30) of "� enables us to rewrite this FOC as
�dnOBESE
N
dtN [t� � (�OBESE � �NORMAL) s (D0 �D1)
�"�� (�OBESE � �NORMAL) (1� s) (D0 �D1)] = 0: (104)
This FOC for the optimal subsidy t implies that the optimal subsidy t is
t = � (�OBESE � �NORMAL) s (D0 �D1) + "�1� ss� (�OBESE � �NORMAL) s (D0 �D1) :
(105)
We next show that the �rst derivative of the objective function in (43) is positive when
t = 0; so that t�TS > 0. Using the FOC (104), the �rst derivative of the objective function in
the maximization problem (43) is
dnOBESEN
dtN [� (�OBESE � �NORMAL) s (D0 �D1)
+"�1� ss� (�OBESE � �NORMAL) s (D0 �D1)] (106)
when t = 0: The factor dnOBESEdt
is positive because both the direct e¤ect (through t) and the
indirect e¤ect (through �) of an increase in t on BNORMAL are negative and thus the e¤ect of
an increase in t on nOBESEN
is positive. Moreover, all factors inside the brackets in expression
(106) are positive. Hence, expression (106) is positive, which implies that t�TS > 0:
We now show that when the optimal subsidy is so high that all consumers choose the
low level of prevention, nOBESEN
= 1, the �rst derivative of the objective function in (43) is
positive. Given the assumption F 0 (�) > 0 for all � 2 [0; ��) and the expression nOBESEN
=
1 � F (BNORMAL) for the number of consumers who choose the low level of prevention, a
39

necessary and su¢ cient condition for all consumers to choose the low level of prevention is
that BNORMAL = 0. Applying the de�nition (17) of BNORMAL, the condition BNORMAL = 0
holds if and only if t = ~t; where
~t = (�OBESE � �NORMAL) [D0 � � (1� s) (D0 �D1)] : (107)
Substituting this expression (107) for t in the expression (104) for the �rst derivative of the
objective function in (43) yields
�dnOBESE
N
dt(�OBESE � �NORMAL)N [D0 � � (D0 �D1)� "�� (1� s) (D0 �D1)]; (108)
which can be rewritten as
�dnOBESE
N
dt(�OBESE � �NORMAL)D0N [1� �(1 + "� (1� s))
D0 �D1
D0
]: (109)
In this expression (109) the factor dnOBESE
N
dt(�OBESE � �NORMAL)D0N is obviously positive
and the expression in brackets is positive by assumption (29). Hence, the expression (109)
is negative, which implies that the optimal subsidy t�TS is smaller than the subsidy ~t given
by expression (107) which induces all consumers to choose the low level of prevention.
This result t�TS < ~t and the previous result t�TS > 0 together imply that the optimal
obesity subsidy t�TS is given by the solution to the FOC for the optimal obesity subsidy.
40


![MORAL HAZARD AND THE OPTIMALITY OF DEBTfunction. I show that a continuous-time moral hazard problem, similar to Holmström and Milgrom [1987], is equivalent to the static moral hazard](https://img.pdfslide.us/doc/110x75/60a8a41c6e66457d3b2312d5/moral-hazard-and-the-optimality-of-debt-function-i-show-that-a-continuous-time.jpg)