Embed Size (px)
Citation preview
8/3/2019 The Opening Range Handbook Part 1 Basic Principles
http://slidepdf.com/reader/full/the-opening-range-handbook-part-1-basic-principles 1/32
8/3/2019 The Opening Range Handbook Part 1 Basic Principles
http://slidepdf.com/reader/full/the-opening-range-handbook-part-1-basic-principles 2/32
http://www.marketgauge.com/
The Opening Range Handbook – Part 1
The Basic Principles of How Markets Behave
by
Geoff Bysshe
www.marketgauge.com
First Edition 2.0
Copyright 2009 by MarketGauge, LLC. All rights reserved.
This publication is designed to provide accurate and authoritativeinformation in regard to the subject matter covered. It is distributed withthe understanding that the author and/or publisher are not engaged inrendering professional services. If professional advice or other expert
assistance is required, the services of a competent professional personshould be sought.
8/3/2019 The Opening Range Handbook Part 1 Basic Principles
http://slidepdf.com/reader/full/the-opening-range-handbook-part-1-basic-principles 3/32
http://www.marketgauge.com/
Contents
Introduction........................................................................................... 2 Chapter 1. The Driving Force Behind Any Market Move................................ 4
What You Need to Know to Be Successful in the Markets ............. 4 Sentiment Is the Driving Force Behind All Major Price Moves........ 5 How to Use the Power of Market Sentiment in Your Trading......... 6
Chapter 2. Why is the Opening Range (OR) so Important?........................... 7 Is the OR Fundamental or Technical Analysis? ........................... 7 What is the OR? .................................................................... 8 Why is the OR So Powerful? .................................................... 9 The OR Is Used by the World’s Most Successful Traders .............10 Is OR Trading for You? ..........................................................10
Chapter 3. Basic Technical Analysis .........................................................11 Understanding the Price and Volume Relationship .....................11 What is a Swing High or Low? ................................................13 How to Identify the Trend Using Swings...................................14 Support and Resistance Simplified ..........................................15 Don’t Over-Analyze the Charts ...............................................21
Chapter 4. Assessing the Opening Range (OR)..........................................22 Getting Started with the OR...................................................22 Three Questions for Analyzing the OR......................................24 Don’t Ignore the Stock’s Big Picture ........................................29
Next Steps ...........................................................................................30
8/3/2019 The Opening Range Handbook Part 1 Basic Principles
http://slidepdf.com/reader/full/the-opening-range-handbook-part-1-basic-principles 4/32
http://www.marketgauge.com/ 2
Introduction
Welcome to The Opening Range Handbook Part 1. This handbook was started as aseries of responses to the many questions I have received about trading from ourcustomers at MarketGauge, LLC. MarketGauge, LLC was founded by myself and KeithSchneider in 1995 while we were fund managers at Millennium Partners in New York
(currently one of the largest, most successful hedge funds in the world).MarketGauge’s original mission has been first to develop serious trading tools forourselves and trading partners, and to deliver them to serious professional traders.
The professional trading tools we develop find trading opportunities based on unusualprice and volume activity in the market indexes, sectors, industry groups and stocks.Our institutional customers have included Barron’s, Fidelity Institutional Brokerage,ADP, Reuters and Thomsen ILX Sytems, among others. Our present day mission hasexpanded to training individual traders from all over the world in the concepts,principles and use of our tools.
I believe that one of the most important ingredients to success in trading is focus.Following this belief, this book is primarily focused on one of the mostimportant market principle that can improve your trading, the Opening
Range. There are a few prerequisites to being able to fully appreciate the power of the Opening Range trading approach so these prerequisites will also be discussed. Thebook will describe how the Opening Range principle is great at identifying risk andevaluating trades based on well-defined risk/reward parameters. You will quickly seehow the Opening Range trading approach offers a very disciplined, low-risk approachto trading.
Whether you’re a seasoned trader or new to the stock market, this book will help youto become a more profitable trader. More specifically, I hope that through this bookyou will discover new insights into how and why markets move the way they dointraday, and also gain a new methodology for finding trading opportunities based ona stock’s intraday price swings. If you are a novice trader this book will provide youwith the foundation and background needed to understand all the principles discussedhere. For the experienced trader the book is organized in such a way that you cansimply focus on the chapters that you feel will offer you the most insight.
The focus of the book is on intraday price and volume activity but the applications of the principles discussed are in no way limited to day trading. The Opening Range canbe used to determine swing trade entry points, trailing stops, and exit points. In manycases the techniques discussed here have prevented me from entering swing tradestoo early or exiting them too late.
How This Book Is Organized
This book begins with an explanation as to why any market should be viewed as areflection of the sentiment of the market’s traders and investors. For as long asmarkets are traded by people, movements in a market’s price will be dictated by the
sentiment of the market participants. The Opening Range principle serves as aroad map for identifying and exploiting price changes that are driven by
shifts in market sentiment.
Chapter 2 introduces the concept of the Opening Range. This is not a complexconcept. I believe a trading strategy should make sense intuitively. This chapter willexplain and demonstrate how and why this simple concept works.
Chapter 3 is what I have referred to as prerequisite information. The Opening Rangetrading approach uses some basic technical analysis. If you are not familiar with
8/3/2019 The Opening Range Handbook Part 1 Basic Principles
http://slidepdf.com/reader/full/the-opening-range-handbook-part-1-basic-principles 5/32
http://www.marketgauge.com/ 3
reading charts, or identifying support and resistance levels on charts, then thischapter is required reading for you. For the more experienced technical trader thischapter will offer a review of the basics and perhaps some insight into how to simplifythe process of reading the charts for the purpose of trading the Opening Range.
Chapter 4 – “Assessing the Opening Range” - will explain how the Opening Rangeprovides a trading roadmap every day, regardless of the instrument you’re trading.This chapter presents the three questions that must be asked and answered to
accurately identify opening range opportunities. I then talk about the important of understanding the big picture and how to apply O.R. concepts.
Throughout this book I will refer to the “market”. I use the word market to describeany trading activity. The activity may be for a particular stock, index or futurescontract. For example, the trading in a stock will be referred to as the market for thatstock.
Without any further delay, let’s get started.
8/3/2019 The Opening Range Handbook Part 1 Basic Principles
http://slidepdf.com/reader/full/the-opening-range-handbook-part-1-basic-principles 6/32
http://www.marketgauge.com/ 4
Chapter 1. The Driving Force Behind Any Market Move
• What You Need to Know to Be Successful in the Markets
• Sentiment Is the Driving Force Behind All Major Price Moves
• How to Use the Power of Market Sentiment in Your Trading
What You Need to Know to Be Successful in the Markets
In 1990 I got lucky. After years of watching the markets through the media,newspapers and books, I started working on the floor of the New York CommoditiesExchange. My job was to be the assistant of a very successful independent floortrader, Keith Schneider. Keith had been trading on the floor since 1977. At the timethe floor of the exchange was home to many futures markets including crude oil, gold,silver, coffee, sugar, cocoa, cotton, the dollar index and more. His trading approachwas extremely disciplined and involved trading multiple markets at once. My mainresponsibilities were to help keep track of the price movements of markets and placeorders in the markets he was trading. Keith was more of a mentor than a boss, and
my responsibilities always felt more like an apprenticeship than a job. Now, 14 yearslater we are still working together as partners, and therefore this book is a reflectionof his trading experiences as well as mine.
I still consider myself fortunate to have been able to start work on the floor of theCommodities Exchange, because trading on the floor lets you experience first hand thesights, sounds, and even the smell of the most powerful forces in any market – fearand greed. Trading on the floor also forces you to watch the market through theactions of the participants, as opposed to sitting at a desk following the marketthrough the analysis of charts and quote screens. The best way to describe thedifference between trading on the floor versus trading from “upstairs” on a computeris to relate it to a sporting event. Think of the difference between being at the stadiumduring the last few minutes of a very close basketball, football, or baseball game
where the crowd roars with each twist and turn of the game, versus sitting at homewatching it on television. There is no comparison. At the stadium you can feel theexcitement; on the trading floor you can sense the mood of the market.
The best part about my experience on the floor was that it taught me the mostimportant principle in understanding what makes traders successful. I believe everysuccessful trader learns this principle or intuitively knows it, and then confirms itthrough experience. This principle is that there is really only one underlying market-moving force in any stock, index, futures contract, etc. This underlying force is thesource of every significant price move. The underlying force is market sentiment orthe market’s mood. If you analyze markets from the perspective that every significantmove in a stock’s price is dictated by the sentiment surrounding that stock then all of the traditional reasons - news, earnings, the economy, etc. make more sense.
Trading on the floor makes this principle easier to see because every day the market’smood or sentiment is revealed by its trading activity. As a trader you must look at thetrading action (the price and volume movements) of the market as if it was sendingyou a message. The message is the market telling you why and how it moved. Forexample did it move quickly with a lot of volume and emotion (fear or greed)? Did itdrift in one direction slowly and quietly? How did it react immediately after a newsannouncement? Did it reverse its initial reaction? The trading floor was anenvironment that forced me to experience this message every day. Like the emotionalroar of the crowd at the stadium, the intensity of the trading activity on the floor
8/3/2019 The Opening Range Handbook Part 1 Basic Principles
http://slidepdf.com/reader/full/the-opening-range-handbook-part-1-basic-principles 7/32
http://www.marketgauge.com/ 5
reflected the message of the market and it could not be ignored. More importantly themessage I heard and saw on the floor often seemed different than the explanations of the day’s activity being reported on the evening news, in newspapers and in books.Furthermore, experiencing the market’s reactions to news events, economic reportsand earnings announcements forced me to rethink much of what I thought Iunderstood from reading so many books about charts, company valuations, and theeconomy. For example why do stocks with strong earnings often see their share pricesfall dramatically? Why is bad economic news often followed by a stock market rally?The answer to these questions lies in market sentiment.
Sentiment Is the Driving Force Behind All Major Price Moves
A stock’s sentiment is the collective sentiment of the traders and investors who havepositions or are considering entering positions in the stock. But sentiment is notsimply the current mood of traders and investors. Sentiment is the prevailingexpectations of the market for the future prospects of the stock. In other words,sentiment represents bullish or bearish feelings for the future prospects of a stock.This means the current movements of a stock’s price are dictated by what the marketexpects will happen in the future, not what has already taken place! Any news is oldnews, any reported earnings data is old information. I’m sure you’ve heard the
expression, “the market is always looking forward.” This is not just a saying. It’s a ruleto trade by and it must be applied to be successful in the markets.
To apply the principle of trading in conjunction with market sentiment you should lookat a stock’s price action with the intent of answering two questions. Is the stocktrading in a way that demonstrates that its sentiment is bullish, bearish or undecided?And, is there any reason for it to be trading this way (i.e. news)? With answers tothese two questions you can begin to gauge the sentiment of the stock. This book willgo into more detail about how to interpret price action as it relates to sentiment andhow to trade based on this knowledge. The simple explanation can be found in somecommon sayings with which you are familiar. For example, “buy the rumor sell thenews”. Let’s look at an example of this phrase. Often a stock experiences a bullish runfor days, but then a piece of good news is announced and the stock sells off hard,
erasing the gains of the last few days. In this scenario, if you had bought the stockwhen the news came out you would have lost money. Why does this happen? Simple.The market participants were expecting or knew that there was a chance that goodnews would come out in the near future. As a result they had good reason to bebullish on the stock’s price and this sentiment drove the price of the stock higher.When news is released traders and investors must decide if the news was as good asexpected and then further assess whether there is more potentially good news on thehorizon. If they can’t expect further good news then they will become less bullish andtake profits. If the news was not as good as they had hoped their sentiment may turnbearish. Any shift in sentiment that would lead traders to become less bullish willcreate the desire to sell and that will tend to push the price of the stock lower.
Market sentiment exists on many levels. There is sentiment that is directly related to
the prospects of a specific company. There is also sentiment based on the company’sindustry group, and there is sentiment regarding the condition of the whole market.One of the most obvious examples of industry group sentiment was the Internetbubble in the late 90’s. During this time a company needed only to put a “.com” at theend of its name and sentiment for the stock would become insanely bullish, and as aresult the share price would climb. As you know, when the market is said to be in abull market it means that share prices in general are rising. Share prices will not riseunless the underlying sentiment of the market is bullish or improving. In a strong bullmarket the overall market sentiment can be strong enough to create increasingly
8/3/2019 The Opening Range Handbook Part 1 Basic Principles
http://slidepdf.com/reader/full/the-opening-range-handbook-part-1-basic-principles 8/32
http://www.marketgauge.com/ 6
bullish sentiment for industry groups and individual stocks. When this occurs it seemsas though every stock is going up regardless of its specific prospects looking forward.
How to Use the Power of Market Sentiment in Your Trading
Now that you know that it is not the news that is driving the markets but insteadchanges in market sentiment, how do you identify when sentiment is changing for the
better or worse? Based on the many years of experience Keith Schneider and I havehad as floor traders, money managers, and software developers of trading software,we believe we know the answer.
One of the most successful trading principles we have employed as floor traders andhedge fund managers is to identify key price points in the market where marketsentiment is likely to lead to a change in the stock’s short term direction or anacceleration of its current momentum. By using these key inflection points one canread market sentiment, anticipate a stock’s next move and quickly assess whichstocks are currently offering the best trading opportunities based on an analysis of riskversus reward.
I call this trading principle the Opening Range (OR) trading approach. I do not claim tobe the trader who discovered the Opening Range. In fact, I’m happy to say that it has
been used by many very successful professional traders for a long time. Whether youare just getting started in trading or you are an experienced trader you can benefitfrom understanding how the Opening Range affects a stock’s movements during theday. The Opening Range trading approach provides a trading road map for the noviceand experienced trader alike.
8/3/2019 The Opening Range Handbook Part 1 Basic Principles
http://slidepdf.com/reader/full/the-opening-range-handbook-part-1-basic-principles 9/32
http://www.marketgauge.com/ 7
Chapter 2. Why is the Opening Range (OR) so Important?
• Is the OR Fundamental or Technical Analysis?
• What is the OR?
• Why is the OR So Powerful?
• The OR Is Used by the World’s Most Successful Traders
• Is OR Trading for You?
Is the OR Fundamental or Technical Analysis?
Before we delve into Opening Range specifics, let’s put it in the perspective of traditional trading analysis approaches. There are two major approaches to stock andmarket analysis – fundamental and technical analysis.
Fundamental Analysis
Fundamental analysis, when applied to stock selection, is the analytical method in
which the economic value of the company or market is the primary determinant inmaking a trading or investment decision. A company’s revenues, earnings, assets andliabilities are analyzed to determine whether an investment opportunity exists.
Fundamentalists believe the price of a stock will be driven by its underlying economicvalue. The objective as a fundamentalist is to buy stocks that are selling below theirfair economic value, and sell stocks that are trading at valuations that exceed their faireconomic value.
While the fundamental approach sounds like an obvious and simple approach toinvesting, determining the economic value of a company is not an exact science. Moreoften than not even professional analysts do not agree on the value of a particularcompany.
The fundamental approach to analyzing stocks does have a lot of merit. In the longrun a stock’s price will be dictated by its true economic value. However, as a tradingapproach it has a significant weakness. Even if you could correctly determine acompany’s true economic value with absolute certainty the market may not agree withyour “correct” assessment for a very long time. In fact, the market could undervalueor overvalue the stock for so long that your assessment of the true economic valuemay change before you have an opportunity to profit from your correct initialassessment. For example, if you buy a stock for $15 because you feel that bearishsentiment has driven its price below its true economic value of $20, and then thestock trades down to an even more undervalued level of $10 your fundamentalanalysis would indicate that it is an even better buy at $10. The stock may be a bettervalue at $10 at that time. But what happens if the bearish sentiment continues tokeep the stock at $10 for a year, and in that time the fundamental condition of thestock deteriorates so much that now your analysis shows that the stock’s economicvalue has also declined to $10. You may have been correct that the stock was worth$20 when you bought it for $15, but now it’s trading for $10 and represents a 50%loss as an investment. Furthermore $10 is what you now think it is worth so not onlydid you never have a chance to profit from your correct fundamental analysis, but alsoyour own analysis now indicates that you should not expect to make money on theinvestment unless the stock becomes overvalued.
8/3/2019 The Opening Range Handbook Part 1 Basic Principles
http://slidepdf.com/reader/full/the-opening-range-handbook-part-1-basic-principles 10/32
http://www.marketgauge.com/ 8
Technical Analysis
Technical analysis is the method in which a stock’s or market’s historical price andvolume action is the primary determinant in making a trading or investment decision.Technical analysts use charts and modelling techniques to identify price trends andpatterns. Technical analysis is based on the belief that a stock’s price is driven by fear,greed, supply, demand and economic value. Furthermore, a technical analyst believesthat these market-moving factors create trading patterns in charts of market price and
volume activity that reoccur over time. These price and volume patterns are used toanticipate future price changes in a stock. An extreme technical analyst will say thatyou don’t need to look at anything but the charts; all known information is reflected inthe charts.
There are many different variations of charts and technical indicators but they all havethe common belief that historical price and volume data can be used to indicate whena stock is under- or overvalued. A technical trader will determine a trade’s entry andexit points based on either historical price levels on charts, projected price levels, timein a trade or some other similar type of information relating to time, price and/orvolume.
Many short-term traders have a bias towards some form of technical analysis. Thismakes sense. For short-term traders, worrying about fundamentals—how a company’s
sales and earnings performed over the last few quarters—won’t have a quantifiableimpact on the price of a stock over a period of hours or minutes.
The Opening Range approach is a technical approach to the markets. It incorporatestime, price and volume as inputs in determining the current bullish, bearish or neutralbias of the stock’s trading activity.
What is the OR?
The Opening Range (OR) is defined in terms of time and price. The time element issimply the first X number of minutes in the trading day. The number of minutes usedto define the Opening Range is your decision as a trader. In this book I define theOpening Range as the first 30 minutes of the trading day. In my trading I use both thefirst 5 minutes and the first 30 minutes because I have found these periods to workthe best for my strategies that are geared towards both swing trading and daytrading. This book will focus on the 30-minute OR because I think that this is the besttime frame for introducing the OR concept. A major reason for this belief is that themarkets tend to experience a reversal period around 10:00 AM EST, and there arealso economic reports that are released at 10:00 AM so the 30-minute OR includesboth of these factors.
The price component of the OR is the day’s trading range at the end of the OR timeperiod. This means that the 30-minute OR is defined as the stock’s high and low forthe day at 10:00 AM. The OR is not the opening price. In fact, the opening price is nota factor in calculating the OR. For example, if Amazon, Inc were to open at $46.49and then sell off to $46.06 at 9:45 AM and then reverse and rally to $46.66 at 9:55AM and then proceed to sell off into the middle of the day’s range until sometime after10:00 AM, its 30-minute OR would be the day’s range at 10:00 AM or $46.06 –$46.66. This is because during the 30-minute OR period $46.06 and $46.66 wereAmazon’s low and high, respectively.
8/3/2019 The Opening Range Handbook Part 1 Basic Principles
http://slidepdf.com/reader/full/the-opening-range-handbook-part-1-basic-principles 11/32
http://www.marketgauge.com/ 9
Why is the OR So Powerful?
As you can see, defining the OR is easy. The 30-minute OR is strictly the high and thelow of the first 30 minutes of trading. How can something so simple be so powerful?
The OR Reveals the Stock’s Bias for the Day
During the first 30 minutes of the day’s trading traders and investors are reacting toany news they have heard or analysis they have done since the close of the prior day.
This makes the opening period emotionally charged and informationally rich. I call itinformationally rich because traders have had time to analyze the prior day’s priceaction, any overnight news, the morning’s economic reports and even the openingprice action. Any or all of these conditions can dramatically change a trader’s bullish orbearish sentiment. It is emotionally charged because it is the first chance traders haveto trade based on their overnight conclusions. Therefore, there are a lot of potentialreasons for the flurry of trading activity that occurs when the market opens.Sometimes this activity lasts a few seconds and sometimes it lasts all day. The initialflurry of activity will generally settle down by the end of the 30-minute OR period.
I like to think of the Opening Range as the day’s “price discovery” period. The first 30minutes of trading is the period when the emotionally charged bulls and bears arebattling for control of the stock for the day. This battle between the bulls and bears in
the morning will often determine the most significant price levels for the rest of theday. In other words, the OR defines the critical price inflection points for the day.
The fact that the OR is such an emotionally charged and informationally rich period isalso why the OR can determine the bias for the day as being bullish, bearish, orneutral. The OR represents the bulls and bears establishing their initial positions forthe day. A move away from the OR indicates that one side is stronger than the other.When a stock moves above the OR the bulls are in control. This means the prevailingsentiment in the stock is bullish. The manner in which the stock breaks above andtrades above the OR will indicate the strength of the bullish sentiment. The same butopposite analysis applies when a stock moves below its OR. A move below the ORindicates that the stock is weak and the bears are in control.
The most basic application of the OR principle is that when a stock is trading above itsOpening Range you should have a bullish bias, and when it is trading below itsOpening Range you should have a bearish bias. After reading this book you will beable to quickly assess whether the stock is in a bullish, bearish or neutral condition bylooking at its trading relative to its Opening Range. The application of this simple rulecan focus your trading in such a way that will keep you in sync with the market’ssentiment. The upcoming chapters will describe how to apply and profit from thissimple rule.
The OR Provides Price Points for Identifying Opportunity and Risk
The OR provides more than just a bias for the day. By identifying important pricepoints at which you can anticipate a market reaction the OR provides a road map formany trading strategies. For example, if you knew that a stock was likely to continue
higher when it trades above a certain price wouldn’t that enable you to prepare to buythe stock at just the right time and price? Or, if you knew that a stock was likely tostop going down at a certain price wouldn’t that also help you to plan when you shouldpurchase that stock? More importantly, when you are long a stock do you know atwhat price the market is telling you that you are wrong to be long, and that youshould take your losses before they get worse? Understanding how a stock tradesrelative to its Opening Range can help you get into trades at the right time and out of losing positions without big losses. OR trading strategies identify low-risk, high-reward, trading opportunities.
8/3/2019 The Opening Range Handbook Part 1 Basic Principles
http://slidepdf.com/reader/full/the-opening-range-handbook-part-1-basic-principles 12/32
http://www.marketgauge.com/ 10
The OR’s significance can be proven statistically
I believe that keeping trading strategies simple is the best approach. Along the samelines, I believe that the fundamental premise of a trading strategy should be simpleand intuitive. The Opening Range principle is based on the premise that the high andthe low of the Opening Range are often significant price points for the rest of thetrading day. I’ve traded stocks and futures since 1990, and I could simply say “trustme” the OR high and low are important, but I don’t need to. The proof is in these
simple numbers. This book focuses on the 30-minute OR so I’ll give you the statisticsfor this time period. The first 30 minutes of the trading day represents slightly lessthan 8% of the trading day. If the market action is truly random then the high of theday for a stock should occur during the first half hour of the day about 8% of the time.My research on individual stocks shows that the high for the day occurs in the first 30minutes about 35% of the time! And the same can be said for the day’s low! Thismeans that there is a 35% chance that the high and low for the day in a stock at10:00 AM will still be the high and low of that stock at the end of the day. Knowinghow to take advantage of this statistical bias in the markets can give you a big edge infinding opportunities and reducing risk in your trading.
The OR Is Used by the World’s Most Successful Traders
As I stated in chapter 1 there are a lot of successful traders who use the OR as acritical part of their trading strategies. I did not invent it, I picked it up as a floortrader. I was convinced that it had merit by one of the floor’s greatest traders - MarkFisher. Mark has a very systematic approach to trading that is based on the OpeningRange principle and is used in many forms by hundreds and maybe thousands of traders on and off the trading floor. He has also recently published a book detailing hissystematic approach to trading. The title of the book is The Logical Trader: Applying a
Method to the Madness, and I’d recommend it to anyone who is serious aboutimproving their trading.
Is OR Trading for You?
Whether you are a swing trader or active day trader the OR provides a road map foranalyzing the sentiment of the market, quantifying risk and identifying trades withgood risk/reward ratios. There are many ways in which a better understanding of howmarkets are affected by the OR can improve your trading. If you are serious abouttrading, you owe it to yourself to understand this market principle.
8/3/2019 The Opening Range Handbook Part 1 Basic Principles
http://slidepdf.com/reader/full/the-opening-range-handbook-part-1-basic-principles 13/32
http://www.marketgauge.com/ 11
Chapter 3. Basic Technical Analysis
• Understanding the Price and Volume Relationship
• What is a Swing High or Low?
• How to Identify the Trend Using Swings
• Support and Resistance Simplified
• Don’t Over-Analyze the Charts
There are many books on technical analysis and this chapter will not attempt tosummarize the whole discipline. If you are not familiar with reading bar charts andcandlestick charts you owe it to yourself to invest some time in educating yourself inthe area of technical analysis. Understanding the basics will improve your insight intothe market dramatically. This chapter will focus on the basic principles of technicalanalysis that will help you to effectively read charts and trade the OR.
Understanding the Price and Volume Relationship
Charts are an important part of trading because a stock’s chart is a visualrepresentation of all the trading activity in that stock. Therefore, it reflects thecollective sentiment of all the traders of that stock. Remember from chapter 2,sentiment is the most powerful factor in determining how a stock will move. Byreading a chart you can assess whether the current sentiment is bullish, bearish, orindecisive. More importantly, the chart can identify price levels at which the sentimentwill likely change for the better or worse.
There are three dimensions to reading the markets – price, volume and time. The firststep to reading the charts is to understand the basic relationship between price andvolume. A common mistake made by the novice chart reader is his/her tendency to
focus on the price movements in the chart. Price and volume should always be lookedat together. A move in price should coincide with an increase in volume. Volume is soimportant that many technical analysts say that volume actually precedes price. Thisis one way of saying that a big change in volume will often indicate an impendingchange in price action. Don’t ignore the volume!
The basic relationship between price and volume is one where volume confirms price. “Confirmation” is a technical analysis term that means to support, or agree with. Aswith many areas of analysis, technical analysis is a science of looking for coincidentindications that your premise about the market is correct. When one indication agreeswith another it is called confirmation. For example, if the price of a stock is rising youmight anticipate that the stock will continue to go higher. If there is an increase involume with the increase in price, the increase in volume provides another reason to
believe that the price will continue to rise and thereby serves as a confirmation of theprice action.
8/3/2019 The Opening Range Handbook Part 1 Basic Principles
http://slidepdf.com/reader/full/the-opening-range-handbook-part-1-basic-principles 14/32
http://www.marketgauge.com/ 12
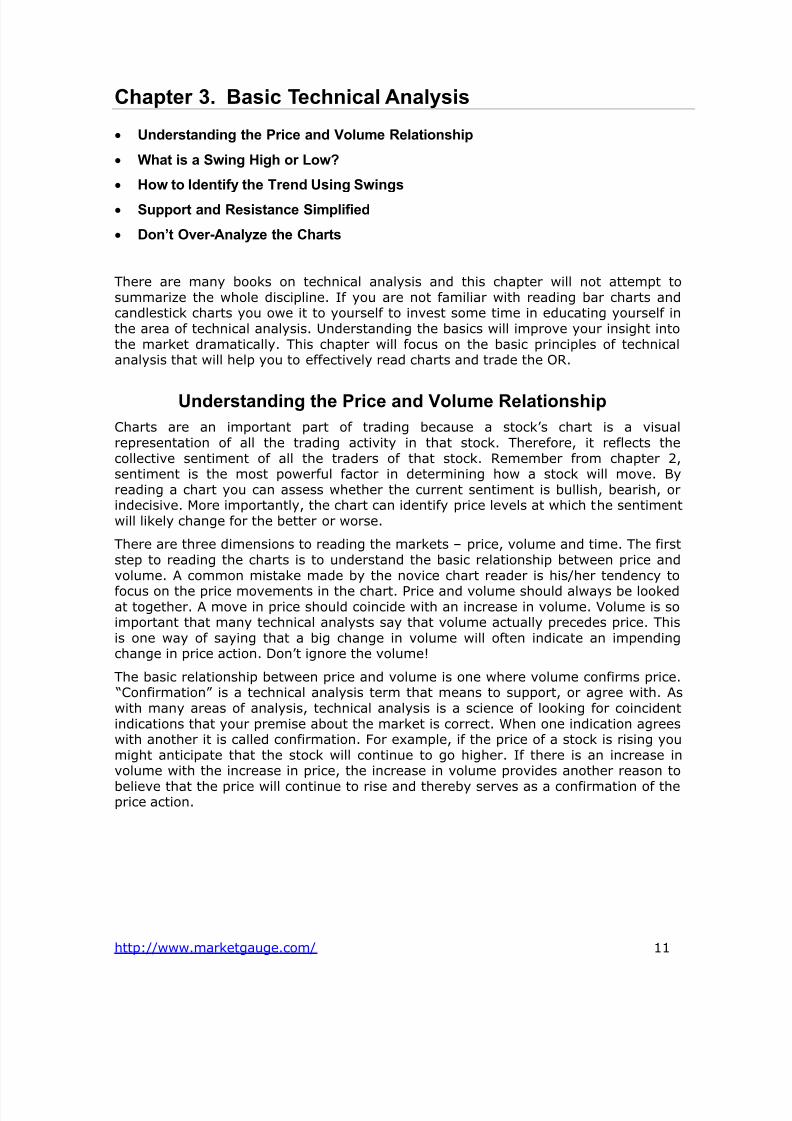
Figure 3-1 is an illustration of a bullish priceand volume pattern. The shaded areashighlight the surges in volume that drove theprice higher. Each surge is followed by apause or decline in price on lighter volume.
Relative volume is what is important
Volume should be interpreted in relativeterms. The absolute number of shares tradedis not as important as the level of volumeactivity relative to the norm for the stockbeing analyzed. When referring to “bigvolume” or “increased volume” in this book Imean volume that is higher than normal. Thisis important because volume is used todetermine an increased level of interest inthe stock as its price changes.
If a stock normally trades two million sharesper day and today it trades 2.2 million sharesthe stock is just acting normally. On the
other hand, if a stock that normally trades200,000 shares per day trades 400,000shares today then clearly there is somethingunusual going on in that stock. So the sameincrease of 200,000 shares in two differentstocks will have very different implications. The fact that the second stock tradedtwice its normal volume means that there is large new or renewed interest in thestock. When there is unusually high interest in the stock it is likely to also experiencean increase in volatility or continue to move in the direction of the volume.
Why does relative volume confirm price?
If an increase in volume occurs in conjunction with a rise in price it is interpreted as
bullish. Why? If an upward trend is going to continue higher it will require new buyersat higher prices. Volume in a rising stock reflects the amount of buying pressure that astock is experiencing. If volume is increasing as the stock moves higher it meansthere are plenty of interested buyers at the higher prices, and that is a bullishcondition.
The volume can be viewed as a gauge of the sentiment of a stock’s price action. If theprice and volume are rising together then more traders are getting involved as thestock climbs. The sentiment is bullish. Later in this chapter I will discuss price levels asanother gauge of trader sentiment. If a stock which has been trading sideways for along time with very little volume starts to rise from one level to the next on very lightvolume the market action is telling you that traders are not very excited about thatmove. If the same price advance happens with unusually large volume then you know
that the sentiment of the stock is shifting form neutral to bullish. The analysis isstraightforward, and with the right tools you can identify these shifts in momentum byscanning daily as well as intraday trading activity.
Another way to interpret higher volume is that it comes from institutional investors.These fund managers need to buy large quantities of stock when they want toestablish a position that can have an impact on their overall portfolio. They generallycannot establish their whole position in one day because it would move the market toomuch. When these fund managers act they leave footprints or clues about theiractions in the volume. These volume footprints indicate when and at what price the
Figure 3-1: Daily chart of XM
Satellite Radio (XMSR)
The shaded areas highlight how a healthyupward-trending stock will experience asurge in volume when the price moveshigher.
8/3/2019 The Opening Range Handbook Part 1 Basic Principles
http://slidepdf.com/reader/full/the-opening-range-handbook-part-1-basic-principles 15/32
http://www.marketgauge.com/ 13
institutional investors are active buyers. One reason to keep an eye out for thesevolume footprints is that they don’t tend to be isolated events. When fund managersdecide that they want to accumulate a large position in a stock their buying power cancreate large price moves that may continue uninterrupted for a whole day, a few daysor even weeks. Often volume spikes will be followed by a period of lower volumeconsolidation which is then followed by another surge in buying. This surge-pause-surge pattern occurs intraday as well as over the course of many days.
If you have scanning software to detect these unusual volume patterns it makes the job of finding stocks that are moving or that are about to move with the support of strong buying behind them much easier. HotScans by MarketGauge(www.marketgauge.com) is an example of such software. In addition to scanning forunusual volume patterns, it also displays price and relative volume using very easy tointerpret gauges.
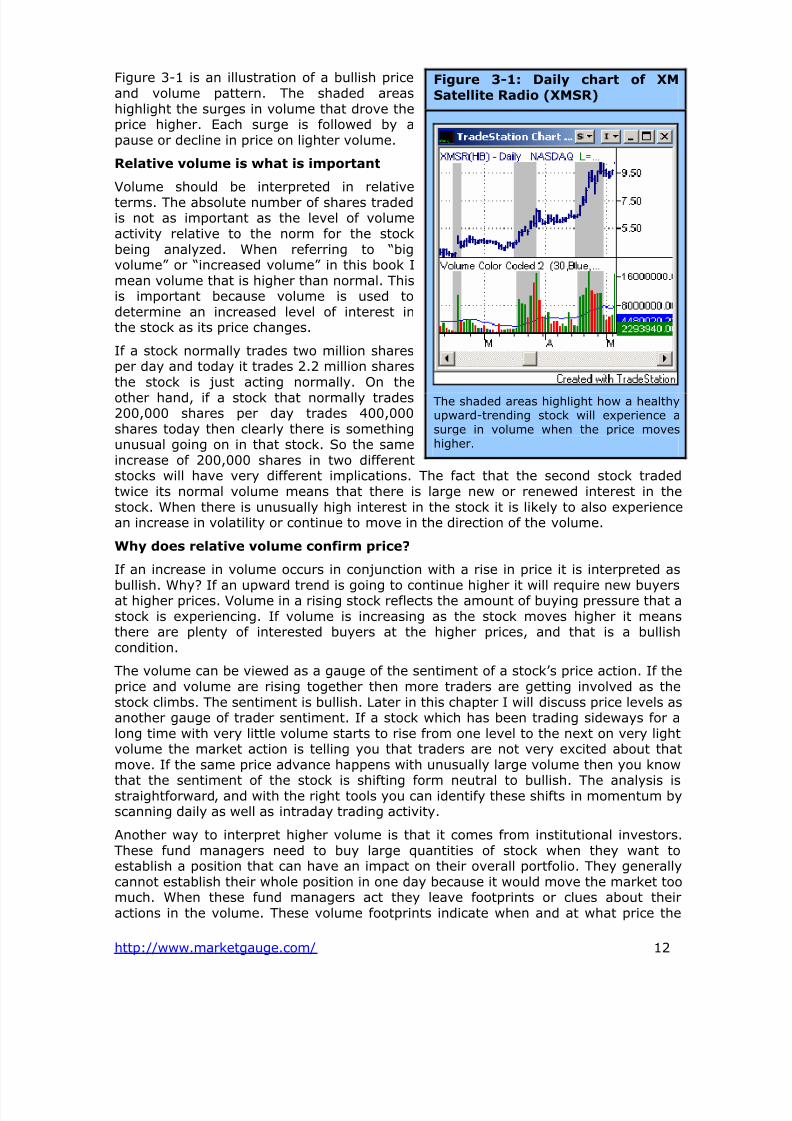
What is a Swing High or Low?
The terms “swing high” and “swing low” are used a lot in trading, and they areimportant concepts not only for determining significant price levels and the trend, butalso for managing risk in trading. A swing low is the low of a prior sell off. A swing
high is the high of a prior rally.Figure 3-2: A Swing High
A swing high (the highest bar,shown in red) is formed when aperiod’s high is higher than boththe period before and after it.
Figure 3-3: A Swing Low
A swing low (the lowest bar,shown in red) is formed when aperiod’s low is lower than both theperiod before and after it.
A swing low requires at least three periods (bars on a bar chart) to be established. Aswing low is formed when a period’s low is lower than both the period before it andthe period after it. A swing high is the reverse. It is formed when a period’s high ishigher than both the period before and after it. You cannot say that a particular bar ona chart is the lowest the stock will go until the stock experiences a period in which it
does not continue to go lower. Therefore, in its simplest definition a swing low is notestablished until a period occurs in which a stock does not make a new low for themove. Figures 3-2 and 3-3 illustrate how swings are formed.
A swing’s significance is determined by how many periods make up the swing and thepercent change in price from the prior swing point. For example, a swing low whichrepresents the low of the last 30 periods and the beginning of a rally that has lastedfor 20 periods would be considered to be a more significant swing low than one thatwas formed after a 3-period decline and a 3-period rise.
8/3/2019 The Opening Range Handbook Part 1 Basic Principles
http://slidepdf.com/reader/full/the-opening-range-handbook-part-1-basic-principles 16/32
http://www.marketgauge.com/ 14
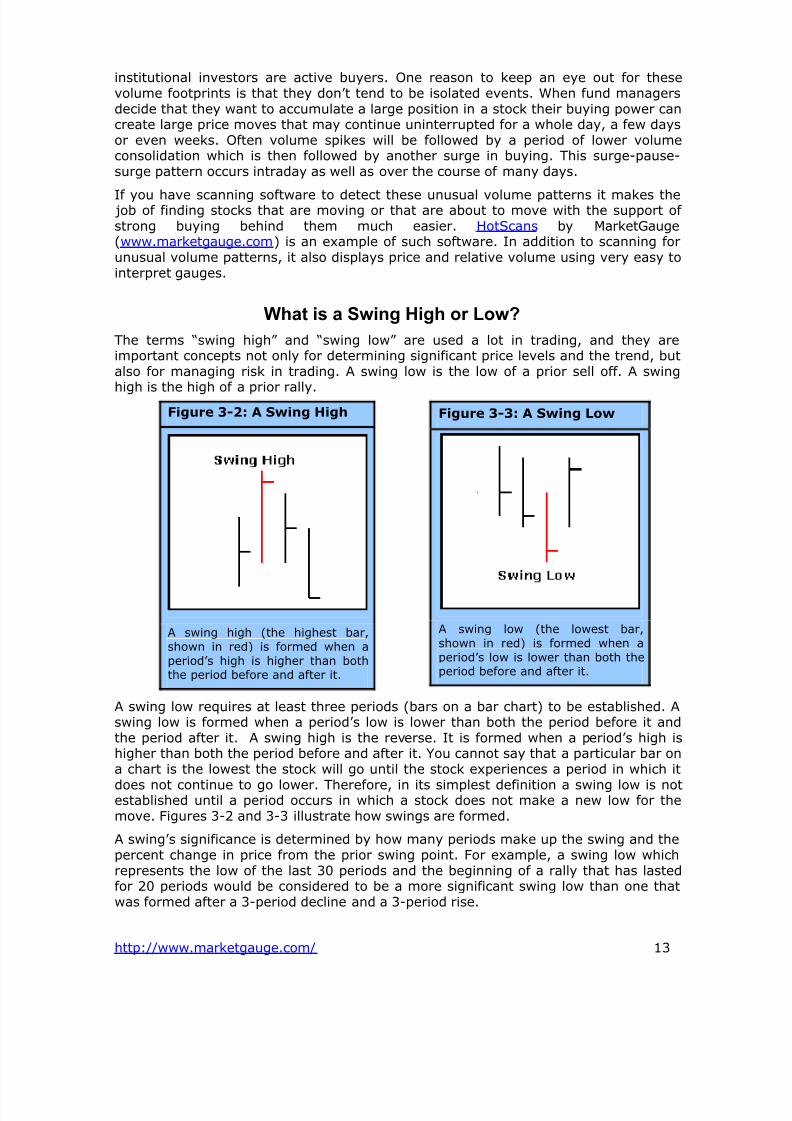
In figure 3-4, the major and minorswings are labelled with down arrowson the swing highs and up arrows onthe swing lows. Identifying swingspoints can be somewhat subjective inthat the size of the move and thetime frame required to constitute aswing are personal decisions.
How to Identify the TrendUsing Swings
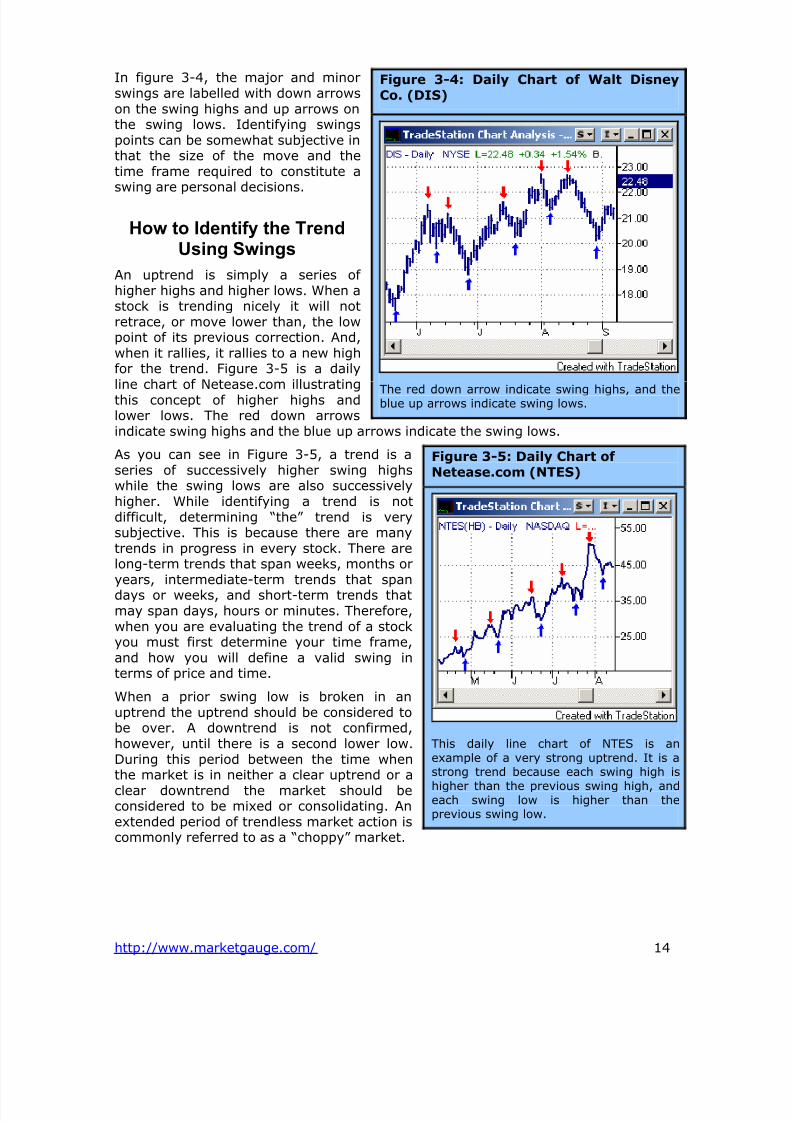
An uptrend is simply a series of higher highs and higher lows. When astock is trending nicely it will notretrace, or move lower than, the lowpoint of its previous correction. And,when it rallies, it rallies to a new highfor the trend. Figure 3-5 is a dailyline chart of Netease.com illustratingthis concept of higher highs andlower lows. The red down arrowsindicate swing highs and the blue up arrows indicate the swing lows.
As you can see in Figure 3-5, a trend is aseries of successively higher swing highswhile the swing lows are also successivelyhigher. While identifying a trend is notdifficult, determining “the” trend is verysubjective. This is because there are manytrends in progress in every stock. There arelong-term trends that span weeks, months oryears, intermediate-term trends that spandays or weeks, and short-term trends thatmay span days, hours or minutes. Therefore,when you are evaluating the trend of a stockyou must first determine your time frame,and how you will define a valid swing interms of price and time.
When a prior swing low is broken in anuptrend the uptrend should be considered tobe over. A downtrend is not confirmed,however, until there is a second lower low.During this period between the time whenthe market is in neither a clear uptrend or a
clear downtrend the market should beconsidered to be mixed or consolidating. Anextended period of trendless market action iscommonly referred to as a “choppy” market.
Figure 3-4: Daily Chart of Walt Disney
Co. (DIS)
The red down arrow indicate swing highs, and theblue up arrows indicate swing lows.
Figure 3-5: Daily Chart of
Netease.com (NTES)
This daily line chart of NTES is anexample of a very strong uptrend. It is astrong trend because each swing high is
higher than the previous swing high, andeach swing low is higher than theprevious swing low.
8/3/2019 The Opening Range Handbook Part 1 Basic Principles
http://slidepdf.com/reader/full/the-opening-range-handbook-part-1-basic-principles 17/32
http://www.marketgauge.com/ 15
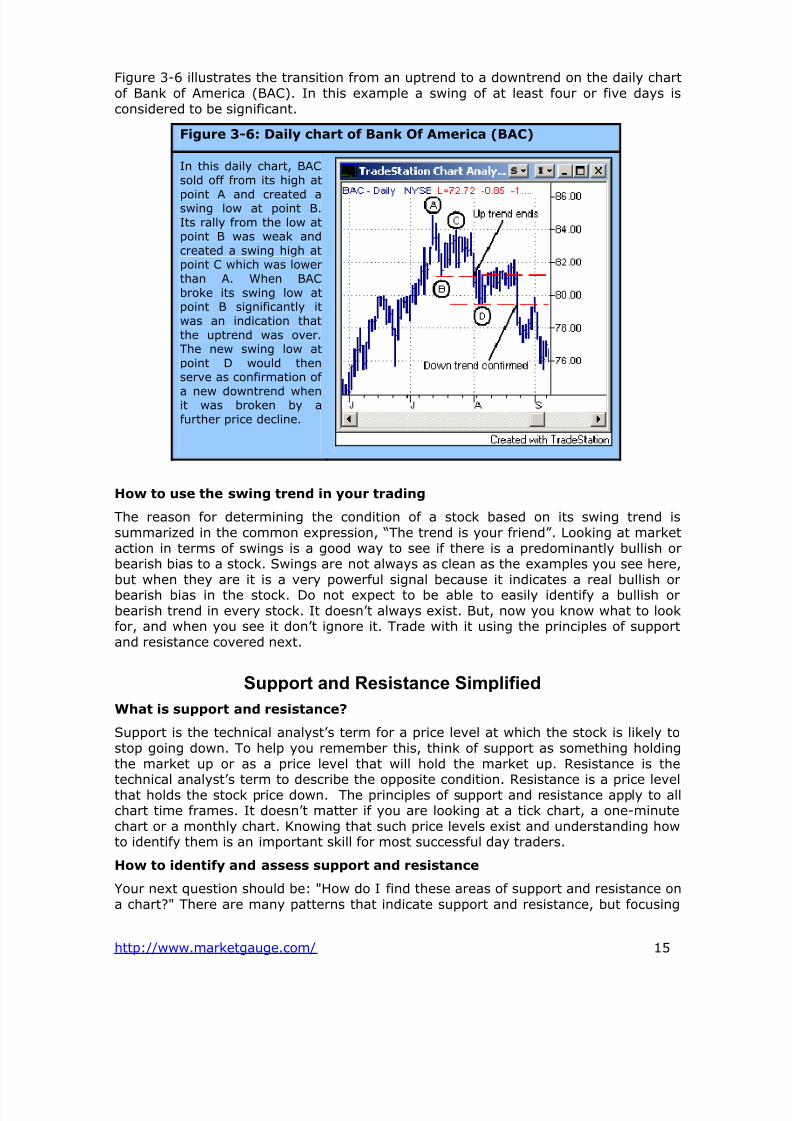
Figure 3-6 illustrates the transition from an uptrend to a downtrend on the daily chartof Bank of America (BAC). In this example a swing of at least four or five days isconsidered to be significant.
Figure 3-6: Daily chart of Bank Of America (BAC)
In this daily chart, BACsold off from its high at
point A and created aswing low at point B.Its rally from the low atpoint B was weak andcreated a swing high atpoint C which was lowerthan A. When BACbroke its swing low atpoint B significantly itwas an indication thatthe uptrend was over.The new swing low atpoint D would thenserve as confirmation of
a new downtrend whenit was broken by afurther price decline.
How to use the swing trend in your trading
The reason for determining the condition of a stock based on its swing trend issummarized in the common expression, “The trend is your friend”. Looking at marketaction in terms of swings is a good way to see if there is a predominantly bullish orbearish bias to a stock. Swings are not always as clean as the examples you see here,but when they are it is a very powerful signal because it indicates a real bullish orbearish bias in the stock. Do not expect to be able to easily identify a bullish orbearish trend in every stock. It doesn’t always exist. But, now you know what to lookfor, and when you see it don’t ignore it. Trade with it using the principles of supportand resistance covered next.
Support and Resistance Simplified
What is support and resistance?
Support is the technical analyst’s term for a price level at which the stock is likely tostop going down. To help you remember this, think of support as something holdingthe market up or as a price level that will hold the market up. Resistance is the
technical analyst’s term to describe the opposite condition. Resistance is a price levelthat holds the stock price down. The principles of support and resistance apply to allchart time frames. It doesn’t matter if you are looking at a tick chart, a one-minutechart or a monthly chart. Knowing that such price levels exist and understanding howto identify them is an important skill for most successful day traders.
How to identify and assess support and resistance
Your next question should be: "How do I find these areas of support and resistance ona chart?" There are many patterns that indicate support and resistance, but focusing
8/3/2019 The Opening Range Handbook Part 1 Basic Principles
http://slidepdf.com/reader/full/the-opening-range-handbook-part-1-basic-principles 18/32
http://www.marketgauge.com/ 16
on the basics is enough to make a big impact on your trading. Identifying major areasof support and resistance is as simple as looking at the chart and finding the prices atwhich the market stopped advancing (swing highs) and stopped going down (swinglows). Swing highs represent resistance and swing lows represent support. Mosttechnical analysis text books will define the support or resistance level created by thehighs and lows as being the exact price of the high or low. As a trader, however, Istrongly advise you to view support and resistance as being an area around the chartpoint. When the market approaches a support or resistance level you must watch theprice and volume action to determine if, and where, the market will respect (stop at)the chart point. Sometimes the market will stop right at the high or low, but often itwill stop slightly above or below the actual chart point.
Once you have identified a price level as being either support or resistance there are anumber of factors that should be considered in determining how significant or strongthe support or resistance level will be. These factors are as follows:
1. Time. The more time a stock trades at a price level the more significant thatlevel becomes. This may not occur in the form of multiple clearly definedswings, but rather in a consolidation period where many of the lows of theconsolidation area are at the same price level forming support.
2. Number of occurrences. This is another way of looking at how much time a
stock has traded at a particular level. If a stock has created multiple swing lowsat the same price level over time, then that price level will be significantsupport in the future.
3. Volume. The higher the relative volume is at a particular price level, the morelikely it is that the price level will become significant support or resistance. Thisshould make sense. If support, for example, is a function of the number of buyers willing to purchase the stock at a certain price, then a price level whichhas attracted high volume in the past is more likely to act as support than theprice level that has not attracted volume in the past.
4. How recently it was formed . Support and resistance are created by the factthat there is real demand (creating support) or a big supply of stock (creating
resistance) at certain price levels. Support and resistance levels that have beencreated recently are likely to be more significant than those that were formedweeks or months ago. It is for this reason that the day trader should alwaysknow the prior day’s high and low. These points represent the most recentsupport and resistance on the daily chart.
8/3/2019 The Opening Range Handbook Part 1 Basic Principles
http://slidepdf.com/reader/full/the-opening-range-handbook-part-1-basic-principles 19/32
http://www.marketgauge.com/ 17
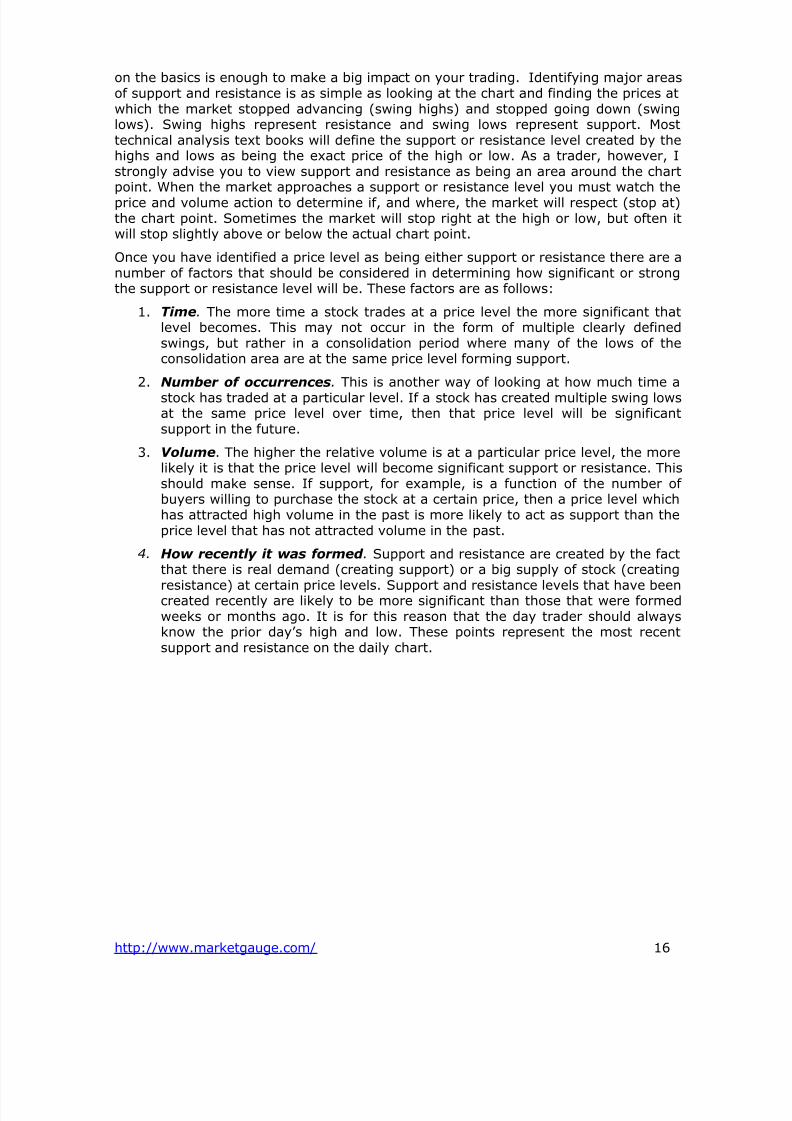
Let’s look at some examples.In the first example, Figure3-7, Nextel (NXTL) is tradingin a range between $11 and$14.60 on a daily chart. Thesupport and resistance areasare labelled with a horizontaldotted line. Notice thatbetween November and earlyDecember NXTL hadestablished $14.60 asresistance by reversing itstrend (swing highs) aroundthat level twice, and it alsoestablished $11.00 assupport by reversing its trendthere twice (swing lows).Therefore, it should not havesurprised traders in thefollowing months when NXTL
stopped near each of theselevels two more times overthe next three months. Inthis example you can see that the real resistance area was from just above $14 up tothe $14.60 level.
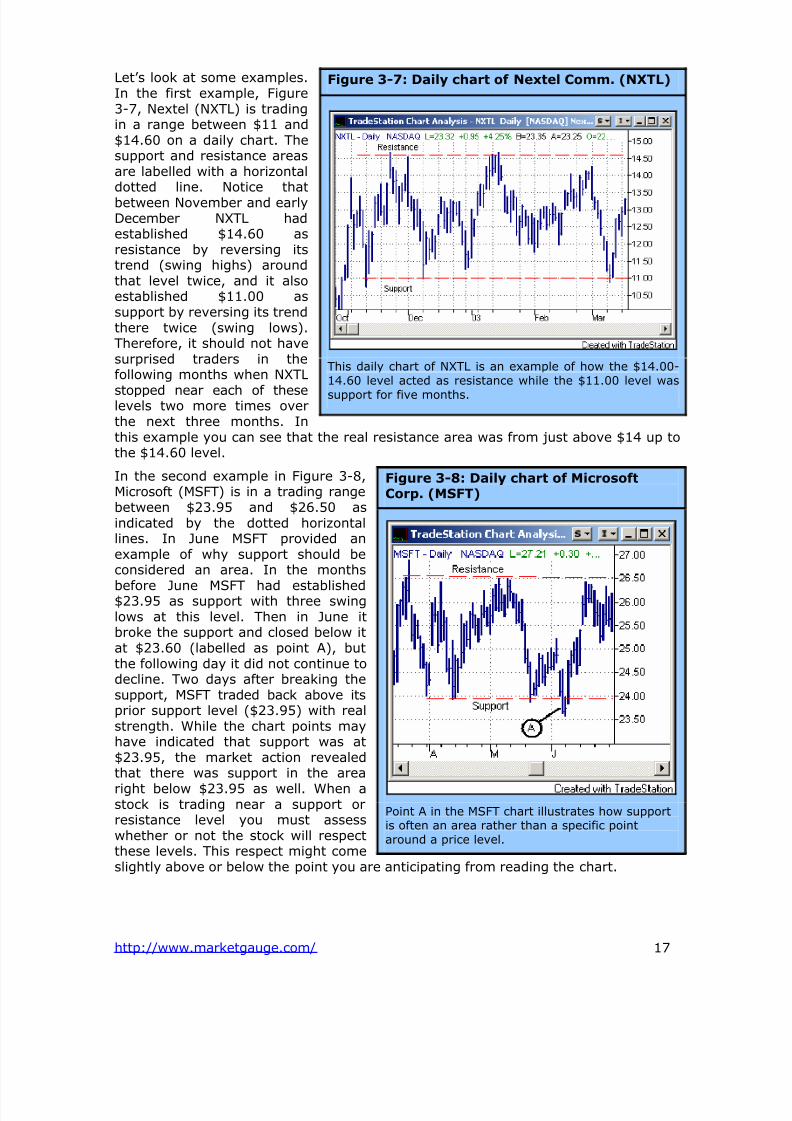
In the second example in Figure 3-8,Microsoft (MSFT) is in a trading rangebetween $23.95 and $26.50 asindicated by the dotted horizontallines. In June MSFT provided anexample of why support should beconsidered an area. In the months
before June MSFT had established$23.95 as support with three swinglows at this level. Then in June itbroke the support and closed below itat $23.60 (labelled as point A), butthe following day it did not continue todecline. Two days after breaking thesupport, MSFT traded back above itsprior support level ($23.95) with realstrength. While the chart points mayhave indicated that support was at$23.95, the market action revealedthat there was support in the area
right below $23.95 as well. When astock is trading near a support orresistance level you must assesswhether or not the stock will respectthese levels. This respect might comeslightly above or below the point you are anticipating from reading the chart.
Figure 3-7: Daily chart of Nextel Comm. (NXTL)
This daily chart of NXTL is an example of how the $14.00-14.60 level acted as resistance while the $11.00 level was
support for five months.
Figure 3-8: Daily chart of MicrosoftCorp. (MSFT)
Point A in the MSFT chart illustrates how supportis often an area rather than a specific pointaround a price level.
8/3/2019 The Opening Range Handbook Part 1 Basic Principles
http://slidepdf.com/reader/full/the-opening-range-handbook-part-1-basic-principles 20/32
http://www.marketgauge.com/ 18
Old resistance becomes new support
So far I’ve described support as being identified by looking for swing or consolidationlows, and I’ve described resistance as being the result of swing or consolidation highs.However, whenever a support or resistance level is broken by a significant amount itreverses its role. This means that when a stock rises convincingly above a resistancelevel then the old resistance price level will now act as support.
A role reversal for support and resistance may be a little counterintuitive, but this is avery important concept in reading support and resistance. The best way to understandwhy this happens is to look at how the sentiment of the traders in a stock impactssupport and resistance levels. Let’s break the traders in the stock into three categoriesbased on their sentiment – bulls (longs), bears (shorts), and undecided.
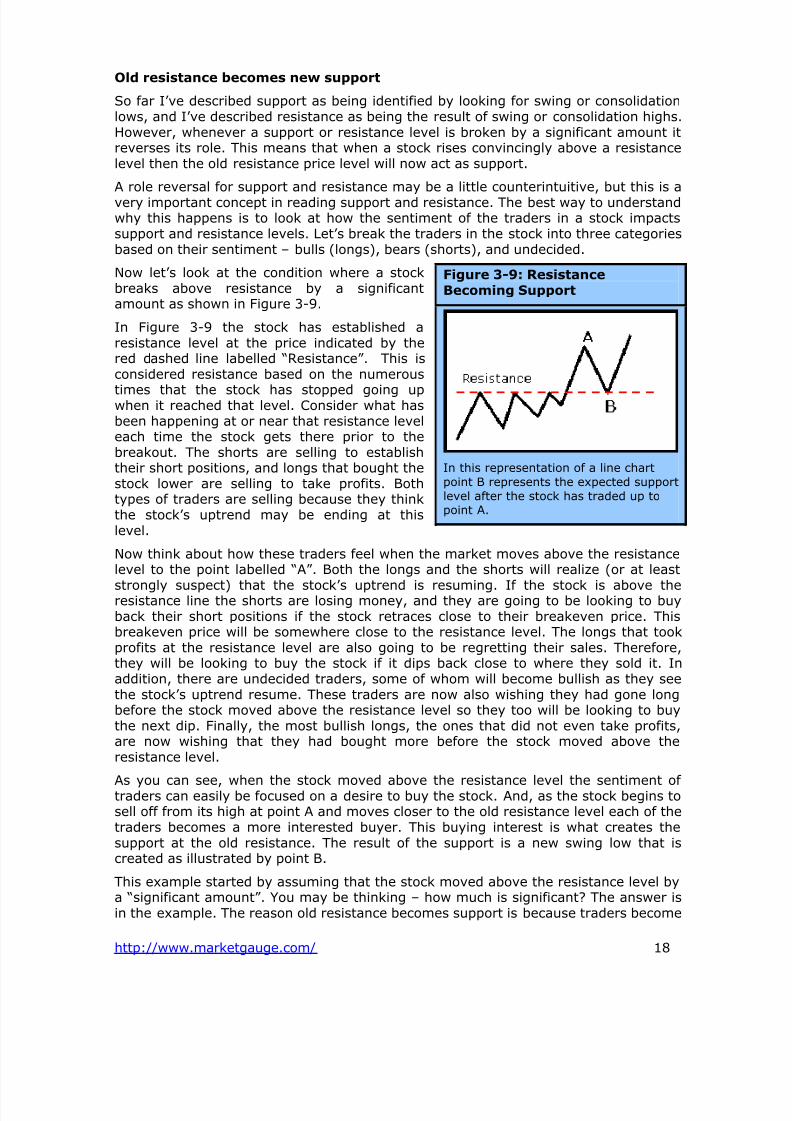
Now let’s look at the condition where a stockbreaks above resistance by a significantamount as shown in Figure 3-9.
In Figure 3-9 the stock has established aresistance level at the price indicated by thered dashed line labelled “Resistance”. This isconsidered resistance based on the numerous
times that the stock has stopped going upwhen it reached that level. Consider what hasbeen happening at or near that resistance leveleach time the stock gets there prior to thebreakout. The shorts are selling to establishtheir short positions, and longs that bought thestock lower are selling to take profits. Bothtypes of traders are selling because they thinkthe stock’s uptrend may be ending at thislevel.
Now think about how these traders feel when the market moves above the resistancelevel to the point labelled “A”. Both the longs and the shorts will realize (or at least
strongly suspect) that the stock’s uptrend is resuming. If the stock is above theresistance line the shorts are losing money, and they are going to be looking to buyback their short positions if the stock retraces close to their breakeven price. Thisbreakeven price will be somewhere close to the resistance level. The longs that tookprofits at the resistance level are also going to be regretting their sales. Therefore,they will be looking to buy the stock if it dips back close to where they sold it. Inaddition, there are undecided traders, some of whom will become bullish as they seethe stock’s uptrend resume. These traders are now also wishing they had gone longbefore the stock moved above the resistance level so they too will be looking to buythe next dip. Finally, the most bullish longs, the ones that did not even take profits,are now wishing that they had bought more before the stock moved above theresistance level.
As you can see, when the stock moved above the resistance level the sentiment of traders can easily be focused on a desire to buy the stock. And, as the stock begins tosell off from its high at point A and moves closer to the old resistance level each of thetraders becomes a more interested buyer. This buying interest is what creates thesupport at the old resistance. The result of the support is a new swing low that iscreated as illustrated by point B.
This example started by assuming that the stock moved above the resistance level bya “significant amount”. You may be thinking – how much is significant? The answer isin the example. The reason old resistance becomes support is because traders become
Figure 3-9: Resistance
Becoming Support
In this representation of a line chartpoint B represents the expected supportlevel after the stock has traded up topoint A.
8/3/2019 The Opening Range Handbook Part 1 Basic Principles
http://slidepdf.com/reader/full/the-opening-range-handbook-part-1-basic-principles 21/32
http://www.marketgauge.com/ 19
more bullish when the stock breaks through the resistance level. This shift insentiment causes them to want to buy the stock back at the level where they hadpreviously sold it, or buy the stock at a level where they had previously wished theyhad bought it. For this shift in sentiment to occur the move above the resistance levelmust be enough to convince traders that they were wrong in thinking that theresistance was potentially the end of the uptrend. If a stock only moves slightly abovea resistance level and then falls back below it, the increase in bullish sentiment willnot occur. In fact, such price action can have the reverse effect and turn traders morebearish because they will see that the stock tried to move above the resistance and “failed”. This is one reason why support or resistance is an area and not a point!
The same principle applies when a stock moves below a support level. The old supportbecomes resistance. Think about how this relates to your own experiences in themarket. How many times have you bought a stock because you had noticed that it hada tendency to stop at a particular level only to watch it continue to go lower? Andthen, when you are sitting with a losing position how often do you think about hownice it would be if you could get the opportunity to sell the position at the same priceyou bought it so that you wouldn’t have to take a loss? When you do this you becomepart of the collective market mood converting old support into new resistance.
Before we look at an example where
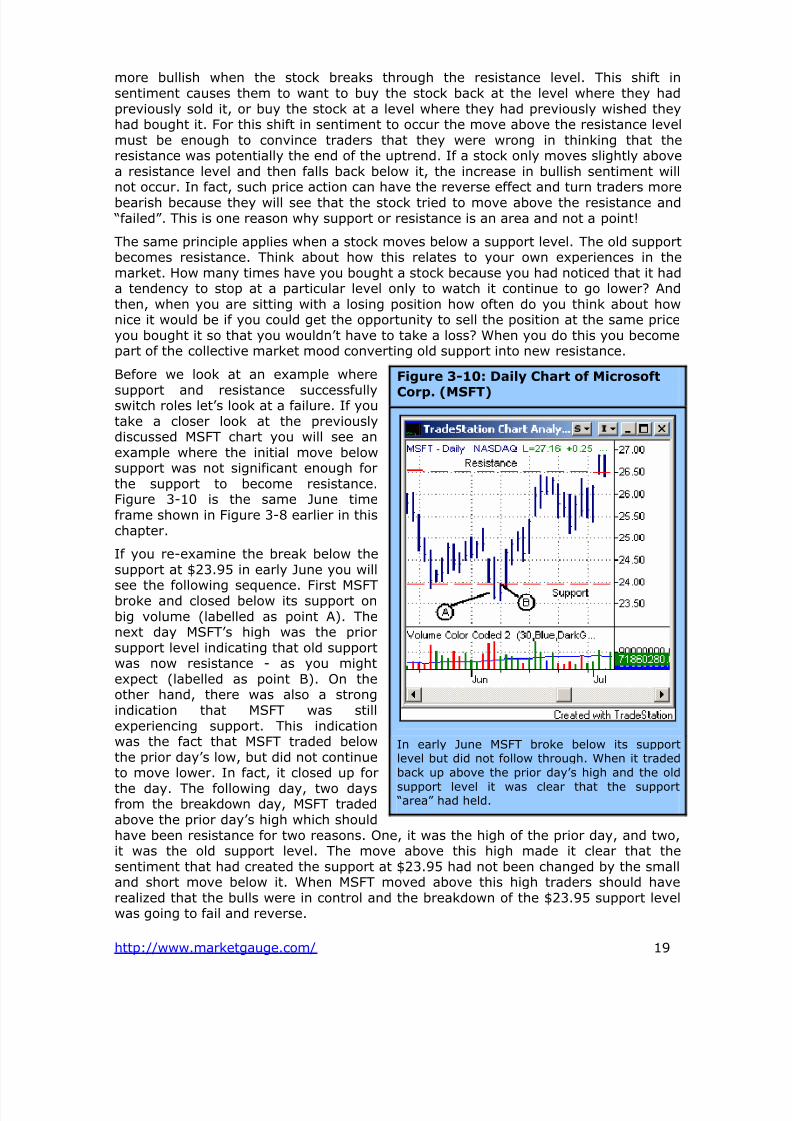
support and resistance successfullyswitch roles let’s look at a failure. If youtake a closer look at the previouslydiscussed MSFT chart you will see anexample where the initial move belowsupport was not significant enough forthe support to become resistance.Figure 3-10 is the same June timeframe shown in Figure 3-8 earlier in thischapter.
If you re-examine the break below thesupport at $23.95 in early June you will
see the following sequence. First MSFTbroke and closed below its support onbig volume (labelled as point A). Thenext day MSFT’s high was the priorsupport level indicating that old supportwas now resistance - as you mightexpect (labelled as point B). On theother hand, there was also a strongindication that MSFT was stillexperiencing support. This indicationwas the fact that MSFT traded belowthe prior day’s low, but did not continueto move lower. In fact, it closed up for
the day. The following day, two daysfrom the breakdown day, MSFT tradedabove the prior day’s high which shouldhave been resistance for two reasons. One, it was the high of the prior day, and two,it was the old support level. The move above this high made it clear that thesentiment that had created the support at $23.95 had not been changed by the smalland short move below it. When MSFT moved above this high traders should haverealized that the bulls were in control and the breakdown of the $23.95 support levelwas going to fail and reverse.
Figure 3-10: Daily Chart of Microsoft
Corp. (MSFT)
In early June MSFT broke below its supportlevel but did not follow through. When it tradedback up above the prior day’s high and the old
support level it was clear that the support “area” had held.
8/3/2019 The Opening Range Handbook Part 1 Basic Principles
http://slidepdf.com/reader/full/the-opening-range-handbook-part-1-basic-principles 22/32
http://www.marketgauge.com/ 20
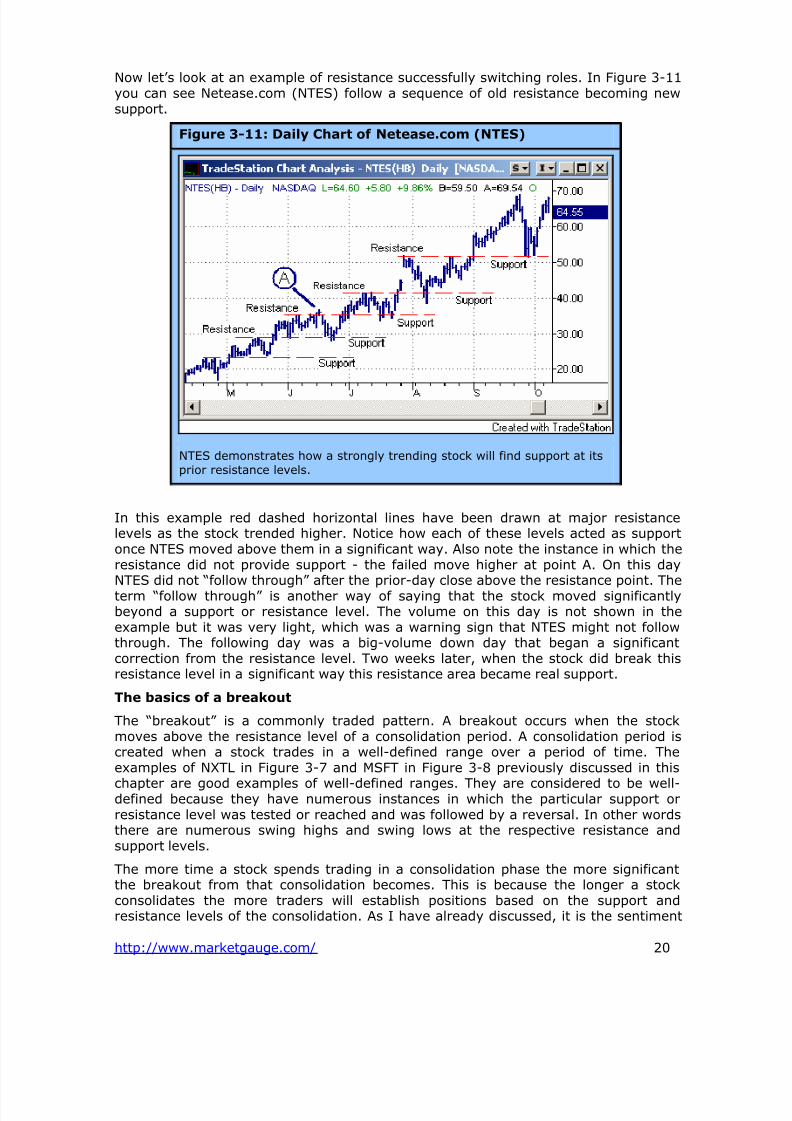
Now let’s look at an example of resistance successfully switching roles. In Figure 3-11you can see Netease.com (NTES) follow a sequence of old resistance becoming newsupport.
Figure 3-11: Daily Chart of Netease.com (NTES)
NTES demonstrates how a strongly trending stock will find support at itsprior resistance levels.
In this example red dashed horizontal lines have been drawn at major resistancelevels as the stock trended higher. Notice how each of these levels acted as supportonce NTES moved above them in a significant way. Also note the instance in which theresistance did not provide support - the failed move higher at point A. On this dayNTES did not “follow through” after the prior-day close above the resistance point. Theterm “follow through” is another way of saying that the stock moved significantlybeyond a support or resistance level. The volume on this day is not shown in theexample but it was very light, which was a warning sign that NTES might not followthrough. The following day was a big-volume down day that began a significantcorrection from the resistance level. Two weeks later, when the stock did break thisresistance level in a significant way this resistance area became real support.
The basics of a breakout
The “breakout” is a commonly traded pattern. A breakout occurs when the stockmoves above the resistance level of a consolidation period. A consolidation period iscreated when a stock trades in a well-defined range over a period of time. Theexamples of NXTL in Figure 3-7 and MSFT in Figure 3-8 previously discussed in this
chapter are good examples of well-defined ranges. They are considered to be well-defined because they have numerous instances in which the particular support orresistance level was tested or reached and was followed by a reversal. In other wordsthere are numerous swing highs and swing lows at the respective resistance andsupport levels.
The more time a stock spends trading in a consolidation phase the more significantthe breakout from that consolidation becomes. This is because the longer a stockconsolidates the more traders will establish positions based on the support andresistance levels of the consolidation. As I have already discussed, it is the sentiment
8/3/2019 The Opening Range Handbook Part 1 Basic Principles
http://slidepdf.com/reader/full/the-opening-range-handbook-part-1-basic-principles 23/32
http://www.marketgauge.com/ 21
of these traders that is going to push the breakout to follow through. When a stockbreaks below the support level it is also considered a breakout, although it iscommonly referred to as a breakdown. A breakdown below support follows all thesame principles of support and resistance as a breakout does – prior support becomesresistance.
The Opening Range approach to trading has many strategies that are based onfollowing or fading breakouts and breakdowns. In the upcoming chapters I will
describe in detail how to analyze the Opening Range as a breakout trade on anintraday chart, but the same concepts can be applied to daily charts.
Don’t Over-Analyze the Charts
The power of understanding technical analysis is not the ability to predict a stock’severy move. Good technical traders trade charts that make sense. They don’t try tomake sense out of every chart.
If the chart does not have any obvious areas of support and/or resistance then don’ttry to find something that doesn’t exist! One of the biggest mistakes new technicaltraders make is that they assume that every chart has some pattern that can betraded. The best approach to reading charts is to focus on the charts that have
obvious patterns rather than trying to interpret patterns that are not clear.
The best way to trade using charts is to become your own expert in analyzing a selectfew chart patterns and then trade stocks that have your pattern. If you specialize andfocus you will learn all the nuances of how stocks trade when they are in the conditionyou have defined as your pattern. When you have mastered one pattern it will be easyto add another pattern to your trading. You will find that mastering one type of pattern will make it easier to master others. For example, if you focus on buyingbreakouts you will quickly discover lots of nuances in price and volume action that willhelp you determine whether or not the breakout is going to follow through. Once youhave mastered how to trade breakouts from the long side you will also know what tolook for to determine which breakouts will fail. At that point looking for breakouts thatare likely to fail as short candidates will be a natural extension of your expertise.
To trade effectively find an efficient method of identifying stocks that have the patternyou are looking for and focus on those stocks. The most efficient way of doing thisusually involves the use of software that scans the market for stocks that meet yourcriteria. As a co-founder of MarketGauge, I naturally think MarketGauge’s HotScansproduct at www.marketgauge.com is the best market scanning tool for identifyingpatterns based on intraday price and volume movements, but there are many othergood tools available for this purpose. Find one that enables you to focus on thepatterns you want to trade.
The rest of this book will be focused on helping you get started in becoming an expertin trading breakouts and other patterns based on the Opening Range. When you havemastered these patterns the same knowledge and techniques can be applied tofollowing and fading gaps, fading the retracements to moving averages and manymore setups.
8/3/2019 The Opening Range Handbook Part 1 Basic Principles
http://slidepdf.com/reader/full/the-opening-range-handbook-part-1-basic-principles 24/32
http://www.marketgauge.com/ 22
Chapter 4. Assessing the Opening Range (OR)
• Getting Started with the OR
• Three Questions for Analyzing the OR
• Don’t Ignore the Stock’s Big Picture
Getting Started with the OR Traders are always looking for insight
As a trader you have probably had an experience where something that seemed fuzzyabout the markets suddenly became clear. It may have been related to readingcharts, or new insight into what was really going on behind the numbers jumpingaround on your Level 2 screen. Suddenly and sometimes for no specific reason, yousee or hear something that pulls lots of loose ends together and you experience afeeling of “Ahaa!” The concept becomes clear, obvious, and it makes you feel that youreally understand. You believe you finally have insight.
Your understanding of the Opening Range trading approach will most likely come toyou in two “Ahaas” or phases. First, you will realize that you can look at an intradaybar chart and clearly see the Opening Range. I don’t mean that you will be able tosimply point out the high and the low and then do the math and recite the OR’s range.I mean you will be able to quickly identify the OR as bullish, bearish, tradable, nottradable, uninteresting, etc. You will have insight.
The second “Ahaa” will occur when you experience the ability to explain and anticipatea stock’s price action based on the footprint of the OR. Sound crazy? Do you think thatyou can use charts to explain and anticipate a stock’s price action? If you do then theOR will absolutely provide you with insight into a stock’s next intraday move. If youdon’t believe in the power of the charts, studying the OR may change your mind.
Insight is usually a function of experience combined with study. In this chapter I willdiscuss the characteristics and qualities that you should focus on in evaluating the OR.The intent is to help you experience or solidify what I described as the first phase of your understanding of the OR. If you have experience looking at the OR in yourtrading you may already have this level of insight and this chapter will serve as arefresher. If you have never traded using the OR as a guide, welcome to the OR!
It is no coincidence that the prior chapters discussed basic technical analysis andmoney management. The Opening Range trading approach is powerful because itprovides technical insight and trading opportunities that are based on good moneymanagement. Therefore, the Opening Range should be analyzed on two levels –technical setup and trade opportunity. The analysis of the stock’s technical conditionanswers the question of whether the stock is in a bullish, bearish or neutral condition.The analysis of a trading opportunity identifies whether or not the stock has a tradableOR setup. It is possible to have a bullish technical condition without having a goodtrading opportunity. In this case you should not try to trade! Sometimes the besttrading decision you can make is to sit on your hands.
Defining the OR
The Opening Range is defined by both time and price. The time element is the first Xnumber of minutes of the trading day. For example, if I am discussing the 30-minuteOR then I am referring to the price action of the first 30 minutes of the trading day(9:30 AM-10:00 AM EST). In my trading I use the first 30 minutes of the trading day
8/3/2019 The Opening Range Handbook Part 1 Basic Principles
http://slidepdf.com/reader/full/the-opening-range-handbook-part-1-basic-principles 25/32
http://www.marketgauge.com/ 23
as my default for day trades. I also look at the first 5 minutes in some situationswhere I may want to be more aggressive. While different trading styles do lendthemselves to different OR time frames the analysis is the same. This book will focuson the 30 minute OR because I think it is the best place to start. As you will see,however, the time element is flexible.
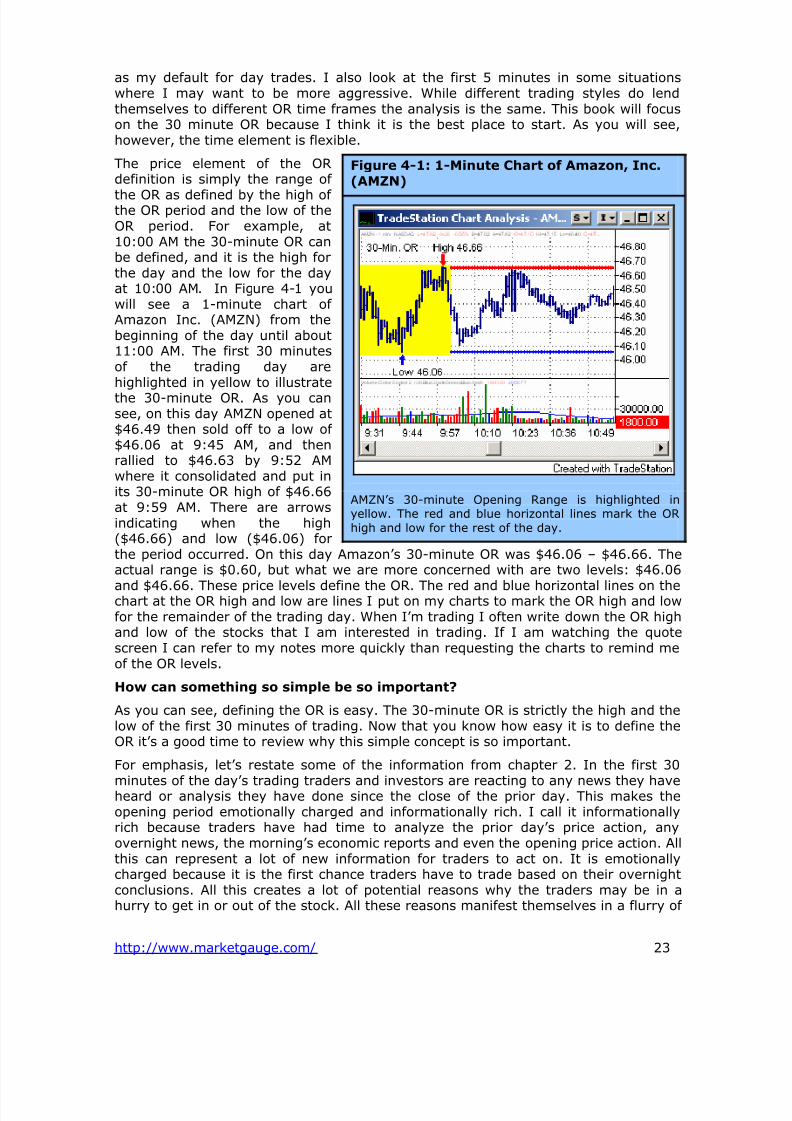
The price element of the ORdefinition is simply the range of
the OR as defined by the high of the OR period and the low of theOR period. For example, at10:00 AM the 30-minute OR canbe defined, and it is the high forthe day and the low for the dayat 10:00 AM. In Figure 4-1 youwill see a 1-minute chart of Amazon Inc. (AMZN) from thebeginning of the day until about11:00 AM. The first 30 minutesof the trading day arehighlighted in yellow to illustratethe 30-minute OR. As you cansee, on this day AMZN opened at$46.49 then sold off to a low of $46.06 at 9:45 AM, and thenrallied to $46.63 by 9:52 AMwhere it consolidated and put inits 30-minute OR high of $46.66at 9:59 AM. There are arrowsindicating when the high($46.66) and low ($46.06) forthe period occurred. On this day Amazon’s 30-minute OR was $46.06 – $46.66. Theactual range is $0.60, but what we are more concerned with are two levels: $46.06
and $46.66. These price levels define the OR. The red and blue horizontal lines on thechart at the OR high and low are lines I put on my charts to mark the OR high and lowfor the remainder of the trading day. When I’m trading I often write down the OR highand low of the stocks that I am interested in trading. If I am watching the quotescreen I can refer to my notes more quickly than requesting the charts to remind meof the OR levels.
How can something so simple be so important?
As you can see, defining the OR is easy. The 30-minute OR is strictly the high and thelow of the first 30 minutes of trading. Now that you know how easy it is to define theOR it’s a good time to review why this simple concept is so important.
For emphasis, let’s restate some of the information from chapter 2. In the first 30
minutes of the day’s trading traders and investors are reacting to any news they haveheard or analysis they have done since the close of the prior day. This makes theopening period emotionally charged and informationally rich. I call it informationallyrich because traders have had time to analyze the prior day’s price action, anyovernight news, the morning’s economic reports and even the opening price action. Allthis can represent a lot of new information for traders to act on. It is emotionallycharged because it is the first chance traders have to trade based on their overnightconclusions. All this creates a lot of potential reasons why the traders may be in ahurry to get in or out of the stock. All these reasons manifest themselves in a flurry of
Figure 4-1: 1-Minute Chart of Amazon, Inc.
(AMZN)
AMZN’s 30-minute Opening Range is highlighted inyellow. The red and blue horizontal lines mark the ORhigh and low for the rest of the day.
8/3/2019 The Opening Range Handbook Part 1 Basic Principles
http://slidepdf.com/reader/full/the-opening-range-handbook-part-1-basic-principles 26/32
http://www.marketgauge.com/ 24
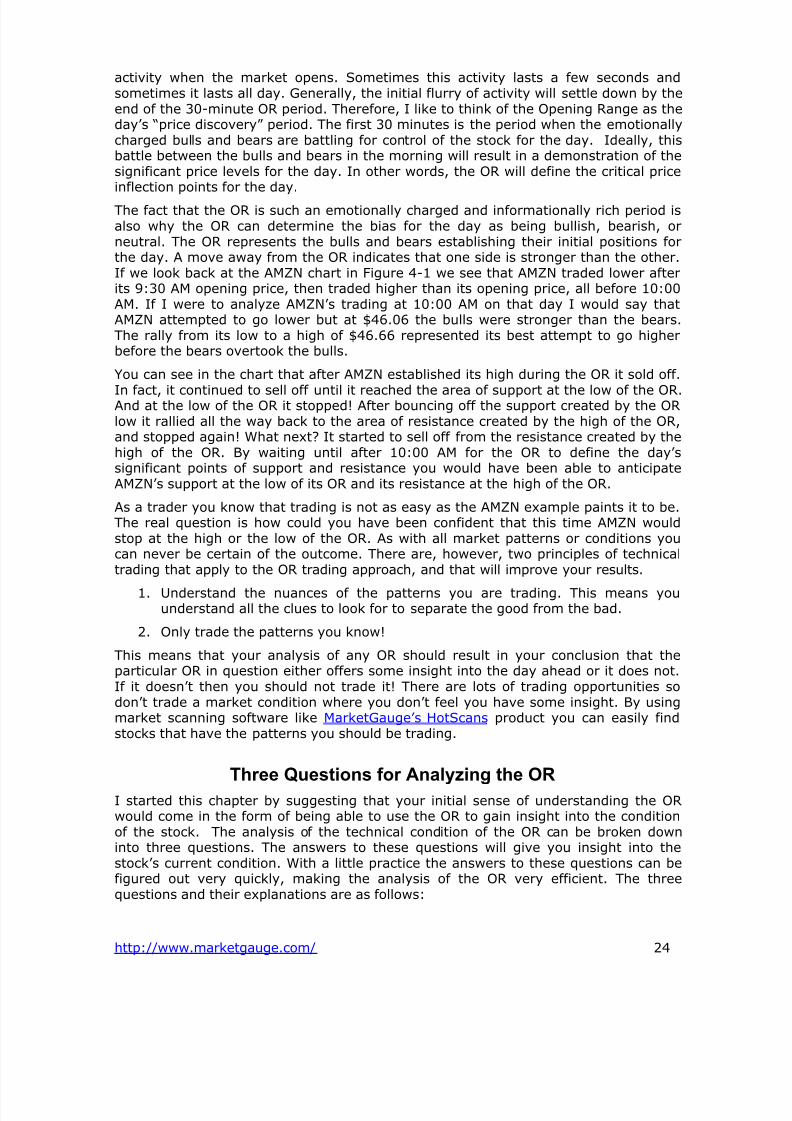
activity when the market opens. Sometimes this activity lasts a few seconds andsometimes it lasts all day. Generally, the initial flurry of activity will settle down by theend of the 30-minute OR period. Therefore, I like to think of the Opening Range as theday’s “price discovery” period. The first 30 minutes is the period when the emotionallycharged bulls and bears are battling for control of the stock for the day. Ideally, thisbattle between the bulls and bears in the morning will result in a demonstration of thesignificant price levels for the day. In other words, the OR will define the critical priceinflection points for the day.
The fact that the OR is such an emotionally charged and informationally rich period isalso why the OR can determine the bias for the day as being bullish, bearish, orneutral. The OR represents the bulls and bears establishing their initial positions forthe day. A move away from the OR indicates that one side is stronger than the other.If we look back at the AMZN chart in Figure 4-1 we see that AMZN traded lower afterits 9:30 AM opening price, then traded higher than its opening price, all before 10:00AM. If I were to analyze AMZN’s trading at 10:00 AM on that day I would say thatAMZN attempted to go lower but at $46.06 the bulls were stronger than the bears.The rally from its low to a high of $46.66 represented its best attempt to go higherbefore the bears overtook the bulls.
You can see in the chart that after AMZN established its high during the OR it sold off.
In fact, it continued to sell off until it reached the area of support at the low of the OR.And at the low of the OR it stopped! After bouncing off the support created by the ORlow it rallied all the way back to the area of resistance created by the high of the OR,and stopped again! What next? It started to sell off from the resistance created by thehigh of the OR. By waiting until after 10:00 AM for the OR to define the day’ssignificant points of support and resistance you would have been able to anticipateAMZN’s support at the low of its OR and its resistance at the high of the OR.
As a trader you know that trading is not as easy as the AMZN example paints it to be.The real question is how could you have been confident that this time AMZN wouldstop at the high or the low of the OR. As with all market patterns or conditions youcan never be certain of the outcome. There are, however, two principles of technicaltrading that apply to the OR trading approach, and that will improve your results.
1. Understand the nuances of the patterns you are trading. This means youunderstand all the clues to look for to separate the good from the bad.
2. Only trade the patterns you know!
This means that your analysis of any OR should result in your conclusion that theparticular OR in question either offers some insight into the day ahead or it does not.If it doesn’t then you should not trade it! There are lots of trading opportunities sodon’t trade a market condition where you don’t feel you have some insight. By usingmarket scanning software like MarketGauge’s HotScans product you can easily findstocks that have the patterns you should be trading.
Three Questions for Analyzing the OR
I started this chapter by suggesting that your initial sense of understanding the ORwould come in the form of being able to use the OR to gain insight into the conditionof the stock. The analysis of the technical condition of the OR can be broken downinto three questions. The answers to these questions will give you insight into thestock’s current condition. With a little practice the answers to these questions can befigured out very quickly, making the analysis of the OR very efficient. The threequestions and their explanations are as follows:
8/3/2019 The Opening Range Handbook Part 1 Basic Principles
http://slidepdf.com/reader/full/the-opening-range-handbook-part-1-basic-principles 27/32
http://www.marketgauge.com/ 25
1. Does the OR have a well-defined area of support or resistance at its low orhigh?
2. Is there a distinctly bullish or bearish bias to the OR?
3. Is the volume for the entire OR unusually high?
1. Does the OR have a well-defined area of support or resistance at its low orhigh?
If you only focus on one of these three questions this should be the one. In fact, theother two questions could be viewed as further validation as to whether or not the ORlow or high is a significant area of support or resistance.
Why does it matter?
Why is it important to establish whether or not the low (high) represents significantsupport (resistance)? When you are trading using the OR you will approach each dayassuming that the OR high and low are likely to be important price levels. But as withany trading strategy you must let the market action confirm your assumptions beforeyou act on them. If the market action in a stock demonstrates that the high of its ORis an area of significant resistance then you know that it will be an important price
level during the day. This important price level may turn out to be the high for the dayor the breakout point for the day’s bull run. If you knew that a particular price levelwas likely to be either the high for the day or a significant breakout point, wouldn’tyou want to focus on that stock and that price level? You don’t need to know anythingabout the OR to understand that.
As a trader you want to focus on a stock when it is likely to move. Watching a stock allday trying to anticipate when and if it is going to move is not only nerve-racking, it’sdangerous! It leads to careless trading and over-trading. By anticipating where theimportant price levels will be (the OR high and low) you can more quickly identifythem. More importantly, if you see price action which demonstrates that a particularprice area constitutes significant resistance, this is an important point to watch. If youadd the fact that this area is also the high of the emotionally charged OR then you
have two reasons to focus on that price level.
By identifying the important price levels as they develop you will be better prepared toact on them because you will spend your time focusing on how the market acts at thecritical points rather than analyzing whether or not the price level is important. If youhave a trading plan based on the OR you will be able to easily justify sitting on yourhands when that is exactly what you should do, and when the setup is right you willbe able to initiate a trade with confidence, after only several seconds of analysis.
When a high or low of the OR demonstrates by its price and volume action that it is asignificant area of support or resistance the OR should be analyzed further. If the ORis sloppy, that is, if there isn’t any well-defined support or resistance, don’t waste yourtime watching it. Find an OR setup that is telling you where the day’s inflection point
will be. Here’s how.Identifying Real Support and Resistance
In chapter 3 I discussed the concept of support and resistance on daily charts. Theconcept is the same when applied to the intraday charts of the OR. One of the majorpoints in Chapter 3 was that it is important to keep your analysis of support andresistance levels simple. If you can’t see obvious levels of support and resistance thendon’t try to invent them! The same is true for analyzing the OR. When you are lookingat the price action within the OR you are looking for real areas of support and
8/3/2019 The Opening Range Handbook Part 1 Basic Principles
http://slidepdf.com/reader/full/the-opening-range-handbook-part-1-basic-principles 28/32
http://www.marketgauge.com/ 26
resistance at the high and the low of the OR. Warning – these levels will not alwaysexist! Your objective is to assess the situation not make it up.
In evaluating the trading activity within the OR you will need to look at a chart with atime interval that is significantly smaller than the time interval of your OR. Forexample, if you are evaluating the 30-minute OR then a 30- or 15-minute chart willnot tell you much. I prefer to look at a 5-minute chart, but often I will go to a 1-minute chart to see what the trading action was like at the OR high or low.
Just as on the daily charts, supportand resistance can be characterizedby lots of trading at the price level, orbig volume traded at the level, or aviolent reversal from the price level.An example of lots of trading at aprice level would be if the stockconsolidated near its OR high for 10of the 30 opening minutes. Such priceaction would mean that the highshould be considered significantresistance. If the stock created a
pattern where it rallied to the samelevel several times over the course of the OR period only to sell off eachtime, then its high would beconsidered significant resistance.Figure 4-2 illustrates an example of significant resistance formed at theOR high. The concept is the samewhen looking for significant support atthe OR low.
This part of analyzing the OR is basedon reading bar charts. But the
objective is to identify basic supportand resistance patterns –consolidation or big volume with pricespikes rejecting a price level. The bestway to improve your ability to identifysupport and resistance quickly is to practice. Look at hundreds of charts!
It will become clearer in the next chapter that the insistence on well-defined pricelevels serves not only to shift the winning odds in your favor; it is also important fromthe money management side of the trade analysis. So be prepared to sit on yourhands and watch a sloppy OR pattern explode into a big mover. It will happen.Remember one of the rules of technical trading I spoke about earlier – only trade thepatterns you know. If the OR does not demonstrate the pattern you are looking for
then don’t trade it. Trading is a business that seeks to make money through theexecution of a trading plan. For the purposes of this book, the plan is to trade stocksthat demonstrate that their OR high and or low are significant levels before we initiatea position.
Figure 4-2: 1-Minute Chart of Tech Data
Corp. (TECD)
TECD’s 30-minute OR is highlighted. Notice howTECD spent the majority of the first 30 minutestrading near the high of the OR. This indicated
that the OR high would be a significant pricepoint. Notice how quickly TECD rallied when itbroke the OR high and how it served as supportafter the initial breakout!
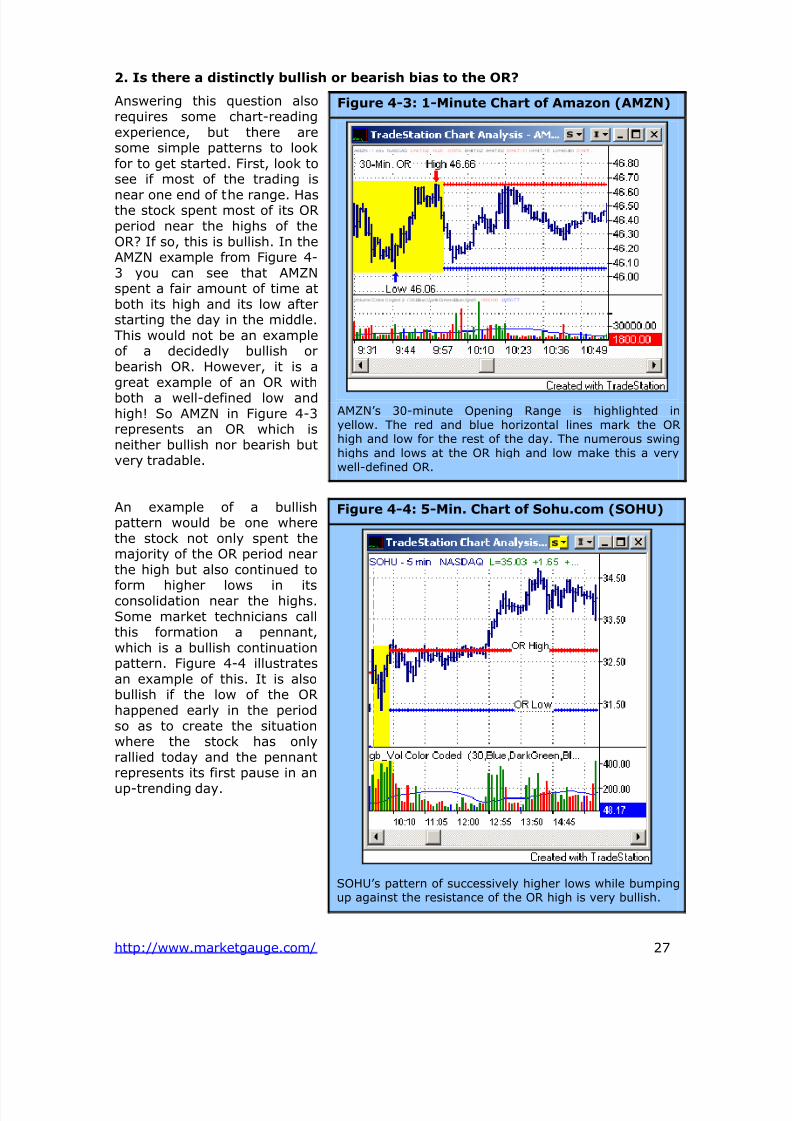
8/3/2019 The Opening Range Handbook Part 1 Basic Principles
http://slidepdf.com/reader/full/the-opening-range-handbook-part-1-basic-principles 29/32
http://www.marketgauge.com/ 27
2. Is there a distinctly bullish or bearish bias to the OR?
Answering this question alsorequires some chart-readingexperience, but there aresome simple patterns to lookfor to get started. First, look tosee if most of the trading is
near one end of the range. Hasthe stock spent most of its ORperiod near the highs of theOR? If so, this is bullish. In theAMZN example from Figure 4-3 you can see that AMZNspent a fair amount of time atboth its high and its low afterstarting the day in the middle.This would not be an exampleof a decidedly bullish orbearish OR. However, it is agreat example of an OR withboth a well-defined low andhigh! So AMZN in Figure 4-3represents an OR which isneither bullish nor bearish butvery tradable.
An example of a bullishpattern would be one wherethe stock not only spent themajority of the OR period nearthe high but also continued to
form higher lows in itsconsolidation near the highs.Some market technicians callthis formation a pennant,which is a bullish continuationpattern. Figure 4-4 illustratesan example of this. It is alsobullish if the low of the ORhappened early in the periodso as to create the situationwhere the stock has onlyrallied today and the pennantrepresents its first pause in an
up-trending day.
Figure 4-3: 1-Minute Chart of Amazon (AMZN)
AMZN’s 30-minute Opening Range is highlighted inyellow. The red and blue horizontal lines mark the ORhigh and low for the rest of the day. The numerous swinghighs and lows at the OR high and low make this a verywell-defined OR.
Figure 4-4: 5-Min. Chart of Sohu.com (SOHU)
SOHU’s pattern of successively higher lows while bumpingup against the resistance of the OR high is very bullish.
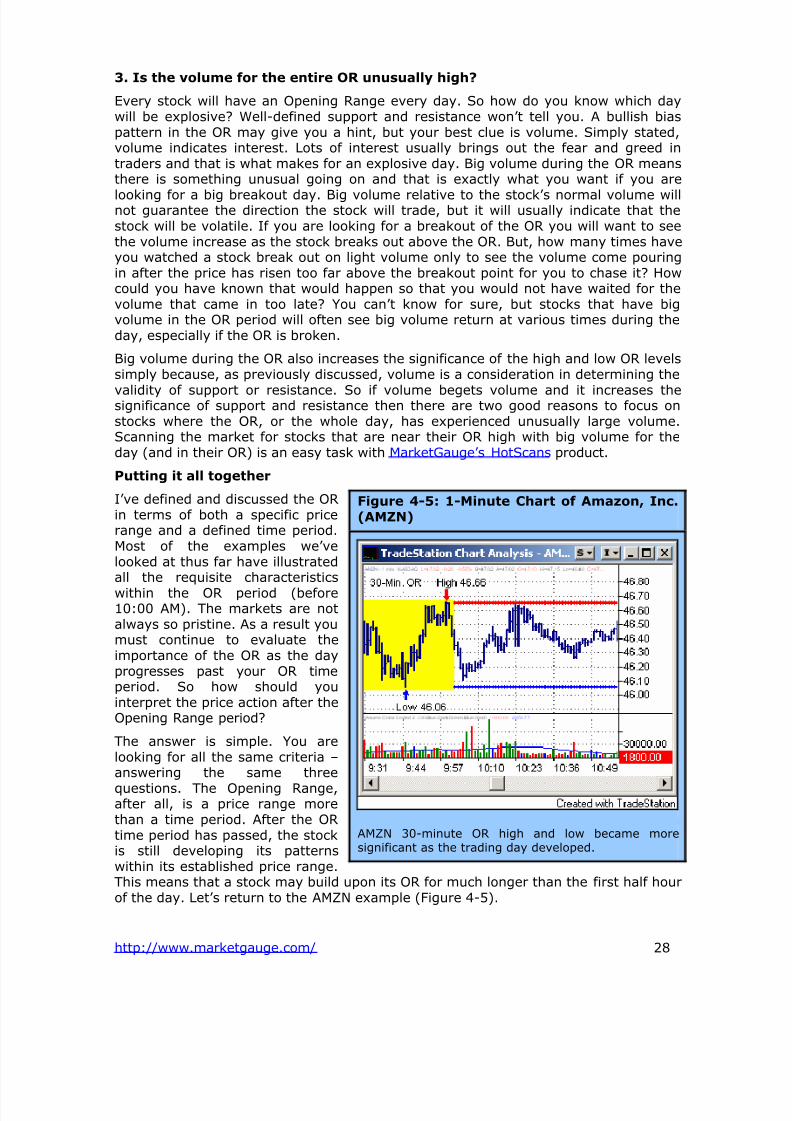
8/3/2019 The Opening Range Handbook Part 1 Basic Principles
http://slidepdf.com/reader/full/the-opening-range-handbook-part-1-basic-principles 30/32
http://www.marketgauge.com/ 28
3. Is the volume for the entire OR unusually high?
Every stock will have an Opening Range every day. So how do you know which daywill be explosive? Well-defined support and resistance won’t tell you. A bullish biaspattern in the OR may give you a hint, but your best clue is volume. Simply stated,volume indicates interest. Lots of interest usually brings out the fear and greed intraders and that is what makes for an explosive day. Big volume during the OR meansthere is something unusual going on and that is exactly what you want if you are
looking for a big breakout day. Big volume relative to the stock’s normal volume willnot guarantee the direction the stock will trade, but it will usually indicate that thestock will be volatile. If you are looking for a breakout of the OR you will want to seethe volume increase as the stock breaks out above the OR. But, how many times haveyou watched a stock break out on light volume only to see the volume come pouringin after the price has risen too far above the breakout point for you to chase it? Howcould you have known that would happen so that you would not have waited for thevolume that came in too late? You can’t know for sure, but stocks that have bigvolume in the OR period will often see big volume return at various times during theday, especially if the OR is broken.
Big volume during the OR also increases the significance of the high and low OR levelssimply because, as previously discussed, volume is a consideration in determining the
validity of support or resistance. So if volume begets volume and it increases thesignificance of support and resistance then there are two good reasons to focus onstocks where the OR, or the whole day, has experienced unusually large volume.Scanning the market for stocks that are near their OR high with big volume for theday (and in their OR) is an easy task with MarketGauge’s HotScans product.
Putting it all together
I’ve defined and discussed the ORin terms of both a specific pricerange and a defined time period.Most of the examples we’velooked at thus far have illustratedall the requisite characteristics
within the OR period (before10:00 AM). The markets are notalways so pristine. As a result youmust continue to evaluate theimportance of the OR as the dayprogresses past your OR timeperiod. So how should youinterpret the price action after theOpening Range period?
The answer is simple. You arelooking for all the same criteria –answering the same three
questions. The Opening Range,after all, is a price range morethan a time period. After the ORtime period has passed, the stockis still developing its patternswithin its established price range.This means that a stock may build upon its OR for much longer than the first half hourof the day. Let’s return to the AMZN example (Figure 4-5).
Figure 4-5: 1-Minute Chart of Amazon, Inc.
(AMZN)
AMZN 30-minute OR high and low became moresignificant as the trading day developed.
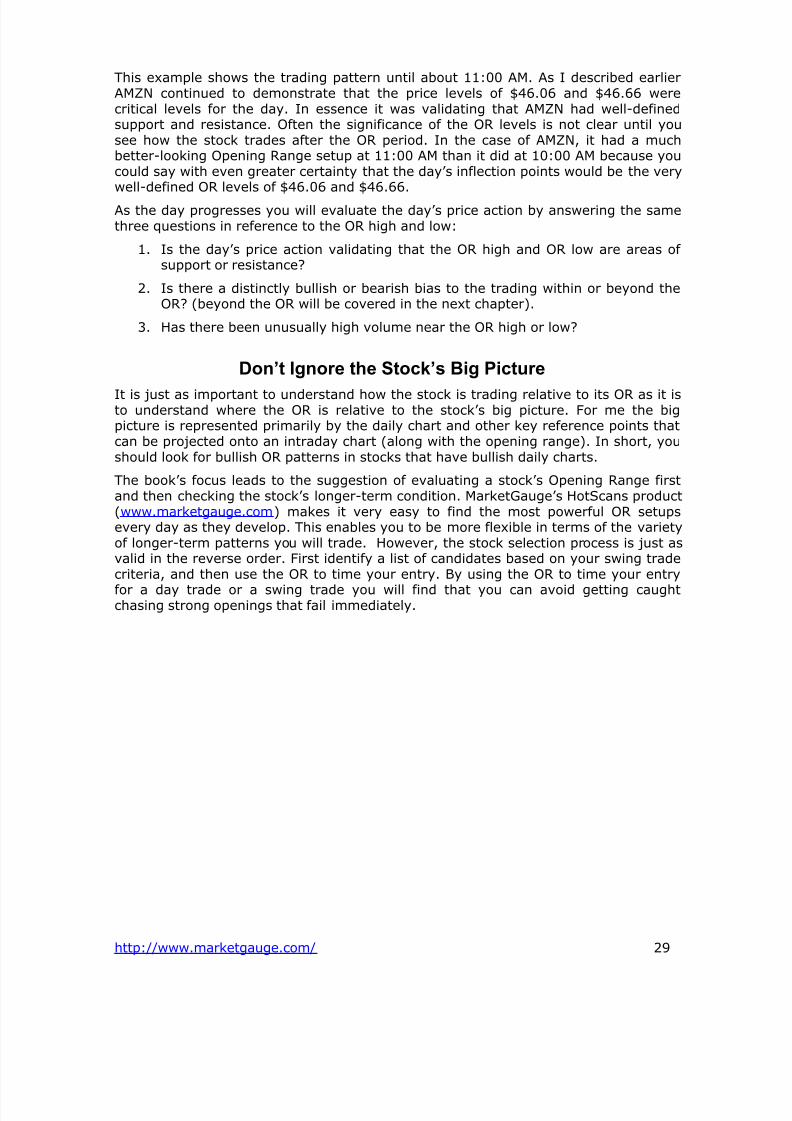
8/3/2019 The Opening Range Handbook Part 1 Basic Principles
http://slidepdf.com/reader/full/the-opening-range-handbook-part-1-basic-principles 31/32
http://www.marketgauge.com/ 29
This example shows the trading pattern until about 11:00 AM. As I described earlierAMZN continued to demonstrate that the price levels of $46.06 and $46.66 werecritical levels for the day. In essence it was validating that AMZN had well-definedsupport and resistance. Often the significance of the OR levels is not clear until yousee how the stock trades after the OR period. In the case of AMZN, it had a muchbetter-looking Opening Range setup at 11:00 AM than it did at 10:00 AM because youcould say with even greater certainty that the day’s inflection points would be the verywell-defined OR levels of $46.06 and $46.66.
As the day progresses you will evaluate the day’s price action by answering the samethree questions in reference to the OR high and low:
1. Is the day’s price action validating that the OR high and OR low are areas of support or resistance?
2. Is there a distinctly bullish or bearish bias to the trading within or beyond theOR? (beyond the OR will be covered in the next chapter).
3. Has there been unusually high volume near the OR high or low?
Don’t Ignore the Stock’s Big Picture
It is just as important to understand how the stock is trading relative to its OR as it isto understand where the OR is relative to the stock’s big picture. For me the bigpicture is represented primarily by the daily chart and other key reference points thatcan be projected onto an intraday chart (along with the opening range). In short, youshould look for bullish OR patterns in stocks that have bullish daily charts.
The book’s focus leads to the suggestion of evaluating a stock’s Opening Range firstand then checking the stock’s longer-term condition. MarketGauge’s HotScans product(www.marketgauge.com) makes it very easy to find the most powerful OR setupsevery day as they develop. This enables you to be more flexible in terms of the varietyof longer-term patterns you will trade. However, the stock selection process is just asvalid in the reverse order. First identify a list of candidates based on your swing tradecriteria, and then use the OR to time your entry. By using the OR to time your entry
for a day trade or a swing trade you will find that you can avoid getting caughtchasing strong openings that fail immediately.
8/3/2019 The Opening Range Handbook Part 1 Basic Principles
http://slidepdf.com/reader/full/the-opening-range-handbook-part-1-basic-principles 32/32
Next Steps
Understanding the insight that can be gained by using the OR, and knowing how toanalyze the quality of the OR are the first steps in becoming a better day trader andswing trader.
Your next step as an OR trader is to understand how and when the OR helps definethe entry and exit triggers in all types of market conditions.
MarketGauge offers numerous ways for you to raise your OR trading to the next levelranging from free tutorials during product launches, to HotScans for finding for specificset-ups in real-time, to The Opening Range Success Formula training program for acomplete OR education.