Embed Size (px)
Citation preview

FACTORS HINDERING SCHOOL EFFECTIVENESS IN TANZANIA: A
CASE OF NACHINGWEA PRIMARY SCHOOLS
ALFRED CHRISTOPHER NDALI
A DISSERTATION SUBMITTED IN PARTIAL FULFILLMENT OF THE
REQUIREMENTS FOR THE DEGREE OF MASTERS OF EDUCATION,
ADMINISTRATION, PLANNING AND POLICY STUDIES OF THE OPEN
UNIVERSITY OF TANZANIA

ii
2015CERTIFICATION
The undersigned certifies that he has read and hereby recommends for acceptance by
The Open University of Tanzania dissertation titled: “Factors Hinder School
Effectiveness in Tanzania: A Case of Nachingwea District Primary Schools” in
partial fulfillment for the award of master of education, administration, planning and
policy studies (MED APPS).
………………………………………
Dr. Zacharia Reginard Rwejuna
(Supervisor)
………………………………………
Date

iii
COPYRIGHT
No part of this dissertation may be reproduced stored in any retrieval system, or
transmitted in any form by any means, electronic, mechanical, photocopying,
recording or otherwise without prior written permission of the author or The Open
University of Tanzania on that behalf.

iv
DECLARATION
I, Alfred Christopher Ndali, do hereby declare that this dissertation is my own
original work and has not been submitted to any other University and will not be
submitted to any other Higher Learning Institution for an award of a Degree.
………………………………………
Signature
………………………………………
Date
v
DEDICATION
I dedicate this work to the Almighty God, the source of all wisdom and knowledge, i
dedicate also to my mother, Maria Alfred Ndali, my lovely brother Mr. James Alfred
Ndali, my young sister Catherine alfred Ndali and Benadetha Alfred Ndali who live
in Tabora, my young brother John and James Alfred Ndali without forgetting my
supervisor Dr. Zacharia Reginard Rwejuna, who assisted me fully in completing my
studies.

vi
ACKNOWLEDGEMENTS
I would like to take this opportunity to extend my sincere gratitude to my almighty
God and Lord Jesus Christ for his guidance and protection throughout my studies for
Master Degree.
My sincere gratitude, are also extended to my supervisor Dr. Zacharia Reginard
Rwejuna for his constructive advice throughout the dissertation process and all staff
from Lindi Regional Centre who encouraged me throughout my Master studies, their
contributions to my knowledge are immeasurable and very valuable to my career
development.
Lastly, but not least is my immeasurable thanks to my family of
Mrs. and late Mr. Alfred James Ndali, who have been supporting and encouraging
me throughout my studies.

vii
ABSTRACT
The study focused on factors that hinder school effectiveness of the primary
school pupils in Nachingwea District in Tanzania. The study was guided by three
objectives which were to: determine the school based factors that affect education
effectiveness in primary schools in Nachingwea District, establish parents’ based
factors that hinder education effectiveness in primary schools in Nachingwea and
establish student personal factors that affect education effectiveness in primary
schools in Nachingwea district. The study was guided by a mixed method design,
where the collected data through questionnaires and interviews were intergraded
to produce stronger inferences to inform the audience on the factors that hinder
school effectiveness in Nachingwea primary schools. The sample was therefore
large comprising of various categories, the teachers and school heads totaling to
130 respondents. The study realized the following as factors contributing to
education ineffectiveness in primary schools in Nachingwea District; delay to
commence studies after school holidays, inadequate learning resources, lack of
motivation for teachers, Unyago cultural practice, absenteeism by both teachers
and pupils, pupils’ lateness, lack of support from parents, low teachers’
commitment level, low and randomly checking of both lesson plans and scheme
of works by head teachers. The study made some recommendations to reduce the
obstacles that hinder the school effectiveness in Nachingwea District.
viii
TABLE OF CONTENTS
CERTIFICATION........................................................................................................ii
COPYRIGHT.............................................................................................................iii
DECLARATION.......................................................................................................iv
DEDICATION.............................................................................................................v
ACKNOWLEDGEMENTS......................................................................................vi
ABSTRACT...............................................................................................................vii
LIST OF TABLES....................................................................................................xii
FIGURE....................................................................................................................xiv
LIST OF ACRONYMS/ABREVIATION...............................................................xv
CHAPTER ONE.........................................................................................................1
1.0 BACKGROUND AND PROBLEM SETTING............................................1
1.1 Introduction.......................................................................................................1
1.2 Statement of the Problem..................................................................................3
1.3 Research Questions...........................................................................................5
1.4 Objective of the Study.......................................................................................5
1.5 Analytical Framework.......................................................................................5
1.6 Conceptual Framework.....................................................................................6
1.7 Scope of the Study............................................................................................7
1.8 Significance of the Study..................................................................................8
1.9 Limitation of the Study.....................................................................................8
CHAPTER TWO........................................................................................................9
2.0 LITERATURE REVIEW...............................................................................9
2.1 Introduction.......................................................................................................9

ix
2.2 Perceptions on School Effectiveness................................................................9
2.3 Factors Determining School Effectiveness.....................................................11
2.3.1 Teaching and Learning Resources..................................................................11
2.3.2 School Climate................................................................................................12
2.3.3 Poor Administration.......................................................................................13
2.3.4 Teaching and Learning Situation....................................................................15
2.3.5 Parents’ Consultation with Teachers...............................................................16
2.4 Research Gap..................................................................................................16
CHAPTER THREE..................................................................................................17
3.0 RESEARCH METHODOLOGY................................................................17
3.1 Introduction.....................................................................................................17
3.2 Study Area and Population and Sampling Sites.............................................17
3.3 Sample Size and Sampling Technique............................................................18
3.4 Research Paradigms........................................................................................19
3.5 Data Collection Methods................................................................................20
3.5.1 Questionnaire..................................................................................................20
3.5.2 Interviews........................................................................................................21
3.6 Ethical Consideration......................................................................................21
3.7 Truthworthiness..............................................................................................22
CHAPTER FOUR.....................................................................................................23
4.0 DATA PRESENTATION AND ANALYSIS..............................................23
4.1 Introduction.....................................................................................................23
4.2 Factors Hindering Effective Primary Education in Nachingwea District
(Quantitative)..................................................................................................25

x
CHAPTER FIVE......................................................................................................44
5.0 ANALYSIS AND DISCUSSION OF THE FINDINGS.............................44
5.1 Introduction.....................................................................................................44
5.2 Factors Hindering Education Effectiveness in Nachingwea District..............44
5.2.1 Commencement of Learning After Schools’ Holiday....................................44
5.2.2 Adequacy of Learning and Teaching Materials..............................................45
5.2.3 Frequency of Staff Meeting............................................................................46
5.2.4 Checking of Scheme of Work by Head Teachers...........................................47
5.2.5 Frequency of Checking Lesson Plan...............................................................48
5.2.6 Observation of Classes by Head Teachers......................................................49
5.2.7 Teachers’ Commitment Level.........................................................................49
5.2.8 Teachers’ Aabsenteeism.................................................................................50
5.2.9 Teachers’ Motivation......................................................................................51
5.2.10 Teachers’ Work Load......................................................................................51
5.2.11 Pupils Frequency of Absenteeism...................................................................52
5.2.12 Pupils’ Lateness and Education Effectiveness................................................53
5.2.13 Parents’ Consultation with Teachers...............................................................53
5.2.14 Parents’ Response in the Provision of Learning Materials.............................54
CHAPTER SIX.........................................................................................................56
6.0 SUMMARY, CONCLUSION AND RECCOMENDATIONS..................56
6.1 Summary of the Study.....................................................................................56
6.2 Summary of the Findings................................................................................56
6.3 Implications of the Findings...........................................................................57
6.4 Conclusion......................................................................................................58
xi
6.5 Recommendations...........................................................................................58
6.6 Recommendations to the Government............................................................58
6.7 Recommendation to the District Nachingwea Council...................................60
REFERENCES..........................................................................................................62
APPENDICES............................................................................................................69

xii
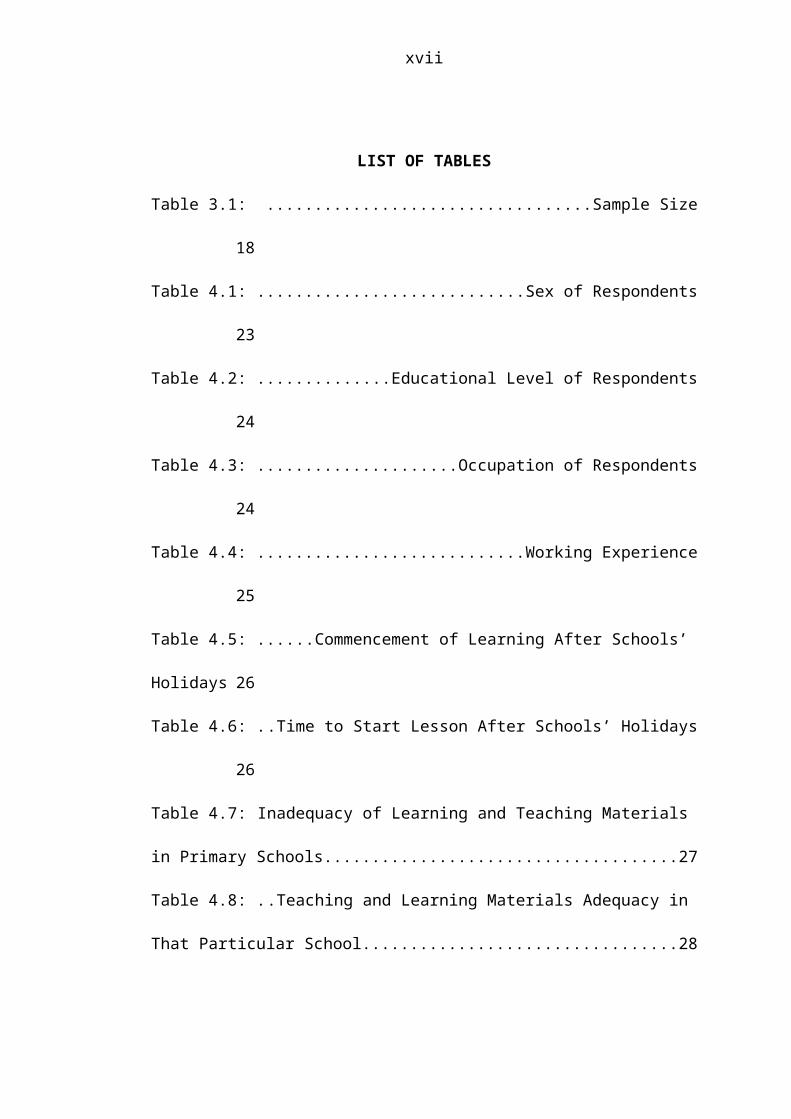
LIST OF TABLES
Table 3.1: Sample Size...........................................................................................18
Table 4.1: Sex of Respondents...............................................................................23
Table 4.2: Educational Level of Respondents........................................................24
Table 4.3: Occupation of Respondents...................................................................24
Table 4.4: Working Experience..............................................................................25
Table 4.5: Commencement of Learning After Schools’ Holidays.........................26
Table 4.6: Time to Start Lesson After Schools’ Holidays......................................26
Table 4.7: Inadequacy of Learning and Teaching Materials in Primary Schools...27
Table 4.8: Teaching and Learning Materials Adequacy in That Particular School28
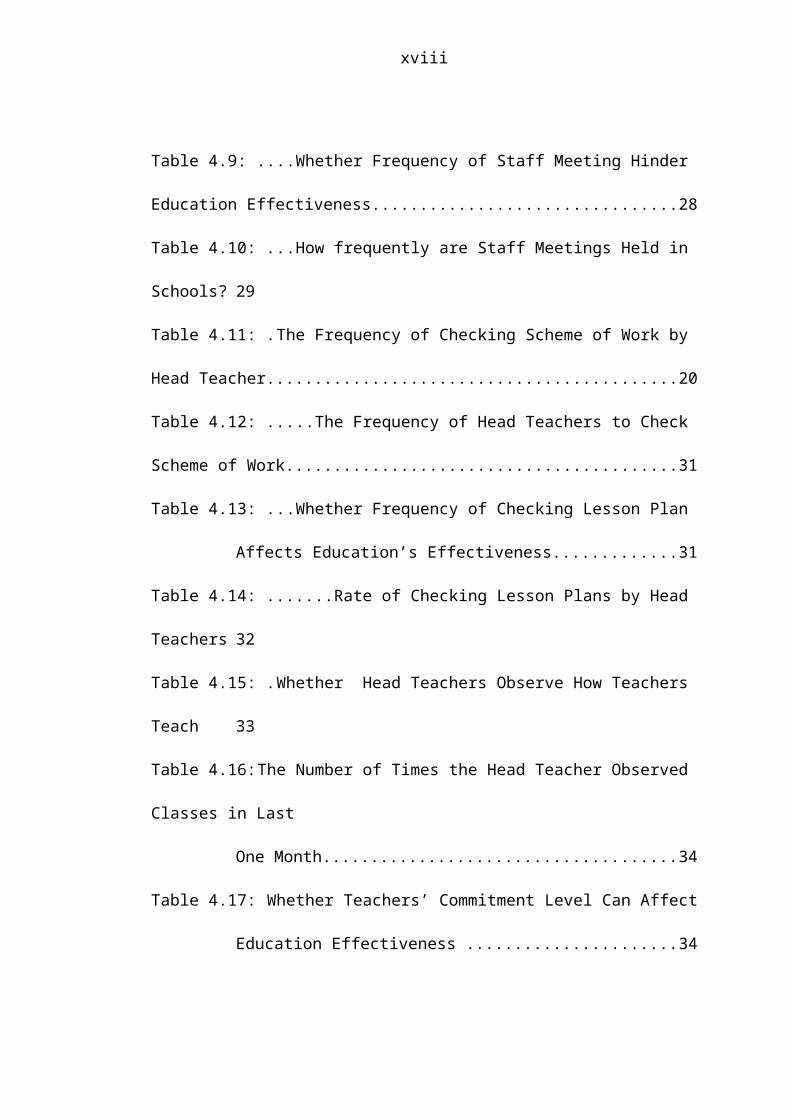
Table 4.9: Whether Frequency of Staff Meeting Hinder Education Effectiveness 28
Table 4.10: How frequently are Staff Meetings Held in Schools?...........................29
Table 4.11: The Frequency of Checking Scheme of Work by Head Teacher..........20
Table 4.12: The Frequency of Head Teachers to Check Scheme of Work...............31
Table 4.13: Whether Frequency of Checking Lesson Plan Affects Education’s
Effectiveness..........................................................................................31
Table 4.14: Rate of Checking Lesson Plans by Head Teachers...............................32
Table 4.15: Whether Head Teachers Observe How Teachers Teach......................33
Table 4.16: The Number of Times the Head Teacher Observed Classes in Last
One Month.............................................................................................34
Table 4.17: Whether Teachers’ Commitment Level Can Affect Education
Effectiveness .........................................................................................34
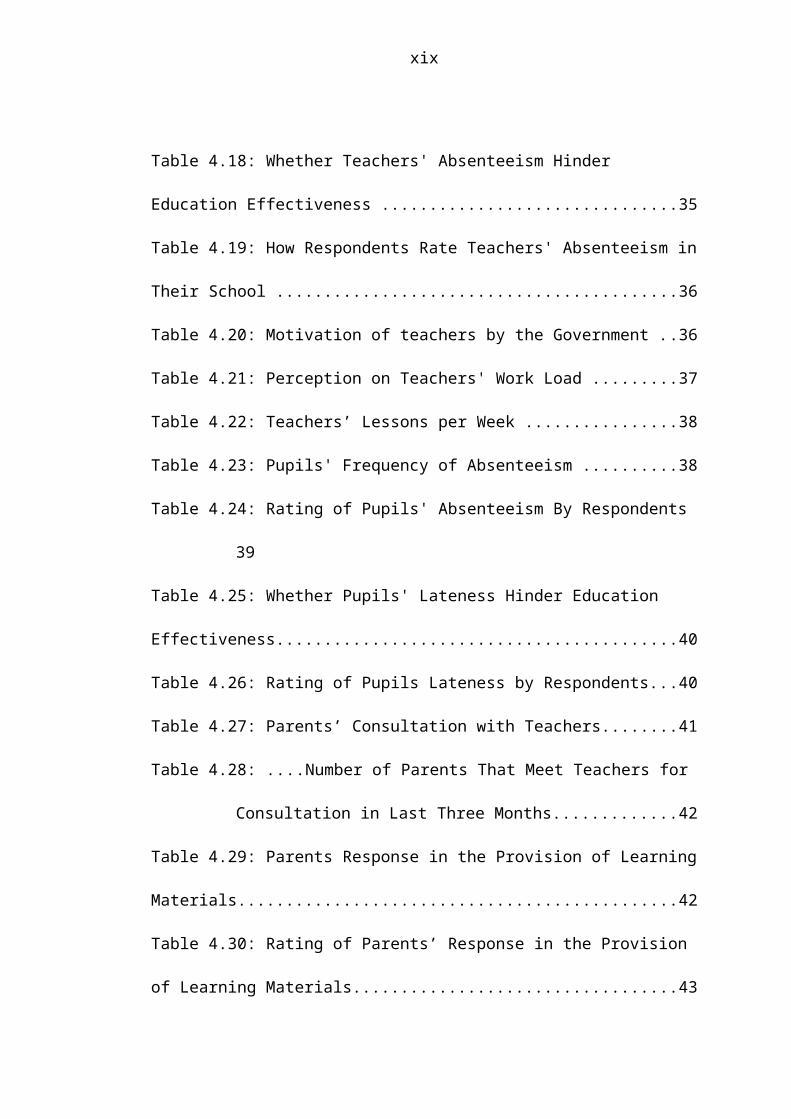
Table 4.18: Whether Teachers' Absenteeism Hinder Education Effectiveness .........35
Table 4.19: How Respondents Rate Teachers' Absenteeism in Their School ...........36
xiii
Table 4.20: Motivation of teachers by the Government ............................................36
Table 4.21: Perception on Teachers' Work Load .......................................................37
Table 4.22: Teachers’ Lessons per Week ..................................................................38
Table 4.23: Pupils' Frequency of Absenteeism ..........................................................38
Table 4.24: Rating of Pupils' Absenteeism By Respondents .....................................39
Table 4.25: Whether Pupils' Lateness Hinder Education Effectiveness.....................40
Table 4.26: Rating of Pupils Lateness by Respondents..............................................40
Table 4.27: Parents’ Consultation with Teachers.......................................................41
Table 4.28: Number of Parents That Meet Teachers for Consultation in Last Three
Months...................................................................................................42
Table 4.29: Parents Response in the Provision of Learning Materials.......................42
Table 4.30: Rating of Parents’ Response in the Provision of Learning Materials......43
Table 4.31: The Impact of ‘Unyago’ On Education Effectiveness.............................43

xiv
FIGURE
Figure 1.1: Conceptual Framework for Analyzing Education Effectiveness
Adopted from Mbugua et al (2012)...........................................................7

xv
LIST OF ACRONYMS/ABREVIATION
NETP National Education and Training Policy
OUT Open University of Tanzania
CHAPTER ONE
1.0 BACKGROUND AND PROBLEM SETTING
1.1 Introduction
Education is a development process that often includes a particular understanding of
the nature of knowledge. This understanding is given expression in a particular social
or ideological context with its particular policy and implementation agendas. It is an
expression of how human learning and development occurs and how they can be
encouraged. Education is seen as a developmental process of change for the better in
the interest of the society that designs it and the individual that receives it Krashen
(1985).
Education can be informal or formal. Different societies may have different views
about what formal education is, which in turn determines how curriculum is seen or
viewed by different societies. For example, those who see curriculum mainly in
terms of content see education primarily as a process of transmitting that content.
Those who see it as mainly concerned with a product see education primarily as
instrumental towards the achievement of that product. And those who see curriculum
primarily in terms of a process see education primarily as developmental. In this
study education is viewed as carrying elements from all these three perspectives
Krashen (1985).
In this sense education builds on, or strengthens what learners already know and
“prepares young people to become better members of their society” (Nyerere, 1968).
2
It is meant to make learners knowledgeable about issues, enable them to understand
the world and be more efficient members of their society, caring for humanity and
life in general. Education is not merely a preparation for maturity, but a life-long
process. It is a continuous growth of the mind and a continuous illumination of life.
Schools thus equip learners with instruments of mental growth that they are expected
to use throughout their lives.
The National Education and Training Policy (NETP, 1995), stipulates that there is a
need for functional education for the promotion of a progressive and united
Tanzania. To this end, school programmes need to be relevant, practical and
comprehensive; while interest and ability should determine individual direction in
education. If the school system is able to determine individual’s direction in
education, then we can say that the school is effective.
Scheerens (1992) categorized school effectiveness into four; one is having high
achievement among all student groups; secondly, having high student and staff
attendance; thirdly, having high staff and students’ satisfaction, and fourthly, having
high public confidence in schools. In order to have high achievement among all
student groups and high public confidence in schools, there must be an acceptable
method of measuring the achievement of students which in turn would promote
public confidence in the school.
The search for a measure of students’ achievement has led to the adoption of
examination among other measures. Examination, therefore, is the series of questions
3
asked in order to determine whether or not the students have mastered what they are
supposed to know or acquire. Although, students’ performance in examinations may
not be the true reflection of their ability, however, it is the closest indicator of the
extent of the students’ achievement in a given skill, Scheerens (1992).
Examinations are intended to monitor, evaluate and reinforce the realization of set
aims and objectives of education and curricula. They are also used to monitor the
proper implementation of the curricula and to measure students’ progress and
achievement for certification and selection for further education, training and
employment (NETP,1995),
From the above introduction we can learn that for the school to be effective there
must be high students’ achievements, high students and teacher attendance, students
exposed to long hours doing academic activities, high spirit of working and teachers’
commitments, public have confidence in the school outputs and general students’
innovativeness and creativity. However, as noted in Nachingwea schools students
complete primary school having difficulties with reading and writing implying that
the schools are not effective. So one would ask what are the factors that hinder
school effectiveness in primary schools in Nachingwea District?
1.2 Statement of the Problem
In recent years, the Government of Tanzania has increased its allocations to primary
education. Donor funding for education is also on the increase, though difficult to
quantify since a significant portion of it still takes place outside the main budget
4
Brock-Utne (1988). Among policy circles many share the view that basic education
is finally getting the priority attention it deserves. However, the state of primary
education in Tanzania continues to be in a state of crisis. National data, qualitative
studies and community surveys generally continue to show that progress has been
slow and there are high levels of dissatisfaction.
Nachingwea district is not an exceptional as far as increased spending for primary
education is concerned. The increased government spending for primary education in
Nachingwea is reflected by significant increased number of social and physical
infrastructures. For example, in a duration of five years that is from 2010 to 2015,
classrooms increased from 510 to 603, desks from 650 to 8,710, students-teachers
ratio from 1:40 to 1:32, teachers, houses from 300 to 639 but despite such increase in
infrastructures students performance has remained poor, for example in 2010, 2011,
2012, and 2013 pass rate in standard seven exams were 27.2%, 59.6%, 28.6%, and
58.4% respectively.
Such a mismatch between increased resources spending and the state of education
signals something wrong! It is not known whether this poor academic achievement in
primary schools in Nachingwea primary schools as indicator of school effectiveness
is caused by which factors among these; student based factors, the school based
factors or the parent based factors.
Hence, the study is set to investigate the factors that hinder the school effectiveness
in Nachingwea primary schools as a way to attain the education for all (EFA) and
also realize the millennium development goals (MDGs).

5
1.3 Research Questions
What are the school-based factors that affect education effectiveness in primary
schools Nachingwea District?
What are parents-based factors that affect education effectiveness in primary
schools in Nachingwea District?
What are students-based factors that affect education effectiveness in primary
schools in Nachingwea district?
1.4 Objective of the Study
The general objective of this study was to find out the factors that hinder education
effectiveness in Nachingwea District. The specific objectives of the study were to;
Determine the school based factors that affect education effectiveness in primary
schools in Nachingwea District.
Establish parents’ based factors that hinder education effectiveness in primary
schools in Nachingwea.
Establish student personal factors that affect education effectiveness in Primary
school in Nachingwea.
1.5 Analytical Framework
There are a number of different analytical frameworks through which to view the
effects of different determinants of education effectiveness. Descriptive survey
design done by Reche, Bundi, Riungu and Mbugua (2012), has made the distinction
between variables considered to be school-based factors, teacher-based factors,
pupils-based factors and community based factors.

6
Variables that were termed as school-based factors include; commencement of
learning, adequacy of learning resources, frequency of staff meetings in a term,
frequency of checking teachers’ schemes of work, frequency of checking teachers'
lessons plans, adequacy of teachers’ prior preparation and observation of classes by
head teachers. For variables that were considered as teacher-based factors comprised
of teacher commitment level, frequency of absenteeism among teachers, teachers’
motivation, teacher turn-over rate and teachers’ workload.
Mbugua et al., (2012) singled three factors that were considered as pupils-based
factors namely; pupils’ frequency of absenteeism, pupils’ lateness and pupils’
language use. Factors that were classified as community based factors included;
parents’ consultation with teachers, parental response to provision of learning
materials, parents’ willingness to participate in school development and assistance
pupils get at home.
For this study, I borrowed heavily from the distinctions made by Mbugua et al.,
(2012) on school-based factors, teacher-based factors, pupils-based factors and
community based factors. Even though the data do not contain all information that
explain education effectiveness but I still feel confident that a lot can be learned
about the determinants of education effectiveness in Nachingwea context.
1.6 Conceptual Framework
The conceptual framework for this study is based on the belief that education
effectiveness in primary schools in Nachingwea district is explained by school-based
7
factors, teacher-based factors, pupils-based factors and community based factors.
Students’ performance are considered as dependent variables while school-based
factors, teacher-based factors, pupils-based factors and community based factors are
considered as independent variables. The magnitude of effect posed by independent
variables on dependent variable depends on government policy (s)
Independent Variable Intervening Variable Dependent Variable
Figure 1.1: Conceptual Framework for Analyzing Education Effectiveness
Adopted from Mbugua et al (2012)
1.7 Scope of the Study
The study principally focused on school-based factors and teachers-based factors. To
a lesser extent the study also observed pupils-based factors and community based
factors that explain education effectiveness in primary schools in Nachingwea
District like pupils’ frequency of absenteeism, pupils’ lateness, parents’ consultation
School effectiveness High public
satisfaction Academic
achievement Students’
Performance Student innovations
and creativity High parental
participation
Government Policy
School-based factors
Teacher-based factors
Pupils-based factors
Community-based factors
8
with teachers, parental response to provision of learning materials and parents’
willingness to participate in school development.
The school-based factors considered in this study included; commencement of
learning, adequacy of learning resources, frequency of staff meetings in a term,
frequency of checking teachers’ schemes of work, frequency of checking teachers'
lessons plans and observation of classes by head teachers. Whereas, teachers’ based
factors included; teacher commitment level, frequency of absenteeism among
teachers, teachers’ motivation and teachers’ workload.
1.8 Significance of the Study
The study is useful in the following areas;-
It identifies factors that are likely to hinder education effectiveness in primary
schools in Nachingwea District.
It shows how policies should be formulated to improve education effectiveness in
primary schools.
It supplement to the existing body of knowledge as source of references for
studying factors that hinder education effectiveness in primary schools.
1.9 Limitation of the Study
Small sample size caused by financial barriers but also poor response from 21
respondents who failed to respond to questionnaires.
Interpretations of the findings appear to be problematic in some cases because
sometimes it is observed that logical or theoretical hypotheses are rejected by the
majority of respondents.

9
CHAPTER TWO
2.0 LITERATURE REVIEW
2.1 Introduction
The chapter presents both theoretical and empirical literature review. Theoretical
literature review provides an overview of perceptions of education effectiveness
worldwide. On the other hand, empirical literature review presents some of the main
propositions and their arguments in order to give a brief synopsis about the
determinants of education effectiveness. Historically, there have been remarkable
debates over the determinants of education effectiveness. To some, social and
economic factors, rather than specific education interventions, were the primary
driving forces behind the historical improvement in education effectiveness in some
countries. Others regard health factors as chief elements in determining education
effectiveness. Yet, some of the current perspectives have incorporated
multidisciplinary approaches and applied a number of factors like parents’ based
factors, students’ based factors, school based factors and teachers’ based factors to
explain the causes of education effectiveness.
2.2 Perceptions on School Effectiveness
Scheerens (2000) pointed out four factors to be associated with school effectiveness
namely; school leadership, acquisition of basic skills to teachers, a secure
environment to learners to learn and high student’s expectations. Cheng (1996)

10
commented that effective schools are those which include things like enough number
of text books, well organized classroom, professional training of teachers, teaching
strategies and learning arrangements. Effective school are regarded as school which
facilitating high academic achievement to learners by using the following issues;
proper utilization of school resources, making good environment for learning and
teaching, and working to realize the school mission and vision are achieved.
Lezotte (2010) as cited by Nyagosha (2011) noted the following as the most
important characteristics of effective school; strong instructional leadership, clear
and focused mission, safe and orderly schools, climate of high expectations for
success, frequent monitoring of students’ progress, positive home-school relations,
and opportunity to learn.
The concept of schools effectiveness as it has been exemplified by several factors
above has no single definition. In Tanzania context, for example, parents would
judge an effective school as that school which facilitates students to pass their
examination in the primary level, the standard seven examinations. This criterion
applies mostly to the public primary schools.
Parents would evaluate a good school also if they find that students’ output from that
school is good in terms of royalty, respect and hard working. In a strict sense,
primary school effectiveness in Tanzania is evaluated to be doing well based on the
number of students who pass to join secondary school. A criterion which seems to
be less technical than what the meaning of a good school should be because they are
11
likely to cause education stakeholders to ignore other construct of school
effectiveness in our schools.
2.3 Factors Determining School Effectiveness
2.3.1 Teaching and Learning Resources
The adequacy and use of teaching and learning materials affects the effectiveness of
a teacher’s lesson. Teaching and learning resources enhances understanding of
abstract ideas and improves performance. Lack of enough teaching and learning
materials makes learning of subjects very abstract to the pupils and could in turn lead
to education ineffectiveness. Schneider (2003) found out that school facilities have a
direct effect on teaching and learning. Text books enable the pupils to follow the
teacher’s sequence of presentation and aids in understanding of lessons (Ubogu,
2004).
Schreens and Booker (1997) as cited by Palarady (2008), Down.com (2010) argued
that most of primary school in Pakistan becomes ineffectiveness because of the
following factor; shortages of basic resources such as buildings, furniture, drinking
water, latrines, instructional materials, and well qualified teachers. Loockheed and
Levin (2012) commented that schools in developing countries become ineffective
because they face with the problem of lack of basic resources such as; qualified
teachers, facilities and text books. According to Saleem, Nazeem, Ibrahim, Hussain,
and Azeem (2012) argue that Pakistan were challenged by material constraints which
hinders primary school effectiveness, the material constraints said were: well-
constructed and well finished school buildings, classroom resources and well-
designed curriculum. Apart from material resources there are also non- material

12
resources which were said to hinder school effectiveness are: lack of vision and
goals, poor learning environment and lack of professional leadership.
Kingdon (2008) argued that in India most obvious hindering public schools
effectiveness were very visible and they included lack of resources, lack of
infrastructure, lack of facilities, lack of books, and teaching materials.
Chonjo (1994) and Zuze (2008) commented that resource such as books and desks
were delayed to be supplied in most primary schools in the country due to financial
problem which cannot support to buy and supply resources needed by most of
schools where schools are located.
2.3.2 School Climate
Dronkers and Robbert (2003) conducted a study and come up with the findings that
cause the school ineffectiveness, the identified factors were; negative demographic
characters of students and parents towards the school, school composition is not
proper or not well organized, teaching and learning condition is poor, and the
behavioral and altitudinal characteristics of students and parents over the school is
poor.
Stoll and Myer (1998) argued that school ineffectiveness may be influenced by
various issues which were happening in the classroom situation such as; school time
table were not consistence to the academic time usage, Teachers – Pupil’s interaction
about work are not high, high noise levels, lots of non-work related movements and
lots of negative feedback from teachers.

13
In Tanzania school climate is a big problem where by classrooms are having bad
flows, wall having a lot of cracks, there is no notice board where to fix timetable and
various announcements concerning students. Schools are located where other
economic activities such as, car garages, and bars which produce noises which
disturb students in the classroom and makes some students to concentrates with what
is going on outside.
2.3.3 Poor Administration
The quality of both school and government administration plays a vital role in
academic performance as it is concerned with pupils, teachers, rules, regulations and
policies that govern the school system. Therefore, poor administration can in turn
lead to less effective school system.
Stoll (1995) as cited by Saleem et al., (2012) did a study in Pakistani about the
school effectiveness and noticed that there were issues which caused the school
ineffectiveness and these are; unfocused leadership, and dysfunctional staff
relationship. Bakkum and Sammons (2011) argue that bad relationship between
school heads and teaching staff and bad cohesion and concession with the school
team.
Papaku (2007) did a study and come up with the key findings of the study identified
a range of factors that hinder the school effectiveness, these include: poor
administration, poor infrastructures, lack of initial training and lack of support for
on-going professional training, unfavorable conditions of service, poor quality of

14
teachers', poor school facilities like desks, lack of appropriate and adequate financial
resources.
Liu (2006) further more did the study of primary school effectiveness in China the
study’s findings revealed that some schools are not effectiveness because of the
following factors; non-shared academic leadership, lack of school facilities,
cohesiveness, and top-down effects to enhance teaching.
In the study by Chadiel (2007) who analyzed the implementation of the management
change in the primary schools in Tanzania revealed that the improvements that were
sought by the plan were not so effective as changes suggested were from top down;
and were not surprisingly to hear from Parliament discussions that primary schools in
Tanzania do not have enough desks and learners attend lesson while sitting on the
floor. This experience correlates with the China’s experiences as presented by Liu
that in some schools they fail to meet the standards for effective schools.
Derrick (2014) did the study in primary school to assess as to why the school fails to
become effective. In his study Derrick discovered there are various issues happening
in the school which leads to school ineffectiveness as follows; poor attendance of
both teachers and students to school, students are not motivated to go to school to
learn, budget cuts limits school effectiveness and poor students respects to their
teachers specifically in the classroom.
In Tanzania context, it is common to see that the students in primary schools
particularly located in rural areas where energy and water supply were in critical
condition pupils are assigned to fetch water and collect fire wood instead of learning
15
thus losing a lot of lessons which might in turn lead to failure in covering the
syllabus.
In the day-to-day schools administration, heads of schools face myriad administrative
problems which bring about school ineffectiveness. These includes, lack of qualified
and dedicated teachers, insufficient funding to maintain schools and paying teachers’
salaries, and interference by parents, lack of accommodation for teachers,
indiscipline on the part of teachers and pupils and uncooperative attitudes of other
school staff about work Luyten, Visscher, and Witziers (2004).
2.3.4 Teaching and Learning Situation
Warwick and Reimers (1995) Schreens (2004) Dronkers and Robbert (2003) argue
that in most cases primary schools become less effectiveness hence lower down
quality of education system in their respective country the following issues stated by
these scholars being influencing the problem to occur; social background of the
students and families, shortages of school buildings to supports teaching and
learning activities, teachers to students ratio were significantly worse and shortages
of teachers who teaches languages and mathematics.
In the past, in Tanzania, it was directed by the employment letters to the primary
school teachers that they are posted to teach every subject in primary school. Since
some teachers were generally trained in the teacher’s training colleges to teach in the
primary school, it was assumed that every teacher who was trained in teacher
training colleges was capable of teaching any subject in primary school. However,
this was not the case, after the Ministry of Education did an evaluation. So, they

16
redirected that the teachers’ college should consider the subjects that a teacher is
expected to teach after graduation. In essence, the students who were exposed to the
teachers who lacked competence in the subjects they were assigned experienced
learning difficulties and the reflection is low achievement rate in some of the primary
schools, Nachingwea inclusive.
2.3.5 Parents’ Consultation with Teachers
Good performance is realized when parents work in consultation with the teachers in
order to understand their children better. Ubogu (2004) indicated that parents’
interaction with teachers enables them to know what their children are encountering
in school and what could be done to deal with the problems. It would also put pupils
on alert and study in school as they would know that their parents would inquire
about their performance. Parents may not be able to provide much guidance and help
their children’s performance improve when they are ignorant of what happens in
school.
2.4 Research Gap
Many researches have been done at national and international levels to point out
factors that hinder education effectiveness in primary schools. I reserve much praise
for past researchers because they gave us a light on factors that determine education
effectiveness but I also wish acknowledge and express the truth that every place
might have specific causal problems which in turn demand specific solutions to
address the them for that reason I decided to do this study because there is no past
17
researches that have been done in Nachingwea to find out the factors that hinder
education effectiveness in Nachingwea primary schools.
CHAPTER THREE
3.0 RESEARCH METHODOLOGY
3.1 Introduction
This chapter presents how various methodological issues related to study have been
approached, to all intents and purposes this chapter covers; study area, sampling
sites, sample size and sampling method, research paradigms, other methodological
elements covered include data collection methods and analysis and ethical
consideration.
3.2 Study Area and Population and Sampling Sites
Past researches justify the presence of correlation between effective education and
the environmental characteristics of a particular area. In regard to that, sampling sites
included in this study were selected based on a number of criteria such as; social
economic activities, traditional practices, location and level of urbanization. The
reason to choose sampling sites from places that have diversity of environmental
characteristics is to get a more representative sample that really reflects the
differences that exist between places and within societies of Nachingwea District.
The population of this study involved the primary school teachers, parents and pupils
in primary schools as well as education officers working in Nachingwea district. The
primary schools included in the sample are: primary school Nambambo, Mianzini,

18
Majimaji, Nguvumoja, Nampemba and Namatula. Nambambo and Mianzini primary
schools are in Nachingwea urban therefore they are almost equal in respect of life
style and social organization. On the other hand, Nampemba and Namatula primary
schools have similar social economic characteristics in the sense that they are all
rural, predominantly agricultural, with almost subsistence levels of production.
Lastly, Majimaji and Nguvumoja primary schools are found in sub urbanized
villages yet the natives here practice Jando and Unyago which has been singled to
have negative correlation with education as justified by Mbugua et al., (2012).
Therefore, the sample schools included in this study not only provide a more
representative sample but also remove biasness in the results obtained. Technically,
sites selected increased the triangulation thus results were expected to be of more
informed than one or few sites could have been selected by the researcher (Merrium,
1988).
3.3 Sample Size and Sampling Technique
Since this study used mixed methods design, a design that combines quantitative and
qualitative tradition in single study (Tashakkori and Teddlie, 2009) its sample needs
to be of parallel sampling methods. That means, the study used quantitative
respondents and the sample for the qualitative design. The quantitative covered 130
respondents where qualitative used 08 informants. Hence the total sample was 138.
The characteristic of the sample is presented in the following table below:
Table 3.1: Sample Size
S n Sample type Quantitative Qualitative Total

19
1 Primary school teachers 70 02 722 Parents 30 02 323 Pupils 28 02 304 Education officers 02 02 04
Total 130 08 138Source: Field Data, 2015
The quantitative used the random sampling technique where the respondent were
selected from the district of Nachingwea as they would offer reliable information on
the factors that affect the school effectiveness and the qualitative used the purposeful
sampling technique where the respondents were included with purpose and not
accidental; hoping to inform the study on the factors that hinder school effectiveness
as they are living and other are working in the school environment.
3.4 Research Paradigms
Interpretivitism and positivism are two research paradigms that exist in research
related to education (Creswell, 2005 and Gatsha, 2010, Rwejuna, 2013).
Interpretivists emphasize on using a small sample with thick data collection the aim
being to grasp the experience, behavior and opinion of individuals in natural setting.
On the other hand, positivists emphasize wider sample to establish theories delivered
from statistical hypothesis (Creswell, 2005 and Gatsha, 2010). Though both
paradigms fit in some cases but they have some short falls. For example,
interpretivist approach lacks definite data analysis, researchers’ bias may influence
the results and lastly it is time consuming for the interviewee and for the researcher
to organize information obtained through this method.

20
Similarly, positivists approach has its weakness such as the extent to which tools
used to collect data can be controlled by the researcher. The existence of such
weakness in both methods entails the need to combine both approaches so as to
balance the weakness that each method exhibits (Creswell, 2003). Therefore, this
study used a mixed methods design because it has a power to provide stronger
inferences in a study yet it provides opportunity to build a greater assortment of
divergent views on the factors affecting primary school effectiveness in Nachingwea
district.
3.5 Data Collection Methods
3.5.1 Questionnaire
The questionnaire is the method used to collect data under the mixed methods design
(Tshakkori and Teddlie, 2009). The method is quick and can be scored by anyone
who knows how to read and write. Silverman (1997) holds that the questionnaire can
be used by the respondents to give opinion on the effectiveness of the programme or
project. Since this study intended to get opinion on the factors that hinder the
education effectiveness in Nachingwea primary schools, this method was an
appropriate one as the respondents could give their opinions on what they consider to
be the factors that hinder the primary school effectiveness in Nachingwea district.
3.5.1.1 Construction of Questionnaire
The questionnaire comprised of 30 questions items. The questionnaire items targeted
to capture the objectives of the study. So the items elicited responses on how the
school based factors, the student based factors, the school administration and the

21
parent related factors hindered the school effectiveness in Nachingwea district. The
questionnaire is attached as an appendix 1.
3.5.1.2 Analysis of Questionnaire
The analysis of questionnaire was guided by the statistical tool known as SPSS
Version 17. This started by coding data into the software by using the processed
questionnaire forms. The coded data were then transformed into the computer
analysis to produce tables which guided the discussion together with data from the
qualitative mode.
3.5.2 Interviews
Since the design sought was of the mixed methods design, the interview was also
used to complement the quantitative data. Interview is the method also recommended
to collect data under the mixed method (Cresswell, 2009; Teddlie and Tashakkori,
2009). The interview used in this study was an open ended question which gives
open question or theme for the interviewees to respond orally.
The interview question is attached as an appendix 2. The interview was rational in
this study because it could be used by the current researcher to collect the
experiences of the education stakeholders on what they feel are the factors that
hinder the school effectiveness in Nachingwea primary schools in a more depth than
it could be done by the un revolving questionnaire tool, Huberman (1996).

22
3.6 Ethical Consideration
Respondents were assured of the confidentiality of the information they provided and
that the information was for academic purposes only. Respondents were free to
withdraw from the study at any time. Administrative unit like Nachingwea District
Council through District Executive Director was consulted to ask for permission and
corporation to undertake this study in their area of jurisdiction particularly in primary
schools. The permission letter from the Open University of Tanzania (OUT) to
conduct the research was shown to the district authority in Nachingwea to grant
permission to access the schools sampled.
3.7 Truthworthiness
Bogdan and Bicklen (1998) consider that for the results of the research to be believed
and relied by the audience it has to maintain a certain level of truth. It is indeed
difficult to obtain truth as it is difficult to establish one and it is difficult to measure
it. However, some measures may help to establish the level of truth the audience can
believe in the findings of the research. In this study therefore the truthworthiness was
established by following stages. First, triangulation of respondents, the current
researcher used more than one respondents selected from school of Majimaji,
Mianzini, Nguvumoja, Namatula to inform the study. This helped the researcher to
establish what is correct about the school effectiveness across respondents. Second,
was the triangulation of the sites. The sites used were more than one and they
involved Nampenda, Namatula , Nguvumoja, and Nambambo schools. Third, was
the triangulation of methods, where the researcher used interviews and questionnaire

23
to establish and cross check the correctness of information across the methods on the
issues related to factors hindering school effectiveness in Nachingwea district.
CHAPTER FOUR
4.0 DATA PRESENTATION AND ANALYSIS
4.1 Introduction
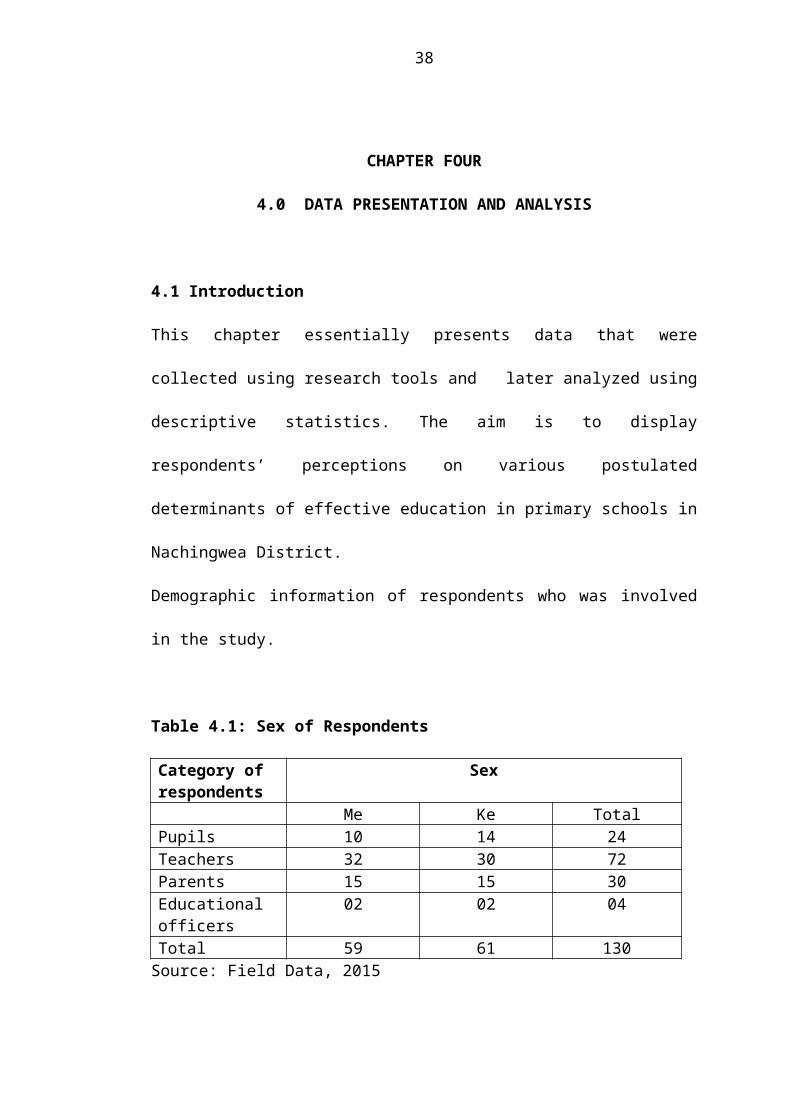
This chapter essentially presents data that were collected using research tools and
later analyzed using descriptive statistics. The aim is to display respondents’
perceptions on various postulated determinants of effective education in primary
schools in Nachingwea District.
Demographic information of respondents who was involved in the study.
Table 4.1: Sex of Respondents
Category of respondents
Sex
Me Ke TotalPupils 10 14 24Teachers 32 30 72Parents 15 15 30Educational officers
02 02 04
Total 59 61 130Source: Field Data, 2015

24
Respondents of questionnaire about factors hindering school effectiveness in
Tanzania case of Nachingwea primary schools basing on teachers factor, pupils
factor. parent factor were as follows: Teachers was 70 where by Me was 32 and Ke
was 30, pupils was 24 where Me was10 and Ke was 14, parents was 30 where Me
was 15 and Ke was 15 and education officer was 04 where Me was 02 and Ke was
02
Table 4.2: Educational Level of Respondents
Category of respondents
Level of education
Class iii-vii
Std vii cert
Form
four cert
Teaching Cert
Diploma cert
Bachelor
Masters and
above
Pupils 24Teachers 65 04 01Parents 20 04 05 03Educational officers
01 03
Source: Field Data, 2015
Respondents who was involved in the study 24 were standard three to seven, 65
teacher holding teaching certificate 04 diploma certificate and 01 bachelor, Parents
20 were standard seven leaver 02 holder of form four certificate 05 holder of other
certificate and 03 bachelor holder, Education officer 01 were the holder of bachelor
and 03 were holding masters
Table 4.3: Occupation of Respondents

25
Occupation TotalTeachers 72
Farmers 28
Doctor 02
Educational officers 04
Total 106
Source: Field Data 2015
Respondents originates from various field of occupation where by 72 were teachers,
28 farmer, 02 doctors, and 04 education officer
Table 4.4: Working Experience
Working experience Total1-5 years 406-10years 1011-15 years 1516- 20years 0921-Above 06
Source: Field Data 2015
Respondents working experience 40 Respondents working experience were 1-5
years, 10 Respondents working experience were 6-10 years,15 Respondents working
experience were 11-15 years ,09respondents working experience were 16-20 and 06
respondents working experience were 20 and above.
4.2 Factors Hindering Effective Primary Education in Nachingwea District
(Quantitative)
Q1. Commencement of learning after school’s holidays: Results from
questionnaire in (Table 4.5) show that 53.9 percent of the respondents agreed that
26
commencement of learning after schools’ holidays can hinder education
effectiveness, whereas, 35.4 percent of the respondents disagreed with the statement
and only 10.8 percent were undecided.
Q.2. The time when lessons start after schools’ holidays: Results of the
questionnaire in (Table 4.6) show that the majority 71.4 percent of schools’ and
class’ teachers start lessons in the first and second day after schools’ holidays while
21.4 percent and 7.1 percent start lesson after 3-5 days and 6+ days respectively.
Table 4.5: Commencement of Learning After Schools’ Holidays
Frequency Percent
Valid Percent Cumulative Percent
Valid Strongly agree 50 38.5 38.5 38.5Agree 20 15.4 15.4 53.8Undecided 14 10.8 10.8 64.6Disagree 26 20.0 20.0 84.6Strongly disagree 20 15.4 15.4 100.0
Total 130 100.0 100.0Source: Field Data 2015
At the bottom of the first column of this table before the word ‘total’ there is an item
labeled ‘Missing’ with value label ‘999’, this represents respondents who belong to
the categories of non-teaching education officers and parents who were not supposed
to answer this question because realistically they do not teach students in normal
classes, in totality they were 60(42.2%) as indicated in the frequency’s column of the
same row.

27
Table 4.6: Time to Start Lesson After Schools’ Holidays
Frequency Percent Valid Percent Cumulative PercentValid 1-2 days 50 38.5 71.4 71.4
3-5 days 15 11.5 21.4 92.9
6+ days 5 3.8 7.1 100.0
Total 70 53.8 100.0Missing 999 60 46.2Total 130 100.0Source: Field Data 2015
Q.3. Inadequacy of learning and teaching materials in primary schools: The
results in Table 4.7 indicate that the majority of the respondents 66.1 percent agreed
with the statement that adequacy of teaching and learning materials in primary
schools can hinder education effectiveness while 7.7 percent and 26.1 percent were
undecided and disagreed respectively
Table 4.7: Inadequacy of Learning and Teaching Materials In Primary Schools
Frequency PercentValid
Percent Cumulative PercentValid Strongly agree 61 46.9 46.9 46.9
Agree 25 19.2 19.2 66.2
Undecided 10 7.7 7.7 73.8
Disagree 5 3.8 3.8 77.7
Strongly disagree 29 22.3 22.3 100.0
Total 130 100.0 100.0
Source: Field Data 2015

28
Q4. Whether learning and teachings materials are adequate in that particular
school: Results in table 4.8, indicate that the majority 78.6 percent of the respondents
perceived that there were no enough teaching and learning materials in respective
primary schools. In contrary, 7.1 percent said that there were enough learning and
teaching materials while 14.3 percent were undecided. At the bottom of the first
column of this table before the word ‘total’ there is an item labeled ‘Missing’ with
value label ‘999’, this represents respondents who belong to the categories of non-
teaching education officers and parents who were not supposed to answer this
question because realistically they have a vague knowledge on the availability of
teaching and learning materials in respective schools, in totality they were 60(42.2%)
as indicated in the frequency’s column of the same row.
Table 4.8: Teaching and Learning Materials Adequacy in That Particular School
Frequency Percent Valid Percent Cumulative PercentValid Yes 5 3.8 7.1 7.1
No 55 42.3 78.6 85.7
Undecided 10 7.7 14.3 100.0
Total 70 53.8 100.0Missing 999
60 46.2
Total 130 100.0Source: Field Data 2015
Q5. Whether frequency of staff meeting hinder education effectiveness: Table
4.9 indicates that 22.1 percent of the respondents agreed with the statement that
29
frequency of staff meeting can hinder education effectiveness contrary to the
majority 53.9 percent who disagreed and 23.1 percent were undecided.
Table 4.9: Whether Frequency of Staff Meeting Hinder Education Effectiveness
Frequency Percent Valid Percent Cumulative PercentValid Strongly agree 20 15.4 15.4 15.4
Agree 10 7.7 7.7 23.1Undecided 30 23.1 23.1 46.2Disagree 40 30.8 30.8 76.9Strongly disagree 30 23.1 23.1 100.0
Total 130 100.0 100.0Source: Field Data 2015
Q6. Frequency of staff meeting in respective schools: Table 4.10 indicates that the
minority of teaching staff 4.3 percent and 10 percent held staff meeting in their
schools daily and once a month respectively contrary to the majority 57.1 percent
who held staff meeting once a week. On the other hand, 14.3 percent held staff
meeting twice a week and 14.3 percent of the respondents said that there is no
specific schedule in their schools for staff meeting. At the bottom of the first column
of this table before the word ‘total’ there is an item labeled ‘Missing’ with value
label ‘999’, this represents respondents who belong to the categories of non-teaching
education officers and parents who were not supposed to answer this question
because they are not involved direct in staff meeting, in totality they were 60(42.2%)
as indicated in the frequency’s column of the same row.
30
Table 4.10: How Frequently are Staff Meetings Held in Schools?
Frequency Percent Valid Percent Cumulative PercentValid Daily 3 2.3 4.3 4.3
Twice a week 10 7.7 14.3 18.6Once a week 40 30.8 57.1 75.7Once a month 7 5.4 10.0 85.7No specific time 10 7.7 14.3 100.0
Total 70 53.8 100.0Missing 999 60 46.2Total 130 100.0Source: Field Data 2015
Q7. Whether frequency of checking scheme of work by head teachers affects
education: Table 4.11 indicates that the majority 61.6 percent of the respondents
agreed that frequency of checking scheme of work by head teachers has an impact on
education effectiveness in primary schools in contrary 30.8 percent negated the
statement while 7.7 percent were undecided.

31
Table 4.11: The Frequency of Checking Scheme of Work by Head Teacher
Frequency Percent Valid Percent Cumulative PercentValid Strongly
agree 40 30.8 30.8 30.8
Agree 40 30.8 30.8 61.5
Undecided 10 7.7 7.7 69.2
Disagree 20 15.4 15.4 84.6
Strongly disagree 20 15.4 15.4 100.0
Total 130 100.0 100.0
Source: Field Data 2015
Q8. The rate of checking scheme of work by head teachers: Table 4.12 shows that
the majority 48.6 percent and 30 percent of class teachers, their scheme of work are
checked by head teachers 1-2 per term and once a moth respectively. Contrary to
that, 10 percent of respondents said that their head teachers do not check their
scheme of work while 11.4 percent of respondents have no specific time of checking
scheme of work. At the bottom of the first column of this table before the word
‘total’ there is an item labeled ‘Missing’ with value label ‘999’, this represents
respondents who belong to the categories of non-teaching education officers and
parents who were not supposed to answer this question because they are not obliged
to prepare scheme of work as they do not belong to teaching staff, in totality they
were 60(42.2%) as indicated in the frequency’s column of the same row.

32
Table 4.12: The Frequency of Head Teachers to Check Scheme of WorkFrequency Percent Valid Percent Cumulative Percent
Valid Does not check 7 5.4 10.0 10.0
Once a month 21 16.2 30.0 40.01-2 per term 34 26.2 48.6 88.6No specific time 8 6.2 11.4 100.0
Total 70 53.8 100.0Missing 999 60 46.2Total 130 100.0Source: Field Data 2015
Q9. Whether frequency of checking lesson plan by head teachers improve
education effectiveness
The results in table 4.13, indicates that the majority of the respondents 65.4 percent
agreed that checking of lesson plan done by head teachers can improve education
effectiveness whereas 30.8 percent disagreed with the statement and 3.8 percent were
undecided.
Table 4.13: Whether Frequency of Checking Lesson Plan Affects Education’s
Effectiveness
Frequency Percent Valid Percent Cumulative PercentValid Strongly agree 50 38.5 38.5 38.5
Agree 35 26.9 26.9 65.4Undecided 5 3.8 3.8 69.2Disagree 20 15.4 15.4 84.6Strongly Disagree 20 15.4 15.4 100.0
Total 130 100.0 100.0Source: Field Data 2015
33
Q10. Rate of checking lesson plan by head teachers: Table 4.14 shows that the
majority 42.9%, 28.6% and 15.7% of the respondents their lesson plan are checked
by head teachers once a month, weekly and once a term as compared to 7.1% whose
lesson plan are not checked while the minority 5.7 % said that their head teachers
check lesson plans randomly. At the bottom of the first column of this table before
the word ‘total’ there is an item labeled ‘Missing’ with value label ‘999’, this
represents respondents who belong to the categories of non-teaching education
officers and parents who were not supposed to answer this question because they are
not obliged to prepare lesson plan as they do not belong to teaching staff, in totality
they were 60(42.2%) as indicated in the frequency’s column of the same row.
Table 4.14: Rate of Checking Lesson Plans by Head Teachers
Frequency Percent Valid Percent Cumulative PercentValid Does not check 5 3.8 7.1 7.1
Once a month 30 23.1 42.9 50.0Once a term 11 8.5 15.7 65.7No specific time 4 3.1 5.7 71.4
Weekly 20 15.4 28.6 100.0Total 70 53.8 100.0
Missing 999 60 46.2Total 130 100.0Source: Field Data 2015
Q11. Whether teachers are observed by their head teachers when are teaching:
Table 4.15, indicates that respondents who agree with the statement that observation
of classes by head teachers when teachers are teaching improves education
effectiveness are about equally the same with those who disagree with the statement
34
as those who agree stands at 46.1 percent compared to 46.2 percent who do not
agree, the rest 7.7 percent were undecided.
Table 4.15: Whether Head Teachers Observe How Teachers Teach
Frequency PercentValid
PercentCumulative
PercentValid Strongly agree 29 22.3 22.3 22.3
Agree 31 23.8 23.8 46.2
Undecided 10 7.7 7.7 53.8
Disagree 26 20.0 20.0 73.8
Strongly disagree 34 26.2 26.2 100.0
Total 130 100.0 100.0Source: Field Data 2015
Q12. How many times head teacher observed how teachers teach in the last one
month: Table 4.16 shows that the majority of respondents 43.7 percent said that no
head teachers observed classes in the last one month as compared to 42.3 percent and
14.1 percent said that head teachers observed classes once a month and 2-4 times a
month respectively. At the bottom of the first column of this table before the word
‘total’ there is an item labeled ‘Missing’ with value label ‘999’, this represents
respondents who belong to the categories of non-teaching education officers and
parents who were not supposed to answer this question because they are not obliged
to teach in normal classes, in totality they were 60(42.2%) as indicated in the
frequency’s column of the same row.

35
Table 4.16: The Number of Times the Head Teacher Observed Classes in Last One
Month
Frequency Percent Valid Percent Cumulative PercentValid Once 30 23.1 42.3 42.3
2-4 in one month 10 7.7 14.1 56.3
Not at all 31 23.8 43.7 100.0Total 71 54.6 100.0
Missing 999 59 45.4
Total 130 100.0Source: Field Data 2015
Q13. Whether teachers’ commitment level can affect education effectiveness:
Table 4.17 indicates that the majority of respondents 55.3 percent agreed with the
statement that teachers’ commitment level can affect education effectiveness. In
contrary, 33.1 percent refused while 11.5 percent were undecided.
Table 4.17: Whether Teachers’ Commitment Level Can Affect Education
Effectiveness
Frequency Percent Valid Percent Cumulative PercentValid Strongly agree 41 31.5 31.5 31.5
Agree 31 23.8 23.8 55.4Undecided 15 11.5 11.5 66.9Disagree 20 15.4 15.4 82.3Strongly disagree 23 17.7 17.7 100.0
Total 130 100.0 100.0Source: Field Data 2015

36
Q14. Whether teachers’ absenteeism can hinder education effectiveness: The
results in Table 4.18 indicate that the majority 50.0 percent agreed that teachers’
absenteeism can hinder education effectiveness contrary to 34.6 percent who negated
the statement and 15.4 percent were undecided.
Table 4.18: Whether Teachers' Absenteeism Hinder Education Effectiveness
Frequency PercentValid
PercentCumulative
PercentValid Strongly agree 35 26.9 26.9 26.9
Agree 30 23.1 23.1 50.0
Undecided 20 15.4 15.4 65.4
Disagree 15 11.5 11.5 76.9
Strongly disagree 30 23.1 23.1 100.0
Total 130 100.0 100.0
Source: Field Data 2015
Q15. Rating of teachers’ absenteeism in respective school: Table 4.19 indicates
that the majority of respondents 63.3 percent rated teachers’ absenteeism as being
low while 21.4 percent and 14.3 percent rated it moderate and high respectively. At
the bottom of the first column of this table before the word ‘total’ there is an item
labeled ‘Missing’ with value label ‘999’, this represents respondents who belong to
the categories of non-teaching education officers and parents who were not supposed
to answer this question because they may not be aware with how often teachers miss

37
classes, in totality they were 60(42.2%) as indicated in the frequency’s column of the
same row.
Table 4.19: How Respondents Rate Teachers' Absenteeism in Their School
Frequency Percent Valid Percent Cumulative PercentValid Low 45 34.6 64.3 64.3
Moderate 15 11.5 21.4 85.7High 10 7.7 14.3 100.0Total 70 53.8 100.0
Missing 999 60 46.2Total 130 100.0Source: Field Data 2015
Q16. Whether motivation of teachers by the Government affect education
effectiveness: Table 4.20 indicates that 54.6 percent of the respondents agreed that
motivation of teachers by the Government can improve or hinder education
effectiveness. In contrary, 36.2 percent disagreed while 9.2 percent were undecided.
Table 4.20: Motivation of teachers by the GovernmentFrequency Percent Valid Percent Cumulative Percent
Valid Strongly agree 30 23.1 23.1 23.1Agree 41 31.5 31.5 54.6
Undecided 12 9.2 9.2 63.8
Disagree 30 23.1 23.1 86.9
Strongly disagree 17 13.1 13.1 100.0
Total 130 100.0 100.0Source: Field Data 2015

38
Q17. Whether teachers’ work load affects education effectiveness: Table 4.21
indicates that 39.2 percent agreed with the statement that teachers’ work load can
affect education effectiveness in primary schools. In contrary, the majority 53.1
percent negated the statement while 7.7 percent were undecided.
Table 4.21: Perception on Teachers' Work Load
Frequency PercentValid
PercentCumulative
PercentValid Strongly agree 31 23.8 23.8 23.8
Agree 20 15.4 15.4 39.2
Undecided 10 7.7 7.7 46.9
Disagree 39 30.0 30.0 76.9
Strongly disagree 30 23.1 23.1 100.0
Total 130 100.0 100.0Source: Field Data 2015
Q18. Teachers’ lessons per week: Table 4.22, indicates that the majority of teachers
41.4 percent have 26-30 lessons per week while the minority of them 2.9 percent and
4.3 percent have 40+ and 1-15 lessons per week respectively. In addition, 22.9
percent have 21-25 lessons per week while teachers having 16-20 lessons and 31-40
lessons all together tally up to 14.3 percent. At the bottom of the first column of this
table before the word ‘total’ there is an item labeled ‘Missing’ with value label ‘999’,
this represents respondents who belong to the categories of non-teaching education
officers and parents who were not supposed to answer this question because they do
39
not attend classes to teach students, in totality they were 60(42.2%) as indicated in
the frequency’s column of the same row.
Table 4.22: Teachers’ Lessons per Week
Frequency Percent Valid PercentCumulative
PercentValid 1-15 3 2.3 4.3 4.3
16-20 10 7.7 14.3 18.621-25 16 12.3 22.9 41.426-30 29 22.3 41.4 82.931-40 10 7.7 14.3 97.140+ 2 1.5 2.9 100.0Total 70 53.8 100.0
Missing 999 60 46.2
Total 130 100.0Source: Field Data 2015
Q19. Pupils’ absenteeism rate: Results in Table 4.23, indicate that 54.7 percent of
the respondents agreed that pupils’ rate of absenteeism hinder education
effectiveness in contrary to that 30 percent of the respondents disagreed while 15.4
percent were undecided.

40
Table 4.23: Pupils' Frequency of Absenteeism
Frequency Percent Valid PercentCumulative
PercentValid Strongly agree 21 16.2 16.2 16.2
Agree 50 38.5 38.5 54.6Undecided 20 15.4 15.4 70.0Disagree 9 6.9 6.9 76.9Strongly Disagree 30 23.1 23.1 100.0
Total 130 100.0 100.0Source: Field Data 2015
Q20. Rating of pupils’ frequency of absenteeism: Table 4.24, indicates that
majority of teachers 42.9 percent regarded schools to have lower rate of students’
absenteeism while the number of teachers who rated students’ absenteeism as
moderate and low were equally the same in numbers summing up to 28.6 percent. At
the bottom of the first column of this table before the word ‘total’ there is an item
labeled ‘Missing’ with value label ‘999’, this represents respondents who belong to
the categories of non-teaching education officers and parents who were not supposed
to answer this question because they may not have correct information on each
school students’ absenteeism rate, in totality they were 60(42.2%) as indicated in the
frequency’s column of the same row.

41
Table 4.24: Rating of Pupils' Absenteeism By Respondents
Frequency Percent
Valid Percent Cumulative Percent
Valid Low 30 23.1 42.9 42.9Moderate 20 15.4 28.6 71.4High 20 15.4 28.6 100.0Total 70 53.8 100.0
Missing 999 60 46.2
Total 130 100.0Source: Field Data 2015
Q21. Whether pupils’ lateness determine education effectiveness: Results in table
4.25 show that the majority of respondents 50 percent disagreed with the statement
that pupils’ lateness can hinder education effectiveness while 38.5 percent agreed
and 11.5 percent were undecided.
Table 4.25: Whether Pupils' Lateness Hinder Education Effectiveness
Frequency Percent Valid Percent Cumulative PercentValid Strongly agree 30 23.1 23.1 23.1
Agree 20 15.4 15.4 38.5Undecided 15 11.5 11.5 50.0Disagree 25 19.2 19.2 69.2Strongly disagree 40 30.8 30.8 100.0
Total 130 100.0 100.0Source: Field Data 2015
Q22. Rating of pupils lateness by respondents
42
Table 4.26 indicates that the majority of the respondents 23.1 percent rated pupils’
lateness as being low in Nachingwea district while 19.2 percent and 11.5 percent
rated it moderate and high respectively. At the bottom of the first column of this
table before the word ‘total’ there is an item labeled ‘Missing’ with value label ‘999’,
this represents respondents who belong to the categories of non-teaching education
officers and parents who were not supposed to answer this question because they
may not have correct information on pupils’ lateness, in totality they were 60(42.2%)
as indicated in the frequency’s column of the same row.
Table 4.26: Rating of Pupils Lateness by RespondentsFrequency Percent Valid Percent Cumulative Percent
Valid Low 30 23.1 23.1 23.1Moderate 25 19.2 19.2 42.3High 15 11.5 11.5 53.8999 60 46.2 46.2 100.0Total 130 100.0 100.0
Source: Field Data 2015
Q23. Whether parents’ consultation with teachers affect education effectiveness:
Table 4.27 indicates that the majority of the respondents 62.3 percent agreed that
parents’ consultation with teachers can help to improve education effectiveness while
22.3 percent disagreed and 15.4 percent were undecided.

43
Table 4.27: Parents’ Consultation With Teachers
Frequency Percent Valid Percent Cumulative PercentValid Strongly agree 50 38.5 38.5 38.5
Agree 31 23.8 23.8 62.3Undecided 20 15.4 15.4 77.7Disagree 15 11.5 11.5 89.2Strongly disagree 14 10.8 10.8 100.0
Total 130 100.0 100.0Source: Field Data 2015
Q24. Number of parents that consulted teachers in the last three months: Table
4.28 indicates that the majority of teachers 43.7 percent were not consulted with
pupils’ parents in the last three months on the other hand 14.1 percent, 35.2 percent
and 7.0 percent were consulted with 1 parent, 2-4 parents and 5+ parents
respectively. At the bottom of the first column of this table before the word ‘total’
there is an item labeled ‘Missing’ with value label ‘999’, this represents respondents
who belong to the categories of non-teaching education officers and parents who
were not supposed to answer this question because it is teachers who were supposed
to provide information on whether parents consult them for students’ matters, in
totality they were 60(42.2%) as indicated in the frequency’s column of the same row.
44
Table 4.28: Number of Parents That Meet Teachers for Consultation in Last
Three Months
Frequency Percent Valid PercentCumulative
PercentValid 1 parent 10 7.7 14.1 14.1
Parents 25 19.2 35.2 49.3Parents 5 3.8 7.0 56.3None 31 23.8 43.7 100.0Total 71 54.6 100.0
Missing 999 59 45.4Total 130 100.0Source: Field Data 2015
Q25. Parents’ response in the provision of learning materials: Table 4.29
indicates that the majority of respondents 45.4 percent agreed that parents’ positive
response in the provision of learning materials can help to improve education
effectiveness while 39.3 percent disagreed with the statement and 15.4 percent were
undecided.
Table 4.29: Parents Response in the Provision of Learning Materials
Frequency PercentValid
PercentCumulative
PercentValid Strongly agree 29 22.3 22.3 22.3
Agree 30 23.1 23.1 45.4Undecided 20 15.4 15.4 60.8Disagree 21 16.2 16.2 76.9Strongly Disagree 30 23.1 23.1 100.0
Total 130 100.0 100.0Source: Field Data 2015
45
Q26. Rating of parent’s response in the provision of learning materials: Table
4.30 indicates that the majority of respondents 67.7 percent said that parents’
response in the provision of learning material is poor. On the other hand, 26.6
percent and 7.7 percent perceived the response to be satisfactory and good
respectively.
Table 4.30: Rating of Parents’ Response in the Provision of Learning Materials
Frequency Percent Valid Percent Cumulative PercentValid Good 10 7.7 7.7 7.7
Satisfactory 32 24.6 24.6 32.3
Poor 88 67.7 67.7 100.0
Total 130 100.0 100.0
Source: Field Data 2015
Q27. The effect of ‘Unyago’ on education effectiveness: Table 4.31 indicates that
the majority of respondents 53.9 percent agreed that ‘Unyago, hinders education
effectiveness while 30.8 percent disagreed with the statement and 15.4 percent were
undecided.
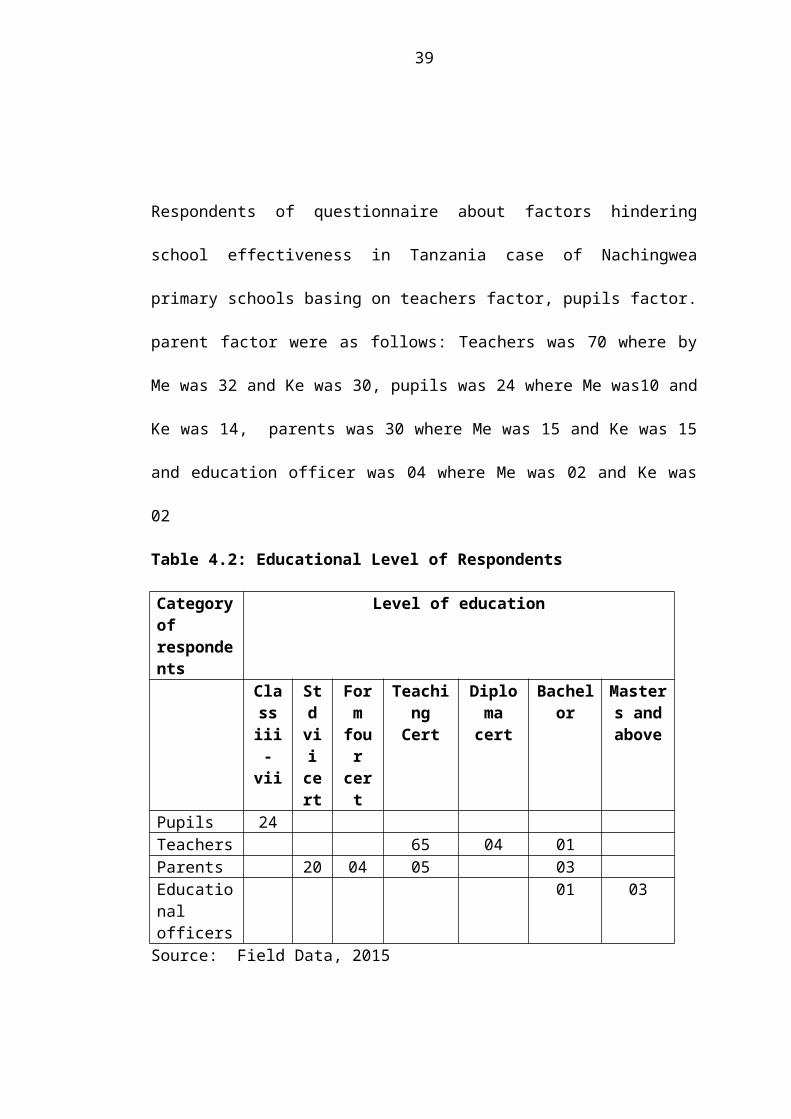
46
Table 4.31: The Impact of ‘Unyago’ On Education Effectiveness
Frequency Percent Valid Percent Cumulative PercentValid Strongly agree 40 30.8 30.8 30.8
Agree 30 23.1 23.1 53.8Undecided 20 15.4 15.4 69.2Disagree 20 15.4 15.4 84.6Strongly disagree 20 15.4 15.4 100.0
Total 130 100.0 100.0Source: Field Data 2015
CHAPTER FIVE
5.0 ANALYSIS AND DISCUSSION OF THE FINDINGS
5.1 Introduction
This chapter contains analysis and discussion of the research findings. The findings
are discussed and presented in a way that shows the factors that hinder education
effectiveness in Nachingwea District.
5.2 Factors Hindering Education Effectiveness in Nachingwea District
5.2.1 Commencement of Learning After Schools’ Holiday
The time allocated for teaching and learning is a factor influencing pupils’ academic
performance. There are two schools’ terms every year with holidays in between in
the months of April, June, September and December. The study therefore sought to
find out when learning begins after a holiday. Results obtained in Table 4.6 indicate
that majority of pupils 71.4% start learning 1-2 days after school opens while 21.4%
and 7.1% start learning 3-5 days and 6+ days after school opens respectively.

47
This indicates that there is wastage of time before learning begins in some schools.
Eshiwani (1983) noted that most schools loose many teaching/ learning hours at the
beginning of the term, this wastage leads to less work being covered and syllabi not
being completed on time hence, contributing to education ineffectiveness in some
schools. Eshiwani’s findings corresponds to the results indicated in table 4.5 where
the majority of the respondents 53.9% agreed that commencement of learning after
schools’ holidays can hinder education effectiveness.
5.2.2 Adequacy of Learning and Teaching Materials
The adequacy and use of teaching and learning materials affects the effectiveness of
a teacher’s lesson. Teaching and learning resources enhances understanding of
abstract ideas and improves students’ performance. The study sought adequacy of
learning resources like text books, library books, wall maps and the exercise books.
Data in table 4.8 show that the majority 78.6% said that there is no enough learning
and teaching materials in their schools in reverse to the minority 7.1% whereas
14.3% were undecided.
Such unfavorable school environment makes learning of subjects like Social Studies
very abstract to the pupils and could be a factor contributing to ineffective education
in primary schools in Nachingwea District as the findings of this study reveals in
Table 4.7 that the majority of the respondents 66.1% agreed with the statement that
inadequacy of teaching and learning materials in primary schools can hinder
education effectiveness while 7.7% and 26.1% were undecided and disagreed
respectively.
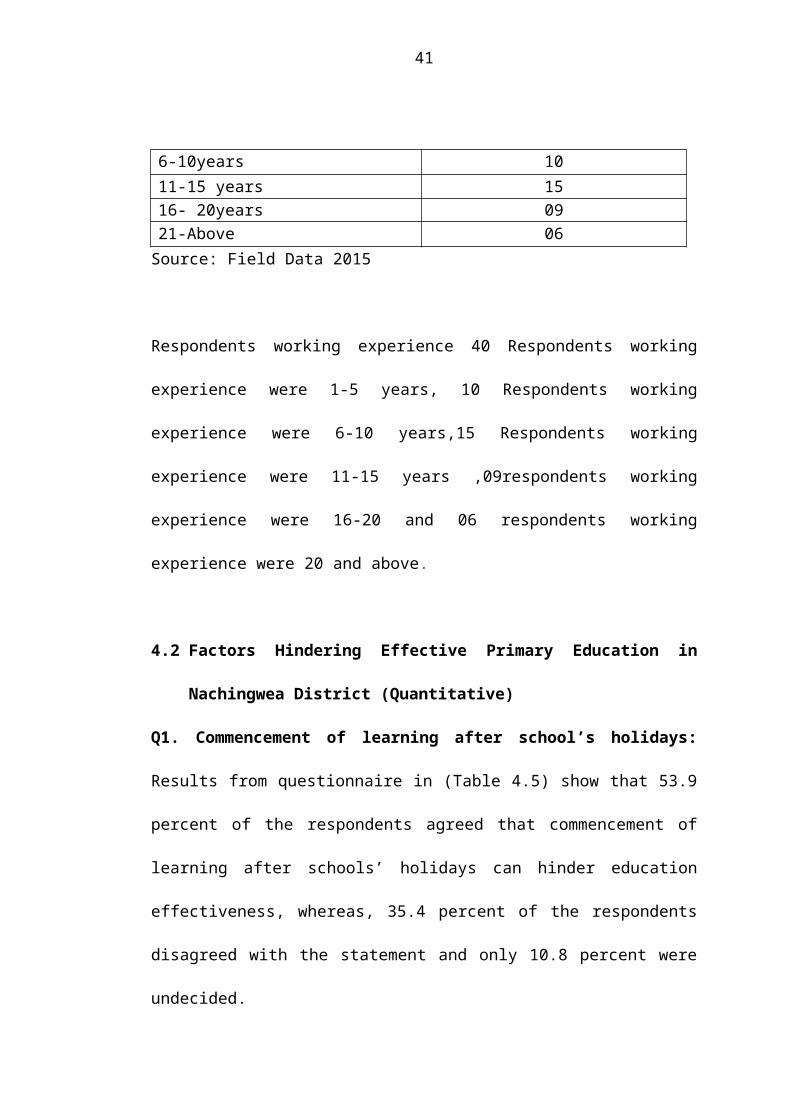
48
The questionnaire finding is further reflected by the opinion of one grade ‘A’ teacher
who had this to say:
I don’t think there is any public school in Tanzania where teaching and learning
materials are enough how can it be in Nachingwea? He continued; I don’t think
there is any public primary school where there is enough learning and teaching
materials as stated in official guidelines…..do you expect any better in education in
the near future? You must be dreaming!
Schneider (2003) found out that school facilities have a direct effect on teaching and
learning. Text books enable the pupils to follow the teacher’s sequence of
presentation and aids in understanding of lessons (Ubogu, 2004).
5.2.3 Frequency of Staff Meeting
Table 4.10 indicates that the minority of teaching staff 4.3% and 10% held staff
meeting in their schools daily and once a month respectively contrary to the majority
57.1% who held staff meeting once a week. On the other hand, 14.3% held staff
meeting twice a week and 14.4% of the respondents said that there is no specific
schedule in their schools for staff meeting. To support the above findings one female
teacher had this to say:
Staff meetings are very important in any active organization because it’s where you
get time to exchange ideas and get updates on the goings. On our school time table
it is scheduled but we never held staff meeting as per time table unless there is

49
something special and urgent, holding staff meetings regularly is not one’s
personal obligation it lies in the hands of school administration….a mere teacher
like me I have no any influence!
Few staff meetings may lead to less co-ordination of curriculum implementation and
rise unnecessary tension among staff members. Findings by Kathuri (1986) asserted
that the first aspect of administration is staff meetings as they facilitate co-ordination
of various activities in the school. This implies that there was less monitoring and
reporting of the progress of the schools activities to the teachers in some schools and
this could be a factor contributing to education ineffectiveness in Nachingwea
District though the majority 53.9% of the respondents in Table 4.9 disagreed with
this statement but there are 23.1% of the respondents who support this statement.
5.2.4 Checking of Scheme of Work by Head Teachers
The responsibility of checking the professional documents like teachers’ schemes of
work and lesson plans lies in the hands of the head teacher. This may be done in
person or he may delegate to the deputy head teacher or the senior teacher.
Preparation and use of schemes of work by the teachers enhances sequential teaching
and results to improved achievements.
Officially head teachers are required to check scheme of work once per term but the
results in table 4.12 shows that the majority 48.6% and 30% of class teachers, their
scheme of work are checked by head teachers 1-2 per term and once a moth
respectively. Contrary to that, 10% of respondents said that their head teachers do not

50
check their scheme of work while 11.4% of respondents have no specific time of
checking scheme of work.
It reflects that most head teachers do not do much follow up on curriculum
implementation during the course of the term. Checking of teachers’ schemes of
work should be done frequently to allow the head teacher monitor curriculum
implementation. Lack of this close monitoring could be a factor contributing to
education ineffectiveness as 46.1% of the respondents in Table 4.15 support this
statement.
5.2.5 Frequency of Checking Lesson Plan
Teachers’ lesson plan is a professional document prepared by teachers for the
purpose of presentation of a lesson. The teacher indicates whether the lesson has
been taught and objectives achieved; if the lesson is not taught, then the teacher
indicates the reason why and when he intends to cover it; if the lesson objectives are
not achieved, the teacher has to plan for remedial lesson in order to make the concept
understood by the pupils. The head teacher is supposed to check teachers’ weekly.
The results in table 4.14 shows that the majority 42.9%, 28.6% and 15.7% of the
respondents their lesson plan are checked by head teachers once a month, weekly and
once a term as compared to 7.1% whose lesson plan are not checked while the
minority 5.7 % said that their head teachers check lesson plans randomly. The
interview response revealed that:

51
I know it’s the responsibility of our school head teacher to check both scheme of
work and lesson plan but how frequently I don’t know! In our school there is no
specific time of checking either of it unless there is an education auditor from higher
authorities coming to our school it’s where we get told by the school head teacher to
prepare them.
Head teachers should monitor lesson plan preparation frequently; otherwise it may
lead to education ineffectiveness as data in Table 4.13 shows that the majority 66.4%
agreed with the statement that failure of checking teachers’ lesson plan may hinder
education effectiveness.
5.2.6 Observation of Classes by Head Teachers
One of the roles of the head teacher is to carry out internal supervision of curriculum
implementation in his/her school. This involves physical observation of teachers’
lessons in progress. Data in Table 4.16 shows that the majority of respondents 43.7%
said that no head teachers observed classes in the last one month as compared to
42.3% and 14.1% said that head teachers observed classes once a month and 2-4
times a month respectively. One of the head teachers’ roles is regular class
supervision in order to promote curriculum goals, failure to do so may lead to
education ineffectiveness. Data in Table 4.15 shows that 46.1% of the respondents
agreed that failure of supervising classes regularly by head teachers may lead to
education ineffectiveness.

52
5.2.7 Teachers’ Commitment Level
Good performance is as a result of high commitment levels by the teachers. Data in
Table 4.17 indicates that the majority of respondents 55.3 percent agreed with the
statement that teachers’ commitment level can affect education effectiveness. In
contrary, 33.1 percent refused while 11.5 percent were undecided. The questionnaire
findings were further echoed by the response from the interviewee who said that:
What….to be committed?! You know my monthly salary package? Do you see our
school environment…..such poor teachers’ office, only two teachers’ houses while
we are sixteen in number……….I don’t have to list all of them cause you understand
what I mean but not all of us are not satisfied with such perplexing environment,
some feel very ok!
Ubogu (2004) asserts that teachers who lack enthusiasm are unable to teach
effectively, making pupils not to learn well. My enphasis is that the teachers with
low level of commitment in their teaching career see the school is the place to endure
to live, they use most of their time plan nonacademic activities and as a result the
students are not benefiting for their planning. Therefore, responsible authorities
should make sure that teachers’ commitment level is at high level.
5.2.8 Teachers’ Aabsenteeism
Teachers’ rate of absenteeism was looked into; Table 4.19 indicates that the majority
of respondents 63.4% rated teachers’ absenteeism as being low, while 21.4% and
14.3% rated it moderate and high respectively. When teachers absent themselves
from school frequently, pupils go unattended and do not do well in academics.
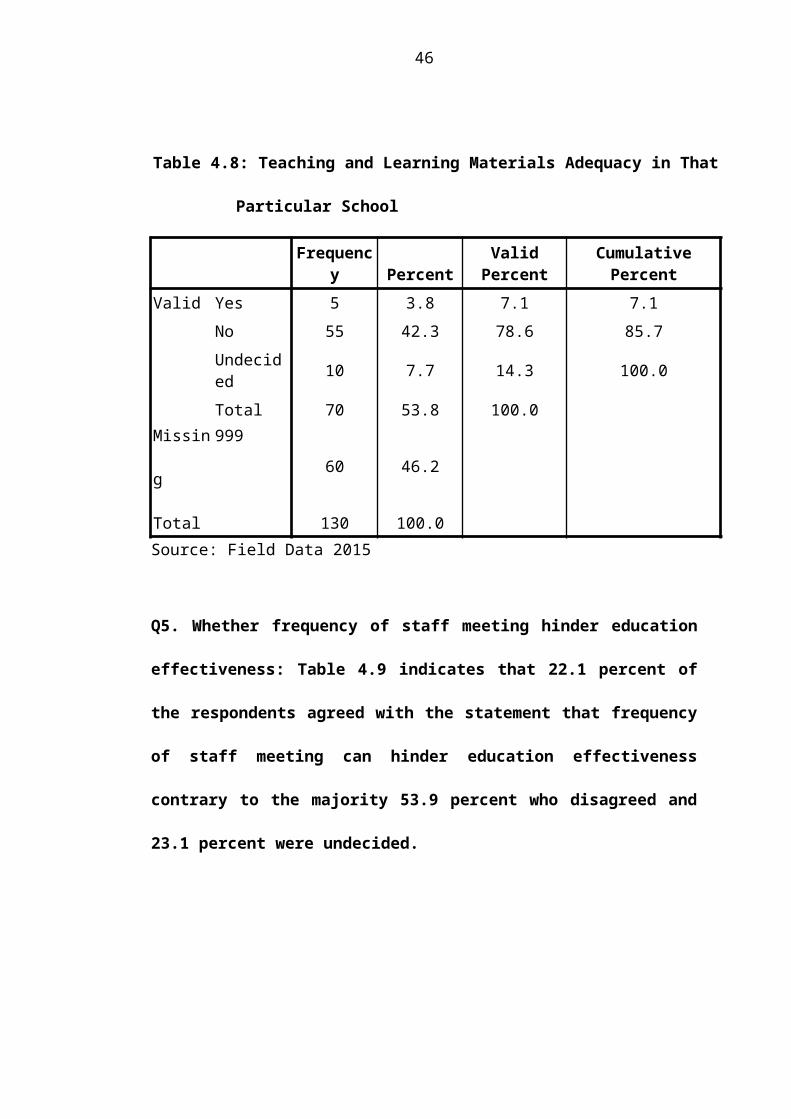
53
Absenteeism by teachers reduces the amount of instructional time and this result in
the syllabi not being completed. This context is against the criteria of an effective
school which emphasizes that the students must stay at school and have enough time
for learning (time on task)(Galabawa, 2004). This in turn, results to lower output of
work by the pupils (Ubogu, 2004). This fact correspond to the results obtained in
Table 4.18 which indicate that the majority 50% agreed that teachers’ absenteeism
can hinder education effectiveness contrary to 34.6% who negated the statement.
One teacher said this on teachers’ absenteeism:
Teachers’ rate of absenteeism differs depending on various reasons but does exist in
every school. Think of a school located far from district headquarter where one have
to travel some distances at every end of a month for salary, will you escape to miss
classes….the answer is no! Therefore, sometime situations like this force us to miss
classes though some miss classes for personal laxity.
5.2.9 Teachers’ Motivation
Table 4.20 indicates that 54.6% of the respondents agreed that motivation of teachers
by the Government can improve or hinder education effectiveness. In contrary,
36.2% disagree while 9.2% were undecided. World Bank Report (1986)
acknowledges that teacher satisfaction is generally related to achievement… satisfied
teachers would concentrate hence enhancing academic performance of their pupils.
One female teacher said this on teachers’ motivation:

54
I believe the greatest motivation of any labor is cash but I also acknowledge in-kind
motivation though they have nothing to do with solving any economic hardship that
we face. Teachers hardly get any allowances as other officers. We live in poor
houses, teach in poor classes, live in peripheral areas but there is no any
compensation allowances given by the government……is this the way people are
motivated?! May be I have narrow understanding of what motivation is!
5.2.10 Teachers’ Work Load
The number of lessons teachers take per week out of possible 40 lessons was looked
into and results in Table 4.22 indicate that the majority of teachers 41.4% have 26-
30 lessons per week while the minority of them 2.9% and 4.3% have 40+ and 1-15
lessons per week respectively. In addition, 22.9% have 21-25 lessons per week while
teachers having 16-20 lessons and 31-40 lessons all together tally up to 14.3%. This
indicates that most teachers are not overloaded hence their output in terms of
education effectiveness should be good as results in table 4.21 show that the majority
of the respondents disagreed that teachers work load do not hinder education
effectiveness may be because of few lessons that most teachers have per week. One
parent in Namatula village said this:
The Government has significantly reduced teachers’ work load by employing more
teachers in recent years but number of teachers alone cannot bring any miracle in
education the same effort need to be placed on improving other infrastructures that
will in turn raise teachers’ working morale and commitment level!

55
The results both questionnaire and the interviews showed that the teachers have
moderate work load. This could be interpreted that the teachers could have enough
time to plan for effective lessons and explore more participatory ways in teaching to
realize high academic achievements of pupils, however this is not used as an
opportunity, instead observation has shown that the teachers use the government
working time in doing their own businesses like shops management, motoring boda
boda and taxes. This corresponds to what Babyegeya (2004) asked that how can a
teacher prepare well lessons and have enough time for marking the students’ exercise
books while he she is thinking of the taxes business in town?.
5.2.11 Pupils Frequency of Absenteeism
The aspect of how frequent pupils absented themselves from school was looked into;
Table 4.24 shows that 28.6% indicated they moderately miss school, 28.6% indicated
their rate of absenteeism is high and 42.9% indicated low. When pupils absent
themselves from school, they tend to lose many concepts and definitely may not do
well in exams. The effect of absenteeism and irregular school attendance is that
materials taught is difficult to understand when studied on one’s own. Continued loss
of classes results to loss of content and knowledge. Assignments and exercises would
not be properly and correctly done leading to poor performance (Ubogu, 2004). From
the analysis above, quite a number of pupils absent themselves from school and
therefore this could be a factor contributing to education ineffectiveness in
Nachingwea primary schools. Ubogu’s findings correspond to results obtained in this
study as Table 4.23 indicates that majority 54.7% of the respondents agreed that
pupils’ rate of absenteeism hinder education effectiveness.
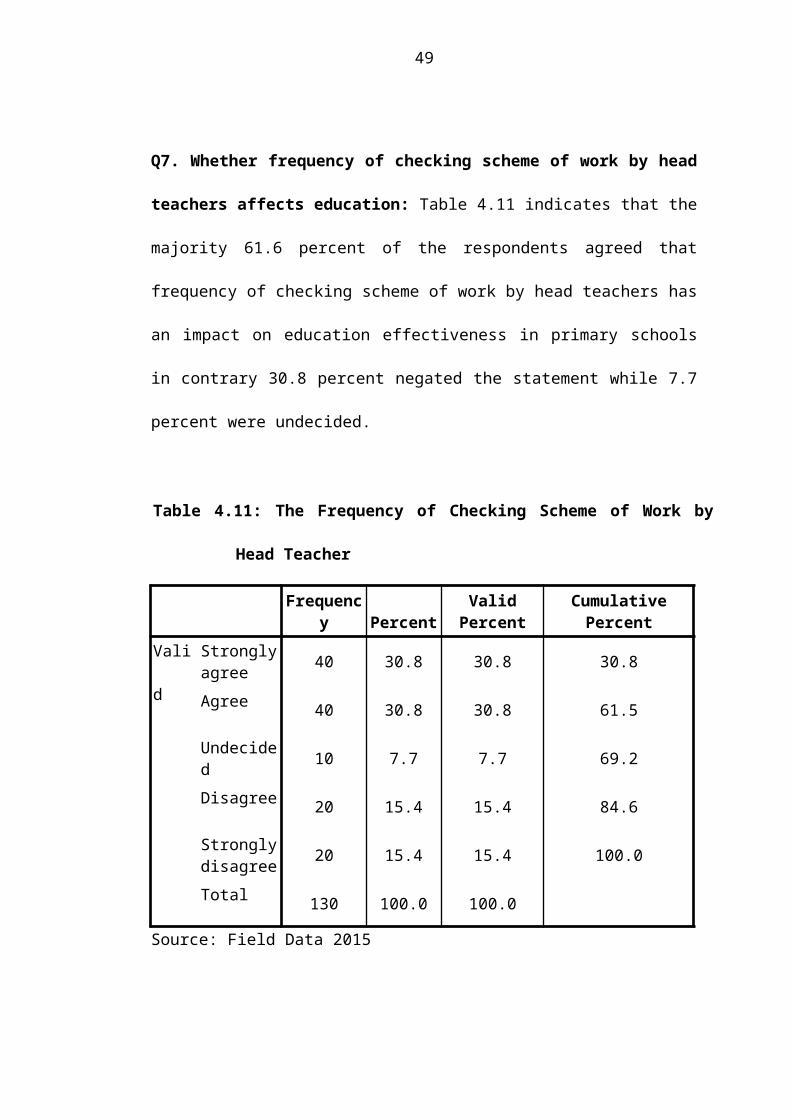
56
5.2.12 Pupils’ Lateness and Education Effectiveness
Table 4.26 indicates that the majority of the respondents 23.1 percent rated pupils’
lateness as being low in Nachingwea district while 19.2 percent and 11.5 percent
rated it moderate and high respectively. When pupils absent themselves from school,
they tend to lose many concepts and definitely may not do well in exams. The effect
of missing classes because of students’ self-lateness and irregular school attendance
is that materials taught is difficult to understand when studied on one’s own.
Continued loss of classes results to loss of content and knowledge which might in
turn lead to education ineffectiveness.
5.2.13 Parents’ Consultation with Teachers
Good performance is realized when parents work in consultation with the teachers in
order to understand their children better. The study therefore sought to find out how
often parents consult the teachers on matters pertaining their children’s education.
Table 4.28 indicates that the majority of teachers 43.7% were not consulted with
pupils’ parents in the last three months on the other hand 14.1%, 35.2% and 7.0%
were consulted with 1 parent, 2-4 parents and 5+ parents respectively. This is an
indication that most parents were not so much concerned about education of the
children. Parents’ interaction with teachers enables them to know what their children
are encountering in school and what could be done to deal with the problems. It
would also put pupils on alert and study in school as they would know that their
parents would inquire about their performance. Parents may not be able to provide

57
much guidance and help their children’s performance improve when they are
ignorant of what happens in schools.
5.2.14 Parents’ Response in the Provision of Learning Materials
Table 4.29 indicates that the majority of respondents 45.4% agreed that parents’
positive response in the provision of learning materials can help to improve
education effectiveness while 39.3% disagreed with the statement and 15.4% were
undecided. Further results on the same variable in Table 4.30 indicate that the
majority of respondents 67.7% said that parents’ response in the provision of
learning material is poor. On the other hand, 26.6% and 7.7% perceived the response
to be satisfactory and good respectively. Lack of basic school needs like learning
materials could not provide a stable mind and conducive environment for the pupils
to study. Lack of learning materials contributes to poor education. Since most
primary schools owned by the Government lack enough learning and teaching
materials, parents need to feel responsible in provision learning materials so as to
supplement the gap left by the Government. One grandfather in Nampemba village
had this to say:
Always people point fingers to the government when things get wrong in education
but to me this is not right because everyone has a part to play in improving
education. Back in our days parents used to volunteer in kind and in cash but know
days things have changed, people believe the government is responsible for
everything but to me it’s not so we need to supplement on what the government does!
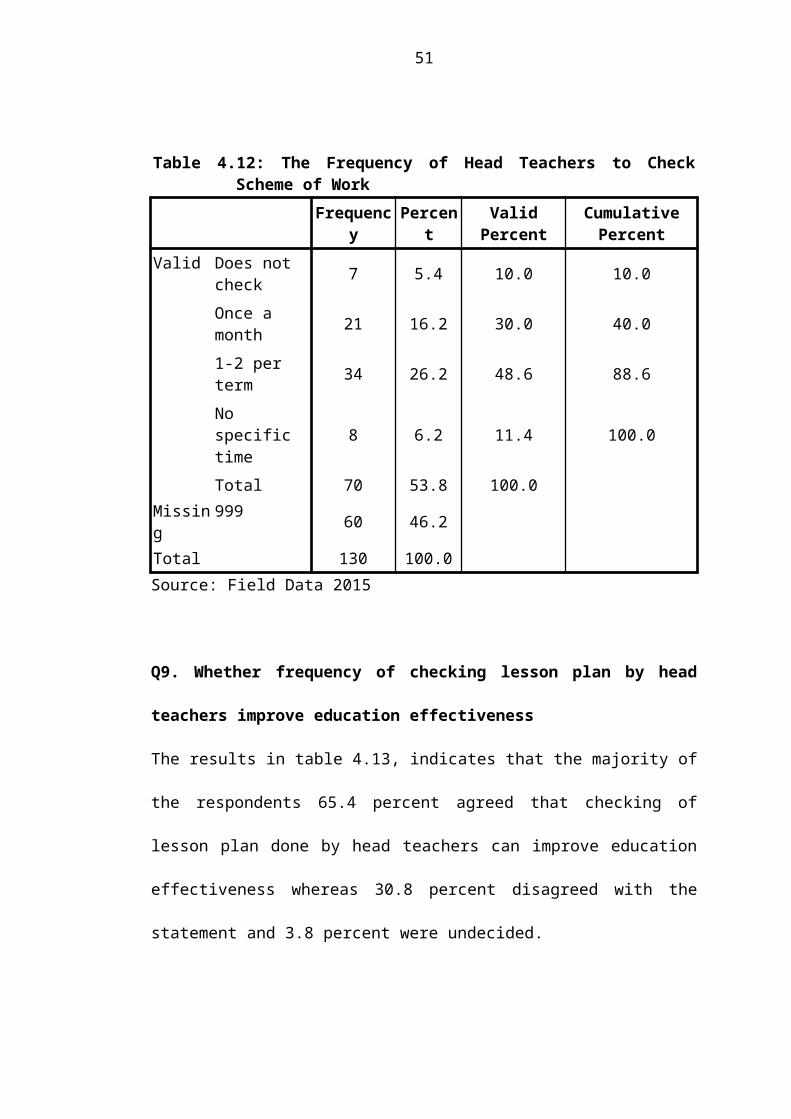
58
The above findings on the poor role played by the parents to assist their sons and
daughters to get the schools requirements was also found by (Lunas, 2013) who
established that the parents in Korogwe had not paid the needed attention to support
their sons and daughters to attend the school in Korogwe secondary schools as a
result this tendency affected those students to perform well academically.

59
CHAPTER SIX
6.0 SUMMARY, CONCLUSION AND RECCOMENDATIONS
6.1 Summary of the Study
This study investigated the factors that hinder education effectiveness in primary
school located in Nachingwea District. It utilized primary data from a total 130
respondents whereby 79 were teachers and 59 were non teachers. The body of
evidence accumulated in various literatures shows the existence of a relationship
between several characteristics and education effectiveness across societies. Mixed
design methods (questionnaire and interviews) have been applied to identify the
important predictors of education effectiveness. From these analyses several
interesting observations can be made, although the analysis itself was subject to
various types of problems including small sample size for data analysis.
Also, interpretations of the findings appear to be problematic in some cases.
Sometimes it is observed that logical or theoretical hypotheses are rejected by the
majority of respondents. Such a situation may be due to different background and
diversity of experiences from individual respondents.
6.2 Summary of the Findings
The study realized the following as factors hindering school effectiveness in primary
schools in Nachingwea district; commencement of learning, inadequate learning
resources, lack of motivation for teachers, Unyago cultural practice, absenteeism by
both teachers and pupils, pupils’ lateness, lack of support from parents, low teachers’

60
commitment level, low and randomly checking of both lesson plans, scheme of
works by head teachers and low parental participation in school issues.
6.3 Implications of the Findings
As the nations gather to take stock of the millennium development goals in 2015, the
nations have to check whether the education goal of ensuring universal primary
education has been acquired. Indeed Tanzania has done much to ensure that there is
high enrolment rate of about 97percent and the completion rate of primary education
is high.
However, with what has been established in Nachingwea District from this study it
seems that there could be pupils in schools but they are not real learning as there is
high students’ absenteeism and the time on task for student is low. This will
altogether hinder the attainment of the millennium development goals and the
philosophy of education for all (EFA) as they do not get the relevant skills they were
required to receive at the time of schooling.
Although primary school is not a significant level of education to enable the
graduates manage life challenges including development projects but to some extent
it gives the basic knowledge to the graduates to manage their own life and be
productive in life. The partial education resulted from the poor school effectiveness
in Nachingwea District will lower down the quality of the graduates and hinder the
ability of the school graduates to manage their own life including development
projects and this has impacts to the quality of the labor and their contribution to
development of the nation at large.

61
6.4 Conclusion
The results suggest that, although many education interventions are being
implemented in Tanzania, Nachingwea primary schools inclusive, their impact is still
low, particularly among the poor and the majority living in rural areas. Renewed
efforts are therefore required to address the factors that hinder education
effectiveness in Tanzania and Nachingwea district in particular. Based on the results
of this study, attention should be given to commencement of learning time (no
delays-lessons should start immediately after opening the schools), inadequate
learning resources, lack of motivation for teachers, Unyago, absenteeism by both
teachers and pupils, pupils’ lateness, lack of support from parents, low teachers’
commitment level, low and randomly checking of both lesson plan and scheme of
work by head teachers.
6.5 Recommendations
Performance of students is a product of socio-economic, psychological and
environmental factors. Education plays a significant role in political, economic and
social realms of development. From the results several variables were seen
established to hinder education effectiveness in Nachingwea. Therefore, the
following recommendations were made;
6.6 Recommendations to the Government
The Prime Ministers’ Office Regional Administration and Local Government in
collaboration with Ministry of Education and Vocational Training should motivate
teachers in terms of recommendation for promotion, subsidizing of house rents and

62
provision of hardship allowances especially for teachers who meet expectation of
students, parents and curriculum goals. Once these incentives are in place, teachers
will enjoy greater status, have much higher levels of motivation and, in turn, become
key players in implementing quality improvement initiatives that are essential if
high-quality, sustainable Universal Primary Education (UPE) is to be achieved.
The government and other stakeholders such as Non-Governmental Organizations
need to sensitize the local community to discard beliefs and practices such as Unyago
that prohibit students’ effective participation which result to education
ineffectiveness in primary schools.
To mitigate on the inadequacy of teaching/learning materials and equipments the
government needs to enhance their provisions to schools. It should extend allocation
of funds solely for purchase of learning and teaching materials. Since the government
cannot do everything on its own it has to collaborate with local communities to
supplement on what the government does this is possible through awareness creation
and educating the local communities to participate in school development but the
government can also enforce the Education Act of 1961 which among other orders
demands local authorities and communities to participate in construction of primary
schools and provision of primary education.
The time allocated for teaching and learning is a factor influencing pupils’ academic
performance but most schools loose many teaching/ learning hours at the beginning
of the term, this wastage leads to less work being covered and syllabi not being

63
completed on time hence hindering education effectiveness. The government through
responsible authorities should ensure that all teachers abide to teaching/learning time
table. School inspectors should ensure that the schools activities start immediately
after opening the schools.
6.7 Recommendation to the District Nachingwea Council
District councils through department of primary education and education audit unit
are responsible for direct monitoring and supervision of education activities in
primary schools but always get inefficient financial and physical resources to meet
their obligation including supervision activities. As shown in results, some teachers
miss classes while some head teachers fail to carry out internal supervision of
curriculum implementation in his/her school through physical observation of classes,
checking of lesson plan and scheme of work. Such poor administration in some
schools demand higher level authorities to make regular supervision in primary
schools. Therefore, the government/local government should allocate enough funds
for school inspectors that will facilitate monitoring and supervision
activities.
Pupils’ absenteeism and lateness in classes it’s a challenge that can be handled
through good collaboration of parents and teachers. Parents are responsible to make
sure their children get early in school but when children are in school it is the
responsibility of a teacher to make sure that they don’t miss lessons. Therefore,
students’ good performance is realized when parents work in consultation with the
teachers because it enable to understand their children better. Therefore, education

64
stakeholders should take measures that encourage and create awareness on
collaboration of parents and teachers.
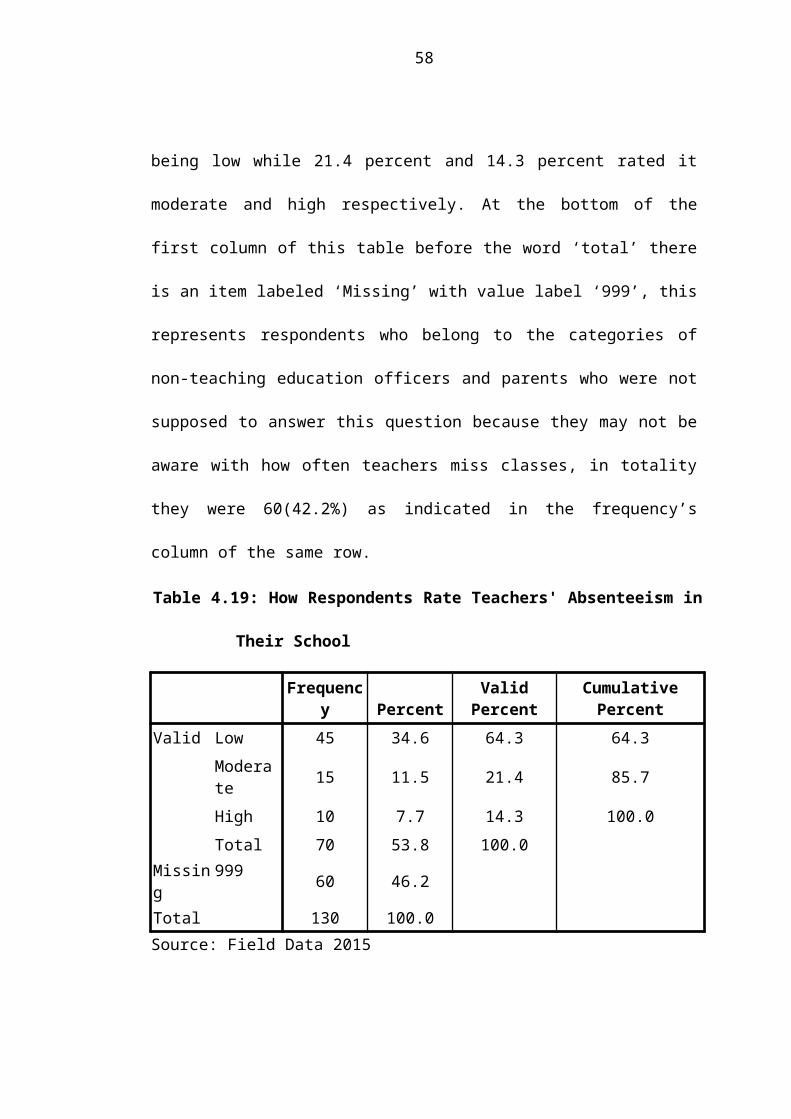
65
REFERENCES
Brock-Utne, B., (1988) A Critical Analysis of World Bank Report No. 6934:
Education Policies for Sub-Saharan Africa: Adjustment, Revitalization, and
Expansion, University of Dar es Salaam, Tanzania.
Babyegeya, E.B.N.K(2004) Education planning and administration. The Open
University of Tanzania.
Chonjo, N, P (1994) the quality of education in Tanzania primary school: assessment
of physical Facilities and teaching learning materials.
Creswell, W. J. (2003). Research design, qualitative, quantitative and mixed meth
approaches, (2nd Ed), Sage Publication, Thousand Oaks, London.
Dawn.com (2010) factors influencing school effectiveness in Pakistan. Retrieved
from www.dawn.com/news/880910/factor-influencinf-school-effectivness-in
Derrick, M (2014) limiting the school effectiveness: ten factors which limits school
effectiveness, Retrived from teaching; about .com/od/pd/a/stripping-
school-effectiveness.htm.
Eshiwani, G. S. (1983). Factors Influencing Performance among Primary and
Secondary School Pupils in Western Kenya Province. A policy study.
Bureau of Educational Research, Kenyatta University.
Faber, S (1999-2014) characteristics of ineffective schools, Retrived from
www.ehow.com/info-8653879- characteristics-ineffective-school.html
Fiel, A. (2005). Discovering Statistics Using SPSS (2nd Edition). Sage Publication
Inc. Thousand Oaks, London.
Galabawa. J (2004). School effective indicators

66
Gatsha, G. (2010). Learning support: perceptions and experiences of remote Distance
Learners from marginalized communities in Botswana, Unpublished
Doctoral Thesis University of Pretoria, Pretoria. Retrieved from
upetd.up.ac.za/thesis/available/etd- 04242010-194233.
Gottfredson, G. D., Gottfredson, D. C., Payne, A. A., & Gottfredson, N. C. (2005).
School Climate predictors of school disorder: Results form a national study
of delinquency prevention in schools. Journal of Research in Crime &
Delinquency, 42(4), 412-444.
Henderson, A. T. and Berla, N. (2004). A New Generation of Evidence: The Family
is Critical to Student Achievement. Washington DC: National Committee
for Citizens in Education.
Hill, P, W (nd) school effectiveness and improvement: an international and
Australian Perspectives centre for applied educational research faculty of
education, the University of Melbourne.
Iwu1, C, G and Iwu2, C, I (2013). Factor inhibiting effective management of primary
school in Nigeria, The case of ebonyi state, business faculty cape Peninsula
University of Technology, South Africa.
Karki, A and Bhattarai, B (2003). School effectiveness; a synthesis of indicators
(phase ii). Tripushwar, Kathmandu, Nepal Tribhuvan University.
Kathuri, M. J. (1986). Factors that Influence the Performance of Pupils in CPE.
KERA Research Report. Nairobi: Kenyatta University, Bureau of
Educational Research.
Kingdon, G, G (2008) School-Sector Effects on Student Achievement in India

67
Kirk, D. J and Jones, T. L (2004). Effective school, assessment Report, Pearson
Education Inc.
Kothari, C, R (2004). Research methodology methods and technique, second revised
edition, New Delhi, new age international (p) limited publishers.
Kothari, C. R. (1990). Research methodology: methods and techniques. New York:
Willy.pp.187-188.
Krashen, S. (1985). The Input Hypothesis: Issues and Implications, New York:
Longman.
Lezotte, L. W. (2010). What effective schools do: Re-envisioning the correlates.
Indianapolis, IN: Solution Tree.
Liu, S (2006). School effectiveness research in china: A dissertation submitted to the
graduate Faculty of the Louisiana state university and agricultural and
mechanical college; unpublished paper.
Lockheed, E. M and Langford, N (1989). A mult-level model of school effectiveness
in a developing country, working paper.
Lockheed. E, M and Levin, M, H (1993). Effective schools in developing countries
argued that developing countries, New York, Routledge 711third avenue
Newyork, NY, 10017.
Luyten, H., Visscher, A., Witziers, B. (2004). School Effectiveness Research: From
a review of the criticism recommendations for further development
University of Twente, The Netherlands Vol, 16, No 3, September 2005, pp
249-279.
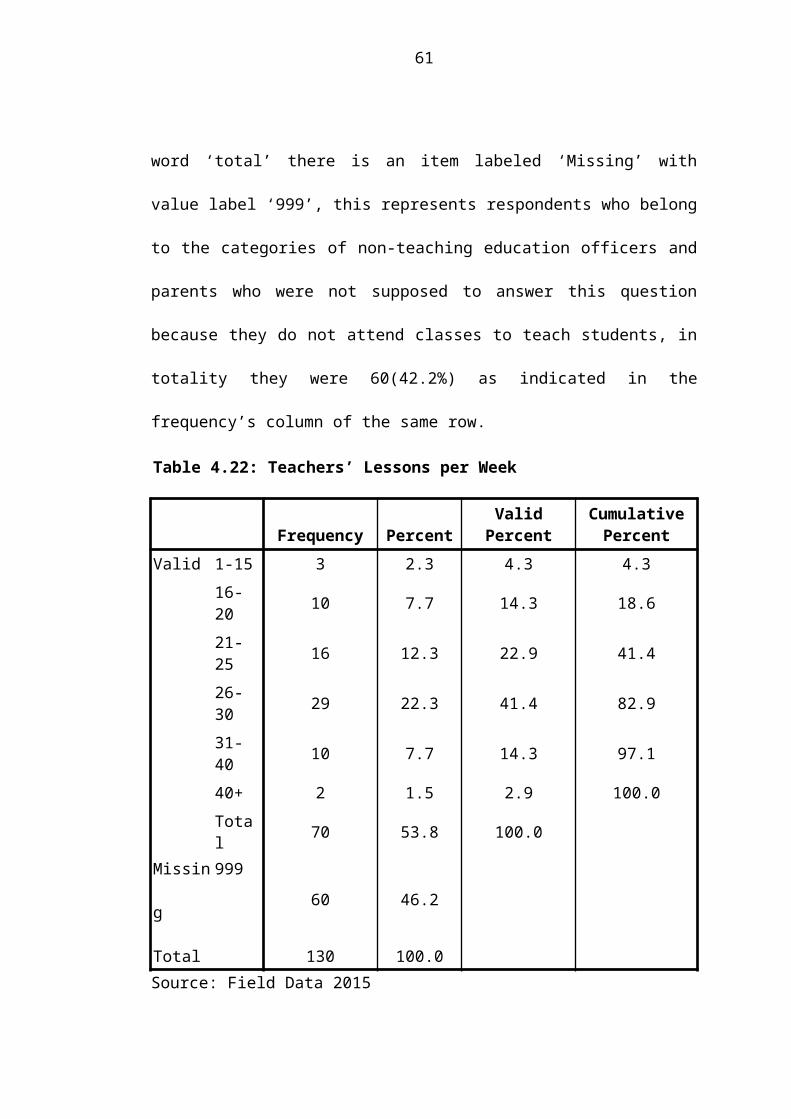
68
Mhehe, G. E. (2002). Women’s enrolment and participation issues at the Open
University of Tanzania Unpublished PhD thesis, Albata University, pp.1-
200. Makunka.
MOEC, (1995). The Tanzania Education and Training Policy, Dar es Salaam.
Nyagosha, P, O (2011). derterminants of differential Kenya certificates of secondary
education performance and school effectiveness in Kiambu and Nyeri
counties, Kenya, Research project Kenyata Unniversity
Nyerere. J. K. (1968). ‘Education for Self-Reliance’, in UJAMAA Essays on
Socialism, Dar es Salaam: OUP.
Palardy, G. J (2008). School effectiveness and school improvement. An international
journal of research, policy and practice. University of califonia, Riverside,
CA, USA.
Pam, S (1995) Characteristics of effective school: A review of school effectiveness
Research. London, univ. (England) inst of education; crown copy right.
Papaku, D, M (2007). Effective school leadership: An exploration of the issue
inhibiting the Effectiveness of School Leadership in Solomon Island’s
Secondary Schools, thesis. Masters of educational leadership. Retrieved
from research commons.waikota.ac.nz/handle/10289/2429. The University
of Waikato.
Patton, M. Q. (1990). Qualitative evaluation and research methods (2nd
Ed).Newbury Park: Sage publication, pp. 278-281.
Pennycuick, D (1993). School effectiveness in developing countries, A summary of
the research evidence-Education research paper. London university of
Sussex No.01, 1993, zsp.
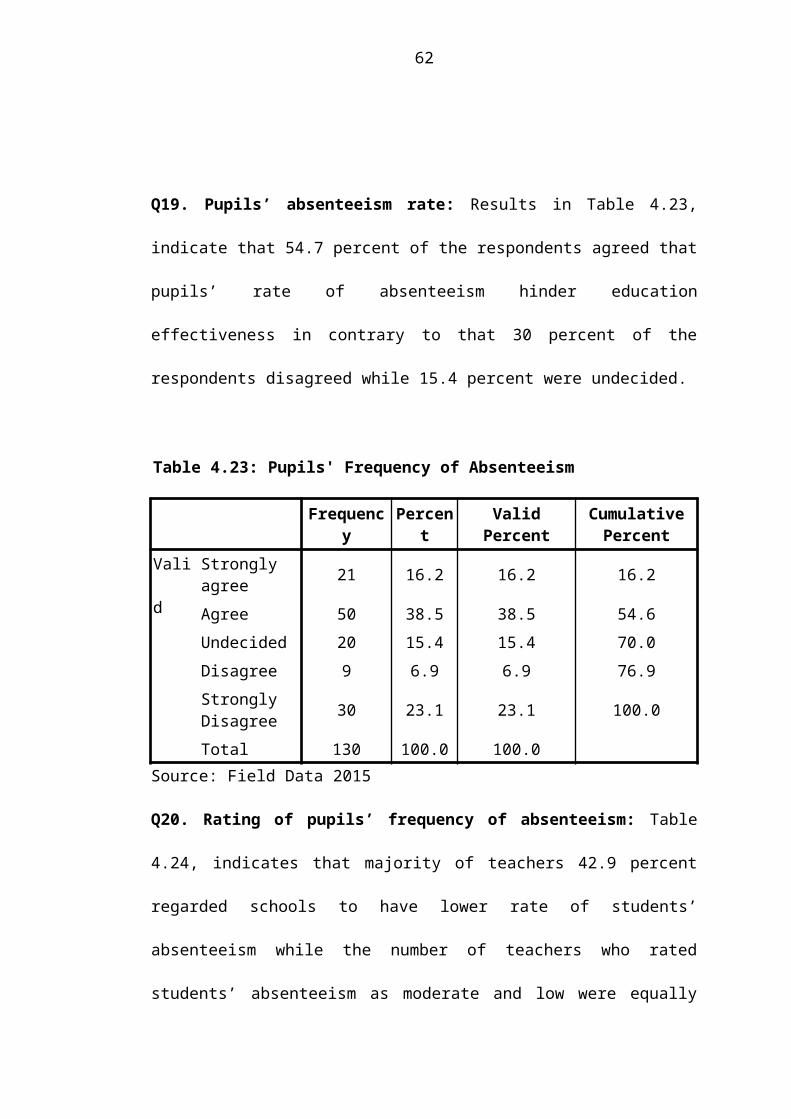
69
Rwejuna Z, R (2013). Factors affecting completion rates at the Open University of
Tanzania, Thesis.Un published doctoral thesis, the Open Universitry of
Tanzania.
Saleem, F, Naseem, Z, Ibrahim, K, Hussain, A and Azeem, M (2012). Determinant
of school effectiveness: A study at Punjab level.Pakistani, journal of
humanities and social science Vol.2 No.14.
Sammson, P. and Bakkum, L (2011). Effective schools, equity and teacher
effectiveness: Areview to the l iterature.vol 5.
Schneider, M. (2003). Do School Facilities Affect Academic Outcomes?
Washington, D. C., National Clearing house for Educational Facilities
Taylor, N (2011). The National school effectiveness study (NSES), summary for
synthesis report.
Ubogu, R. E, (2004). The Causes of Absenteeism and Dropout among Secondary
School Students in Delta Central Senatorial Districtof Delta State.
Unpublished Ph.D Thesis, Delta State University, Nigeria: Abraka.
Uline, L, C. Miller, M.D and Moran, T. M (1998). School effectiveness; the
underlying. Educational administration quarterly Vol.34, No.4 (October
1998)462-483.
USAID (nd). Using opportunity to learn and early grade reading fluency to measure
school Effectiveness in Ethiopia, Guatemala, Honduras and Nepal. Working
paper.
(19th-24th Nov, 1984). Universal primary education and village based teacher training
Programme in Tanzania, report recommendation.
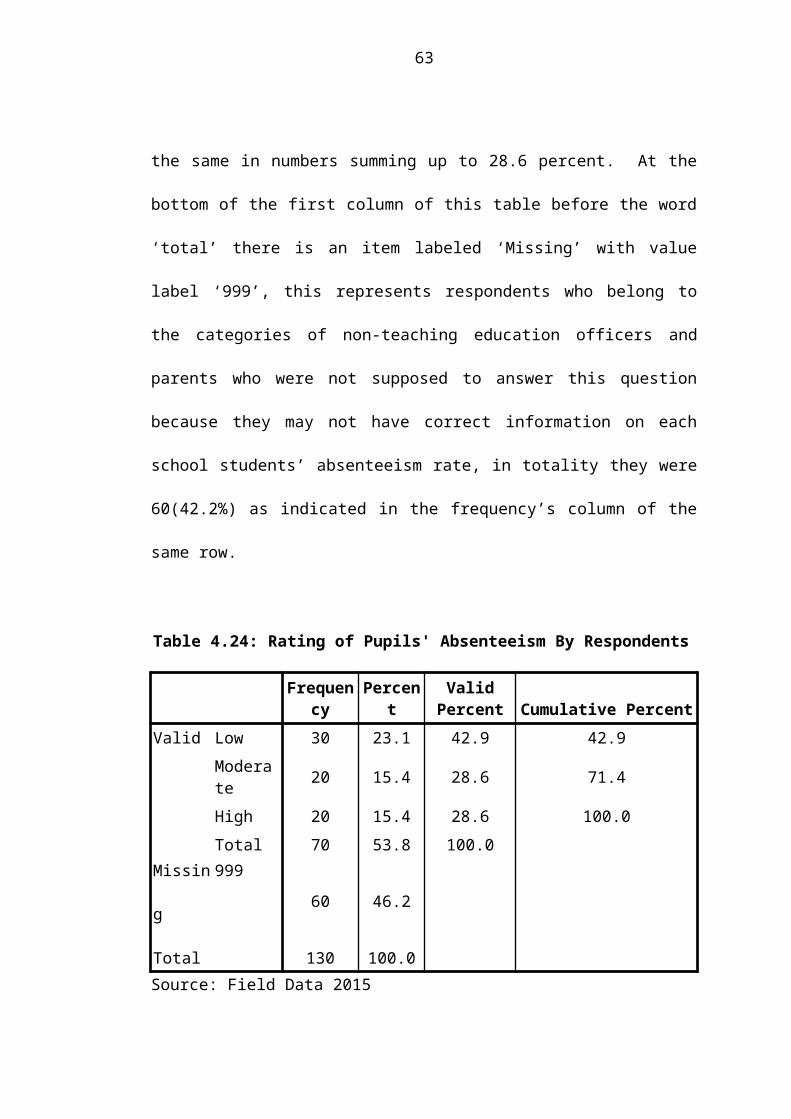
70
Wallace foundation (2009). Assessment the effectiveness of school leaders; new
directions and new process.
Ward, M. (2006). Education reform in Uganda reflection on policy partnership,
strategy and Implementation, Uganda, wwwdfid.gov.uk.
Warwick. D.P and Reimers, F (1995). Hope despair? Learning in Pakistani primary
schools. USA, Greenwood publishing group INC.
Yu, G (2007) Research project-school effectiveness and education quality in
southern and east Africa.working paper 12.
Zoe, A Barley, Z, A Andrea, D and Beesley, A, D (2007). Rural school success what
can we learn? Journal of research rural education, 22(i).
Zuze, L, T (2008). Equity and effectiveness in east African primary schools, Thesis
presented for the degree of doctor of philosophy in the department of
economics university of CapeTown.

71
APPENDICES
APPENDIX 1: QUESTIONNAIRE
1. Do you think commencement of learning after school holiday can determine
education effectiveness?
a). Strongly agree
b). Agree
c). Undecided
d). Disagree
e). Strongly disagree
2. When did you start lessons after school holiday?
a). 1-2 days
b). 3-5days
c). 6+
3. Do you think adequacy of learning and teaching materials is one of the
factors affecting school effectiveness?
a). Strongly agree
b). Agree
c). Undecided
d). Disagree
e). Strongly disagree
4. Are teaching and learning materials adequate in your school?
a). Yes
b). No

72
c). I don’t know
5. Can frequency of staff meeting in a term affect education effectiveness?
a). Strongly agree
b). Agree
c). Undecided
d). Disagree
e). Strongly disagree
6. How frequently are staff meeting held in your school?
a). Daily
b). Twice a week
c). Once a week
d). Once a month
e). No specific time
7. Do you think frequency of checking teachers’ scheme of work has an effect
on school effectiveness?
a). Strongly agree
b). Agree
c). Undecided
d). Disagree
e). Strongly disagree
8. How frequently does your teacher check teachers’ scheme of work?
a). Does not check
b). Once a month
c). Twice a month

73
d). 1-2 per term
e). No specific time
9. Do you think frequency of checking teachers’ lesson plans is a factor
affecting education effectiveness?
a). Strongly agree
b). Agree
c). Undecided
d). Disagree
e). Strongly disagree
10. How frequently does your head teacher check teachers’ lesson plan?
a). Does not check
b). Once a month
c). Once a term
d). No specific time
11. Observation of classes by head teachers can be a determinant of school
effectiveness in primary schools?
a). Strongly agree
b). Agree
c). Undecided
d). Disagree
e). Strongly disagree
12. How many times has your teacher observed classes in the last one month?
a). Once
b). 2-4
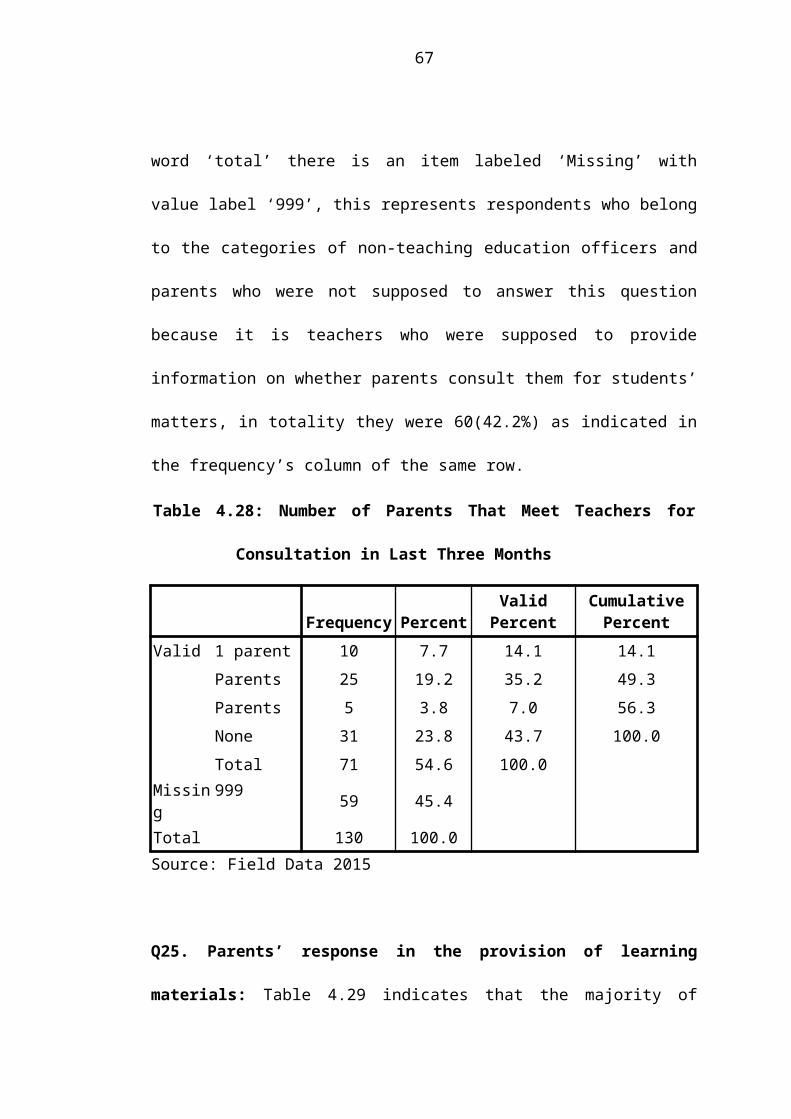
74
c.). Not at all
13. Teachers’ commitment level can have influence on education effectiveness?
a). Strongly agree
b). Agree
c). Undecided
d). Disagree
e). Strongly disagree
14. Do you think teachers’ absenteeism is among the factors affecting education
effectiveness?
a). Strongly agree
b). Agree
c). Undecided
d). Disagree
e). Strongly disagree
15. How do you rate frequency of teachers’ absenteeism in your school?
a). Low
b). Moderate
c). High
16. Do you think motivation of teachers by the government can determine
education effectiveness?
a). Strongly agree
b). Agree
c). Undecided
d). Disagree
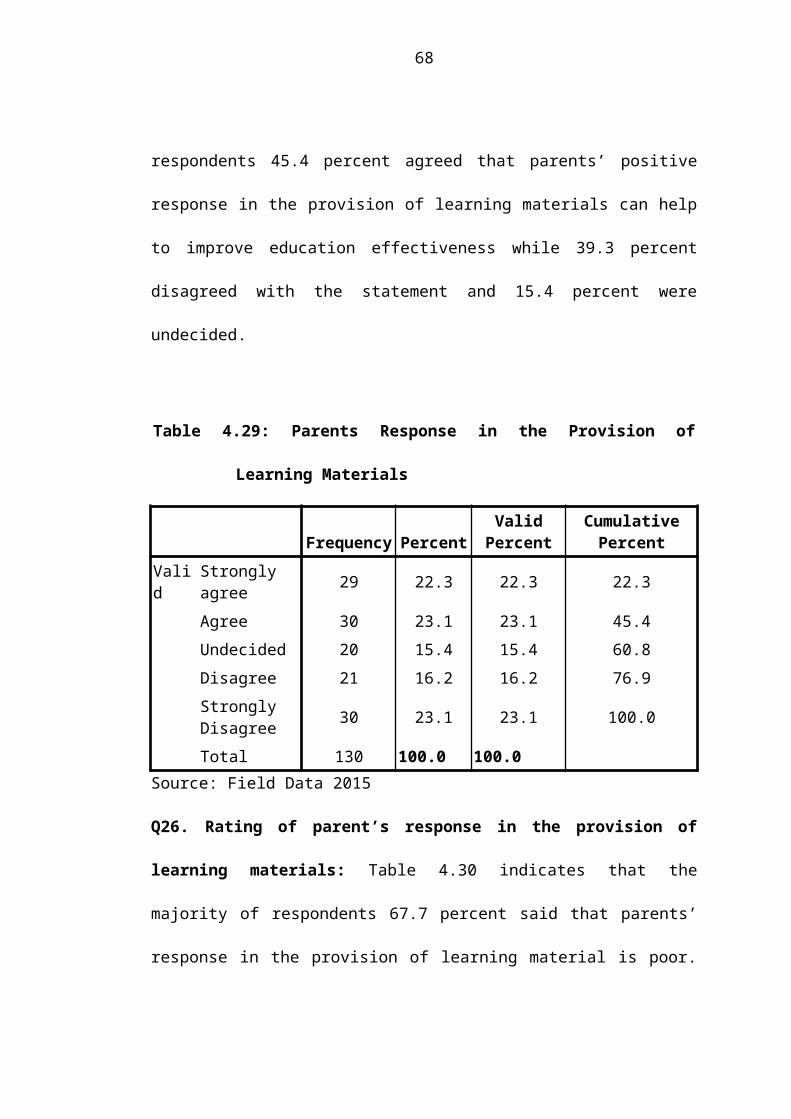
75
e). Strongly disagree
17. You as a teacher do you feel being motivated by the government?
a). Yes
b). Not at all
c). I don’t know
18. Do you think teachers’ work load as measured by lessons taken per week can a
determinant of education effectiveness?
a). Strongly agree
b). Agree
c). Undecided
d). Disagree
e). Strongly disagree
19. How many lessons do you have per week?
a). 1-15
b). 16-20
c). 21-25
d). 26-30
e). 31-40
f). 40+
20. Is pupils’ frequency of absenteeism a determinant of education effectiveness?
a). Strongly agree
b). Agree
c). Undecided
d). Disagree
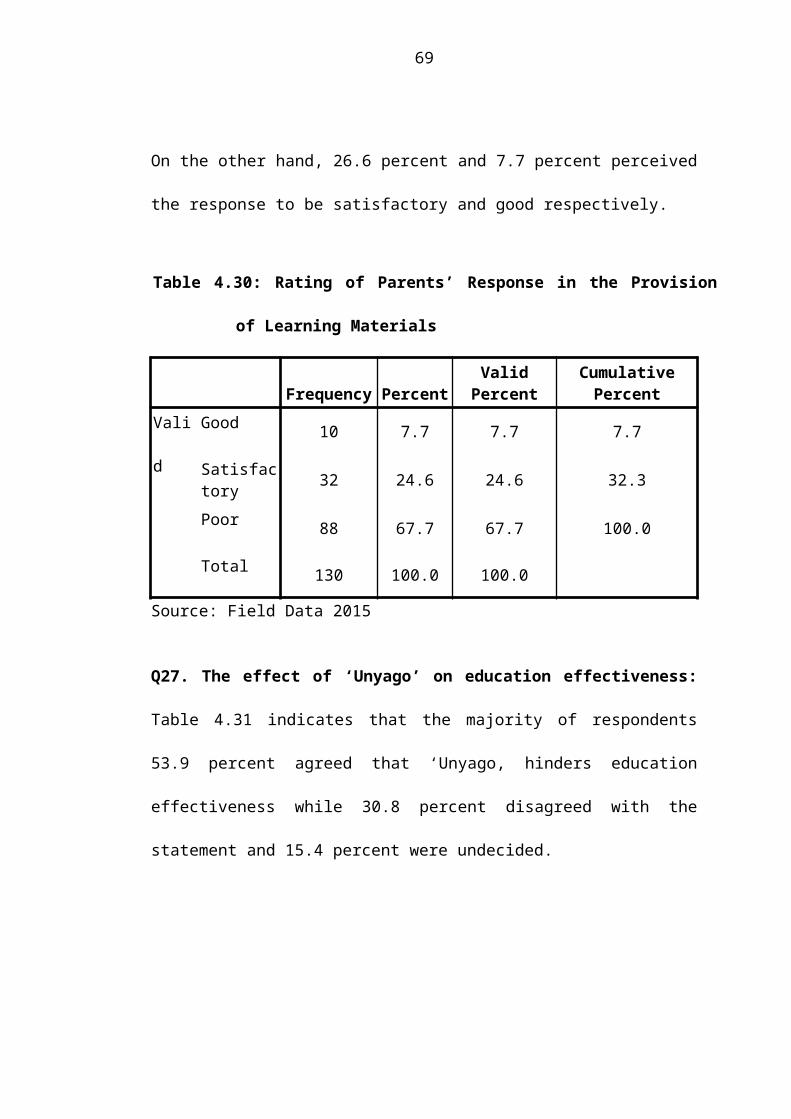
76
e). Strongly disagree
21. How do you rate frequency of students’ absenteeism in your school?
a). Low
b). Moderate
c.). High
22. Dou you think pupils’ lateness can determine education effectiveness in primary
schools?
a). Strongly agree
b). Agree
c). Undecided
d). Disagree
e). Strongly disagree
23. How do you rate pupils’ lateness in your school?
a). Low
b). Moderate
c). High
24. Parents consultation with teachers can be a factor that affects education
effectiveness?
a). Strongly agree
b). Agree
c). Undecided
d). Disagree
e). Strongly disagree
25. How many parents have consulted you in the last three months?

77
a). 1
b). 2-4
c). 5+
d). No one
26. Do you think parents’ response to the provision of learning material can
influence education effectiveness?
a). Strongly agree
b). Agree
c). Undecided
d). Disagree
e). Strongly disagree
27. How do you rate parents’ response to the provision of learning materials?
a). Good
b). Satisfactory
b). Poor
28. Do you think parents’ willingness to participate in school development can affect
education effectiveness?
a). Strongly agree
b). Agree
c). Undecided
d). Disagree
e). Strongly disagree
29. Do you think parents are willing to participate in school development?
a). Willing

78
b). Not willing
30. Do you think traditional practices like “Unyago” can determine education
effectiveness in primary schools?
a). Strongly agree
b). Agree
c). Undecided
d). Disagree
e). Strongly disagree
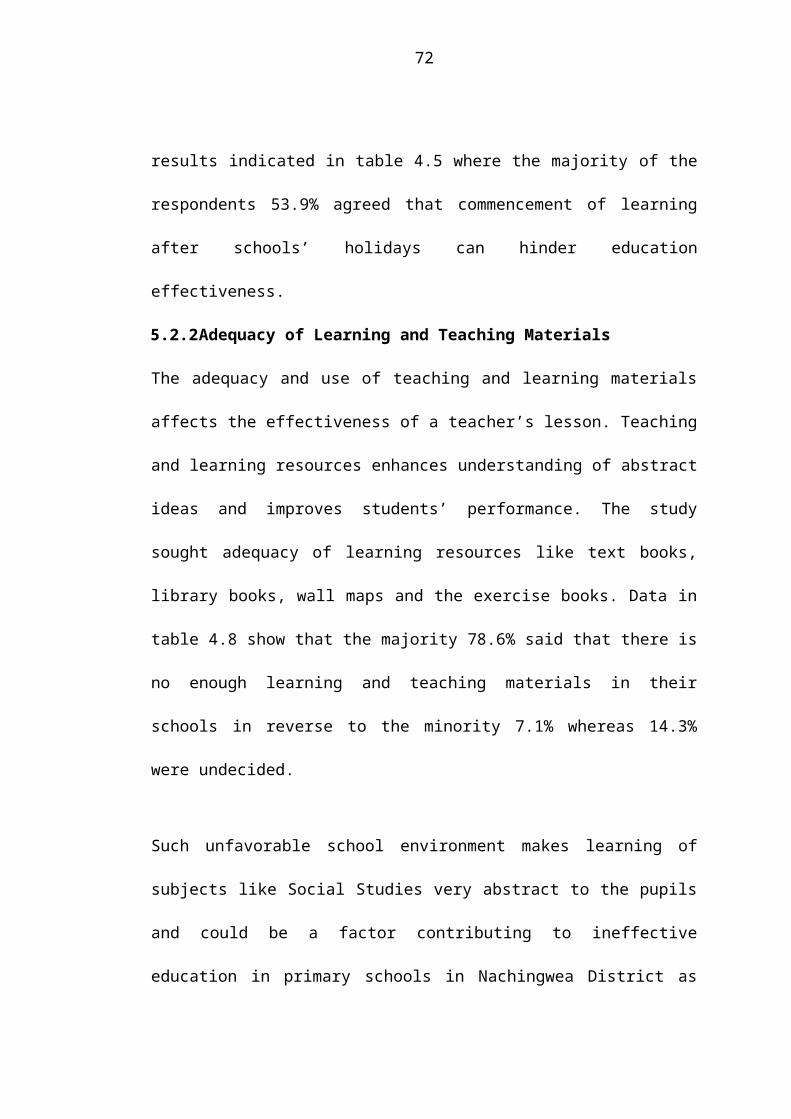
79
APPENDIX 2: INTERVIEW QUESTION
Q Explain on the factors that hinder school effectiveness in Nachingwea Primary
schools
Are they related to students?
Parents?
School administration or
Teachers? How?

80
APPENDIX 3: RESEARCH CLEARANCE LETTER
THE OPEN UNIVERSITY OF TANZANIA
DIRECTORATE OF RESEARCH, PUBLICATIONS AND POSTGRADUATE
STUDIES
15th August, 2014P.O. Box 23409Dar es Salaam, Tanzaniahttp://www.out.ac.tz 15th August, 2014
To Whom It May Concern
RE: RESEARCH CLEARANCE
This is to certify that Mr. Christopher Alfred Ndali has been granted permission to conduct research on “Factors Hindering School Effectiveness in Tanzania: A case of Nachingwea District, Lindi”. This permission allows her to conduct research in Schools and community members in Nachingwea District in connection with the research. This is in accordance with the Government circular letter Ref. No. MPEC/R/10/1 dated 4th July, 1980; the Vice Chancellor was empowered to issue research clearance to the staff and students of the University on behalf of the Government and the Tanzania Commission for Science and Technology, a successor organization to UTAFITI. This permission is granted for the period between 15th August and 14th October, 2014. We thank you in advance for your cooperation and facilitation of this research activity.Yours sincerely,
Prof. S. A. MbogoFor: VICE CHANCELLORTHE OPEN UNIVERSITY OF TANZANIA

81
APPENDIX 4: PERMISSION LETTER
HALIMASHAURI YA WILAYA YA NACHINGWEA
( Barua zote zitumwe kwa Mkurugenzi Mtendaji (W)
MKOA WA LINDI Simu :0732 933112Fax:0732 933112Email:Nachingwea [email protected]
S.L.P 291,NACHINGWEA18/09/2014
Kumb.Na.LG.E10/50/VOL.VI/125
Prof. S .A. MbogoDirector of postgraduate studies.S.L.P 23409The open university of TanzaniaDAR ES SALAAM
YAH: UTAMBULISHO WA NDUGU CHRISTOPHER ALFRED NDALI KUFANYA “RESEARCH”
Husika na kichwa cha habari hapo juu pia rejea barua yenye Kumb. Na MPEC/R /10/1 ya tarehe 15th august 2014
Nanachukua nafasi hii kukujulisha kuwa amekubaliwa kufanya “utafiti” katika halimashauri ya wilya ya Nachingwea
Ahsante
Nakala:Christopher Alfred Ndali – Muda ukiwadia fika katika ofisi hii ya Utumishi kwa Maelekezo


![1202 mccormack[1]](https://img.pdfslide.us/doc/110x75/54944385b479594c4d8b4a55/1202-mccormack1.jpg)