Embed Size (px)
Citation preview
Tim Grant at the Centre for Design at RMIT
The Olympic stadium analysed using the DPWS tool
This case study shows how a large scale building project used LCA to information its design and material selection The LCA was carried out prior to the design of the building in the DPWS tool with the Boustead 3 model using various sources of data It required the input of the materials used and their alternatives and an estimate of the energy and water used by the building The LCA project resulted in a building which minimised its impact on the environment and provided a benchmark for other stadium projects The LCA was also used to showcase the green games internationally
Summary Introduction Using LCA Goal and scope Functional Unit System boundary Assumptions Data Results Discussion Conclusion Acknowledgments and References
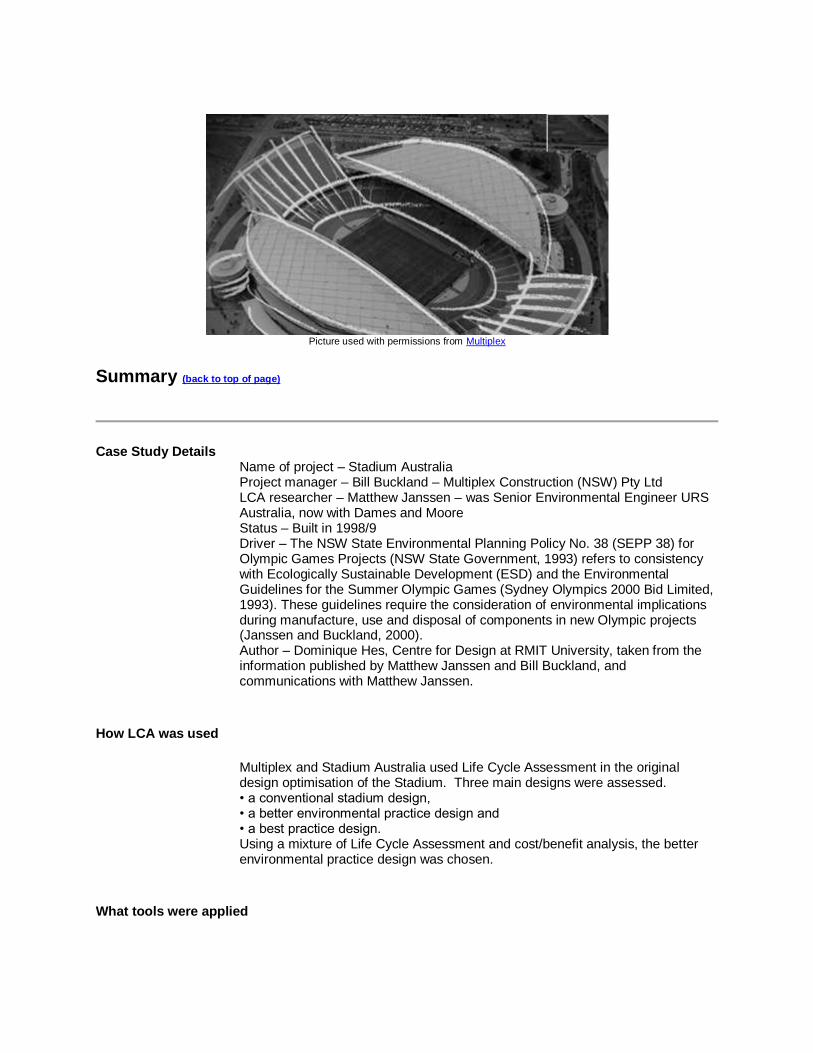
Picture used with permissions from Multiplex
Summary (back to top of page)
Case Study Details Name of project ndash Stadium Australia Project manager ndash Bill Buckland ndash Multiplex Construction (NSW) Pty Ltd LCA researcher ndash Matthew Janssen ndash was Senior Environmental Engineer URS Australia now with Dames and Moore Status ndash Built in 19989 Driver ndash The NSW State Environmental Planning Policy No 38 (SEPP 38) for Olympic Games Projects (NSW State Government 1993) refers to consistency with Ecologically Sustainable Development (ESD) and the Environmental Guidelines for the Summer Olympic Games (Sydney Olympics 2000 Bid Limited 1993) These guidelines require the consideration of environmental implications during manufacture use and disposal of components in new Olympic projects (Janssen and Buckland 2000) Author ndash Dominique Hes Centre for Design at RMIT University taken from the information published by Matthew Janssen and Bill Buckland and communications with Matthew Janssen
How LCA was used
Multiplex and Stadium Australia used Life Cycle Assessment in the original design optimisation of the Stadium Three main designs were assessed bull a conventional stadium design bull a better environmental practice design and bull a best practice design Using a mixture of Life Cycle Assessment and costbenefit analysis the better environmental practice design was chosen
What tools were applied
The LCA was carried out using a software tool by the NSW Department of Public Works and Services based around the Boustead 3 model but using Australian data
Data
Data was collected using a questionnaire and integrated into the contractual arrangements Further data was collected from invoices receipts monthly reports manufacturers and suppliers This was supplemented by data from product literature other projects and international databases
Results of applying LCA
The result of the LCA was an improved design resulting in annual primary energy savings of 30 Added to this the use of gas cogeneration led to a 37 reduction in greenhouse gas emissions when compared with conventional design (Janssen 1999) There was a 13 reduction in water use with 77 of water used being sourced either from onsite recycling or onsite water collection Further the LCA aided in the selection of materials and the prioritisation and evaluation of initiatives Finally it allowed compliance with the ESD requirements placed on the project
Comment - Life Cycle Assessment provides a number of opportunities for building design professionals and product manufacturers These include incorporating
environmental considerations into design improving and marketing environmental performance (pg 6 Janssen 1998)
Introduction (back to top of page)
Stadium Australia is the most famous example of an Australian building which actively used Life Cycle Assessment as part of its design and construction process This case study outlines the Goal Scope Inventory and Results used and looks at the experience as documented in public literature
The building Stadium Australia is the centre piece of the Homebush Bay Olympic site It was built for the 2000 Olympic Games in Australia and will hold sporting events and concerts for over 50 years to come
Building details The Stadium seated 110000 spectators during the games with temporary stands at the north and south ends Once the games were concluded the stadium seating was reduced to 80000 It has seven floor levels and a basement and houses restaurants lounges private boxes and two large banquet halls as well as public areas Four large 12 m diameter circular access ramps flank the building It has a 30000 m2 elliptic shaped roof supported by two 14 m deep tapering steel trusses anchored in concrete thrust blocks and covered with translucent polycarbonate sheeting with four levels of opacity to filter the sun[1]
Construction Information
Capacity 110000 (Olympic) 80000 (post Olympics) Highest Point 58 metres above ground level Site Area 16 hectares Olympic Track Area 120 metres wide 197 metres long Roof size 30000 sqm Roof weight 4100 tonnes Main arch span 2956 metres Construction Obayashi CorporationMultiplex Constructions Design Bligh Lobb Sports Architects Construction began September 1996 Construction completed March 1999 Cost $690 million Original site use Main cattle holding yards for Homebush Abattoirs Soil moved 55000 cubic metres Largest crane lift 250 tonnes (to lift main arch) Concrete used 90000 cubic metres Concrete truckloads required 18000 Structural steel 12000 tonnes Reinforcing 10000 tonnes Peak construction workforce 1500 workers Number of levels 7 No of seats undercover 60000 Capacity of end stands 30000 Number of piles 2600 Length of electrical cabling 180km No of masonry blocks 1000000
Using LCA (back to top of page)
LCA was used for Stadium Australia because the Planning Policy for Olympic games projects No 38 (SEPP 38)[2] refers to compliance with Ecologically Sustainable Development (ESD) and the Environmental Guidelines for the Summer Olympic Games [3] These required that the project consider the environmental impact during the life of the project that is the manufacture use and disposal of materials Multiplex Construction used LCA to quantify Stadium Australiarsquos environmental performance
LCA is a method which ldquocan be used to quantify and assess the environmental impact of any product system or service It is well suited to describing the environmental impact of buildings
and their associated serviceshelliphelliphelliphellip LCA provides a way to quantify the relative importance of building use compared to the rest of the buildingrsquos life cyclerdquo (Janssen 1998)
The LCA was carried out by the New South Wales Department of Public Works and Services and ERM Mitchell McCotter[4] The results were used in detail to inform the design process and in summary as documentation to verify meeting the Planning Policy to demonstrate responsibility to the various environmental interest groups and finally to document the green games as an example for others to follow
From the October 1998 Study Stadium Australia Life Cycle Assessment (inventory results) provided by ERM for use in this case study[15]
Life cycle assessment has a number of uses including
reviewing options aiding decision and policy making preparing environmental management plan and programs marketing products or services on an environmental basis improving design
Overall life cycle assessment assists in considering environmental impacts holistically and can be used in conjunction with other environmental assessment management and decision making tools (pg 2)
The methodology employed for this life cycle assessment is in accordance with ASNZS ISO 140401998 Environmental Management - Life cycle assessment - Principles and framework
This LCA study presents an inventory of results of environmental inputs (raw materials and energy) and outputs (air and water emissions and solid waste) from the systems illustrated in Figure 21 (figure 1) below These inputs and outputs have potential environmental impacts
The scope of the study is limited to reporting the quantities of these inputs and outputs No life cycle impact assessment has been carried out on the results
The assumptions made in carrying out the study are summarised in Appendix B (pg 19)
Scope (back to top of page)
Goal The goal of the LCA on the Stadium was to quantify the impacts of the building throughout its life in order to minimise them Specifically to quantify raw material use energy use emissions to air and water and solid wastes into an inventory of results[5]
Scope The Stadium could seat 110000 spectators during the games with temporary stands at the north and south ends Once the games concluded the stadium seating was reduced to 80000 seats It has seven floor levels and a basement and houses restaurants lounges private boxes and two large banquet halls as well as public areas
The areas covered by the life cycle assessment of the Stadium included
procurement (raw material extraction manufacture and transport) of the building systems
construction and reconfiguration operation and maintenance for a fifty year design life and demolition (Janssen 1999)
This study has been conducted on Stadium Australia over its whole life cycle This includes
total life cycle procurement of the building systems construction and reconfiguration operation and maintenance
demolition
This LCA study presents an inventory of results of environmental inputs (raw materials and energy) and outputs (air and water emissions and solid waste) from the systems illustrated below These inputs and outputs have potential environmental impacts
The scope of the study is limited to reporting the quantities of these inputs and outputs No life cycle impact assessment has been carried out on the results [6]
Functional Unit (back to top of page)
As the LCA was used to quantify the impacts of the current design for optimisation purposes the functional unit was the provision of a stadium for 50 years This LCA further split the functional unit per life cycle stage These are summarised below[7]
General - Each stage of the life cycle assessment is based on a functional unit to which all the results are referenced These are detailed below
Total Life Cycle - The functional unit for the total life cycle was the sum of the functional units for procurement construction and reconfiguration operation and maintenance and demolition stages
Procurement - The functional unit for the procurement stage was the raw material extraction processing and transport of the major building materials to the Stadium site
Construction and reconfiguration - The functional unit for this stage was the construction of the Stadium (ie the building systems considered in Procurement) and the reconfiguration of the Stadium post-Olympics
Operation and maintenance - The functional unit for this stage was the operation and required major maintenance of the Stadium over its fifty year design life to accommodate up to 110 000 spectators during the Olympics and up to 80 000 spectators post-Olympics The results of this stage of the Stadiums life cycle are directly dependent on the forecast use of the Stadium in terms of numbers of events and spectators per year
Demolition - The functional unit for this stage is the demolition of the Stadium at the end of its design life of fifty years
System boundary (back to top of page)
The system boundaries were defined by the following diagram published in the paper written by Matthew Janssen for a construction conference in 1999 (Janssen 1999) This suggests that the project looked at the impacts of the materials (including transport) the use of the materials the usemaintenance of the building and the disposal of the building and their associated emissions without aggregating them
Figure 1 - Depiction of the system boundary from Janssen 1999
Figure 12 Schematic of the LCA process and system boundary (ERM 1998)
Building system procurement This includes the first 3 boxes in Figure 1 extraction of raw materials manufacture of the products and systems and transport All major processes which were required to procure the building systems such as the production of energy and intermediate transport were also included
In summary the sub-systems were aggregated as follows
Concrete systems insitu concrete pre-cast concrete bored piles retaining walls
Steelwork systems hand rails barriers gates and other steelwork facade metal cladding structural steelwork
Ceiling and wall systems masonry block walls cement render
plasterboard fibreboard tiling glasswork interior paintwork
Seating and roof systems stadium seating polycarbonate roof
Building services systems hydraulics system mechanical and air conditioning system electrical system fire service system stormwater system
Other systems lifts and escalators arena track
Excluded Soft furnishings were excluded from the study Also any systems outside the boundary of the Stadium such as the precinct works and outbuildings were excluded In all cases systems excluded were considered minor in relation to the overall works
Stadium construction and reconfiguration The fourth box in Figure 1 considered
Waste management waste to landfill waste to reuse or recycling
Energy use diesel and gas fuel for construction and demolition machinery electricity
Water use potable town water recycled stormwater
Raw materials additional systems added in reconfiguration
All activities involved in the construction of the Stadium were contained in the study including crushing the existing concrete cattleyards during site establishment
As the LCA was conducted during construction site specific data was used from early 1996 on the waste production and energy and water use Projections then had to be made from mid-1998 to early 1999 when the Stadium was completed
This life cycle stage also took account of the reconfiguration of the Stadium to the post Olympics 80000 seat mode Including the demolition of the upper level temporary North and South stands and the extension of the polycarbonate roof structure
Operation and maintenance The operation and maintenance issues considered over the fifty year design life of the Stadium as shown by the fifth box in Figure 1 are listed below
Energy use for the following systems
heating and hot water cooling and air conditioning cogeneration system lighting power kitchen facilities lifts and escalators
Waste management waste to landfill waste to recycling compostible waste
Water use potable town water recycled water water collected on site
Maintenance of the Stadium replacement of systems as required waste produced in maintenance
Stadium demolition The final box in Figure 1 dealt with the end of life scenario for the Stadium after 50 years The main issues considered were
Energy use for demolition machinery diesel fuel electricity
Waste management waste to landfill waste to reuse or recycling
Assumptions (back to top of page)
From the October 1998 Study Stadium Australia Life Cycle Assessment (inventory results) provided by ERM for use in this case study [15]
B1 GENERAL
This appendix documents the major assumptions made in this LCA and forms part of the scope and system boundary of the study Detailed assumptions on building material manufacturing processes contain confidential information and are not included in this report
B2 TOTAL LIFE CYCLE middot only the major building systems are included (see listing in Appendix C) middot furnishings and fitout are not included middot input data is sourced from suppliers and is product and site specific where possible middot where site specific data is not available generic LCA data for similar products and processes is used middot the results are aggregated for the whole life cycle of the Stadium B3 PROCUREMENT Energy middot annual energy use and production data are used where possible to average out seasonal variations middot country specific energy production data are used for overseas products middot state specific energy production data are used for Australian products Transport middot all intermediate transport is included for the movement of raw materials intermediate and final product to the Stadium B4 CONSTRUCTION AND RECONFIGURATION B41 Waste
middot the waste data was obtained from on-site recycling and monitoring data middot waste is specified as either a type of solid waste which requires disposal or solid waste for recycling middot waste is not attributed to individual systems but for the Stadium construction as a whole middot estimates on the waste produced during reconfiguration are made on the same basis as the demolition of the Stadium as discussed in Section B62 B42 Energy middot energy use data was obtained from on-site records and estimates middot the energy use is not attributed to individual building systems but for the Stadium construction as a whole B43 Water middot water use data was obtained from on-site records and estimates middot the water use is not attributed to individual building systems but for the Stadium construction as a whole middot recycled stormwater is collected in ponds and primarily used for dust suppression during construction B44 Air emissions middot the main air emissions considered are volatile organic compounds (VOCs) from the paintwork middot dust from construction was not considered in the study as it was not possible to calculate the actual mass moving off the construction site With the magnitude and number of developments occurring in the Homebush Bay area it is difficult to determine the source and extent of dust from individual sites B5 OPERATION AND MAINTENANCE
B51 Stadium use middot the energy water use and solid waste output is based on the estimate of Stadium use in terms of number of events and spectators per year This data was supplied by Multiplex middot the results of this study are dependent on this estimated usage and will vary significantly if the estimates change middot the Stadium is assumed to have an operational life of 50 years B52 Energy middot annual energy use for the Stadium operation was estimated by Rudds Pty Ltd and supplied by Multiplex for use in this LCA study The estimate of energy use per year is given in Table B1 below middot transport of spectators to and from the Stadium is not included
B53 Table B1 Estimated annual energy use by function
Function Electricity
(GJyear) Gas
(GJyear) Total
(GJyear)
Heating and hot water 1100 300 1400
Cooling and air
conditioning 18000
18000
Cogeneration
39100 39100
Power 400
400
Lighting 400
400
Kitchen 900 8400 9200
Lifts and escalators 800
800
Total 21300 47700 68900
B54 Air emissions
The air emissions for the Stadium during its operation are primarily determined by its energy use and the source of that energy The assumed source and energy use for fifty years of operation is as shown in table B1 If the energy use or source of energy changes in that time the quantity and type of air emissions will be different
B55 Waste
the estimate of mass of waste generated per spectator per event was taken from the Tower Hill Investment Management Ltd (1998) report into solid waste management during Stadium operation
this estimate is 08 kg per spectator per event and is divided into the proportions given in Table B2
coupled with the estimated annual usage of the Stadium the total annual masses of solid wastes and recyclables produced are calculated as shown in Table B2
Table B2 Annual spectator solid waste
Waste type Mass
proportion Total tonnes per
year
Compostible 40 800
Paper and board to recycling 31 300
Glass aluminium PET and steel to
recycling 16 600
Landfill 13 300
compostible waste is assumed to be separated at the source If facilities are available in Sydney this waste will be composted and reused If no facilities are built this waste will most likely go to landfill
B56 Air and water emissions middot no allowance for air or water emissions other than those produced due to energy use are included for the operation of the Stadium
B57 Maintenance middot the maintenance requirements were taken from schedules developed by Domain Consulting for Multiplex middot only maintenance requiring replacement of building materials is included in this study This includes repainting refurbishment and replacement of systems as required middot cleaning was not incorporated in the study as it is highly variable different for each system and difficult to quantify middot air emissions (VOCs) for repainting are included in the study
B6 DEMOLITION B61 General For the purposes of this study it is assumed the Stadium will be demolished in fifty years time However this may not actually happen The Stadium may have a shorter or longer lifespan depending on future circumstances
This life cycle stage has the lowest data quality as it relies on forecasts of building material and waste management practices in fifty years For example the assumed high percentage of concrete recycling may not be accurate if there is no use for concrete products in fifty years
However these estimates are based on indications from current practices and the expectation that reuse and recycling of demolition materials will expand in the future due to depletion of scarce natural resources
B62 Waste middot a high degree of deconstruction and recycling is assumed for the Stadium based on communication with demolition experts For example approximately 99 of the concrete and steel is assumed to be reused recycled or downcycled as they may be valuable commodities in fifty years time middot materials are considered to the stage where they are taken off site Waste treatment or the energy involved in transport or recycling other than concrete crushing on site are not included middot the mass of waste to landfill or recycling is balanced against the mass of materials brought to the Stadium in the building system procurement stage B63 Energy middot all of the concrete is assumed to be crushed on site and the energy requirement for this is included middot the deconstructiondemolition is assumed to be faster than construction and a proportion of the construction energy is allowed for demolition B64 Air and water emissions middot no allowance for air or water emissions other than those produced due to energy use is made for the demolition (Appendix B)
Data (back to top of page)
How data was collected The data was collected using a quantitative questionnaire with assistance provided to help in its completion Building product suppliers were contacted for a description of their manufacturing process and associated raw materials energy use water use and waste products Data was also collected from other studies especially for the operational phase Examples of such studies are forecast energy use for the Stadium (Rudds 1998) and forecast water use (Sinclair Knight Merz 1998)(Janssen and Buckland 2000)
Other data was collected from invoices for electricity water diesel petrol and gas and monthly reports Information was supplied by building product suppliers consultants and subcontractors and collected by Multiplex ERM Mitchell McCotter and the Department of Public Works and Services[9]
From the October 1998 Study Stadium Australia Life Cycle Assessment (inventory results) provided by ERM for use in this case study[15]
Conducting a quantitative life cycle assessment of this scale requires collection of a considerable amount of data from a wide range of sources Data was collected by Multiplex the Department of Public Works and Services and ERM Mitchell McCotter with cooperation from the Stadium consultants subcontractors and building product suppliers
The data is relevant to the actual building material or life cycle stage For example if a building material is manufactured in Australia the data reflects the Australian conditions
All operations were based on mass or energy flows and entered onto the Boustead Model 3 database for life cycle inventory calculations This model calculates the results given the material and energy inputs and environmental outputs on a life cycle basis
Data sources and assumptions The data collected by the questionnaire was verified and supplemented using
computer databases of previous studies published literature and trade information previous energy or environmental audits direct contact with the manufacturer or designer (Janssen 1998)
Allocation No information was available on allocation procedures for co-products Impact methodology The impact methodology used was that based on the DPWS Boustead model Calculation It was reported that all calculations were based on mass or energy flows through the system(Janssen 1999)
Results (back to top of page)
Most of the results were divided into four stages
Procurement Construction Operation Demolition
Summarises the results of the life cycle assessment for energy use greenhouse gas emissions solid waste production and water use (as taken from the DPWS 1998 report in Janssen 1999)
Procurement Construction amp Reconfiguration
Operation amp Maintenance
Demolition Total
Primary energy use
(TJ) 1370 150 6000 80 7600
18 2 79 1
Greenhouse gas
emissions (lsquo000 tonnes CO2 equiv)
140 10 470 5 625
22 2 75 1
Solid wastes ndash
recycled or landfilled
(lsquo000 tonnes)
80 50 160 385 675
12 7 24 57
Water use (lsquo000
680 90 2250 5 3025
tonnes)
22 3 74 gt1
Table1 Summary of Stadium Australia LCA results (Janssen 1999) Total Life Cycle (results from the October 1998 Study Stadium Australia Life Cycle Assessment (inventory results) provided by ERM for use in this case study [15] Energy As Table E1 shows the primary energy use over the total life cycle for the Stadium is estimated at approximately 7600 TJ Figure E3 shows the percentage division of this energy use by life cycle stage
The operation and maintenance of the Stadium over 50 years accounts for 79 of the energy use and is the most significant stage in the Stadiums life for energy considerations Therefore the design decisions which affect the operating energy of a building such as Stadium Australia will have a relatively significant impact on the buildingrsquos total energy use
Figure E3 Total primary energy use by life cycle stage
The procurement of the building systems (ie extraction of raw materials manufacture and transport to site) accounts for 18 of the total primary energy and indicates that the choice of building materials is also significant for total life cycle energy
Raw materials Figure E4 shows the percentage breakdown of raw materials used over the Stadiumrsquos life time Water is the most significant raw material by mass and approximately 75 of it is used during the operation of the Stadium However note that due to the design choices made for the Stadium such as use of recycled water and rainwater harvesting on the Stadium roof 60 of the water used over the life of the Stadium is non-potable
Figure E4 Total raw material use
Solid waste
As Table E1 shows approximately 671 000 tonnes of solid wastes are produced over the life of the Stadium In this study solid outputs from the system are termed solid wastes which are reused recycled or are disposed to landfill Figure E5 shows the likely disposal route for solid wastes over the life of the Stadium
Sixty eight percent (68) by mass of the wastes have been estimated as being recycled or reused Twelve percent (12) will be landfilled and 20 have an unknown disposal route reflecting the uncertainty in compostible waste management during operation of the Stadium The facilities for segregating compostible waste are incorporated in the Stadium design However facilities to compost the waste are not yet available in Sydney
Figure E5 Disposal route for solid waste generated over the total life of the Stadium
Air emissions
The most significant air emission by mass over the life of the Stadium is carbon dioxide a greenhouse gas Operation and maintenance of the Stadium is responsible for the greatest proportion of greenhouse
gas emissions as illustrated by Figure E6 These greenhouse gas emissions are due to energy use over the Stadiumrsquos fifty year design life which involves the burning of fossil fuels such as coal and gas
Figure E6 Greenhouse gas emissions by life cycle stage
E53 Procurement The procurement stage of the Stadiumrsquos life cycle involves the extraction of raw materials manufacture of building materials and their transport to the site As discussed in Section E52 the procurement of the building systems is responsible for 18 of the total energy use Figure E7 shows the contribution of the major building materials to this energy use The concrete and steelwork systems dominate the results as may be expected for the Stadium construction type
Figure E7 Energy use in procurement by major building systems
E54 Construction and Reconfiguration
The most significant result for the construction and reconfiguration of the Stadium is the generation and disposal of solid wastes Hardcore wastes account for most of the waste generated during construction
and reconfiguration It is estimated that approximately 76 of the construction and reconfiguration waste will be reused or recycled For construction only between 60 and 70 of the waste is being sent to recycling
E55 Operation and Maintenance Environmental measures Some of the results for the operation and maintenance have been discussed in Section E52 above An integral part of the Stadium design has been the incorporation of environmental measures for energy and water efficiency such as middot energy cogeneration with waste heat recovery middot power factor correction middot passive ventilation on levels 1 2 and 6 middot high energy efficiency lighting middot natural lighting middot carpark ventilation monitoring middot harvesting of rainwater on the Stadium roof for irrigation middot use of recycled water middot reduced flush toilets middot water efficient fixtures Stadium vs conventional design As a comparison the annual primary energy consumption greenhouse gas emissions and water consumption were estimated for both the Stadium design and a more conventional design which does not incorporate any of the measures listed above Figure E8 illustrates how the annual primary energy consumption for the Stadium design is 120 TJ compared to 175 TJ for the conventional design representing an approximately 30 annual primary energy saving
Figure E8 Annual primary energy consumption for Stadium vs conventional design
The energy efficiency measures and the use of gas cogeneration in the Stadium translates into a 37 reduction of greenhouse gas emissions when compared with a more conventional design as shown in Figure E9
Figure E9 Annual greenhouse gas emissions for Stadium vs conventional design
As Figure E10 shows the annual water use for the Stadium design is approximately 45000 tonnes compared to 52000 tonnes for a more conventional design representing a 14 reduction in water use
Figure E10 also shows that the source of this water for the Stadium design is significantly different from that of a conventional design as 77 of the water is either sourced from recycled water or collected on site Twenty three percent (23) of the water is sourced from the potable water supply for the Stadium design A conventional design could be expected to source 100 of its water from the potable supply
Figure E10 Annual water consumption for Stadium vs conventional design
E56 Demolition The most significant consideration for demolition of the Stadium is the production and management of waste Demolition accounts for 58 of the solid waste created over the total life of the Stadium
Consideration of the demolition of the building is therefore most important for solid waste management over its total life cycle
However forecasting the waste management practices in 50 years at the end of the Stadiums design life is difficult Construction demolition and waste management experts were contacted to make estimates on the proportion of the waste reused recycled or disposed to landfill
It is expected that up to 98 of the waste generated during demolition of the Stadium will be reused or recycled
Discussion (back to top of page)
Why LCA LCA was used in this project primarily to help Multiplex Construction to quantify the environmental performance of the stadium to set a benchmark for future stadia and to ensure that the regulatory and planning requirements were met
LCA was also seen to have potential in choosing building materials and assisting in the design issues such as waste and energy efficient design (Janssen and Buckland 2000)
Comment The obvious area for life cycle assessment is in the concept and detailed design stages This is where most decisions are made that affect the environmental performance of the project or building Matthew Janssen personal communication 2122001
Data The information and data for the LCA was collected by quantitative questionnaires that were given to all subcontractors and information requested from manufacturers Highly accurate data was obtained through continued communication with the subcontractors and initiatives such as workshops to help them deal with the requirements Importantly periodic sensitivity analysis helped determine priorities in data collection This data was kept in commercial confidence by Multiplex and only aggregated results used publicly[10]
Problems with data collection
Difficulty in collecting the data The article from Building Innovation and Construction Technology May 1999 lsquoTheory into factrsquo discusses the difficulty in collecting data To expedite the collection they report that the requirement for data collection was integrated it into the contractual arrangements According to Buckland it is the first time subcontractors have participated in an inventory and collection of information was not easyrdquo[11]
Using international data Discussed in the 1998 AIRAH conference paper by Matthew Janssen is the problem of different fuel mixes for energy and the need to be cautious when using international data (Janssen 1998) There is a need
to use Australian data and if it is not available to tailor data to Australian conditions
Tool used All data collected was entered into a computer tool at the DPWS based on the Boustead Model 3 database This tool calculated the impacts[12]
The results published in the public domain look mainly at energy water waste and greenhouse Impacts commonly reported on but not included were
o ozone depletion o toxicity (human and ecological)ndash though indoor air quality issues were
looked at o acidification o smog
This was due to the confidentiality of the data the lack of a suitable Australian impact methodology to calculate these accurately and the lack of data on these impacts
Advantages of using LCA Multiplex can use the lessons learnt from the Life Cycle Assessment in other large scale public buildings (Janssen and Buckland 2000) Further the results can be used by the industry in future design and construction projects particularly of other stadia (Janssen 1999)
Multiplex and its many product manufacturers suppliers and subcontractors have gained a better understanding of their interaction with the environment in terms of raw materials energy use and emissions to air water and land (Janssen and Buckland 2000)
BHP LCA of the Green Games BHP was asked as major sponsor to carry out an LCA to provide the lsquogreenprintrsquo which the Sydney games lacked as a starting point for future hosts (EA 2000) This LCA was summarised into the simple modeling tool LISA As a point of interest for this case study a short summary is made of the model This can be viewed interactively by downloading the LCA tool LISA
ldquoBHP intends to continue to develop and apply LCA in the future because of its value as a powerful tool for reducing the impact of products and
processes on the environmentrdquo (pg 30 EA 2000)
Conclusion (back to top of page)
How LCA influenced the results of the case study Multiplex and Stadium Australia used Life Cycle Assessment in the original design optimisation of the Stadium Three main designs were assessed
o a conventional stadium design o a better environmental practice design and o a best practice design
Using a mixture of Life Cycle Assessment and costbenefit analysis the better environmental practice design was chosen [14]
Acknowledgments and Project team (back to top of page)
Thanks go to Bill Buckland and David Ghannoum of Multiplex Allison Smith of ERM Mitchell McCotter Zig Peshos from the NSW Department of Public Works and Services and Matthew Janssen currently with Dames and Moore but previously Senior Environmental Engineer with URS Australia
Project Team
Multiplex Constructions Bill Buckland Design Manager Report review Ulrika Fernstrom Site Engineer Data collection and review
Environmental amp Energy Services DPWS
Gary Woods Manager Report review Dawn Perryman Principal Scientist LCA and report review Matthew Janssen Environmental Engineer LCA modelling and report preparation
ERM Mitchell McCotter
Jasmine Westerman Senior Associate Report review Kate Jackson Project Engineer Data collection
References(back to top of page)
DPWS (1998) NSW Department of Public Works and Services Stadium Australia Life Cycle Assessment (Inventory Results) Conducted for Multiplex Constructions (NSW) by DPWS Environmental and Energy Services and ERM Mitchell McCotter (1998)
EA (2000) Greening the Games ndash Australia Creating Sustainable Solutions for a New Millennium Published by Environment Australia June 2000 Available from httpwwwenvironmentgovaugreengamesacrobatgamespdf(last accessed 822001)
Janssen M (1998) Life Cycle Assessment of Buildings and Services AIRAH International Conference Sydney 1998
Janssen M(1999) Stadium Australia Life Cycle Assessment Paper presented at the Construction conference 11 May 1999
Janssen M and Buckland B (2000) Stadium Australia Life Cycle Assessment ndash Energy Use and energy Efficient Design
[1] Description from Building Innovation and Construction Technology Theory In To Facts section Number 5 February 1999 as viewed from the website httpwwwdbcecsiroauinno-web0299greenolympicshtm last accessed 622001
[2] NSW State Government Environmental Planning and Assessment Act 1979 State Environmental Planning Policy No 38 - Olympic Games Projects (1993)
[3] Sydney Olympics 2000 Bid Limited Environmental Guidelines for the Summer Olympic Games (1993)
[4] NSW Department of Public Works and Services Stadium Australia Life Cycle Assessment (Inventory Results) Conducted for Multiplex Constructions (NSW) by DPWS and ERM Mitchell McCotter Report prepared by DPWS Environmental and Energy Services (1998)
[5] Building Innovation and Construction Technology Theory In To Facts section Number 5 February 1999 as viewed from the website httpwwwdbcecsiroauinno-web0299greenolympicshtm last accessed 622001
[6] Personal communication with Matthew Janssen 2122001
[7] Personal communication with Matthew Janssen 2122001
[8] Personal communication with Matthew Janssen 2122001
[9] Information sourced from Building Innovation and Construction Technology Theory In To Facts section Number 5 February 1999 httpwwwdbcecsiroauinno-web0299greenolympicshtm last accessed 622001
[10] Information sourced from Building Innovation and Construction Technology Theory In To Facts section Number 5 February 1999 httpwwwdbcecsiroauinno-web0299greenolympicshtm last accessed 622001
[11] Information sourced from Building Innovation and Construction Technology Theory In To Facts section Number 5 February 1999 httpwwwdbcecsiroauinno-web0299greenolympicshtm last accessed 622001
[12] Information sourced from Building Innovation and Construction Technology Theory In To Facts section Number 5 February 1999 httpwwwdbcecsiroauinno-web0299greenolympicshtm last accessed 622001
[13] Comment made in Building Innovation and Construction Technology Theory In To Facts section Number 5 February 1999 httpwwwdbcecsiroauinno-web0299greenolympicshtm last accessed 622001
[14] Personal communication Matthew Janssen 2122001
[15] October 1998 Stadium Australia Life Cycle Assessment (Inventory Results) This study was commissioned by Multiplex Constructions and carried out with their assistance by the NSW Department of Public Works and Services and ERM Mitchell McCotter
httpbuildlcarmiteduauCaseStudStadiumStadiumhtml
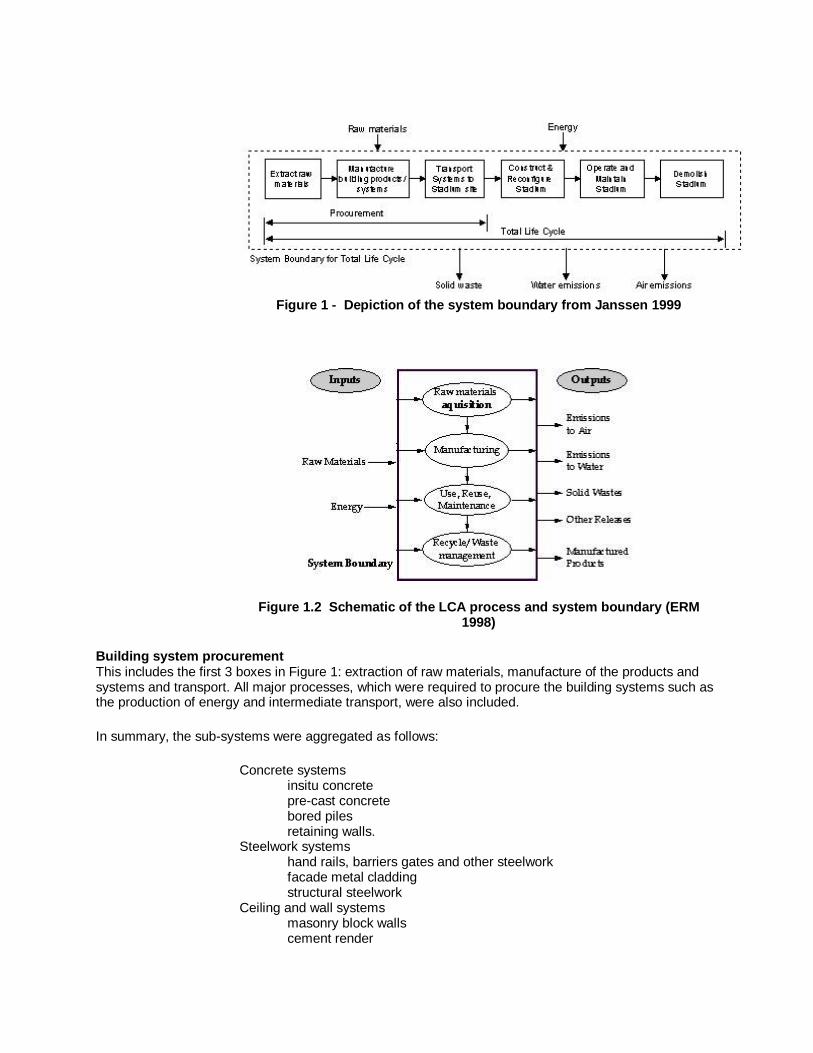
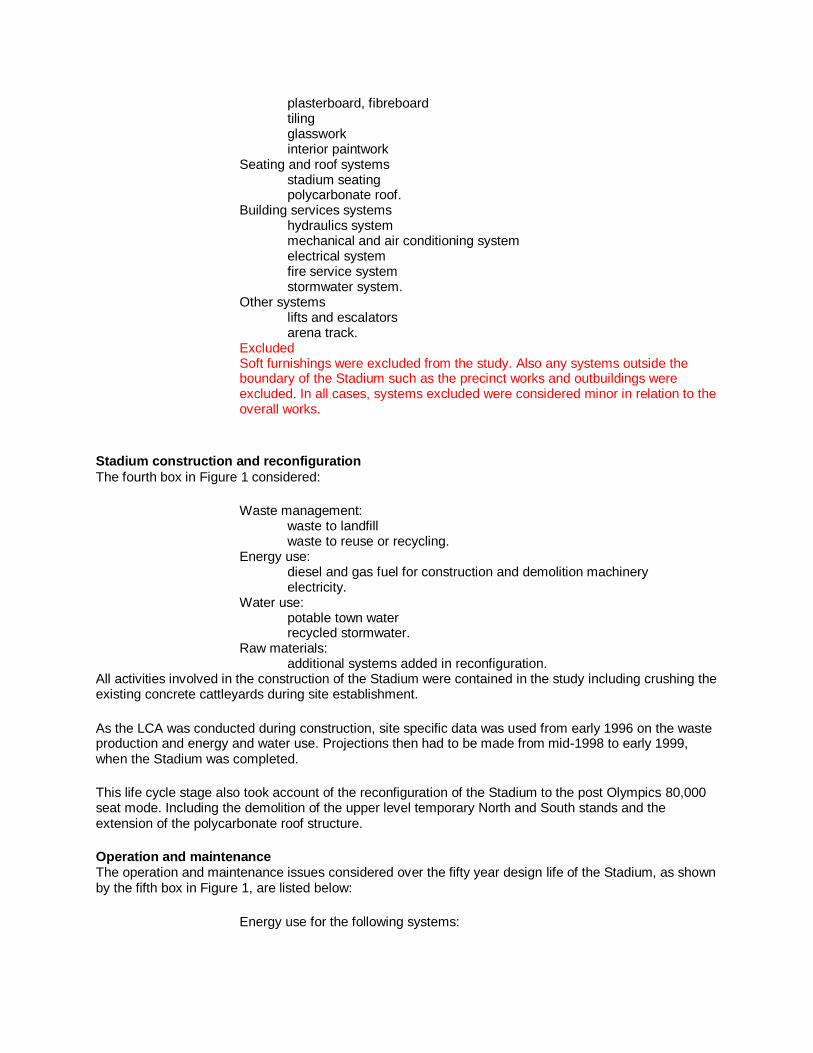
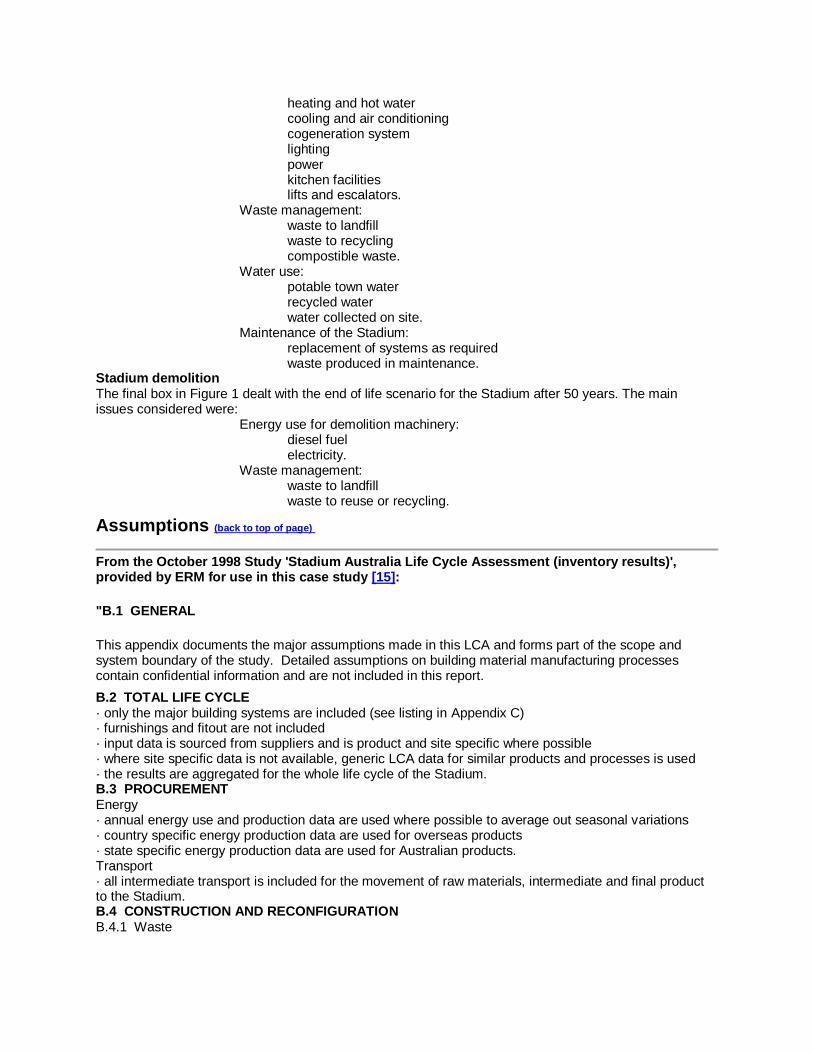
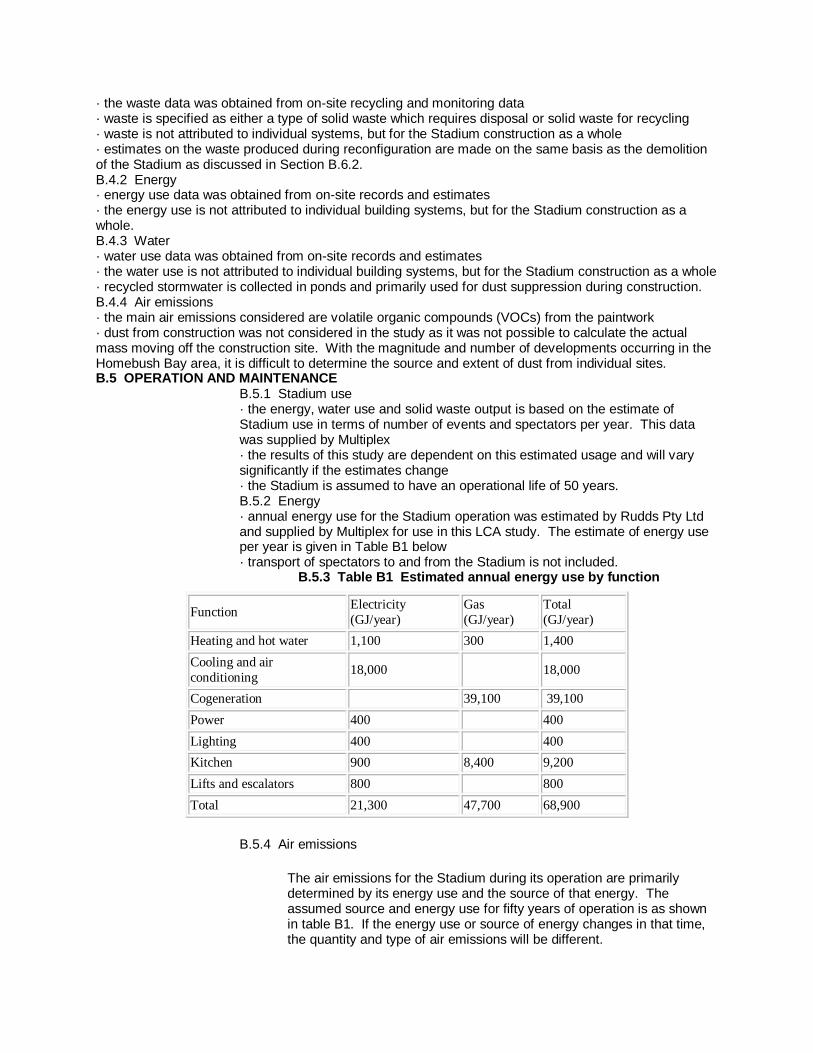
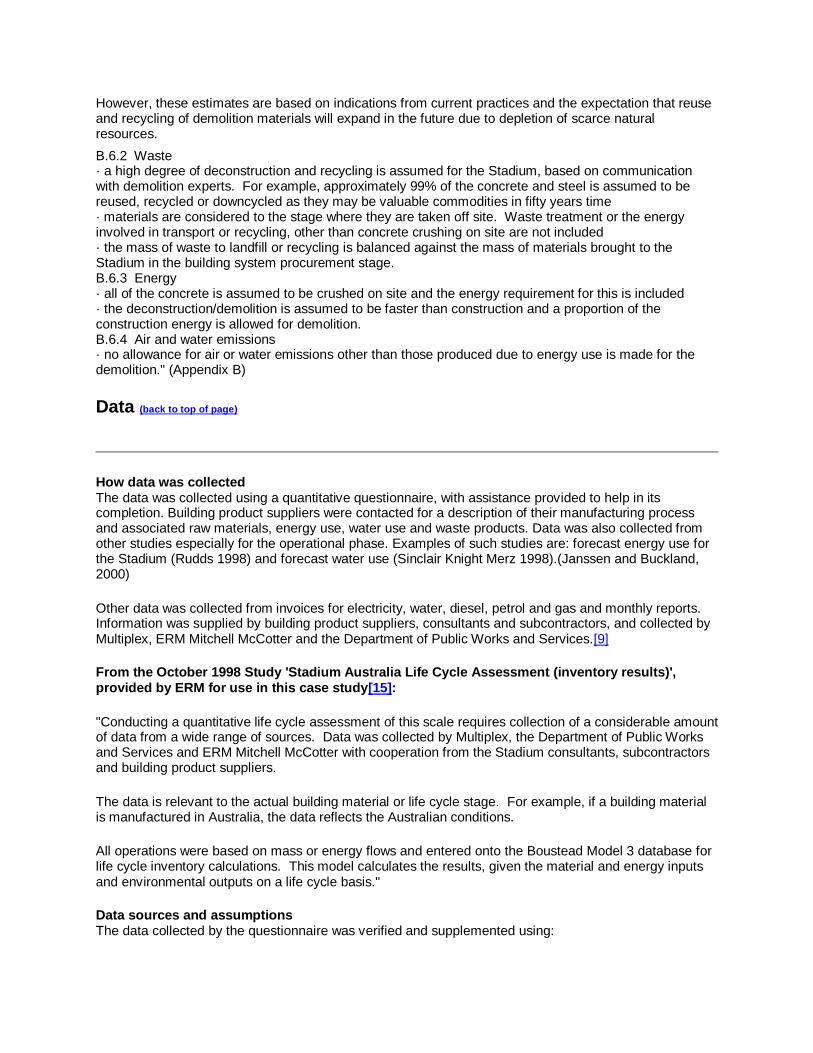
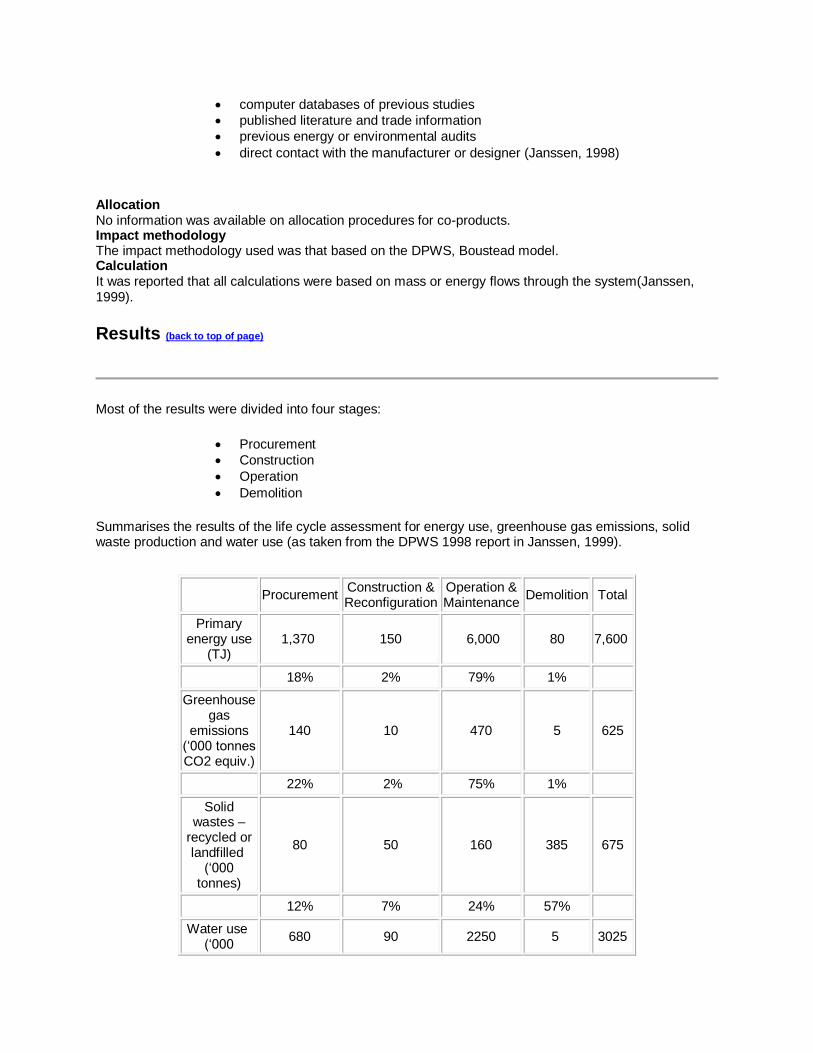
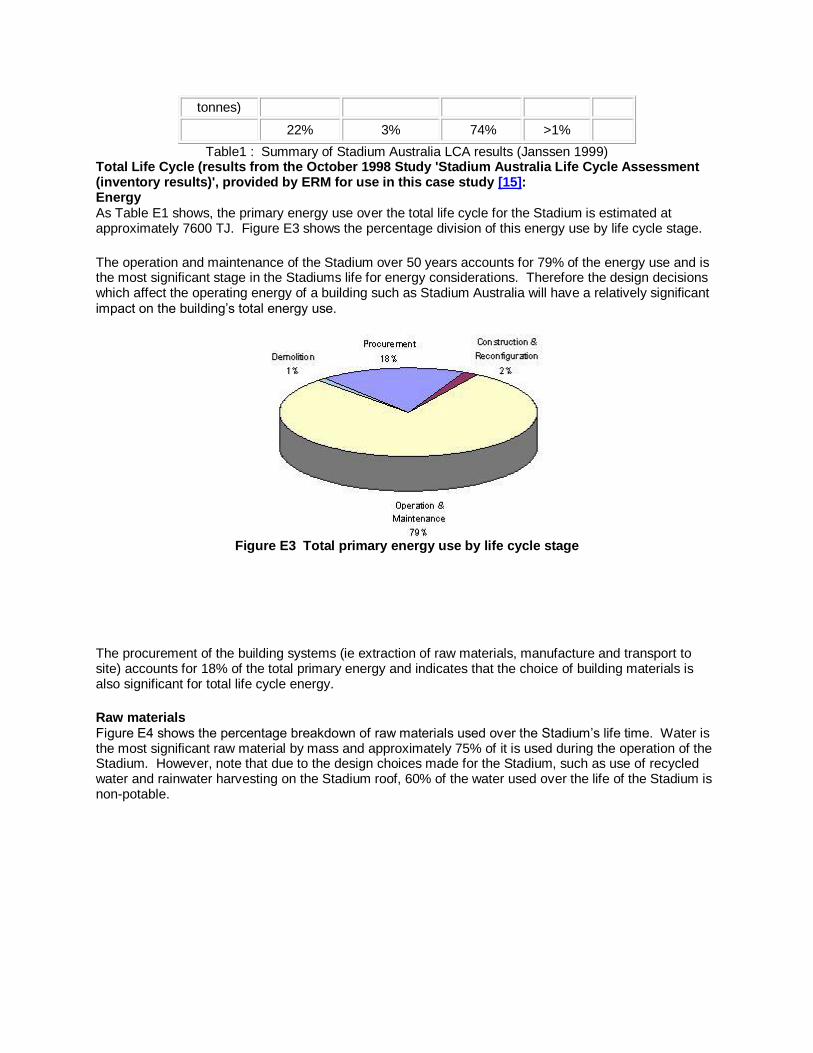
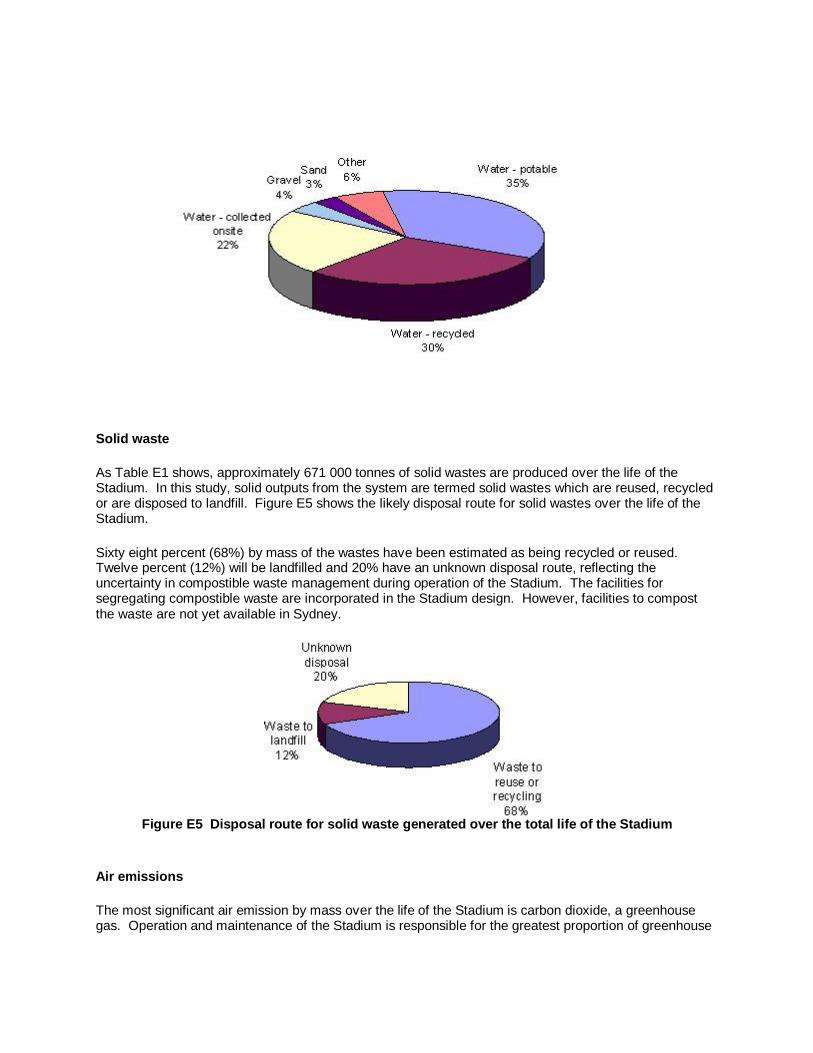
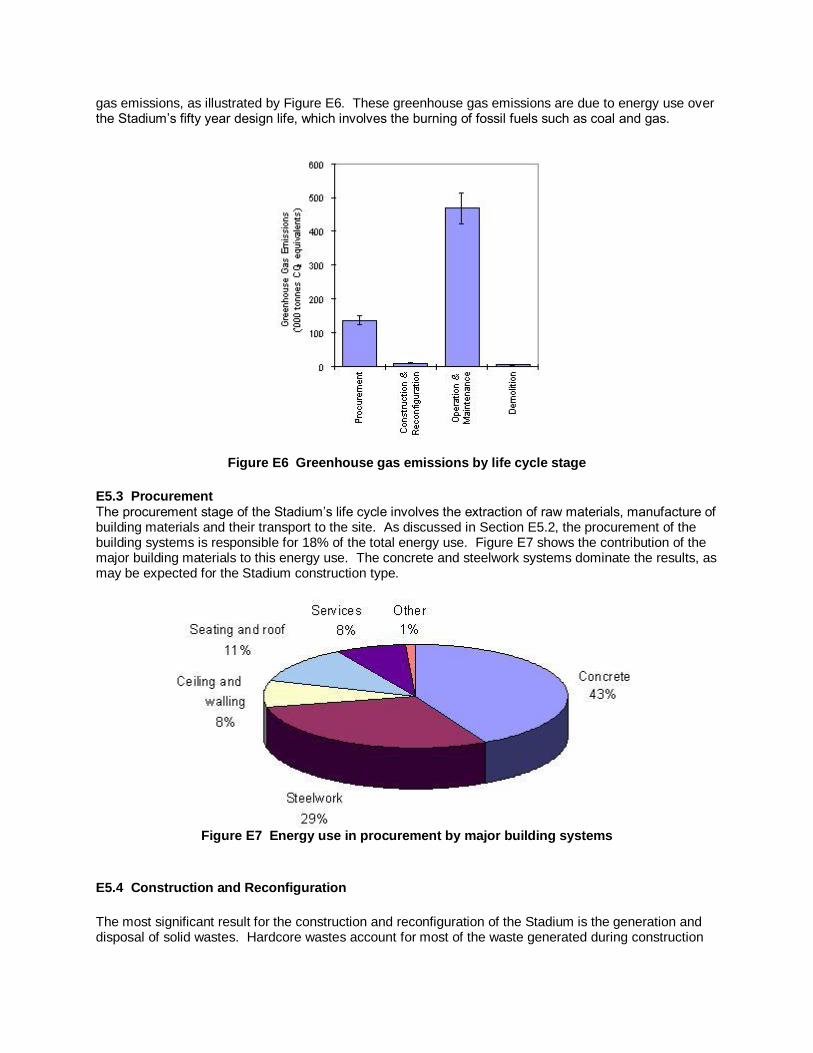
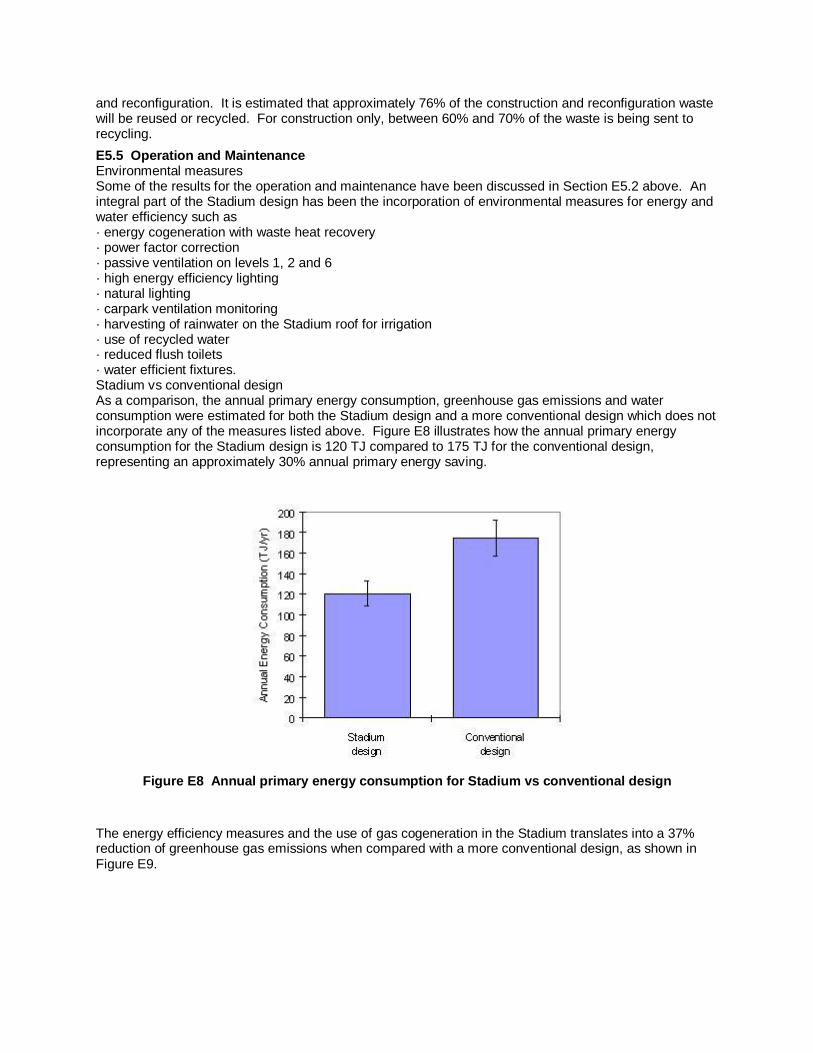
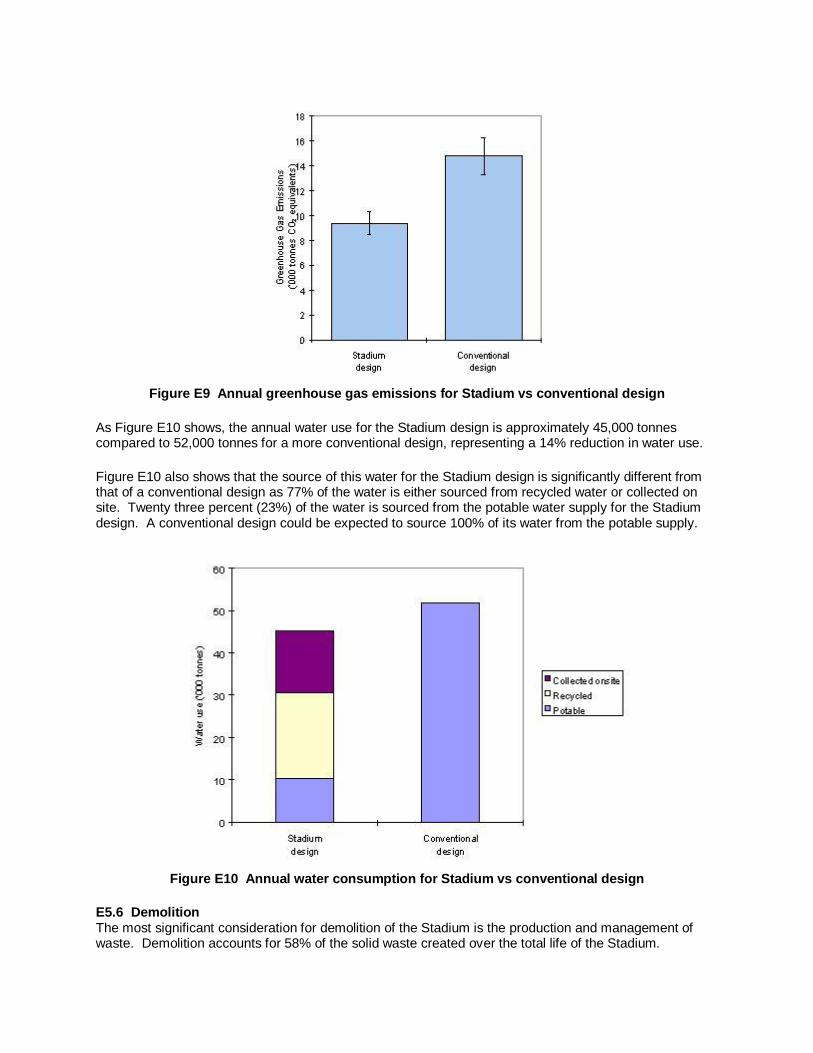
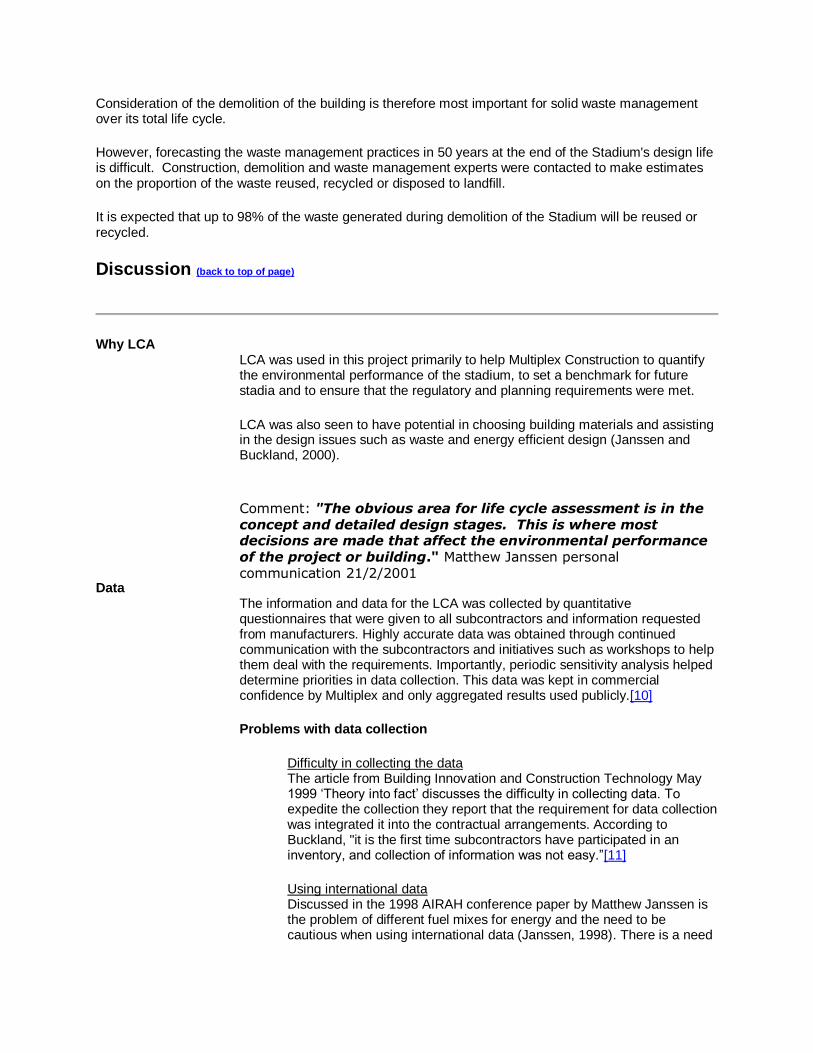
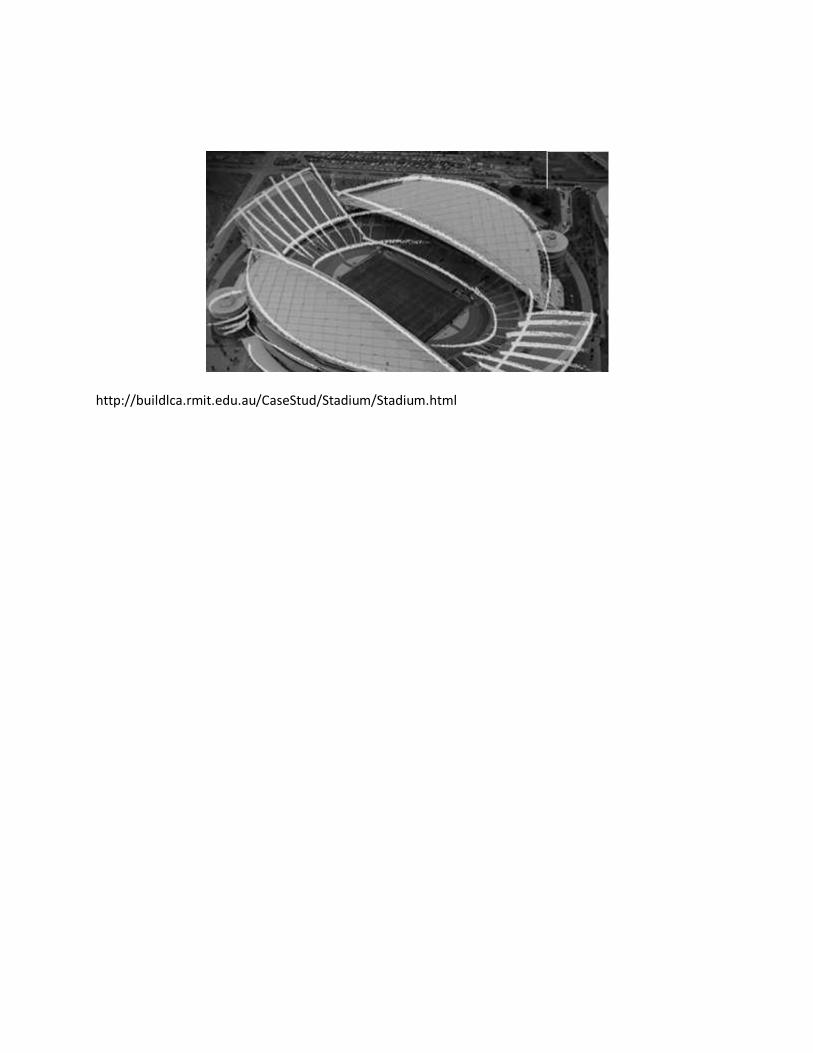
httpbuildlcarmiteduauCaseStudStadiumStadiumhtml


![[MS-DPWSRP]: Devices Profile for Web Services (DPWS ......The Devices Profile for Web Services (DPWS): Shared Resource Publishing Data Structure describes the Shell Publishing data](https://img.pdfslide.us/doc/110x75/60380c683c5400624a7a49b1/ms-dpwsrp-devices-profile-for-web-services-dpws-the-devices-profile.jpg)