Embed Size (px)
Citation preview
Stadium ProposalReview of Proposal | Update on Modeling Progress
DRAFT | For Discussion Purposes
OVERVIEW OF BASELINE MODEL
2
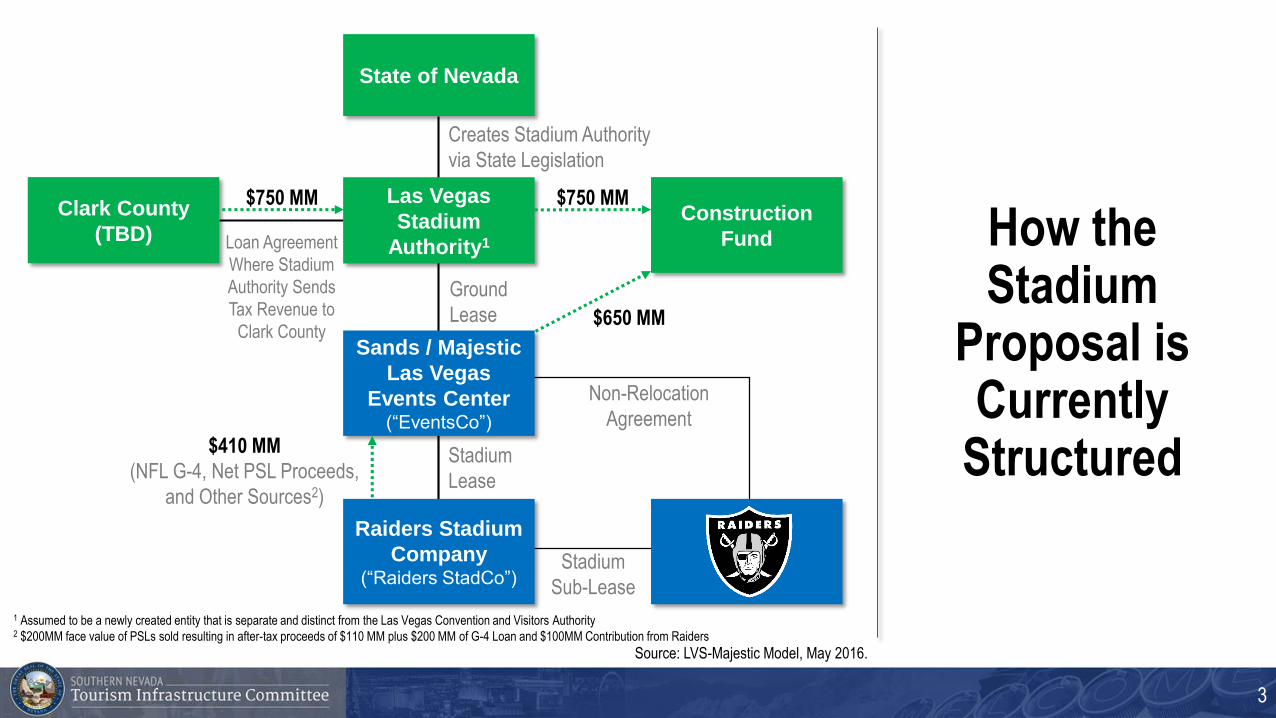
How the Stadium
Proposal is Currently
Structured
Source: LVS-Majestic Model, May 2016.
1 Assumed to be a newly created entity that is separate and distinct from the Las Vegas Convention and Visitors Authority2 $200MM face value of PSLs sold resulting in after-tax proceeds of $110 MM plus $200 MM of G-4 Loan and $100MM Contribution from Raiders
$750 MM$750 MM
State of Nevada
Las Vegas
Stadium
Authority1
Sands / Majestic
Las Vegas
Events Center(“EventsCo”)
Raiders Stadium
Company(“Raiders StadCo”)
Construction
Fund
Clark County
(TBD)
Creates Stadium Authority
via State Legislation
Loan Agreement
Where Stadium
Authority Sends
Tax Revenue to
Clark County
Non-Relocation
Agreement
Stadium
Sub-Lease
Stadium
Lease
$410 MM
(NFL G-4, Net PSL Proceeds,
and Other Sources2)
Ground
Lease $650 MM
3
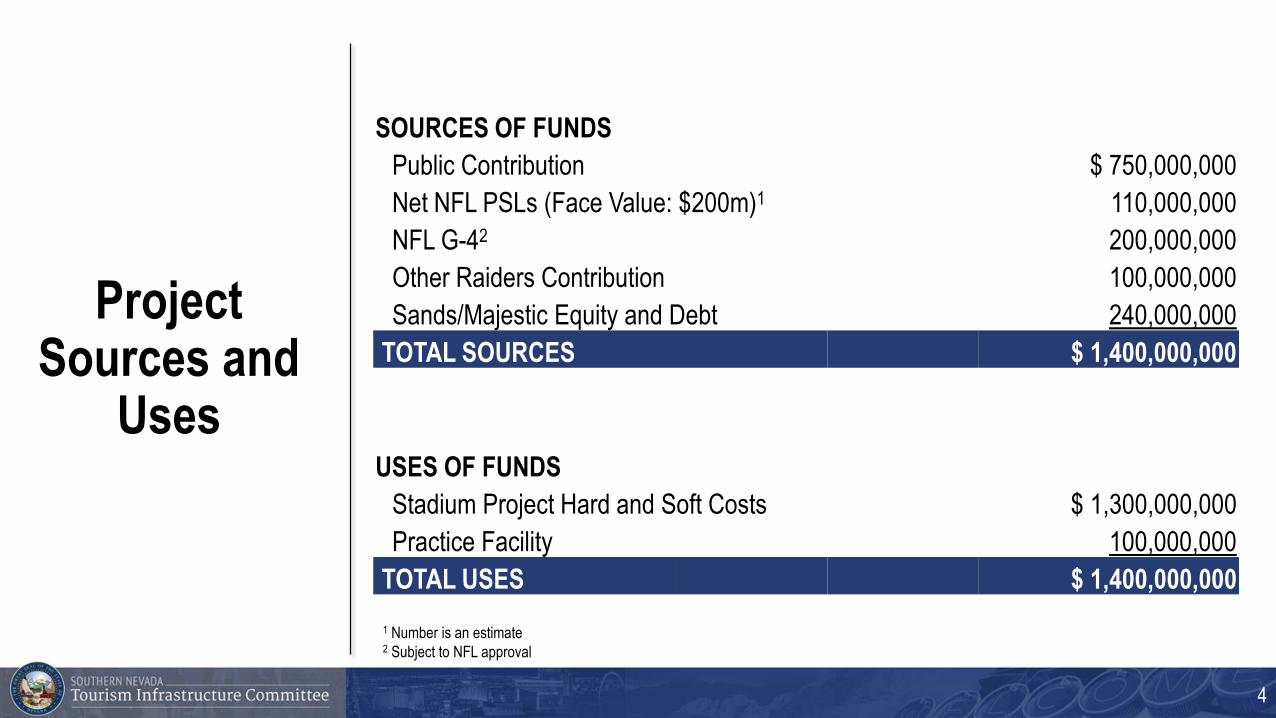
Project Sources and
Uses
SOURCES OF FUNDS
Public Contribution $ 750,000,000
Net NFL PSLs (Face Value: $200m)1 110,000,000
NFL G-42 200,000,000
Other Raiders Contribution 100,000,000
Sands/Majestic Equity and Debt 240,000,000
TOTAL SOURCES $ 1,400,000,000
USES OF FUNDS
Stadium Project Hard and Soft Costs $ 1,300,000,000
Practice Facility 100,000,000
TOTAL USES $ 1,400,000,000
1 Number is an estimate2 Subject to NFL approval
4
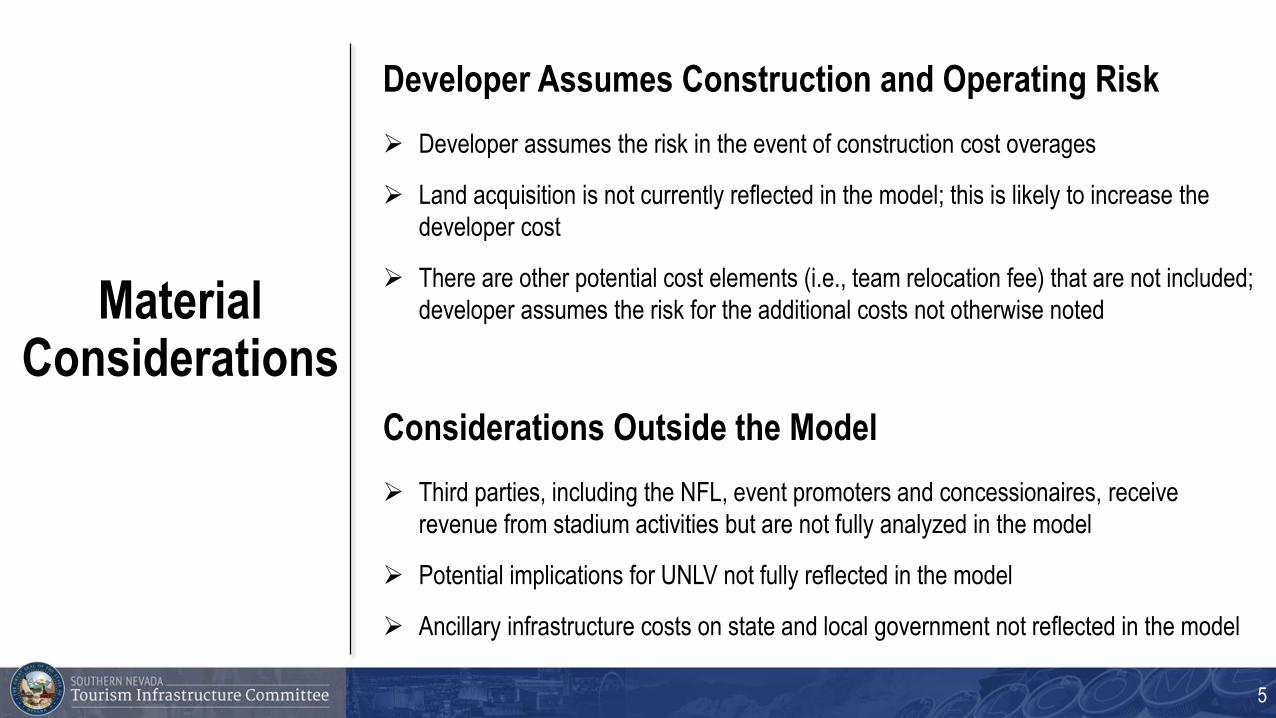
Material Considerations
Developer assumes the risk in the event of construction cost overages
Land acquisition is not currently reflected in the model; this is likely to increase the
developer cost
There are other potential cost elements (i.e., team relocation fee) that are not included;
developer assumes the risk for the additional costs not otherwise noted
Developer Assumes Construction and Operating Risk
Third parties, including the NFL, event promoters and concessionaires, receive
revenue from stadium activities but are not fully analyzed in the model
Potential implications for UNLV not fully reflected in the model
Ancillary infrastructure costs on state and local government not reflected in the model
Considerations Outside the Model
5
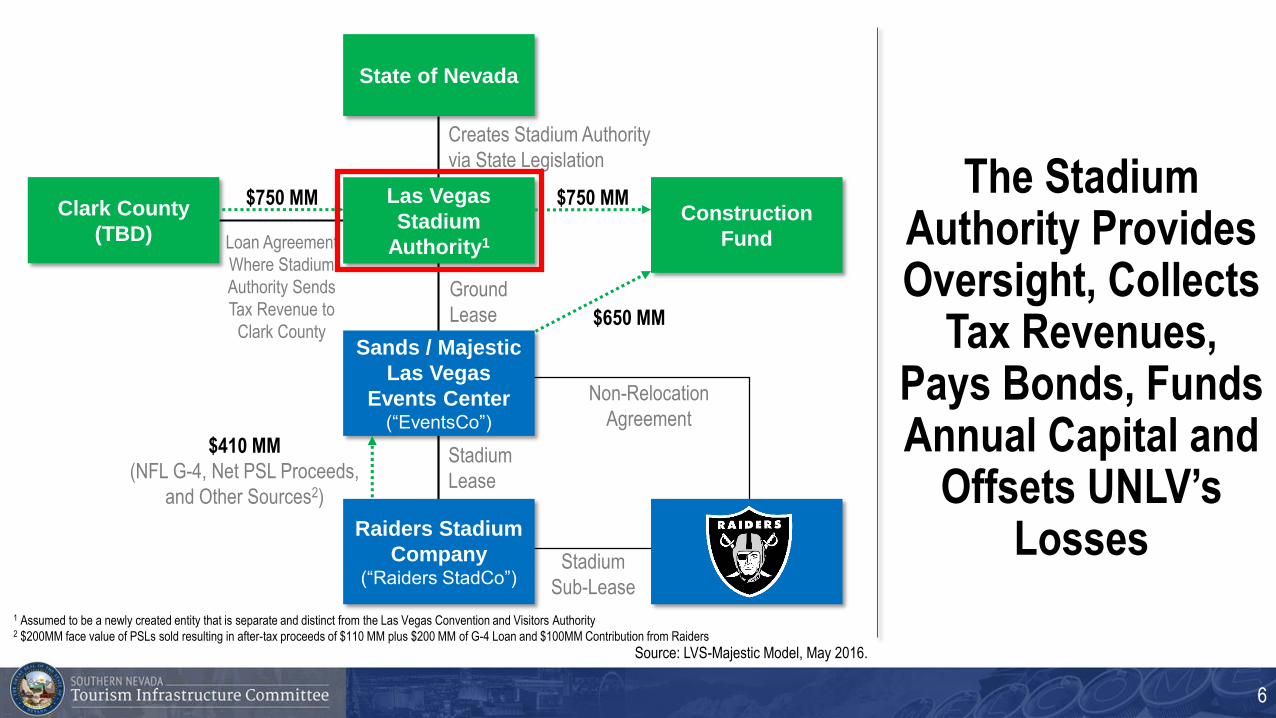
The Stadium Authority Provides Oversight, Collects
Tax Revenues, Pays Bonds, Funds Annual Capital and
Offsets UNLV’s Losses
Source: LVS-Majestic Model, May 2016.
1 Assumed to be a newly created entity that is separate and distinct from the Las Vegas Convention and Visitors Authority2 $200MM face value of PSLs sold resulting in after-tax proceeds of $110 MM plus $200 MM of G-4 Loan and $100MM Contribution from Raiders
$750 MM$750 MM
State of Nevada
Las Vegas
Stadium
Authority1
Sands / Majestic
Las Vegas
Events Center(“EventsCo”)
Raiders Stadium
Company(“Raiders StadCo”)
Construction
Fund
Clark County
(TBD)
Creates Stadium Authority
via State Legislation
Loan Agreement
Where Stadium
Authority Sends
Tax Revenue to
Clark County
Non-Relocation
Agreement
Stadium
Sub-Lease
Stadium
Lease
$410 MM
(NFL G-4, Net PSL Proceeds,
and Other Sources2)
Ground
Lease $650 MM
6
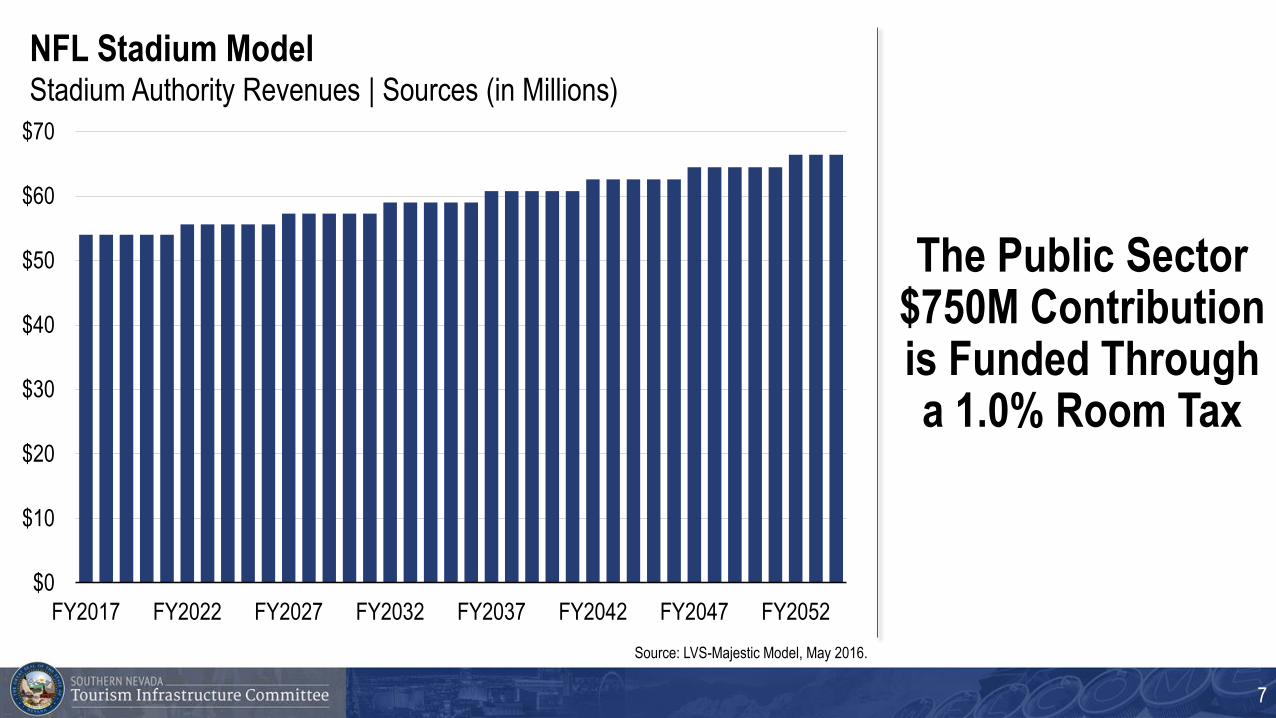
The Public Sector $750M Contribution is Funded Through a 1.0% Room Tax
$0
$10
$20
$30
$40
$50
$60
$70
FY2017 FY2022 FY2027 FY2032 FY2037 FY2042 FY2047 FY2052
Mill
ions
NFL Stadium Model Stadium Authority Revenues | Sources (in Millions)
Source: LVS-Majestic Model, May 2016.
7
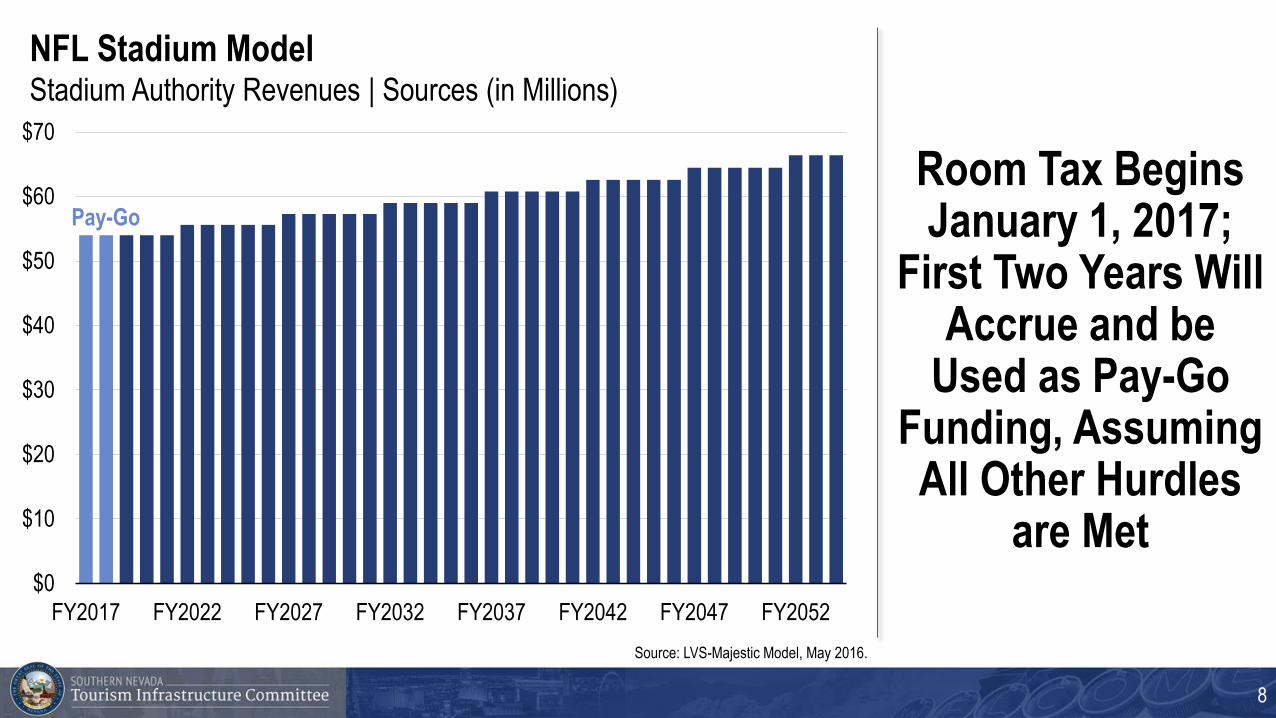
Room Tax Begins January 1, 2017;
First Two Years Will Accrue and be
Used as Pay-Go Funding, Assuming All Other Hurdles
are Met$0
$10
$20
$30
$40
$50
$60
$70
FY2017 FY2022 FY2027 FY2032 FY2037 FY2042 FY2047 FY2052
Mill
ions
NFL Stadium Model Stadium Authority Revenues | Sources (in Millions)
Pay-Go
Source: LVS-Majestic Model, May 2016.
8
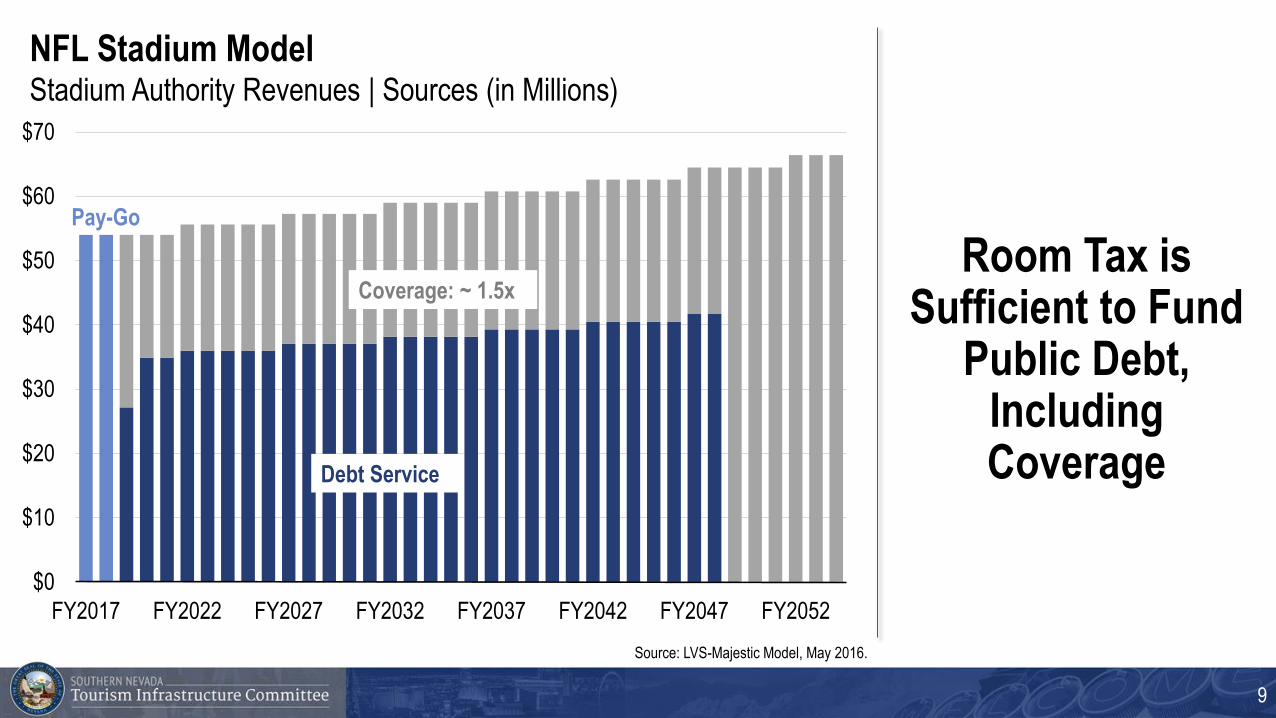
Room Tax is Sufficient to Fund
Public Debt, Including Coverage
$0
$10
$20
$30
$40
$50
$60
$70
FY2017 FY2022 FY2027 FY2032 FY2037 FY2042 FY2047 FY2052
Mill
ions
NFL Stadium Model Stadium Authority Revenues | Sources (in Millions)
Debt Service
Coverage: ~ 1.5x
Source: LVS-Majestic Model, May 2016.
Pay-Go
9
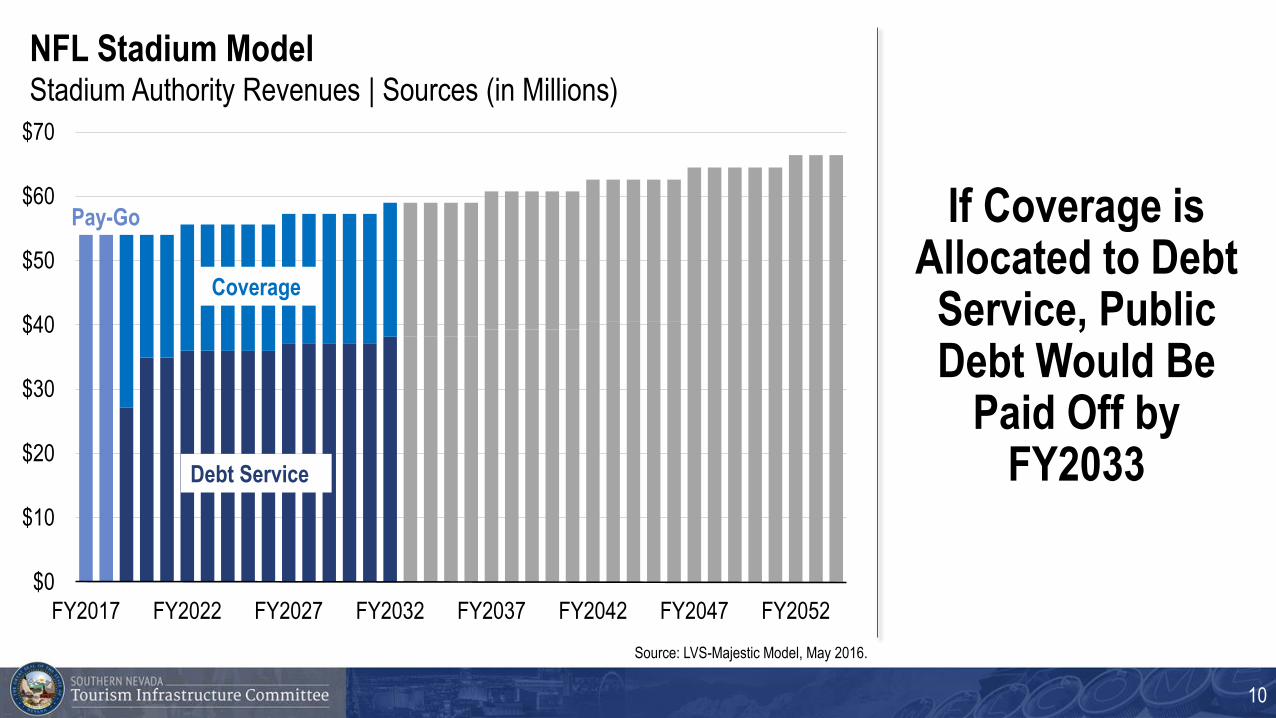
If Coverage is Allocated to Debt
Service, Public Debt Would Be
Paid Off by FY2033
$0
$10
$20
$30
$40
$50
$60
$70
FY2017 FY2022 FY2027 FY2032 FY2037 FY2042 FY2047 FY2052
Mill
ions
NFL Stadium Model Stadium Authority Revenues | Sources (in Millions)
Debt Service
Coverage
Source: LVS-Majestic Model, May 2016.
Pay-Go
10
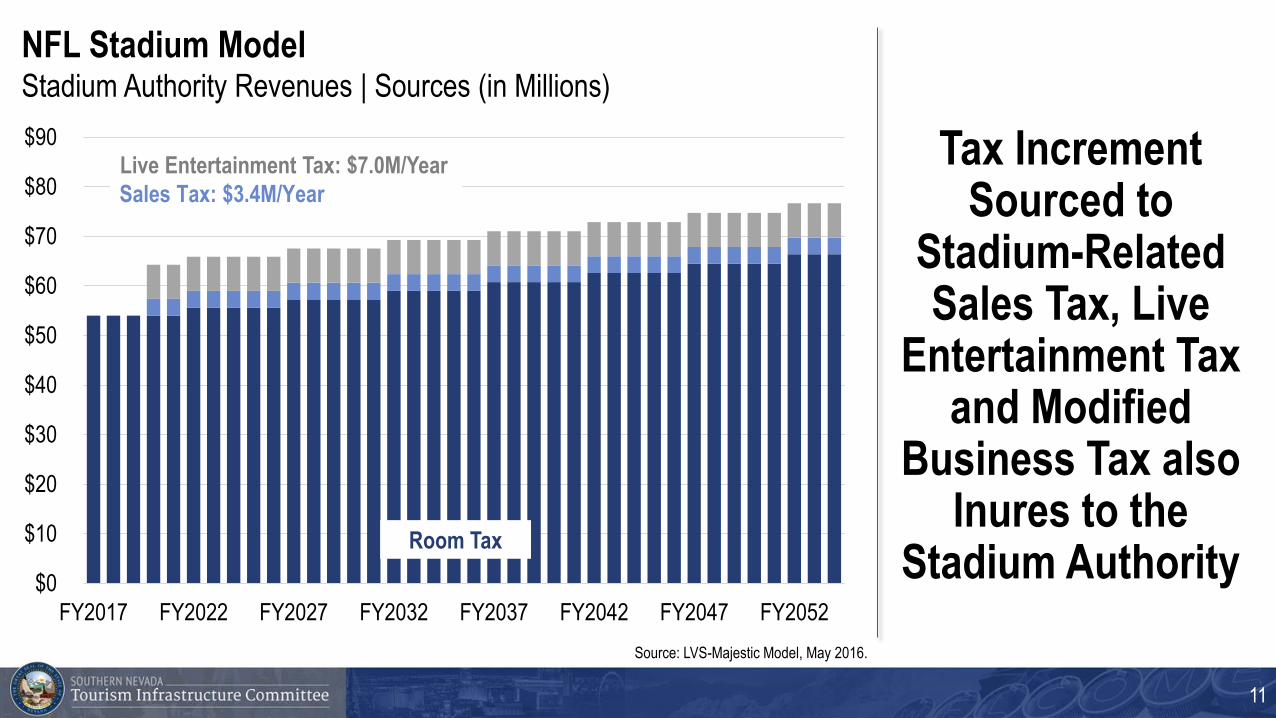
Tax Increment Sourced to
Stadium-Related Sales Tax, Live
Entertainment Tax and Modified
Business Tax also Inures to the
Stadium Authority
NFL Stadium Model Stadium Authority Revenues | Sources (in Millions)
$0
$10
$20
$30
$40
$50
$60
$70
$80
$90
FY2017 FY2022 FY2027 FY2032 FY2037 FY2042 FY2047 FY2052
Live Entertainment Tax: $7.0M/Year
Sales Tax: $3.4M/Year
Room Tax
Source: LVS-Majestic Model, May 2016.
11

Stadium Authority Funds are Used to Repay Debt, Fund Annual Capital and
Offset Losses to UNLV
$0
$10
$20
$30
$40
$50
$60
Mill
ions Capital Contribution
UNLV Payment
Debt Payments
Assumptions:
Bond Principal: $572MBond Interest: $577MUNLV Payment: $221MAnnual Capital: $158MCoverage: $1.1BTotal: $2.63B
NFL Stadium Model Stadium Authority | Sources (in Millions)
Source: LVS-Majestic Model, May 2016.
12
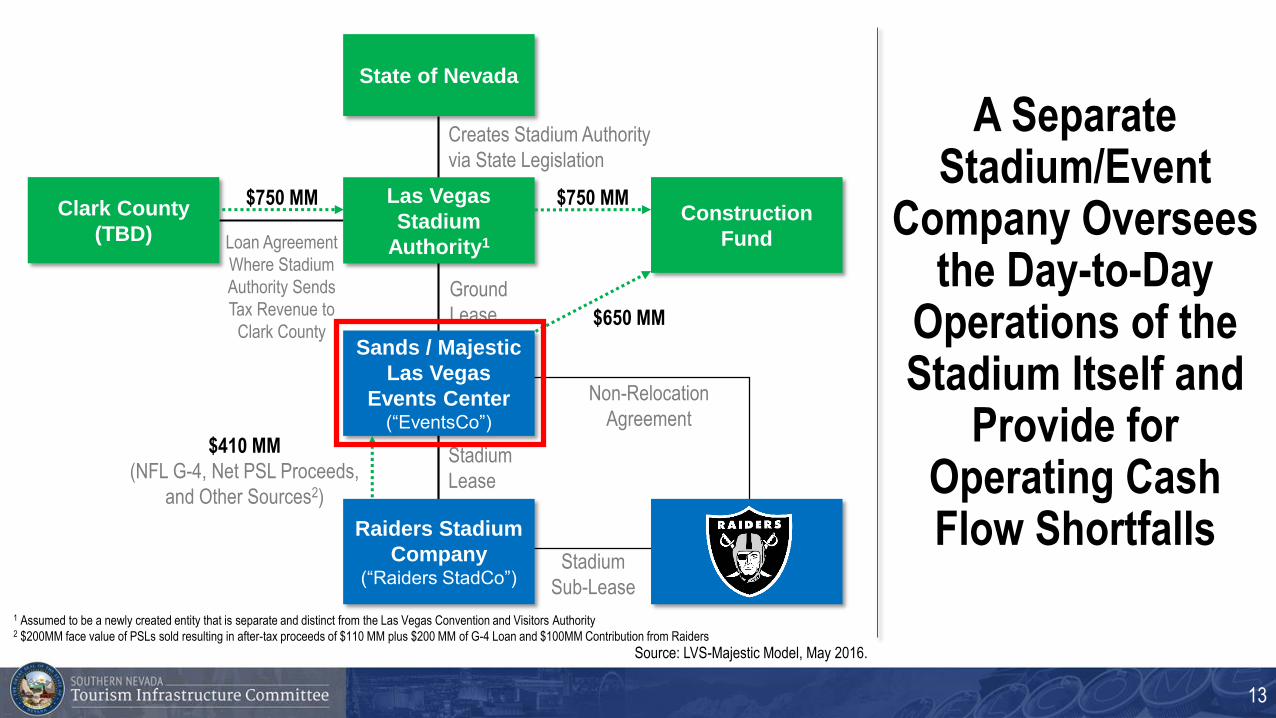
A Separate Stadium/Event
Company Oversees the Day-to-Day
Operations of the Stadium Itself and
Provide for Operating Cash Flow Shortfalls
Source: LVS-Majestic Model, May 2016.
1 Assumed to be a newly created entity that is separate and distinct from the Las Vegas Convention and Visitors Authority2 $200MM face value of PSLs sold resulting in after-tax proceeds of $110 MM plus $200 MM of G-4 Loan and $100MM Contribution from Raiders
$750 MM$750 MM
State of Nevada
Las Vegas
Stadium
Authority1
Sands / Majestic
Las Vegas
Events Center(“EventsCo”)
Raiders Stadium
Company(“Raiders StadCo”)
Construction
Fund
Clark County
(TBD)
Creates Stadium Authority
via State Legislation
Loan Agreement
Where Stadium
Authority Sends
Tax Revenue to
Clark County
Non-Relocation
Agreement
Stadium
Sub-Lease
Stadium
Lease
$410 MM
(NFL G-4, Net PSL Proceeds,
and Other Sources2)
Ground
Lease $650 MM
13
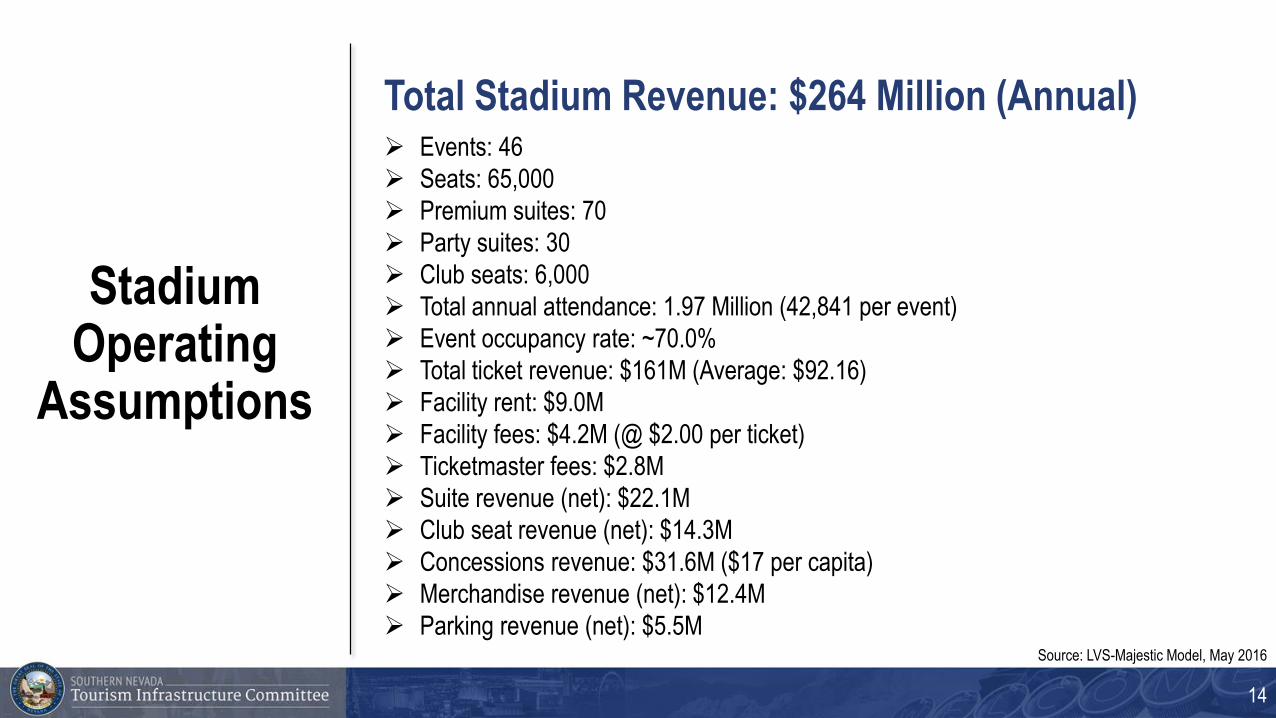
Stadium Operating
Assumptions
Events: 46
Seats: 65,000
Premium suites: 70
Party suites: 30
Club seats: 6,000
Total annual attendance: 1.97 Million (42,841 per event)
Event occupancy rate: ~70.0%
Total ticket revenue: $161M (Average: $92.16)
Facility rent: $9.0M
Facility fees: $4.2M (@ $2.00 per ticket)
Ticketmaster fees: $2.8M
Suite revenue (net): $22.1M
Club seat revenue (net): $14.3M
Concessions revenue: $31.6M ($17 per capita)
Merchandise revenue (net): $12.4M
Parking revenue (net): $5.5M
Total Stadium Revenue: $264 Million (Annual)
14
Source: LVS-Majestic Model, May 2016
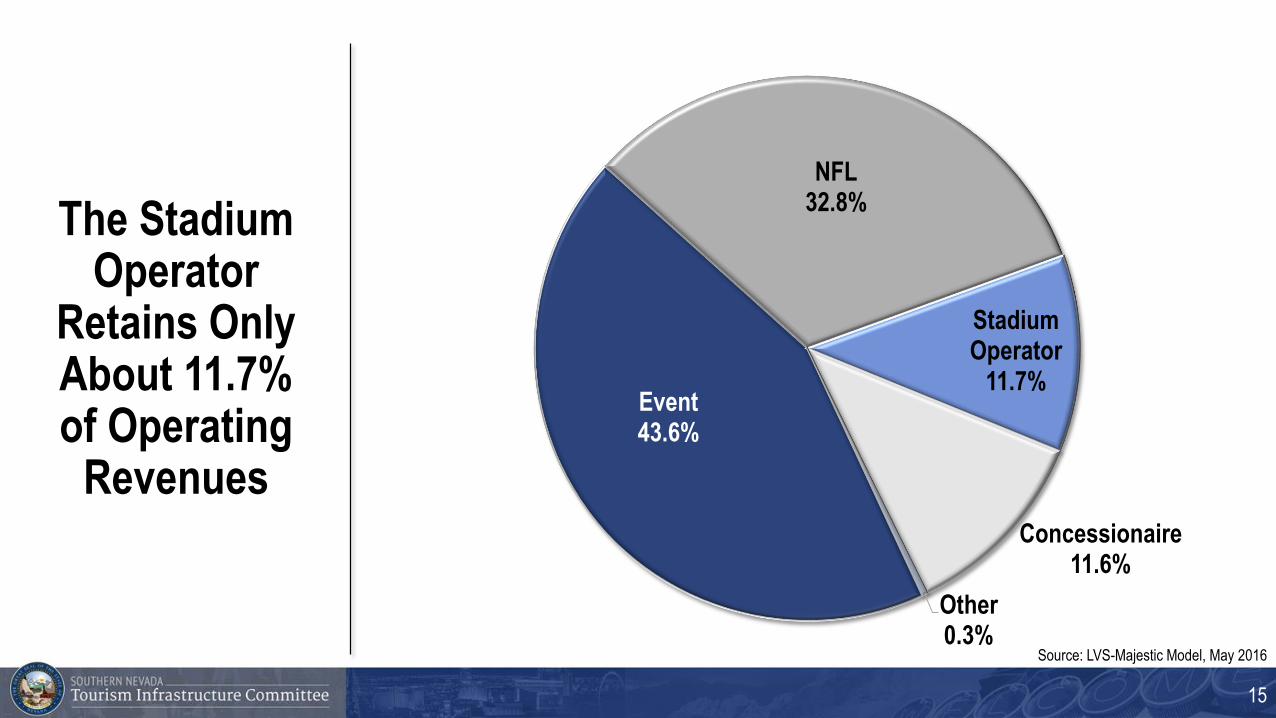
The Stadium Operator
Retains Only About 11.7% of Operating
Revenues
Event43.6%
NFL32.8%
StadiumOperator
11.7%
Concessionaire11.6%
Other0.3%
Source: LVS-Majestic Model, May 2016
15
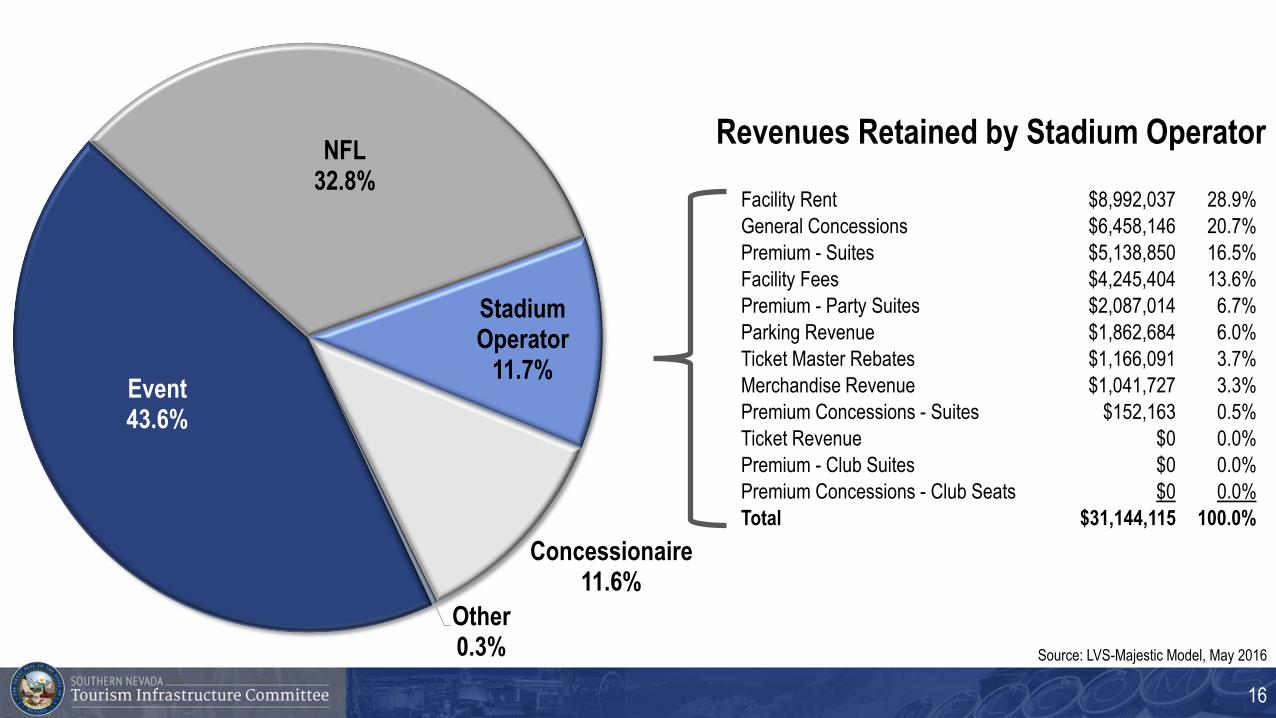
Facility Rent $8,992,037 28.9%
General Concessions $6,458,146 20.7%
Premium - Suites $5,138,850 16.5%
Facility Fees $4,245,404 13.6%
Premium - Party Suites $2,087,014 6.7%
Parking Revenue $1,862,684 6.0%
Ticket Master Rebates $1,166,091 3.7%
Merchandise Revenue $1,041,727 3.3%
Premium Concessions - Suites $152,163 0.5%
Ticket Revenue $0 0.0%
Premium - Club Suites $0 0.0%
Premium Concessions - Club Seats $0 0.0%
Total $31,144,115 100.0%
Revenues Retained by Stadium Operator
Event43.6%
NFL32.8%
StadiumOperator
11.7%
Concessionaire11.6%
Other0.3% Source: LVS-Majestic Model, May 2016
16
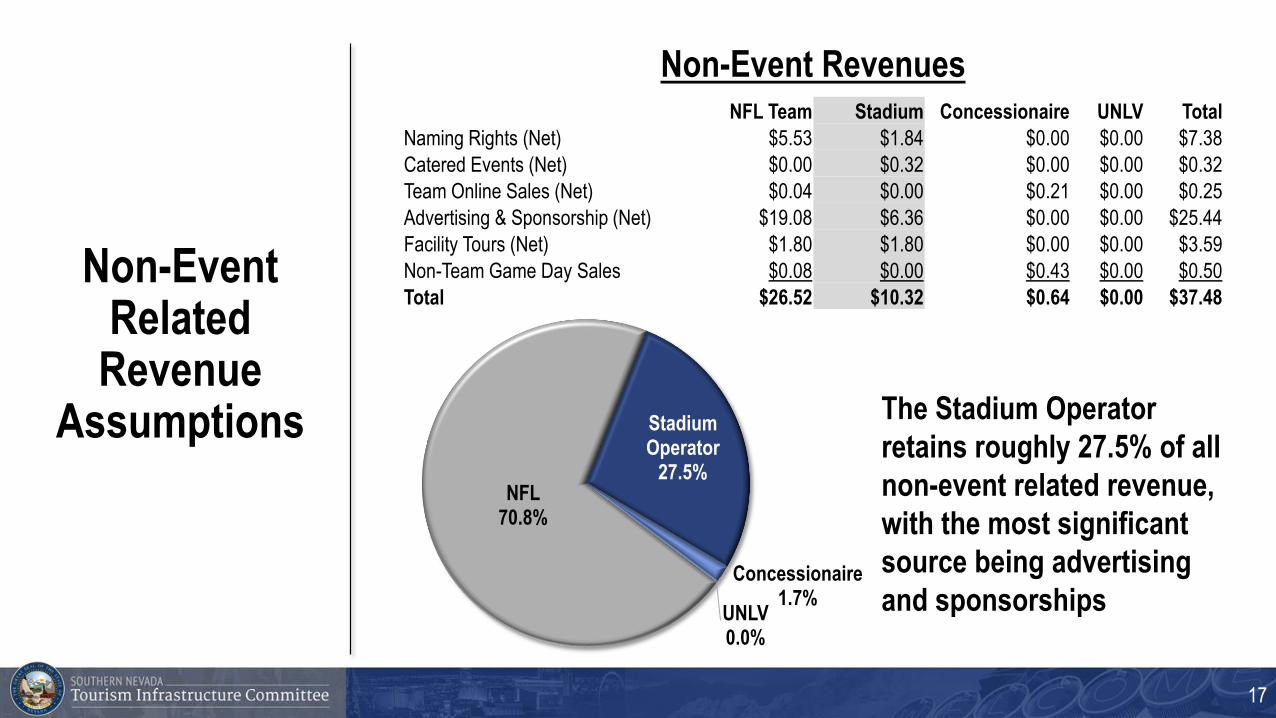
Non-Event Related
Revenue Assumptions
NFL Team Stadium Concessionaire UNLV Total
Naming Rights (Net) $5.53 $1.84 $0.00 $0.00 $7.38
Catered Events (Net) $0.00 $0.32 $0.00 $0.00 $0.32
Team Online Sales (Net) $0.04 $0.00 $0.21 $0.00 $0.25
Advertising & Sponsorship (Net) $19.08 $6.36 $0.00 $0.00 $25.44
Facility Tours (Net) $1.80 $1.80 $0.00 $0.00 $3.59
Non-Team Game Day Sales $0.08 $0.00 $0.43 $0.00 $0.50
Total $26.52 $10.32 $0.64 $0.00 $37.48
NFL70.8%
StadiumOperator
27.5%
Concessionaire1.7%
UNLV0.0%
The Stadium Operator
retains roughly 27.5% of all
non-event related revenue,
with the most significant
source being advertising
and sponsorships
Non-Event Revenues
17
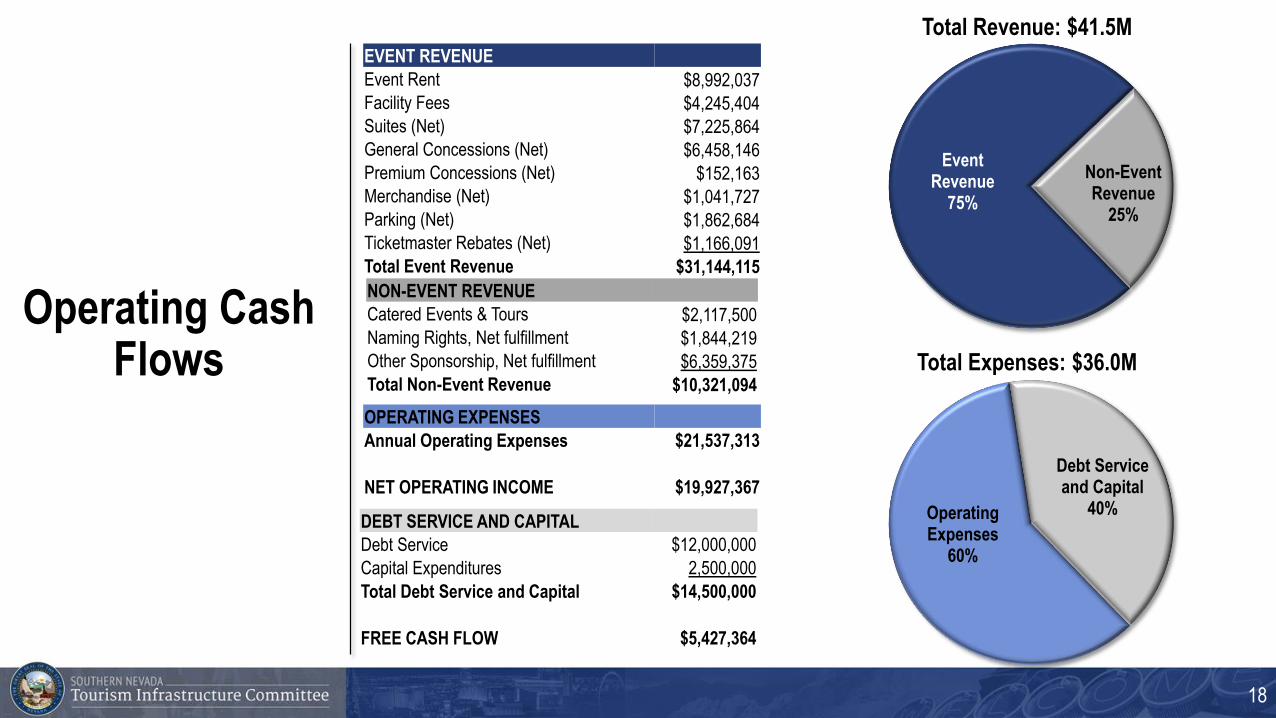
Operating Cash Flows
NON-EVENT REVENUE
Catered Events & Tours $2,117,500
Naming Rights, Net fulfillment $1,844,219
Other Sponsorship, Net fulfillment $6,359,375
Total Non-Event Revenue $10,321,094
EVENT REVENUE
Event Rent $8,992,037
Facility Fees $4,245,404
Suites (Net) $7,225,864
General Concessions (Net) $6,458,146
Premium Concessions (Net) $152,163
Merchandise (Net) $1,041,727
Parking (Net) $1,862,684
Ticketmaster Rebates (Net) $1,166,091
Total Event Revenue $31,144,115
Event Revenue
75%
Non-Event Revenue
25%
Operating Expenses
60%
Debt Service and Capital
40%
OPERATING EXPENSES
Annual Operating Expenses $21,537,313
NET OPERATING INCOME $19,927,367
DEBT SERVICE AND CAPITAL
Debt Service $12,000,000
Capital Expenditures 2,500,000
Total Debt Service and Capital $14,500,000
FREE CASH FLOW $5,427,364
Total Revenue: $41.5M
Total Expenses: $36.0M
18
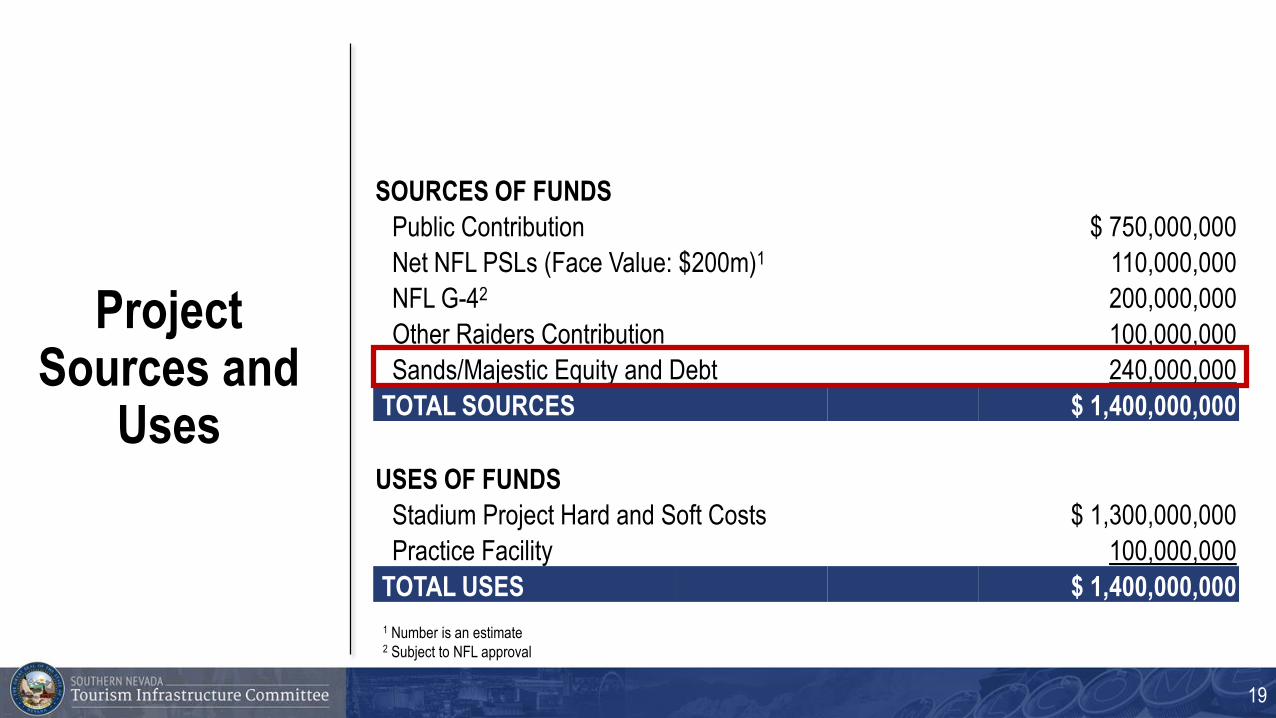
Project Sources and
Uses
SOURCES OF FUNDS
Public Contribution $ 750,000,000
Net NFL PSLs (Face Value: $200m)1 110,000,000
NFL G-42 200,000,000
Other Raiders Contribution 100,000,000
Sands/Majestic Equity and Debt 240,000,000
TOTAL SOURCES $ 1,400,000,000
USES OF FUNDS
Stadium Project Hard and Soft Costs $ 1,300,000,000
Practice Facility 100,000,000
TOTAL USES $ 1,400,000,000
1 Number is an estimate2 Subject to NFL approval
19
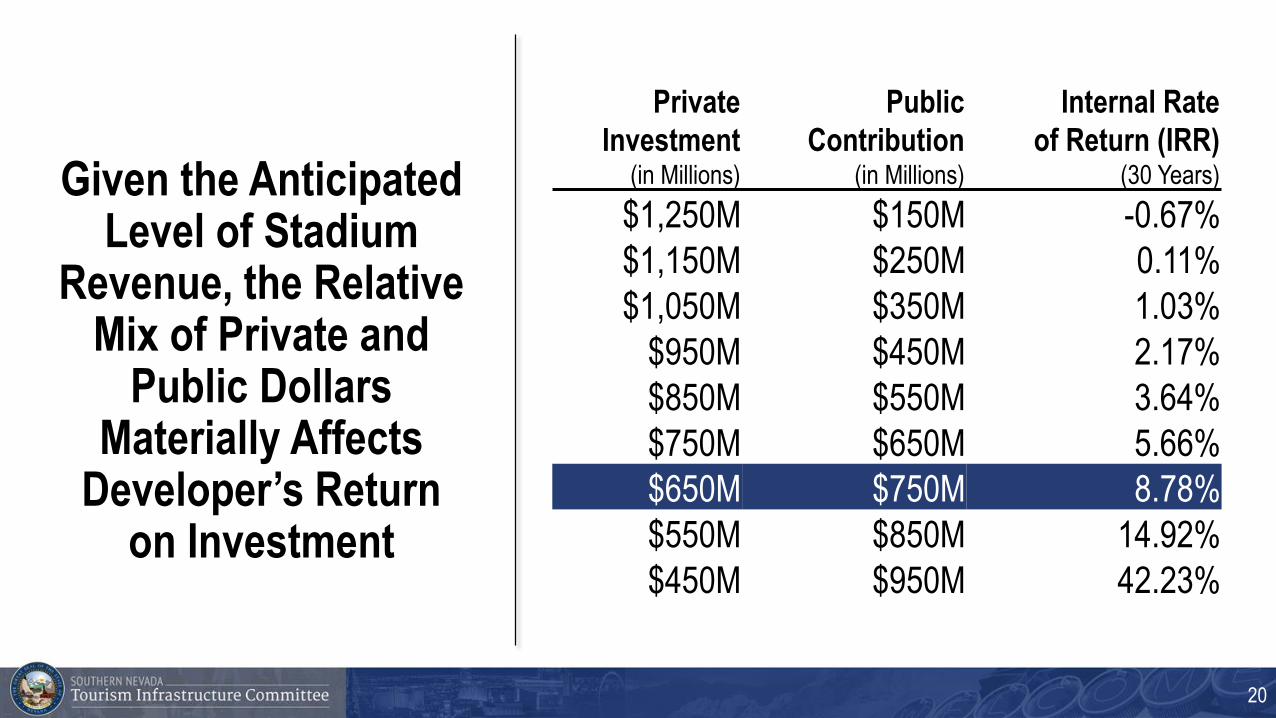
Private
Investment(in Millions)
Public
Contribution(in Millions)
Internal Rate
of Return (IRR)(30 Years)
$1,250M $150M -0.67%
$1,150M $250M 0.11%
$1,050M $350M 1.03%
$950M $450M 2.17%
$850M $550M 3.64%
$750M $650M 5.66%
$650M $750M 8.78%
$550M $850M 14.92%
$450M $950M 42.23%
Given the Anticipated Level of Stadium
Revenue, the Relative Mix of Private and
Public Dollars Materially Affects
Developer’s Return on Investment
20
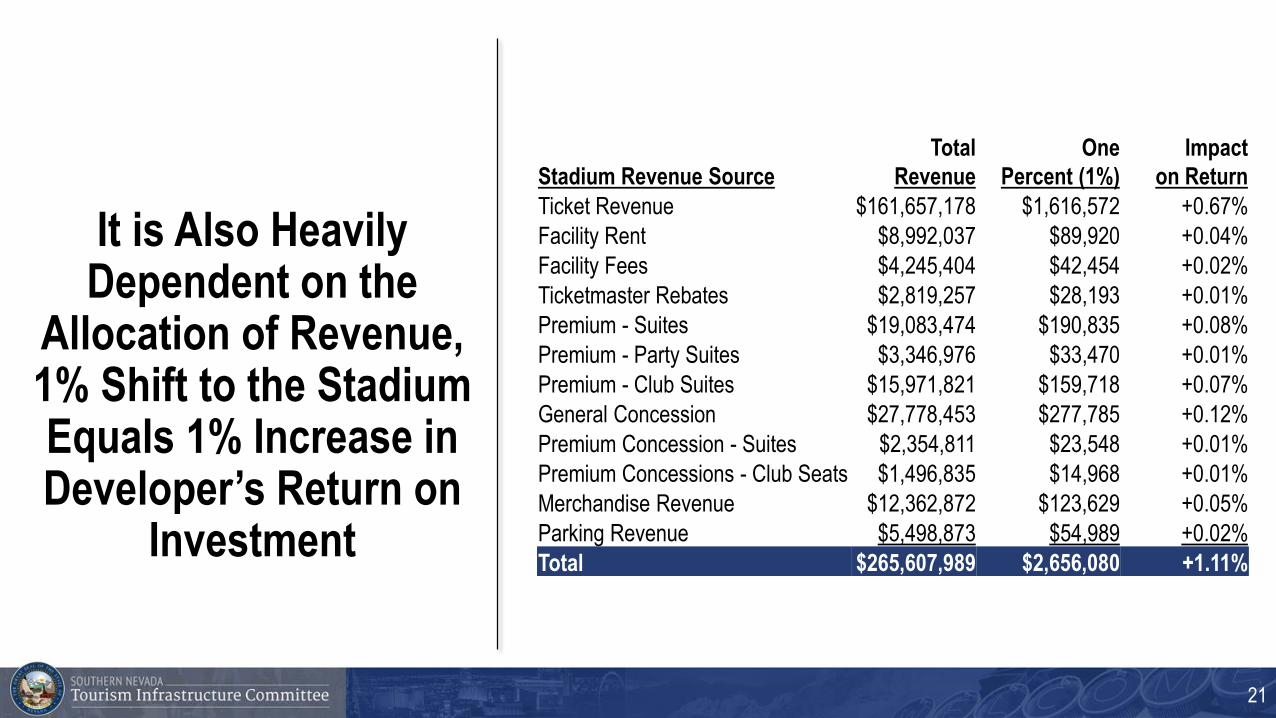
It is Also Heavily Dependent on the
Allocation of Revenue, 1% Shift to the Stadium Equals 1% Increase in Developer’s Return on
Investment
Stadium Revenue Source
Total
Revenue
One
Percent (1%)
Impact
on Return
Ticket Revenue $161,657,178 $1,616,572 +0.67%
Facility Rent $8,992,037 $89,920 +0.04%
Facility Fees $4,245,404 $42,454 +0.02%
Ticketmaster Rebates $2,819,257 $28,193 +0.01%
Premium - Suites $19,083,474 $190,835 +0.08%
Premium - Party Suites $3,346,976 $33,470 +0.01%
Premium - Club Suites $15,971,821 $159,718 +0.07%
General Concession $27,778,453 $277,785 +0.12%
Premium Concession - Suites $2,354,811 $23,548 +0.01%
Premium Concessions - Club Seats $1,496,835 $14,968 +0.01%
Merchandise Revenue $12,362,872 $123,629 +0.05%
Parking Revenue $5,498,873 $54,989 +0.02%
Total $265,607,989 $2,656,080 +1.11%
21
MODEL REVISIONS AND STRESS TESTING
22
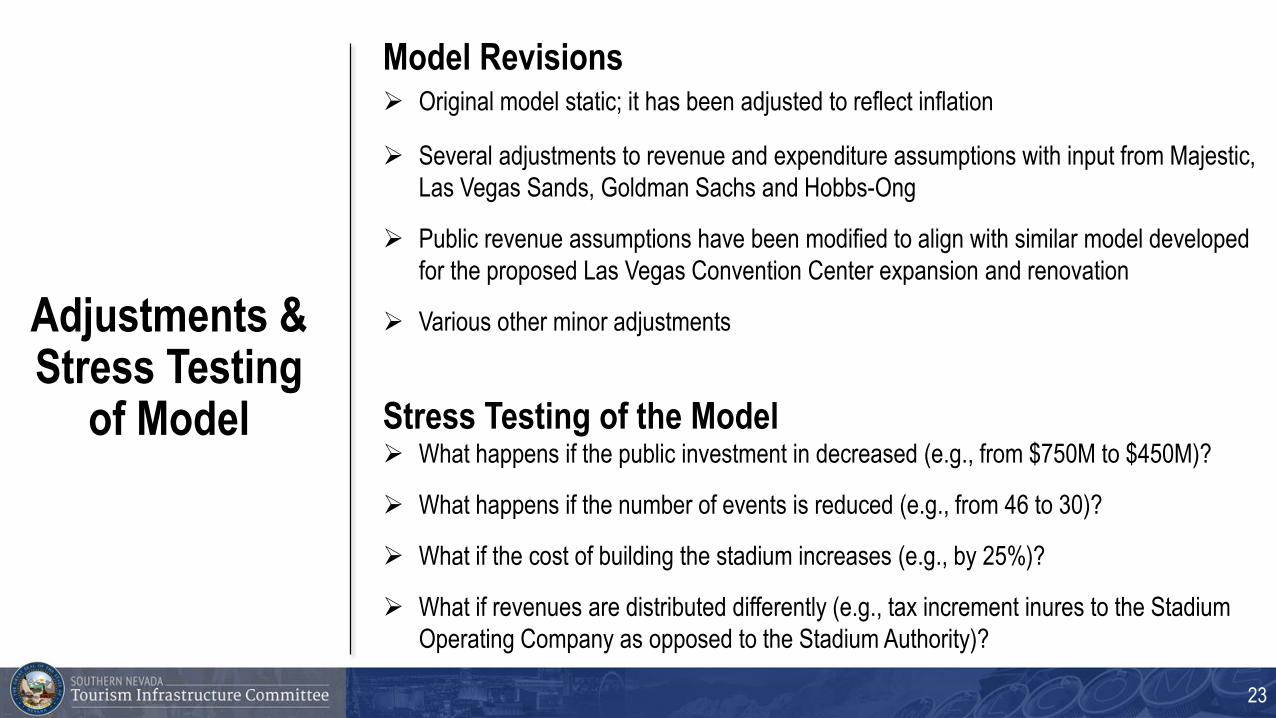
Adjustments & Stress Testing
of Model
Original model static; it has been adjusted to reflect inflation
Several adjustments to revenue and expenditure assumptions with input from Majestic,
Las Vegas Sands, Goldman Sachs and Hobbs-Ong
Public revenue assumptions have been modified to align with similar model developed
for the proposed Las Vegas Convention Center expansion and renovation
Various other minor adjustments
What happens if the public investment in decreased (e.g., from $750M to $450M)?
What happens if the number of events is reduced (e.g., from 46 to 30)?
What if the cost of building the stadium increases (e.g., by 25%)?
What if revenues are distributed differently (e.g., tax increment inures to the Stadium
Operating Company as opposed to the Stadium Authority)?
Stress Testing of the Model
Model Revisions
23
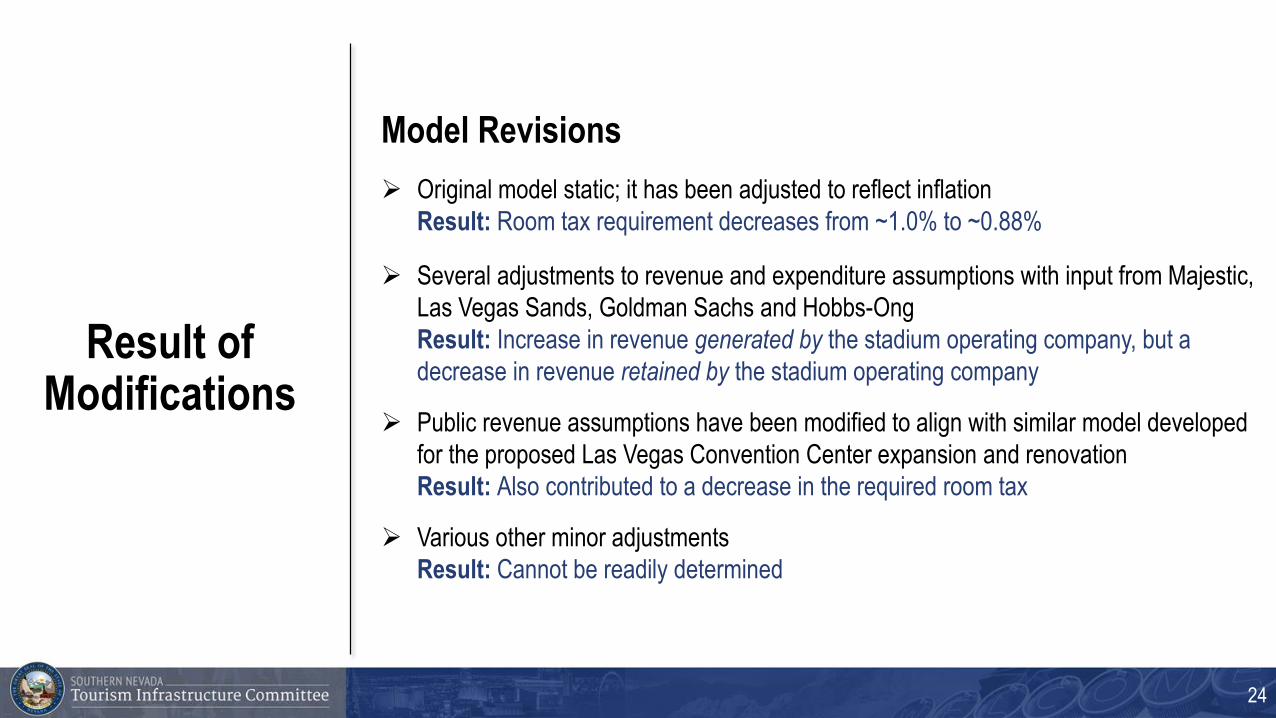
Result of Modifications
Original model static; it has been adjusted to reflect inflation
Result: Room tax requirement decreases from ~1.0% to ~0.88%
Several adjustments to revenue and expenditure assumptions with input from Majestic,
Las Vegas Sands, Goldman Sachs and Hobbs-Ong
Result: Increase in revenue generated by the stadium operating company, but a
decrease in revenue retained by the stadium operating company
Public revenue assumptions have been modified to align with similar model developed
for the proposed Las Vegas Convention Center expansion and renovation
Result: Also contributed to a decrease in the required room tax
Various other minor adjustments
Result: Cannot be readily determined
Model Revisions
24
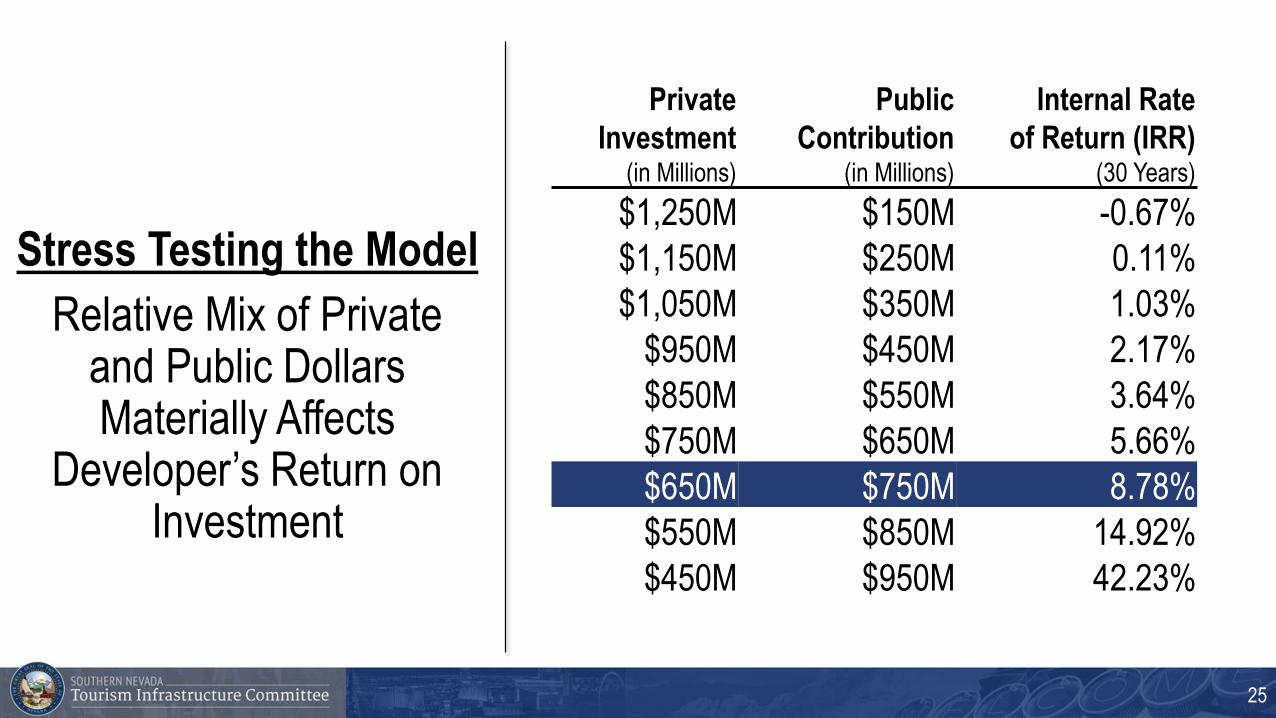
Stress Testing the Model
Relative Mix of Private and Public Dollars Materially Affects
Developer’s Return on Investment
Private
Investment(in Millions)
Public
Contribution(in Millions)
Internal Rate
of Return (IRR)(30 Years)
$1,250M $150M -0.67%
$1,150M $250M 0.11%
$1,050M $350M 1.03%
$950M $450M 2.17%
$850M $550M 3.64%
$750M $650M 5.66%
$650M $750M 8.78%
$550M $850M 14.92%
$450M $950M 42.23%
25
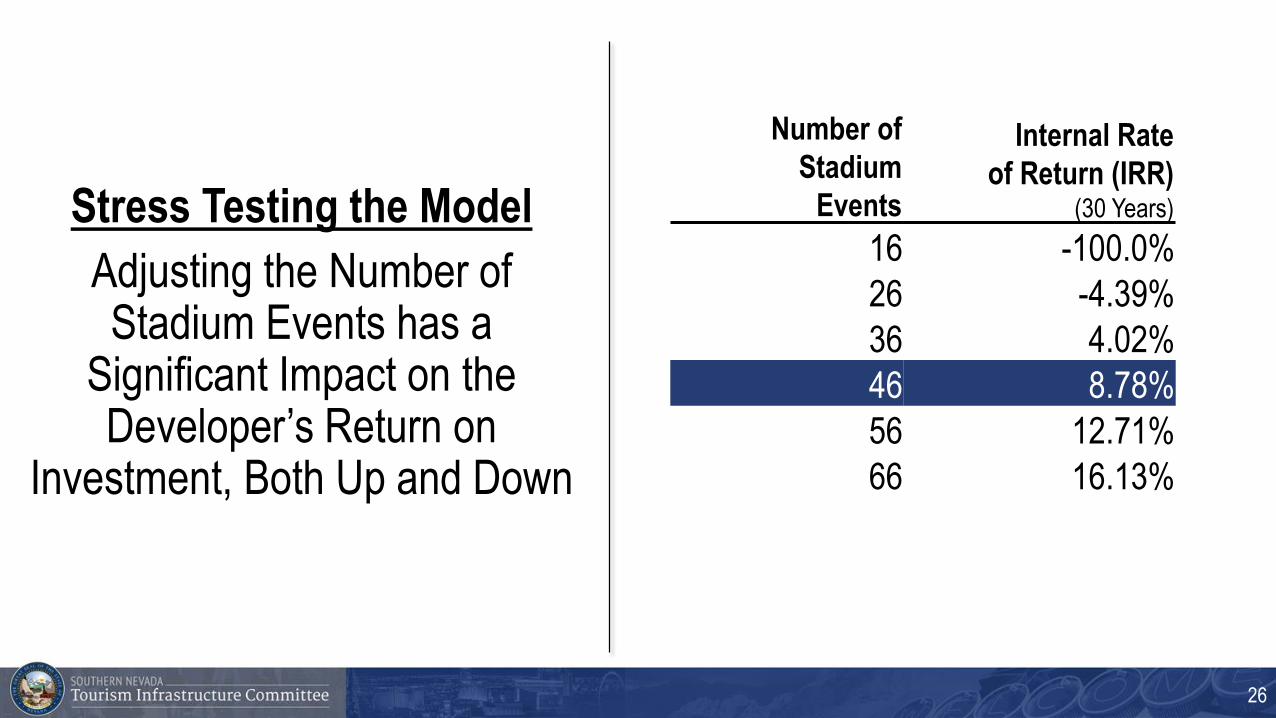
Number of
Stadium
Events
Internal Rate
of Return (IRR)(30 Years)
16 -100.0%
26 -4.39%
36 4.02%
46 8.78%
56 12.71%
66 16.13%
Stress Testing the Model
Adjusting the Number of Stadium Events has a
Significant Impact on the Developer’s Return on
Investment, Both Up and Down
26
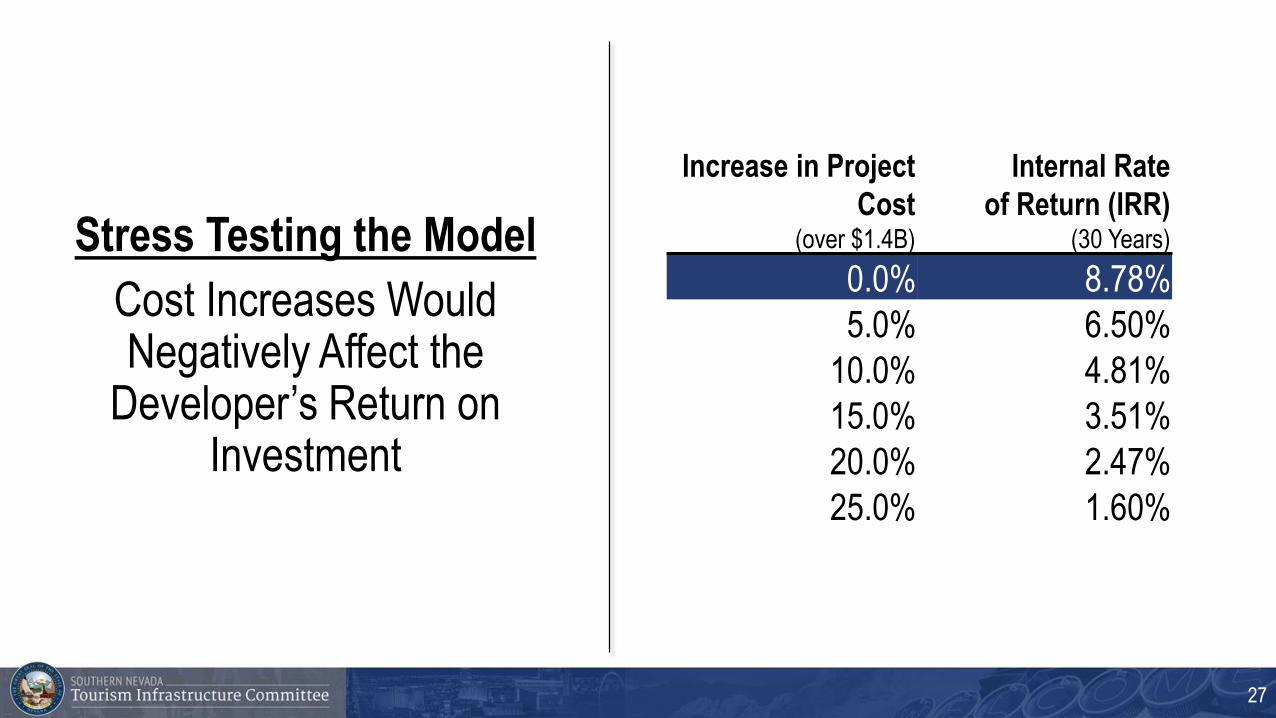
Increase in Project
Cost(over $1.4B)
Internal Rate
of Return (IRR)(30 Years)
0.0% 8.78%
5.0% 6.50%
10.0% 4.81%
15.0% 3.51%
20.0% 2.47%
25.0% 1.60%
Stress Testing the Model
Cost Increases Would Negatively Affect the
Developer’s Return on Investment
27
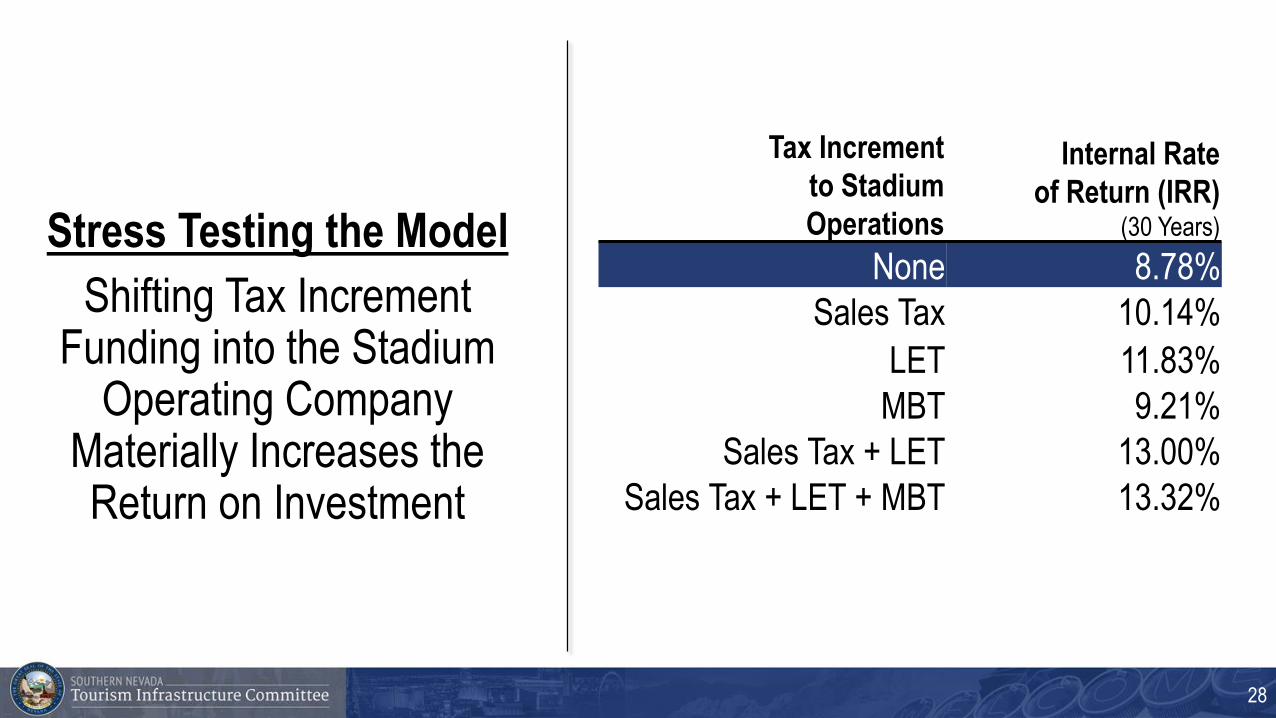
Tax Increment
to Stadium
Operations
Internal Rate
of Return (IRR)(30 Years)
None 8.78%
Sales Tax 10.14%
LET 11.83%
MBT 9.21%
Sales Tax + LET 13.00%
Sales Tax + LET + MBT 13.32%
Stress Testing the Model
Shifting Tax Increment Funding into the Stadium
Operating Company Materially Increases the Return on Investment
28
KEY CONSIDERATIONS AND NEXT STEPS
29
Further Vetting is Required
Further review is needed to better understand the reasonableness of
pricing assumptions
Distributions to stadium operator appear modest (11.7%), need to
ensure that this is consistent similarly-situated venues
Analysis of tax increment area is important; current model is specific
only to the stadium itself but this area could be expanded, which
affects project economics
30
Key Considerations and Next Steps
Stadium development model is complex and assumption sensitive
Number of events is a critical consideration; Las Vegas has a
competitive advantage, but the projections may be aggressive (they
may also be conservative)
Potential strategy:
– Tier 1: Targeted return for developer of 9.0%
– Tier 2: Residual distributions to state and developer based on
investment share
Development of Plan B (Collegiate Stadium Alternative) in the event
that an NFL team does not get approved in 18 months, analysis
pending
31

Stadium ProposalReview of Proposal | Update on Modeling Progress
DRAFT | For Discussion Purposes