Embed Size (px)
Citation preview
THE OPEN DATA INVENTORY
OPEN DATA WATCH, INC. - WWW.OPENDATAWATCH.COM
How Open Are Official Statistics?
2015 ANNUAL REPORT
ODIN 2015
ODIN ONLINE
odin.opendatawatch.com
125 Countries20 Data Categories
SOCIAL STATISTICSPopulation & Vital Statistics
Education FacilitiesEducation Outcomes
Health FacilitiesHealth Outcomes
Reproductive HealthGender Statistics
Poverty & Income StatisticsECONOMIC
National AccountsLabor Statistics
Price IndexesGovernment Finance
Money & BankingInternational Trade
Balance of PaymentsENVIRONMENT
Land UseResource Use
Energy UsePollution
Built Environment
10 Elements
COVERAGE
Indicator Coverage
Data Available Last 5 Years
Data Available Last 10 Years
First Administrative Level
Second Administrative Level
OPENNESS
Machine Readable
Non-proprietary
Download Options
Metadata Available
Free/ unrestricted use and reuse
X
THE OPEN DATA INVENTORY
2015 ANNUAL REPORT
OPEN DATA WATCH, INC. - WWW.OPENDATAWATCH.COM
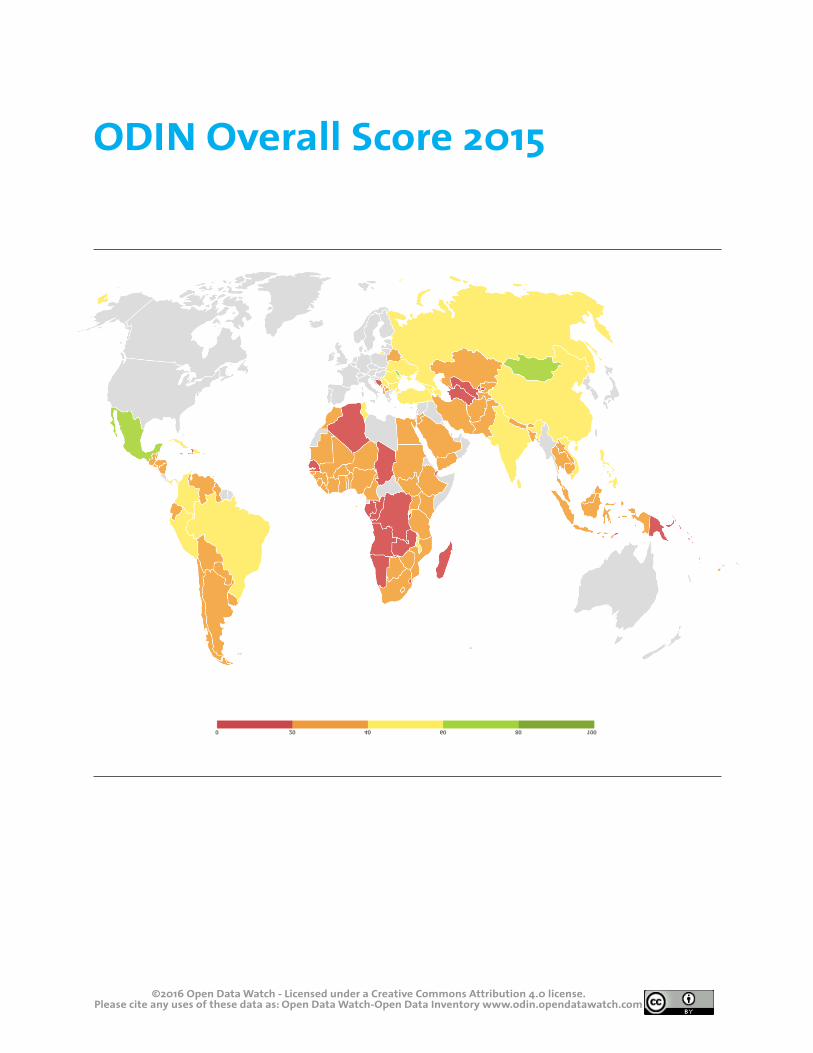
ODIN Overall Score 2015
©2016 Open Data Watch - Licensed under a Creative Commons Attribution 4.0 license. Please cite any uses of these data as: Open Data Watch-Open Data Inventory www.odin.opendatawatch.com
2015 ODIN Annual Report www.opendatawatch.com 1
Introducing ODIN
In 2015 the Open Data Inventory (ODIN) assessed the coverage and openness of official statistics in 125 mostly low- and middle-income countries. Data in 20 statistical categories were assessed on 10 elements of coverage and openness. The assessments are objective: they record whether data are available and whether the data conform to standards for open data, but they do not attempt to assess the quality of the data. They also record the online location of the data, allowing others to verify the results.
ODIN scores are summarized by data categories and by the elements of data coverage and openness, creating a profile of each country’s statistical system and its ability to deliver the information needed by governments, citizens, and the private sector to guide their decisions. In 2015 no country’s ODIN score reached 70 percent of the total possible points. The highest scoring country was Mexico, with a score of 68 percent, followed closely by Moldova and Mongolia. Rwanda, with a score of 59 percent, was 4th overall and the highest scoring country in Africa. The lowest scoring countries were found in parts of Africa, Asia, and Europe. Measured just on the elements of openness, Mexico was the clear leader with a score
of 74 percent, followed by Rwanda and Moldova. Measured by data coverage, which considers the availability of key indicators over the last 10 years and for sub-national units, Cuba had the highest score, followed by China and Moldova.
There is more to be learned from the ODIN assessments. This first annual report on the Open Data Inventory describes the assessment process and highlights significant patterns in the results. The appendixes list results for 125 countries and provide greater details on the assessment methodology as well as orientation for obtaining ODIN results online at http://odin.opendatawatch.com/.
What is ODIN? The Open Data Inventory (ODIN) is an assessment of the coverage and openness of data provided on the websites maintained by national statistical offices (NSOs). Each assessment covers twenty categories of social, economic, and environmental statistics. Each data category is assessed on five elements of coverage and five elements of openness. The twenty categories assessed by ten elements result in two hundred item scores for each country. Aggregate scores are computed across the categories and elements and for sub-groups of categories and elements. The overall ODIN score is an indicator
of how complete and open an NSO’s data offerings are. The categorical scores for social, economic, and environmental statistics and summary scores for coverage and openness produce a picture of the national statistical systems’ strengths and weaknesses.
In its first year of operation, ODIN contains complete assessments of 125 countries. More will be added with each annual update with the goal of including all recognized national statistical systems.
125 Complete Country Assessments
Introducing ODIN
www.opendatawatch.com 2015 ODIN Annual Report2
What is its purpose? By providing a comprehensive view of the coverage and openness of official statistics, ODIN will help to identify critical gaps, promote open data policies, improve data access, and encourage dialogue between NSOs and data users. NSOs and their development partners can use ODIN as part of a strategic planning process and as a measuring rod for the development of the statistical system. ODIN also provides valuable
information to data users within the government and private sectors and to the general public about the availability of important statistical series. In addition to the ratings of coverage and openness in twenty statistical categories, ODIN assessments record the online location of key indicators in each data category, permitting quick access to hundreds of indicators.
Introducing ODIN
Why assess national statistical offices? ODIN assessments begin with the websites maintained by national statistical offices because, in most countries, the NSO is the lead agency of the national statistical system, coordinating its work with other governmental bodies that produce official statistics. Of course, the responsibilities of NSOs differ from country to country. It is not uncommon for important statistics to be produced by autonomous agencies such as the central bank or ministries of education, health, or planning, which may not report directly to the NSO or the chief statistician. If a national data source can be reached from the NSO’s website, it is included in the ODIN assessment. However, external data portals, such as the African Development Bank’s Open Data for Africa (http://www.afdb.org/en/knowledge/statistics/open-data-for-africa/), the World Bank Data website
(http://data.worldbank.org/), or the many databases maintained by other international agencies (see http://data.un.org/) are not included in the assessment.
NSOs, as producers and caretakers of official statistics, have a special obligation to maximize their public benefit. NSOs can and should be the leading advocate for and provider of high quality, official statistics to government, the public, and to the international community. Indeed, an NSO that subscribes to the United Nations’ Fundamental Principles of Official Statistics is committed by Principle 1 to provide “… official statistics that meet the test of practical utility … compiled and made available on an impartial basis by official statistical agencies to honor citizens’ entitlement to public information.”
How are Open Data defined?There is general agreement on the core meaning of open data. As summarized in the Open Definition version 2.1 (http://opendefinition.org/od/2.1/en/) “Knowledge is open if anyone is free to access, use, modify, and share it — subject, at most, to measures that preserve provenance and openness.” This concept has been elaborated by governmental and non-governmental organizations. The International Open Data Charter (http://opendatacharter.net/) provides one of the most detailed explanations.
In practical terms open data should be machine readable in non-proprietary formats, selectable by users, accompanied by accurate metadata, and free to be used and reused for any purpose without limitations other than acknowledgement of the original source. These core elements have been incorporated into the ODIN assessment. A more detailed description of the elements on which openness is scored is available in the methodological appendix to this report.
2015 ODIN Annual Report www.opendatawatch.com 3
What data categories are included in ODIN?ODIN assessments review published statistics in twenty categories, grouped as social statistics (eight categories), economic and financial statistics (seven categories), and environmental statistics (five categories). Although each group contains a different number of data categories, the ODIN overall scores weight the three groups equally. For each category, a small set of principal or sentinel indicators has been identified. These were selected because they are frequently needed for developing and implementing public policies or private initiatives and because they provide evidence of underlying statistical processes for which statistical offices are responsible. The guidelines for assessing data coverage in each category are
described in the methodological appendix to this report. All of the data included in ODIN may be termed “macro” data, in contrast to the “micro” or unit-record data collected through censuses, surveys, and administrative records. ODIN does not evaluate micro data because the approach to assessing their openness would be quite different. However, the principles of open data are just as important for public access to properly curated micro databases. The International Household Survey Network maintains a global catalog of censuses and surveys (http://catalog.ihsn.org/index.php/catalog), which includes information about public access to the data.
Introducing ODIN
ODIN will help to identify critical gaps, promote open data policies, improve data access, and encourage dialogue between NSOs and data users
www.opendatawatch.com 2015 ODIN Annual Report4
ODIN Results
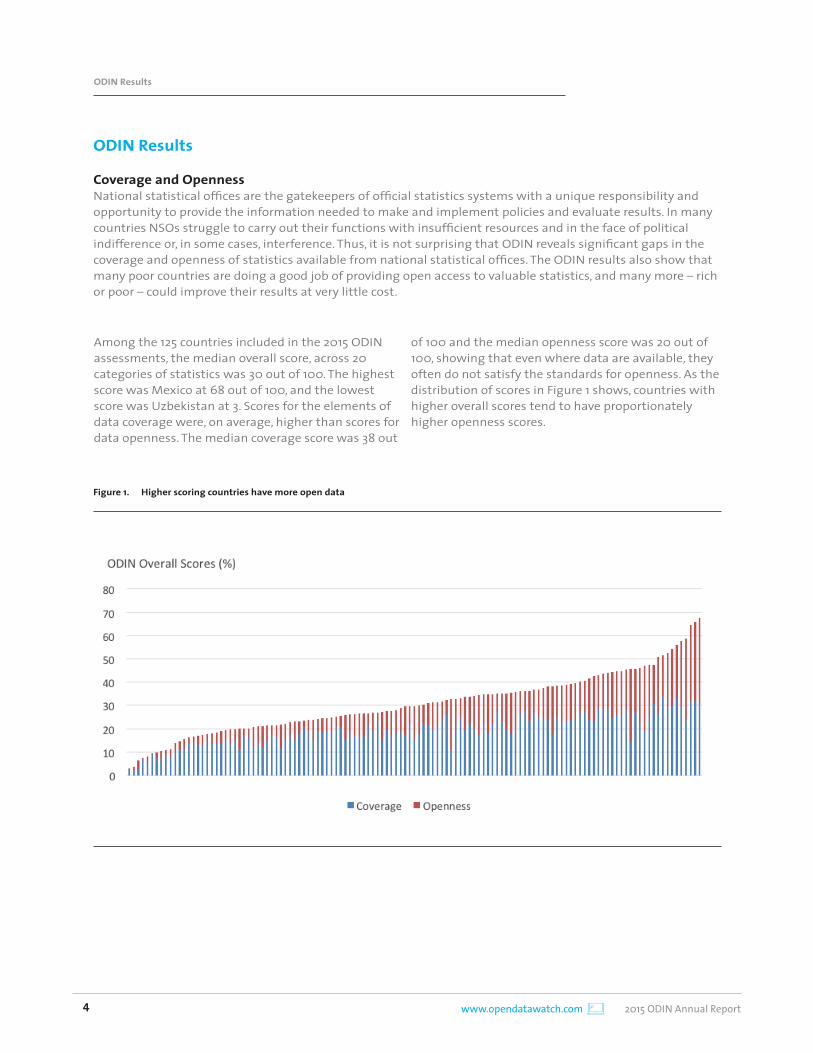
Coverage and OpennessNational statistical offices are the gatekeepers of official statistics systems with a unique responsibility and opportunity to provide the information needed to make and implement policies and evaluate results. In many countries NSOs struggle to carry out their functions with insufficient resources and in the face of political indifference or, in some cases, interference. Thus, it is not surprising that ODIN reveals significant gaps in the coverage and openness of statistics available from national statistical offices. The ODIN results also show that many poor countries are doing a good job of providing open access to valuable statistics, and many more – rich or poor – could improve their results at very little cost.
Among the 125 countries included in the 2015 ODIN assessments, the median overall score, across 20 categories of statistics was 30 out of 100. The highest score was Mexico at 68 out of 100, and the lowest score was Uzbekistan at 3. Scores for the elements of data coverage were, on average, higher than scores for data openness. The median coverage score was 38 out
of 100 and the median openness score was 20 out of 100, showing that even where data are available, they often do not satisfy the standards for openness. As the distribution of scores in Figure 1 shows, countries with higher overall scores tend to have proportionately higher openness scores.
Figure 1. Higher scoring countries have more open data
ODIN Results
2015 ODIN Annual Report www.opendatawatch.com 5
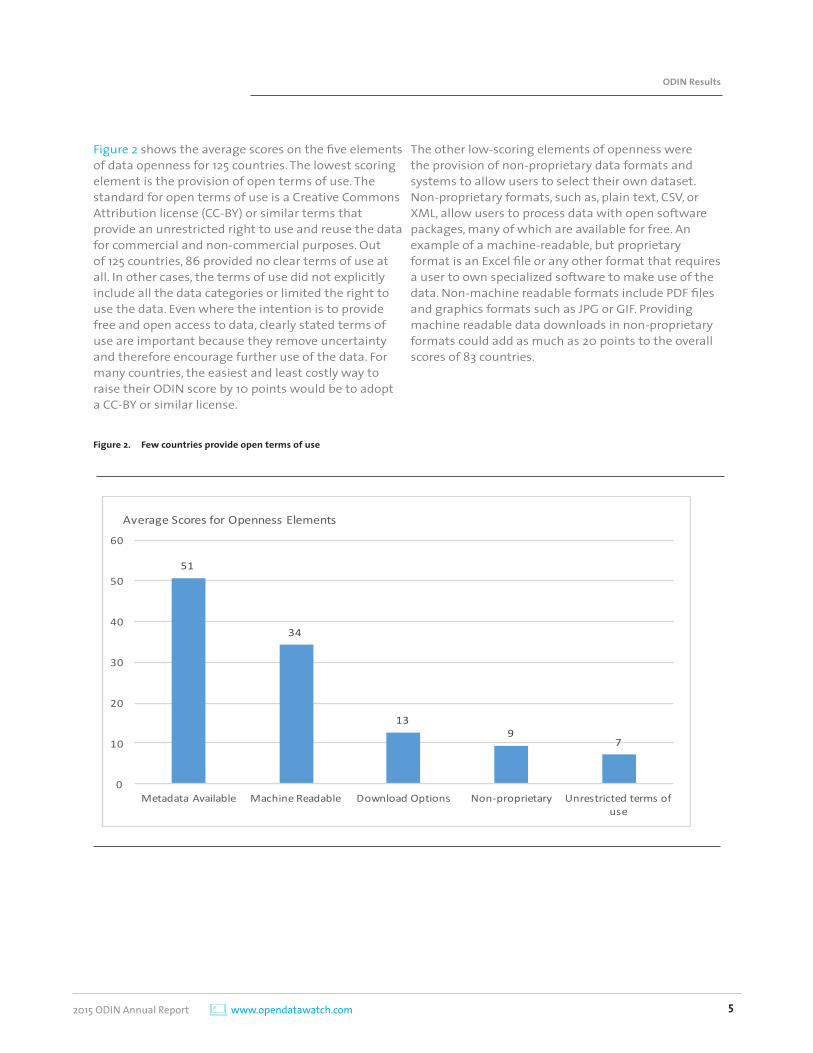
Figure 2 shows the average scores on the five elements of data openness for 125 countries. The lowest scoring element is the provision of open terms of use. The standard for open terms of use is a Creative Commons Attribution license (CC-BY) or similar terms that provide an unrestricted right to use and reuse the data for commercial and non-commercial purposes. Out of 125 countries, 86 provided no clear terms of use at all. In other cases, the terms of use did not explicitly include all the data categories or limited the right to use the data. Even where the intention is to provide free and open access to data, clearly stated terms of use are important because they remove uncertainty and therefore encourage further use of the data. For many countries, the easiest and least costly way to raise their ODIN score by 10 points would be to adopt a CC-BY or similar license.
The other low-scoring elements of openness were the provision of non-proprietary data formats and systems to allow users to select their own dataset. Non-proprietary formats, such as, plain text, CSV, or XML, allow users to process data with open software packages, many of which are available for free. An example of a machine-readable, but proprietary format is an Excel file or any other format that requires a user to own specialized software to make use of the data. Non-machine readable formats include PDF files and graphics formats such as JPG or GIF. Providing machine readable data downloads in non-proprietary formats could add as much as 20 points to the overall scores of 83 countries.
Figure 2. Few countries provide open terms of use
ODIN Results
51
34
139
7
0
10
20
30
40
50
60
MetadataAvailable MachineReadable DownloadOptions Non-proprietary Unrestrictedtermsofuse
AverageScoresforOpennessElements
www.opendatawatch.com 2015 ODIN Annual Report6
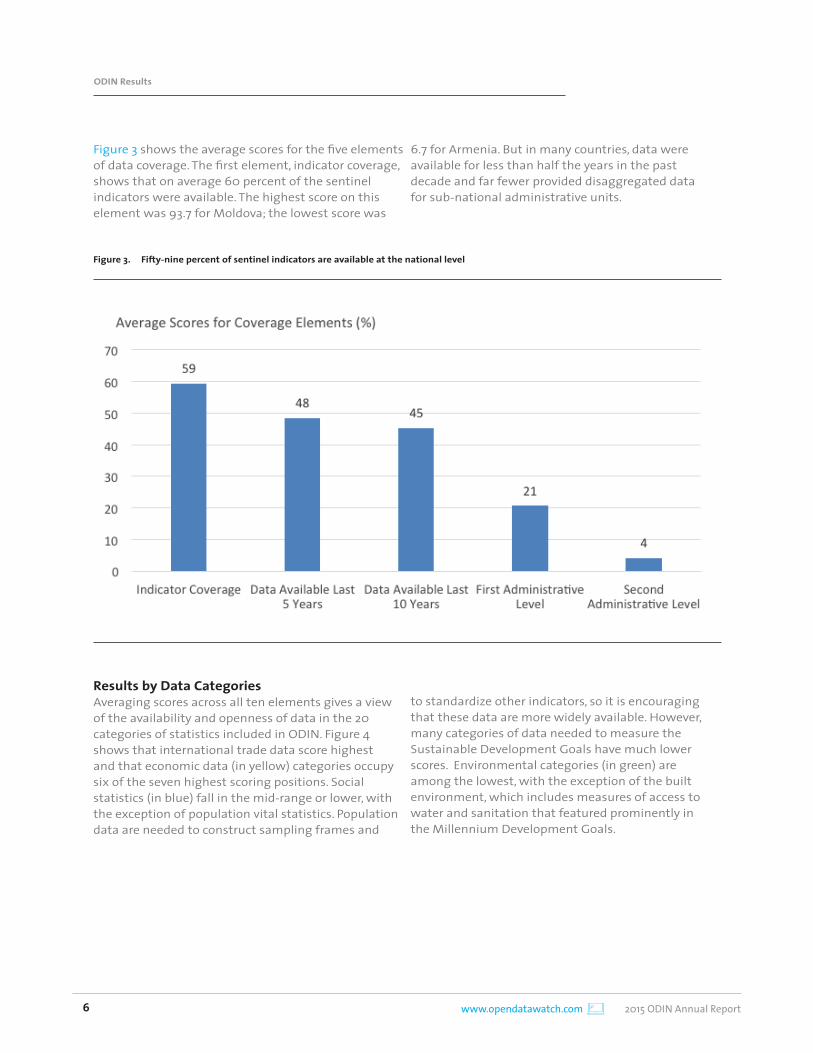
Figure 3 shows the average scores for the five elements of data coverage. The first element, indicator coverage, shows that on average 60 percent of the sentinel indicators were available. The highest score on this element was 93.7 for Moldova; the lowest score was
6.7 for Armenia. But in many countries, data were available for less than half the years in the past decade and far fewer provided disaggregated data for sub-national administrative units.
Figure 3. Fifty-nine percent of sentinel indicators are available at the national level
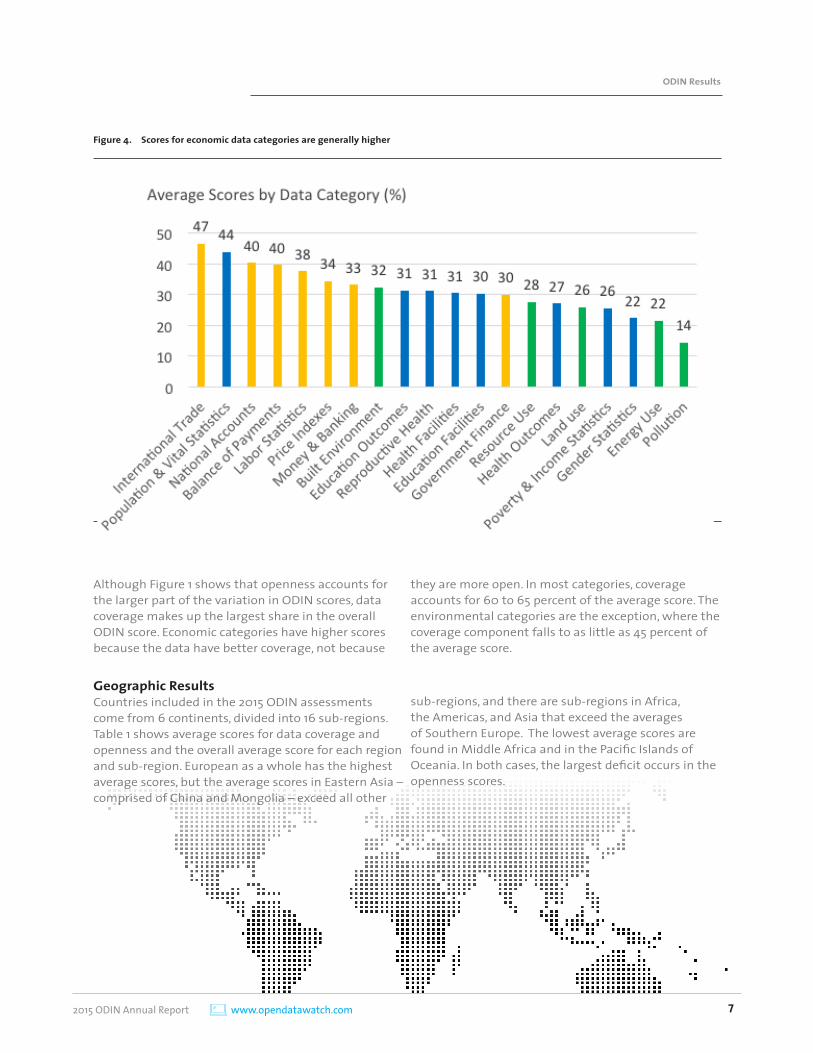
Results by Data CategoriesAveraging scores across all ten elements gives a view of the availability and openness of data in the 20 categories of statistics included in ODIN. Figure 4 shows that international trade data score highest and that economic data (in yellow) categories occupy six of the seven highest scoring positions. Social statistics (in blue) fall in the mid-range or lower, with the exception of population vital statistics. Population data are needed to construct sampling frames and
to standardize other indicators, so it is encouraging that these data are more widely available. However, many categories of data needed to measure the Sustainable Development Goals have much lower scores. Environmental categories (in green) are among the lowest, with the exception of the built environment, which includes measures of access to water and sanitation that featured prominently in the Millennium Development Goals.
ODIN Results
2015 ODIN Annual Report www.opendatawatch.com 7
Although Figure 1 shows that openness accounts for the larger part of the variation in ODIN scores, data coverage makes up the largest share in the overall ODIN score. Economic categories have higher scores because the data have better coverage, not because
they are more open. In most categories, coverage accounts for 60 to 65 percent of the average score. The environmental categories are the exception, where the coverage component falls to as little as 45 percent of the average score.
Figure 4. Scores for economic data categories are generally higher
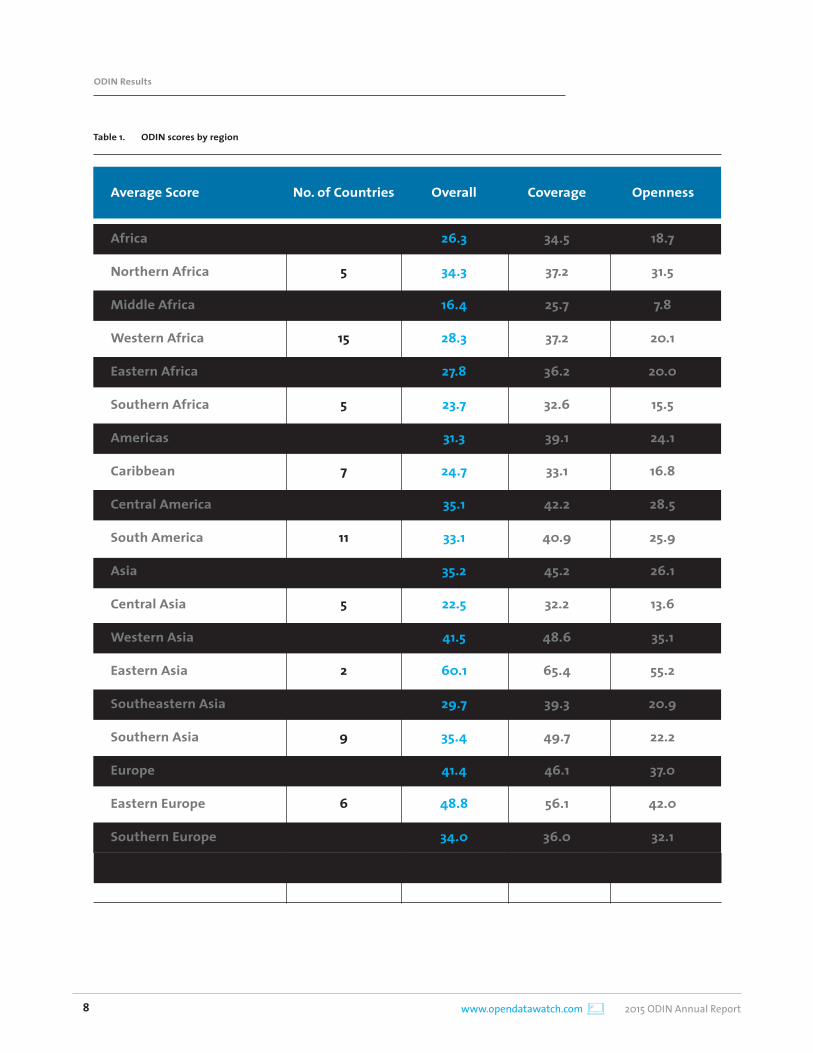
Geographic ResultsCountries included in the 2015 ODIN assessments come from 6 continents, divided into 16 sub-regions. Table 1 shows average scores for data coverage and openness and the overall average score for each region and sub-region. European as a whole has the highest average scores, but the average scores in Eastern Asia – comprised of China and Mongolia – exceed all other
sub-regions, and there are sub-regions in Africa, the Americas, and Asia that exceed the averages of Southern Europe. The lowest average scores are found in Middle Africa and in the Pacific Islands of Oceania. In both cases, the largest deficit occurs in the openness scores.
ODIN Results
www.opendatawatch.com 2015 ODIN Annual Report8
Table 1. ODIN scores by region
Africa
Northern Africa
Middle Africa
Western Africa
Eastern Africa
Southern Africa
Americas
Caribbean
Central America
South America
Asia
Central Asia
Western Asia
Eastern Asia
Southeastern Asia
Southern Asia
Europe
Eastern Europe
Southern Europe
Oceania (Pacific Islands)
Average Score
45
5
7
15
14
5
25
7
7
11
33
5
9
2
8
9
12
6
6
8
No. of Countries
26.3
34.3
16.4
28.3
27.8
23.7
31.3
24.7
35.1
33.1
35.2
22.5
41.5
60.1
29.7
35.4
41.4
48.8
34.0
16.4
Overall
34.5
37.2
25.7
37.2
36.2
32.6
39.1
33.1
42.2
40.9
45.2
32.2
48.6
65.4
39.3
49.7
46.1
56.1
36.0
25.2
Coverage
18.7
31.5
7.8
20.1
20.0
15.5
24.1
16.8
28.5
25.9
26.1
13.6
35.1
55.2
20.9
22.2
37.0
42.0
32.1
8.2
Openness
ODIN Results
2015 ODIN Annual Report www.opendatawatch.com 9
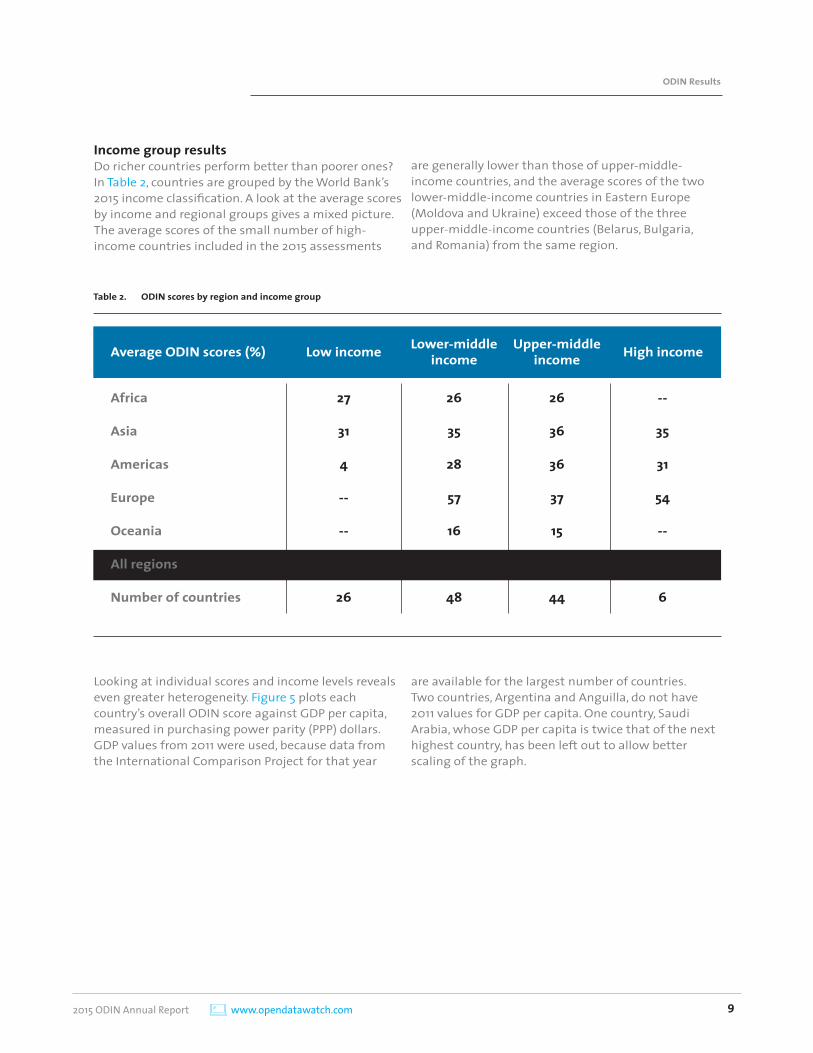
Income group results Do richer countries perform better than poorer ones? In Table 2, countries are grouped by the World Bank’s 2015 income classification. A look at the average scores by income and regional groups gives a mixed picture. The average scores of the small number of high-income countries included in the 2015 assessments
are generally lower than those of upper-middle-income countries, and the average scores of the two lower-middle-income countries in Eastern Europe (Moldova and Ukraine) exceed those of the three upper-middle-income countries (Belarus, Bulgaria, and Romania) from the same region.
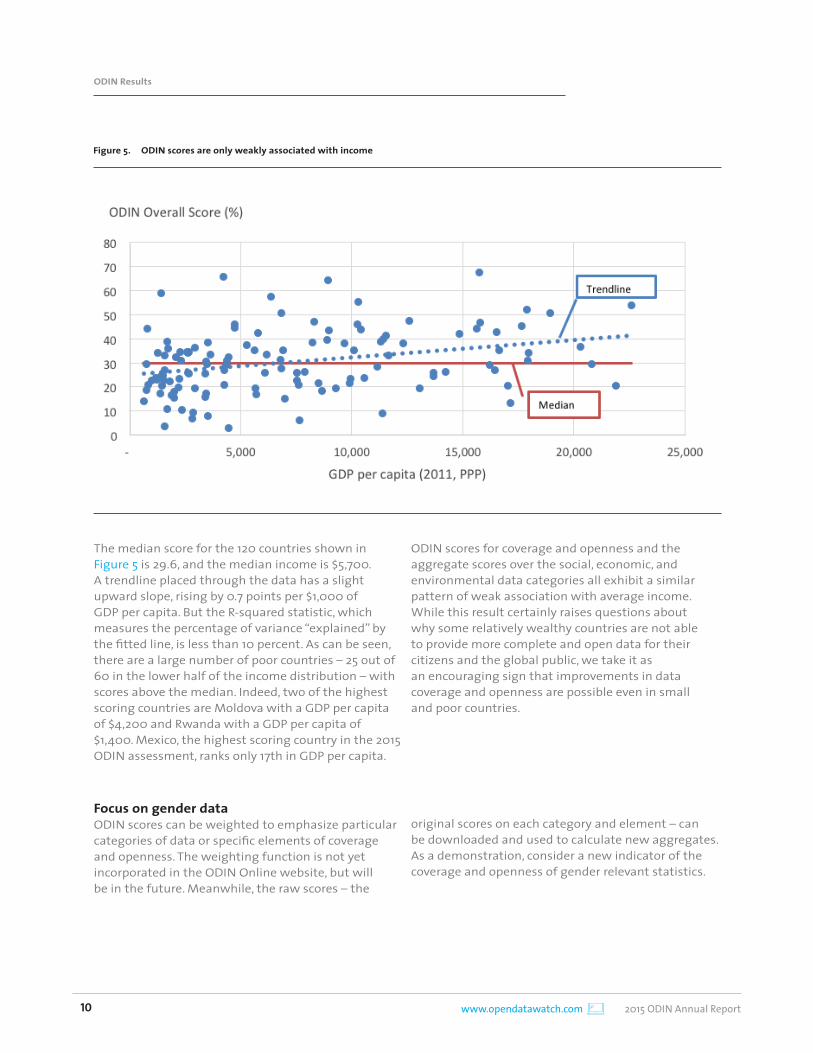
Looking at individual scores and income levels reveals even greater heterogeneity. Figure 5 plots each country’s overall ODIN score against GDP per capita, measured in purchasing power parity (PPP) dollars. GDP values from 2011 were used, because data from the International Comparison Project for that year
are available for the largest number of countries. Two countries, Argentina and Anguilla, do not have 2011 values for GDP per capita. One country, Saudi Arabia, whose GDP per capita is twice that of the next highest country, has been left out to allow better scaling of the graph.
Table 2. ODIN scores by region and income group
Africa
Asia
Americas
Europe
Oceania
All regions
Number of countries
Average ODIN scores (%)
27
31
4
--
--
27
26
Low income
26
35
28
57
16
29
48
Lower-middle income
26
36
36
37
15
33
44
Upper-middle income
--
35
31
54
--
36
6
High income
ODIN Results
www.opendatawatch.com 2015 ODIN Annual Report10
The median score for the 120 countries shown in Figure 5 is 29.6, and the median income is $5,700. A trendline placed through the data has a slight upward slope, rising by 0.7 points per $1,000 of GDP per capita. But the R-squared statistic, which measures the percentage of variance “explained” by the fitted line, is less than 10 percent. As can be seen, there are a large number of poor countries – 25 out of 60 in the lower half of the income distribution – with scores above the median. Indeed, two of the highest scoring countries are Moldova with a GDP per capita of $4,200 and Rwanda with a GDP per capita of $1,400. Mexico, the highest scoring country in the 2015 ODIN assessment, ranks only 17th in GDP per capita.
ODIN scores for coverage and openness and the aggregate scores over the social, economic, and environmental data categories all exhibit a similar pattern of weak association with average income. While this result certainly raises questions about why some relatively wealthy countries are not able to provide more complete and open data for their citizens and the global public, we take it as an encouraging sign that improvements in data coverage and openness are possible even in small and poor countries.
Figure 5. ODIN scores are only weakly associated with income
Focus on gender dataODIN scores can be weighted to emphasize particular categories of data or specific elements of coverage and openness. The weighting function is not yet incorporated in the ODIN Online website, but will be in the future. Meanwhile, the raw scores – the
original scores on each category and element – can be downloaded and used to calculate new aggregates. As a demonstration, consider a new indicator of the coverage and openness of gender relevant statistics.
ODIN Results
2015 ODIN Annual Report www.opendatawatch.com 11
The ODIN assessments contain 8 categories of data that have particular relevance for monitoring the status and welfare of women. Many of the sentinel indicators examined in the ODIN assessments have been included in the list of proposed Sustainable Development Goal indicators.
The eight categories are: 1. Population&vitalstatistics2. Educationoutcomes3. Healthoutcomes4. Reproductivehealth5. Genderstatistics6. Poverty&incomestatistics7. Laborstatistics8. Builtenvironment
With the exception of the built environment, the scoring guidelines for the first element of indicator coverage for these categories specify sex disaggregation of the indicators. The built environment is included because it provides data
on household access to water and sanitation, issues of particular concern to women and children. The gender statistics category provides data on gender violence and political participation of women. The other nine elements of coverage and openness do not differentiate gender disaggregated data, but, taken together, their scoring reflects systematic differences in the coverage or openness of these data categories. In constructing the gender indicator, all elements and data categories are weighted equally.
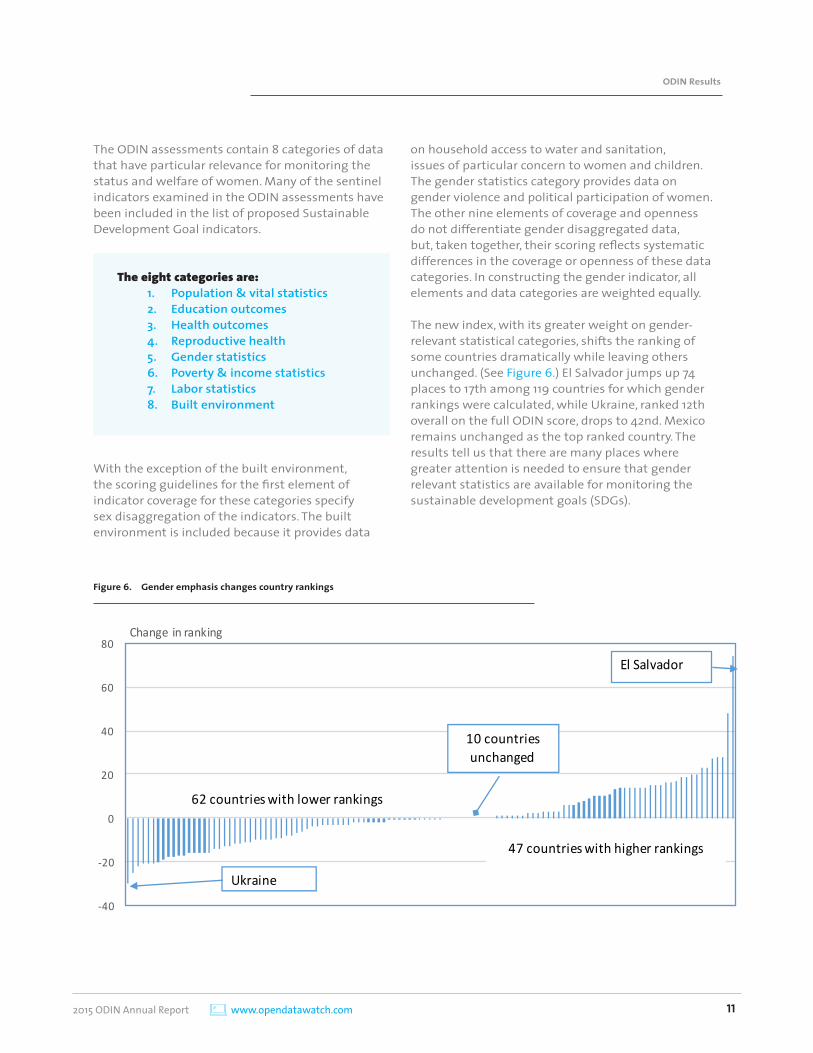
The new index, with its greater weight on gender-relevant statistical categories, shifts the ranking of some countries dramatically while leaving others unchanged. (See Figure 6.) El Salvador jumps up 74 places to 17th among 119 countries for which gender rankings were calculated, while Ukraine, ranked 12th overall on the full ODIN score, drops to 42nd. Mexico remains unchanged as the top ranked country. The results tell us that there are many places where greater attention is needed to ensure that gender relevant statistics are available for monitoring the sustainable development goals (SDGs).
Figure 6. Gender emphasis changes country rankings
ODIN Results
-40
-20
0
20
40
60
80Changeinranking
ElSalvador
Ukraine
62countrieswithlower rankings
47countrieswithhigherrankings
10countriesunchanged
www.opendatawatch.com 2015 ODIN Annual Report12
Planning for Open Data
The road to open data and open statistical systems is complicated to navigate and must be carefully planned. There are legal, technical, and organizational issues that must be brought into alignment. Strong buy-in from many stakeholders is also needed. In planning the development of their statistical systems, many countries have adopted the framework for National Strategies for the Development of Statistics (NSDS), promulgated by the Partnership in Statistics for Development in the 21st Century (PARIS21). ODIN assessments can serve as a complement to the NSDS process, highlighting strengths and weaknesses in the current system and measuring progress toward a more open system.
An NSDS is a planning tool to guide the development of national statistical systems capable of producing the data necessary to design, implement, and monitor national development policies and programs and to meet their regional and international data commitments. Since the first NSDS guidelines were formalized more than 10 years ago, NSDSs have been prepared by 95 countries, with some now in their second or third generation. (See http://www.paris21.org/Knowledge/381.) PARIS21 provides support and advocacy for NSDSs and, in 2014, launched an updated set of guidelines. Both earlier and recent NSDS 2.0 Guidelines include similar elements, such as assessment of the existing system, stakeholder analysis and engagement, vision and goals, organizational structure, monitoring and evaluation, legal framework, timeline and action plan, a framework for external assistance, and a budget. The new PARIS21 NSDS guidelines incorporate additional elements and guidance on specific topics, including gender data and openness based on 10 years of experience on all continents. The Guidelines are available at http://nsdsguidelines.paris21.org/.
Before countries can implement a plan for open data, they should incorporate the necessary steps in their NSDSs. Among the factors affecting openness cited in the new guidelines are: data confidentiality; establishing legal authority for open data; setting data dissemination goals and targets; and building
an open data IT platform. However, a review of NSDSs in fourteen countries conducted by Open Data Watch staff found open data to be among the least frequently mentioned issues identified in the plans. While plans for Mongolia and Timor-Leste made frequent mention of open data principles, nine other countries’ plans made less frequent mention of openness, and Ethiopia, Tanzania, and Zimbabwe made weak or no mention of data openness. The fourteen countries in the NSDS study included seven ranked in the top half of the ODIN openness assessment, among them Mongolia (ranked 4th) and Rwanda (ranked 2nd). Ethiopia, Tanzania, Zimbabwe, whose NSDSs had a weak coverage of open data issues, are all ranked in the bottom thirty percent in the ODIN openness assessment.
For countries currently near the top of the openness rankings, ODIN can help them identify specific areas in need of improvement. Mongolia, for example, needs to include open terms of use for all its data categories. This may require steps to secure legal authority to do so. Rwanda gets full marks for its terms of use and for providing adequate metadata, but falls short by not providing user download options and non-proprietary file formats. Countries near the bottom of the rankings will need to invest across the board in the technical means of providing open data, in preparing metadata, and in obtaining legal authority to provide the right of free use and reuse of their data.
Planning for Open Data
Future developmentsThe Open Data Inventory is a continuing project of Open Data Watch. Assessments will be carried out annually, beginning in the second quarter of the calendar year. The updated results will be posted in their entirety at the end of the year. All countries included in 2015 will be assessed again in 2016 and fifty or more countries will be added, including many high-income countries. With adequate resources, the intention is to extend ODIN to all recognized official statistical systems.
Although the ODIN methodology has proved to be reliable and reproducible over the course of the 2015 assessment, further changes are possible. We are interested in receiving feedback and suggestions for improvements. NSO websites and their contents frequently change, and we would also appreciate information on new or updated sites or the location of information that could not be found during the 2015 assessment. Feedback of any kind can be sent by email to [email protected].
2015 ODIN Annual Report www.opendatawatch.com 13
Appendix
APPENDIXES
www.opendatawatch.com 2015 ODIN Annual Report14
Country Region
Mexico
Moldova
Mongolia
Rwanda
Georgia
China
RussianFederation
Turkey
Cuba
Armenia
Serbia
Ukraine
Azerbaijan
Tunisia
Vietnam
Romania
India
Malawi
Bulgaria
Peru
SriLanka
Panama
Philippines
Brazil
Colombia
DominicanRepublic
Indonesia
Jordan
Uganda
Kosovo
Sudan
Albania
SouthAfrica
Nigeria
Chile
Kyrgyzstan
Afghanistan
Central America
East Europe
Eastern Asia
East Africa
West Asia
Eastern Asia
East Europe
West Asia
Caribbean
West Asia
Southern Europe
East Europe
West Asia
Northern Africa
Southeast Asia
East Europe
Southern Asia
East Africa
East Europe
South America
Southern Asia
Central America
Southeast Asia
South America
South America
Caribbean
Southeast Asia
West Asia
East Africa
Southern Europe
Northern Africa
Southern Europe
Southern Africa
West Africa
South America
Central Asia
Southern Asia
67.8
66.0
64.5
59.3
57.8
55.6
54.1
52.3
50.9
50.8
47.6
47.3
46.9
46.3
46.1
45.5
44.9
44.3
44.3
44.2
43.6
43.0
42.5
42.4
41.5
40.1
39.9
39.1
39.0
38.5
38.5
38.4
38.2
37.7
37.0
36.4
36.2
61.0
64.3
64.3
47.0
58.8
66.4
60.2
57.8
67.4
52.8
37.3
50.8
61.3
29.2
44.8
54.0
56.2
51.1
52.9
49.8
57.4
57.1
57.4
46.0
48.5
54.2
53.2
48.6
47.4
46.1
35.0
45.4
49.9
47.8
48.0
50.6
53.6
74.2
67.6
64.7
70.7
56.8
45.6
48.5
47.3
35.7
49.0
57.2
44.1
33.6
62.2
47.4
37.6
34.5
38.1
36.3
39.0
30.9
30.0
28.6
39.0
35.0
27.0
27.6
30.4
31.3
31.5
41.7
31.9
27.4
28.3
26.8
23.3
20.2
1
2
3
4
5
6
7
8
9
10
11
12
13
14
15
16
17
18
19
20
21
22
23
24
25
26
27
28
29
30
31
32
33
34
35
36
37
6
3
4
36
8
2
7
9
1
21
66
25
5
97
43
17
13
24
20
28
10
12
11
40
31
16
19
30
34
39
76
41
27
33
32
26
18
1
3
4
2
7
12
9
11
21
8
6
13
26
5
10
19
24
18
20
16
32
35
37
17
23
43
41
33
30
29
15
28
42
38
44
55
61
OverallSCORE l RANK
CoverageSCORE l RANK
OpennessSCORE l RANK
Appendix
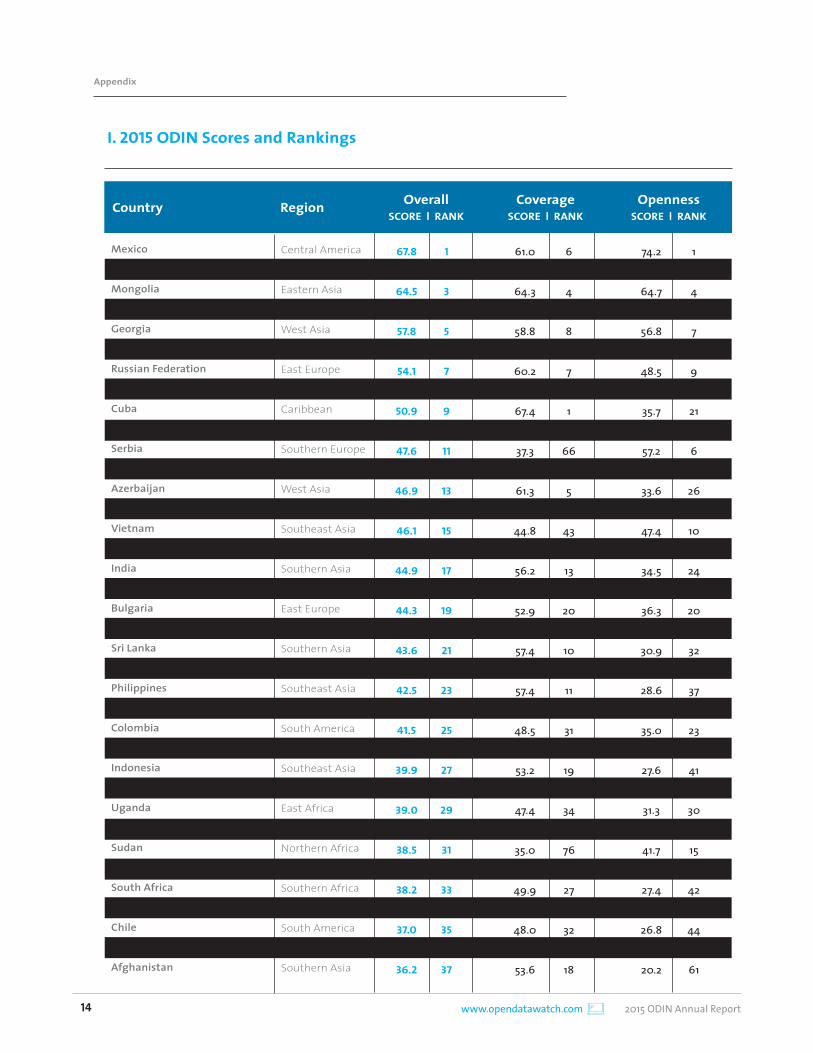
I. 2015 ODIN Scores and Rankings
2015 ODIN Annual Report www.opendatawatch.com 15
Appendix
Country Region
Argentina
Egypt
Belarus
Bhutan
Bolivia
SaudiArabia
Coted’Ivoire
Kenya
Tajikistan
Togo
Iran,IslamicRep.
Bangladesh
Yemen
CaboVerde
Gambia
Macedonia,FYR
Honduras
Nepal
Morocco
Palestine
Lesotho
Uruguay
Ghana
SouthSudan
Liberia
Kazakhstan
Mauritius
Pakistan
Maldives
Guatemala
Nicaragua
Lebanon
Mali
Montenegro
Belize
Paraguay
Guyana
South America
Northern Africa
East Europe
Southern Asia
South America
West Asia
West Africa
East Africa
Central Asia
West Africa
Southern Asia
Southern Asia
West Asia
West Africa
West Africa
Southern Europe
Central America
Southern Asia
Northern Africa
West Asia
Southern Africa
South America
West Africa
East Africa
West Africa
Central Asia
East Africa
Southern Asia
Southern Asia
Central America
Central America
West Asia
West Africa
Southern Europe
Central America
South America
South America
35.8
35.5
35.5
35.4
35.4
35.1
34.8
34.6
34.5
34.4
34.3
34.2
33.7
33.5
33.4
33.1
32.5
32.5
31.6
31.1
31.1
31.1
30.7
29.7
29.7
29.7
29.4
29.1
28.6
27.8
27.3
27.0
27.0
26.3
26.3
26.2
26.2
46.8
41.3
54.6
52.4
35.5
39.6
36.3
45.4
43.4
34.9
44.1
54.2
39.9
44.3
39.0
22.1
40.2
49.0
52.8
47.3
38.6
41.0
42.9
30.8
35.2
43.3
34.6
42.8
37.6
35.5
34.9
30.9
38.6
33.0
38.3
46.5
32.9
25.6
30.1
17.8
19.6
35.2
30.9
33.4
24.6
26.3
34.0
25.3
15.8
28.1
23.4
28.3
43.3
25.4
17.1
12.0
16.2
24.1
21.8
19.3
28.8
24.5
17.1
24.6
16.5
20.2
20.7
20.3
23.4
16.3
20.1
15.2
7.5
19.9
38
39
40
41
42
43
44
45
46
47
48
49
50
51
52
53
54
55
56
57
58
59
60
61
62
63
64
65
66
67
68
69
70
71
72
73
74
37
54
14
23
72
58
71
42
46
77
45
15
57
44
59
114
56
29
22
35
60
55
48
89
74
47
79
49
65
73
78
88
61
84
63
38
86
46
34
70
66
22
31
27
49
45
25
48
79
40
54
39
14
47
72
88
78
52
56
67
36
51
73
50
75
60
58
59
53
76
63
81
107
64
OverallSCORE l RANK
CoverageSCORE l RANK
OpennessSCORE l RANK
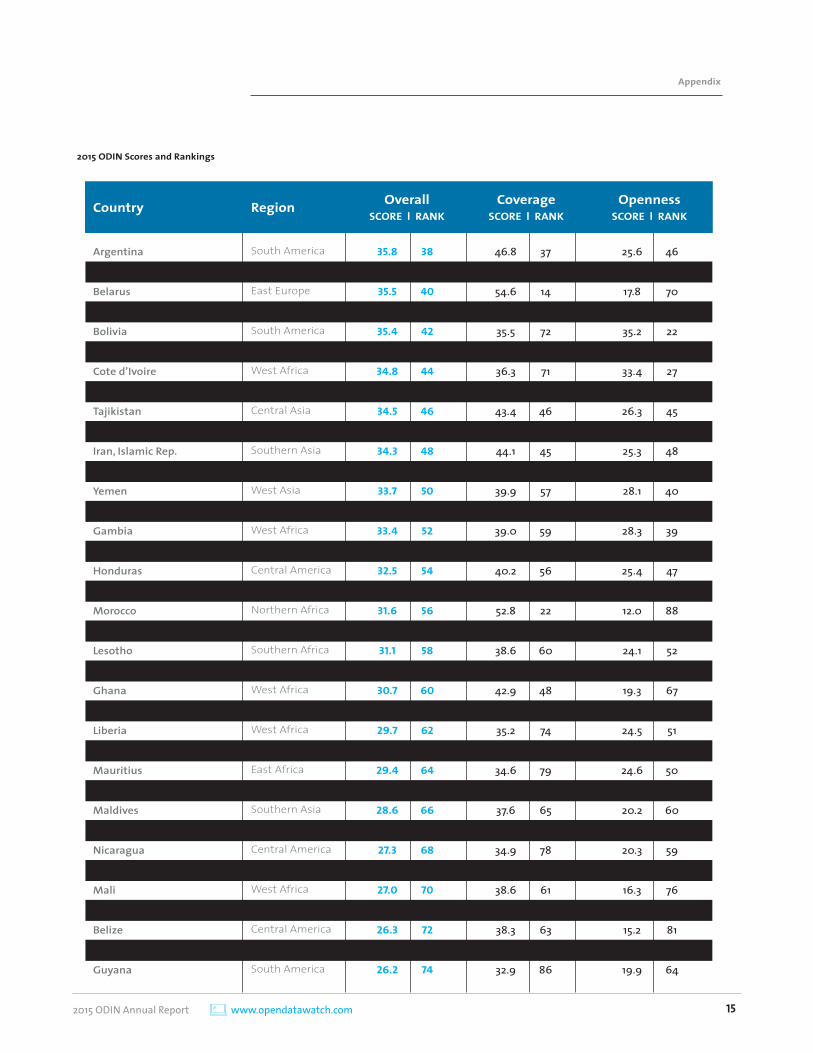
2015 ODIN Scores and Rankings
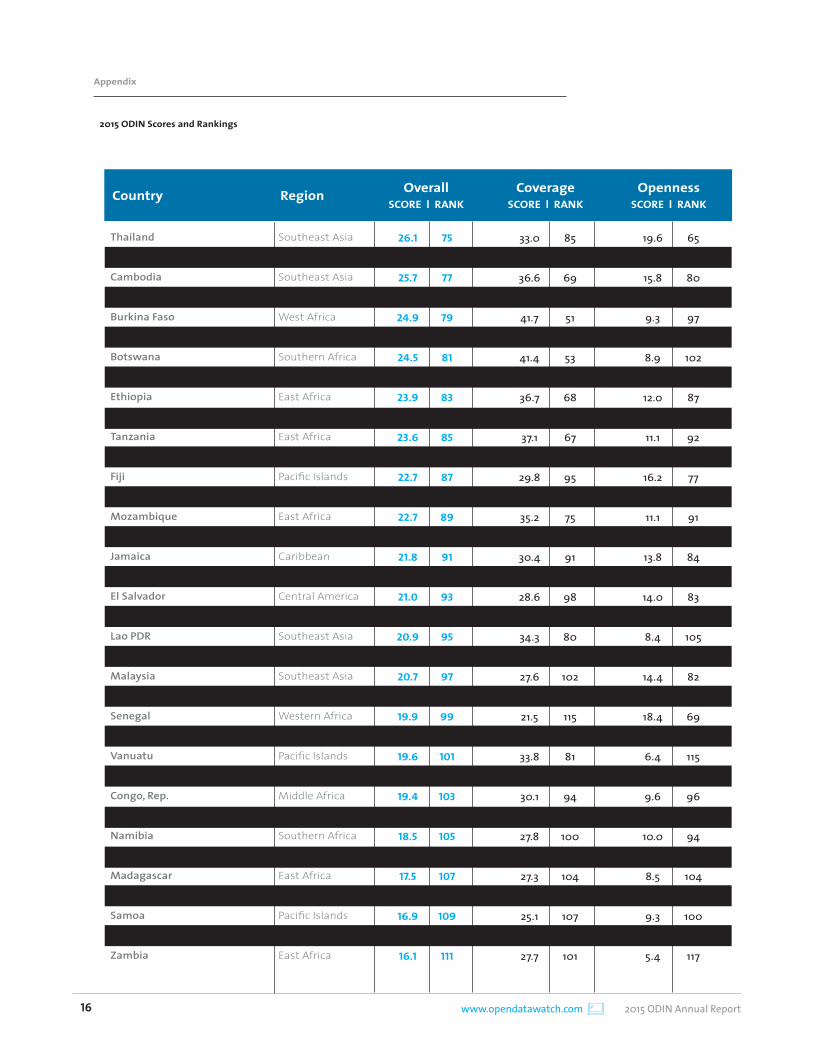
www.opendatawatch.com 2015 ODIN Annual Report16
Thailand
Cameroon
Cambodia
Mauritania
BurkinaFaso
SierraLeone
Botswana
St.Lucia
Ethiopia
Ecuador
Tanzania
Guinea
Fiji
Zimbabwe
Mozambique
Benin
Jamaica
St.Vincent&Grenadines
ElSalvador
Niger
LaoPDR
Venezuela
Malaysia
Guinea-Bissau
Senegal
BosniaandHerzegovina
Vanuatu
Algeria
Congo,Rep.
Burundi
Namibia
SolomonIslands
Madagascar
Micronesia,Fed.Sts.
Samoa
Chad
Zambia
Southeast Asia
Middle Africa
Southeast Asia
West Africa
West Africa
West Africa
Southern Africa
Caribbean
East Africa
South America
East Africa
West Africa
Pacific Islands
East Africa
East Africa
West Africa
Caribbean
Caribbean
Central America
West Africa
Southeast Asia
South America
Southeast Asia
West Africa
Western Africa
Southern Europe
Pacific Islands
Northern Africa
Middle Africa
East Africa
Southern Africa
Pacific Islands
East Africa
Pacific Islands
Pacific Islands
Middle Africa
East Africa
26.1
26.0
25.7
25.7
24.9
24.5
24.5
24.0
23.9
23.6
23.6
23.3
22.7
22.7
22.7
22.5
21.8
21.8
21.0
20.9
20.9
20.8
20.7
20.7
19.9
19.8
19.6
19.4
19.4
19.0
18.5
18.1
17.5
17.3
16.9
16.5
16.1
33.0
42.5
36.6
30.7
41.7
36.4
41.4
37.6
36.7
30.2
37.1
38.4
29.8
41.6
35.2
33.1
30.4
23.5
28.6
33.5
34.3
24.5
27.6
25.0
21.5
31.9
33.8
27.8
30.1
30.4
27.8
27.0
27.3
29.3
25.1
26.5
27.7
19.6
10.7
15.8
21.1
9.3
13.6
8.9
11.4
12.0
17.6
11.1
9.3
16.2
5.3
11.1
12.7
13.8
20.2
14.0
9.3
8.4
17.4
14.4
18.6
18.4
8.6
6.4
11.7
9.6
8.4
10.0
9.9
8.5
6.2
9.3
7.3
5.4
75
76
77
78
79
80
81
82
83
84
85
86
87
88
89
90
91
92
93
94
95
96
97
98
99
100
101
102
103
104
105
106
107
108
109
110
111
85
50
69
90
51
70
53
64
68
93
67
62
95
52
75
83
91
111
98
82
80
109
102
108
115
87
81
99
94
92
100
105
104
96
107
106
101
65
93
80
57
97
85
102
90
87
71
92
98
77
118
91
86
84
62
83
99
105
72
82
68
69
103
115
89
96
106
94
95
104
116
100
110
117
2015 ODIN Scores and Rankings
Appendix
Country Region OverallSCORE l RANK
CoverageSCORE l RANK
OpennessSCORE l RANK
2015 ODIN Annual Report www.opendatawatch.com 17
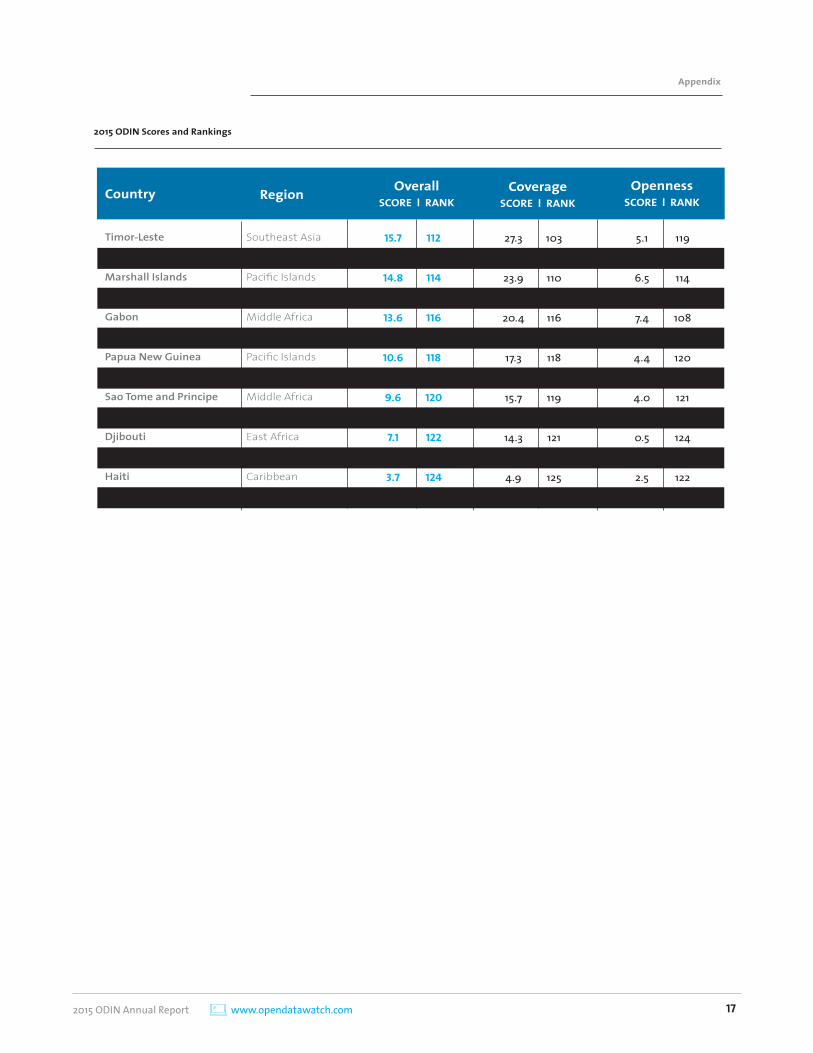
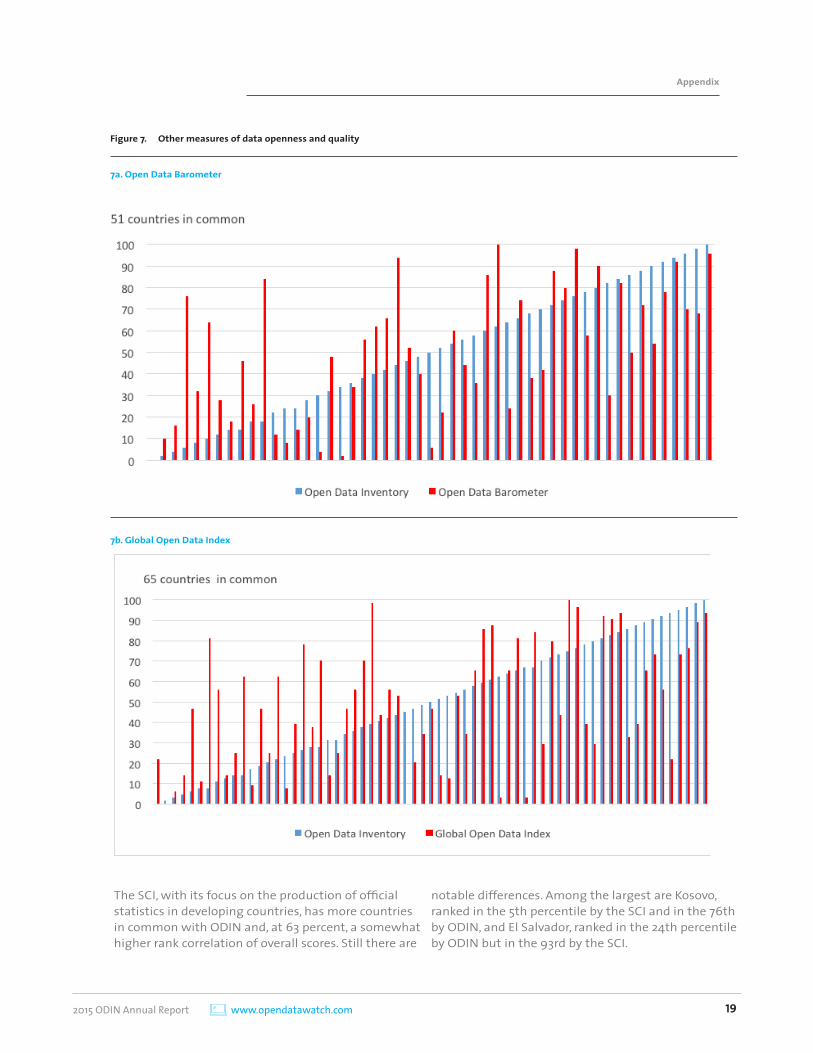
2015 ODIN Scores and Rankings
Appendix
Country Region
Timor-Leste
Angola
MarshallIslands
Congo,Dem.Rep.
Gabon
Kiribati
PapuaNewGuinea
Anguilla
SaoTomeandPrincipe
Turkmenistan
Djibouti
Swaziland
Haiti
Uzbekistan
Southeast Asia
Middle Africa
Pacific Islands
Middle Africa
Middle Africa
Pacific Islands
Pacific Islands
Caribbean
Middle Africa
Central Asia
East Africa
Southern Africa
Caribbean
Central Asia
15.7
15.4
14.8
14.1
13.6
10.8
10.6
10.3
9.6
9.0
7.1
6.4
3.7
3.0
27.3
22.3
23.9
22.1
20.4
15.0
17.3
13.9
15.7
18.3
14.3
5.4
4.9
5.3
5.1
9.0
6.5
6.8
7.4
7.0
4.4
6.9
4.0
0.4
0.5
7.3
2.5
0.8
112
113
114
115
116
117
118
119
120
121
122
123
124
125
103
112
110
113
116
120
118
122
119
117
121
123
125
124
119
101
114
113
108
111
120
112
121
125
124
109
122
123
OverallSCORE l RANK
CoverageSCORE l RANK
OpennessSCORE l RANK
www.opendatawatch.com 2015 ODIN Annual Report18
The Global Open Data Index (http://index.okfn.org/) and the Open Data Barometer (http://www.opendatabarometer.org/) are well known measures of the openness of government produced datasets. The Open Data Barometer (ODB) employs an expert assessment system that relies on scoring by local informants on questions concerning the policies, implementation, and impacts of open government data initiatives. Secondary data are used to complement the expert survey data and assess the readiness of countries to implement open government data initiatives. (See “Methods and “Overview,” http://www.opendatabarometer.org/report/about/method.html.) The Global Open Data Index (GODI), produced by the Open Knowledge Foundation, is a crowd-sourced indicator of the openness datasets. Information on datasets is gathered through the Open Data Census. The census is “… compiled using contributions from civil society members and open data practitioners around the world, to which the public is invited to contribute at any time; it is then peer-reviewed and checked periodically by a team of 60+ expert country editors.” (See “About the Open Data Index,” https://index.okfn.org/about/) and measuring progress toward a more open system.
Unlike the Open Data Inventory, both indexes include non-statistical information in their assessments, such as national maps, land ownership records, transport timetables, postcodes, government budgets, company registers, and election results. Both indicators include a limited selection of datasets produced by national statistical offices, such as the national accounts, unemployment, and population estimates, but their measures leave out much of the data traditionally associated with official statistics. Both indexes have prioritized high-income countries. This results in limited overlap with the countries assessed by ODIN.
Another index of interest is the World Bank’s Statistical Capacity Indicator (http://datatopics.worldbank.org/statisticalcapacity/). The Statistical Capacity Indicator (SCI) differs from the ODB and GODI in several respects. It considers only the datasets that are traditionally the responsibility of the national statistical office, although modern statistical systems may produce many other kinds of information; the criteria by which datasets are evaluated are derived from published information, rather than the judgment of experts or data users; and it is available for 149 developing countries but not for most countries
classified by the World Bank as high income. It does not explicitly consider whether the datasets satisfy criteria for openness. Instead, it is intended to measure the capacity of the country to produce statistics of good quality.
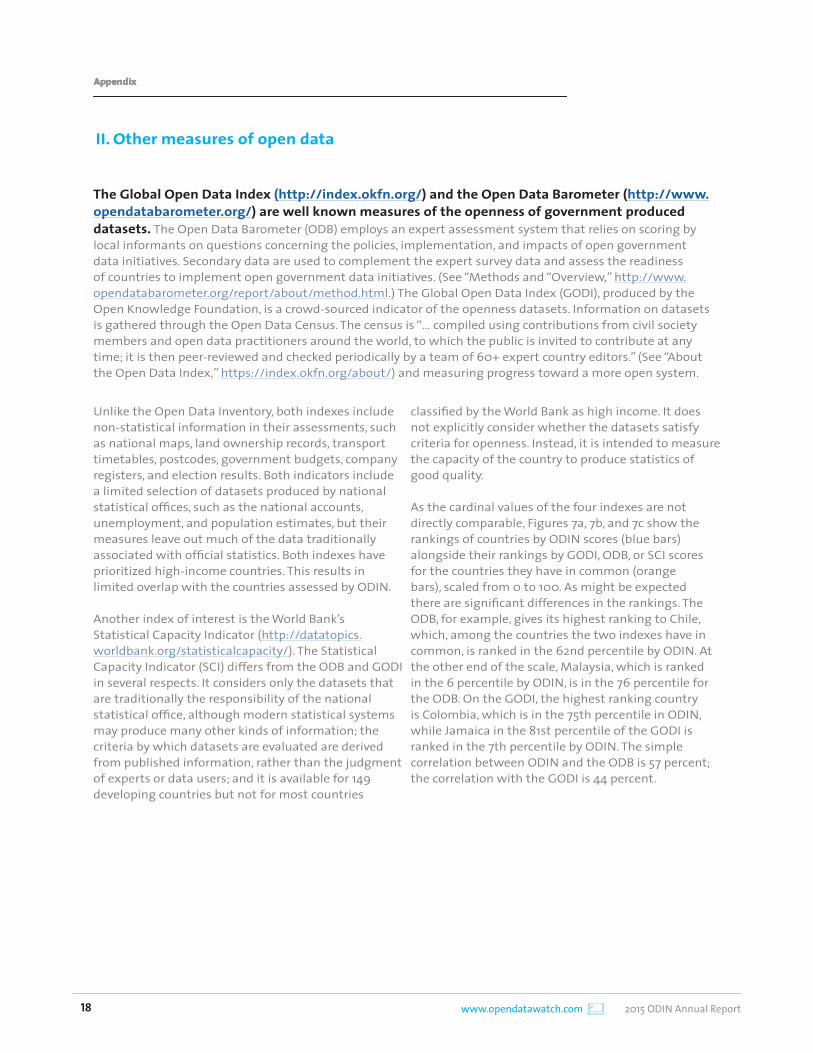
As the cardinal values of the four indexes are not directly comparable, Figures 7a, 7b, and 7c show the rankings of countries by ODIN scores (blue bars) alongside their rankings by GODI, ODB, or SCI scores for the countries they have in common (orange bars), scaled from 0 to 100. As might be expected there are significant differences in the rankings. The ODB, for example, gives its highest ranking to Chile, which, among the countries the two indexes have in common, is ranked in the 62nd percentile by ODIN. At the other end of the scale, Malaysia, which is ranked in the 6 percentile by ODIN, is in the 76 percentile for the ODB. On the GODI, the highest ranking country is Colombia, which is in the 75th percentile in ODIN, while Jamaica in the 81st percentile of the GODI is ranked in the 7th percentile by ODIN. The simple correlation between ODIN and the ODB is 57 percent; the correlation with the GODI is 44 percent.
AppendixAppendixAppendixAppendixAppendixAppendix
II. Other measures of open data
2015 ODIN Annual Report www.opendatawatch.com 19
Appendix
7a. Open Data Barometer
Figure 7. Other measures of data openness and quality
7b. Global Open Data Index
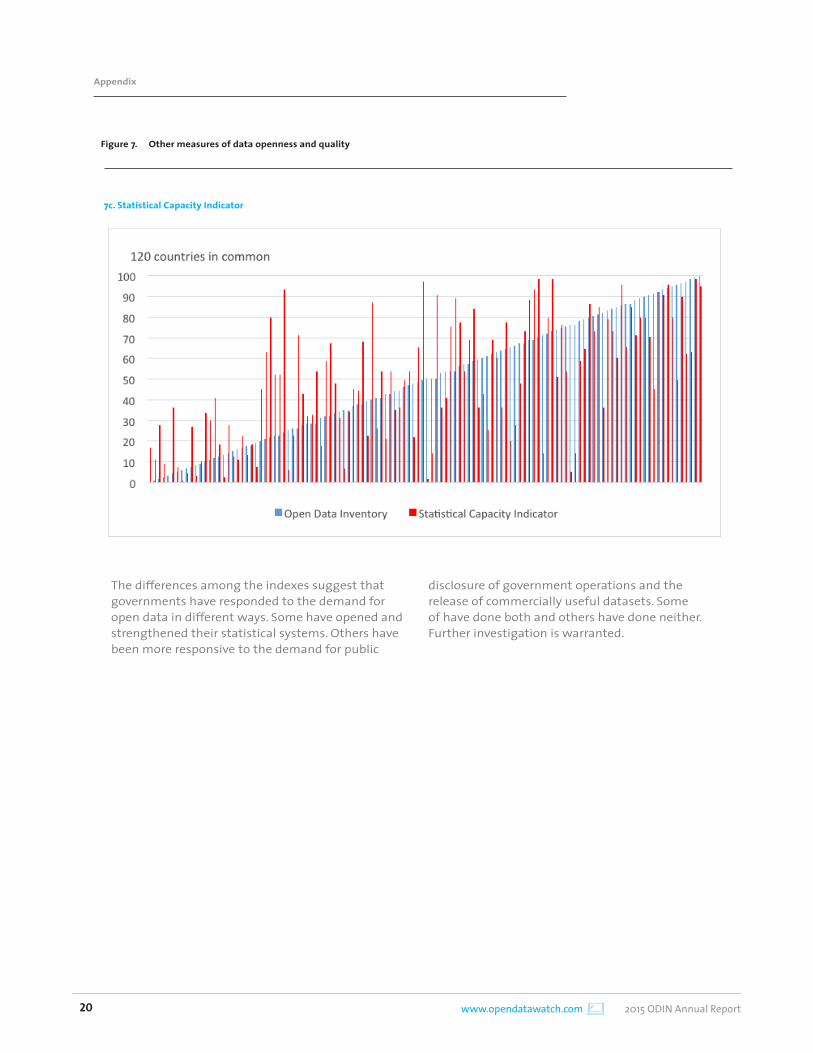
The SCI, with its focus on the production of official statistics in developing countries, has more countries in common with ODIN and, at 63 percent, a somewhat higher rank correlation of overall scores. Still there are
notable differences. Among the largest are Kosovo, ranked in the 5th percentile by the SCI and in the 76th by ODIN, and El Salvador, ranked in the 24th percentile by ODIN but in the 93rd by the SCI.
www.opendatawatch.com 2015 ODIN Annual Report20
Figure 7. Other measures of data openness and quality
7c. Statistical Capacity Indicator
The differences among the indexes suggest that governments have responded to the demand for open data in different ways. Some have opened and strengthened their statistical systems. Others have been more responsive to the demand for public
disclosure of government operations and the release of commercially useful datasets. Some of have done both and others have done neither. Further investigation is warranted.
Appendix
2015 ODIN Annual Report www.opendatawatch.com 21
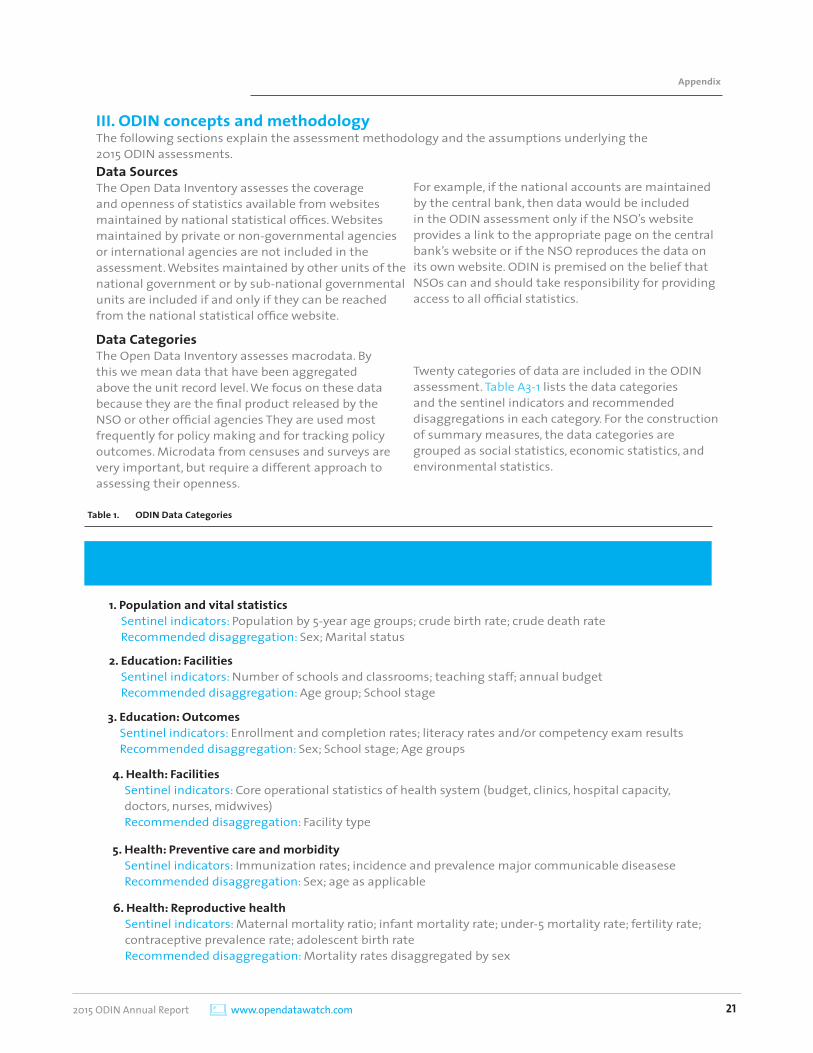
III. ODIN concepts and methodologyThe following sections explain the assessment methodology and the assumptions underlying the 2015 ODIN assessments.Data Sources The Open Data Inventory assesses the coverage and openness of statistics available from websites maintained by national statistical offices. Websites maintained by private or non-governmental agencies or international agencies are not included in the assessment. Websites maintained by other units of the national government or by sub-national governmental units are included if and only if they can be reached from the national statistical office website.
For example, if the national accounts are maintained by the central bank, then data would be included in the ODIN assessment only if the NSO’s website provides a link to the appropriate page on the central bank’s website or if the NSO reproduces the data on its own website. ODIN is premised on the belief that NSOs can and should take responsibility for providing access to all official statistics.
Data Categories The Open Data Inventory assesses macrodata. By this we mean data that have been aggregated above the unit record level. We focus on these data because they are the final product released by the NSO or other official agencies They are used most frequently for policy making and for tracking policy outcomes. Microdata from censuses and surveys are very important, but require a different approach to assessing their openness.
Twenty categories of data are included in the ODIN assessment. Table A3-1 lists the data categories and the sentinel indicators and recommended disaggregations in each category. For the construction of summary measures, the data categories are grouped as social statistics, economic statistics, and environmental statistics.
Table 1. ODIN Data Categories
Data category: Social Statistics
1. Population and vital statisticsSentinel indicators: Population by 5-year age groups; crude birth rate; crude death rate Recommended disaggregation: Sex; Marital status
2. Education: FacilitiesSentinel indicators: Number of schools and classrooms; teaching staff; annual budget Recommended disaggregation: Age group; School stage
3. Education: OutcomesSentinel indicators: Enrollment and completion rates; literacy rates and/or competency exam results Recommended disaggregation: Sex; School stage; Age groups
4. Health: FacilitiesSentinel indicators: Core operational statistics of health system (budget, clinics, hospital capacity, doctors, nurses, midwives) Recommended disaggregation: Facility type
Appendix
5. Health: Preventive care and morbiditySentinel indicators: Immunization rates; incidence and prevalence major communicable diseasese Recommended disaggregation: Sex; age as applicable
6. Health: Reproductive healthSentinel indicators: Maternal mortality ratio; infant mortality rate; under-5 mortality rate; fertility rate; contraceptive prevalence rate; adolescent birth rate Recommended disaggregation: Mortality rates disaggregated by sex
www.opendatawatch.com 2015 ODIN Annual Report22
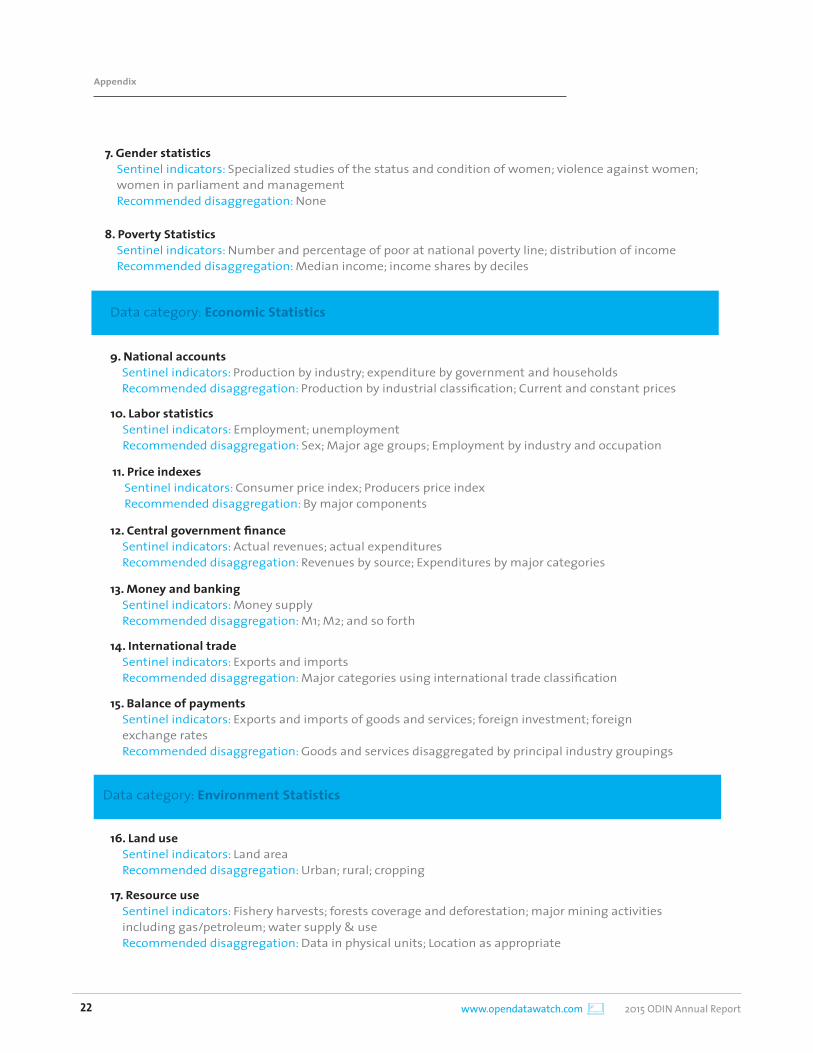
9. National accountsSentinel indicators: Production by industry; expenditure by government and households Recommended disaggregation: Production by industrial classification; Current and constant prices
10. Labor statisticsSentinel indicators: Employment; unemployment Recommended disaggregation: Sex; Major age groups; Employment by industry and occupation
11. Price indexesSentinel indicators: Consumer price index; Producers price index Recommended disaggregation: By major components
8. Poverty StatisticsSentinel indicators: Number and percentage of poor at national poverty line; distribution of income Recommended disaggregation: Median income; income shares by deciles
12. Central government financeSentinel indicators: Actual revenues; actual expenditures Recommended disaggregation: Revenues by source; Expenditures by major categories
13. Money and bankingSentinel indicators: Money supply Recommended disaggregation: M1; M2; and so forth
Data category: Economic Statistics
14. International tradeSentinel indicators: Exports and imports Recommended disaggregation: Major categories using international trade classification
15. Balance of paymentsSentinel indicators: Exports and imports of goods and services; foreign investment; foreign exchange rates Recommended disaggregation: Goods and services disaggregated by principal industry groupings
Appendix
Data category: Environment Statistics
16. Land useSentinel indicators: Land area Recommended disaggregation: Urban; rural; cropping
17. Resource useSentinel indicators: Fishery harvests; forests coverage and deforestation; major mining activities including gas/petroleum; water supply & use Recommended disaggregation: Data in physical units; Location as appropriate
7. Gender statisticsSentinel indicators: Specialized studies of the status and condition of women; violence against women; women in parliament and management Recommended disaggregation: None
2015 ODIN Annual Report www.opendatawatch.com 23
Appendix
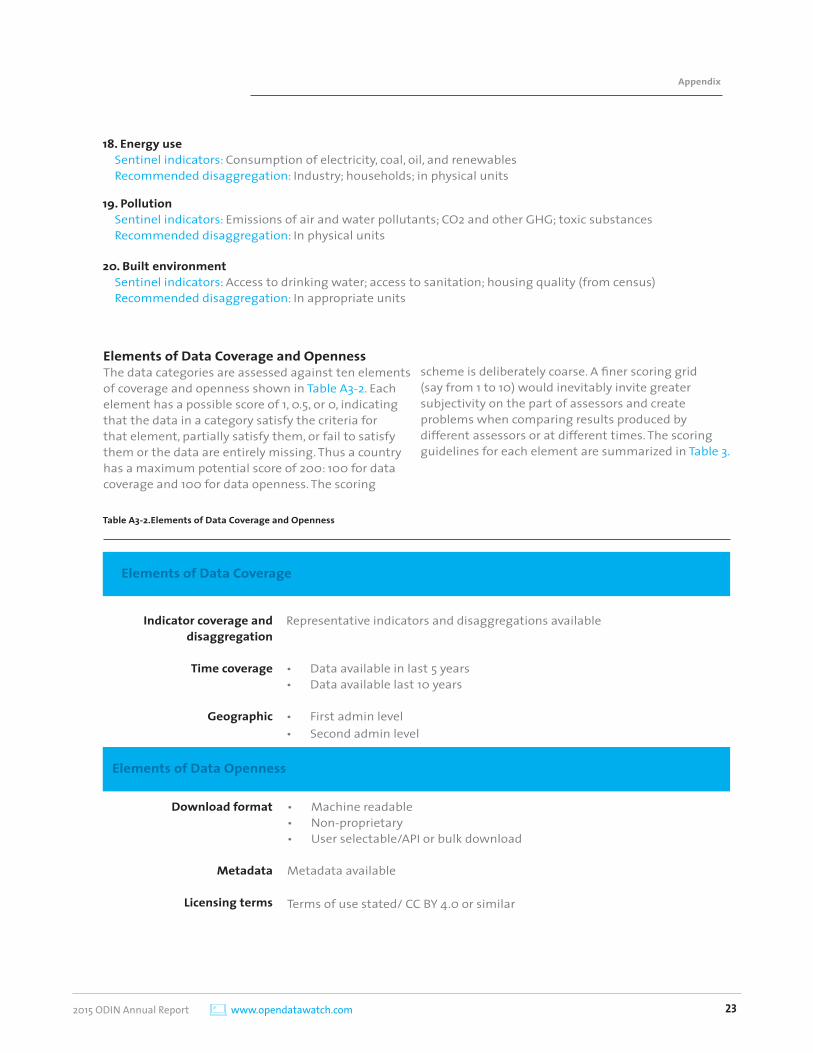
Elements of Data Coverage and Openness The data categories are assessed against ten elements of coverage and openness shown in Table A3-2. Each element has a possible score of 1, 0.5, or 0, indicating that the data in a category satisfy the criteria for that element, partially satisfy them, or fail to satisfy them or the data are entirely missing. Thus a country has a maximum potential score of 200: 100 for data coverage and 100 for data openness. The scoring
scheme is deliberately coarse. A finer scoring grid (say from 1 to 10) would inevitably invite greater subjectivity on the part of assessors and create problems when comparing results produced by different assessors or at different times. The scoring guidelines for each element are summarized in Table 3.
Indicator coverage and disaggregation
Time coverage
Geographic
Download format
Metadata
Licensing terms
Representative indicators and disaggregations available
• Data available in last 5 years• Data available last 10 years
• First admin level• Second admin level
• Machine readable• Non-proprietary• User selectable/API or bulk download
Metadata available
Terms of use stated/ CC BY 4.0 or similar
Elements of Data Coverage
Elements of Data Openness
Table A3-2. Elements of Data Coverage and Openness
19. PollutionSentinel indicators: Emissions of air and water pollutants; CO2 and other GHG; toxic substances Recommended disaggregation: In physical units
20. Built environmentSentinel indicators: Access to drinking water; access to sanitation; housing quality (from census) Recommended disaggregation: In appropriate units
18. Energy useSentinel indicators: Consumption of electricity, coal, oil, and renewables Recommended disaggregation: Industry; households; in physical units
www.opendatawatch.com 2015 ODIN Annual Report24
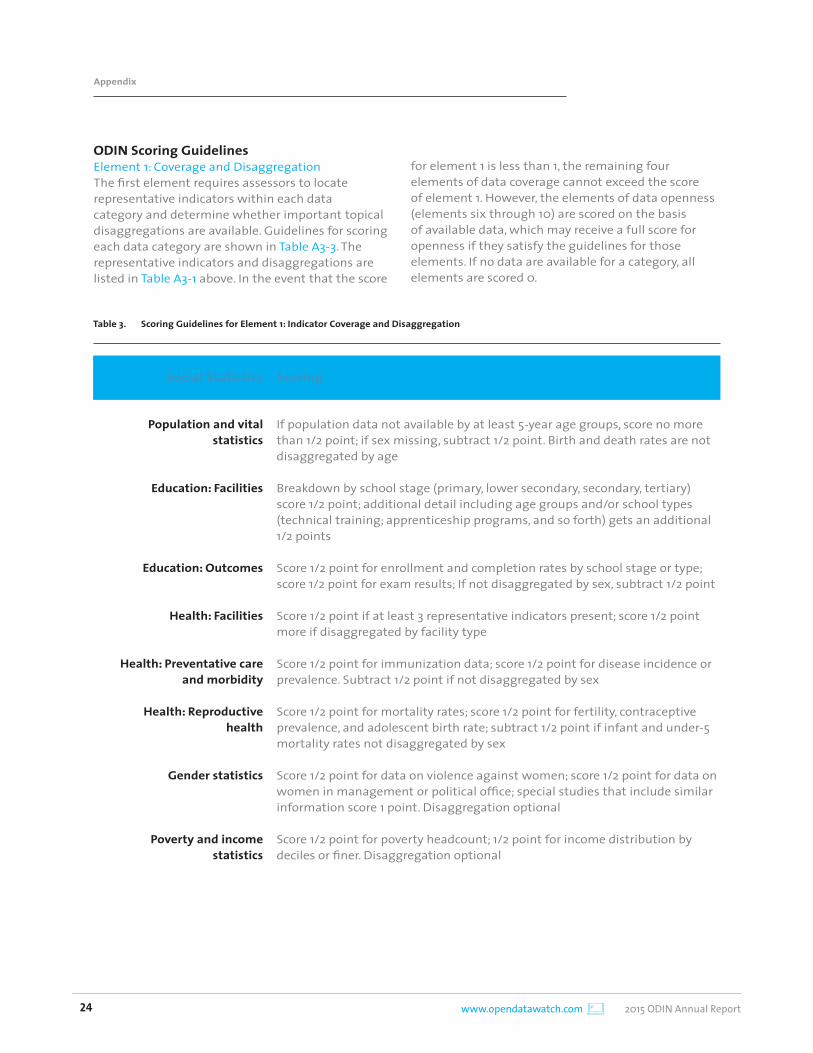
ODIN Scoring GuidelinesElement 1: Coverage and DisaggregationThe first element requires assessors to locate representative indicators within each data category and determine whether important topical disaggregations are available. Guidelines for scoring each data category are shown in Table A3-3. The representative indicators and disaggregations are listed in Table A3-1 above. In the event that the score
for element 1 is less than 1, the remaining four elements of data coverage cannot exceed the score of element 1. However, the elements of data openness (elements six through 10) are scored on the basis of available data, which may receive a full score for openness if they satisfy the guidelines for those elements. If no data are available for a category, all elements are scored 0.
Population and vital statistics
Education: Facilities
Education: Outcomes
Health: Facilities
Health: Preventative care and morbidity
Health: Reproductive health
Gender statistics
Poverty and income statistics
If population data not available by at least 5-year age groups, score no more than 1/2 point; if sex missing, subtract 1/2 point. Birth and death rates are not disaggregated by age
Breakdown by school stage (primary, lower secondary, secondary, tertiary) score 1/2 point; additional detail including age groups and/or school types (technical training; apprenticeship programs, and so forth) gets an additional 1/2 points
Score 1/2 point for enrollment and completion rates by school stage or type; score 1/2 point for exam results; If not disaggregated by sex, subtract 1/2 point
Score 1/2 point if at least 3 representative indicators present; score 1/2 point more if disaggregated by facility type
Score 1/2 point for immunization data; score 1/2 point for disease incidence or prevalence. Subtract 1/2 point if not disaggregated by sex
Score 1/2 point for mortality rates; score 1/2 point for fertility, contraceptive prevalence, and adolescent birth rate; subtract 1/2 point if infant and under-5 mortality rates not disaggregated by sex
Score 1/2 point for data on violence against women; score 1/2 point for data on women in management or political office; special studies that include similar information score 1 point. Disaggregation optional
Score 1/2 point for poverty headcount; 1/2 point for income distribution by deciles or finer. Disaggregation optional
Social Statistics Scoring
Table 3. Scoring Guidelines for Element 1: Indicator Coverage and Disaggregation
Appendix
2015 ODIN Annual Report www.opendatawatch.com 25
Appendix
National accounts
Labor statistics
Price indexes
Central government finance
Money and banking
Trade
Balance of payments
Land use
Resource use
Energy use
Pollution
Built environment
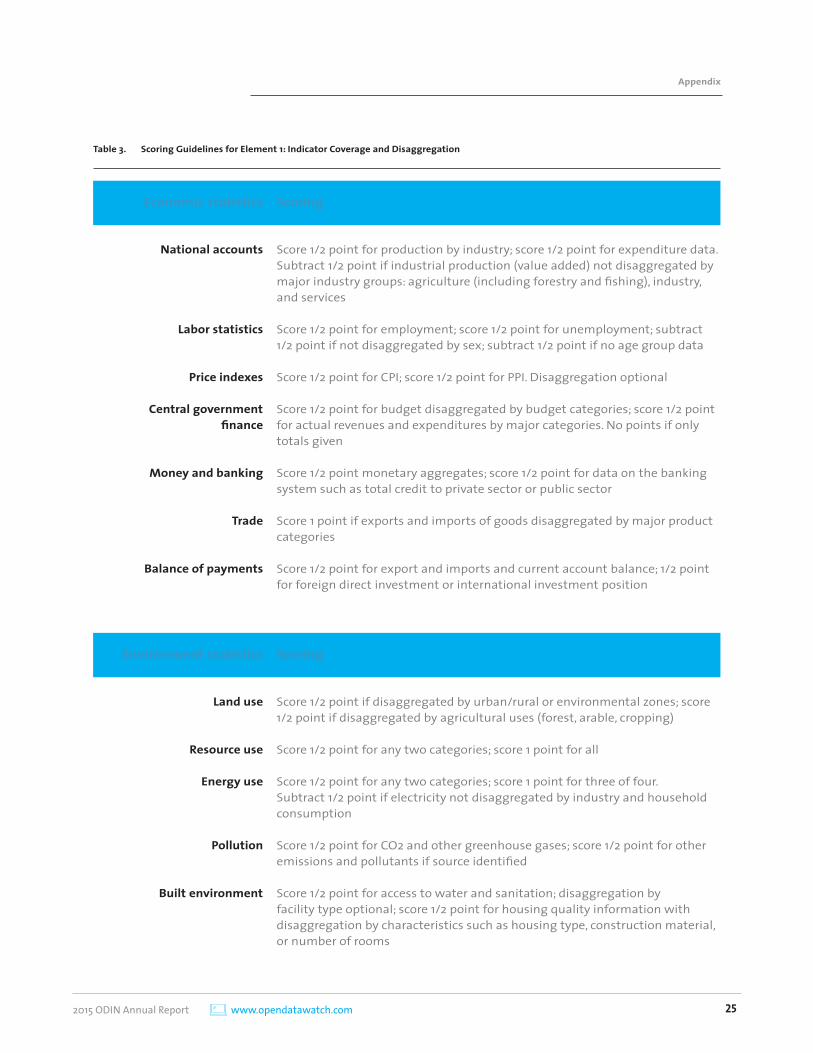
Score 1/2 point for production by industry; score 1/2 point for expenditure data. Subtract 1/2 point if industrial production (value added) not disaggregated by major industry groups: agriculture (including forestry and fishing), industry, and services
Score 1/2 point for employment; score 1/2 point for unemployment; subtract 1/2 point if not disaggregated by sex; subtract 1/2 point if no age group data
Score 1/2 point for CPI; score 1/2 point for PPI. Disaggregation optional
Score 1/2 point for budget disaggregated by budget categories; score 1/2 point for actual revenues and expenditures by major categories. No points if only totals given
Score 1/2 point monetary aggregates; score 1/2 point for data on the banking system such as total credit to private sector or public sector
Score 1 point if exports and imports of goods disaggregated by major product categories
Score 1/2 point for export and imports and current account balance; 1/2 point for foreign direct investment or international investment position
Score 1/2 point if disaggregated by urban/rural or environmental zones; score 1/2 point if disaggregated by agricultural uses (forest, arable, cropping)
Score 1/2 point for any two categories; score 1 point for all
Score 1/2 point for any two categories; score 1 point for three of four. Subtract 1/2 point if electricity not disaggregated by industry and household consumption
Score 1/2 point for CO2 and other greenhouse gases; score 1/2 point for other emissions and pollutants if source identified
Score 1/2 point for access to water and sanitation; disaggregation by facility type optional; score 1/2 point for housing quality information with disaggregation by characteristics such as housing type, construction material, or number of rooms
Economic statistics
Environment statistics
Table 3. Scoring Guidelines for Element 1: Indicator Coverage and Disaggregation
Scoring
Scoring
www.opendatawatch.com 2015 ODIN Annual Report26
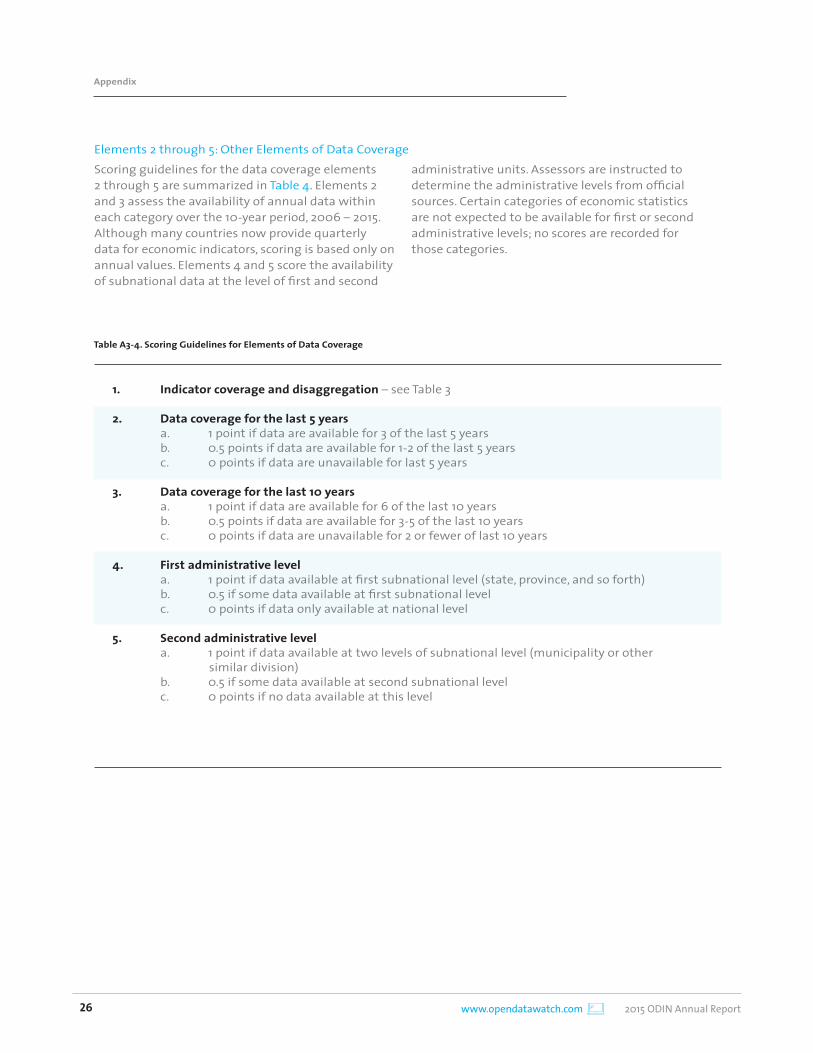
Scoring guidelines for the data coverage elements 2 through 5 are summarized in Table 4. Elements 2 and 3 assess the availability of annual data within each category over the 10-year period, 2006 – 2015. Although many countries now provide quarterly data for economic indicators, scoring is based only on annual values. Elements 4 and 5 score the availability of subnational data at the level of first and second
administrative units. Assessors are instructed to determine the administrative levels from official sources. Certain categories of economic statistics are not expected to be available for first or second administrative levels; no scores are recorded for those categories.
1. Indicator coverage and disaggregation – see Table 3
2. Data coverage for the last 5 yearsa. 1 point if data are available for 3 of the last 5 yearsb. 0.5 points if data are available for 1-2 of the last 5 years c. 0 points if data are unavailable for last 5 years
3. Data coverage for the last 10 yearsa. 1 point if data are available for 6 of the last 10 yearsb. 0.5 points if data are available for 3-5 of the last 10 yearsc. 0 points if data are unavailable for 2 or fewer of last 10 years
4. First administrative levela. 1 point if data available at first subnational level (state, province, and so forth)b. 0.5 if some data available at first subnational levelc. 0 points if data only available at national level
5. Second administrative levela. 1 point if data available at two levels of subnational level (municipality or other similar division)b. 0.5 if some data available at second subnational levelc. 0 points if no data available at this level
Table A3-4. Scoring Guidelines for Elements of Data Coverage
Elements 2 through 5: Other Elements of Data Coverage
Appendix
2015 ODIN Annual Report www.opendatawatch.com 27
Appendix
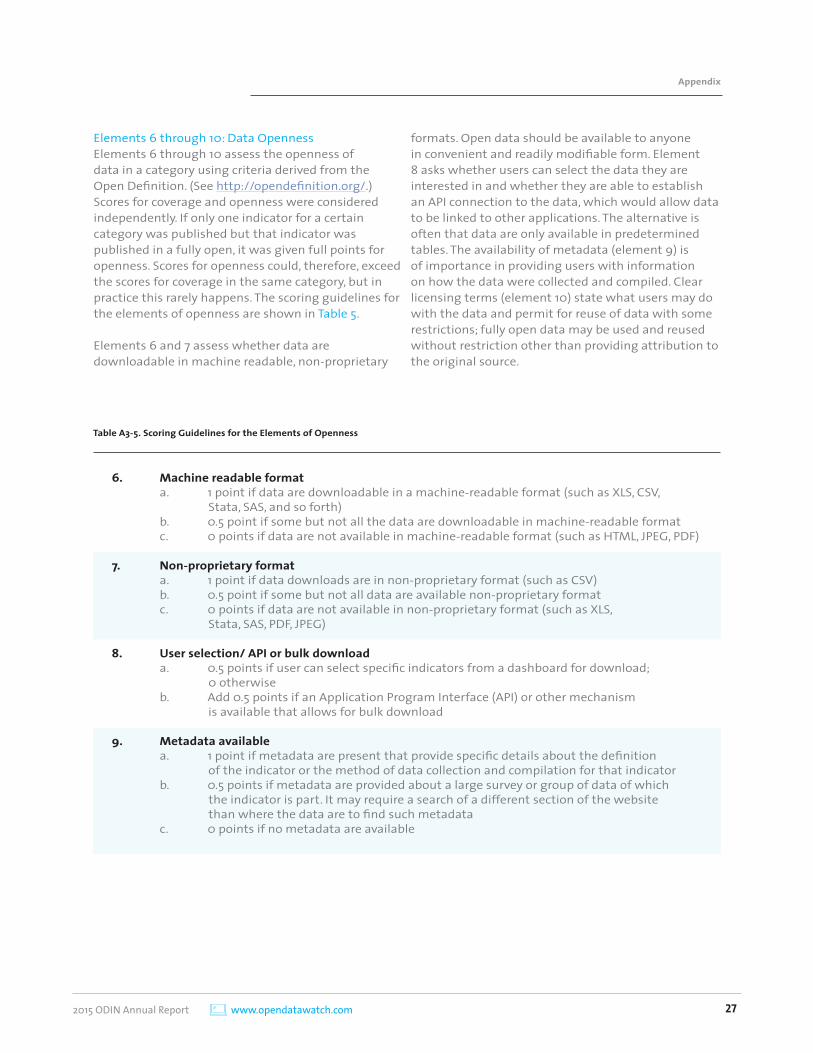
Elements 6 through 10: Data OpennessElements 6 through 10 assess the openness of data in a category using criteria derived from the Open Definition. (See http://opendefinition.org/.) Scores for coverage and openness were considered independently. If only one indicator for a certain category was published but that indicator was published in a fully open, it was given full points for openness. Scores for openness could, therefore, exceed the scores for coverage in the same category, but in practice this rarely happens. The scoring guidelines for the elements of openness are shown in Table 5.
Elements 6 and 7 assess whether data are downloadable in machine readable, non-proprietary
formats. Open data should be available to anyone in convenient and readily modifiable form. Element 8 asks whether users can select the data they are interested in and whether they are able to establish an API connection to the data, which would allow data to be linked to other applications. The alternative is often that data are only available in predetermined tables. The availability of metadata (element 9) is of importance in providing users with information on how the data were collected and compiled. Clear licensing terms (element 10) state what users may do with the data and permit for reuse of data with some restrictions; fully open data may be used and reused without restriction other than providing attribution to the original source.
6. Machine readable formata. 1 point if data are downloadable in a machine-readable format (such as XLS, CSV, Stata, SAS, and so forth)b. 0.5 point if some but not all the data are downloadable in machine-readable formatc. 0 points if data are not available in machine-readable format (such as HTML, JPEG, PDF)
7. Non-proprietary formata. 1 point if data downloads are in non-proprietary format (such as CSV)b. 0.5 point if some but not all data are available non-proprietary formatc. 0 points if data are not available in non-proprietary format (such as XLS, Stata, SAS, PDF, JPEG)
8. User selection/ API or bulk downloada. 0.5 points if user can select specific indicators from a dashboard for download; 0 otherwiseb. Add 0.5 points if an Application Program Interface (API) or other mechanism is available that allows for bulk download
9. Metadata availablea. 1 point if metadata are present that provide specific details about the definition of the indicator or the method of data collection and compilation for that indicatorb. 0.5 points if metadata are provided about a large survey or group of data of which the indicator is part. It may require a search of a different section of the website than where the data are to find such metadatac. 0 points if no metadata are available
Table A3-5. Scoring Guidelines for the Elements of Openness
www.opendatawatch.com 2015 ODIN Annual Report28
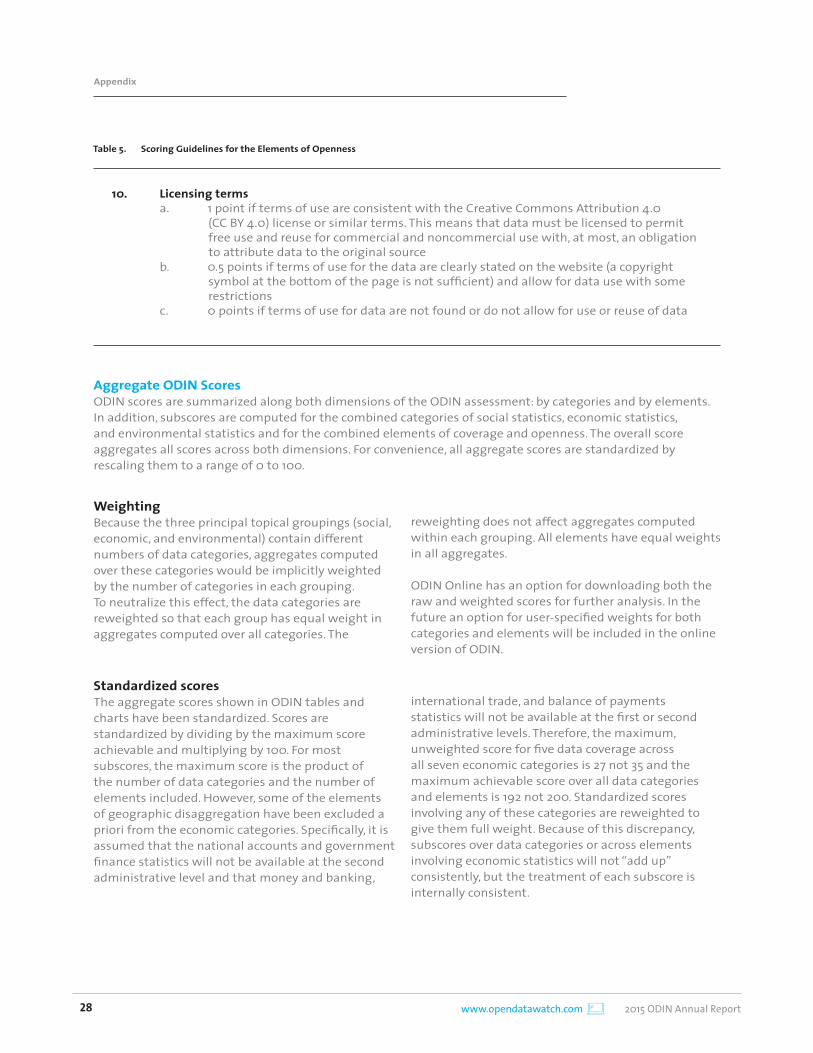
10. Licensing termsa. 1 point if terms of use are consistent with the Creative Commons Attribution 4.0 (CC BY 4.0) license or similar terms. This means that data must be licensed to permit free use and reuse for commercial and noncommercial use with, at most, an obligation to attribute data to the original sourceb. 0.5 points if terms of use for the data are clearly stated on the website (a copyright symbol at the bottom of the page is not sufficient) and allow for data use with some restrictionsc. 0 points if terms of use for data are not found or do not allow for use or reuse of data
Table 5. Scoring Guidelines for the Elements of Openness
Aggregate ODIN ScoresODIN scores are summarized along both dimensions of the ODIN assessment: by categories and by elements. In addition, subscores are computed for the combined categories of social statistics, economic statistics, and environmental statistics and for the combined elements of coverage and openness. The overall score aggregates all scores across both dimensions. For convenience, all aggregate scores are standardized by rescaling them to a range of 0 to 100.
WeightingBecause the three principal topical groupings (social, economic, and environmental) contain different numbers of data categories, aggregates computed over these categories would be implicitly weighted by the number of categories in each grouping. To neutralize this effect, the data categories are reweighted so that each group has equal weight in aggregates computed over all categories. The
reweighting does not affect aggregates computed within each grouping. All elements have equal weights in all aggregates.
ODIN Online has an option for downloading both the raw and weighted scores for further analysis. In the future an option for user-specified weights for both categories and elements will be included in the online version of ODIN.
Standardized scoresThe aggregate scores shown in ODIN tables and charts have been standardized. Scores are standardized by dividing by the maximum score achievable and multiplying by 100. For most subscores, the maximum score is the product of the number of data categories and the number of elements included. However, some of the elements of geographic disaggregation have been excluded a priori from the economic categories. Specifically, it is assumed that the national accounts and government finance statistics will not be available at the second administrative level and that money and banking,
international trade, and balance of payments statistics will not be available at the first or second administrative levels. Therefore, the maximum, unweighted score for five data coverage across all seven economic categories is 27 not 35 and the maximum achievable score over all data categories and elements is 192 not 200. Standardized scores involving any of these categories are reweighted to give them full weight. Because of this discrepancy, subscores over data categories or across elements involving economic statistics will not “add up” consistently, but the treatment of each subscore is internally consistent.
Appendix
2015 ODIN Annual Report www.opendatawatch.com 29
Appendix
IV. Accessing ODIN Online The ODIN website is located at: http://odin.opendatawatch.com/. The website should be easy to navigate without additional instructions, but here is a short guide to what you will find.
ODIN Home• The Home page displays a map of the world, showing in color the countries that have been
included in the 2015 ODIN assessment. Colors indicate the range of their overall ODIN score. Countries in gray were not include in the 2015 ODIN assessments
• Clicking on a country brings up an information box with the country’s aggregate scores and rank. Clicking on the country name takes you to the Country Profile page. (See below.)
Rankings• The Rankings page displays the overall score and aggregate subscores for data coverage and
openness for all countries. The display can be sorted by country name, region, or scores by clicking on the table headers.
• The Rankings dataset can be downloaded with the Export button.
Country Profile• The Country Profile page provides the most detailed information on a country’s ODIN scores.
Summary scores are shown for the 20 data categories (aggregated over the elements of coverage and openness) and for the 10 elements of coverage and openness (aggregated over the social, economic, and data categories). Graphs provide regional and global comparisons.
Regional Profile• ODIN countries are grouped by geographic regions and sub-regions defined by the United Nation
Statistics Division’s M49 Macro Geographical Regions and Sub-Regions Listing (http://unstats.un.org/unsd/methods/m49/m49regin.htm). Country codes are three character ISO codes. ODIN also includes the Republic of Kosovo with ISO code XKS, which is not included in the UN list. Three character regional codes were created for use in ODIN and are not part of the M49 listing.
• ODIN countries have also been classified by the World Bank’s income groups. On the Regional Profile page you can choose to view countries grouped by geographic region or by income group. First select the type of display, then select the regions and sub-regions.
• Data from the Country Profile page can be downloaded with the Export button.
Country Comparison• The Country Comparison page allows users to tabulate aggregate scores for one or more countries.
The overall score and five scores aggregated over categories and elements are displayed.• First select the regions or sub-regions from which to select countries; then select some or all
of the countries.• Data from the Country Comparison page can be downloaded with the Export button. The
“spark charts” to the right of the table do not download.
www.opendatawatch.com 2015 ODIN Annual Report30
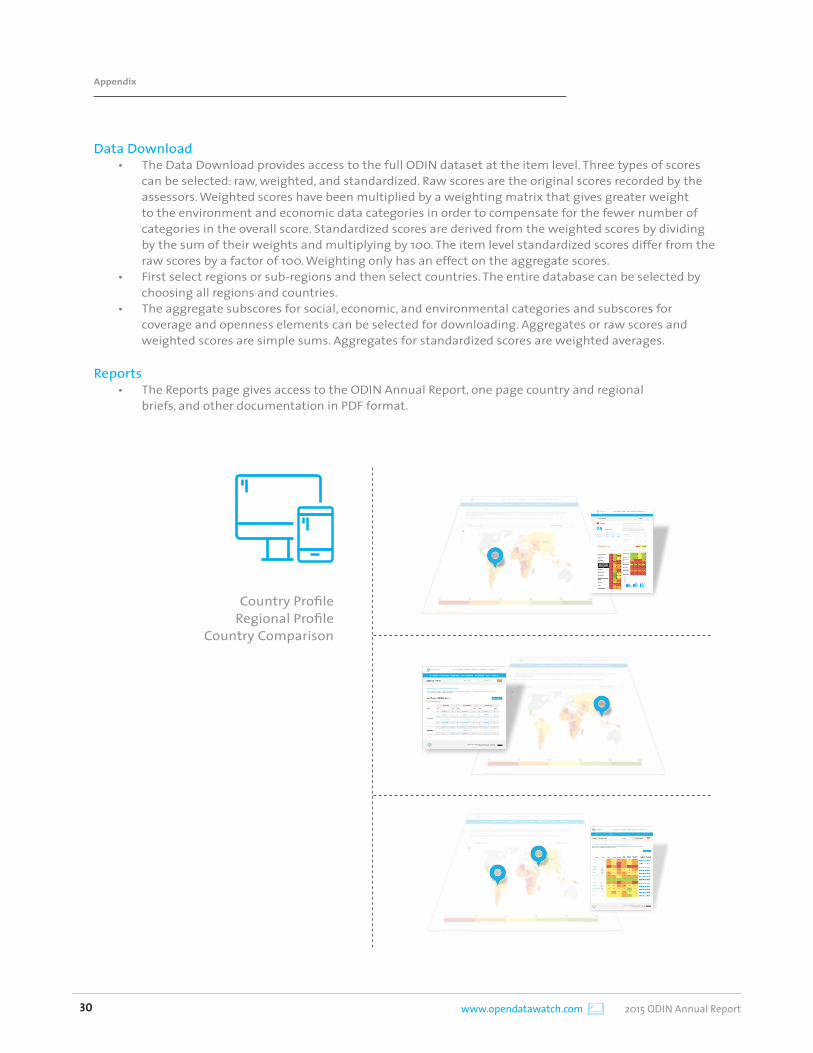
Data Download• The Data Download provides access to the full ODIN dataset at the item level. Three types of scores
can be selected: raw, weighted, and standardized. Raw scores are the original scores recorded by the assessors. Weighted scores have been multiplied by a weighting matrix that gives greater weight to the environment and economic data categories in order to compensate for the fewer number of categories in the overall score. Standardized scores are derived from the weighted scores by dividing by the sum of their weights and multiplying by 100. The item level standardized scores differ from the raw scores by a factor of 100. Weighting only has an effect on the aggregate scores.
• First select regions or sub-regions and then select countries. The entire database can be selected by choosing all regions and countries.
• The aggregate subscores for social, economic, and environmental categories and subscores for coverage and openness elements can be selected for downloading. Aggregates or raw scores and weighted scores are simple sums. Aggregates for standardized scores are weighted averages.
Reports• The Reports page gives access to the ODIN Annual Report, one page country and regional
briefs, and other documentation in PDF format.
Country ProfileRegional Profile
Country Comparison
Appendix
2015 ODIN Annual Report www.opendatawatch.com 31
Acknowledgements
The Open Data Inventory is a team effort. We are pleased to acknowledge the help of all who contributed to our work.
Open Data WatchShaida Badiee, Misha Belkindas, Eric Swanson, Zach Christensen, Jamison Crowell, Amelia Pittman, Reza Farivari, and Martin Getzendanner
ODIN AssessorsChandrika Kaul, Amelia Pittman, Jamison Crowell, Maria Vallenilla, Morgan Smith, Tawheeda Wahabzada, Usman Masood, Mandy Badamkhand, Sophia Rozas, Mariya Fedorchuk, Ela Comanescu, Amira Khalil, Maissa Khattab, Zach Christensen, and Erik Champenois.
Peer Reviewers Tim Herzog (World Bank), Martine Durand (OECD), Jon Clifton (Gallup), Geoffrey Greenwell (PARIS21), Jessica Espey (Sustainable Development Solutions Network), Mor Rubinstein (Open Knowledge), Joel Gurin and Laura Manley (Center for Open Data Enterprise)
Website and publication designDistrict Design Group
Website developmentAkron, Inc.
Cover photo “Harvesting Crops” courtesy of the World Bank Photo Collection. Copyright: Flickr/Curt Carnemark/World Bank
Back cover “Reading books by the Chinggis Monument” courtesy of the World Bank Photo Collection. Copyright: Flickr/Khasar Sandag / World Bank
Funding Provided by the William and Flora Hewlett Foundation