Embed Size (px)
Citation preview
The objective of UN Environment’s work on ecosystem management is to enable countries to maintain healthy and productive ecosystems so that they continue to provide important services and goods, such as water, food, flood control, biodiversity and climate regulation.
This work contributes directly or in-directly to a large number of the sustainable development goals and targets (1.b, 2.1, 2.4, 3.3, 6.3, 6.5, 6.6, 7.2, 11.4, 11.6, 11.a, 12.6, 12.7, 12.8, 13.3, 14.1, 14.2, 14.3, 14.4, 14.5, 14.6, 14.c, 15.1, 15.2, 15.3, 15.4, 15.5, 15.6, 15.7, 15.8, 15.9, 15.a, 17.5, 17.14, 17.19).
1
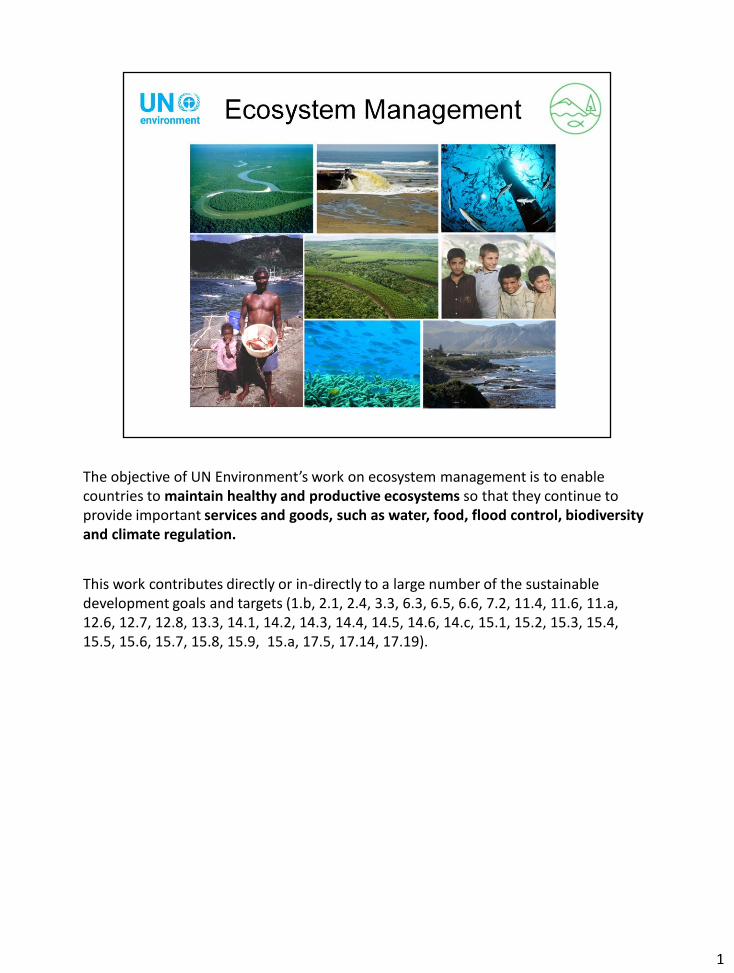
The available resources are about twice the budget for 2016-2017 but 92% of
available resources are earmarked (73% Global Environment Facility funding
and 19% is in Trust Funds as a result of earmarked contributions). Furthermore,
these resources are dedicated to projects extending beyond 2017 while
expenditure shown in this graph is only until end of June 2017.
2
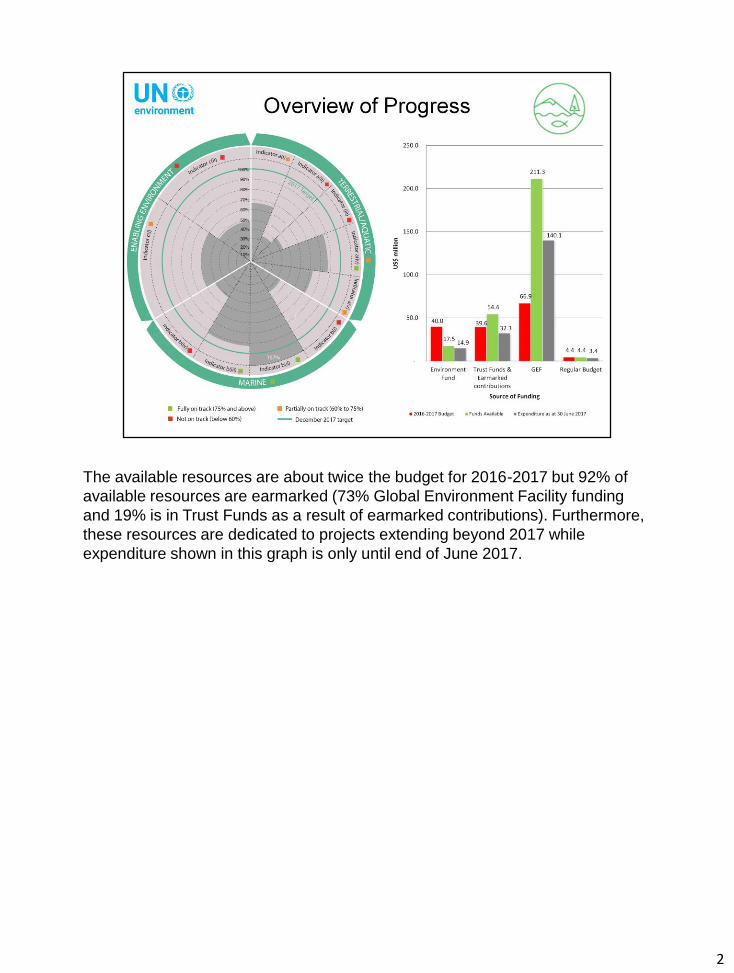
The slide shows progress on the 11 indicators in the preceding slide against the
December 2017 targets set up in the Programme of Work 2016-2017. Progress
on several indicators appears to be lagging behind. Part of the reason is the
different reporting time frame on our extra-budgetary projects which account for
more than 92% of the available resources to meet our performance targets. For
instance, reports on the Global Environment Facility projects are due in
September and these will be included in the end of 2017 report.
Progress on indicators
Expected Accomplishment (a) (terrestrial and aquatic ecosystems)
• Sectoral integration of the ecosystem approach: End of 2015 baseline was 25
countries with an expected increase of 12 by end of 2017. Current increase of
8 countries accounts for 67% of the end of 2017 target. Attainment of target
likely.
• River basins and the ecosystem approach: UN Environment is or has been
working in 14 river basins since the beginning of the 2014-2017 Mid-Term
Strategy and out of these 5 have demonstrated either an approval of the
ecosystem approach by respective governance bodies or implementation by
respective river basin countries. The indicator calls for the approval or
3
implementation of the ecosystem approach by river basin governing bodies or
parties in 100% river basins we work in. The 14 river basins we currently work
in are at various stages in the project cycle with some projects coming to
closure and showing results whereas others are just starting. Therefore, we
are unlikely to reach the full 100% target for all 14 river basins though further
evidence of progress is expected in GEF project reports. Partial attainment
of target likely.
• Water quality frameworks: End of 2017 target is 30 countries and current
progress is 13 (or 43%). Work stream has taken a slightly different approach
since the approval of the Programme of Work indicator due to the Sustainable
Development Goals and the target/indicator on water quality (6.3.2). UN
Environment is the custodian agency for reporting on this indicator and efforts
have thus focused on country ability to report on water quality under the SDG
framework. Partial attainment of target likely.
• Increased area managed through integrated landscape management:
Evidence based on the World Database on Protected Areas where 14.8% of
terrestrial area is covered by a protection measure as per one of the seven
IUCN categories. Target 17% is a global target with 2020 timeframe thus
the full attainment of target not likely by end of 2017.
• Area of landscape/watershed restoration: 72% has been completed of the
2014-2017 timeframe restoration target of 5000 hectares. Achievement
expected to increase when Global Environment Facility project reporting is
included in end of 2017 reporting. Attainment of target likely.
Expected Accomplishment (b) (coastal and marine ecosystems)
• Marine litter: since beginning of 2016, 3 out of targeted 7 countries (or regional
bodies) demonstrated adoption of marine litter action plans, bringing the total
number of countries to 76. Attainment of target likely.
• Waste water: since the beginning of 2016, 5 countries or other entities have
adopted action plans to reduce untreated waste water exceeding the end of
2017 target by 2. The total number of countries is now 73 and target
exceeded.
• Regional Seas: Eleven out of 12 regional seas (end of 2017 target), have
demonstrated the implementation of the ecosystem approach during the
2014-2017 timeframe. Attainment of target likely.
• Increased area managed through integrated seascape management: Due to
challenges in collecting area based information we are using globally collected
data (by UN Environment) and comparing this with targets under the Strategic
Plan for Biodiversity 2011-2020 and the Aichi Biodiversity Targets. The target
of 10% conservation of coastal and marine areas is therefore, unlikely to
3
be met before the global timeframe of 2020.
Expected Accomplishment (c) (integration of ecosystem services in
planning and accounting)
• Accounting of ecosystem services: 6 out of 10 (end of 2017 target) have
demonstrated integration of ecosystem services in their accounting and
planning processes. Attainment of target likely.
• Integration of ecosystem services in at least two different policies: The target
calls for revision of at least one environmental policy framework and one
development plan to integrate biodiversity and ecosystem services. UN
Environment has supported 83 countries to update their National Biodiversity
Strategies and Action Plans of the 189 countries that have submitted their
National Biodiversity Strategies and Action Plans to the Convention on
Biological Diversity. In addition, we have supported 50 countries to develop
their National Action Programmes under the UN Convention on Combatting
Desertification and a number of countries to put in place other environment or
development frameworks. However, the countries above that have received
support from us do not directly overlap and thus only 44 countries have made
changes to at least two strategies/policies with the assistance of UN
Environment. The attainment of the end of 2017 target of 90 countries is
not likely due to the explanation above.
3
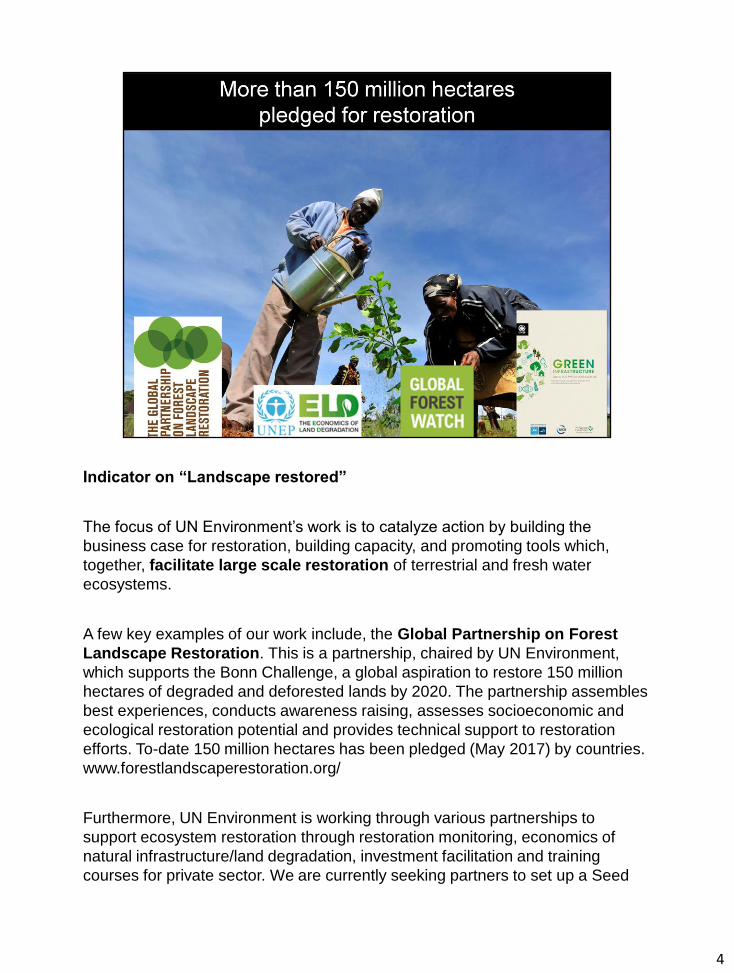
Indicator on “Landscape restored”
The focus of UN Environment’s work is to catalyze action by building the
business case for restoration, building capacity, and promoting tools which,
together, facilitate large scale restoration of terrestrial and fresh water
ecosystems.
A few key examples of our work include, the Global Partnership on Forest
Landscape Restoration. This is a partnership, chaired by UN Environment,
which supports the Bonn Challenge, a global aspiration to restore 150 million
hectares of degraded and deforested lands by 2020. The partnership assembles
best experiences, conducts awareness raising, assesses socioeconomic and
ecological restoration potential and provides technical support to restoration
efforts. To-date 150 million hectares has been pledged (May 2017) by countries.
www.forestlandscaperestoration.org/
Furthermore, UN Environment is working through various partnerships to
support ecosystem restoration through restoration monitoring, economics of
natural infrastructure/land degradation, investment facilitation and training
courses for private sector. We are currently seeking partners to set up a Seed
4
Capital Assistance Facility for Forest and Landscape Restoration to unlock
private finance in restoration projects in developing countries. This initiative
builds on the experiences of the Seed Capital Assistance Facility for renewable
energy which UN Environment set up in 2011 and which to date has unlocked
more than US $500 million in private finance for renewable energy and energy
efficiency.
UN Environment is also one of the partners in a new Restoration Initiative which
is lined up for funding and contributions worth US $250 million. The initiative
aims to increase restoration on more than 40 million hectares in 10 countries
(Cameroon, Central African Republic, China, Democratic Republic of Congo,
Guinea-Bissau, Kenya, Myanmar, Pakistan, Sao Tome & Principe and Tanzania).
The initiative is targeted to start early 2018.
4
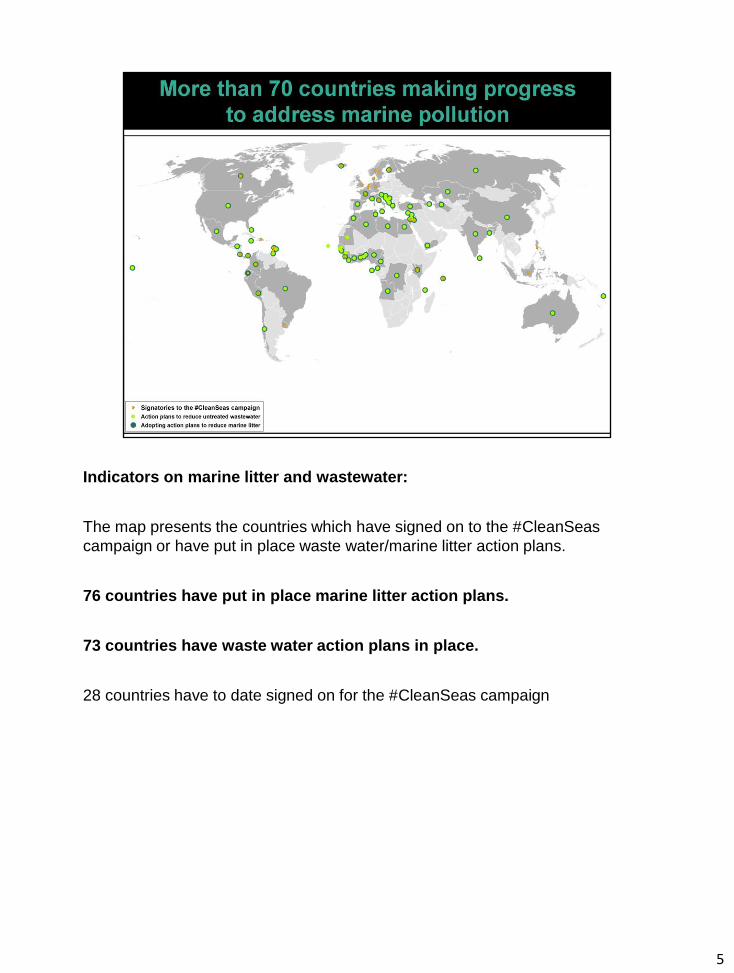
Indicators on marine litter and wastewater:
The map presents the countries which have signed on to the #CleanSeas
campaign or have put in place waste water/marine litter action plans.
76 countries have put in place marine litter action plans.
73 countries have waste water action plans in place.
28 countries have to date signed on for the #CleanSeas campaign
5
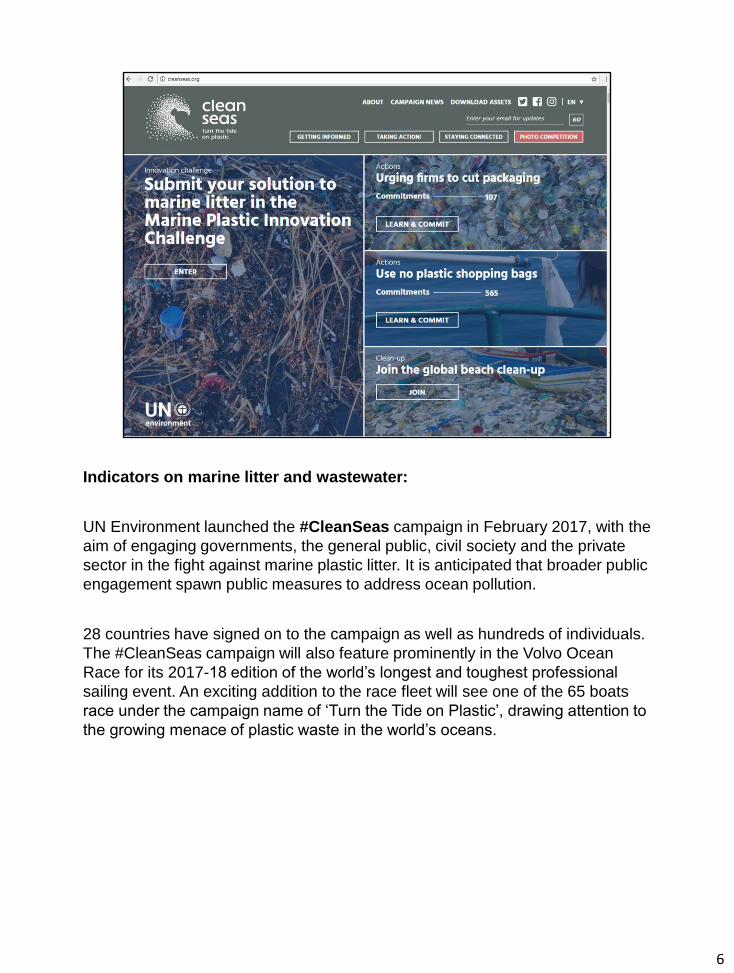
Indicators on marine litter and wastewater:
UN Environment launched the #CleanSeas campaign in February 2017, with the
aim of engaging governments, the general public, civil society and the private
sector in the fight against marine plastic litter. It is anticipated that broader public
engagement spawn public measures to address ocean pollution.
28 countries have signed on to the campaign as well as hundreds of individuals.
The #CleanSeas campaign will also feature prominently in the Volvo Ocean
Race for its 2017-18 edition of the world’s longest and toughest professional
sailing event. An exciting addition to the race fleet will see one of the 65 boats
race under the campaign name of ‘Turn the Tide on Plastic’, drawing attention to
the growing menace of plastic waste in the world’s oceans.
6
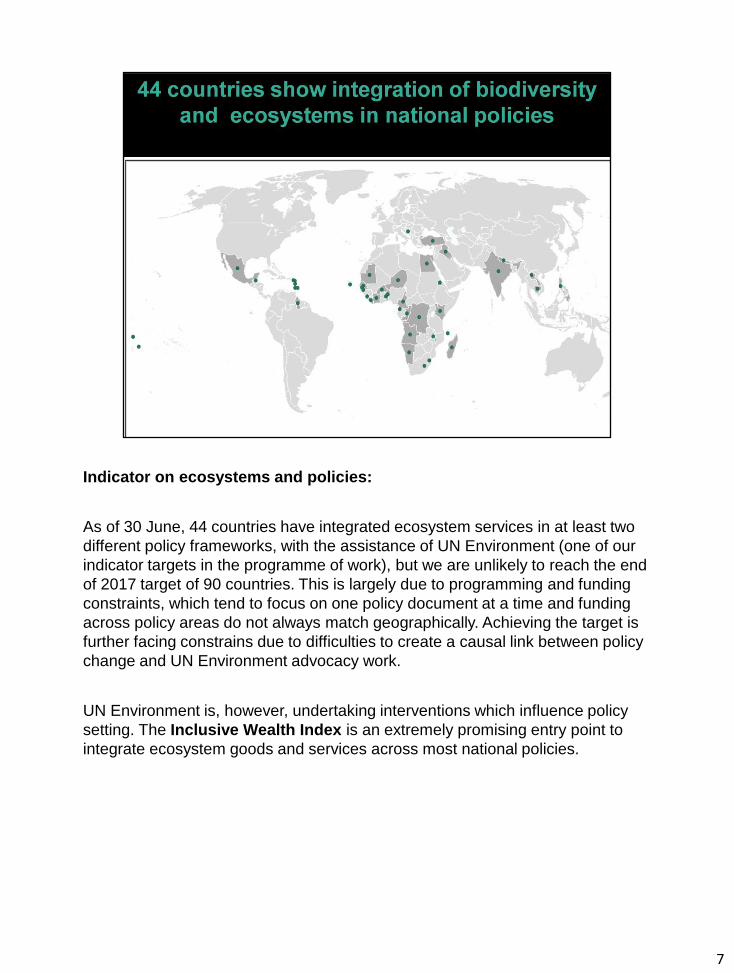
Indicator on ecosystems and policies:
As of 30 June, 44 countries have integrated ecosystem services in at least two
different policy frameworks, with the assistance of UN Environment (one of our
indicator targets in the programme of work), but we are unlikely to reach the end
of 2017 target of 90 countries. This is largely due to programming and funding
constraints, which tend to focus on one policy document at a time and funding
across policy areas do not always match geographically. Achieving the target is
further facing constrains due to difficulties to create a causal link between policy
change and UN Environment advocacy work.
UN Environment is, however, undertaking interventions which influence policy
setting. The Inclusive Wealth Index is an extremely promising entry point to
integrate ecosystem goods and services across most national policies.
7
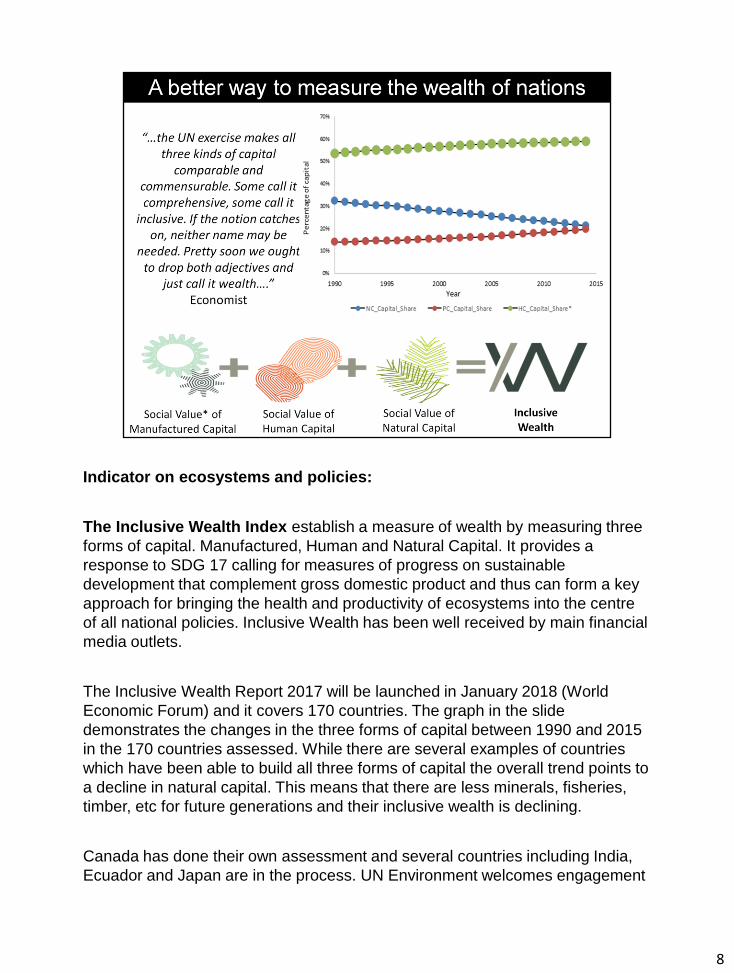
Indicator on ecosystems and policies:
The Inclusive Wealth Index establish a measure of wealth by measuring three
forms of capital. Manufactured, Human and Natural Capital. It provides a
response to SDG 17 calling for measures of progress on sustainable
development that complement gross domestic product and thus can form a key
approach for bringing the health and productivity of ecosystems into the centre
of all national policies. Inclusive Wealth has been well received by main financial
media outlets.
The Inclusive Wealth Report 2017 will be launched in January 2018 (World
Economic Forum) and it covers 170 countries. The graph in the slide
demonstrates the changes in the three forms of capital between 1990 and 2015
in the 170 countries assessed. While there are several examples of countries
which have been able to build all three forms of capital the overall trend points to
a decline in natural capital. This means that there are less minerals, fisheries,
timber, etc for future generations and their inclusive wealth is declining.
Canada has done their own assessment and several countries including India,
Ecuador and Japan are in the process. UN Environment welcomes engagement
8
with more countries to assess their National Inclusive Wealth.
*The social value of the three forms of capital incorporates both the positive and
negative impacts on society.
8
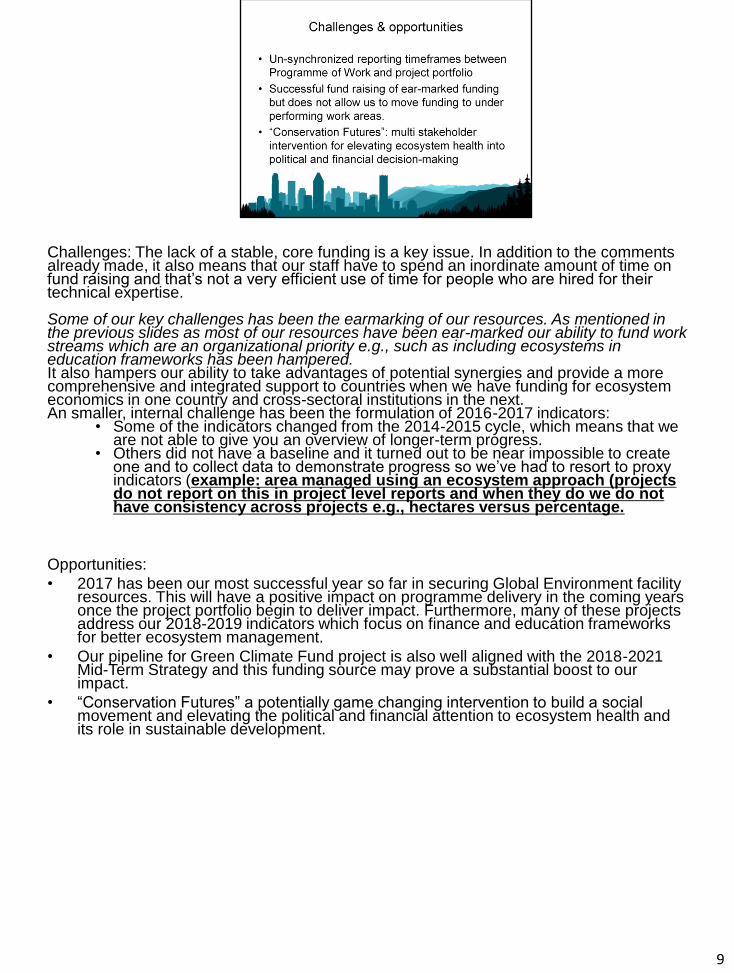
Challenges: The lack of a stable, core funding is a key issue. In addition to the comments already made, it also means that our staff have to spend an inordinate amount of time on fund raising and that’s not a very efficient use of time for people who are hired for their technical expertise. Some of our key challenges has been the earmarking of our resources. As mentioned in the previous slides as most of our resources have been ear-marked our ability to fund work streams which are an organizational priority e.g., such as including ecosystems in education frameworks has been hampered. It also hampers our ability to take advantages of potential synergies and provide a more comprehensive and integrated support to countries when we have funding for ecosystem economics in one country and cross-sectoral institutions in the next. An smaller, internal challenge has been the formulation of 2016-2017 indicators:
• Some of the indicators changed from the 2014-2015 cycle, which means that we are not able to give you an overview of longer-term progress.
• Others did not have a baseline and it turned out to be near impossible to create one and to collect data to demonstrate progress so we’ve had to resort to proxy indicators (example: area managed using an ecosystem approach (projects do not report on this in project level reports and when they do we do not have consistency across projects e.g., hectares versus percentage.
Opportunities:
• 2017 has been our most successful year so far in securing Global Environment facility resources. This will have a positive impact on programme delivery in the coming years once the project portfolio begin to deliver impact. Furthermore, many of these projects address our 2018-2019 indicators which focus on finance and education frameworks for better ecosystem management.
• Our pipeline for Green Climate Fund project is also well aligned with the 2018-2021 Mid-Term Strategy and this funding source may prove a substantial boost to our impact.
• “Conservation Futures” a potentially game changing intervention to build a social movement and elevating the political and financial attention to ecosystem health and its role in sustainable development.
9