Embed Size (px)
Citation preview

1
The Northeast Fisheries The Northeast Fisheries Observer ProgramObserver Program
Amy Van Amy Van AttenAtten, Operations Coordinator & Acting , Operations Coordinator & Acting Branch ChiefBranch Chief
Contributions by Sara Wetmore, Debra Duarte, and Contributions by Sara Wetmore, Debra Duarte, and Brian Brian GervelisGervelis
NOAA, National Marine Fisheries Service NOAA, National Marine Fisheries Service Northeast Fisheries Science CenterNortheast Fisheries Science Center
166 Water Street, Woods Hole, MA 02543166 Water Street, Woods Hole, MA 02543www.nefsc.noaa.gov/femad/fsb/www.nefsc.noaa.gov/femad/fsb/
Herring Committee Meeting, Portland Maine, May 22, 2008
Presentation OutlinePresentation OutlineProgram overviewProgram overviewProgram StructureProgram StructureCostsCostsSeadaySeaday allocationallocationInformation collectedInformation collectedTraining and Training and certificationcertificationObserver retentionObserver retentionData reporting and Data reporting and processingprocessing
The Herring FisheryThe Herring FisheryNumber of trips observedNumber of trips observedCoverage levels and Coverage levels and location by gear and location by gear and seasonseasonIncidental take summaryIncidental take summarySampling protocolsSampling protocolsReleased bagsReleased bagsTiming of dayTiming of dayCatch compositionCatch compositionBasket samplingBasket samplingSize of catch (herring, Size of catch (herring, mackerel, and haddock)mackerel, and haddock)

2
The Northeast Fisheries Observer ProgramThe Northeast Fisheries Observer Program
Coverage from Coverage from Maine through Maine through North CarolinaNorth CarolinaLegal Authority:Legal Authority:–– Marine Mammal Marine Mammal
Protection ActProtection Act–– MagnusonMagnuson--Stevens Stevens
Fishery Fishery Conservation and Conservation and Management ActManagement Act
–– Endangered Endangered Species ActSpecies Act
Program StructureProgram Structure
Based out of the NMFS, Northeast Fisheries Science Based out of the NMFS, Northeast Fisheries Science CenterCenter–– Observer Training Center, Falmouth MAObserver Training Center, Falmouth MA–– Training, observer debriefing, data processing, archivalTraining, observer debriefing, data processing, archival
Contract with an Observer Service ProviderContract with an Observer Service Provider–– AIS, Inc.AIS, Inc.
Two Industry Funded Approved ProvidersTwo Industry Funded Approved Providers–– AIS, Inc. and EWTS, Inc.AIS, Inc. and EWTS, Inc.
Currently have 93 certified observers Currently have 93 certified observers Contractor deploys observers as instructed by the Contractor deploys observers as instructed by the Seaday Schedule and Vessel Selection ListsSeaday Schedule and Vessel Selection Lists

3
Fisheries Sampling Branch Table of OrganizationFisheries Sampling Branch Table of OrganizationAmy Van Atten
Acting Branch Chief
Tom GaffneyOffice for Law
Enforcement Liaison
Mary WoodruffAdministrative
Support
Amy Van AttenOperations Coordinator
Mike TorkMid-Atlantic
Area Lead
Sara WetmoreNortheast Area Lead
Janeen QuintalSpecial Access
Area Analyst
Erin KupchaData Archive
Lead
Katherine McArdleData Quality
Lead
Gina ShieldDatabase
Lead
Joe MelloData Processing
Lead
Corrin FloraScallop Vessel
Call In Coordinator
Tyler StaplesScallop Vessel
Call In Coordinator
Patricia YoosCOTR for AIS
Nancy PeltierComputer Assistant Tania Lewandowski
Training Coordinator
Eric MatzenMid-Atlantic
Assistant Area Lead
Brian GervelisNortheast
Assistant Area Lead
Maria RoachScanning Project
Frank CapitanioScanning Project
Tom MillerCourier
Tim BertrandData Editor
Ian ConboyData Editor
Charles DunlapData Editor
Kris TholkeData Editor Lead
Amanda TongData Editor
Amy WestellData Editor
Brian WestellData Editor
Debra DuarteData Error Project
Patricia McGinnData Error Project
Chuck GasiorAIS Data Entry
Jeanne LoveringData Entry
Charlotte SavageAIS Data Entry
Mike BallTrainer
Diana CowanTrainer
Betty LentellIncidental Take Lead
Erich DruskatData Editor
Stephanie PalkerTrip Tracker
Peter CanavinData Editor
Niki RossiData Editor
Allocation of SeadaysAllocation of SeadaysMultiMulti--purpose observer programpurpose observer programCoverage is sufficient to provide statistically reliable bycatchCoverage is sufficient to provide statistically reliable bycatchestimatesestimates–– Uses a measure of variability around a particular species group Uses a measure of variability around a particular species group
bycatch estimatebycatch estimate–– 30% Coefficient of Variation = good quality30% Coefficient of Variation = good quality
Variables used to allocate coverage (based on previous yearsVariables used to allocate coverage (based on previous years’’effort):effort):–– Geographic area fishedGeographic area fished–– Mesh sizeMesh size–– Trip lengthTrip length–– Target speciesTarget species–– Gear typeGear type
Target 5% coverage of multispecies fisheriesTarget 5% coverage of multispecies fisheriesTarget 30% of U.S./Canada, SAP, and BTarget 30% of U.S./Canada, SAP, and B--DAS fisheriesDAS fisheriesTarget 10% of accessTarget 10% of access--area scallop fisheriesarea scallop fisheriesTarget 20% of the herring fisheryTarget 20% of the herring fishery

4
Program FundingProgram FundingCongressional
Allocation of Funds
Population Dynamics Branch
(fish stock assessments)
Protected SpeciesBranch
(marine mammal & sea turtle)
Social ScienceBranch
(social & economic impacts)
NE Regional Office(quota monitoring)
Fixed Costs(NEFSC support,
permanent salaries, lease,contract labor)
Industry Funded(scallop access areasAnd limited access)
Congressional Funding of NE Observer Coverage
$0
$1,000,000
$2,000,000
$3,000,000
$4,000,000
$5,000,000
$6,000,000
$7,000,000
$8,000,000
2003 2004 2005 2006 2007
Year
Allo
catio
n
New England GroundfishProtected SpeciesAtlantic Coast
Industry Funds(resource set-aside)
Program CostsProgram CostsSEADAY = $1,200
Observer Trainings
Observer Salaries and Benefits
Facility, Gear, Equipment
Insurance
Travel and Trip Deployment
Data Processing
Data Quality Controls
5
Type of Information that Observers Type of Information that Observers CollectCollect
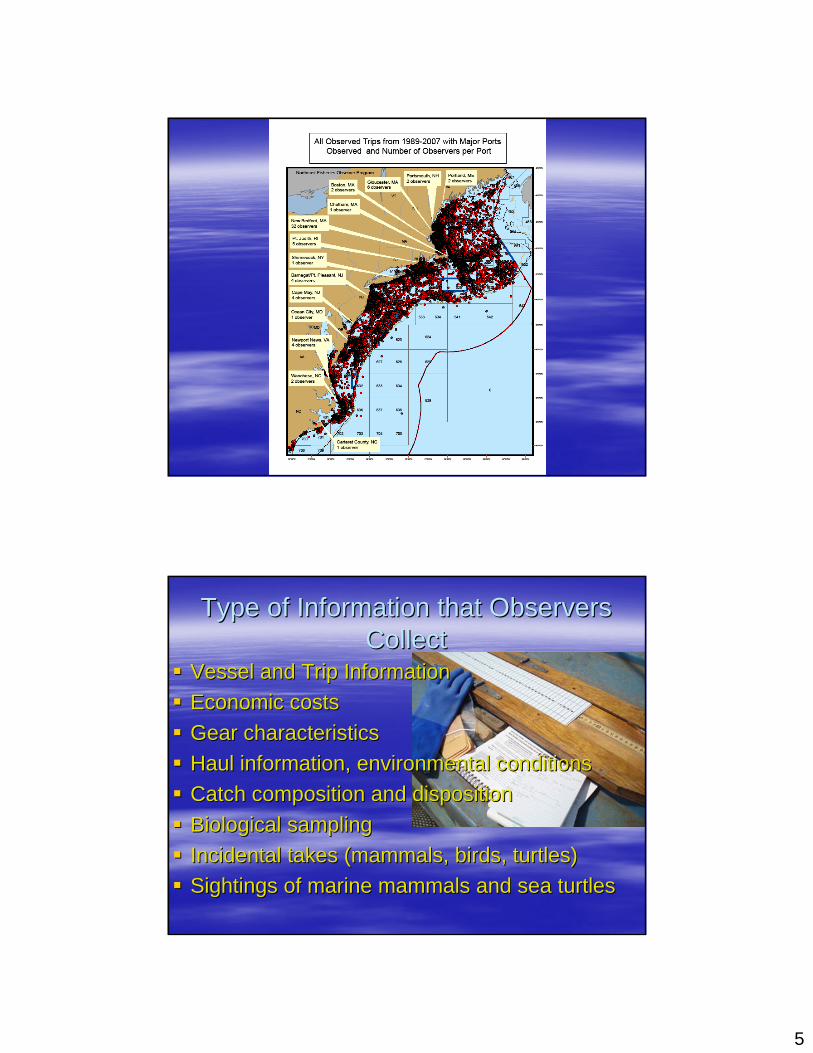
Vessel and Trip InformationVessel and Trip InformationEconomic costsEconomic costsGear characteristicsGear characteristicsHaul information, environmental conditionsHaul information, environmental conditionsCatch composition and dispositionCatch composition and dispositionBiological samplingBiological samplingIncidental takes (mammals, birds, turtles)Incidental takes (mammals, birds, turtles)Sightings of marine mammals and sea turtlesSightings of marine mammals and sea turtles
6
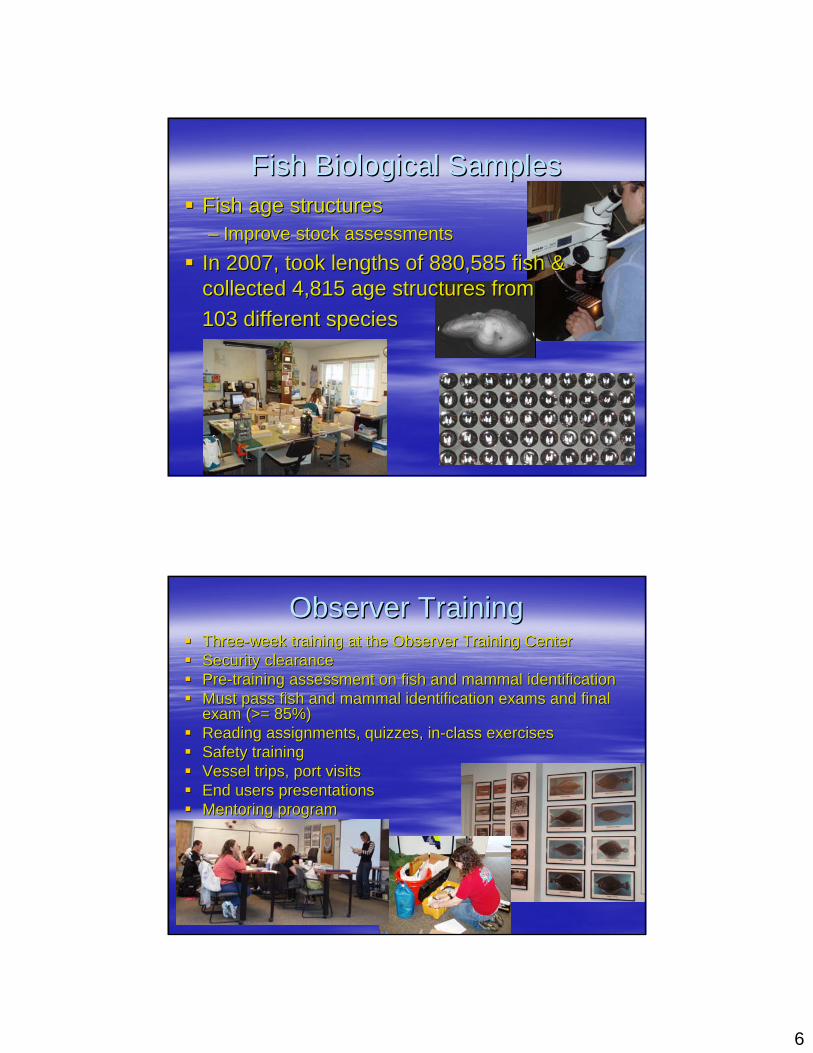
Fish Biological SamplesFish Biological SamplesFish age structuresFish age structures–– Improve stock assessmentsImprove stock assessments
In 2007, took lengths of 880,585 fish & In 2007, took lengths of 880,585 fish & collected 4,815 age structures from collected 4,815 age structures from 103 different species103 different species
Observer TrainingObserver TrainingThreeThree--week training at the Observer Training Centerweek training at the Observer Training CenterSecurity clearanceSecurity clearancePrePre--training assessment on fish and mammal identificationtraining assessment on fish and mammal identificationMust pass fish and mammal identification exams and final Must pass fish and mammal identification exams and final exam (>= 85%)exam (>= 85%)Reading assignments, quizzes, inReading assignments, quizzes, in--class exercisesclass exercisesSafety trainingSafety trainingVessel trips, port visitsVessel trips, port visitsEnd users presentationsEnd users presentationsMentoring programMentoring program
7
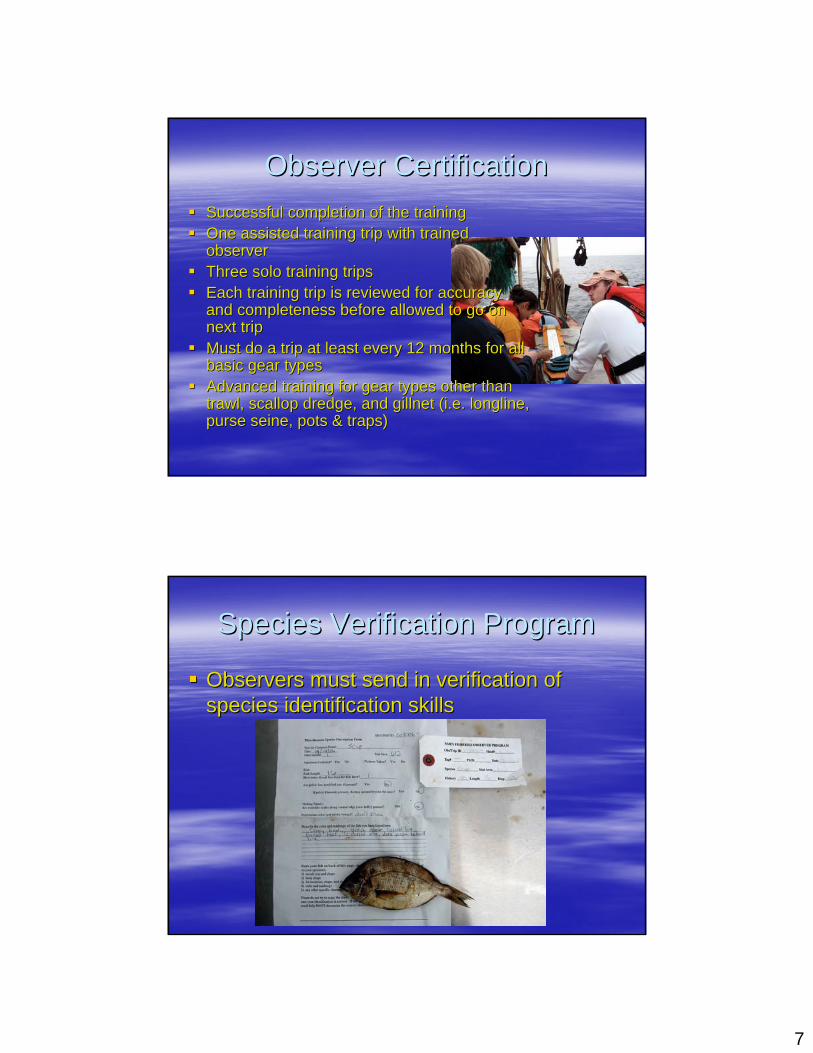
Observer CertificationObserver CertificationSuccessful completion of the trainingSuccessful completion of the trainingOne assisted training trip with trained One assisted training trip with trained observerobserverThree solo training tripsThree solo training tripsEach training trip is reviewed for accuracy Each training trip is reviewed for accuracy and completeness before allowed to go on and completeness before allowed to go on next tripnext tripMust do a trip at least every 12 months for all Must do a trip at least every 12 months for all basic gear typesbasic gear typesAdvanced training for gear types other than Advanced training for gear types other than trawl, scallop dredge, and gillnet (i.e. trawl, scallop dredge, and gillnet (i.e. longlinelongline, , purse seine, pots & traps)purse seine, pots & traps)
Species Verification ProgramSpecies Verification Program
Observers must send in verification of Observers must send in verification of species identification skillsspecies identification skills

8
Training UpdatesTraining UpdatesEstablished an Executive Training Committee (7 Established an Executive Training Committee (7 staff members)staff members)Annual meetingAnnual meetingSixSix--month review meetingmonth review meetingTailor training style to current studentsTailor training style to current studentsUpdate or refine protocolsUpdate or refine protocolsEnsure new manual or log updates are reflected Ensure new manual or log updates are reflected properly throughoutproperly throughoutNew speakers (i.e. FishermenNew speakers (i.e. Fishermen’’s Panel)s Panel)Certification process for each gear typeCertification process for each gear type
Observer RetentionObserver Retention
Average retention rate is only 1 yearAverage retention rate is only 1 yearGreat concern Great concern –– would like it to be higherwould like it to be higherConsiderations for retention are considered in Considerations for retention are considered in contract awardcontract awardReasons for leaving (out of 189 exit interviews)Reasons for leaving (out of 189 exit interviews)–– Sea sicknessSea sickness–– Requires too much time away from home (144 Requires too much time away from home (144
days/year)days/year)–– Unpredictable schedule (trip plans changing)Unpredictable schedule (trip plans changing)–– Conditions on vessels (safety, smoking, mistreatment)Conditions on vessels (safety, smoking, mistreatment)

9
Does Data Quality Improve Over Time?Does Data Quality Improve Over Time?
Table 3. AVERAGE DATA QUALITY SCORES BY EXPERIENCE CATEGORY
0
10
20
30
40
50
60
70
80
< 1 YEAR 1-2 YEARS 3-4 YEARS 5-10 YEARS > 10 YEARS
Experience Categories
Dat
a Q
ualit
y Sc
ore
Table 1. NUMBER OF OBSERVERS PER EXPERIENCE CATEGORY (As of 03/31/2007)
0
5
10
15
20
25
< 1 YEAR 1-2 YEARS 3-4 YEARS 5-10 YEARS > 10 YEARS
Experience Categories
Num
ber o
f Obs
erve
rs
Trip ReportsTrip ReportsElectronic data are downloaded within 24 hours of landing

10
Haddock Cap MonitoringHaddock Cap MonitoringObserver Catch ReportsObserver Catch Reports–– Trip summary of herring and Trip summary of herring and
haddock caughthaddock caught–– Transmitted electronically by Transmitted electronically by
observer to NEFOP office within observer to NEFOP office within 24 hours of trip landing24 hours of trip landing
–– Preliminary data emailed to Preliminary data emailed to Regional Office on daily basisRegional Office on daily basis
–– Data are verified when paper trip Data are verified when paper trip logs are received at NEFOP office logs are received at NEFOP office within 3within 3--5 days of trip landing5 days of trip landing
Trip ProcessingTrip ProcessingElectronic submission (trip summary) within 24 hours of Electronic submission (trip summary) within 24 hours of landinglandingPaper logs received within 7 days of landingPaper logs received within 7 days of landingPrioritization: quota monitoring trips, training trips, trips Prioritization: quota monitoring trips, training trips, trips with incidental takeswith incidental takesFolders and labels are made and recorded in trip trackingFolders and labels are made and recorded in trip trackingSafety compliance checkSafety compliance checkEditor begins overviewEditor begins overview

11
Editing the TripEditing the TripEditor has individual observer Editor has individual observer assignmentsassignmentsReview trip for proper use of logs and Review trip for proper use of logs and completenesscompletenessTranscribe any coded fieldsTranscribe any coded fieldsMaintain a Trip File WorksheetMaintain a Trip File WorksheetMaintain a Data Quality WorksheetMaintain a Data Quality WorksheetVerify samples against trip logsVerify samples against trip logsEnsure that observer followed proper Ensure that observer followed proper sampling protocolssampling protocolsEnsure that logs are complete and ready Ensure that logs are complete and ready for entryfor entryDebrief the Observer on performance and Debrief the Observer on performance and review outstanding questionsreview outstanding questionsCompleted within 45 days of landingCompleted within 45 days of landing
Debriefing the ObserverDebriefing the ObserverOn the phone, by email, or in personOn the phone, by email, or in personReceive feedback on every tripReceive feedback on every tripMandatory inMandatory in--person 6person 6--month debriefingmonth debriefing–– Review edited tripsReview edited trips–– Review data qualityReview data quality–– Receive feedback on incidental take Receive feedback on incidental take
Review photographs, identification, sampling, necropsy results, Review photographs, identification, sampling, necropsy results, current current researchresearch
–– Meet with Safety LeadMeet with Safety LeadReview any current and/or newly identified safety issuesReview any current and/or newly identified safety issues
–– Meet with Area LeadMeet with Area LeadReview results from Comment Cards and Captain InterviewsReview results from Comment Cards and Captain InterviewsReview latest management issues, council agendas, etc.Review latest management issues, council agendas, etc.Get feedback on editorGet feedback on editor’’s performances performance
–– Meet with EnforcementMeet with EnforcementEnsure that there are no outstanding or unreported problems (harEnsure that there are no outstanding or unreported problems (harassment, etc.)assment, etc.)
–– Meet with TrainersMeet with TrainersReview submitted fish through the species verification programReview submitted fish through the species verification programReview fish identificationReview fish identification
–– Review gear measurements on Review gear measurements on codendcodend, liner, and dredge, liner, and dredge–– Meet with End UsersMeet with End Users

12
Data ProcessingData ProcessingData entry (entry screens include audit ranges, code lookup)Data entry (entry screens include audit ranges, code lookup)Data are run through a primary auditData are run through a primary auditData are run through a secondary auditData are run through a secondary auditData are loaded to Oracle database within 90 days of landingData are loaded to Oracle database within 90 days of landingFinal check of key fields (from final data tables to trip folderFinal check of key fields (from final data tables to trip folder))Paper logs are scanned and bar codedPaper logs are scanned and bar codedLoaded to a website for end usersLoaded to a website for end users’’ accessaccessTrips are filed onTrips are filed on--site for 3 yearssite for 3 yearsTrips are archived at secure facility offTrips are archived at secure facility off--sitesite
Probation ProgramProbation ProgramAny concerns with overall observer data quality -submission errors, communications, timeliness of data, under-sampling, poor captain interviewsCease conducting trips and schedule a debriefing in Woods HoleA performance plan is drafted and must be followed to resume standingGenerally three trips are completed, with each trip completely reviewed and approved before re-deploying Become non-eligible for bonus during probation period (usually 30 days)Emergency Probation Action– Invoked if there was reason to believe some egregious
violation of procedures or protocols had been committed– Pending an investigation – Usually results in decertification

13
Quality Assurance ProgramsQuality Assurance ProgramsRegular communication with observersRegular communication with observers–– Debriefings, refresher trainings, memos, newslettersDebriefings, refresher trainings, memos, newsletters
PrePre--briefing between observers and editors for briefing between observers and editors for certain trips (i.e. pair trawl, herring)certain trips (i.e. pair trawl, herring)Shadow Trip ProgramShadow Trip ProgramData Quality and Bonus ProgramData Quality and Bonus ProgramProbation and Decertification ProcessProbation and Decertification ProcessSpecies Verification ProgramSpecies Verification ProgramCaptain InterviewsCaptain InterviewsFishermen Comment CardsFishermen Comment Cards
Observations in the Herring FisheryObservations in the Herring Fishery2005 2005 -- 20072007

14
Number of Observed Herring TripsNumber of Observed Herring Trips2005 2005 -- 20072007
300300575769691591591515TotalsTotals
48481111111117179920072007
424200121225255520062006
210210464646461171171120052005
TotalsTotalsPurse Purse SeineSeine
Single Single MidMid--WaterWater
Paired Paired MidMid--WaterWater
Bottom Bottom TrawlTrawl
Does not include aborted trips, which comprised 29% of the trips in 2007.
Observer Coverage Rate Observer Coverage Rate in the Herring Fishery, 2005 in the Herring Fishery, 2005 -- 20072007
6.138466,178,785.104,062,2936.7462521720073.090379,143,596.802,445,7823.18182207200617.48194,378,705.5016,498,30324.332337822005
Fall (September - December)Fall (September - December)2.658162,939,588.401,672,9892.1951410920072.5624107,492,107.302,754,3343.235334011200619.0184,473,217.3016,058,43429.0323721082005
Summer (May - August)Summer (May - August)3.599145,106,116.001,623,4369.240930328200711.74737,157,651.204,364,94119.78618737200616.05825,797,931.604,142,64025.243103262005
%covtotal lbs landedlbs observed%cov#total trips#obs tripsWinter (January - April)Winter (January - April)% coverage by lbs % coverage by trips
Average based on trips = 13% Average based on catch = 9%

15

16

17
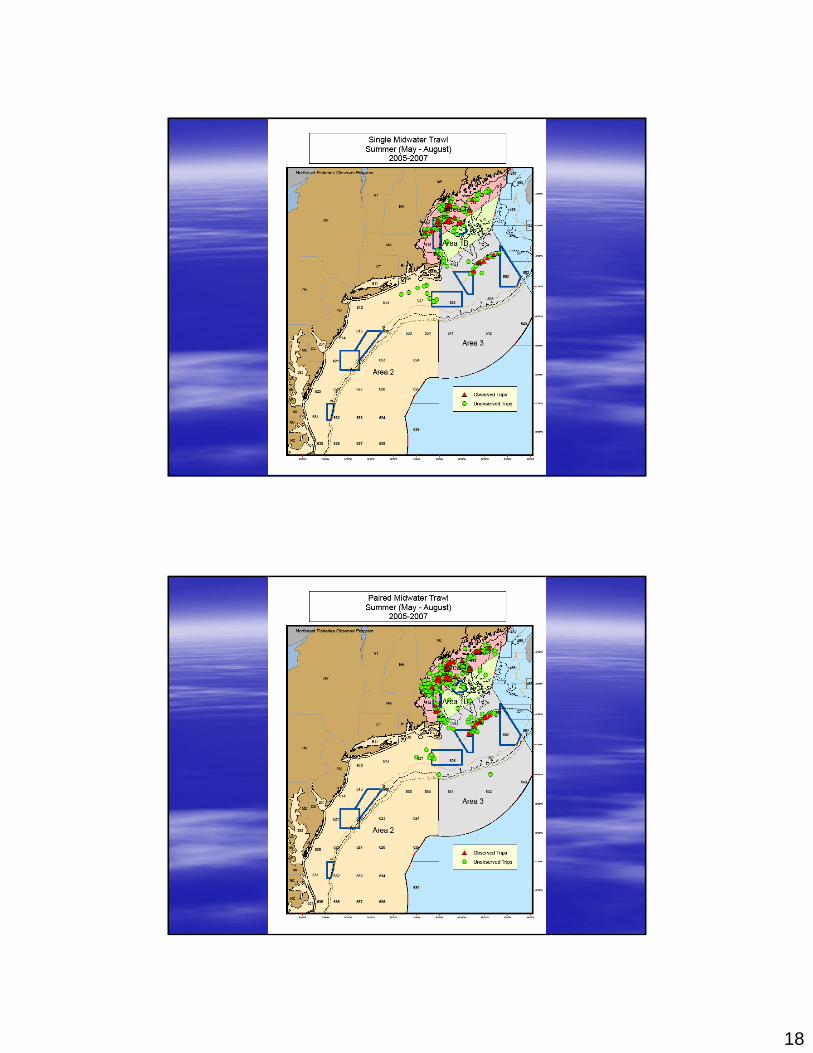
18

19

20

21

22
Incidental Takes Observed in the Incidental Takes Observed in the Herring FisheryHerring Fishery
2005 2005 -- 20072007Bottom TrawlBottom Trawl–– 2 white2 white--sided dolphinssided dolphins
Paired MidPaired Mid--Water TrawlWater Trawl–– 11 white11 white--sided dolphinssided dolphins–– 48 Northern gannets (58% released alive)48 Northern gannets (58% released alive)
Single MidSingle Mid--Water TrawlWater Trawl–– 1 white1 white--sided dolphinsided dolphin–– 1 common dolphin1 common dolphin–– 1 pilot whale1 pilot whale–– 2 Northern gannets (50% released alive)2 Northern gannets (50% released alive)
Purse SeinePurse Seine–– 18 gray seals (all released alive)18 gray seals (all released alive)–– 1 harbor seal (released alive)1 harbor seal (released alive)–– 1 unidentified seal (released alive)1 unidentified seal (released alive)

23

24
Sampling in the Herring FisherySampling in the Herring FisheryDepends on gear type used, how the fish are Depends on gear type used, how the fish are brought onboard, and where they are stored brought onboard, and where they are stored Large volume fisheriesLarge volume fisheries–– Catch compositionCatch composition
10 Baskets, 10 Baskets, subsampledsubsampled and extrapolatedand extrapolatedAll handAll hand--picked discards are weighedpicked discards are weighed
Smaller volume using fish binsSmaller volume using fish bins–– Catch estimation (volume to volume)Catch estimation (volume to volume)
Sampling is described in handout.Sampling is described in handout.

25
Haul LogHaul Log

26

27
AtAt--Sea ProcessorSea Processor

28
Results from Haul Questions on Results from Haul Questions on Being Able to See the Being Able to See the CodendCodend
(n=387)(n=387)
Was the observer able to see the Was the observer able to see the codendcodend??–– MidMid--water: 49% = No; 28% = Yes; 23% = NAwater: 49% = No; 28% = Yes; 23% = NA–– Purse seine: 26% = No; 36% = Yes; 38% = NAPurse seine: 26% = No; 36% = Yes; 38% = NA
Were there fish in the Were there fish in the codendcodend at the end of the pump?at the end of the pump?–– MidMid--water: 28% = No; 15% = Yes; 34% = Couldnwater: 28% = No; 15% = Yes; 34% = Couldn’’t see; 23% = NAt see; 23% = NA–– Purse seine: 34% = No; 24% = Yes; 4% = CouldnPurse seine: 34% = No; 24% = Yes; 4% = Couldn’’t see; 38% = NAt see; 38% = NA
When the When the codendcodend was emptied where was it located?was emptied where was it located?–– MidMid--water: 14% = Off Stern; 32% = Side of Vessel; 9% = On Deck; water: 14% = Off Stern; 32% = Side of Vessel; 9% = On Deck;
45% = NA45% = NA–– Purse seine: 1% = Off Stern; 43% = Side of Vessel; 4% = On Deck;Purse seine: 1% = Off Stern; 43% = Side of Vessel; 4% = On Deck;
52% = NA52% = NA
Summary of Observed Herring Trips, 2005 Summary of Observed Herring Trips, 2005 -- 20072007
Port Land # tripsDays (total)
Area fished (most)
# hauls (total)
Haul duration (avg hours)
Bottom depth (avg fathoms)
GLOUCESTER, MA 1 1 514 2 1.6 42NEWPORT, RI 8 11 539 51 1.2 20POINT JUDITH, RI 6 6 539 25 1.0 28GLOUCESTER, MA 2 8 511 5 39PORT CLYDE, ME 15 33 513 28 38PORTLAND, ME 4 9 512 8 59PORTSMOUTH, NH 3 7 514 4 27PROSPECT HARBOR, ME 5 10 512 9 46ROCKLAND, ME 27 56 513 75 38VINALHAVEN, ME 1 2 511 1 46CAPE MAY, NJ 1 4 616 2 4.4 44 19 - 44FALL RIVER, MA 2 8 513 2 5.0 35 6 - 9GLOUCESTER, MA 56 168 514 181 4.0 43 18 - 24NEW BEDFORD, MA 22 92 521 75 4.1 35 15 - 20NEWINGTON, NH 8 35 522 32 3.6 46 20 - 25POINT JUDITH, RI 1 2 539 1 2.6 20PORTLAND, ME 23 57 513 39 4.3 58 10 - 25PORTSMOUTH, NH 2 7 522 6 5.1 38 20 - 27PROSPECT HARBOR, ME 3 8 513 7 4.7 59 8 - 22PROVIDENCE, RI 17 31 539 32 3.1 19ROCKLAND, ME 12 30 513 24 3.4 53 19 - 24ROCKPORT, MA 1 2 539 2 2.4 17VINALHAVEN, ME 11 32 513 24 3.5 52 17 - 23BOOTHBAY HARBOR, ME 1 2 513 1 2.5 35FALL RIVER, MA 4 15 514 5 3.4 28 10 - 15GLOUCESTER, MA 19 64 522 63 4.0 48NEW BEDFORD, MA 4 19 613 22 3.9 33NEWINGTON, NH 1 3 513 1 8.7 66OTHER PROVIDENCE, RI 1 4 537 6 1.0 22OTHER WASHINGTON, RI 1 2 539 7 0.6 18POINT JUDITH, RI 7 17 537 18 3.5 30PORTLAND, ME 29 80 513 57 4.0 50 25 - 39PORTSMOUTH, NH 2 8 513 7 4.5 65Si
ngle
Mid
wat
erTr
awl
Purs
e Se
ine
Headrope depth (avg fathoms)
Bot
tom
O
tter
Traw
lPa
ired
Mid
wat
erTr
awl
29
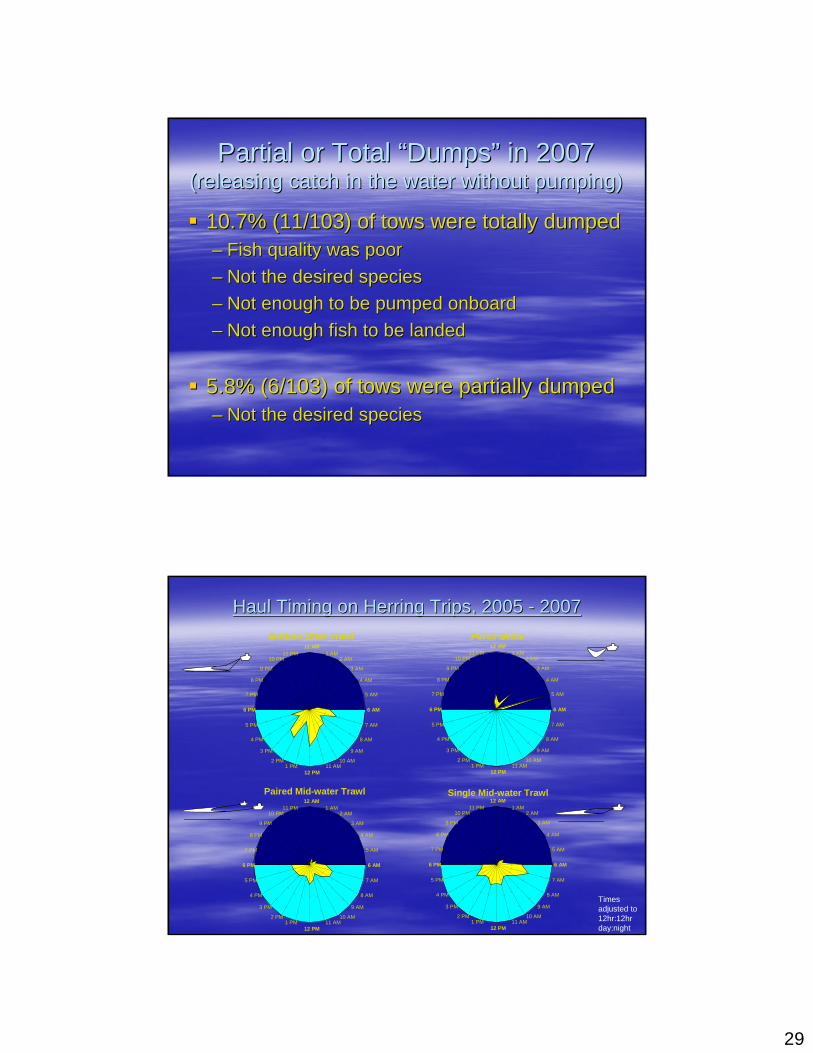
Partial or Total Partial or Total ““DumpsDumps”” in 2007 in 2007 (releasing catch in the water without pumping)(releasing catch in the water without pumping)
10.7% (11/103) of tows were totally dumped10.7% (11/103) of tows were totally dumped–– Fish quality was poorFish quality was poor–– Not the desired speciesNot the desired species–– Not enough to be pumped onboardNot enough to be pumped onboard–– Not enough fish to be landedNot enough fish to be landed
5.8% (6/103) of tows were partially dumped5.8% (6/103) of tows were partially dumped–– Not the desired speciesNot the desired species
Haul Timing on Herring Trips, 2005 Haul Timing on Herring Trips, 2005 -- 20072007Bottom Otter Trawl Purse Seine
12 AM1 AM
2 AM
3 AM
4 AM
5 AM
6 AM
7 AM
8 AM
9 AM
10 AM11 AM
12 PM1 PM
2 PM
3 PM
4 PM
5 PM
6 PM
7 PM
8 PM
9 PM
10 PM11 PM
Paired Mid-water Trawl12 AM
1 AM2 AM
3 AM
4 AM
5 AM
6 AM
7 AM
8 AM
9 AM
10 AM11 AM
12 PM1 PM
2 PM
3 PM
4 PM
5 PM
6 PM
7 PM
8 PM
9 PM
10 PM11 PM
12 AM1 AM
2 AM
3 AM
4 AM
5 AM
6 AM
7 AM
8 AM
9 AM
10 AM11 AM
12 PM1 PM
2 PM
3 PM
4 PM
5 PM
6 PM
7 PM
8 PM
9 PM
10 PM11 PM
Single Mid-water Trawl12 AM
1 AM2 AM
3 AM
4 AM
5 AM
6 AM
7 AM
8 AM
9 AM
10 AM11 AM
12 PM1 PM
2 PM
3 PM
4 PM
5 PM
6 PM
7 PM
8 PM
9 PM
10 PM11 PM
Times adjusted to 12hr:12hr day:night

30
Catch Composition on Herring Trips, 2005 Catch Composition on Herring Trips, 2005 -- 20072007
WinterJan - AprSpecies / Group TOTAL LBS % TOTAL % HAULS TOTAL LBS % TOTAL % HAULS TOTAL LBS % TOTAL % HAULS TOTAL LBS % TOTAL % HAULSAlewife 30,879 3.7% 95% 25,528 0.3% 29% 66,787 5.3% 60%Atl Herring 630,111 75.5% 100% 8,669,695 97.4% 100% 926,574 72.9% 100%Atl Mackerel 155,278 18.6% 67% 177,648 2.0% 43% 217,237 17.1% 85%Blueback Herring 4,863 0.6% 28% 16,286 0.2% 21% 55,605 4.4% 40%Commercial, Other 19 0.0% 10% 1,500 0.0% 24% 154 0.0% 30%Cod 141 0.0% 7% 43 0.0% 7% 0 0.0% 0%Dogfish 8,621 1.0% 75% 3,294 0.0% 69% 2,117 0.2% 85%Flounders 92 0.0% 13% 0 0.0% 0% 0 0.0% 0%Haddock 0 0.0% 0% 358 0.0% 12% 0 0.0% 0%Hakes 2,600 0.3% 44% 413 0.0% 7% 93 0.0% 20%Monkfish 0 0.0% 0% 56 0.0% 5% 6 0.0% 15%Non-Commercial, Other 17 0.0% 11% 0 0.0% 38% 19 0.0% 20%Other Herrings 833 0.1% 3% 3,304 0.0% 21% 1,154 0.1% 25%Skates 1 0.0% 3% 2 0.0% 2% 1 0.0% 5%Squids 1,048 0.1% 20% 220 0.0% 2% 210 0.0% 35%Trash 155 0.0% 8% 1,230 0.0% 12% 300 0.0% 5%IAL Species 1 porbeagle
Paired Midwater Trawl42 hauls
Single Midwater Trawl20 hauls
Bottom Otter Trawl61 hauls
Purse Seine0 hauls
BASS, STRIPED MENHADEN, ATLANTIC SHRIMP, SCARLET CRAB, HORSESHOE JELLYFISH, NK RAVEN, SEABLUEFISH POLLOCK SNAPPER, NK CRAB, SPIDER, NK LAMPREY, NK SCULPIN, LONGHORNBUTTERFISH REDFISH, NK TAUTOG EEL, NK LUMPFISH SCULPIN, NKHAKE, NK SCUP WEAKFISH FISH, NK OCEAN POUT STARFISH, SEASTAR,NKLOBSTER, AMERICAN SEA BASS, BLACK WOLFFISH, ATLANTIC HAGFISH, ATLANTIC OCTOPUS, NKMACKEREL, NK SHRIMP, NK
Non-Commercial, OtherCommercial, Other
Catch Composition on Herring Trips, 2005 Catch Composition on Herring Trips, 2005 -- 20072007
SummerMay - AugSpecies / Group TOTAL LBS % TOTAL % HAULS TOTAL LBS % TOTAL % HAULS TOTAL LBS % TOTAL % HAULS TOTAL LBS % TOTAL % HAULSAlewife 0 0.0% 0% 0 0.0% 0% 29 0.0% 3%Atl Herring 2,380,638 99.7% 100% 12,469,553 99.8% 100% 5,810,671 99.5% 99%Atl Mackerel 870 0.0% 13% 9,220 0.1% 25% 2,709 0.0% 21%Blueback Herring 8 0.0% 3% 0 0.0% 0% 0 0.0% 0%Commercial, Other 112 0.0% 13% 1,159 0.0% 6% 396 0.0% 14%Cod 0 0.0% 0% 108 0.0% 6% 37 0.0% 4%Dogfish 5,127 0.2% 31% 4,372 0.0% 23% 6,759 0.1% 27%Flounders 0 0.0% 0% 2 0.0% 1% 11 0.0% 14%Haddock 0 0.0% 0% 8,760 0.1% 22% 2,281 0.0% 34%Hakes 25 0.0% 6% 521 0.0% 7% 845 0.0% 34%Monkfish 0 0.0% 0% 21 0.0% 7% 26 0.0% 3%Non-Commercial, Other 69 0.0% 6% 1,857 0.0% 38% 557 0.0% 40%Other Herrings 0 0.0% 0% 300 0.0% 1% 15,061 0.3% 3%Skates 0 0.0% 0% 0 0.0% 0% 0 0.0% 0%Squids 420 0.0% 9% 1,734 0.0% 7% 136 0.0% 16%Trash 53 0.0% 6% 21 0.0% 3% 63 0.0% 4%IAL Species
Paired Midwater Trawl69 hauls
Single Midwater Trawl70 hauls
1 mako, 1 shark NK,2 basking sharks, 1 torpedo ray
2 porbeagles, 1 basking shark
Bottom Otter Trawl0 hauls
Purse Seine32 hauls
1 blue shark
BASS, STRIPED MENHADEN, ATLANTIC SHRIMP, SCARLET CRAB, HORSESHOE JELLYFISH, NK RAVEN, SEABLUEFISH POLLOCK SNAPPER, NK CRAB, SPIDER, NK LAMPREY, NK SCULPIN, LONGHORNBUTTERFISH REDFISH, NK TAUTOG EEL, NK LUMPFISH SCULPIN, NKHAKE, NK SCUP WEAKFISH FISH, NK OCEAN POUT STARFISH, SEASTAR,NKLOBSTER, AMERICAN SEA BASS, BLACK WOLFFISH, ATLANTIC HAGFISH, ATLANTIC OCTOPUS, NKMACKEREL, NK SHRIMP, NK
Non-Commercial, OtherCommercial, Other

31
Catch Composition on Herring Trips, 2005 Catch Composition on Herring Trips, 2005 -- 20072007
FallSep - DecSpecies / Group TOTAL LBS % TOTAL % HAULS TOTAL LBS % TOTAL % HAULS TOTAL LBS % TOTAL % HAULS TOTAL LBS % TOTAL % HAULSAlewife 154 0.2% 33% 0 0.0% 0% 31,942 0.2% 16% 14,500 0.2% 10%Atl Herring 77,136 95.4% 100% 2,400,981 99.9% 100% 15,466,468 96.3% 100% 5,849,156 93.8% 100%Atl Mackerel 637 0.8% 44% 690 0.0% 7% 430,015 2.7% 61% 254,628 4.1% 36%Blueback Herring 70 0.1% 11% 0 0.0% 0% 21,956 0.1% 14% 11,767 0.2% 13%Commercial, Other 159 0.2% 56% 32 0.0% 11% 1,533 0.0% 27% 12,020 0.2% 46%Cod 7 0.0% 22% 0 0.0% 0% 161 0.0% 10% 19 0.0% 6%Dogfish 1,784 2.2% 100% 891 0.0% 36% 74,239 0.5% 58% 40,699 0.7% 57%Flounders 108 0.1% 100% 4 0.0% 4% 8 0.0% 7% 57 0.0% 17%Haddock 5 0.0% 11% 0 0.0% 0% 2,918 0.0% 31% 35,213 0.6% 33%Hakes 474 0.6% 44% 0 0.0% 0% 8,289 0.1% 27% 10,649 0.2% 41%Monkfish 30 0.0% 11% 0 0.0% 0% 112 0.0% 5% 76 0.0% 14%Non-Commercial, Other 66 0.1% 100% 0 0.0% 0% 256 0.0% 10% 1,431 0.0% 23%Other Herrings 0 0.0% 0% 0 0.0% 0% 16,185 0.1% 16% 2,826 0.0% 14%Skates 41 0.1% 56% 12 0.0% 7% 5 0.0% 1% 0 0.0% 1%Squids 5 0.0% 22% 137 0.0% 14% 3,098 0.0% 33% 564 0.0% 16%Trash 200 0.2% 11% 0 0.0% 0% 200 0.0% 2% 90 0.0% 7%IAL Species
Paired Midwater Trawl83 hauls
Single Midwater Trawl69 hauls
2 basking sharks, 1 mako, 5 shark NK, 7 porbeagles, 1 sand tiger shark,
5 bluefin tuna, 5 tuna NK
2 porbeagles, 1 shark NK
Bottom Otter Trawl9 hauls
Purse Seine28 hauls
BASS, STRIPED MENHADEN, ATLANTIC SHRIMP, SCARLET CRAB, HORSESHOE JELLYFISH, NK RAVEN, SEABLUEFISH POLLOCK SNAPPER, NK CRAB, SPIDER, NK LAMPREY, NK SCULPIN, LONGHORNBUTTERFISH REDFISH, NK TAUTOG EEL, NK LUMPFISH SCULPIN, NKHAKE, NK SCUP WEAKFISH FISH, NK OCEAN POUT STARFISH, SEASTAR,NKLOBSTER, AMERICAN SEA BASS, BLACK WOLFFISH, ATLANTIC HAGFISH, ATLANTIC OCTOPUS, NKMACKEREL, NK SHRIMP, NK
Non-Commercial, OtherCommercial, Other
Catch Composition on Herring Trips, 2007Catch Composition on Herring Trips, 2007
0%
Change in Species Distribution During Pumping
aver
age
% o
f bas
ket w
eigh
t
Atl Herring
River HerringAtl Mackerel
Other = hake, dogfish, squid, sculpin
10%
20%
30%
40%
50%
60%
70%
80%
90%
100%
pumping begin pumping endproportion of pumping time elapsed
0
1
2
3
4
5
6
7
1 2 3 4 5 6 7 8 9 10
corrected basket #
aver
age
bask
et w
eigh
t (lb
s)
River HerringAtl Mackerel
The distribution of river herring weights is significantly different from mackerel (Χ2 = 38.99, df = 9, p = 0.00001)

32
Basket Sampling on Herring Trips, 2007Basket Sampling on Herring Trips, 2007
Single and Paired Midwater Trawl
pumping begin pumping endproportion of pumping time elapsed
Multiple hauls on the same trip
Two baskets taken at the same time
Basket Sampling on Herring Trips, 2007, contBasket Sampling on Herring Trips, 2007, cont’’dd
Purse Seine
pumping begin pumping endproportion of pumping time elapsed

33
Basket Sampling on Herring Trips, 2007, contBasket Sampling on Herring Trips, 2007, cont’’dd
0%
25%
50%
75%
100%
0% 25% 50% 75% 100%
completeness
even
ness
Completeness = the time between the first and last baskets ÷ total pumping time(e.g., pumping from 1:00 - 2:00, first basket at 1:10, last basket at 1:55 = 75% complete)
Evenness = the shortest gap between baskets ÷ the longest gap between baskets (e.g., longest gap of 20 minutes, shortest gap of 10 minutes = 50% even)
Herring Age Classes on Herring Trips, 2005 Herring Age Classes on Herring Trips, 2005 -- 20072007
Bubble size represents # of animals
2
4
6
8
10
12
appr
oxim
ate
age
Summer FallWinter
> 13
<2

34
Mackerel Size Classes on Herring Trips, 2005 Mackerel Size Classes on Herring Trips, 2005 -- 20072007
Size Class (based on length-weight relationship)
# an
imal
s re
cord
ed in
siz
e cl
ass
average length (cm) of anim
als in size class
0
200
400
600
800
1000
1200
1400
UNCL SM XXSM XSM SM MED LRG XLRG UNCL LG0
10
20
30
40
50
60
70# animalsaverage length
Haddock Catch on Herring Trips, 2005 Haddock Catch on Herring Trips, 2005 -- 20072007Paired Mid-water Trawl Single Mid-water Trawl
Area 1B
Area 3
Area 1A
515
525
513
521 522
512
537
526
514
465
562
464
538
561
511
551
ME
MA
NH
MA
Area 1B
Area 3
Area 1A
515
525
513
521 522
512
537
526
514
465
562
464
538
561
511
551
ME
MA
NH
MA
symbol size represents total catch of haddock (lbs)
SummerFall
Winter

35
Area 1B
Area 3
Area 1A
515
525
513
521 522
512
537
526
514
465
562
464
538
561
511
551
ME
MA
NH
MA
Area 1B
Area 3
Area 1A
515
525
513
521 522
512
537
526
514
465
562
464
538
561
511
551
ME
MA
NH
MA
Haddock Size on Herring Trips, 2005 Haddock Size on Herring Trips, 2005 -- 20072007Paired Mid-water Trawl Single Mid-water Trawl
symbol size represents average size of haddock (cm)
SummerFall
Winter
0
10
20
30
40
50
20 30 40 50 60 70length (cm)
# at
leng
th
FallSummerWinter
0
10
20
30
40
50
60
20 30 40 50 60 70
length (cm)
# at
leng
th
FallSummer
Areas Possibly Needing Areas Possibly Needing Consideration & Regulatory SupportConsideration & Regulatory Support
Bring closed Bring closed codendcodend onboard whenever possible and open onboard for onboard whenever possible and open onboard for observer to see.observer to see.Provide accurate details to the observer on why bags may be partProvide accurate details to the observer on why bags may be partially ially pumped and released. pumped and released. Provide observer notice when pumping may be coming to an end.Provide observer notice when pumping may be coming to an end.Notify observer of any known marine mammal in the net. Notify observer of any known marine mammal in the net. Provide the observer with a safe sampling station. This may incProvide the observer with a safe sampling station. This may include a lude a safety harness if grating systems are high above the deck, a safsafety harness if grating systems are high above the deck, a safe e method to obtain basket samples, and storage space for baskets amethod to obtain basket samples, and storage space for baskets and nd gear. gear. Provide assistance in obtaining basket samples and sorted discarProvide assistance in obtaining basket samples and sorted discards. ds. In pair trawl operations, require additional communication betweIn pair trawl operations, require additional communication between the en the boats if fish are being pumped to both vessels with only one obsboats if fish are being pumped to both vessels with only one observer. erver. Require completion of the Catcher Vessel Log (or some version ofRequire completion of the Catcher Vessel Log (or some version of that) that) in a Catcher/Processor operation. in a Catcher/Processor operation. Require a flow scale on a Processing Vessel since there is no otRequire a flow scale on a Processing Vessel since there is no other her method to estimate volume of catch. method to estimate volume of catch.

36
Future Considerations to Improve Future Considerations to Improve MonitoringMonitoring
May want to consider using two observers May want to consider using two observers on larger vessels (125 feet and above is on larger vessels (125 feet and above is used on West Coast). used on West Coast). May want to consider using Electronic May want to consider using Electronic Monitoring (video camera system), mounted Monitoring (video camera system), mounted at the grate, if two observers can not be at the grate, if two observers can not be deployed. deployed. Need to make goals very clear on what the Need to make goals very clear on what the coverage is for.coverage is for.