Embed Size (px)
Citation preview
THE NEW FACE OF INTERNATIONAL TRADE
Arjun Goswami
Chief of Regional Cooperation and Integration Thematic Group
Asian Development Bank
European Institute for Asian Studies
Brussels, Belgium
22 June 2018
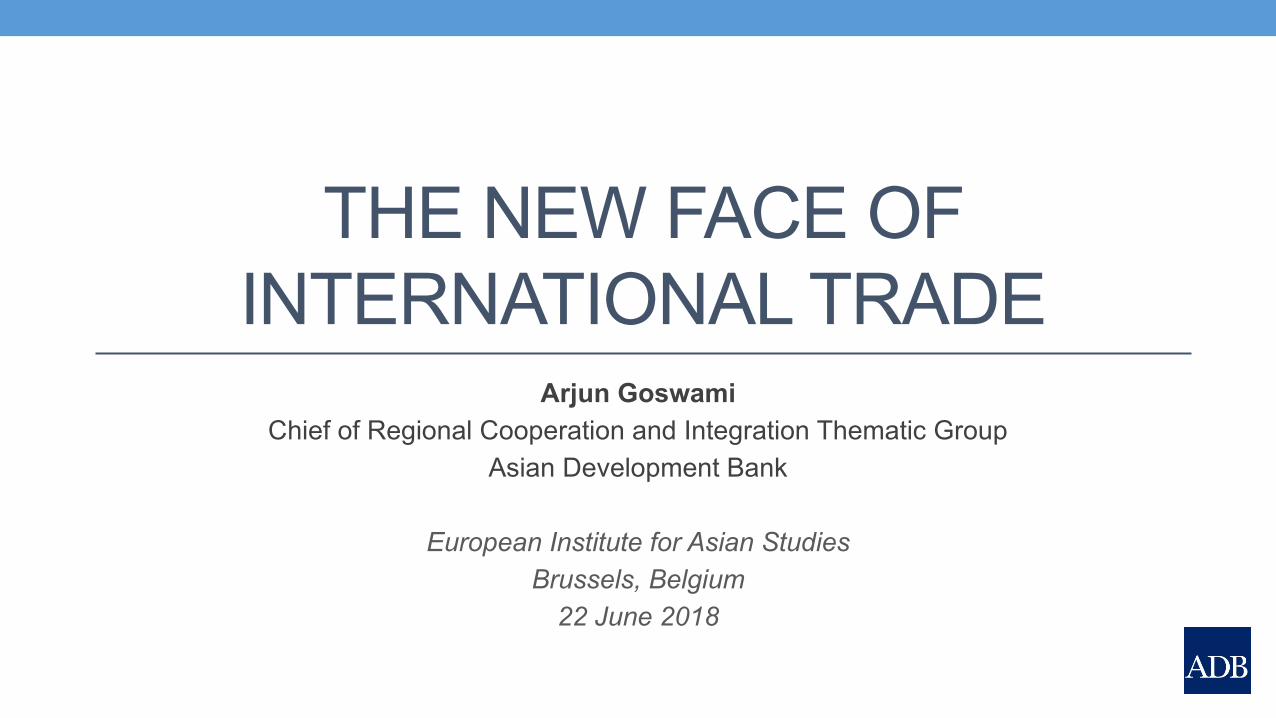
Outline• Global and regional trade : tailwinds and cross currents• Policy : Mitigating the impacts of global trade protectionism• Countries : Dealing with nontariff barriers through trade facilitation
• Market forces : Harnessing of disruptive technology• Businesses : Addressing rising inequality through inclusive trade and investment
• Conclusion : The new face of international trade
2
GLOBAL AND REGIONAL TRADE : TAILWINDS AND CROSS CURRENTS
3
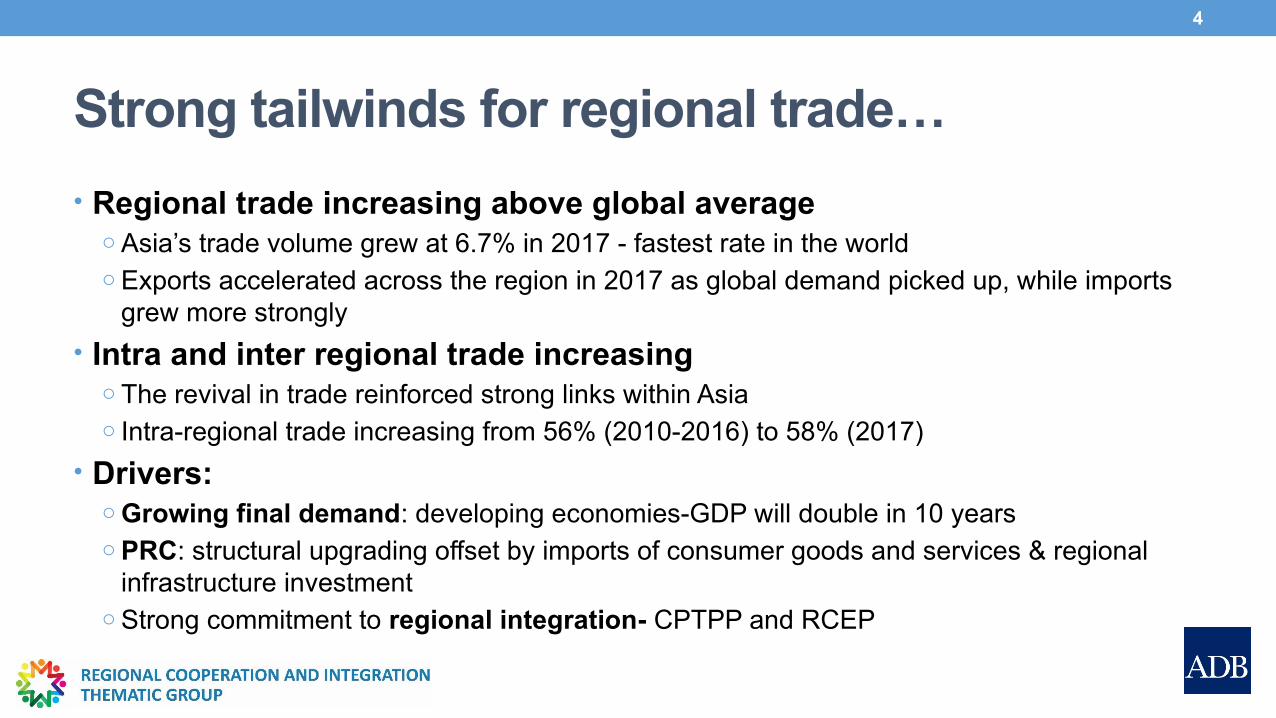
Strong tailwinds for regional trade…
• Regional trade increasing above global averageo Asia’s trade volume grew at 6.7% in 2017 - fastest rate in the worldo Exports accelerated across the region in 2017 as global demand picked up, while imports
grew more strongly
• Intra and inter regional trade increasingo The revival in trade reinforced strong links within Asiao Intra-regional trade increasing from 56% (2010-2016) to 58% (2017)
• Drivers: o Growing final demand: developing economies-GDP will double in 10 yearso PRC: structural upgrading offset by imports of consumer goods and services & regional
infrastructure investmento Strong commitment to regional integration- CPTPP and RCEP
4
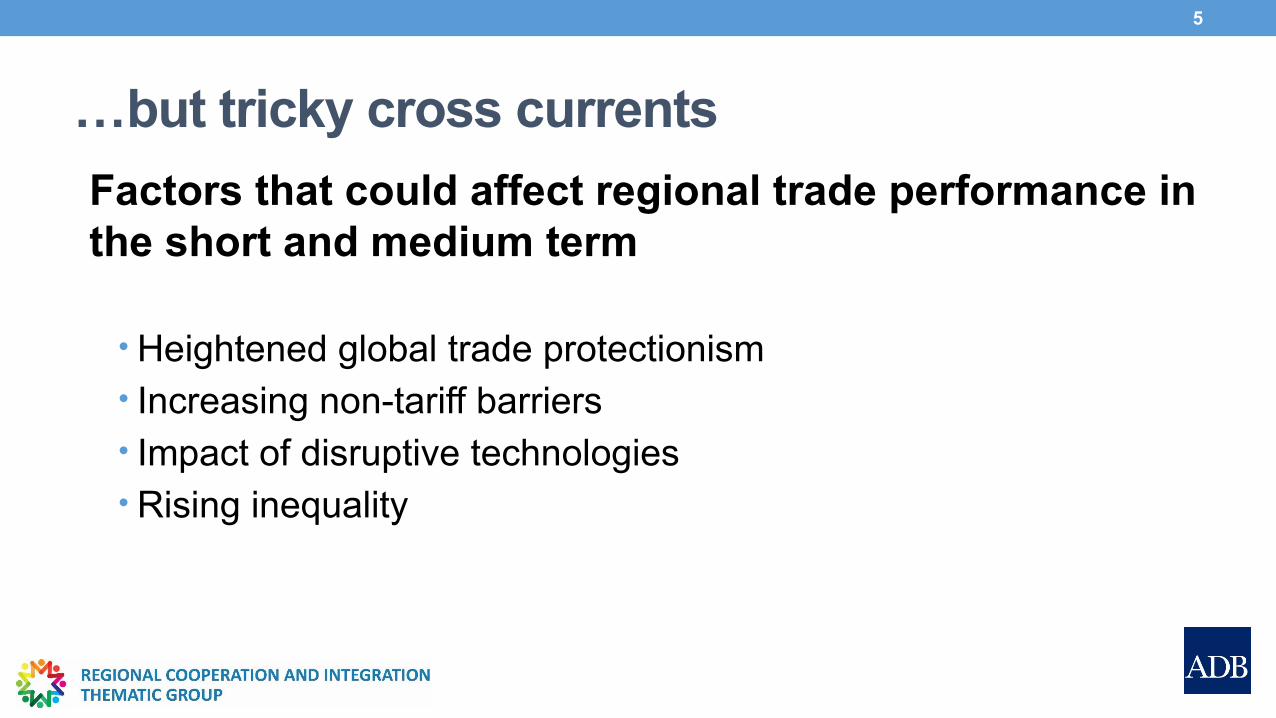
…but tricky cross currents
Factors that could affect regional trade performance in the short and medium term
• Heightened global trade protectionism• Increasing non-tariff barriers • Impact of disruptive technologies• Rising inequality
5
POLICY : MITIGATING THE IMPACTS OF GLOBAL TRADE PROTECTIONISM
6
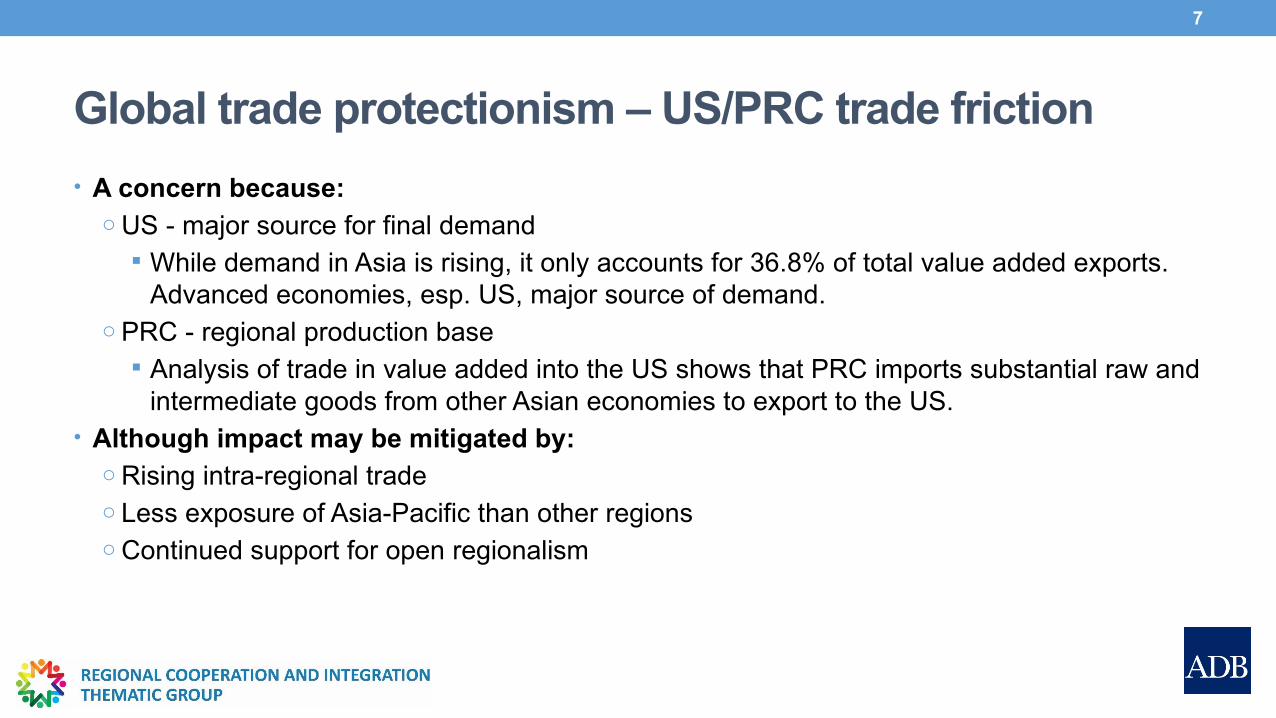
Global trade protectionism – US/PRC trade friction
• A concern because:o US - major source for final demand
While demand in Asia is rising, it only accounts for 36.8% of total value added exports. Advanced economies, esp. US, major source of demand.
o PRC - regional production base Analysis of trade in value added into the US shows that PRC imports substantial raw and
intermediate goods from other Asian economies to export to the US.• Although impact may be mitigated by:
o Rising intra-regional tradeo Less exposure of Asia-Pacific than other regionso Continued support for open regionalism
7
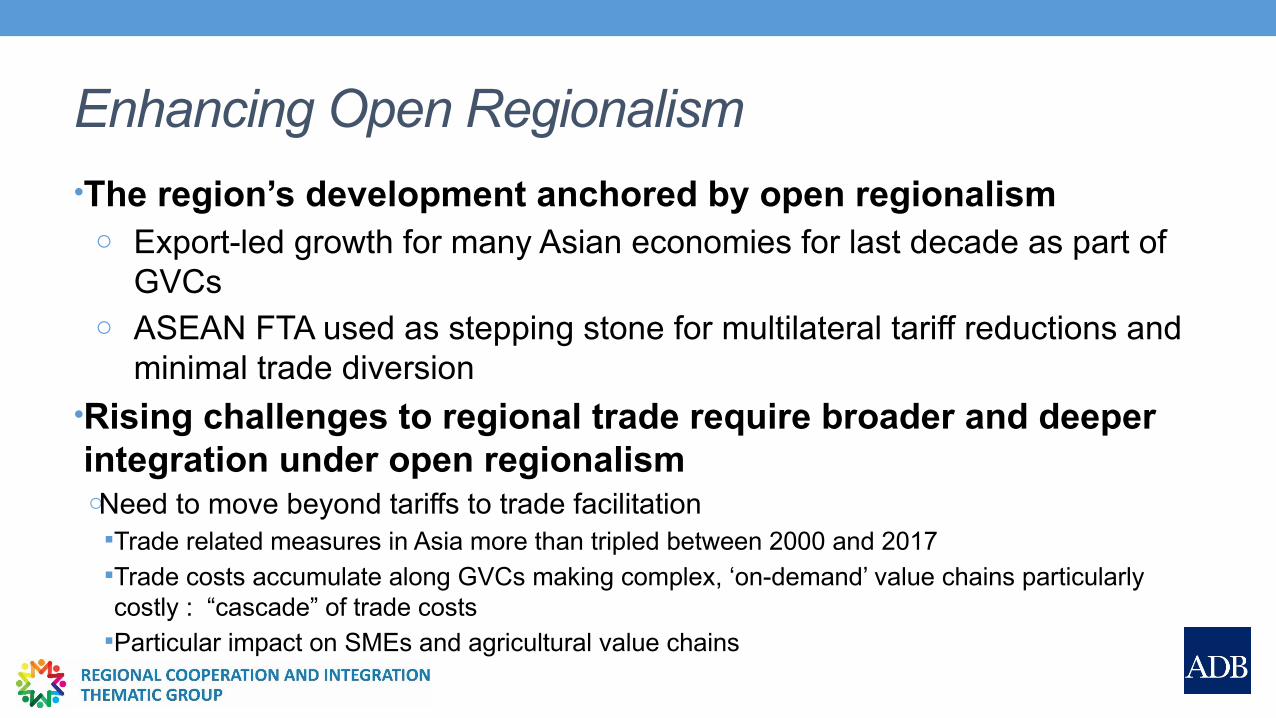
Enhancing Open Regionalism
•The region’s development anchored by open regionalismo Export-led growth for many Asian economies for last decade as part of
GVCso ASEAN FTA used as stepping stone for multilateral tariff reductions and
minimal trade diversion•Rising challenges to regional trade require broader and deeper integration under open regionalismoNeed to move beyond tariffs to trade facilitationTrade related measures in Asia more than tripled between 2000 and 2017Trade costs accumulate along GVCs making complex, ‘on-demand’ value chains particularly costly : “cascade” of trade costsParticular impact on SMEs and agricultural value chains
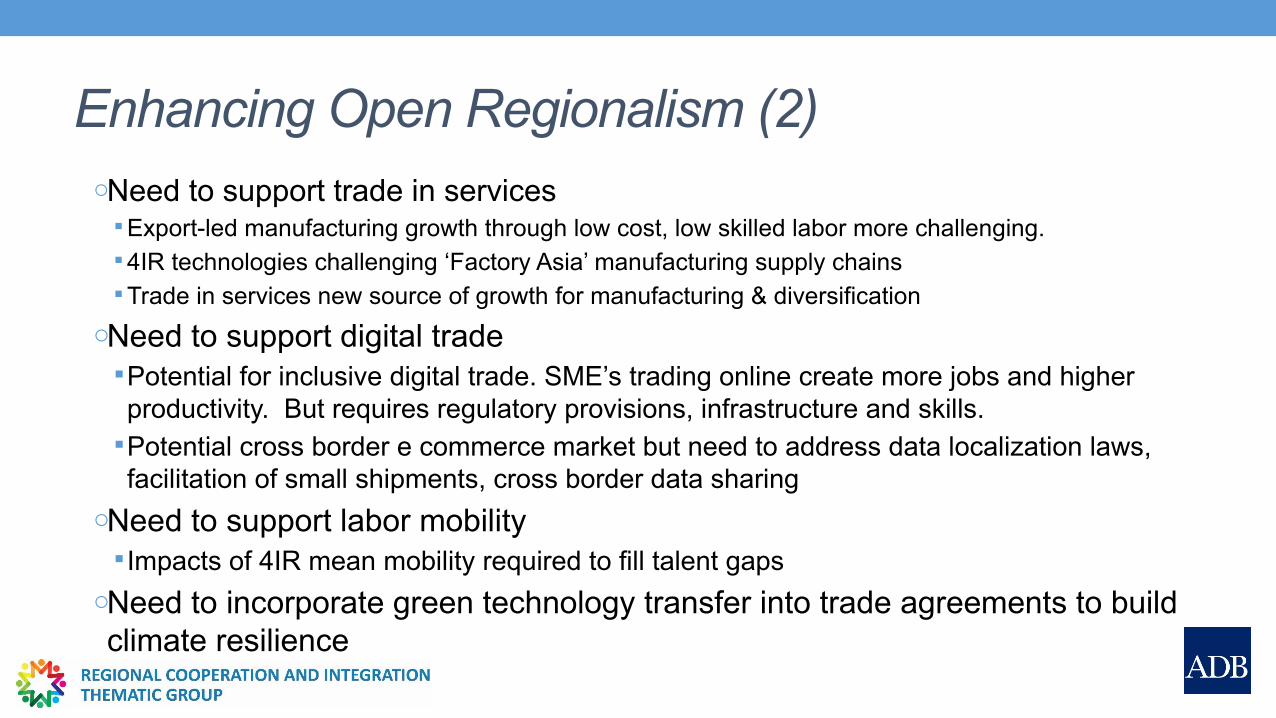
Enhancing Open Regionalism (2)oNeed to support trade in services Export-led manufacturing growth through low cost, low skilled labor more challenging.4IR technologies challenging ‘Factory Asia’ manufacturing supply chainsTrade in services new source of growth for manufacturing & diversification
oNeed to support digital tradePotential for inclusive digital trade. SME’s trading online create more jobs and higher productivity. But requires regulatory provisions, infrastructure and skills.
Potential cross border e commerce market but need to address data localization laws, facilitation of small shipments, cross border data sharing
oNeed to support labor mobility Impacts of 4IR mean mobility required to fill talent gaps
oNeed to incorporate green technology transfer into trade agreements to build climate resilience
COUNTRIES : DEALING WITH NONTARIFF BARRIERS
10
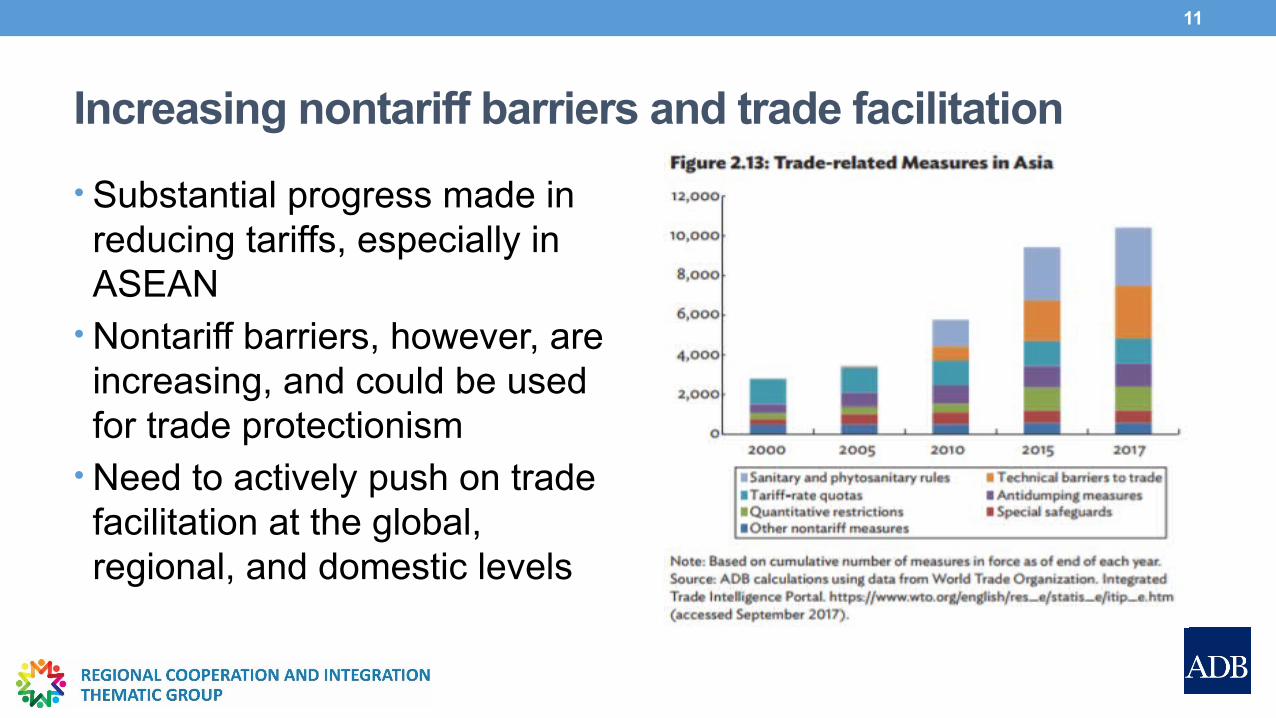
Increasing nontariff barriers and trade facilitation
• Substantial progress made in reducing tariffs, especially in ASEAN
• Nontariff barriers, however, are increasing, and could be used for trade protectionism
• Need to actively push on trade facilitation at the global, regional, and domestic levels
11
Progress of WTO’s Trade Facilitation Agreement • Negotiations on WTO’s Trade Facilitation Agreement (TFA) were concluded in November 2013; agreement was entered into force in February 2017 following its ratification by two-thirds of the WTO membership
• TFA designed to reduce border inefficiencies, and the resulting costs• According to an ADB study, full implementation of the WTO TFA could reduce trade costs in Asia and the Pacific by 9%
• Challenge is to putting the agreement into practice. WTO member countries have focused efforts and resources on being ready to comply with the TFA provisions – with varying degrees of success and challenges
12
Progress of Regional Trade Agreements - CPTPP and RCEP• CPTPPoSigned in March 2018 by 11 membersoTariff cuts on 90% of tariff lines - many to 0%oStandardized, harmonized rules of originoSME friendly; Allows cumulationoTFA+oProvisions on SPS and TBT
• RCEPoASEAN+6 negotiations ongoingoTFA =“floor” (ASEAN commitments on NSW and AEOs?oROOs standardized and harmonizedoSPS and TBT provisions
13
ADB supported subregional programs
• ADB’s subregional programs (GMS, IMT-GT, BIMP-EAGA, CAREC, SASEC, Pacific) – central driver of trade facilitation
• Support implementation of the WTO TFA – open regionalism• Subregional programs increasingly focusing on:o Increasing competitiveness and creation of ‘economic corridors’ to
complement infrastructure connectivityoCollaborating with other regional programs (e.g., the Belt and Road
Initiative).
14
GMS• Grouping: Cambodia, the PRC (Yunnan Province and GZAR), Lao PDR, Myanmar, Thailand, and Viet Nam. Est. 1992
• Status: GMS countries significantly ahead of other RCI programs in TFA ratification (100%).
• Focus: Guided by the GMS Transport and Trade Facilitation Action Program – simplify and modernize customs procedures and border management and strengthen capacity of sanitary and phytosanitary agencies
• ADB: Support for Secretariat, loans and grants, capacity building• Results: Cross-Border Transport Facilitation Agreement, streamlined Single-Stop Customs Inspections. Time to cross borders at Bavet and Moc Bai reduced by half and 3,000 jobs created through Moc Bai border economic zone. In Thailand, implementation of NSW in 2008 brought savings of about $1.5 billion annually and cut the time to export from 17 to 14 days
• Looking forward: Ha Noi Action Plan 2018–2022 - customs modernization, coordinated border management, and risk based approaches to sanitary and phyto-sanitary standards
15
CAREC• Grouping: Afghanistan, Azerbaijan, the PRC, Georgia, Kazakhstan, the
Kyrgyz Republic, Mongolia, Pakistan, Tajikistan, Turkmenistan, and Uzbekistan. Est. 2001
• Status: 73% WTO members, 64% ratified; notifications range from 0% (Pakistan) to 100% (Afghanistan)
• Focus: Guided by the Transport and Trade Facilitation Strategy, focus is on customs cooperation on reforms and modernization and integrated trade facilitation by establishing a regional mechanism.
• ADB: Support for Secretariat, loans and grants (e.g., RIBS project), capacity building
• Results: Average time needed to clear a border crossing along a CAREC transport corridor – by rail and road – was reduced by an hour in in 2015 from 2014. Cross border clearance time by road decline 6.1% in 2015 (ADB)
• Looking forward: Guided by CAREC 2030, supporting WTO-related commitments, with respect to trade facilitation and policy - support for national single windows, improved border crossing points, and customs harmonization.
16
SASEC• Grouping: Bangladesh, Bhutan, India, Maldives, Myanmar, Nepal, and Sri
Lanka. Est. 2001• Status: All countries except Bhutan and Maldives have ratified the WTO
TFA. Trade facilitation in SASEC lagging behind other Asian countries. • Focus: Guided by the Trade Facilitation Strategic Framework 2014-2018,
focus is on customs modernization and assessments focused on SPS measures, improving cross border facilities, transport facilitation and institutional capacity building. Aim Is to elevate the practice and processes of border clearance to international standards and international best practices, including through automation
• ADB: Support for Secretariat, loans and grants (e.g., Bangladesh, Bhutan, and Nepal for customs administration), and capacity building with partners (WTO, Korea Customs Service)
• Results: In Bangladesh, the no. of signatures required for export and import clearance declined significantly from 25 in 1999 to 5 in 2014
• Looking forward; SASEC Operational Plan 2016-2025 extends coverage to multimodal transport (land and sea) focusing on logistics chain; greater focus on achieving competitiveness along economic corridors
17
Pacific• Grouping: Cook Islands, FSM, Fiji, Kiribati, Marshall
Islands, Nauru, Palau, PNG, Samoa, Solomon Islands, Timor-Leste, Tonga, Tuvalu, Vanuatu
• Status: Fiji, Samoa, and PNG ratified the WTO FTA. Trade costs high due to remote & scattered populations but comparable with countries with similar income levels.
• Focus: Guided by ADB’s Pacific Approach 2016-2020, transport connectivity through shipping, aviation, and road transport
• ADB: Loans and grants (undersea telecoms cables) and technical support through assessments of bottlenecks and monitoring systems
• Results: Full implementation of TFA would reduce trade costs 26% Palau, 18% Tonga, 17% Vanuatu and 16% Fiji.
• Looking forward: Greater emphasis on software and systems as cost drivers
18
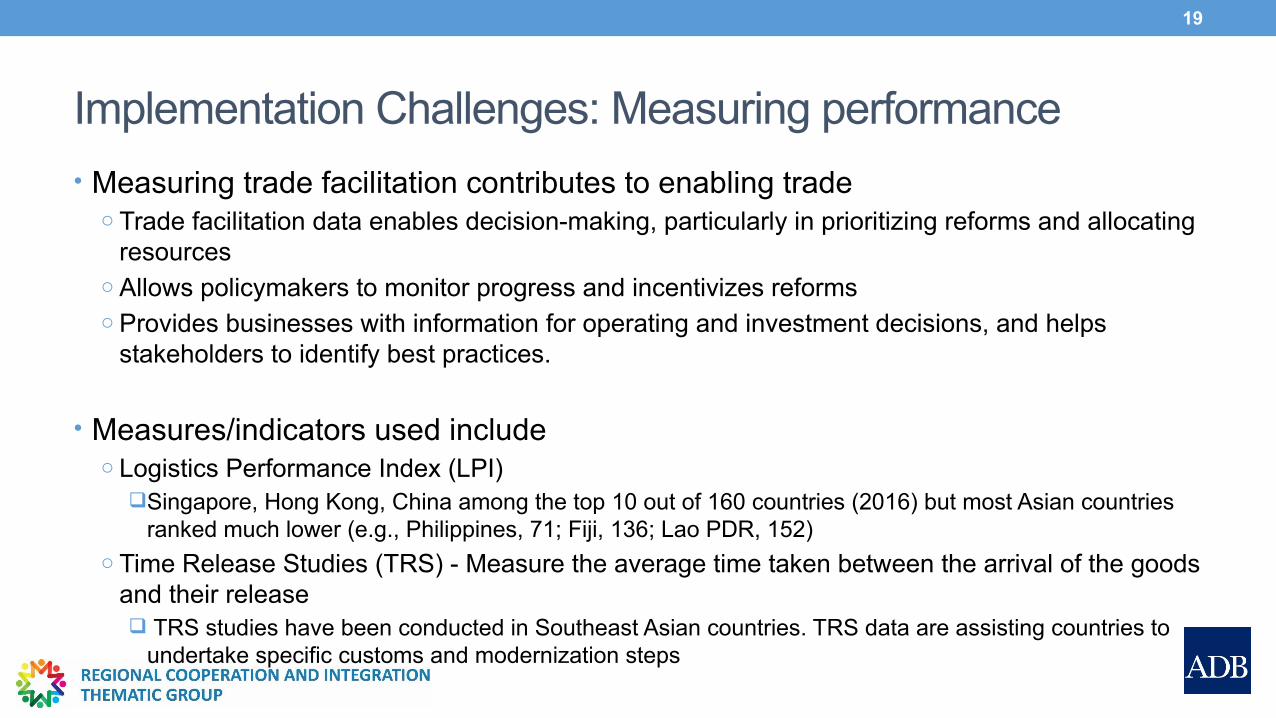
Implementation Challenges: Measuring performance
• Measuring trade facilitation contributes to enabling tradeo Trade facilitation data enables decision-making, particularly in prioritizing reforms and allocating
resources o Allows policymakers to monitor progress and incentivizes reformso Provides businesses with information for operating and investment decisions, and helps
stakeholders to identify best practices.
• Measures/indicators used includeo Logistics Performance Index (LPI)
Singapore, Hong Kong, China among the top 10 out of 160 countries (2016) but most Asian countries ranked much lower (e.g., Philippines, 71; Fiji, 136; Lao PDR, 152)
o Time Release Studies (TRS) - Measure the average time taken between the arrival of the goods and their release TRS studies have been conducted in Southeast Asian countries. TRS data are assisting countries to
undertake specific customs and modernization steps
19
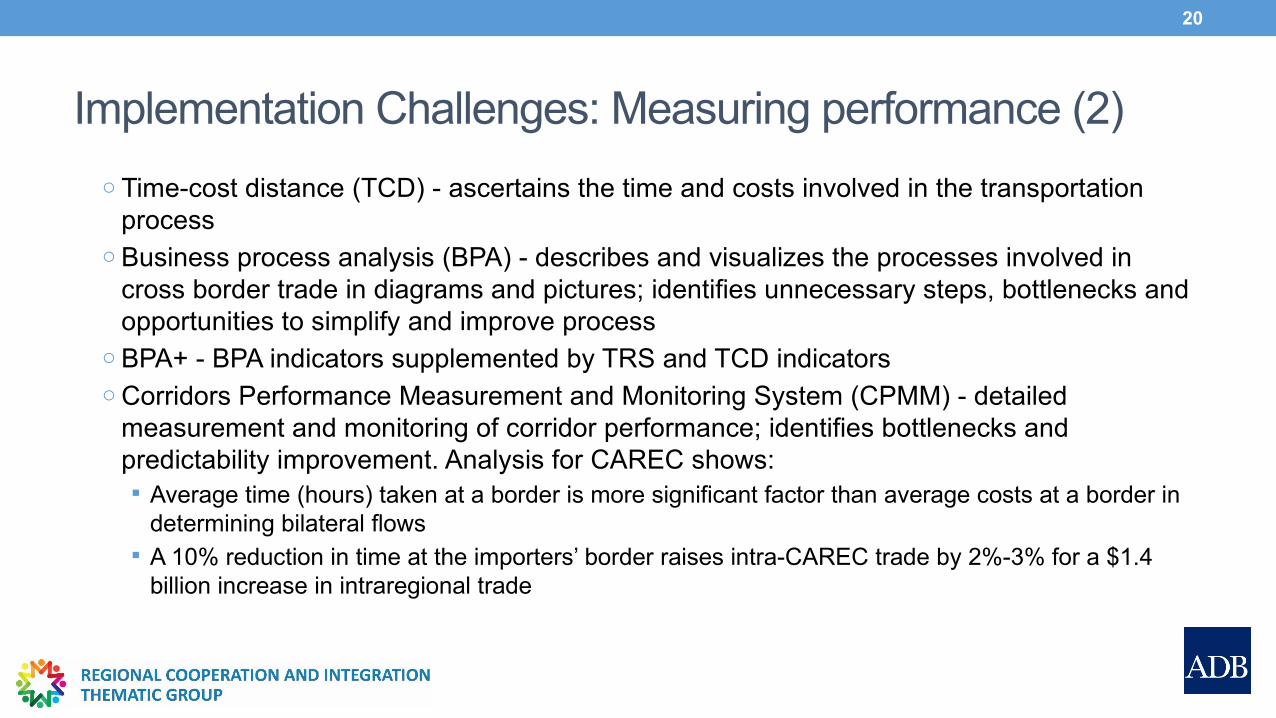
Implementation Challenges: Measuring performance (2)
o Time-cost distance (TCD) - ascertains the time and costs involved in the transportation process
o Business process analysis (BPA) - describes and visualizes the processes involved in cross border trade in diagrams and pictures; identifies unnecessary steps, bottlenecks and opportunities to simplify and improve process
o BPA+ - BPA indicators supplemented by TRS and TCD indicatorso Corridors Performance Measurement and Monitoring System (CPMM) - detailed
measurement and monitoring of corridor performance; identifies bottlenecks and predictability improvement. Analysis for CAREC shows: Average time (hours) taken at a border is more significant factor than average costs at a border in
determining bilateral flows A 10% reduction in time at the importers’ border raises intra-CAREC trade by 2%-3% for a $1.4
billion increase in intraregional trade
20
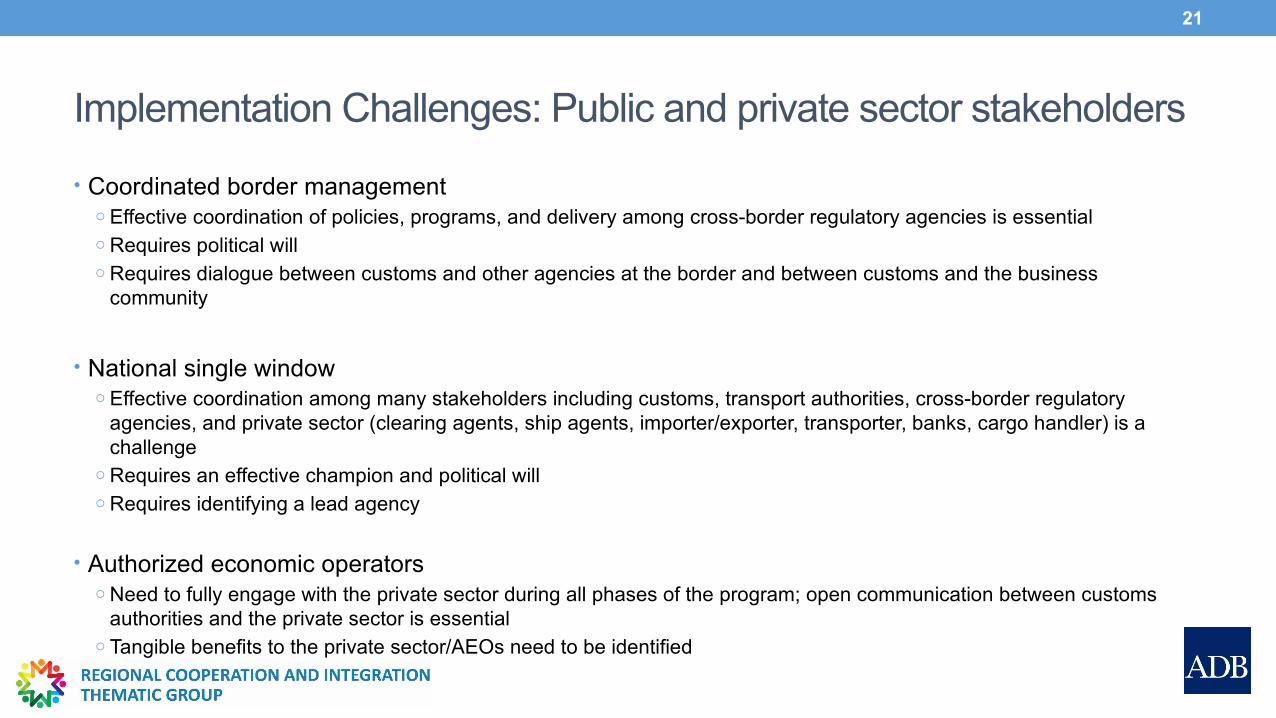
Implementation Challenges: Public and private sector stakeholders
• Coordinated border managemento Effective coordination of policies, programs, and delivery among cross-border regulatory agencies is essentialo Requires political willo Requires dialogue between customs and other agencies at the border and between customs and the business
community
• National single windowo Effective coordination among many stakeholders including customs, transport authorities, cross-border regulatory
agencies, and private sector (clearing agents, ship agents, importer/exporter, transporter, banks, cargo handler) is a challenge
o Requires an effective champion and political willo Requires identifying a lead agency
• Authorized economic operatorso Need to fully engage with the private sector during all phases of the program; open communication between customs
authorities and the private sector is essentialo Tangible benefits to the private sector/AEOs need to be identified
21
MARKET FORCES : HARNESSING OF DISRUPTIVE TECHNOLOGIES
22
Impacts of disruptive technologies • Fourth Industrial Revolution (4IR) - set of highly disruptive technologies such as artificial intelligence, robotics, blockchain and 3D printing
• Technologies of 4IR may affect tradeo Impact on low cost, low skilled “Factory Asia” Decrease the competitiveness of low-cost, low-skilled
labor May lead to reshoring of production back to high labor
cost countrieso Opportunities for increased access and productivity
23
Harnessing of disruptive technologies• Regional cooperation can help harness disruptive technologies - ASEAN case Encourage data to flow without friction and without barriers between
nations with due regard for privacy and security Improve ICT access and improve logistics and technology enabled
digital payment for cross-border e-commerce Work collaboratively on crafting rules and regulations on how data flow
across borders and under what conditions Set and harmonize regional standards and safety regulations and how
these are enforced Identify skills gaps and reduce barriers to labor mobility to provide
access to pools of human capital with new skills
24

BUSINESSES : ADDRESSING RISING INEQUALITIES THROUGH INCLUSIVE
TRADE AND INVESTMENT
25
Sources of rising inequality• Distribution of income and its evolution affected by geographical distribution of economic activities
• Driver of inequality in the spatial dimension – interaction between new opportunities through trade, technology, and market-oriented reform, interacting with geography and infrastructureoUrbanization may lead to rising inequality - widening wage premium for skills, more superior infrastructure, market access, and scale economies
oCoastal areas where international trade is concentrated fare better compared with interior regions
26
Addressing rising inequality
To address rising inequality, ADB supports• private sector-led agribusiness regional value chains• SMEs to engage in regional trade through trade finance• SMEs to engage in regional investment through targeted business accelerators
• linking lagging rural border areas to regional value chains and potential markets
• harnessing the power of technology.
27
28Key Achievements in 2017
Dalat, VIE130 ha
Kunming, PRC57 ha
Toba, INO7.5 ha
Japan market
PRC market
Transferof
technologyand know-
how
Exports ofhigh-value cut flowers
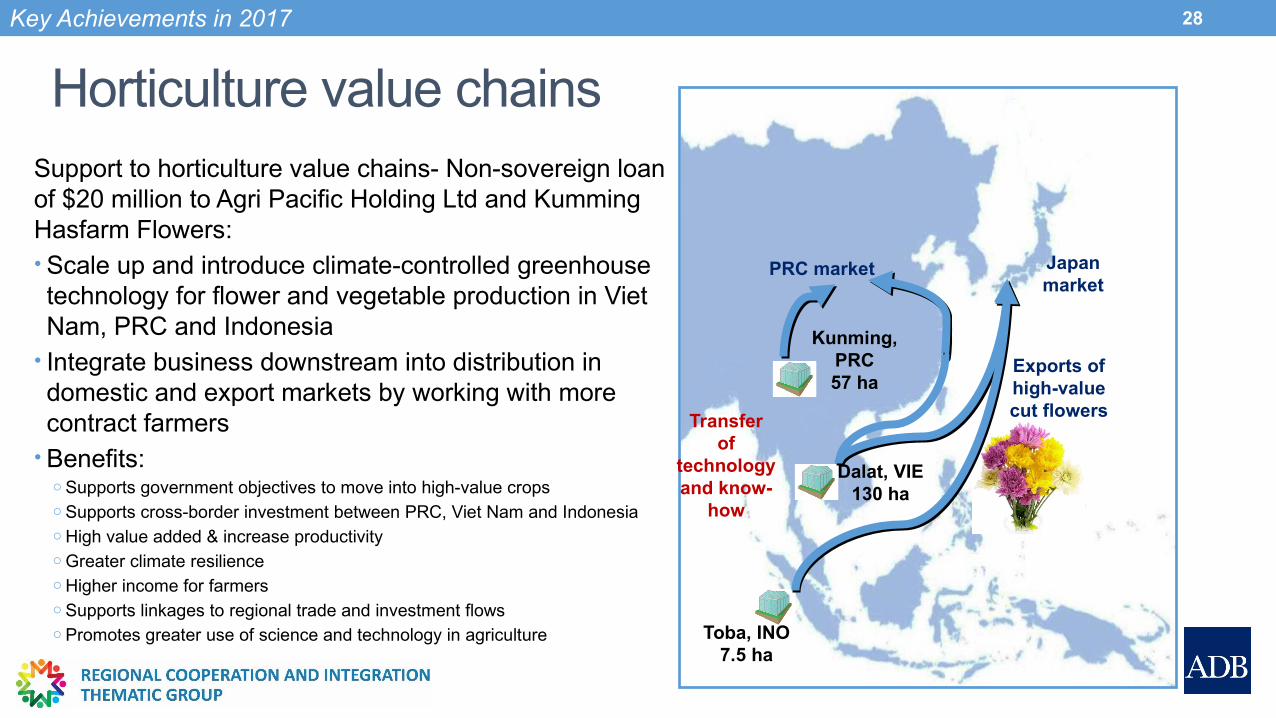
Horticulture value chainsSupport to horticulture value chains- Non-sovereign loan of $20 million to Agri Pacific Holding Ltd and Kumming Hasfarm Flowers:• Scale up and introduce climate-controlled greenhouse technology for flower and vegetable production in Viet Nam, PRC and Indonesia
• Integrate business downstream into distribution in domestic and export markets by working with more contract farmers
• Benefits:o Supports government objectives to move into high-value cropso Supports cross-border investment between PRC, Viet Nam and Indonesiao High value added & increase productivityo Greater climate resilienceo Higher income for farmerso Supports linkages to regional trade and investment flowso Promotes greater use of science and technology in agriculture
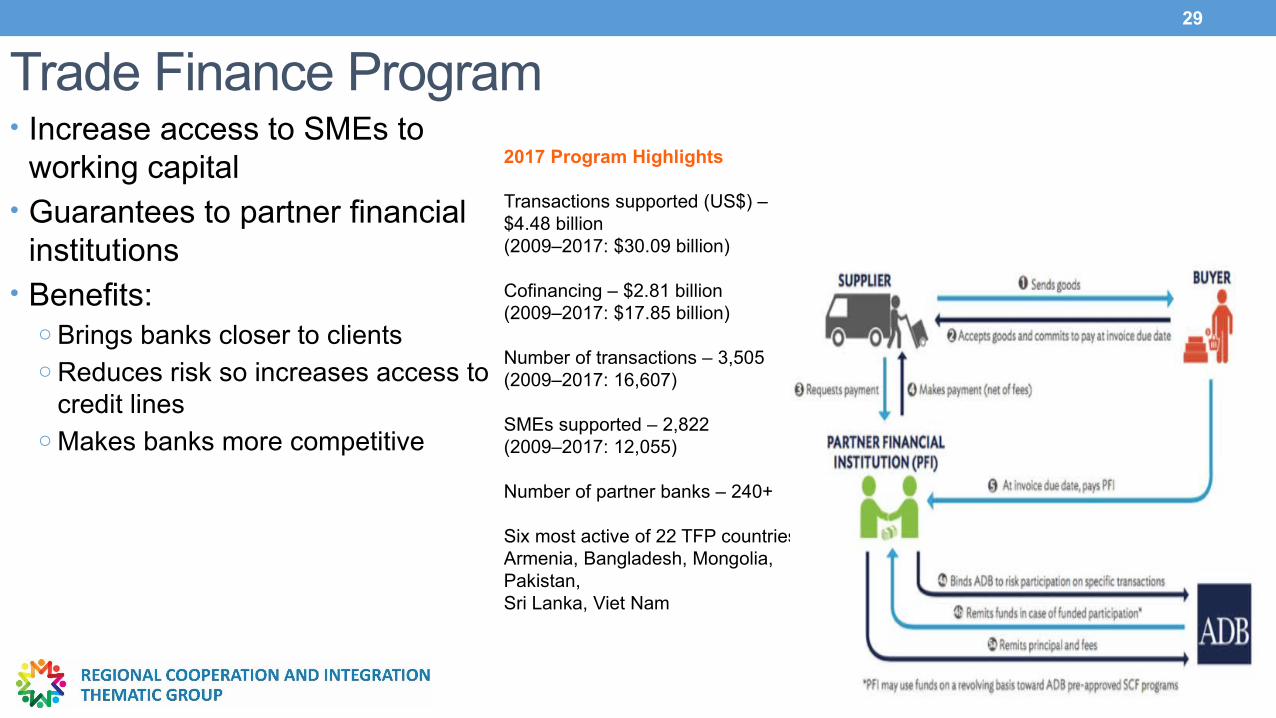
Trade Finance Program• Increase access to SMEs to
working capital• Guarantees to partner financial
institutions• Benefits:
o Brings banks closer to clientso Reduces risk so increases access to
credit lineso Makes banks more competitive
29
2017 Program Highlights
Transactions supported (US$) – $4.48 billion (2009–2017: $30.09 billion)
Cofinancing – $2.81 billion(2009–2017: $17.85 billion)
Number of transactions – 3,505(2009–2017: 16,607)
SMEs supported – 2,822(2009–2017: 12,055)
Number of partner banks – 240+
Six most active of 22 TFP countriesArmenia, Bangladesh, Mongolia, Pakistan,Sri Lanka, Viet Nam
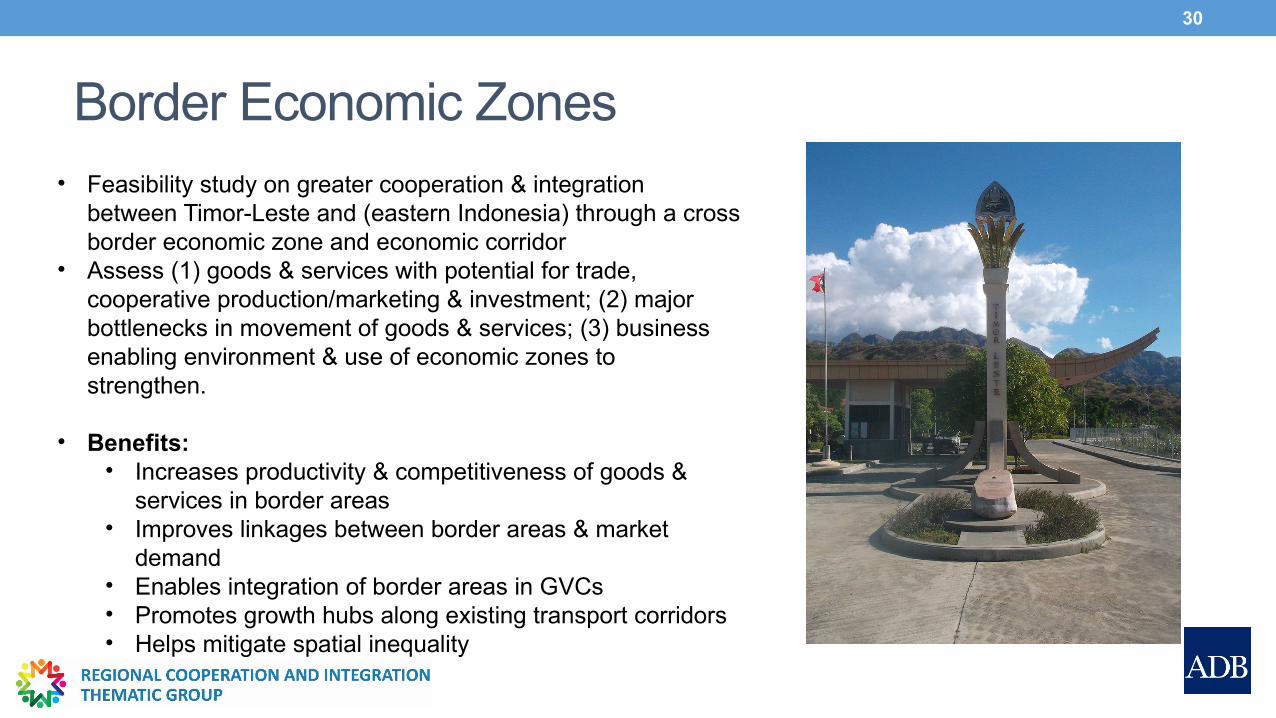
Border Economic Zones
30
• Feasibility study on greater cooperation & integration between Timor-Leste and (eastern Indonesia) through a cross border economic zone and economic corridor
• Assess (1) goods & services with potential for trade, cooperative production/marketing & investment; (2) major bottlenecks in movement of goods & services; (3) business enabling environment & use of economic zones to strengthen.
• Benefits:• Increases productivity & competitiveness of goods &
services in border areas• Improves linkages between border areas & market
demand• Enables integration of border areas in GVCs• Promotes growth hubs along existing transport corridors• Helps mitigate spatial inequality
Dynamic SMEs Foreign Direct Investment• Study on opportunities and challenges for Foreign Direct Investment by
‘dynamic’ SMEs between India and the Mekong.• Will consider:
o The lessons learnt from ‘dynamic’ SMEs (those that invest overseas already) on opportunities for investment between India, Cambodia, Thailand and Viet Nam
o The major challenges enterprises face to cross-border investment at the firm level and the broader business enabling environment.
• Benefits:o FDI- outward and inward, key for integration into GVCso Greater engagement in GVCs raises productivity and increases wageso Helps greater income distributiono ‘Dynamic SME’s key for GVC integration of middle and small enterprises (‘cluster leaders’),
Identify key initiatives for government & private sector to help SMEs enter
31
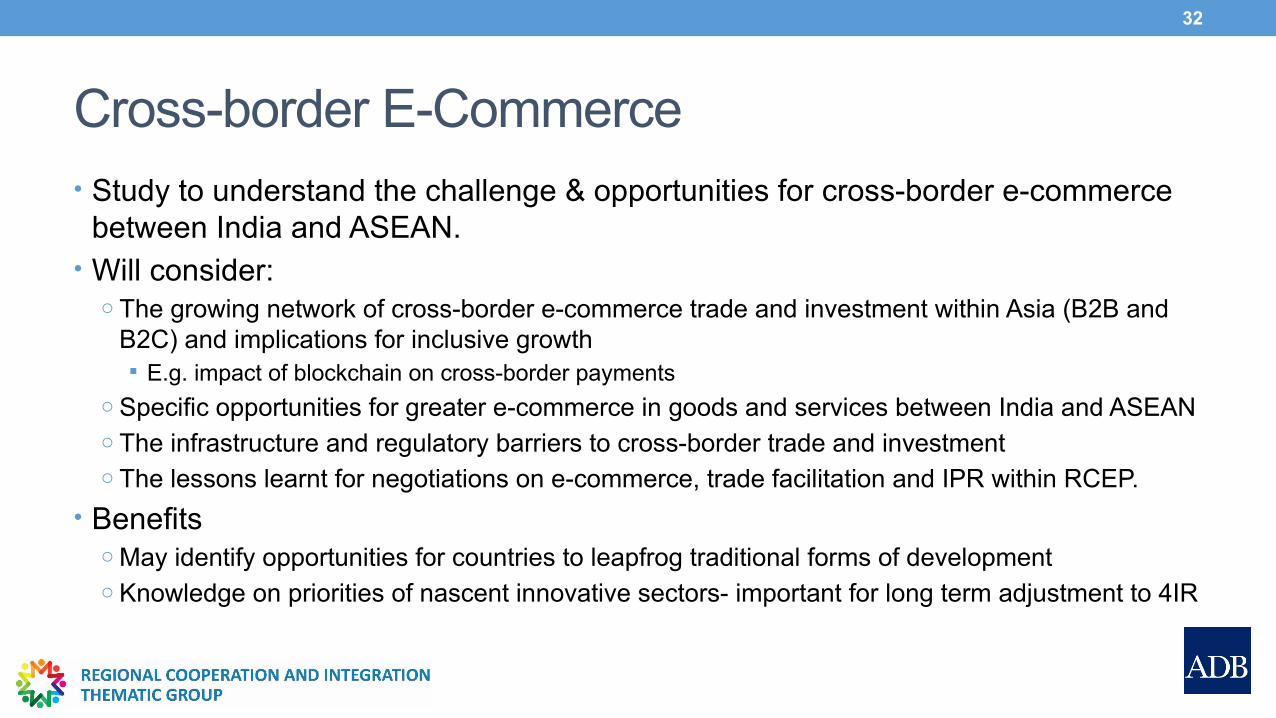
Cross-border E-Commerce• Study to understand the challenge & opportunities for cross-border e-commerce
between India and ASEAN. • Will consider:
o The growing network of cross-border e-commerce trade and investment within Asia (B2B and B2C) and implications for inclusive growth E.g. impact of blockchain on cross-border payments
o Specific opportunities for greater e-commerce in goods and services between India and ASEANo The infrastructure and regulatory barriers to cross-border trade and investmento The lessons learnt for negotiations on e-commerce, trade facilitation and IPR within RCEP.
• Benefitso May identify opportunities for countries to leapfrog traditional forms of developmento Knowledge on priorities of nascent innovative sectors- important for long term adjustment to 4IR
32
CONCLUSION : THE NEW FACE OF INTERNATIONAL TRADE
33
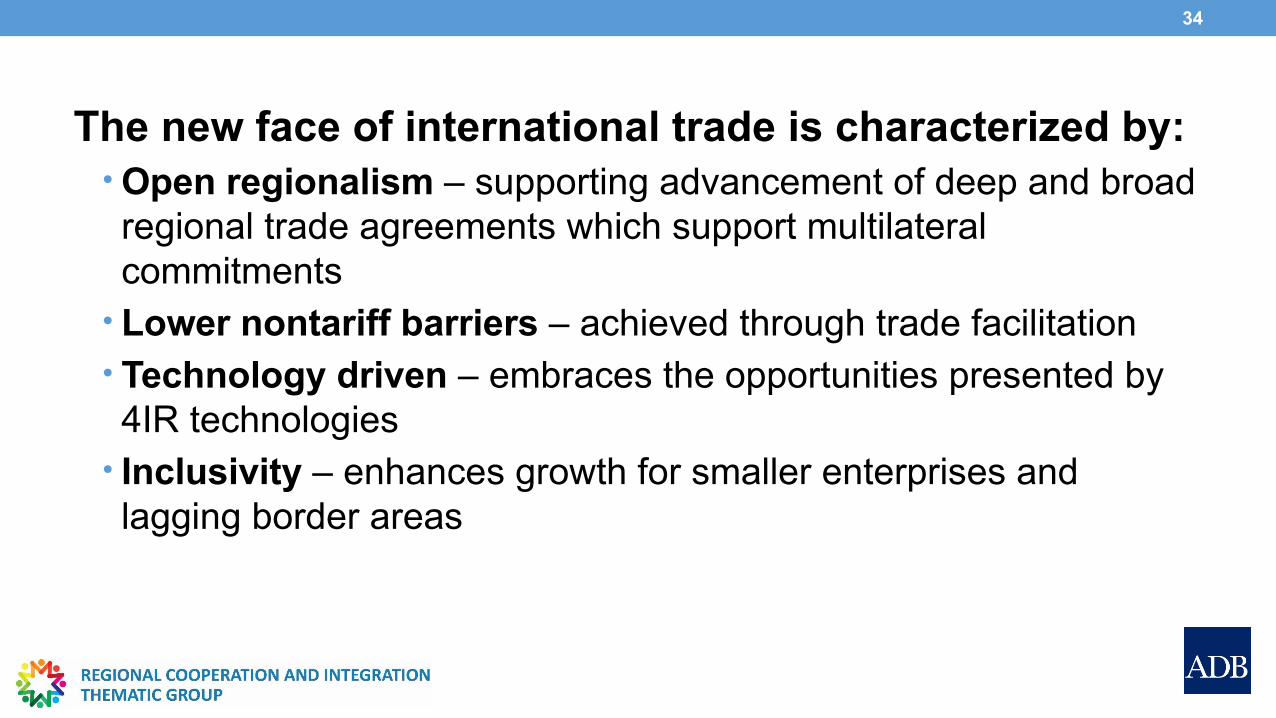
The new face of international trade is characterized by:• Open regionalism – supporting advancement of deep and broad regional trade agreements which support multilateral commitments
• Lower nontariff barriers – achieved through trade facilitation• Technology driven – embraces the opportunities presented by 4IR technologies
• Inclusivity – enhances growth for smaller enterprises and lagging border areas
34

THANK YOU!
35