Embed Size (px)
Citation preview

The Neural Correlates of Culture, Sociality, and Attention to Context
by
Matthew Joseph Russell
A thesis submitted in partial fulfillment of the requirements for the degree of
Doctor of Philosophy
Department of Psychology
University of Alberta
© Matthew Joseph Russell, 2016

ii
Abstract
Recent cultural psychological theory proposes that social orientation differences lead to general
differences in attention. Whereas independent cultures (i.e., European Canadians) are thought to
see the self as separate from its context, or more generally, process the world analytically and
separate objects from their context, interdependent cultures (i.e., Japanese) are thought to see the
self as dependent on its surrounding context, or more broadly, have a holistic view of the world
and embed objects in their context. Further examining the relationship between culture and
attention, I investigated the neural correlates of attention with event related potentials (ERPs) for
non-social and social tasks, comparing European Canadian and Japanese participants. I begin
this thesis by conceptualizing culture and important cultural frameworks related to current social
orientation theory (Chapter 1). I then introduce my research investigating the neural correlates of
culture and attention for non-social memory (Chapter 2). Using analytic attention instructions, I
asked participants to judge, and later, remember, target animals that were paired with task-
irrelevant original (congruent) or novel (incongruent) contexts. I investigated: 1) whether the
N400 ERP wave would show an incongruity effect for both cultures, due to retrieved contexts
conflicting with later-shown novel contexts, and 2) whether the incongruity effect would more
strongly predict performance for Japanese, i.e., reflecting more difficulty ignoring contexts in
Japanese. Results showed that both groups exhibited N400 incongruity effects, with Japanese
showing more typical N400 topographies. However, incongruent-trial accuracy was only related
to a reduction of N400s in Japanese.
In Chapter 3, I then investigated the neural correlates of culture and social attention. As a basis
for this research, previous behavioral and eye-tracking findings had shown that interdependent
cultures tend to be more influenced than independent cultures by background social information.

iii
To investigate early attention patterns, I collected ERPs during a task where participants were
asked to rate the emotions of central persons within five person emotion lineups. Lineups were
either congruent, with all faces showing similar emotions, or incongruent, with central face
emotions differing from background face emotions. The behavioral results replicated previous
findings, showing that Japanese participants’ ratings were more influenced by background
information than European Canadians’. The ERP data also revealed an influence from social
incongruence for Japanese, showing increased processing for incongruent lineups (than
congruent lineups) in early (the N400) and later (the LPC) semantic ERPs. Such ERP
incongruity effects were not seen for European Canadians. Individuals’ independence social
orientation beliefs also related to these incongruity effects: Independence social orientation
beliefs moderated the two cultures’ early processing patterns. A negative relationship emerged
between independence and European Canadians’ N400 incongruity effects, which was not
observed in Japanese. Furthermore, Independence social orientation beliefs were negatively
related with both groups’ later LPC-based incongruity effects. In addition, while European
Canadians did not show N400 or LPC incongruity effects, they still showed evidence of noticing
social incongruence through N2 incongruity effects. Together these findings give evidence that
social orientation differences also affect early social attention neural patterns.
Next in Chapter 4, I investigated how culture and relationship context affect social attention. For
this investigation, I collected ERP data during a task where face emotion lineups were deemed to
be in close or acquaintance relationships. For neural patterns, I replicated Chapter 3’s findings
for acquaintances, with only Japanese showing N400 incongruity effects. Contrasting with these
patterns, only European Canadians showed N400 incongruity effects for close relationships. I
also replicated Chapter 3’s findings for N2 incongruity effects; European Canadians noticed

iv
incongruent social context, evidenced by N2 incongruity effects, regardless if they had N400s or
not. In contrast, I found that Japanese had both N2s and N400s or neither. Regarding
relationships with cultural beliefs, social orientation beliefs only significantly correlated with N2
incongruity effects for acquaintances. Together these findings suggest that social orientation
differences that have been related to attention may be stronger tied to acquaintance relationships.
To close, in Chapter 5, I discuss the results of my three studies and implications for our
understanding of culture, attention, and social orientation, and discuss neuroscience’s place in
cultural psychology.
v
Preface
This thesis is an original work by Matthew Joseph Russell. All research projects, of which this
thesis is a part, received research ethics approval from the University of Alberta Research Ethics
Board. Chapter 2’s research was approved under Project Name “Measuring Neural Activation
during a Visual Task: An EEG study”, No. Pro00010505, 11/3/2011, and Chapter 3 and 4’s
research was approved under Project Name “Face Lineup Processing”, No. Pro00039243,
5/19/2016.
Chapter 2 of this thesis forms part of an international research collaboration, led by Dr.
Takahiko Masuda at the University of Alberta, with Ms. Yvonne Chen as a doctoral candidate
collaborator at the University of Alberta, Mr. Hioki Koichi as a collaborator from Kobe
University, and Dr. Jeremy Caplan as a collaborator at the University of Alberta. Chapter 3 and 4
were also collaborative works, with support from Dr. Takahiko Masuda and Dr. Anthony Singhal
at the University of Alberta, and international collaborator Mr. Hioki Koichi at Kobe University.
Chapter 2 of this thesis has been published as Masuda, T., Russell, M. J., Chen, Y.Y., Hioki, K.,
& Caplan, J. B. (2014). N400 incongruity effect in an episodic memory task reveals different
strategies for handling irrelevant contextual information for Japanese than European Canadians.
Cognitive Neuroscience, 5, 17-25. In this project, I was responsible for data collection, data
preprocessing and analyses, data interpretation, and composition and editing of the manuscript.
As collaborators, Dr. Masuda worked on concept formation, data collection, and manuscript
composition, Ms. Chen contributed to data analysis and manuscript composition, Mr. Hioki was
involved in the programming of the paradigm and data collection, and Dr. Caplan provided EEG
devices, helped with concept formation, and helped with manuscript composition.

vi
In addition, Chapter 3 of this thesis has been published as Russell, M. J., Masuda, T., Hioki, K.,
& Singhal, A. (2015). Culture and social judgments: The importance of culture in Japanese and
European Canadians’ N400 and LPC processing of face lineup emotion judgments. Culture and
Brain, 3, 131-147. As I was the main contributor, I was lead in all aspects of this project. As
collaborators, Dr. Masuda helped with concept formation, provided devices, and helped with
manuscript composition, Mr. Hioki provided devices in Japan and helped with manuscript
composition, and Dr. Singhal helped with the ERP methods, data interpretation, and manuscript
composition.
Finally, while Chapter 4 has not been published yet, it was also a collaborative project; however,
my role and collaborators’ roles were similar to that of Chapter 3.

vii
Acknowledgments
I offer thanks to all the people that supported me as I plugged away at this research during these
last five years. In particular, special thanks to my wonderful research assistants (Hannah Hu,
Shez Kassam, Camille del Rosario, & Kristen Zentner), supportive lab members (Liman Man
Wai Li, Hajin Lee, & Sawa Senzaki), supportive supervisor Dr. Takahiko Masuda, thought-
provoking committee members Dr. Esther Fujiwara and Dr. Anthony Singhal, uber-collaborators
in Japan, Dr. Hioki Koichi and Dr. Keiko Ishii, members of the culture and cognition laboratory
that helped with design and piloting, soccer buddies that helped me kick away stress, girlfriend
Karen whom supported me as I struggled through my writing, family back in ‘merica that
supported me through my many years away from home, and last but not least, my family away
from home, the Edmonton Kendo and Naginata Club, which provided a quasi-semi-sorta
‘religious’ sanctuary from it all—to the tune of a-‘Men!’ ;)
viii
TABLE OF CONTENTS
Abstract……………………………………………………………………..... ii
Preface………………………………………………………………………... v
Acknowledgements………………………………………………………..…. vii
Table of Contents…………………………………………………………...... viii
List of Tables………………………………………………………………..... xiii
List of Figures……………………………………………………………....... xiv
Chapter 1: Introduction…………………………………………………..….. 1
1.1 A Multi-Level Approach to Culture…………………………....... 1
1.1.1 The Socioecological Level of Culture..………………. .. 2
1.1.2 The Meaning System Level of Culture………………... 3
1.1.3 The Individual Level of Culture…………………...…... 4
1.1.4 Social Orientation Theory ………………….……...…... 5
1.2 Using ERP Methods to Study Culture ……………………….…. 6
1.2.1 The N400………………………………………….….... 7
1.2.2 The LPC………………………………………….…...... 7
1.2.3 The N2………………………………………….….…... 7
1.3 Framing my Thesis…………………………..………………….... 8
Chapter 2: Culture, Non-Social Memory, and the Brain……………….......... 8
2.1 Introduction…………………………………………………..….. 8
2.1.1 Culture and Attention Neuroscience……………….….. 10
2.1.2 Hypotheses……………………………………….…….. 12
2.2 Methods…………………………………………………….……. 13

ix
2.2.1 Participants……………………………………….…….... 13
2.2.2 Materials……………………………………….….……... 13
2.2.3 Procedure………………………………………………... 14
2.2.4 The Study Phase………………………..………….……. 14
2.2.5 The Distractor phase…………………...………….…….. 14
2.2.6 The Test Phase……………………….……………….… 15
2.2.7 Electroencephalography (EEG) Recording and Analyses 15
2.3 Results………………………………………….…………….…….. 17
2.3.1 Behavior………………………………………...….…….. 17
2.3.2 Mean N400s………………………………………..…….. 18
2.3.3 Accuracy–N400 relationship……………………….……. 21
2.4 Discussion………………………………………………………….. 22
2.4.1 Summary…………………………………..……….…….. 22
2.4.2 Future Directions……………………….………….….…. 24
2.4.3 Non-Social Memory and Social Orientation…………….. 25
Chapter 3: Culture, Face-lineup Tasks, and the Brain……………………….… 26
3.1 Introduction……………………………………………….….……. 26
3.1.1 Social Tasks and Attention……………………….……... 26
3.1.2 Non-Social and Social Tasks and the N400……….…….. 27
3.1.3 The Late Positive Complex (LPC) ……………………… 28
3.1.4 The N2………………………………………..…….……. 28
3.1.5 Hypotheses………………………………………….……. 29
3.2 Methods……………………………………………………….……. 30

x
3.2.1 Participants……………………………….………….……. 30
3.2.2 Face Lineup Stimuli………………………………....……. 30
3.2.3 Procedure………………………………...………….……. 31
3.2.4 Trial Timing………………………………………...…….. 33
3.2.5 Electroencephalography (EEG) Recording, Preprocessing,
and Analyses……………………………………..……... 33
3.2.6 Cultural Beliefs: Independent and Interdependent
Social Orientation…………………..…………….……... 34
3.3 Results………………………………………………..……….…….. 35
3.3.1 Behavioral Data: Emotion Ratings…………………….…. 35
3.3.2 ERP/N400 Analyses……………………...………….……. 36
3.3.3 ERP/LPC Analyses……………………….………….……. 37
3.3.4 ERP/N2 Analyses…………………………………….……. 41
3.3.5 Cultural Beliefs and Incongruity Effects………………….. 42
3.4 Discussion…………………………………………..………….……. 45
3.4.1 Summary and Implications……………………….….……. 45
3.4.2 Limitations and Future Research……………………….…. 46
3.4.3 Face Lineup Tasks and Social Orientation………………... 48
Chapter 4: Culture, Relational Tasks, and the Brain...………………………….. 49
4.1 Introduction…………………………………………………….…… 49
4.1.1 Culture and Close Others…………………………….……. 50
4.1.2 Culture and Acquaintances………………………..….…… 51
4.1.3 Relational Judgments and the N400………………………. 52

xi
4.1.4 The N2………………………………………………..…... 52
4.1.5 Hypotheses………………………………...……….…….. 53
4.2 Methods……………………………………………………….……. 54
4.2.1 Participants……………………………….………….……. 54
4.2.2 Face Lineup Stimuli…………………...…………….……. 55
4.2.3 Procedure…………………………………………….……. 56
4.2.4 Trial Timing………………………….……………….…… 57
4.2.5 Electroencephalography (EEG) Recording, Preprocessing,
and Analyses………………………….…………….…… 58
4.2.6 Cultural Beliefs: Independent and Interdependent
Social Orientation………………………………….……. 59
4.3 Results………………………………………………………….……. 60
4.3.1 Behavioral Data: Emotion Ratings………………………... 60
4.3.2 ERP/N400 Analyses………………………………….…… 61
4.3.3 ERP/N2 Analyses…………………………………….….... 63
4.3.4 Cultural Beliefs and Incongruity Effects…………………. 70
4.4 Discussion…………………………………………………………… 73
4.4.1 Summary and Implications……………………….….…… 73
4.4.2 Limitations and Future Research……………………….… 76
4.4.3 Relational Tasks and Social Orientation………………….. 77
Chapter 5: General Discussion………………….…………………………..….. 78
5.1 Overall Summary……………………….………………………….. 78
5.2 Rethinking Social Orientation Theory……………………….……... 80

xii
5.2.1 The Importance of Acquaintances in Social Orientation
Theory……………………………………………….….. 81
5.3 A Place for Cultural Neuroscience……………………………..…... 84
5.4 Conclusion...……………………………..………………............… 86
Footnotes……………………………………….……………………………… 87
References……………………………………….…………………………….. 89
Appendix A: Social Orientation Scale Items...………………………............... 98
Appendix B: Relationship Descriptions...…………..…………………………. 100

xiii
LIST OF TABLES
Table Page
1. Means (standard error) for accuracy and response times (top) and N400 voltages in the
300–500 ms time window (bottom), as a function of culture and condition......... 20
2. Means (standard deviations) for ratings (top), N400 difference waves (bottom-left),
LPC difference waves (bottom-center), and N2 difference waves (bottom right), as a
function of culture and condition.…………………..………………….……… 41
3. Means (standard deviations) for the rating incongruity effect (larger = stronger), the
N400 incongruity effect (larger = stronger), and the N2 incongruity effect (larger =
stronger), as a function of culture and condition……..……………………….. 70
4. Correlations between independence beliefs, interdependence beliefs, and social
orientation scores, and the N400 and N2 incongruity effects collapsed across cultures, for
the close and acquaintance conditions…………………………………………. 73

xiv
LIST OF FIGURES
Figure Page
1. Example study phase image and respective test phase images for (a) an example studied
image, with target analysis recognition (b) congruent and (c) incongruent condition
images, and untargeted (d) novel animal on studied background and (e) novel animal on
novel background images.………………………………………........................ 16
2. Time diagram for the experiment showing the three consecutive phases: The study,
distractor, and the test phase……………….…..……………………..………… 17
3. 1) Congruent and incongruent condition grand-averaged ERP waveforms for Japanese
(left) and European Canadians (right), at electrode Cz. Probe stimulus onset was at t=0
ms, and the 200-ms pre-stimulus baseline is also shown. 2) Topographic spline maps
showing the difference between congruent and incongruent conditions (congruent minus
incongruent). For Japanese participants, this topography is quite consistent with previous
N400 findings (Kutas and Federmeier, 2011). For European Canadians, the posterior
portion of the pattern (typical of N400 findings) appears weaker, and there may be an
additional source, perhaps related to the recognition-memory FN400 (Rugg & Curran,
2007).................................................................................................................... 19
4. Simple slopes using accuracy to predict mean N400 voltage (labelled as mean voltage,
with more negative voltages reflecting stronger N400 processing) for the incongruent
condition, for Japanese and European Canadians. ………………………......... 22

xv
Figure Page
5. Trial timing diagram for the face emotion rating task. Backgrounds were black in actual
trials. b. (bottom) Example face emotion rating task stimuli, for the congruent (happy
(center) – happy (background) and sad – sad) and the incongruent conditions (happy –
sad, and sad – happy)..……………………………………………………..……. 32
6. Congruent and incongruent condition grand averaged ERP waveforms for European
Canadians (top 9 electrodes) and Japanese (bottom 9 electrodes) for electrodes F3, Fz, F4,
C3, Cz, C4, P3, Pz, & P4. Probe stimulus onset was at t=0 ms, and the 200-ms pre-
stimulus baseline is also shown……………………………………………........ 38
7. Expanded congruent and incongruent condition grand averaged ERP waveforms for
European Canadians (top; blue) and Japanese (bottom; red) at electrodes Cz and P4. Time
windows for ERP analyses are set on white backgrounds (Cz: 350-500 ms for N400
analyses; P4: 500-700 ms for LPC analyses). Probe stimulus onset was at t=0 ms, and the
200-ms pre-stimulus baseline is also shown……………………………………. 39
8. Difference waves (congruent condition minus the incongruent condition) for European
Canadians and Japanese at electrodes Cz, P4, and the averaged frontal (F3, Fz, and F4)
and parietal N2 electrodes (P3, Pz, and P4; parietal electrodes were multiplied by -1).
Time windows for ERP analyses are set on white backgrounds (Cz: 350-500 ms for N400
analyses; P4: 500-700 ms for LPC analyses; Average N2: 225-300 ms for N2 analyses).
Probe stimulus onset was at t=0 ms, and the 200-ms pre-stimulus baseline is also
shown…………………………………………………….……………………... 40

xvi
Figure Page
9. Simple slopes using independence social orientation beliefs to predict N400 difference
waves over the 350 to 500 ms time window at Cz (positive values reflect N400
incongruity effects), for European Canadians and Japanese. …...…………….. 45
10. Example relational task stimuli (top) for the congruent (happy (center) – happy
(background) and sad – sad) and the incongruent conditions (happy – sad, and sad –
happy), and for the (bottom) filler neutral lineups (neutral – neutral, neutral – sad, and
neutral – happy)…………………………………………………………...…… 57
11. Trial timing diagram (for 1 trial) of the relational task…………….…….……. 58
12. Graph of rating incongruity effect magnitudes (larger values reflect more perceived
influence from incongruent social context) for each culture and condition. Error bars are
based on standard error values. ………………………………………………... 64
13. Close condition congruent and incongruent condition grand averaged ERP waveforms for
European Canadians (top 9 electrodes) and Japanese (bottom 9 electrodes) for electrodes
F3, Fz, F4, C3, Cz, C4, P3, Pz, & P4. Probe stimulus onset was at t=0 ms, and the 200-ms
pre-stimulus baseline is also shown.……………………………………………. 65
14. Acquaintance condition congruent and incongruent condition grand averaged ERP
waveforms for European Canadians (top 9 electrodes) and Japanese (bottom 9 electrodes)
for electrodes F3, Fz, F4, C3, Cz, C4, P3, Pz, & P4. Probe stimulus onset was at t=0 ms,
and the 200-ms pre-stimulus baseline is also shown…………..………………. 66

xvii
Figure Page
15. Expanded congruent and incongruent condition grand averaged ERP waveforms for
European Canadians (top; blue) and Japanese (bottom; red) at electrodes Cz, for the close
(left) and acquaintance (right) conditions. Time windows for N400 analyses are set on
white backgrounds (250-450 ms). Probe stimulus onset was at t=0 ms, and the 200-ms
pre-stimulus baseline is also shown……………………………………….……. 67
16. Difference waves (the congruent condition minus the incongruent condition) for
European Canadians and Japanese at electrode Cz and at averaged N2 frontal (F3, Fz, and
F4) and parietal electrodes (P3, Pz, and P4; parietal electrodes multiplied by -1). Time
windows for ERP analysis are set on white backgrounds (Cz: 250-450 ms for N400;
Average N2: 250-375 ms for N2). Probe stimulus onset was at t=0 ms, and the 200-ms
pre-stimulus baseline is also shown…………………………..………..………. 68
17. Graph of N400 incongruity effect magnitudes (positive values reflect stronger (more
negative) N400 processing of incongruent social context) for each culture and condition.
Error bars are based on standard error values………………………………….. 69
18. Graph of N2 incongruity effect magnitudes (positive values reflect stronger (more
negative) N2 processing of incongruent social context) for each culture and condition.
Error bars are based on standard error values.…………………………………. 69

1
Chapter 1: Introduction
Through historic evolutionary developments, humankind was given the ability to imitate
others (Tomasello, 1999). Whereas other animals could sometimes copy actions of their brethren,
human imitation involved not only copying actions from others, but also inferring intentionality
from these actions. This gave humans an evolutionary advantage as it allowed them to learn
more quickly than other species, as they could take the meaning behind actions and generalize it
to other domains. Able to efficiently take meanings from others, humans gained the capacity to
create shared meanings that lasted through the generations. These shared meanings and practices
are sometimes referred to as culture (e.g., Bruner, 1990; Miller, 1999; Shweder, 1991). While
culture likely started as simple shared meanings among small groups of early humans, culture-
related advancements have accumulated to the point that incredible developments are now
possible, being effortlessly shared across the globe (e.g., Iaccarino, 2003). Furthermore, the
effects of culturally shared meanings have been shown across a wide range of domains (e.g.,
Kitayama & Cohen, 2007), even affecting our fundamental psychological processes such as
attention (Nisbett, 2003; Nisbett & Masuda, 2003; Nisbett & Miyamoto, 2005; Nisbett, Peng,
Choi, & Norenzayan, 2001). Complex and expansive, we need to investigate culture on multiple
levels to understand its nuances and intricacies.
1.1 A Multi-Level Approach to Culture
Recent models in cultural psychology have proposed multi-level views to culture,
integrating the various ways that we can view culture (e.g., Miyamoto, 2013). For example,
Miyamoto’s model proposed that distal (i.e., broader factors, such as sociopolitical systems,
ecological influences, settlement patterns, etc.), proximal (i.e., immediate factors, such as
cultural products, mass media, communication practices, etc.), and individual level (i.e.,

2
internalized practices, beliefs, etc.) cultural influences affect our psychological processes.
However, as these levels do not clearly correspond to the cultural differences I discuss in this
manuscript, I offer an alternate model. In the model that I propose as a framework for this paper,
there are three interconnected levels of culture: the socioecological level, the meaning system
level, and the individual level.
1.1.1 The Socioecological Level of Culture
The socioecological level of culture refers to factors in our immediate social and physical
environments that lead to the development of shared cultural meanings (e.g., Dowson, 1967;
Berry 1966; 1971; Gregory, 1968; Segall, Campbell, & Herskovits, 1966; Talhelm et al., 2014;
Varnum, Na, Murata, & Kitayama, 2012; Yuki et al., 2007). The logic behind this view of
culture is that to be adaptive in our socioecological environments, we need to create strategies to
solve the intricacies and dilemmas that these environments present. Related to this level of
culture, research has emphasized how historic socioecological environments relate to cultural
differences in attention (e.g., Talhelm et al., 2014; Varnum, Grossmann, Kitayama, & Nisbett,
2010). For instance, Talhelm and colleagues (2014) recently found that areas in China
historically linked to wheat farming show more focused attention than areas of China connected
to rice farming. They argue that because rice farming requires cooperation to succeed (i.e.,
shared irrigation & planting practices, etc.), people in these socioecological environments then
needed to pay more attention to the people and environments around them, creating a more
spread pattern of attention. Conversely, as wheat farming requires less cooperation, people in
these socioecological environments developed a more focused pattern of attention. Beyond these
findings, other research supports that various physical environments, such as the presence of
carpentered buildings, and social environments, such as social class, also lead to immediate

3
cultural differences in attention (e.g., Segall et al., 1966; Varnum et al., 2012). While useful in
explaining many culture-related phenomena, this level of culture alone does not explain well
how cultural differences endure over time, even in the absence of immediate socioecological
constraints. To address this question, we need to combine this level of culture with the next, the
meaning system level of culture.
1.1.2 The Meaning System Level of Culture
The meaning system level of culture refers to accumulated historically shared meanings
which are thought to guide and direct behaviors (e.g., Bruner, 1990; Miller, 1999; Shweder,
1991). Whereas historic dilemmas related to social and physical environments are thought to
have led to the initial establishment of various shared cultural meanings, these meanings have
then slowly accumulated over time. They come in the form of personal and societal narratives,
literature, media, and other messages that tell the essence of what it is to have a good and
meaningful life (e.g., Bruner, 1990; Miller, 1999; Shweder, 1991). When parents tell their
children how to act based on their accumulated meanings, they have become vessels of meaning
systems. When people read complex books on philosophy, textbooks on psychology, or even
simple novels, they are transported across time and place to cultural meanings accumulated
throughout the years. These collections of meanings interact with us in that they create
immediate socioecological like environments based on how we should act and believe, directly
influencing our psychological processes (e.g., Nisbett, 2003). As one example that will be
revisited in depth in section 1.2, meaning systems related to cultural differences in how people
view the self have been associated with cultural differences in attention (e.g., Varnum et al.,
2010). Meaning systems tend to be investigated on the societal (i.e., European Canadians vs.

4
Japanese) or the group (i.e., Protestants vs. Catholics) levels. However, shared meanings may
also exist on a more individualized level.
1.1.3 The Individual Level of Culture
Lastly, addressing individual differences in how people take on culture, there is the
individual level of culture (e.g., Miyamoto, 2013). I term the individual level of culture to be
beliefs, values, or practices that are shared with other individuals that hold similar dispositions or
experiences. This level of culture is less shared and therefore less accumulated en masse than
the other two levels of culture, as it is related to individuals’ experiences, which may involve
influences from multiple, contradictory meaning systems and/or socioecological environments.
While a society at large might provide overarching meaning systems that direct how a person
should act, a person’s own individualized cultural experiences can also interact with and
influence these meanings. For example, a person may be Canadian of East Asian descent, having
both cultural experiences related to Canadian society and their East Asian experience (e.g., Fong
et al., 2014). As such, this level of culture is more individualized and nuanced than the other two
levels of culture. Because of this, multiple within-individual cultural influences are thought to
obstruct relationships between individuals’ cultural beliefs and culture-related behaviors (e.g.,
Na, Grossmann, Varnum, Kitayama, Gonzalez, & Nisbett, 2010). However, recent research has
found some evidence of individual-level cultural differences, with individuals’ cultural beliefs
sometimes relating to the degree they take on previously noted meaning system culture-related
behaviors (e.g., Miyamoto, 2013; Russell, Masuda, & Li, 2016). Furthermore, cultural
neuroscience research has more regularly found these relationships, often linking individuals’
cultural beliefs to how much they display culture related neural patterns (e.g., Goto, Ando,

5
Huang, Yee, & Lewis, 2010; Goto, Yee, Lowenberg, & Lewis, 2013; Ishii, Kobayashi, &
Kitayama, 2010; Na & Kitayama, 2011; Russell, Masuda, Hioki, & Singhal, 2015).
These three levels of culture all relate to aspects of my thesis; however, I will focus
mostly on findings directly involving the individual and meaning system levels of culture.
1.1.4 Social Orientation Theory
As one major cultural difference between North Americans and East Asians, researchers
have found that the two cultural groups carry a differing view of the self (e.g., Markus &
Kitayama, 1991). These social orientation differences relate to North Americans (i.e., European
Americans, European Canadians, etc.) tending to view the self as independent from others,
placing individuals as separate from other people, and East Asians (i.e., Koreans, Chinese,
Japanese, etc.) tending to view the self as interdependent with others, placing individuals as
interconnected with others. Furthermore, these differences in social orientation are often paired
with differences in general attention (e.g., Varnum et al., 2010). Independent cultures tend to
analytically attend to focal objects, including other people, as separate from their contexts, and
interdependent cultures tend to holistically attend to focal objects as related to their contexts.
As such, recently researchers have offered the social orientation hypothesis as a
framework to explain seen cultural differences in attention (Varnum et al., 2010). This
hypothesis states that because of social orientation differences, people then develop differing
generalized ways of attending to the world. In line with these thoughts, a plethora of evidence
has demonstrated that various independent cultures show focused attention to focal objects, and
interdependent cultures show spread attention between foreground and background information
(i.e., North Americans vs. East Asians, wheat vs. rice farmers, mobile vs. sedentary cultures,
middle vs. low class, etc.; Talhelm et al., 2014; for a review see Varnum et al., 2010).

6
Furthermore, evidence suggests that social orientation may be causally related to attention, with
the priming of social orientation resulting in immediate attention changes within given cultural
contexts, similar to those naturally seen between independent and interdependent cultures (e.g.,
Oyserman, 2015; Varnum et al., 2010).
Expanding on this research, my thesis explores nuances of how social orientation affects
early attention.
1.2 Using ERP Methods to Study Culture
To measure this early attention, I focus on using cultural neuroscience methods. As a
recent movement in cultural psychology, researchers have begun to use neuroscience measures
to better understand how culture influences our biological processes (e.g., Chiao, 2009; Han et
al., 2013; Han & Northoff, 2009; Kitayama & Tompson, 2010; Kitayama & Uskul, 2011). These
measures are important as they each provide additional information about culture’s effect on the
human psyche. While various behavioral measures (i.e., accuracy, reaction time, judgments,
eye-movements, etc.) are very important in that they give us empirical evidence based in
observable actions, sometimes the processes and motivations involved in these actions are
unclear. I see neuroscience as one means to help fill this gap. For example, my main target
measure electroencephalography (EEG) can better help us understand various early attention
neural processes, even before they are observable in our actions (e.g., Luck, 2005).
EEG research is based on the fact that our thought processes generate measureable
amounts of electrical activity. However, as this electricity alone offers little meaning to specific
attention processes, we pair it with psychological events (i.e., our target happenings in tasks) to
form Event Related Potentials (ERPs; Luck, 2005). These ERPs give us measures of various

7
attention processes elicited by the events and are often split into different ERP components,
which are voltage deflections related to portions of our brain’s processing of events. In
particular, the research I discuss below targets three ERP components: the N400, the late positive
complex (LPC), and the N2.
1.2.1 The N400
The first target ERP component I focused on is called the N400. One key property of the
N400 is it is often linked with the processing of semantic (i.e., meaning-based) relationships, and
responds stronger to incongruent and unexpected semantic events, called the N400 incongruity
effect (e.g., Kutas & Federmeier, 2011). Due to this sensitivity to meaning-related violations, the
N400 has become a regular target of recent cultural research (e.g., Goto et al., 2010; 2013; Ishii
et al., 2010; Na & Kitayama, 2011). If culture represents “shared meanings between people”
(Bruner, 1990; Miller, 1999; Shweder, 1991), the presence of an N400 in a given cultural context
can be interpreted as being elicited by violations to this culture’s shared meanings.
1.2.2 The LPC
Beyond the N400, I was also interested in the LPC. This ERP component is commonly
associated with the N400 (e.g., Yao & Wang, 2014). The LPC is thought to reflect cognitive
resource allocation and stimulus evaluation, and is sensitive to affective incongruence. This
property also makes it a likely target of cultural research, as it can also help give evidence of
culturally shared meanings related to stimulus evaluation.
1.2.3 The N2
Finally, I was interested in the N2 ERP component. The N2 is associated with earlier
processes, often interpreted as conflict monitoring processes (e.g., Yeung, Botvinick, & Cohen,

8
2004). The N2 was relevant to my research as it gave me a measure of whether or not contextual
cues were processed, whether cultures showed components related to shared meanings (i.e.,
shown through the N400 or LPC components). While the N400 and LPC stand more as top-
down (i.e., complex, meaning system related) measures of culture’s effect on brain processes, the
N2 can be seen as additional evidence of what occurs in bottom-up (i.e., more simple perceptual)
processes.
1.3 Framing my Thesis
This thesis will explore how culture affects neural patterns related to non-social and
social attention. Below I refer to non-social tasks as ones lacking clear information relating
people to other people, and social tasks as including information directly relating people to other
people. I focus on social attention through tasks showing lineups of people placed in a row (face-
lineup tasks) and tasks providing information relating people to others, which I term relational
tasks. As a general format for the upcoming three chapters, I will introduce key literature related
to each chapter’s research, present my research itself and interpret it, and discuss my findings as
they may be related to social orientation and attention. My research visits various aspects of
non-social and social attention, investigating how culture affects neural patterns in: non-social
memory tasks (Chapter 2), social face-lineup tasks (Chapter 3), and relational tasks (Chapter 4).
My final discussion (Chapter 5) integrates the results of my three studies and implications for
our understanding of culture, attention, and social orientation. To close, I discuss where I think
neuroscience belongs in cultural research, based on my recent experiences (Chapter 5).
Chapter 2: Culture, Non-Social Memory, and the Brain
2.1 Introduction

9
As introduced earlier in the social orientation hypothesis section (1.2.1), cultural
differences in social orientation are thought to result in cultural differences in general, non-social
attention (e.g., Varnum et al., 2010). More interdependent cultures (such as East Asian cultures)
tend to attend to the world holistically, seeing focal objects as interrelated with surrounding
contextual information, whereas more independent cultures (such as North American cultures)
tend to attend to the world analytically, seeing focal objects as separate from their contexts (e.g.,
Nisbett, 2003; Nisbett & Masuda, 2003; Nisbett & Miyamoto, 2005; Nisbett et al., 2001). These
findings are quite robust, with East Asians being more likely than their North American
counterparts to attend to context in a wide range of non-social tasks, including how the two
cultures make visual judgments, make decisions, view scenes, create narratives, and make
memory judgments (e.g., Chua, Boland, & Nisbett, 2005; Ji, Peng, & Nisbett, 2000; Li, Masuda,
& Russell, 2015; Masuda, Gonzalez, Kwan, & Nisbett, 2008; Masuda & Nisbett, 2001; 2006;
Nand, Masuda, Senzaki, & Ishii, 2014; Senzaki, Masuda, & Ishii, 2014; Wang, Masuda, Ito, &
Rashid, 2014).
Expanding on this research, the present study investigated how culture affects neural
patterns during non-social memory tasks. As a basis for this research, Masuda and Nisbett (2001)
previously compared American and Japanese performance during a non-social memory task. In
their research, they first had participants rate the likability of foreground animals that were
paired with background wilderness scenes. Then after a short distractor task, participants were
asked to judge in a surprise recognition task if they had seen the animals before, when: 1)
previously seen animals were placed with their original backgrounds (the congruent condition),
2) previously seen animals were placed with novel backgrounds (the incongruent condition), 3)
novel animals were placed with previously studied backgrounds, or 4) novel animals were placed
10
with novel backgrounds. As a key cultural difference, they found that while both cultural groups
did well for congruent condition lineup memory judgments, Japanese showed poorer memory
performance in the incongruent condition, which was also significantly worse than for
Americans. According to this behavioral evidence, they argued that East Asians placed more
importance on background cues. This argument was supported by follow-up eye-tracking
research, also showing cultural differences in eye-movements, with Japanese visually attending
more to the context than Americans (e.g., Chua et al., 2005; Masuda, Ishii, & Kimura, In Press).
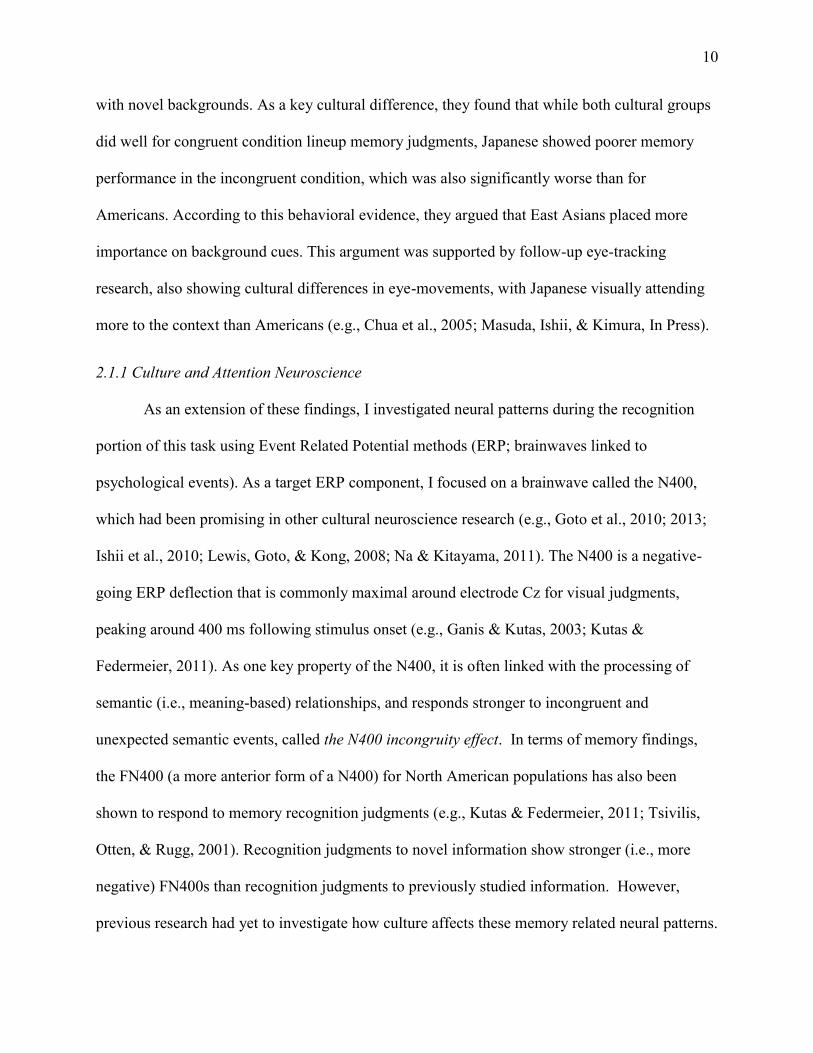
2.1.1 Culture and Attention Neuroscience
As an extension of these findings, I investigated neural patterns during the recognition
portion of this task using Event Related Potential methods (ERP; brainwaves linked to
psychological events). As a target ERP component, I focused on a brainwave called the N400,
which had been promising in other cultural neuroscience research (e.g., Goto et al., 2010; 2013;
Ishii et al., 2010; Lewis, Goto, & Kong, 2008; Na & Kitayama, 2011). The N400 is a negative-
going ERP deflection that is commonly maximal around electrode Cz for visual judgments,
peaking around 400 ms following stimulus onset (e.g., Ganis & Kutas, 2003; Kutas &
Federmeier, 2011). As one key property of the N400, it is often linked with the processing of
semantic (i.e., meaning-based) relationships, and responds stronger to incongruent and
unexpected semantic events, called the N400 incongruity effect. In terms of memory findings,
the FN400 (a more anterior form of a N400) for North American populations has also been
shown to respond to memory recognition judgments (e.g., Kutas & Federmeier, 2011; Tsivilis,
Otten, & Rugg, 2001). Recognition judgments to novel information show stronger (i.e., more
negative) FN400s than recognition judgments to previously studied information. However,
previous research had yet to investigate how culture affects these memory related neural patterns.

11
Previous research had, however, investigated cultural differences in the N400 for non-
social visual judgments (Goto et al., 2010; 2013). In this research, Goto, et al. (2010) compared
neural patterns for a simple task where participants were asked to categorize focal objects as
being animate or inanimate. To compare if participants naturally processed the relationship
between focal objects and contexts, focal objects were designed to be either semantically
congruent with contexts (e.g., a crab superimposed on a beach) or semantically incongruent (e.g.,
a crab superimposed on a parking lot). If stronger N400s were seen for the incongruent
condition (vs. the congruent condition), it would support that foreground and background
information were processed as being meaningfully linked. Results of this research showed that
Asian Americans produced stronger N400 amplitudes during incongruent trials than congruent
trials, but no such incongruity effects were found for European Americans, suggesting that only
Asian Americans naturally linked meanings between focal and background (non-social)
information. Replicating these findings, Goto, et al. (2013) found similar effects using
combinations of emotional facial expressions (happy vs. sad) and affective background scenes
(positive vs. negative). Again only Japanese showed an N400 incongruity effect, implying that
they naturally processed the relationship between foreground face-emotions and landscape
emotion context, while Americans did not. Together these ERP findings support that East Asians
seem to naturally connect foreground objects and background contexts in non-social tasks,
whereas North Americans separate foreground from context.
Extending these findings showing that neural patterns related to memory recognition
judgments in North Americans and cultural differences in attention (e.g., Tsivilis et al., 2001;
Goto et al., 2010; 2013; Masuda and Nisbett, 2001), I investigated how culture affects peoples’
neural patterns during non-social memory tasks.

12
2.1.2 Hypotheses
Modeling my task after the previously described Masuda and Nisbett’s (2001) memory
task, I had participants first rate the likeability of target animals in an initial study task. Then,
after a short distractor task, I had participants recognize if they had seen the animals. These
recognition animals were either novel or previously presented, and paired with novel or
previously paired background wildernesses. As my target neural measure, I compared
N400/FN400s (which I simplify as the N400 from now on) for European Canadian and Japanese
participants during the period where participants were asked to recognize if they had seen the
animals. Similar to the Masuda and Nisbett (2001) study, I focused on comparing the congruent
condition (i.e., where previously presented animals were paired with their initial backgrounds)
with the incongruent condition (i.e., where previously presented animals were paired with novel
backgrounds). In an attempt to disentangle cultural variations in neural patterns from those of
spontaneous attention strategies, I provided all participants with the same attention instructions,
telling them to focus on remembering foreground animals for a later memory task.
I expected that the N400 could be used to show incongruity effects across cultures in the
non-social memory task, revealing that people at least retrieved prior learned associations
between animals and task-irrelevant contextual information. This effect would be seen as a
stronger N400 (i.e., more negative) to the incongruent condition than the congruent condition.
Furthermore, I expected that both groups would show an N400 incongruity effect (Hypothesis
1a), as previous research with North Americans had shown that they at least notice incongruent
context in memory studies (e.g., Tsivilis et al., 2001). However for Hypothesis 1b, I expected
that like the Goto et al.’s (2010; 2013) studies, the Japanese would show stronger N400
incongruity effects, showing their stronger tendency to link meanings between foreground and

13
background information. Finally for Hypothesis 2, I expected that only Japanese would use this
contextual information as a cue in their recognition judgements, showing a relationship between
stronger N400 processing in the incongruent condition and decreased memory performance. As
Japanese are thought to place importance on context (compared to European Canadians),
incongruent contextual information would then produce interference in their memory judgments.
2.2 Methods
2.2.1 Participants
I recruited 38 European Canadians and 34 Japanese international students from the
University of Alberta. Of these, 7 European Canadian and 13 Japanese data sets were excluded
due to equipment failure or data collection issues and 3 Japanese data sets were excluded due to
insufficient trial numbers in target conditions. This left 31 European Canadians (15 Male, 16
Female; Ages 19.6±2.4, range=18–30 years) and 18 Japanese (5 Male, 13 Female; Ages
19.7±1.1, range=18–23 years) participants. European Canadian participants earned partial course
credit and Japanese participants received an honorarium for their participation. Instructions were
provided in English for both groups, and Japanese instruction and clarification was provided as
necessary, with key points reinforced in Japanese for all Japanese participants.
2.2.2 Materials
I modified Masuda and Nisbett’s (2001) original stimuli by increasing image quality and
quantities. In total, I presented 36 images of unique animals paired with unique backgrounds in
the likeability rating task (the study phase) and 72 images of animals paired with varying
backgrounds in the test phase. 18 of the test images were previously seen animals with their
original backgrounds (the congruent condition), 18 were previously studied animals with novel
backgrounds (the incongruent condition), 18 were novel animals with previously studied

14
backgrounds, and 18 were novel animals paired with novel backgrounds (see Figure 1). As
Masuda & Nisbett’s (2001) study only found Condition by Culture interactions for the congruent
and incongruent conditions, I limited my final analyses to those two conditions.
2.2.3 Procedure
The session took place in an electrically shielded, sound-attenuated chamber. Differing
from the original Masuda and Nisbett (2001) task, in which attention was undirected, participants
were given analytic attention instructions to improve memory performance and control attention,
in order to make brainwaves more comparable (e.g., Luck, 2005).
2.2.4 The Study Phase
Each participant tried 3 practice trials (excluded from analyses), followed by 36
experimental trials. Each trial began with a fixation that was jittered with a uniform-random
interval between 1500–2000 ms, followed by an animal–wilderness image presented for 5000 ms
(see Figure 2). Both animals and backgrounds were drawn at random without replacement from
the previously described image pools. After image presentations, participants then rated how
much they liked each animal. The rating task was used as an orienting task to ensure continual
attention to the images throughout the trials and was excluded from analyses. As part of the
initial instructions for this phase, participants were provided with analytic attention instructions,
and asked to focus on the animal and ignore the background for the duration of trials to control
attention behaviors (said as, “Please focus on and remember these animals for a later task”)1.
2.2.5 The Distractor phase

15
The study phase was followed by a two-minute-long distractor phase. Participants were
asked to complete simple multiple choice addition/subtraction problems by selecting the correct
answer among three other semi-randomly generated incorrect alternate answers.
2.2.6 The Test Phase
Participants were then given a recognition-memory task. This task started with 6 practice
trials (excluded from analyses), and was followed with 72 experimental trials that were presented
pseudo-randomly. Each trial began with a fixation that was jittered by a uniform-random interval
between 1500–2000 ms, followed by the presentation of the target image, which was displayed
on the screen until a response was made. Participants were told to judge whether they had seen
the animal (regardless of backgrounds) and were encouraged to respond as quickly and
accurately as possible (see Figure 2).
2.2.7 Electroencephalography (EEG) Recording and Analyses
EEG data were recorded using a high-density 256-channel Geodesic Sensor Net
(Electrical Geodesics Inc., Eugene, OR), amplified at a gain of 1000 and sampled at 250 Hz.
During preparations, impedances were kept below 50 kΩ. EEG data were initially referenced to
the vertex electrode (Cz), but digitally average re-referenced during preprocessing. Data was
preprocessed and analyzed by custom MATLAB scripts, in conjunction with the open-source
EEGLAB toolbox (Delorme & Makeig, 2004; http://sccn.ucsd.edu/eeglab). In preprocessing,
signals were digitally bandpass filtered between 0.5–30 Hz, artifacts were corrected via
Independent Component Analysis, and trials that deviated more than 300 µV from baseline were
rejected. After preprocessing, participants with fewer than 8 surviving accurate trials in each
condition of interest were removed from the final analyses. To measure resulting ERPs, trials
were referred to a 200-ms pre-stimulus baseline and the N400 was quantified at electrode Cz as a

16
mean voltage over the 300–500 ms time-window post-stimulus presentation in the test phase,
based on previous literature (e.g., Ganis & Kutas, 2003; Kutas & Federmeier, 2011). Final
statistical analyses were carried out using Matlab 7.1 (MathWorks, Natick, MA, USA) and SPSS
Statistics for PC, Release Version 18.0.0 (SPSS, Inc., 2009, Chicago, IL).
Figure 1: Example study phase image and respective test phase images for (a) an example
studied image, with target analysis recognition (b) congruent and (c) incongruent condition
images, and untargeted (d) novel animal on studied background and (e) novel animal on novel
background images.

17
Figure 2: Time diagram for the experiment showing the three consecutive phases: The study,
distractor, and test phases.
2.3 Results
2.3.1 Behavior
Accuracy and response time (RT) means are reported in Table 1. In a mixed 2 (Culture:
Japanese vs. European Canadian) X 2 (Condition: Congruent vs. Incongruent) repeated-measures
ANOVA with Accuracy as the measure, with Culture as a between-subjects factor and Condition
as a within-subjects factor, a significant main effect of Condition revealed higher accuracy in the
congruent than incongruent condition, F(1, 47) = 39.02, p < .001, = .46 (Congruent M =
87.4%, SD = 11.1, Incongruent M = 74.6%, SD = 11.8). The main effect of Culture and the
Culture by Condition interaction were not significant (p > .1). This supports that the analytic
instructions to focus on focal animals did effectively lead to similar memory behaviors for both
cultural groups.
A second ANOVA, with RT as the measure, found a main effect of Condition, with faster
RTs for the congruent than incongruent condition, F(1, 47) = 28.79, p < .001, = .37
18
(Congruent M = 1550 ms, SD = 537, Incongruent M = 1880 ms, SD = 796). As with Accuracy,
the main effect of Culture and the Culture by Condition interaction were not significant (p > .1).
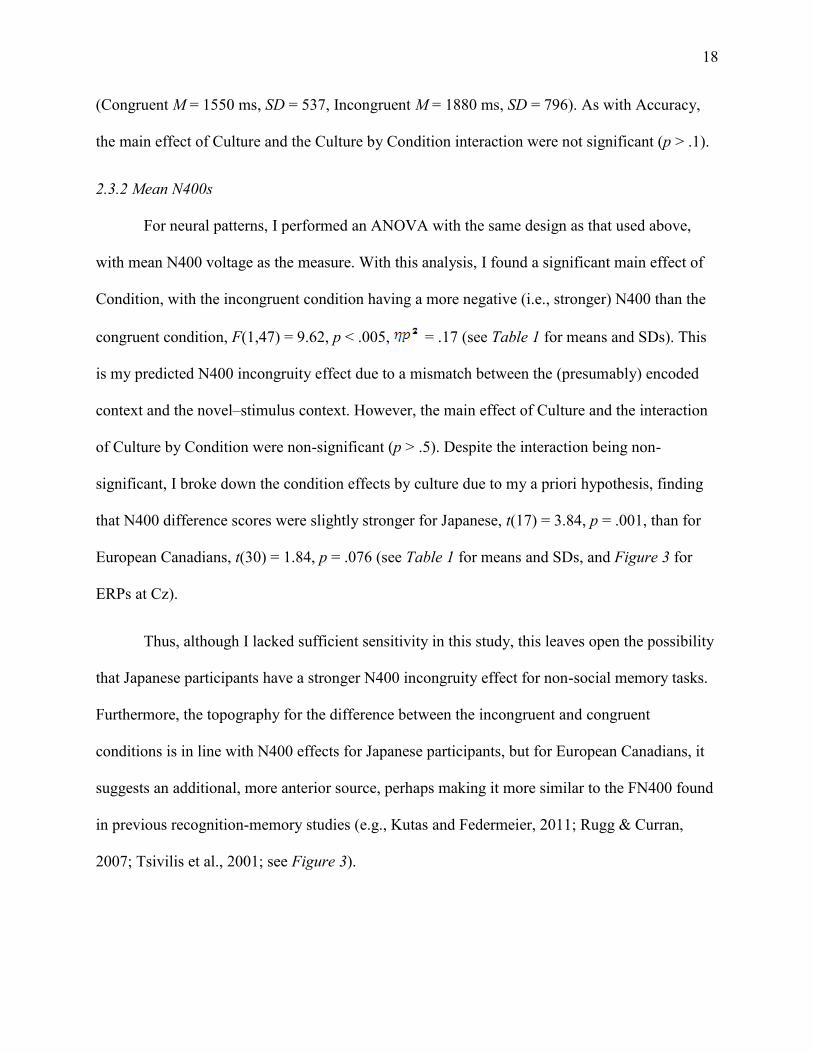
2.3.2 Mean N400s
For neural patterns, I performed an ANOVA with the same design as that used above,
with mean N400 voltage as the measure. With this analysis, I found a significant main effect of
Condition, with the incongruent condition having a more negative (i.e., stronger) N400 than the
congruent condition, F(1,47) = 9.62, p < .005, = .17 (see Table 1 for means and SDs). This
is my predicted N400 incongruity effect due to a mismatch between the (presumably) encoded
context and the novel–stimulus context. However, the main effect of Culture and the interaction
of Culture by Condition were non-significant (p > .5). Despite the interaction being non-
significant, I broke down the condition effects by culture due to my a priori hypothesis, finding
that N400 difference scores were slightly stronger for Japanese, t(17) = 3.84, p = .001, than for
European Canadians, t(30) = 1.84, p = .076 (see Table 1 for means and SDs, and Figure 3 for
ERPs at Cz).
Thus, although I lacked sufficient sensitivity in this study, this leaves open the possibility
that Japanese participants have a stronger N400 incongruity effect for non-social memory tasks.
Furthermore, the topography for the difference between the incongruent and congruent
conditions is in line with N400 effects for Japanese participants, but for European Canadians, it
suggests an additional, more anterior source, perhaps making it more similar to the FN400 found
in previous recognition-memory studies (e.g., Kutas and Federmeier, 2011; Rugg & Curran,
2007; Tsivilis et al., 2001; see Figure 3).

19
Figure 3: 1) Congruent and incongruent condition grand-averaged ERP waveforms for Japanese
(left) and European Canadians (right), at electrode Cz. Probe stimulus onset was at t=0 ms, and
the 200-ms pre-stimulus baseline is also shown. 2) Topographic spline maps showing the
difference between congruent and incongruent conditions (congruent minus incongruent). For
Japanese participants, this topography is quite consistent with previous N400 findings (Kutas and
Federmeier, 2011). For European Canadians, the posterior portion of the pattern (typical of N400
findings) appears weaker, and there may be an additional source, perhaps related to the
recognition-memory FN400 (Rugg & Curran, 2007).
Japanese European Canadians
2)
1)

20
Table 1
Means (standard error) for accuracy and response times (top) and N400 voltages in the 300–
500 ms time window (bottom), as a function of culture and condition.
Accuracy (%) RT (ms)
Culture Congruent Incongruent Congruent Incongruent
Japanese 83.9(2.97) 72.5(2.31) 1630(132) 1910(156)
European
Canadians 89.4(1.77) 75.8(2.31) 1500(96) 1860(156)
Mean N400 Voltage (µV)
Culture Congruent Incongruent
Japanese -1.36(0.40) -1.93(0.33)
European
Canadians -1.55(0.26) -1.96(0.29)
Combined -1.48(0.22) -1.95(0.22)

21
2.3.3 Accuracy–N400 relationship
As different strategies might have been adopted by the two cultural groups to make
memory judgments in the task, I further tested what could be driving the N400 effects for the two
groups, performing multiple regression analyses of accuracy on mean N400 voltages, for the two
cultures. Using a hierarchical linear regression model for the interaction of culture and accuracy
on the prediction of mean N400 voltages for the congruent condition, I found no significant
interaction, b = .96, t(45) = .23, p = .82. Furthermore, the combined model, which regressed the
main effects of culture and mean N400 voltages on accuracy, was not significant. Applying the
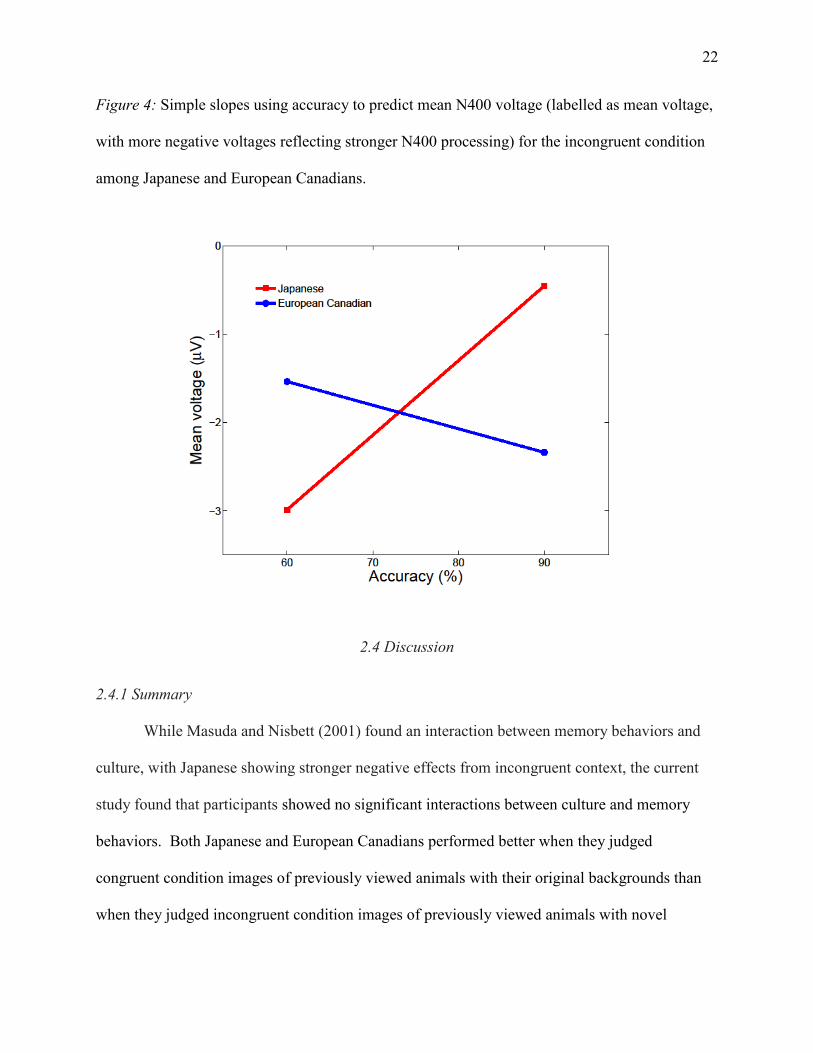
same analysis to the incongruent condition, there was a significant interaction of culture, b =
11.12, t(45) = 2.70, p = .01. Probing the interaction with simple slopes (see Figure 4), I found
that the interaction was primarily driven by the Japanese, = .348, b = 8.45, t(16) = 2.92, p
= .01, although an opposite trend was found for European Canadians, = .047, b = -2.673,
t(29) = -1.19, p = .24. Whereas the Japanese participants had a fairly strong positive relationship
between accuracy and N400 mean voltage, suggesting that N400 processing interfered with
memory performance, the European Canadians had a weak negative relationship. This may
suggest that for Japanese it was more difficult to ignore processed contextual information
(indicated by a stronger N400), resulting in higher likelihood of not recognizing previously seen
animals when they were paired with new background contexts.
22
Figure 4: Simple slopes using accuracy to predict mean N400 voltage (labelled as mean voltage,
with more negative voltages reflecting stronger N400 processing) for the incongruent condition
among Japanese and European Canadians.
2.4 Discussion
2.4.1 Summary
While Masuda and Nisbett (2001) found an interaction between memory behaviors and
culture, with Japanese showing stronger negative effects from incongruent context, the current
study found that participants showed no significant interactions between culture and memory
behaviors. Both Japanese and European Canadians performed better when they judged
congruent condition images of previously viewed animals with their original backgrounds than
when they judged incongruent condition images of previously viewed animals with novel

23
backgrounds. This was expected as I attempted to control basic attention strategies to make
brainwaves more comparable (e.g., Luck, 2005). Furthermore, in line with Hypothesis 1a, I
found a robust N400 incongruity effect, with no interaction with culture, again supporting that
overall attention was well controlled. In terms of strength of this incongruity effect for each
culture, while Hypothesis 1b was not confirmed, as there was no found interaction of condition
and culture for the N400, I should note that despite statistical equivalence of the N400
incongruity effect between groups, the effect was more pronounced in Japanese and showed a
more typical N400 topological pattern (versus a mix between a N400 and FN400 pattern for
European Canadians).
More interestingly, despite statistical equivalence of memory performance and a
tendency for both cultures to show N400 incongruity effects, individual variability revealed a
striking difference between the ways each culture’s memory incongruity co-varied with their
recognition-memory judgments, confirming Hypothesis 2. In the incongruent condition, the
Japanese participants had a strong positive relationship between accuracy and mean N400
voltage, signifying that they performed better when the N400 was weaker (i.e., less negative),
whereas the European Canadians had a weak relationship in the opposite direction. These
findings likely relate to prior research on cultural differences in attention. On the one hand,
European Canadians’ memory judgments were uninfluenced by N400 effects. Even those
showing strong N400 effects in the incongruent condition, who presumably noticed that these
animals were shown in incongruent contexts, did not show decreased memory performance. This
suggests that European Canadians were able to effectively ignore contextual incongruity in their
memory judgements, which could be interpreted as aligned with Western, analytic notions of the
world that place objects as separate from their context. On the other hand, Japanese participants

24
did show a strong negative relationship between the N400 and memory performance. Japanese
participants that covertly noticed incongruent context (seen in individuals with stronger N400s),
seemed to also be distracted by their increased N400 processing, showing poorer memory
performance. This may suggest that Japanese bind foreground and object context together,
leading them to have difficulty recognizing foreground information when they notice it is out of
context, which is in line with their noted holistic attention preference.
Building upon previous findings (e.g. Goto et al. 2010; 2013, Ishii et al, 2010; Kutas &
Federmeier, 2011), this study advances discussion of the viability of the N400 as a marker for
cultural neuroscience studies, providing evidence that N400 processing also reflects cultural
differences in memory judgments, with only Japanese showing interference from neural patterns
associated with a mismatch between remembered and current context.
2.4.2 Future Directions
While one strength of this study was the analytic instructions, as they controlled attention
and hence the associated ERPs to be more comparable across cultures (e.g., Luck, 2005), future
research should also investigate other possibilities for the task. For example, one could probe
Japanese and European Canadians when they are not instructed on how to attend on the memory
task. This research could reveal if natural differences exist in how the two cultures encode
memory. Also, future studies should increase trial numbers to allow further investigations of the
data. It is possible that implied differences in processing shown in the current study through
topographical differences (i.e., the N400 vs. the FN400) will be clearer with more trials, as other
recognition memory studies which reveal FN400s for North Americans tend to have much more
trials than we included (e.g., Rugg & Curran, 2007; Tsivilis et al., 2001). Furthermore, this
increase in trial quantities would also allow additional analyses related to inaccurate trials, as

25
well as analyses linking memory encoding and recognition neural patterns. Finally, as individual
differences in social orientation have been shown to link to cultural differences in neural patterns,
future memory studies should also include social orientation scales to see if they help explain
observed patterns (e.g., Goto et al, 2010; 2013; Ishii et al. 2008; Lewis et al. 2008; Na &
Kitayama, 2011).
2.4.3 Non-Social Memory and Social Orientation
Breaking from the simple story presented by the social orientation hypothesis, suggesting
that independent cultures do not notice context and interdependent cultures do, this research
gives evidence that cultural differences in general attention may not be so simple. While East
Asians do show slightly stronger N400 incongruity effects in the memory task, North Americans
also show patterns suggesting that they notice contextual mismatches. However, the key cultural
difference seems to be in how the two cultures use this information in memory judgments. In line
with social orientation theory, the more independent European Canadians do not show
performance (i.e., recognition accuracy) interference from noticing changes in the backgrounds,
potentially due to cultural beliefs that context does not matter. However, the more interdependent
Japanese do show interference, possibly due to their beliefs that context matters. As such, I
believe that the key addition to social orientation literature gleaned from this study is that
cultural differences in attention may not actually be in whether context is processed. Rather,
social orientation differences may be more related to how contextual information is used. North
Americans do not seem to use this contextual information in their memory judgments and East
Asians do.
Finding evidence that cultural differences in general attention also seem to apply to
memory judgments (Masuda, Russell, Chen, Hioki, & Caplan, 2014), I decided to move my

26
investigation to how culture affects neural patterns related to social attention. My reasoning was,
if social orientation differences generate general attention differences, as is suggested by recent
theory (e.g., Varnum et al, 2010), we should then be able to find that neural patterns underlying
social attention are in line with previously reported non-social attention neural patterns (i.e.,
Goto et al. 2010; 2013).
Chapter 3: Culture, Face-lineup Tasks, and the Brain
3.1 Introduction
Moving my focus from non-social attention, I decided to investigate how cultural
differences in social orientation directly affect early social attention-related neural patterns. I
expected that cultural differences in social orientation should also be associated with early social
attention: Independent cultures should place individuals as separate from their social contexts
and interdependent cultures should place individuals as embedded in their social contexts. In fact,
this has been supported by recent behavioral evidence (e.g., Masuda, Ellsworth, et al., 2008;
Masuda, Wang, Ishii, & Ito, 2012).
3.1.1 Social Tasks and Attention
To test how independent and interdependent cultures were affected by social context,
research by Masuda and colleagues used a face lineup task (e.g., Masuda et al., 2012; Masuda,
Ellsworth, et al., 2008). In this research, North Americans and East Asians were asked to rate
emotions of center faces in five-person emotional face lineups. Lineups were either congruent,
with emotions of center faces and background faces the same (i.e., the center person was happy
and the background people were happy), or incongruent, with emotions of center faces and
background faces being different (i.e., the center person was happy and the background people

27
were sad). In line with noted cultural differences in attention, North Americans showed little
influence from incongruent background face emotions in their ratings (i.e., showing little
difference between congruent and incongruent lineup ratings), while East Asians showed
influence from this social incongruence (i.e., showing larger differences between the two types
of ratings). This finding suggested that only East Asians integrated background faces’ emotional
information into their ratings of center persons.
Further investigating social attention patterns during this face lineup task, Masuda and
colleagues also measured eye-movement patterns when participants viewed these face-lineups in
preparation for their rating judgments (e.g., Masuda et al., 2008; Masuda, Ellsworth et al., 2008).
Tracking eye-movements, they found that North Americans focused their attention more on
center persons and Japanese spread their attention more between center and background people.
Given these cultural variations in emotion judgments and the corresponding eye movement
patterns, I was interested in also exploring North Americans’ and East Asians’ neural patterns
during the face lineup task. While previous research focused on judgments and eye-movements
leading to the task’s decision, I wanted to investigate how culture affected early social attention
patterns, seen through ERPs.
3.1.2 Non-Social and Social Tasks and the N400
I focused my main ERP analyses on the N400. As stated before, the N400 is a negative-
going deflection ERP that is usually maximal in central electrode sites (usually Cz) around 400
ms after events are presented (e.g., Ganis & Kutas, 2003; Kutas & Federmeier, 2011). The N400
has been linked to the processing of semantic relationships and responds more to incongruent or
unexpected events, which is called the N400 incongruity effect. Previous cross-cultural N400
findings were derived from non-social tasks, showing that only Asian Americans (and not

28
European Americans) show N400 responses when objects and backgrounds do not semantically
fit (e.g., Goto et al. 2010; 2013).
For the current study, I expected a stronger N400 to incongruent emotions in the face
lineup task for East Asians than for congruent emotions, reflecting that they processed
incongruent emotions as meaningful, which would not occur for North Americans. East Asians
would be more influenced by this social incongruence potentially due to their interdependent,
social context-oriented cultural characteristics. Conversely, North Americans would be less
influenced by social incongruence, potentially due to their independent cultural values, stressing
the independence of the self from others.
3.1.3 The Late Positive Complex (LPC)
Beyond the N400, I was also interested in the late positive complex (LPC). This
waveform is commonly associated with the N400 (e.g., Yao & Wang, 2014). The LPC is a
positive-going ERP component that usually begins around 500ms, and is maximal at parietal
electrodes. It is thought to reflect cognitive resource allocation and stimulus evaluation, and is
sensitive to affective incongruence. Contrasting with the N400, incongruent stimuli generally
result in larger LPCs than congruent stimuli at parietal electrodes, which is called the LPC
incongruity effect. I was interested in examining whether such a LPC difference might also be
present for East Asians in the face-lineup task, reflecting a continued attention to and processing
of background incongruent emotions.
3.1.4 The N2
Lastly, I was interested in exploring whether conflict monitoring processes were seen in
lieu of N400/LPC differences. While the N400 and the LPC are usually associated with
semantic, meaning-based processing, the N2 ERP component is associated with earlier processes,

29
often interpreted as conflict monitoring processes (e.g., Yeung et al., 2004). Like the N400, the
N2 is seen as a more negative deflection, peaking somewhere between 200 and 400ms for
incongruent stimuli (vs. congruent stimuli), which is called the N2 incongruity effect. One task
commonly associated with N2 processing is the flanker task, where participants are asked to
categorize a central object when it is surrounded by congruent (i.e., < < < < <) or incongruent
objects (i.e., < < > < <). The N2 may be relevant to the face lineup task as it could be seen as a
flanker task, albeit with the difference that participants are asked to judge the intensity of
emotions of center persons, rather than to categorize quickly center objects, as is done in typical
flanker tasks.
I was interested in whether North Americans still show a N2 (similar to flanker studies),
even if they lacked N400 and LPC processing, suggesting that they at least noticed background
incongruence. This would conceptually replicate Chapter 2’s findings showing that North
Americans notice surrounding context in non-social memory tasks (Masuda et al., 2014)2.
3.1.5 Hypotheses
Based on non-social ERP findings (Goto et al., 2010; 2013), and previous findings
showing cultural differences in rating behaviors for the face lineup task (Masuda et al., 2012;
Masuda, Ellsworth et al., 2008), I expected that cultural differences in neural patterns should also
be at work when rating face lineups. Assuming East Asians are generally characterized by a
more interdependent culture, placing value on harmonious interpersonal relationships, they may
also process social incongruence as more meaningful than North Americans (e.g., Ito, Masuda,
Komiya, & Hioki, 2015; Kim, Sherman, & Taylor, 2008). To test these notions, I had European
Canadians and Japanese engage in the face lineup task while collecting ERP data. Behaviorally I
expected to replicate previous findings, showing that judgments were more influenced by

30
incongruent social information in Japanese than in European Canadians. In the neural domain, I
expected that: 1) an N400 incongruity effect would be shown for Japanese, but not for European
Canadians, and that 2) individuals’ social orientation beliefs would help explain differences in
N400 incongruity effects, as was seen in recent related cultural ERP studies (e.g., Goto et al.,
2010; 2013; Lewis et al., 2008). I also explored if: 3) there were later occurring processing
differences in the form of an LPC incongruity effect for the Japanese group, and 4) if a N2
incongruity effect was seen for North Americans, in lieu of N400/LPC differences, suggesting
that they at least noticed incongruent social context.
3.2 Methods
3.2.1 Participants
I recruited 42 European Canadian undergraduate students (21 Females, 21 Males; Ages
18.9±2.7, range=17–34 years) from the University of Alberta and 42 Japanese undergraduate
students (24 Females, 18 Males; Ages 20.4.±4.1, range=18–38 years) from Kobe University.
European Canadian participants earned partial course credit and Japanese participants received
an honorarium ($10 - $12) for their participation. Both written and oral instructions were
provided in English for European Canadian participants and Japanese for Japanese participants.
English instructions and questionnaires were translated to Japanese and back-translated to
English by two fluent bilingual English/Japanese speakers (Brislin, 1976).
3.2.2 Face Lineup Stimuli
Task stimuli consisted of lineups of five persons’ faces with one center face surrounded
by two background faces on each side. The center person was either happy or sad, and the
background people were all either happy or sad. Happy and sad emotions were chosen based on
the fact that cultural differences in emotion processing for prior face-lineup studies were clearest

31
for these emotions (vs. anger; Masuda, Ellsworth et al., 2008). Lineups with similar emotions
(i.e., the center person and the background people were happy) were classified as congruent, and
lineups with differing emotions (i.e., the center person was sad, but the background people were
happy) were classified as incongruent (see Figure 5 for example stimuli). I included 64 images
total from the Masuda et al. (2012) and Masuda, Argo, Hioki, & Ito (2015) studies, where
images were validated to be clearly and equally understood between European Canadian and
Japanese students in pilot studies (Lineups contained: 32 Caucasian and 32 Japanese lineups, 32
male and 32 female center models, 32 happy and 32 sad expressions for center persons, and 32
happy and 32 sad expressions for background people)3. I also selected four other lineups
representing all foreground-background emotion combinations (i.e., happy-happy, sad-happy,
etc.) for practice images.
Besides the practice images, the task contained 64 different image combinations with 32
congruent images (16 happy (center) - happy (background) and 16 sad - sad) and 32 incongruent
images (16 sad - happy and 16 happy - sad). Participants were assigned to one of two pseudo-
random orders of presentation for lineups, where images were arranged such that no more than
two congruent or incongruent images were presented sequentially, and the center models for any
two sequentially presented images were not the same.
3.2.3 Procedure
Sessions took place in electrically shielded rooms at the University of Alberta and Kobe
University. After providing consent and being prepped for EEG data collection, participants were
seated 55cm from a square 19” LCD monitor that displayed the face lineup task from a computer
running E-prime 2.0 Professional (Psychology Software Tools Inc., Pittsburgh, PA). Participants
then engaged in the task while EEG data were recorded simultaneously on a separate computer

32
through Acknowledge 4.0 (Biopac Systems Inc., Goleta, CA). The same EEG system was used
in both locations. Participants were told that their task was to rate the emotion of the center
person as fast as possible by pressing keys (with both hands) on a keyboard, first rating how
positively they perceived the center person’s emotional state, and then rating how negatively
they perceived the center person’s emotional state, by referring to a 10 point Likert scale (0=not
at all to 9=extremely). After eight practice trials, participants made 64 judgments, with a two
minute break provided at the mid-point of these judgments. On completion, participants
answered demographic and survey questions, before being debriefed and dismissed.
Figure 5: a. (top) Trial timing diagram for the face emotion rating task. Backgrounds were black
in actual trials. b. (bottom) Example face emotion rating task stimuli, for the congruent (happy
(center) – happy (background) and sad – sad) and the incongruent conditions (happy – sad, and
sad – happy).

33
3.2.4 Trial Timing
Each trial started with a fixation cross (+) for 1000 ms, followed by the presentation of a
face lineup image for 4000 ms. At this point, face lineups continued on the screen while
participants were provided a rating bar displaying which type of rating to make. First,
participants made positive ratings, followed by negative ratings4. Ratings were scaled from
(0=not at all to 9=extremely) for both the positive and negative ratings. If participants took more
than 5000ms for either rating, the trial automatically proceeded to the next rating or step. Finally,
participants were provided with a short break between trials to rest their eyes, set as a random
interval between 1500 to 2500 ms (see Figure 5 for trial timing diagram).
3.2.5 Electroencephalography (EEG) Recording, Preprocessing, and Analyses
EEG data were recorded using the same low-density 9-channel Biopac Systems Inc.
amplifier (MP150; EEG100C) and electro-cap system (CAP100C) in Canada and Japan, with
EEG signals recorded at electrodes F3, Fz, F4, C3, Cz, C4, P3, Pz, and P4, as well as one vertical
eye-blink electrode set above and below the right eye (recorded through an EOG100C amplifier).
EEG system amplification was set to a gain of 10,000 and sampled at 1,000 Hz, and electrode
impedance reduced to below 7 kΩ. Data were analyzed by custom MATLAB scripts in
conjunction with the open-source EEGLAB toolbox (Delorme & Makeig, 2004;
http://sccn.ucsd.edu/eeglab). Output EEG signals were initially referenced to a forehead
electrode and online filtered with analog filters between 0.1 and 35 Hz. After data collection,
EEG signals were average re-referenced and digitally bandpass filtered between 0.5–30 Hz.
Artifacts were corrected by Independent Component Analysis (e.g., Hoffman & Falkenstein,
2008; Makeig, Bell, Jung, & Seinowski, 1996), with data with increased signal to noise ratios
(i.e., as seen by poor Individual Components) first put through an automatic BSS Sobi algorithm

34
to decrease noise (Begam & Thilakavathi, 2014). Finally, trials that deviated greater than 100 µV
from baseline or strongly from other preprocessed trials were rejected.
For analyses, trials were epoched 200 ms pre- to 700 ms post-presentation of the initial
4000 ms display of the lineup stimulus (see Figure 5), with trials baseline-corrected to the 200
ms preceding stimulus presentation. The N400 was quantified by taking the mean voltage at
electrode Cz for the 350 to 500 ms time window. This time window was based on previous
literature, as well as an initial peak picking analysis (e.g., Kutas & Federmeier, 2011). The LPC
was quantified by taking the mean voltage at electrode P4 for the 500 to 700 ms time window.
P4 was chosen as it was the maximal point for parietal LPC differences (Picton et al., 2000).
Finally, inspecting the output waveforms, the N2 was noted to be most apparent in frontal and
parietal electrodes, with the parietal electrodes being opposite polarity of frontal electrodes. As
such, the N2 was quantified by taking the mean voltage by averaging electrodes F3, Fz, and F4
with the P3, Pz, P4 electrodes (the parietal electrodes were multiplied by minus one to correct for
their reversed polarity) for the 225 to 300 ms time window. Statistical analyses were carried out
using Matlab 7.1 (MathWorks, Natick, MA, USA) and SPSS Statistics for PC, Release Version
18.0.0 (SPSS, Inc., 2009, Chicago, IL). Participants with fewer than 45 surviving trials (and less
than 20 per each condition) or a lack of sufficient Individual Components were removed from
final analyses. This resulted in a loss of 4 participants for the European Canadian group and 3
participants for the Japanese group, leaving 38 European Canadians (17 Females and 21 Males)
and 39 Japanese (22 Females and 17 Males) for ERP analyses.
3.2.6 Cultural Beliefs: Independent and Interdependent Social Orientation
As measures of individuals’ independent and interdependent social orientation beliefs,
participants were administered a 23-item social orientation scale (13 independence items and 10

35
interdependence items) based on Kim, Kim, Kam, & Shin (2003). An English version was
provided to European Canadian participants, and a Japanese version was provided to Japanese
participants. Participants rated each item on a Likert-scale ranging from 1 (Strongly disagree) to
7 (Strongly agree). Sample items for the independence sub-scale are, “I enjoy being admired for
my unique qualities,” and “I prefer to be self-reliant rather than dependent on others,” and
sample items for the interdependence sub-scale are, “I am careful to maintain harmony in my
group,” and “I act as fellow group members prefer I act,” see Appendix A for items. Reliabilities
for each sub-scale were satisfactory (Independence sub-scale: European Canadians, Cronbach’s
α = .746, Japanese, α = .813; Interdependence sub-scale: European Canadians, α = .821,
Japanese α = .712).
3.3 Results
3.3.1 Behavioral Data: Emotion Ratings
I collapsed all model factors (i.e., model gender, culture group, etc.) for target lineups and
focused on analyses of participants’ ratings during the congruent and incongruent conditions. I
further averaged positive ratings of central happy faces with negative ratings of central unhappy
faces [which were split in previous studies’ analyses, but showed similar patterns; note that no
interaction between positive and negative rating incongruity effects were found for this study, p
> .3] for both the congruent and incongruent conditions. In a mixed 2 (Culture: European
Canadians and Japanese) X 2 (Condition: Congruent Lineups vs. Incongruent Lineups) repeated-
measures ANOVA, with ratings as the measure, I found a significant main effect of Condition,
F(1, 82) = 36.27, p < .001, = .31. In general, participants showed influence from social
incongruence (Congruent M = 7.26, SD = .90, Incongruent M = 6.19, SD = 1.38). However, this
effect was qualified by an interaction between Culture and Condition, F(1, 82) = 7.41, p < .01,

36
= .083. The results of simple effects analyses revealed that while European Canadians
showed influence of social incongruence in their ratings; t(41) = 3.17, p < .005, this influence
was stronger for Japanese; t(41) = 5.12 , p < .001 (see Table 2 for means and SDs). The main
effect of Culture was not significant (p > .1). This interaction replicates previous findings
(Masuda et al., 2012; Masuda, Ellsworth et al., 2008).
3.3.2 ERP/N400 Analyses
To yield sufficient trial quantities for the ERP analyses, I collapsed all model factors and
focused on the ERP averages of the congruent and incongruent conditions (see Figure 6 for 9
electrode grand-averaged waveforms, and Figure 7 for larger grand-averaged waveforms at Cz).
In an initial analysis, I found a main effect of culture on the mean amplitude of N400 ERPs
during the 350 to 500 ms time window, t(75) = 2.78 , p < .01, reflecting that European Canadians
generally had larger N400s than Japanese (European Canadians M = -1.75 µV, SD = .78,
Japanese M = -1.25 µV, SD = .78).
More importantly, to focus on my hypothesized condition differences, I created N400
difference waves by subtracting the averaged incongruent ERP waveforms from the congruent
ERP waveforms at electrode Cz for the 350-500 ms time window (see Figure 8 for difference
waveforms; e.g., Luck 2005). Comparing N400 difference waves for each culture, an
independent samples t-test revealed a difference in N400 processing, t(75) = 2.02 , p < .05.
Further analyzing this difference with one-sample t-tests for each culture (comparing the
difference waves to 0), revealed that European Canadians did not show a difference in N400
processing for the two conditions, t(37) > -1, ns, but that Japanese did, t(38) = 2.16 , p < .05,
reflecting stronger N400 processing for incongruent face lineups (see Table 2 for Means and
SDs). This conceptually replicates previous findings that showed cultural differences in social

37
attention behaviors (Masuda et al., 2012; Masuda, Ellsworth et al., 2008), and adds that early
neural patterns for social tasks are also influenced by cultural differences in attention, with
Japanese only processing social incongruence as meaningful.
3.3.3 ERP/LPC Analyses
Exploring LPC differences, I again collapsed all model factors and focused on the ERP
averages of the congruent and incongruent conditions (see Figure 6 for grand-averaged
waveforms, and Figure 7 for larger grand-averaged waveforms at P4). In an initial analysis, I did
not find a main effect of culture on the mean amplitude of LPC ERPs during the 500 to 700 ms
time window.
More importantly, to focus on my hypothesized condition differences, I created LPC
difference waves by subtracting the averaged incongruent ERP waveforms from the congruent
ERP waveforms at electrode P4 for the 500-700 ms time window (see Figure 8 for difference
waveforms; e.g., Luck 2005). Comparing LPC difference waves, an independent samples t-test
revealed a difference in LPC processing between cultures, t(75) = 2.22 , p < .05. Further
analyzing this difference with one-sample t-tests within each culture (comparing the difference
waves to 0), revealed that European Canadians did not show a difference in the LPC between the
two conditions, t(37) > -1, ns, while Japanese did, t(38) = 2.60, p < .05, reflecting more LPC
processing for incongruent face lineups (see Table 2 for Means and SDs) . This finding is novel
and suggests that meaning-based processing differences for the Japanese continued into the 500-
700 ms time range, reflecting continued attention to and processing of social incongruence.

38
Figure 6: Congruent and incongruent condition grand averaged ERP waveforms for European
Canadians (top 9 electrodes) and Japanese (bottom 9 electrodes) for electrodes F3, Fz, F4, C3,
Cz, C4, P3, Pz, & P4. Probe stimulus onset was at t=0 ms, and the 200-ms pre-stimulus baseline
is also shown.
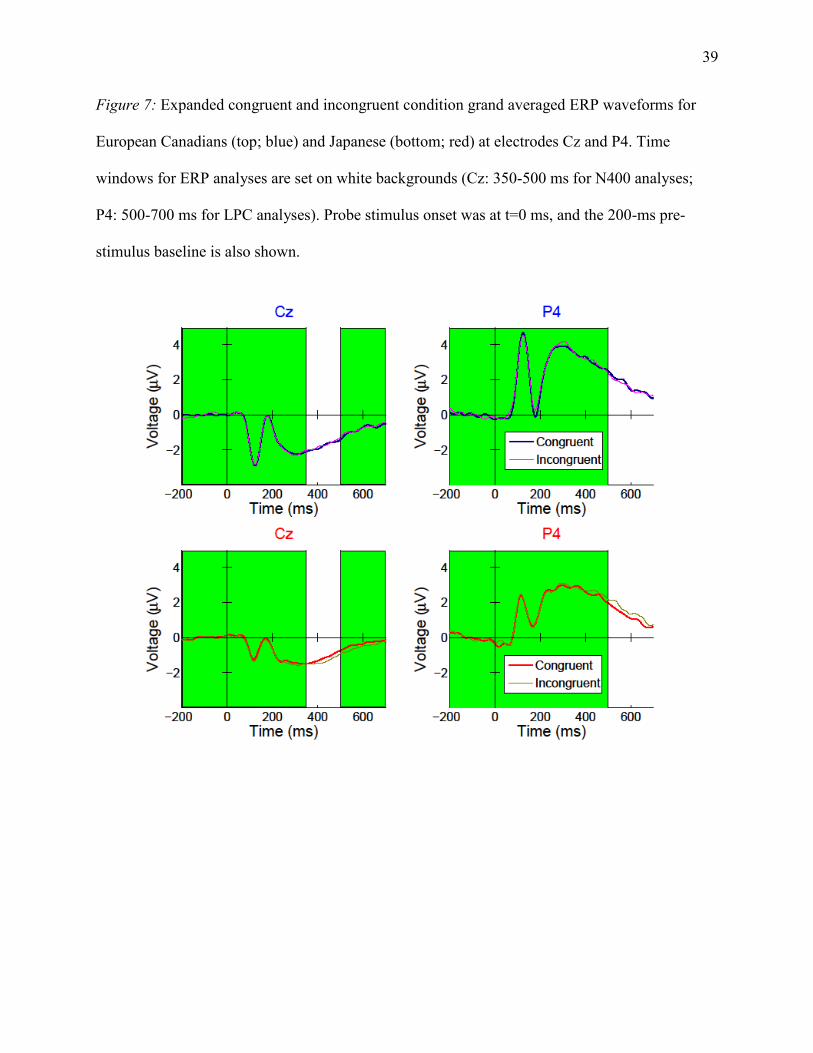
39
Figure 7: Expanded congruent and incongruent condition grand averaged ERP waveforms for
European Canadians (top; blue) and Japanese (bottom; red) at electrodes Cz and P4. Time
windows for ERP analyses are set on white backgrounds (Cz: 350-500 ms for N400 analyses;
P4: 500-700 ms for LPC analyses). Probe stimulus onset was at t=0 ms, and the 200-ms pre-
stimulus baseline is also shown.

40
Figure 8: Difference waves (congruent condition minus the incongruent condition) for European
Canadians and Japanese at electrodes Cz, P4, and the averaged frontal (F3, Fz, and F4) and
parietal N2 electrodes (P3, Pz, and P4; parietal electrodes were multiplied by -1). Time windows
for ERP analyses are set on white backgrounds (Cz: 350-500 ms for N400 analyses; P4: 500-700
ms for LPC analyses; Average N2: 225-300 ms for N2 analyses). Probe stimulus onset was at
t=0 ms, and the 200-ms pre-stimulus baseline is also shown.

41
Table 2
Means (standard deviations) for ratings (top), N400 difference waves (bottom-left), LPC
difference waves (bottom-center), and N2 difference waves (bottom right), as a function of
culture and condition.
Average Ratings (from 0-9)
Culture Congruent Incongruent
European
Canadians 7.11 (.79) 6.53 (1.04)
Japanese 7.40 (.98) 5.86 (1.60)
Culture
N400 Difference
Wave (µV)
(Congruent -
Incongruent)
LPC Difference
Wave (µV)
(Congruent -
Incongruent)
N2 Difference
Wave (µV)
(Congruent -
Incongruent)
European
Canadians
-.043 (.43) .064 (.69) .30(.92)
Japanese .17 (.49) -.28 (.67) -.09(1.40)
3.3.4 ERP/N2 Analyses
Finally, exploring N2 differences, I collapsed all model factors and focused on the ERP
averages of the congruent and incongruent conditions, averaging over the 6 described electrodes
(F3, Fz, F4, and the negative of P3, Pz, and P4 electrodes; see Figure 6 for overall grand-
averaged waveforms). In an initial analysis, I did not find a main effect of culture on the mean
amplitude of N2 ERPs during the 225 to 300 ms time window.

42
Next, focusing on my hypothesized condition differences, I created N2 difference waves
by subtracting the averaged incongruent ERP waveforms from the congruent ERP waveforms,
for the averaged frontal and rear electrode data (for the 225-300 ms time window; see Figure 8
for N2 difference waves). Comparing N2 difference waves for each culture, an independent
samples t-test did not show a significant difference of culture in N2 processing, t(75) = 1.45, p
= .15. However, as my hypothesis focused on whether or not North Americans notice context
(and less about the cultural difference), I proceeded to investigate cultural patterns in N2
processing with one-sample t-tests within each culture (comparing the difference waves to 0). In
this analysis, I found that while European Canadians did show a near significant difference in N2
processing for the two conditions, t(37) = -2.00, p = .052, the Japanese did not, t(38) = .43, ns.
This suggests that European Canadians may have at least noticed the incongruent context early
(see Table 2 for Means and SDs). Conversely, the lack of N2 processing for Japanese may relate
to the fact that the N400 and LPC ERP components are much larger, and ERP components are
known to affect other components (e.g., Luck, 2005).
This result is interesting when paired with the N400 and LPC data; it might suggest that
while European Canadians did not engage in later semantic processing of incongruent social
context, they did seem to at least notice the incongruence early on.
3.3.5 Cultural Beliefs and Incongruity Effects
As previous studies have shown relationships between social orientation beliefs and the
magnitude of N400 incongruity effects, I then explored the relationship between social
orientation beliefs and our observed neural incongruity effects (e.g., Goto et al., 2010; 2013;
Lewis et al., 2008; Na & Kitayama, 2011). I calculated three incongruity measures: 1) the N400
incongruity effect, as the difference wave computed by subtracting incongruent N400 waveforms

43
from congruent waveforms (with a positive score denoting stronger N400 processing for
incongruent lineups), the 2) the LPC incongruity effect, as the difference wave computed by
subtracting congruent LPC waveforms from incongruent waveforms (with a positive score
denoting more LPC processing for incongruent lineups), and 3) the N2 incongruity effect, as the
difference wave computed by subtracting incongruent N2 frontal and parietal averages from
congruent waveforms (with a positive score denoting stronger N2 processing for incongruent
lineups).
I then quantified differences in independence and interdependence social orientation
beliefs for the two groups. Using an independence samples t-test, testing for differences in
independence beliefs between the two cultures, I found a significant difference between the two
cultures’ independence social orientation beliefs, t(81) = 3.17, p < .01 (European Canadian M =
5.46, SD = .73; Japanese M = 4.97, SD = .68). In contrast, there was no difference between
cultures for interdependence social orientation beliefs (European Canadian M = 4.50 SD = .70;
Japanese M = 4.42 SD = .90). These findings replicate previous findings, showing cultural
differences in social orientation (e.g., Markus & Kitayama, 1991), while suggesting that these
differences might be more salient in the independence social orientation domain.
Finally, I investigated the relationship between social orientation beliefs (independence
and interdependence) and the three neural incongruity effect measures for possible correlation,
mediation, and moderation effects. I found two such relationships. The first was between
independence social orientation beliefs and the N400 incongruity effect. Using hierarchal linear
regression to model the interaction of culture and independence social orientation beliefs on the
prediction of the N400 incongruity effect, I found a significant interaction, b = 2.00, p < .05.
Breaking down this finding into simple slopes, I found that European Canadians’ independence

44
beliefs showed a negative relationship with the N400 incongruity effect, with more independent
European Canadians showing weaker N400 incongruity effects, R2
= .24, p < .01. No such
relationship was found for the Japanese, R2
=.001, p > .5 (see Figure 9; Note that one outlier was
excluded from the moderation analysis due to it being greater than 3 standard deviations from
regression lines. However, both with and without this outlier, the moderation interaction was still
significant).
The second relationship of interest was a significant negative correlation between the
LPC incongruity effect and independence social orientation beliefs, r(76) = -.23, p < .05.
Regardless of cultural group, individuals with greater independence beliefs showed weaker LPC
incongruity effects. No correlations were found between the N2 incongruity effect and social
orientation beliefs.
The moderation finding on the N400 replicates previous findings in North American
contexts showing a relationship between social orientation beliefs and N400 incongruity effects
in European American and Asian American populations (e.g., Goto et al., 2010; 2013; Lewis et
al., 2008; Na & Kitayama, 2011). However, that social orientation beliefs did not qualify the
Japanese participants’ N400 incongruity effect is novel, perhaps suggesting something different
about the Japanese processing patterns for this task. Nevertheless, as social orientation beliefs
and neural patterns did align for LPC processing, it may instead be that this relationship is seen
later for Japanese in this paradigm, as it is more complicated than previous tasks (e.g., Goto et al.,
2010; 2013; Lewis et al., 2008; Na & Kitayama, 2011).

45
Figure 9: Simple slopes using independence social orientation beliefs to predict N400 difference
waves over the 350 to 500 ms time window at Cz (positive values reflect N400 incongruity
effects), for European Canadians and Japanese.
3.4 Discussion
3.4.1 Summary and Implications
In summary, I found that culture affects how people process face-lineup tasks.
Replicating previous behavioral findings, Japanese showed more influence from social
incongruence in their ratings than European Canadians (Masuda et al., 2012; Masuda, Ellsworth
et al., 2008). In terms of neural processing, European Canadians did not show a difference in
how they engaged in meaning-based processing of social congruence and incongruence, but
Japanese did. That is, only Japanese showed increased social incongruence processing, as
evidenced by stronger earlier (N400) and later (LPC) meaning-based processing ERPs.

46
Furthermore, independent social orientation beliefs moderated these neural processing patterns
for earlier N400 neural processing: Independence beliefs explained European Canadians’ earlier
processing patterns, but not Japanese. However, independence social orientation beliefs
correlated with neural processing patterns for both culture groups’ later meaning-based neural
processing, with less independent individuals generally showing stronger LPC incongruity
effects. Finally as one nuance of these findings, while European Canadians did not show
differences in meaning-based processing, they did seem to at least notice social incongruence
(seen through the N2).
Overall these patterns suggest that cultural differences in modes of attention are also seen
in the neural domain for social tasks. Even in the brain’s early processing of face lineups,
cultural differences emerged, with North Americans noticing but tending to not place meaning
on social incongruence, and East Asians placing meaning on this social context5. I maintain that
these brain patterns are partially attributable to differences in social orientation between the two
cultures: North Americans are independent, placing value on uniqueness from others, and
therefore tending to not place meaning on social incongruence, and East Asians are
interdependent, placing value on harmony with others, and therefore, being generally more likely
to process social incongruence as a potential threat (e.g., Ito et al., 2014; Kim et al., 2008).
3.4.2 Limitations and Future Research
Although the interaction pattern for the behavioral data replicates previous findings
(Masuda et al., 2012; Masuda, Ellsworth et al., 2008), in contrast to these studies, which did not
show an influence for North Americans, I found that both groups were significantly influenced
by social incongruence. As a possible explanation for this difference, I offer that the reason that
European Canadians also showed an influence from background emotion context may be due to

47
the fact that I combined face lineup stimuli from two studies (Masuda et al., 2012; Masuda et al.,
2015). As one key difference in the two studies, while the first contained lineups in casual
clothing (Masuda et al., 2012), the second study contained lineups in business suits (Masuda et
al., 2015). This mixing may have increased attention to the relationship between persons,
resulting in an influence from background figures in both cultures, although the influence from
social context was still stronger for Japanese.
Also, I should note that I did not find that the rating incongruity effect was correlated
with any ERP incongruity effects (or social orientation). I reason that while the current paradigm
encouraged participants to process stimuli as fast as possible, rating decisions were not
necessarily completed during the initial face lineup viewings that corresponded in time to the
target ERPs. As such, I consider the elicited ERP patterns to reflect attentional and cognitive
processes that occurred earlier than what is required by the face lineup task’s eventual judgment.
This is an important limitation of ERP research in that it reflects regular, relatively early
perceptual/cognitive processes. Future studies should attempt to comprehensively capture
multiple stages of social cognitive processes with other brain measures that might better address
later time periods, such as electroencephalography (EEG) oscillations or fMRI (e.g., Kitayama &
Park, 2010; Klimesch, 2012). Another limitation of the current design was that participants were
required to make two judgments (both positive and negative) for each face lineup, and in a set
order. This order may also be partially responsible for the lack of a relationship between brain
and behavior, as well as possibly affecting how the two cultural groups processed the face lineup
stimuli. To solve this possible confound, future research should either counterbalance the order
of these judgments or have participants make simpler, single judgments.

48
Finally, I should note that while the trial quantities in the current study were sufficient for
N400 and LPC ERPs, they were underpowered for the N2 (e.g., Luck, 2005). This is likely
responsible for why European Canadians only showed marginal N2 incongruity effects in the
current design. In such, future studies should increase trial numbers to see if significant cultural
differences in N2 incongruity effects emerge. In addition, future designs could also target the
N170, as it is related to face processing, which may relate to the task.
3.4.3 Face Lineup Tasks and Social Orientation
This study gives evidence that social orientation differences also affect social attention
neural patterns. Whereas the more interdependent Japanese tend to process incongruent social
context as meaningful, the more independent European Canadians do not. These findings are
important for social orientation theory as social orientation differences are thought to generate
general attention differences (e.g., Varnum et al., 2010), making it critical that cultural
differences in attention also hold for social attention. In addition to these findings, I found
evidence that cultural differences in attention may not relate to whether or not people notice
social context. Regardless of the fact that European Canadians’ did not process social
incongruence as meaningful, I found evidence that they still noticed it. Rather it seems that the
key cultural difference may be in later cognitive processing stages, affecting whether or not
people place meaning on this context. This pattern conceptually replicates the pattern seen for
the non-social memory task in Chapter 2 (Masuda et al., 2014), suggesting that both cultures
process non-social and social contextual cues, but that culture affects how individuals place
meaning on or use this context.
Beyond these findings, one surprising discovery was that European Canadians also
showed influence in their rating behaviors from incongruent background faces, which was not

49
seen in the Masuda et al., (2012) and Masuda, Ellsworth et al., (2008) studies. As the current
study also included people in business suits, it is possible that this changed the relationship
perceived between center and background faces, influencing how people take into account social
context. To explore this issue, I decided to pursue a final project investigating if the framing of
the relationship between center and background faces affected social attention neural patterns.
Chapter 4: Culture, Relational Tasks, and the Brain
4.1 Introduction
In fact, a plethora of research suggests that both cultures are influenced differentially by
different types of relationships (e.g., Arriaga, 2013; Doi, 1973; Heine, 2008; Hwang, 1987;
Markus & Kitayama, 1991; Wegner et al., 1985), and even recent social orientation models
include relationships as a part of the key differences between the independent and interdependent
selves (e.g., Heine, 2008). In his recent social orientation model, Heine proposed that
independent and interdependent cultures place differing importance on various types of
relationships. In particular, independent cultures place close relationships as very important in-
group members (i.e., people that matter) and acquaintances as much less important, holding them
as between in-group and out-group (i.e., people that do not matter). Conversely, interdependent
cultures place close relationships as very important in-group members, so relationally
intertwined that people mix identities with their close others. Furthermore, they also place
acquaintances as important in-group members, although they do not mix selves.
This Heine (2008) model in mind, I expected that cultural differences in social orientation
might differentially affect how North Americans and East Asians process social context from
close and acquaintance relationships.

50
4.1.1 Culture and Close Others
Based on the Heine (2008) social orientation model, I expected that North Americans
should care about social context from close relationships, as they consider close others as very
important. Along these lines, previous research gives support that North Americans care greatly
about close others (e.g., Arriaga, 2013; Wegner et al., 1985). In terms of how people are seen to
affect each other in close relationships, this influence is considered vast to “the extent to which
partners affect each other (being) profound and pervasive,” and such that, both thoughts,
emotions, and lives become intertwined (e.g., Arriaga, 2013; Wegner et al., 1985). Ironically
this research also terms close relationships to be ‘interdependent’, although this is not the
interdependence we refer to for social orientation. Basically, this ‘interdependence’ is where
North Americans share their lives with their close others, allowing influence from each other’s
thoughts and emotions.
However, Heine’s (2008) social orientation model is not as clear about East Asians’ close
relationships. What it states is that one key factor of East Asian interdependent cultures is that
they place close relationships as very important, mixing identities with their close others. Based
on this, we could hypothesize that East Asians might show an extreme caring for social context
from close relationships, because they are so close. However, we could also hypothesize that
East Asians would not care about this context, because they do not differentiate each other as
being separate. Looking to other literature on East Asian’s close relationships, there is support
for the latter, with East Asian cultures sharing similar beliefs about how to treat close others (e.g,
Doi, 1973; Hwang, 1987). In terms of Japanese culture, Doi (1973) proposed that one key aspect
of the Japanese psyche is that they need to have forums to experience Amae with their close
others, where they could have freedom from holding back (i.e., Enryo) and be spoiled. In fact,

51
Doi argued that this was such an essential part of healthy Japanese life that a lack of Amae would
lead to negative psychological outcomes, perhaps due to the intense expectations on behaviors
outside of these relationships. Similarly, Chinese Confucian principles place importance on
‘favoring the intimate’ (e.g., Hwang, 1987). This ‘favoring the intimate’ refers to the notion that
people do not need to hold back with close others, expressing thoughts and feelings more freely.
Based on the above theory, I expected that North Americans would pay careful attention
to social context from close others, as their cultural values endorse mutual influence from each
other’s thoughts and feelings, but that East Asians would not place as much meaning on social
context from close others, as close relationships are ‘favored,’ held as sanctuaries from having to
worry about holding back. In contrast, I expected that these patterns would reverse for
acquaintances.
4.1.2 Culture and Acquaintances
For acquaintances, the Heine (2008) model offers a simple explanation of how North
Americans and East Asians should care about social context. Because the model proposes that
acquaintances are placed as more important for interdependent cultures than for independent
cultures, we should expect that East Asians (as an interdependent culture) would attend more to
social contextual cues for acquaintances than North Americans (as an independent culture).
Reinterpreting previous findings, we see support for this notion, as the previous face lineup tasks
implied acquaintance relationships, such as classmates (Masuda et al., 2012; Masuda, Ellsworth
et al., 2008; Russell et al., 2015) or coworkers (Russell et al., 2015). These thoughts in mind, I
expected that only East Asians would care about social context for acquaintances. Contrasting
with my expectations for close relationships, these patterns would suggest that social attention
52
differences are best in line with cultural differences in general attention for acquaintances (e.g.,
Varnum et al., 2010).
To test my expectations for the two relationships, I compared neural patterns during a
relational task, which followed a similar setup to previous face lineup tasks, where participants
rated center face’s emotions, when these faces were surrounded by congruent (the same
emotions) or incongruent emotions (different emotions; Masuda et al., 2012; Masuda, Ellsworth
et al., 2008; Russell et al., 2015). To focus on key relationships, face lineups were termed to be
people in either close or acquaintance relationships.
4.1.3 Relational Judgments and the N400
For neural patterns, I again focused my analyses on the N400. For the current study, I
expected that I would replicate previous findings from Russell et al. (2015) for acquaintance
relationships, with only East Asians experiencing an N400 incongruity effect, reflecting that they
processed the incongruent emotions early as meaningful for this relationship. Conversely, for
close relationships I expected no N400 incongruity effect for East Asians, as their cultural values
stress dropping their guard around close others, which should allow them to avoid placing
meaning on incongruent social context (e.g., Doi, 1973; Hwang, 1987). In contrast, I expected a
N400 incongruity effect for North Americans, as their cultural values favor experiencing
influence from close others (e.g., Arriaga, 2013; Wegner et al., 1985), likely leading them to
place meaning on the social context.
4.1.4 The N2
I was also interested in exploring whether early conflict monitoring processes were seen
through N2 incongruity effects, especially in lieu of N400 incongruity effects, as such was found
in my previous study (Russell et al., 2015). My thoughts were that it would be possible that

53
people show N2 incongruity effects, even if they lacked N400 incongruity effects, suggesting
that they at least noticed background incongruence, whether or not they processed it as
meaningful. This would replicate Chapter 3’s findings, suggesting that N400s and N2s can
reflect independent processes (Russell et al., 2015).
4.1.5 Hypotheses
Extending previous findings, revealing cultural differences in neural patterns during the
face lineup task that were in line with social orientation theory (Russell et al., 2015; Varnum et
al., 2010), I investigated if neural patterns depended on the relationship faces in lineups had with
surrounding others. I assumed that previously found N400 neural patterns would hold for
acquaintance relationships, showing that only East Asians process incongruent social context for
acquaintances as meaningful (and not North Americans), due to East Asians placing
acquaintances as more important (e.g., Heine, 2008; Russell et al., 2015), but reverse for close
relationships, because East Asians hold cultural beliefs that their guard can be dropped in close
relationships (i.e., Amae & “Favoring the intimate”), allowing them to not have to process
incongruent context early as meaningful (e.g., Doi, 1973; Hwang, 1987). Conversely, I assumed
North Americans would show an N400 incongruity effect for close relationships, as their culture
stresses allowing influence from close others, likely requiring them to place meaning on these
others’ emotional cues (e.g., Arriaga, 2013; Wegner et al., 1985).
To test these notions, I had European Canadians and Japanese engage in a relational task
while collecting ERP data. Using a novel paradigm based on the face-lineup task (Masuda et al.,
2012; Masuda, Ellsworth et al., 2008; Russell et al., 2015), participants were asked to rate a
center person’s emotions when they were surrounded by others with congruent (i.e., the same) or
incongruent (i.e., different) emotions, while keeping the designated relationship between center

54
and surrounding faces in mind (either close or acquaintance). In terms of neural patterns, I
expected that for acquaintance relationships (Hypothesis 1), an N400 incongruity effect would be
shown for Japanese, showing additional processing of incongruent (vs. congruent emotions), but
not for European Canadians. Conversely, for close relationships (Hypothesis 2), the N400
incongruity effect would not be seen for Japanese but instead be seen for European Canadians. I
also explored whether N2 incongruity effects were seen for European Canadians and Japanese
across relationships (Hypothesis 3), particularly in absence of N400 incongruity effects, which
would replicate the findings of Chapter 3 (Russell et al., 2015), and if individuals’ social
orientation beliefs helped explain N400/N2 incongruity effects (Hypothesis 4), as associations
have been seen in recent related cultural ERP studies (e.g., Goto et al., 2010; 2013; Russell et al.,
2015).
4.2 Methods
4.2.1 Participants
I collected data from 57 European Canadian undergraduate students from the University
of Alberta and 48 Japanese undergraduate students from Kobe University. For European
Canadians, 29 were assigned to the Close condition (16 Females, 13 Males; Ages 19.1±1.7,
range=18–25 years) and 28 were assigned to the Acquaintance condition (16 Females, 12 Males;
Ages 18.8±1.5, range=17–24 years). For Japanese, 24 were assigned to the Close condition (10
Females, 14 Males; Ages 20.7±1.6, range=18–24 years) and 24 were assigned to the
Acquaintance condition (10 Females, 14 Males; Ages 20.3±2.8, range=18–31 years). In addition,
7 European Canadian (3 Close & 4 Acquaintance) and 10 Japanese (4 Close & 6 Acquaintance)
participants took part in sessions, but were rejected due to data collection issues (i.e., electrode
issues, movement issues, or not following task instructions). European Canadian participants

55
earned partial course credit and Japanese participants received an honorarium (~$10 - $15) for
their participation. Both written and oral instructions were provided in English for European
Canadian participants and Japanese for Japanese participants. To make instructions equivalent,
English instructions and questionnaires were translated to Japanese and back-translated to
English by two fluent bilingual English/Japanese speakers (Brislin, 1976).
4.2.2 Face Lineup Stimuli
Task stimuli consisted of lineups of three schematic faces, with one center face
surrounded by two background faces (1 to each side; see Figure 10 for example images)6. The
center face was happy, sad, or neutral, and the background faces were both happy, sad, or neutral.
I included neutral faces in this study (versus the Happy/Sad format in Chapter 3) to improve data
quality; these neutral faces worked as a baseline for happy/sad emotion judgments and varied the
task in an effort to increase task concentration, which can improve ERP quality (Luck, 2005).
Lineups with similar happy/sad emotions were classified as congruent (i.e., the center face and
the background faces were happy), and lineups with differing happy/sad emotions were
classified as incongruent (i.e., the center face was sad, but the background faces were happy). On
the other hand, neutral lineups only came in three varieties (i.e., center face was neutral and the
background faces were happy, sad, or neutral) as these lineups were not targets of analyses and
were only included to increase task rating/ERP quality.
Types of lineups were randomized with E-prime 2.0 Professional (Psychology Software
Tools Inc., Pittsburgh, PA) between sets of 11 lineups, consisting of eight happy/sad lineups (i.e.,
two sets consisting of all four combinations of happy/happy, happy/sad, sad/happy, and sad/sad)
and three neutral lineups (i.e., one set of the three neutral types explained above). In total,
besides two practice rounds, which each involved presentations of one set of lineups (each

56
consisting of 11 lineups), the actual task involved 132 lineup presentations. These 132 lineups
consisted of 48 congruent lineups (24 happy (center) - happy (background) and 24 sad - sad), 48
incongruent lineups (24 sad - happy and 24 happy - sad), and 36 lineups involving neutral faces
(12 for each of the three types).
4.2.3 Procedure
Sessions took place in electrically shielded rooms at the University of Alberta and Kobe
University. After providing consent and being prepped for EEG data collection, participants were
assigned to either the close or acquaintance condition, and seated approximately 55cm from a
square 19” LCD monitor that displayed task instructions and stimuli from a computer running E-
prime 2.0 Professional (Psychology Software Tools Inc., Pittsburgh, PA). EEG data were
recorded simultaneously on a separate computer through Acknowledge 4.0 (Biopac Systems Inc.,
Goleta, CA).
Before collecting EEG data, participants were first instructed on the nature of the task
and how/when to make movements. Participants were told that their task was to rate how the
center person would feel (on a scale of 1 to 9 (where 1=very negative, 5=neutral, and 9=very
positive)) if they were surrounded by people of the instructed relationship. Finally, the target
relationship, either close or acquaintance, was described before engaging in practice trials (see
Appendix B for relationship descriptions). After all instructions, participants were provided with
two practice rounds (one untimed & one timed) to become accustomed to the task. At this point,
participants proceeded to the actual task, where participants were asked to rate lineups while
EEG data were collected. At the midway point of these ratings (after 66 ratings), participants
were provided with a short break, at least one minute long. On completion, participants answered
demographic and survey questions, before being debriefed and dismissed.

57
4.2.4 Trial Timing
Each trial included (in order): 1) a reminder of the relationship presented for 1000 ms, 2)
a presentation of a fixation cross (+) for 500 ms, 3) a brief blank screen randomly jittered
between 400 - 800 ms, 4) the presentation of a face lineup for 3500 ms, 5) a rating task screen
(limited to 3000 ms), and 6) a brief blank screen for 1000 ms (see Figure 11 for trial timing).
The rating task did not include a presentation of the face lineup, and the rating task screen (step
#5) disappeared and moved on to the blank screen (step #6) when an answer was provided.
Participants were asked to make decisions on their ratings in their heads when the face lineup
was presented and to make decisions as fast as possible during the rating task screen (step #5).
Figure 10: Example relational task stimuli (top) for the congruent (happy (center) – happy
(background) and sad – sad) and the incongruent conditions (happy – sad, and sad – happy), and
for the (bottom) filler neutral lineups (neutral – neutral, neutral – sad, and neutral – happy).

58
Figure 11: Trial timing diagram (for 1 trial) of the relational task.
4.2.5 Electroencephalography (EEG) Recording, Preprocessing, and Analyses
EEG data were recorded using the same low-density 9-channel Biopac Systems Inc.
amplifier (MP150; EEG100C) and electro-cap system (CAP100C) setups in Canada and Japan,
with EEG signals recorded at electrodes F3, Fz, F4, C3, Cz, C4, P3, Pz, and P4, as well as
vertical eye-blink electrodes set above and below the right eye and horizontal eye-blink
electrodes set to both sides of the right eye recorded through EOG100C amplifiers. EEG system
amplification was set to a gain of 10,000 and sampled at 1,000 Hz, and electrode impedance
reduced to below 7 kΩ. Data were analyzed by custom MATLAB scripts in conjunction with the
open-source EEGLAB toolbox (Delorme & Makeig, 2004; http://sccn.ucsd.edu/eeglab). Output
EEG signals were initially referenced to the right earlobe and online filtered with analog filters
between 0.1 and 35 Hz. After data collection, EEG signals were re-referenced to a mathematical
average of the left and right earlobes and digitally bandpass filtered between 0.5–30 Hz. Eye
movement trials were removed via visual inspection and residual artifacts corrected by Principle
Component Analysis (e.g., Hoffman & Falkenstein, 2008; Luck, 2005). As very noisy electrodes
greatly affect PCA artifact correction, they were dropped before PCA artifact correction and re-
interpolated at the end of preprocessing if necessary. Finally, corrected trials for which voltages
deviated greater than 100 µV from baseline or strongly from others were rejected.

59
For analyses, trials were epoched 200 ms pre- to 700 ms post-presentation of the initial
3500ms display of the lineup stimulus (see Figure 11), with trials baseline corrected to the
200ms preceding this stimulus presentation. The N400 was quantified by taking the mean
voltage at electrode Cz for the 250 to 450 ms time window. This time window was based on
visual inspection and previous literature, with an earlier N400 (than our previous study) likely
due to instruction for participants to make decisions in their head during the face lineup
presentation (e.g., Kutas & Federmeier, 2011; Luck, 2005; Russell et al., 2015). Also, similar to
my previous face lineup study (in Chapter 3; Russell et al., 2015), the N2 was noted to come in
the form of a dipole, strongest in frontal and parietal electrodes, with the parietal electrodes
showing opposite polarity of frontal electrodes. In such, the N2 was quantified by taking the
mean voltage by averaging F3, Fz, and F4 electrodes with the P3, Pz, P4 electrodes (the parietal
electrodes were multiplied by minus one to reverse their polarity) for the 250 to 375 ms time
window, based on visual inspection and typical N2 ranges (e.g., Yeung et al., 2004). Statistical
analyses were carried out using Matlab 7.1 (MathWorks, Natick, MA, USA) and SPSS Statistics
for PC, Release Version 18.0.0 (SPSS, Inc., 2009, Chicago, IL). Participants with fewer than 60
surviving trials (and less than 30 trials per each condition) or a lack of sufficient Principle
Components were removed from final analyses. In addition, participants that had noisy Cz
electrodes were dropped from all analyses as Cz was the main target electrode, and participants
with more than one bad channel in the N2 electrodes were dropped from N2 analyses alone.
4.2.6 Cultural Beliefs: Independent and Interdependent Social Orientation
Individuals’ independent and interdependent social orientation beliefs were assessed with
a 23-item social orientation scale (13 independence items and 10 interdependence items), based
on Kim et al. (2003). An English version was provided to European Canadian participants, and a
60
Japanese version was provided to Japanese participants. Participants rated each item on a Likert-
scale ranging from 1 (Strongly disagree) to 7 (Strongly agree). Sample items for the
independence sub-scale are, “I enjoy being admired for my unique qualities,” and “I prefer to be
self-reliant rather than dependent on others,” and sample items for the interdependence sub-scale
are, “I am careful to maintain harmony in my group,” and “I act as fellow group members prefer
I act,” see Appendix A for items. Reliabilities for each sub-scale were satisfactory across cultures
and conditions (Independence sub-scale: European Canadian Close Cronbach’s α = .756,
Acquaintance α = .768 & Japanese Close α = .875, Acquaintance α = .868; Interdependence sub-
scale: European Canadians Close α = .732, Acquaintance α = .828 & Japanese Close α = .818,
Acquaintance α = .850).
4.3 Results
4.3.1 Behavioral Data: Emotion Ratings
As this study involved only one rating scale, I focused on a single rating measure,
reflecting how much participants perceived center faces to be influenced by incongruent
surrounding faces. This measure was calculated as the difference between participants’ ratings
during the congruent and incongruent conditions, which I call the rating incongruity effect. To
calculate the rating incongruity effect, I took the average of the absolute value of the difference
between congruent and incongruent lineup ratings for each participant (the congruence was
based on the center face’s emotion and averaged between congruence/incongruence subtractions
for happy and sad center emotions). In a 2 (Culture: European Canadians vs. Japanese) by 2
(Condition: Close vs. Acquaintance) ANOVA, with the rating incongruity effect as the measure,
I found a significant main effect of Condition, F(1, 101) = 9.43, p < .01, = .085, revealing
that participants generally reported larger perceived influence from social incongruence in their

61
ratings for the close, than for the acquaintance condition, (Close M = 3.16, SD = 1.64,
Acquaintance M = 2.32, SD = 1.61). I also found a significant main effect of Culture, F(1, 101) =
45.16, p < .001, = .31, revealing that European Canadians generally reported perceiving
more influence from social incongruence than Japanese, (European Canadians M = 3.57, SD =
1.64, Japanese M = 1.76, SD = .99; see Table 3 for means and SDs split by culture and condition,
and Figure 12 for the graph version). The interaction of Culture and Condition was not
significant (p > .3).
While the main effect of culture deviates from previous findings, which showed larger
context effects for East Asians (Masuda, Ellsworth et al., 2008; Masuda et al., 2012; Russell et
al., 2015), I interpret this to be due to this study’s manipulation to make relationships salient—I
explicitly stated that participants should make ratings as if the center person was surrounded by
the others of the instructed relationship, compared to previous studies where participants were
just told to rate the center person’s emotions. Regardless of these patterns, previous culture and
attention neuroscience research has revealed cultural differences in neural attention patterns,
despite behavioral differences or similarities (e.g., Goto et al., 2010; 2013; Russell et al., 2015).
4.3.2 ERP/N400 Analyses
To yield sufficient trial quantities for N400 analyses, I collapsed the ERP averages for the
congruent and incongruent conditions (see figures for 9 electrode grand-averaged waveforms for
the close (Figure 13) and acquaintance (Figure 14) conditions, and Figure 15 for expanded
grand-averaged waveforms at Cz). In an initial analysis, I found a main effect of Culture on the
mean amplitude of N400 ERPs during the 250 to 450 ms time window, F(1, 101) = 4.68 , p < .05,
= .044, reflecting that Japanese generally had stronger (more negative) N400s than

62
European Canadians (European Canadians M = -.57 µV, SD = 1.03, Japanese M = -1.00 µV, SD
= 1.06).
More importantly, to focus on my hypothesized condition differences, I created N400
difference waves by subtracting the averaged incongruent ERP waveforms from the congruent
ERP waveforms at electrode Cz (for the 250-450 ms time window; see Figure 16 for difference
waveforms; e.g., Luck 2005), reflecting the N400 incongruity effect. Using a 2 (Culture:
European Canadian vs. Japanese) by 2 (Condition: Close vs. Acquaintance) ANOVA, with the
N400 difference wave voltage as a measure, I found an interaction of Culture and Condition, F(1,
101) = 11.81 , p < .001, = .11. The main effects of Culture and Condition were not
significant, ps > .3. Breaking down the interaction by condition, I found that for the close
condition European Canadians showed a stronger N400 incongruity effect than the Japanese,
t(34.77) = 2.07 , p < .05, and for the acquaintance condition the Japanese showed a stronger
N400 incongruity effect than European Canadians, t(50) = -2.65 , p < .05. Similarly, breaking
down by Culture, I found that European Canadians showed a stronger N400 incongruity effect in
the close than the acquaintance condition, t(55) = 2.92, p < .001, and Japanese showed a stronger
N400 incongruity effect in the acquaintance than the close condition, t(46) = -2.12 , p < .05.
Finally, to directly investigate the magnitude of this N400 incongruity effect, I compared
the N400 difference wave magnitude to 0 with one-sample t-tests for each culture and condition.
In this analysis, I found that that whereas European Canadians showed a N400 incongruity effect
for the close condition, t(28) = 3.63, p < .001, they did not for the acquaintance condition, t(27) =
-1.14, ns. On the other hand, Japanese did not show a N400 incongruity effect for the close
condition, t(23) = -.46, ns, but did for the acquaintance condition, t(23) = 2.34, p < .05 (see Table
3 for Means and SDs, and Figure 17 for N400 incongruity effect graph). These results follow my

63
hypotheses, giving evidence that for acquaintance relationships only Japanese place meaning on
incongruent social context, replicating previous findings (Russell et al., 2015), but for close
relationships this pattern actually reverses, with only European Canadians placing meaning on
this incongruent social context.
4.3.3 ERP/N2 Analyses
Next, exploring N2 differences, I collapsed the ERP averages of the congruent and
incongruent conditions, averaging over the 6 described electrodes (F3, Fz, F4, and the negative
of P3, Pz, and P4 electrodes; see Figures for 9 electrode grand-averaged waveforms for the close
(Figure 13) and acquaintance (Figure 14) conditions). In an initial analysis, I did not find a main
effect of Culture on the average mean amplitude of N2 ERPs during the 250 to 375 ms time
window.
Focusing on my hypothesized condition differences, I created N2 difference waves by
subtracting the 6 electrode averaged incongruent ERP waveforms from the congruent ERP
waveforms (for the 250-375 ms time window; see Figure 16 for averaged N2 difference waves),
reflecting the N2 incongruity effect. Using a 2 (Culture: European Canadian vs. Japanese) by 2
(Condition: Close vs. Acquaintance) ANOVA, with N2 difference wave voltage as a measure, I
did not find an interaction of Culture and Condition, p = .23, nor main effects of Culture or
Condition, ps > .3.
However, as I wished to explore if N2 incongruity effects were seen across conditions as
part of my hypotheses, I still compared the N2 difference wave magnitude to 0 with one-sample
t-tests for each culture and condition, to directly look at the magnitude of N2 incongruity effects.
In this analysis, I found that that European Canadians showed significant N2 incongruity effects
for both the close condition, t(28) = 2.31, p < .05, and the acquaintance condition, t(27) = 2.64, p

64
< .05. On the other hand, the Japanese did not show an N400 incongruity effect for the close
condition, t(23) = .22, ns, but did for the acquaintance condition, t(22) = 2.01, p < .05 (see Table
3 for Means and SDs, and Figure 18 for N2 incongruity effect graph). Despite this difference in
N2 processing for the two conditions in Japanese, an independent samples t-test comparing
Japanese processing for the two conditions did not show a significant difference, p = .17.
Overall, these findings replicate and extend Chapter 3’s findings, giving evidence that
European Canadians notice social incongruence (seen through N2 incongruity effects in both
conditions), whether or not they actually process this social incongruence as meaningful (Russell
et al., 2015), but that Japanese only process context when they also process it as meaningful.
Figure 12: Graph of rating incongruity effect magnitudes (larger values reflect more perceived
influence from incongruent social context) for each culture and condition. Error bars are based
on standard error values.
0
1
2
3
4
5
Close Acquaintance
Ra
tin
g I
nco
ng
ruit
y E
ffect
European Canadians Japanese

65
Figure 13: Close condition congruent and incongruent condition grand averaged ERP
waveforms for European Canadians (top 9 electrodes) and Japanese (bottom 9 electrodes) for
electrodes F3, Fz, F4, C3, Cz, C4, P3, Pz, & P4. Probe stimulus onset was at t=0 ms, and the
200-ms pre-stimulus baseline is also shown.

66
Figure 14: Acquaintance condition congruent and incongruent condition grand averaged ERP
waveforms for European Canadians (top 9 electrodes) and Japanese (bottom 9 electrodes) for
electrodes F3, Fz, F4, C3, Cz, C4, P3, Pz, & P4. Probe stimulus onset was at t=0 ms, and the
200-ms pre-stimulus baseline is also shown.

67
Figure 15: Expanded congruent and incongruent condition grand averaged ERP waveforms for
European Canadians (top; blue) and Japanese (bottom; red) at electrodes Cz, for the close (left)
and acquaintance (right) conditions. Time windows for N400 analyses are set on white
backgrounds (250-450 ms). Probe stimulus onset was at t=0 ms, and the 200-ms pre-stimulus
baseline is also shown.

68
Figure 16: Difference waves (the congruent condition minus the incongruent condition) for
European Canadians and Japanese at electrode Cz and at averaged N2 frontal (F3, Fz, and F4)
and parietal electrodes (P3, Pz, and P4; parietal electrodes multiplied by -1). Time windows for
ERP analyses are set on white backgrounds (Cz: 250-450 ms for N400; Average N2: 250-375 ms
for N2). Probe stimulus onset was at t=0 ms, and the 200-ms pre-stimulus baseline is also shown.

69
Figure 17: Graph of N400 incongruity effect magnitudes (positive values reflect stronger (more
negative) N400 processing of incongruent social context) for each culture and condition. Error
bars are based on standard error values.
Figure 18: Graph of N2 incongruity effect magnitudes (positive values reflect stronger (more
negative) N2 processing of incongruent social context) for each culture and condition. Error bars
are based on standard error values.
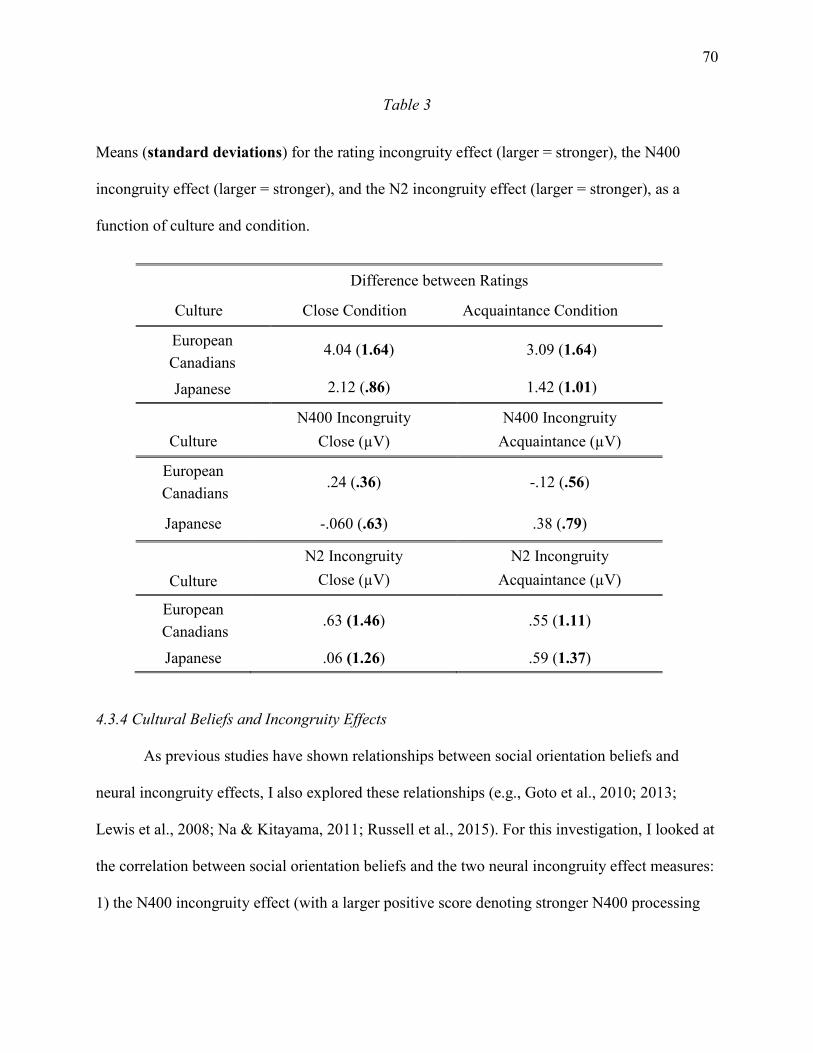
70
Table 3
Means (standard deviations) for the rating incongruity effect (larger = stronger), the N400
incongruity effect (larger = stronger), and the N2 incongruity effect (larger = stronger), as a
function of culture and condition.
Difference between Ratings
Culture Close Condition Acquaintance Condition
European
Canadians 4.04 (1.64) 3.09 (1.64)
Japanese 2.12 (.86) 1.42 (1.01)
Culture
N400 Incongruity
Close (µV)
N400 Incongruity
Acquaintance (µV)
European
Canadians .24 (.36) -.12 (.56)
Japanese -.060 (.63) .38 (.79)
Culture
N2 Incongruity
Close (µV)
N2 Incongruity
Acquaintance (µV)
European
Canadians .63 (1.46) .55 (1.11)
Japanese .06 (1.26) .59 (1.37)
4.3.4 Cultural Beliefs and Incongruity Effects
As previous studies have shown relationships between social orientation beliefs and
neural incongruity effects, I also explored these relationships (e.g., Goto et al., 2010; 2013;
Lewis et al., 2008; Na & Kitayama, 2011; Russell et al., 2015). For this investigation, I looked at
the correlation between social orientation beliefs and the two neural incongruity effect measures:
1) the N400 incongruity effect (with a larger positive score denoting stronger N400 processing
71
for incongruent lineups), and 2) the N2 incongruity effect (with a larger positive score denoting
stronger N2 processing for incongruent lineups).
For this analysis, I first quantified differences in independence and interdependence
beliefs for the two groups for both conditions. Using a 2 (Culture: European Canadian vs.
Japanese) by 2 (Condition: Close vs. Acquaintance) ANOVA, with independence beliefs as a
measure, I found a main effect of Culture, F(1, 101) = 9.65, p < .005, = .087 (European
Canadian M = 5.58, SD = .65; Japanese M = 5.09, SD = .95). I did not find a main effect of
Condition or an interaction of Culture and Condition, ps > .3. Using a similar model, with
interdependence beliefs as a measure, I found no main effects or interactions of Culture and/or
Condition, ps > .17 (European Canadian M = 4.47, SD = .74; Japanese M = 4.61, SD = .91). As a
last analysis, I combined the two scales as a social orientation score (subtracting independence
from interdependence social orientation beliefs), as a score often calculated to reflect overall
social orientation tendencies (e.g., Na & Kitayama, 2011). Using a similar ANOVA model to
the above models, with social orientation scores as the measure, I found a main effect of Culture,
F(1, 101) = 6.18, p < .05, = .058 (European Canadian M = 1.11, SD = 1.11; Japanese M
= .48, SD = 1.49). I did not find a main effect of Condition or an interaction of Culture and
Condition, ps > .3. These findings replicate those showing cultural differences in social
orientation between East Asians and North Americans (Markus & Kitayama, 1991), and suggest
that conditions are comparable within cultures, as no social orientation differences were seen.
Finally, I investigated the relationship between social orientation beliefs (independence
beliefs, interdependence beliefs, and social orientation scores) and the two neural incongruity
effect measures for possible correlation, mediation, and moderation effects. While I found no
mediation or moderation effects, I did find a difference in correlations between incongruity

72
effects and social orientation for the two conditions (see Table 4 for a summary of correlations).
For the close condition, there were no significant correlations between either neural measure;
however, for the acquaintance condition, there was a significant negative correlation between the
N2 incongruity effect and social orientation scores, r(52) = -.32, p < .05. Regardless of cultural
group, individuals with stronger independence beliefs (and weaker interdependence beliefs)
showed weaker N2 incongruity effects. A similar, but non-significant pattern was seen with the
N400 incongruity effect, with social orientation scores relating negatively to N400 incongruity
effects, r(52) = -.20, p = .15.
The correlation between N400 processing and social orientation beliefs for the
acquaintance condition is similar in magnitude and direction to that of the LPC (reflecting later
meaning-based processing) in the face lineup study (Russell et al., 2015), although I lack
sufficient sensitivity in this study to reach significance. This may suggest that meaning-based
processing still weakly relates to individuals’ social orientation beliefs. On the other hand, the
stronger relationship between social orientation and N2 processing gives evidence that conflict
monitoring processes may better reflect individuals’ social orientation beliefs related to this task.
Together these findings add to growing evidence that an individual’s social orientation beliefs
relate to neural patterns (e.g., Goto et al., 2010; 2013; Lewis et al., 2008; Na & Kitayama, 2011;
Russell et al., 2015).

73
Table 4
Correlations between independence beliefs, interdependence beliefs, and social orientation
scores, and the N400 and N2 incongruity effects, collapsed across cultures and split for the close
and acquaintance conditions.
Independence Interdependence Social Orientation
Close Condition Beliefs Beliefs Scores
N400 Incongruity
Effect .163 .076 -.048
N2 Incongruity
Effect -.211 -.012 .121
Acquaintance Independence Interdependence Social Orientation
Condition Beliefs Beliefs Scores
N400 Incongruity
Effect .159 -.168 -.202
N2 Incongruity
Effect .247 ^ -.269 ^ -.318 *
^: p < .08, *: p < .05
4.4 Discussion
4.4.1 Summary and Implications
In summary, I found that relationship type affects how European Canadians and Japanese
process incongruent social contextual cues. For acquaintances (Hypothesis 1), European
Canadians did not show a difference in how they engaged in meaning-based (N400) processing
of social congruence and incongruence, but Japanese did. This pattern replicates previous face
lineup findings (Russell et al., 2015). On the other hand, patterns reversed for close relationships
(Hypothesis 2), with only European Canadians engaging in increased N400 meaning-based
processing of social incongruence. Besides N400 processing, interesting patterns were also seen

74
for N2 conflict monitoring processes (Hypothesis 3). European Canadians showed patterns
suggesting they noticed incongruent social context (seen as a N2 incongruity effect), whether or
not they showed N400 incongruity effects, and Japanese only showed this processing pattern
when they also showed N400 incongruity effects. The European Canadian pattern replicates
previous findings showing that they may notice social incongruence, even without processing it
as meaningful (Russell et al., 2015). Finally in relation to Hypothesis 4, I found that social
orientation beliefs correlated with N2 incongruity effects (better than N400 incongruity effects),
giving evidence that individuals’ social orientation beliefs relate to how much people experience
social incongruence related conflict in this task.
In terms of N400 patterns, my findings suggest that relationship type influences how
people place meaning on incongruent social contextual cues. For acquaintances, in line with
cultural differences in general attention and the social orientation hypothesis (e.g., Nisbett, 2003;
Varnum et al., 2010), East Asians processed social incongruence as meaningful and North
Americans did not. I interpret these findings to reflect that East Asians process incongruence as
they place importance on threats concerning acquaintances, while North Americans do not
because they place less importance on these threats for these relationships (e.g., Heine, 2008).
Contrasting with these findings, patterns reversed for close relationships. I explain the North
American patterns in terms of the mutual influence they experience with close others, which may
require them to place meaning on this social context (e.g., Arriaga, 2013; Wegner et al., 1985).
Conversely, I take East Asians’ lack of meaning-based processing to reflect a dropped guard
around close others, due to beliefs that this relationship is ‘favored’, allowing them to not worry
about reading into these cues in their early social attention (e.g., Doi, 1973; Hwang, 1987).
75
N2 conflict monitoring neural patterns also suggest cultural differences in how North
Americans and East Asians notice incongruent social context. While North Americans showed
evidence of experiencing conflict from social incongruence, regardless of whether or not they
placed it as meaningful, Japanese only showed conflict related to social incongruence when they
also placed it as meaningful. This suggests that meaning-based and conflict processing may
potentially be independent processes. The finding that N2/N400 neural patterns seem to be more
independent for North Americans may be due to their preferred mode of attention. Because
North Americans are thought to not link focal information/goals and context (e.g., Nisbett, 2003),
they may be able to process conflict from incongruent social cues (as context for the task), even
if they do not process it as meaningful (which is more involved in the focal task). In contrast, the
more holistic East Asians may have a more all-or-none pattern (processing both or neither) due
to difficulties ignoring presented contextual information (e.g., Choi, Dalal, Kim-Prieto, & Park,
2003; Li et al., 2015; Nisbett, 2003). As noticing social context can be seen as a quasi-
presentation of information (i.e., ‘presenting’ the context to the brain), this ‘presentation’ may
then be difficult for East Asians to ignore, resulting in patterns where noticed context is also
processed as meaningful. However, this interpretation is still speculation and should be an object
of future investigations.
Finally, the fact that only the N2 incongruity effect had a strong correlation with social
orientation beliefs, and only for the acquaintance condition, is interesting. On the one hand, it
supports that the link between social orientation and attention may be most salient for
acquaintances. Those that are more interdependent tend to process more the differences between
central and background figures in acquaintance relationships. On the other hand, the fact that the
correlation is stronger for conflict monitoring processes than for meaning-based processes holds

76
multiple possible interpretations, including: 1) relationship beliefs may be more normative,
suppressing individual differences in meaning-based processing, 2) conflict experienced by
context may be an important part of social orientation differences, and/or 3) the situations
provided in the current paradigm were too artificial to elicit a strong connection between
meaning-based processing and individuals’ social orientation beliefs. To follow up on these
possibilities, future studies should further investigate the relationship between social attention
related neural patterns and social orientation beliefs, using more realistic stimuli.
4.4.2 Limitations and Future Research
As an unexpected finding, I found that North Americans showed more influence from
social incongruence in their judgments than East Asians. This is in contrast to noted cultural
differences in attention and previous face lineup task studies (e.g., Masuda et al., 2012; Masuda,
Ellsworth et al., 2008; Nisbett, 2003; Russell et al., 2015; Varnum et al., 2010). While it may be
that North Americans actually perceive more influence from social context, I believe that this
was due to limitations of the current design. That is, as the focus of the current study was on
relationships, I explicitly instructed participants to make judgments of center persons in relation
to the surrounding people (vs. other studies that left how to take into account this context less
explicit; Masuda et al., 2012; Masuda, Ellsworth, 2008; Russell et al., 2015). This in turn may
have lead North Americans to rate more influence from surrounding others. Furthermore, as
North Americans have been shown to extreme score and East Asians to score moderately, ratings
might have become stronger for North Americans than East Asians (e.g., Heine, Lehman, Peng,
& Greenholz, 2002). To address this issue, I am currently exploring other research with a
weaker manipulation. So far, preliminary data with North Americans replicates that they do still
show an influence from social context from close and acquaintance others, with acquaintance-

77
related influence being much weaker, but East Asian comparison data is still to be collected.
For additional future research, I hope to target other relationship types to determine the
boundary conditions of where North Americans and East Asians process social incongruence as
meaningful, such as targeting friends, strangers, etc. As another possibility, I aim to pursue
future research comparing in-group vs. out-group relationships, because North American cultures
and East Asians cultures have been shown to differ in how they view people in their in-groups
and out-groups, with East Asians showing a stronger differentiation between in-group and out-
group members (e.g., Heine, 2008)7. Finally, as my current neural findings only relate to very
basic early attention processes, I hope to investigate more realistic settings in future studies, such
as when people actually interact with others of various relationship types. In line with cultural
differences in how people are expected to act, (i.e., Amae, ‘interdependence’ with close others,
“Favoring the intimate”, & “Respecting the superior”; e.g., Arriaga, 2013; Doi, 1973; Hwang,
1987; Talhelm et al., 2014; Varnum et al., 2010; Wegner et al., 1985), I also expect cultural
differences in behavior. These behavioral differences have great implications as one important
goal of cultural psychology should be to understand real behaviors, to give us a better basis for
how people can improve their interactions with their ‘brothers and sisters’ around the world.
4.4.3 Relational Tasks and Social Orientation
The current research begins to clarify on ambiguities introduced by the social orientation
hypothesis by Varnum et al. (2010). In contrast to the simple story offered by Varnum and
colleagues, stating that social orientation differences lead to general attention differences, I found
evidence that European Canadians (as an example of an independent culture) and Japanese’s (as
an interdependent culture) social attention patterns depend on the type of relationship linking the
people. Depending on the relationship, both North Americans and East Asians may place

78
meaning on the early processing of incongruent social context. Because of these patterns, it is
unlikely that all social orientation differences (i.e., across relationships) directly lead to the seen
cultural differences in general attention. Instead, my findings suggest that experiences with
certain relationships may be more associated with general attention differences.
Chapter 5: General Discussion
5.1 Overall Summary
Together my findings provide neural evidence that North American and East Asian
cultures show similarities and differences in how they pay attention to the world. In line with
previous theoretical frameworks showing North Americans to be independent and analytic,
placing people (and objects) as separate from their surrounding contexts, and East Asians to be
interdependent and holistic, placing people (and objects) as part of their surrounding contexts
(e.g., Nisbett, 2003; Varnum et al., 2010), I found support that for some non-social and social
situations, this may be so (e.g., Masuda et al., 2014; Russell et al., 2015). However, as an
interesting nuance of my research I also found evidence that these cultural differences do not
mean that North Americans do not process context at all—North Americans actually showed
neural patterns suggesting that they processed incongruent context in all three studies. Instead,
cultural differences seem to relate to whether or not people use or place meaning on this
processed context, influencing judgments and meaning-based neural patterns. These differences
in meanings placed on contextual information support the notions of cultural psychologists,
which consider a key aspect of culture to be differences in meanings (e.g., Bruner, 1990; Miller,
1999; Shweder, 1991). We learn meanings growing up in our cultural environments, and these
meanings then influence how we place importance on the information we experience in our lives.
79
In addition, my findings give support to the idea that neural patterns reflect additional
processes beyond what are shown through behavioral data alone (i.e., Goto et al., 2010; 2013;
Russell et al., 2015). In Chapter 2, I found cultural similarities in judgments and neural patterns,
but that the judgments and neural patterns only related to each other for the Japanese, and in
Chapter 3 and 4 I found contrasting neural patterns between cultures, despite participants’ rating
patterns. In terms of what ERP and behavioral methods describe, I see the ERP neural patterns
as describing early, automatic attention, as these processing patterns are too early to involve a
great deal of thought. In contrast, I consider the judgment behaviors to describe more effortful,
intentional process, as they allow more time for thought and deliberation. For describing
intermediate attention processes, other research has referred to reaction time, eye-movements, or
later neural patterns, such as oscillations or fMRI patterns (e.g., Kitayama & Park, 2010;
Klimesch, 2012; Masuda et al., 2008). We learn to process the world through our cultural
experiences, and this may exert influences across the attention stream, including: 1) our early
automatic processes, reflecting how we initially process the world (seen through ERPs), 2) our
attention to and deliberation of tasks at hand (as reaction time, eye-movements, later neural
patterns, etc.), and 3) how we put together all this information and decide how to act (as
judgment behaviors).
As another key finding, I found evidence that factors surrounding judgments may
influence how people take into account context. While implied acquaintance face lineups
(Chapter 3) and explicit acquaintance face lineups (Chapter 4) showed previously noted cultural
patterns of attention, these patterns actually reversed for close relationships, with North
Americans only processing context as meaningful for this relationship. This finding is important
as it gives evidence that cultural differences in attention may not be as simple as previously

80
suggested. While my findings attest to the effects of relationship type on social attention, I
expect that other situations may also affect whether or not people place meaning on non-social
and social context. As one example, I offer North American attention patterns during non-social
tasks (e.g., Ganis & Kutas, 2003; Goto et al., 2010; 2013). As I introduced earlier, North
Americans do not show neural patterns suggesting a natural linking of meanings between
foreground objects and background context for semantically congruent and incongruent images
(Goto et al., 2010; 2013). However, one nuance of this research was that participants were only
asked to judge the type of foreground object (i.e., animate vs. inanimate) without mentioning the
context, to investigate if the connection was spontaneous. This said, other research by Ganis and
Kutas (2003) suggests that North Americans can link foreground and background non-social
information, when they are instructed to judge the congruence between foreground and
background context. While this is a rather explicit instruction, I expect that other situations also
affect how people place meaning on context, with factors such as task instructions, internal
motivations, or task type, etc. playing a role in whether or not people place meaning on context.
More relevant to this paper’s discussion, the patterns seen for meaning processing ERPs
for close and acquaintance relationships are also significant to social orientation theory.
5.2 Rethinking Social Orientation Theory
Recent theoretical trends in social orientation theory have provided the field of cultural
psychology with a framework for why differing cultures may experience cultural differences in
attention (Varnum et al., 2010). For this framework, termed the social orientation hypothesis,
Varnum and colleagues provided evidence that social orientation differences are linked to
cultural difference in general attention. They explained that various independent and
interdependent cultures (i.e., North Americans vs. East Asians, mobile vs. sedentary cultures,

81
middle vs. low class, etc.), tend to have similar patterns of attention, with independent people
tending to show analytic attention patterns, and interdependent people tending to show holistic
attention patterns. Furthermore, attempting to provide evidence for a causal relationship between
the two, they discussed that priming individuals with social orientation (i.e., through tasks like “I
(independent) vs. we (interdependent) priming”; Oyserman, 2015; Varnum et al., 2010), leads to
subsequent differences in patterns of attention that parallel cultural differences in attention.
While their evidence seems parsimonious, I would argue that the offered framework by
Varnum and colleagues (2010) strays from the more realistic Heine (2008) model of social
orientation. One strength of the model by Heine (2008) is that it is detailed, offering various
explanations for differences in how the two cultures view the self, related to how they: 1) set in-
group vs. out-group boundaries, 2) vary behaviors across situations, 3) see people’s personal
attributes, and 4) place importance on varying relationships. I argue that dropping these ‘nuances
of social orientation,’ as is unintentionally done by the Varnum et al. (2010) model, misses the
essence of how the two cultures actually see the self. Adding to these nuances, we now have
evidence that one difference between North American independence and East Asian
interdependence is that for acquaintances, East Asians only place early meaning on social
incongruence, and for close relationships, only North Americans place early meaning on social
incongruence. While my evidence does not allow me to comment on other cultures introduced in
arguments for the social orientation hypothesis, it does give evidence (at least for North
Americans and East Asians) that the simple social orientation hypothesis needs revision.
5.2.1 The Importance of Acquaintances in Social Orientation Theory
While I am critical of the simplicity of the social orientation hypothesis (Varnum et al.,
2010), I believe that there is some validity to this explanation—if we rethink the mechanisms for

82
why social orientation may affect attention. Instead of a wide-ranging influence of social
orientation on attention, it may be that certain types of social experiences in each type of social
orientation environment better influence our patterns of attention. Looking at the evidence I
provide in Chapter 3 and 4 and previous research by Masuda and colleagues (Masuda et al.,
2012; Masuda, Ellsworth, et al., 2008; Russell et al., 2015), it seems that acquaintances are a
likely candidate for a social generator of general cultural differences in attention. As such, I
would like to do a thought experiment, considering possible situations that might support
attention differences for some of the cultures offered as part of the social orientation hypothesis
(i.e., 1) North Americans vs. East Asians, 2) Mobile vs. Sedentary cultures, 3) Middle vs. Low
Class; Varnum et al., 2010). I will skip the former for this thought experiment, as I have already
given explanations for how North Americans and East Asians place meaning on context for close
and acquaintances relationships.
In the case of mobile cultures (i.e., herding or hunter gatherers) vs. sedentary (farming or
cooperative fishing), mobile lifestyles are thought to lead to independence as people must
survive in small groups for extensive periods of time, and sedentary lifestyles are thought to lead
to interdependence as people are set in communities, needing to work together (Berry, 1967).
Considering the importance of relationships for each culture, both groups need strong support of
close, family members to survive, with the more independent hunter-gatherers families being
mutually dependent on each other, using differing foraging strategies to maximize probability of
success (i.e., males hunting and females gathering; e.g., Marlowe, 2007). However, the key
difference would seem to be for community (i.e., acquaintance) relationships. Sedentary
communities need to work together to survive (i.e., as crops sometimes fail and/or planting
practices may require help), but mobile lifestyles may actually thrive better in absence of large

83
communities, as resources sometimes become too scarce to share (e.g., Lee, 1968). This then
could affect the value placed on social context from acquaintance relationships, with sedentary
cultures placing value on this context to protect these relationships, as losing their support could
be hazardous, and mobile cultures being motivated to ignore this context as it is less important,
as being together with acquaintances may actually hurt their ability to forage enough to survive.
As for middle class vs. low class cultures, middle class lifestyles are thought to lead to
independence as people have more freedom in terms of money and jobs, and low class lifestyles
are thought to lead to interdependence as people need to worry about the constraints involved in
their situation (e.g., Varnum et al., 2012). When it comes to the importance placed on
relationships for each cultural group, the situations that are thought to drive these social
orientation differences do not seem to directly relate to close others (although they may do so
indirectly). Instead, they relate to situations outside of the home, involving opportunities.
Middle class members have much more freedom as they are not as worried about the
consequences of economic rough times, as they have the skills and the savings to make it
through these periods. As such they can be more independent, stressing less about their social
situation outside the home. For low class members, constraints are much more apparent as they
are more likely to live from day to day, making the consequences of rough economic times more
hazardous (i.e., they may not be able to eat). This should make them motivated to monitor and
address constraints related to their relationships with community members, as potential
supporters) and co-workers (as important to sources of income.
In terms of common factors across these examples, I see a similarity across independent
and interdependent cultures in that close relationships seem to be relatively important for both
social orientations. Conversely, I see a key difference for acquaintances. On the one hand,

84
independent cultures place less importance on acquaintances, as having these relationships does
not influence life outcomes much (or potentially leads to harm). On the other hand,
interdependent cultures place more importance on acquaintances, as they provide vital support
(e.g., Berry, 1967; Heine, 2008; Markus & Kitayama, 1991; Talhelm et al., 2014; Varnum et al.,
2012). If such is true across social orientation contexts, this commonality might be the reason
that various independent and interdependent cultures seem to share similar meaning systems
related to how the two groups should attend to the world. As independent cultures do not need to
attend to context outside of the home, they may pass on analytic patterns of attention. As
interdependent cultures need to attend to context outside of the home, they may pass on holistic
patterns of attention. Following this logic, I offer that a revised social orientation hypothesis may
be better stated as: “Social orientation differences associated with non-close others (in particular,
acquaintances) lead to cultural differences in general attention.”
To investigate this revised social orientation hypothesis, I suggest that future research
examine if acquaintance social attention patterns hold across the types of cultures mentioned as
evidence in the social orientation hypothesis. Furthermore, as causality is in question, future
studies should investigate if acquaintance (vs. close relationship) priming uniquely leads to
previously noted cultural differences in attention. Finally, as it is still uncertain if other
relationships besides acquaintances affect patterns of attention, future research should also
examine social attention patterns across other relationships.
5.3 A Place for Cultural Neuroscience
To close off my paper, I’d like to briefly discuss what my experiences during this thesis
research have lead me to believe about cultural neuroscience’s (in particular ERP methods) place
in cultural psychology. I believe this is an important discussion as cultural neuroscience

85
methods are relatively new, being only recently embraced by cultural psychology (e.g., Chiao,
2009; Han et al., 2013; Han & Northoff, 2009; Kitayama & Tompson, 2010; Kitayama & Uskul,
2011). For this discussion, I offer 4 quick points of consideration.
First, cultural neuroscience methods need to be ‘extraordinarily’ rigorous: Because
many readers of neuroscience papers do not fully understand the nuances/intricacies of the
methods, findings can be difficult for readers to appraise because they may lack the bases
required to accurately judge what was done. This is particularly dangerous as neuroscience
methods are very strict, requiring stronger standards than other methods to make data
interpretable (i.e., ERPs need to have processes related to events quick, and tasks simple enough
to yield consistent brain reactions). As such, I believe cultural psychologists should be
committed to learning neuroscience methods in depth if they set down the neuroscience path, as
they need to be responsible for their findings. Next, Cultural neuroscience methods are cool, but
also sometimes jiving (i.e. pretentious): While it is true that cultural neuroscience research can be
attractive, as neuroscience findings are generally interesting and new, neuroscience is not always
necessary. Instead, I believe we should pursue other, easier methods to address our questions if
possible, as cultural neuroscience methods can cost us a lot in terms of time and money. These
costs are important, as we can probably do many behavioral studies in place of a single cultural
neuroscience study. Also, the reality is that even if we can use neuroscience for our questions,
neuroscience methods often stand to benefit from additional, complementary methods.
Moving on from my misgivings, I offer third, Neuroscience adds unique measures of
psychological processes to cultural research: As a big positive, each neuroscience method can
add unique evidence for how culture affects our psychology. In the case of ERP methods, we can
investigate various early processes, such as perception and cognition, which are different from

86
what is assessed by eye-tracking or task behaviors (e.g., Masuda et al., 2012; Masuda, Ellsworth
et al., 2008; Russell et al., 2015). As another benefit of ERP methods, we can investigate
multiple aspects of early processes simultaneously. In the case of Chapter 3 and 4, I found
evidence using different ERP components (i.e., the N400 and the N2) that North Americans do
process conflict from incongruent context, but that cultural differences were most salient in how
people placed meaning on this context (Masuda et al., 2014; Russell et al., 2015). Last but not
least, I offer what I consider a big plus, Cultural neuroscience can help us investigate individual
level cultural differences: As I mentioned before, while individual level culture less regularly
relates to behaviors, individuals’ cultural beliefs do often relate to neural patterns (e.g., Goto et
al., 2010; Ishii et al., 2010; Na et al., 2010; Na & Kitayama, 2011; Russell et al., 2015). I believe
these findings are important to cultural psychology, as evidence that individual level culture
explains overarching meaning system level cultural differences is important as it provides
support for the validity of cultural differences. Furthermore, these correlations provide support
that culture is substantial, being internalized into individuals’ psyches.
5.4 Conclusion
Regardless of the mixed nature of my thoughts, I am very optimistic for the future of
cultural neuroscience. Unveiling unique aspects of our psychological processes, neuroscience
methods are important means to investigate how culture affects the human psyche. While I
expect some struggle as cultural psychology attempts to embrace neuroscience methods, I
believe that with time neuroscience methods will become a standard tool in cultural research
toolkits. I too struggled with this learning process in the research detailed above, but in the end I
believe I created an effective tool, using ERPs to better understand how culture influences how
people attend to non-social and social context.

87
Footnotes
Footnote 1: Because the use of controlled instructions was advantageous to the interpretation of
the ERPs, my initial design also included a second, between subjects condition involving holistic
instructions, as such instructions are more applicable to Japanese. However, as participants in
general did too poor in their performance in this condition, answering around chance level
(~50%), this condition was abandoned. This said, with modifications to the current design I
believe that such a condition could be created for future research.
Footnote 2: Note that the current study was designed such to target the N400, but not the N2.
The N2 component was an unexpectedly found ERP component. However, with this limitation
in mind, Chapter 4’s trial quantities were increased with the goal of better targeting the N2.
Footnote 3: The images differed in that one group involved business suits (Masuda et al., 2015)
and the other involved casual clothing (Masuda et al., 2012). I combined these two datasets, as I
wanted to use unique combinations of each face-lineup for each judgment. Additionally, I felt
this was justified as my lab had found somewhat similar cultural differences for both datasets
(Masuda et al., 2012; Masuda, Ellsworth, et al., 2008).
Footnote 4: Judgments, with two sequential ratings and positive ratings always first, were based
on previous studies (e.g., Masuda et al., 2012; Masuda, Ellsworth, et al., 2008). However, this is
a limitation of the current design, as is explained in the discussion, and was addressed in the next
study (Chapter 4).
Footnote 5: Note that while the Japanese did not show an N2, this does not mean they did not
notice the incongruent context, as the N400 patterns reflect a processing of the context.
However, what I believe this reflects is the relatively high level of noise due to lower than

88
optimal trial numbers and a complex task, making it difficult for used data preprocessing
procedures (based on ICA) to independently focus on both ERP components.
Footnote 6: Face-lineups were changed to schematic faces in this study to simplify processing of
the images in order to improve ERP quality and to also control for possible influences from
people’s interpretations of the images. This may have affected Japanese performance due to
noted cultural differences in emotion symbols, with East Asians using eye-centric emoticons vs.
North American mouth-centric emoticons (e.g., Park, Baek, & Cha, 2014); however, mouth
differentiations in smiles and frowns are still prevalent in both cultures, and the fact that
behavioral rating incongruity effects were seen in both conditions corroborates this fact.
Footnote 7: A limitation of this research is that while the current data shows hypothesized
differences in processing, based in some theoretical frameworks, some frameworks, and even
parts of the Heine (2008) model, could yield differing predictions for how the two cultures would
process context. For example, because North Americans show more flexibility between in-group
and out-groups, especially for acquaintances, this could also mean they care more about context
from acquaintances (i.e., as a potential in-group member). As such, future studies should
investigate if patterns differ for North Americans when acquaintances are framed as potential in-
group members (i.e., cooperative or soon to be friends) vs. out-group members (i.e., competitive).

89
References
Arriaga, X. B. (2013). An interdependence theory analysis of close relationships. In J. A.
Simpson & L. Campbell (Eds.), The Oxford handbook of close relationships (pp. 39-65).
Oxford, England: Oxford University Press.
Begam, R. B., & Thilakavathi, B. (2014). Eyeblink artefact removal from EEG using
independent component analysis. IJRET: International Journal of Research in
Engineering and Technology, 3, 298-303.
Berry, J. W. (1966). Temme and Eskimo perceptual skills. International Journal of Psychology,
1, 207-229.
Berry, J. W. (1967). Independence and conformity in subsistence-level societies. Journal of
Personality and Social Psychology, 7, 415–418.
Berry, J. W. (1971). Ecological and cultural factors in spatial perceptual development. Canadian
Journal of Behavioral Science, 3, 324-336.
Brislin, R. W. (1976). Comparative research methodology: Cross-cultural studies. International
Journal of Psychology, 11, 215-229.
Bruner, J. S. (1990). Acts of meaning. Cambridge, MA: Harvard University Press.
Chiao, J. Y. (2009). Cultural neuroscience: A once and future discipline. Progress in Brain
Research, 178, 287-304.
Choi, I., Dalal, R., Kim-Prieto, C., & Park, H. (2003). Culture and judgment of causal relevance.
Journal of Personality and Social Psychology, 84, 46-59.
Chua, H. F., Boland, J. E., & Nisbett, R. E. (2005). Cultural variation in eye movements during
scene perception. Proceedings of the National Academy of Science, 102, 12629-12633.
90
Delorme, A., & Makeig, S. (2004). EEGLAB: an open source toolbox for analysis of single-trial
EEG dynamics including independent component analysis. Journal of Neuroscience
Methods, 134, 9-21.
Doi, T. (1973). The key analysis of Japanese behavior: The anatomy of dependence. New York,
NY: Kodansha America.
Dowson, J. L. M. (1967). Cultural and psychological influences upon spatial-perceptual
processes in West Africa. Part I. International Journal of Psychology, 2, 115-128.
Fong, M. C., Goto, S. G., Moore, C., Zhao, T., Schudson, Z., & Lewis, R. (2014). Switching
between Mii and Wii: The effects of cultural priming on the social affective N400.
Culture and Brain, 2, 52-71.
Ganis, G., & Kutas, M. (2003). An electrophysiological study of scene effects on object
identification. Cognitive Brain Research, 16, 123-44.
Goto, S. G., Ando, Y., Huang, C., Yee, A., & Lewis, R. S. (2010). Cultural differences in the
visual processing of meaning: Detecting incongruities between background and
foreground objects using the N400. Social Cognitive and Affective Neuroscience, 5,
242-253.
Goto, S. G., Yee, A., Lowenberg, K. & Lewis, R. S. (2013). Cultural differences in sensitivity to
social context: Detecting affective incongruity using the N400. Social Neuroscience, 8,
63-74.
Gregory, R. L. (1968). Perceptual illusions and brain models. Proceedings of the Royal Society
of London. Series B. Biological Science, 171, 279-296.
Han, S., & Northoff, G. (2009). Understanding the self: A cultural neuroscience approach.
Progress in Brain Research, 178, 203-212.

91
Han, S., Northoff, G., Vogeley, K., Wexler, B. E., Kitayama, S., & Varnum, M. E. W. (2013). A
cultural neuroscience approach to the biosocial nature of the human brain. Annual
Review of Psychology, 64, 335–359.
Heine, S.J. (2008). Cultural psychology. New York: Norton.
Heine, S. J., Lehman, D.R., Peng, K., & Greenholz, J. (2002). What’s wrong with cross-cultural
comparison of subjective Likert scales?: The reference-group effect. Journal of
Personality and Social Psychology, 82, 903-918.
Hwang, K. K. (1987). Face and favor: The Chinese power game. American Journal of
Sociology, 92, 944-974.
Hoffman, S., & Falkenstein, M. (2008). The correction of eye-blinks artefacts in the EEG:
A comparison of two prominent methods. PLoS One, 3, DOI:
10.1371/journal.pone.0003004.
Iaccarino, M. (2003). Science and culture. EMBO Reports, 4, 220-223.
Ishii, K., Kobayashi, Y., & Kitayama, S. (2010). Interdependence modulates the brain response
to word-voice incongruity. Social Cognitive and Affective Neuroscience, 5, 307–317.
Ito, K., Masuda, T., Komiya, A., & Hioki, K. (2015). Seeking help from close, same-sex friends:
Relational costs for Japanese and personal costs European Canadians. Journal of Social
and Personal Relationships, 32, 529-554.
Ji, L. J., Peng, K. P., & Nisbett, R. E. (2000). Culture, control, and perception of relationships
in the environment. Journal of Personality and Social Psychology, 78, 943–955.
Kim, J., Kim, M., Kam, K. Y., & Shin, H. (2003). Influence of self-construals on the perception
of different self-presentation style in Korea. Asian Journal of Social Psychology, 6,
89-101.

92
Kim, H. S., Sherman, D. K., & Taylor, S.E. (2008). Culture and social support. American
Psychologist, 63, 518-526.
Kitayama, S., & Cohen, D. (Eds.) (2007). Handbook of cultural psychology. New York:
Guildford Press.
Kitayama, S., & Park, J. (2010). Cultural neuroscience of the self: Understanding the social
grounding of the brain. Social Cognitive & Affective Neuroscience, 5, 111-129.
Kitayama, S., & Uskul, A. K. (2011). Culture, mind, and the brain: Current evidence and future
directions. Annual Review of Psychology, 62, 419-449.
Kitayama, S., & Tompson, S. (2010). Envisioning the future of cultural neuroscience. Asian
Journal of Social Psychology, 13, 92-101.
Klimesch, W. (2012). Alpha band oscillations, attention and controlled access to stored
information. Trends in Cognitive Science, 16, 606-617.
Kutas, M., & Federmeier, K. (2011). Thirty years and counting: Finding meaning in the N400
component of the event-related brain potential (ERP). Annual Review of Psychology, 62,
621-647.
Lee, R. B. (1968). What hunters do for a living, or, how to make out on scarce resources. In R. B.
Lee & I. DeVore (Eds.), Man the hunter (pp. 30-48). Chicago: Aldine.
Lewis, R. S., Goto, S. G., & Kong, L. L. (2008). Culture and context: East Asian American and
European American differences in P3 event-related potentials and self-construal.
Personality and Social Psychology Bulletin, 34, 623–634.
Li, L. M . W., Masuda, T., & Russell, M. J. (2015). Culture and decision making: Investigating
cultural variations in the East Asian and North American online decision making
processes. Asian Journal of Social Psychology, 18, 183-191.

93
Luck, S. J. (2005). An introduction to the event-related potential technique. Cambridge, MA:
The MIT Press.
Makeig, S., Bell, A. J., Jung, T, P. & Sejnowski, T. J. (1996). Independent component analysis of
electroencephalographic data. Advances in Neural Information Processing Systems, 8,
145-151.
Markus, H. R. & Kitayama, S. (1991). Culture and the self: Implications for cognition,
emotion, and motivation. Psychological Review, 98, 224-253.
Marlowe, F. W. (2007). Hunting and gathering: The human sexual division of foraging labor.
Cross-Cultural Research, 41, 170-195.
Masuda, T., Argo, J., Hioki, K., & Ito, K. (2015). Culture and perception of emotion in the
business setting. Unpublished manuscript, University of Alberta.
Masuda, T., Ellsworth, P. C., Mesquita, B., Leu, J., Tanida, S., & Van de Veerdonk, E. (2008).
Placing the face in context: Cultural differences in the perception of facial emotion.
Journal of Personality and Social Psychology, 94, 365–381.
Masuda, T., Gonzalez, R., Kwan, L., & Nisbett, R. E. (2008). Culture and aesthetic preference:
Comparing the attention to context of East Asians and Americans. Personality and Social
Psychology Bulletin, 34, 1260-1275.
Masuda, T., Ishii, K., & Kimura, J. (In Press). When does the culturally dominant mode of
attention appear or disappear?: Comparing patterns of eye movement during the visual
flicker task between European Canadians and Japanese. Journal of Cross-Cultural
Psychology. DOI: 10.1177/0022022116653830.

94
Masuda, T., & Nisbett, R. E. (2001). Attending holistically versus analytically: Comparing the
context sensitivity of Japanese and Americans. Journal of Personality and Social
Psychology, 81, 922–934.
Masuda, T., & Nisbett, R. E. (2006). Culture and change blindness. Cognitive Science, 30, 381-
399.
Masuda, T., Russell, M. J., Chen, Y.Y., Hioki, K., & Caplan, J. B. (2014). N400 incongruity
effect in an episodic memory task reveals different strategies for handling irrelevant
contextual information for Japanese than European Canadians. Cognitive Neuroscience,
5, 17-25.
Masuda, T., Wang, H., Ishii, K., & Ito, K. (2012). Do surrounding figures’ emotions affect
judgment of target figure’s emotion? Comparing the eye-movement patterns of European
Canadians, Asian Canadians, Asian international students, and Japanese. Frontiers in
Integrative Neuroscience. DOI: 10.3389/fnint.2012.00072.
Miller, J. G. (1999). Cultural psychology: Implications for basic psychological theory.
Psychological Science, 10, 85-91.
Miyamoto, Y. (2013). Culture and analytic versus holistic cognition: Toward multilevel analyses
of cultural influences. Advances in Experimental Social Psychology, 47, 131-188.
Na, J., Grossmann, I., Varnum, M. E. W., Kitayama, S., Gonzalez, R., & Nisbett, R. E. (2010).
Cultural differences are not always reducible to individual differences. Proceedings of
the National Academy of Sciences, 107, 6192-6197.
Na, J., & Kitayama, S. (2011). Spontaneous trait inference is culture-specific: Behavioral and
neural evidence. Psychological Science, 22, 1025–1032.

95
Nand, K., Masuda, T., Senzaki, S., & Ishii, K. (2014). Examining cultural drifts in artworks
through history and development: Cultural comparisons between Japanese and western
landscape paintings and drawings. Frontiers in Psychology, 5, 1041. DOI:
0.3389/fpsyg.2014.01041
Nisbett, R. E. (2003).The geography of thought: How Asians and Westerners think differently. . .
and why. New York: The Free Press.
Nisbett, R. E., & Masuda, T. (2003). Culture and point of view. Proceedings of the National
Academy of Sciences of the United States of America, 100, 11163-11170.
Nisbett, R. E., & Miyamoto, Y. (2005). The influence of culture: Holistic versus analytic
perception. Trends in Cognitive Science, 9, 467-473.
Nisbett, R. E., Peng, K., Choi, I., & Norenzayan, A. (2001). Culture and systems of thought:
Holistic versus analytic cognition. Psychological Review, 108, 291–310.
Oyserman, D. (2015). Culture as situated cognition. In R. Scott & S. M. Kosslyn
(Eds.), Emerging Trends in the Social Sciences: An interdisciplinary, searchable, and
linkable resource (pp. 1-20). Hoboken, NJ: John Wiley & Sons.
Park, J., Baek, Y. M., & Cha, M. (2014). Cross-cultural comparison of nonverbal cues in
emoticons on Twitter: Evidence from big data analysis. Journal of Communication, 64,
333-354.
Picton, T.W., Bentin, S., Berg, P., Donchin, E., Hillyard, S.A., Johnson, R.,…&, Taylor, M.J.
(2000). Guidelines for using human event-related potentials to study cognition:
Recording standards and publication criteria. Psychophysiology, 37, 127-152.
Rugg, M. D., & Curran, T., (2007). Event-related potentials and recognition memory. Trends
in Cognitive Sciences, 11, 251–257.
96
Russell, M. J., Masuda, T., Hioki, K., & Singhal, A. (2015). Culture and social judgments: The
importance of culture in Japanese and European Canadians’ N400 and LPC processing of
face lineup emotion judgments. Culture and Brain, 3, 131-147.
Russell, M. J., Masuda, T., & Li., L. M. W. (2016). Using dialectical manipulations to overcome
North American consistency norms. Unpublished Manuscript, University of Alberta,
Edmonton.
Segall, M. H., Campbell, D. T., & Herskovits, M. J. (1966). The influence of culture on visual
perception. Indianapolis: Bobbs-Merrill.
Senzaki, S., Masuda, T., & Ishii, K. (2014). When is perception top-down and when is it not?
Culture, narrative, and attention. Cognitive Science, 38, 1493-1506.
Shweder, R. A. (1991). Cultural psychology: What is it? In R. A. Shweder (Ed.), Thinking
through cultures: Expeditions in cultural psychology (pp. 73–110). Cambridge, MA:
Harvard University Press.
Talhelm, T., Zhang, X., Oishi, S., Shimin, C., Duan, D., Lan, X., & Kitayama, S. (2014). Large-
scale psychological differences within China explained by rice versus wheat agriculture.
Science, 344, 603-608.
Tomasello, M. (1999). The cultural origins of human cognition. Cambridge, MA: Harvard
University Press.
Tsivilis, D., Otten, L. J, & Rugg, M. D. (2001) Context effects on the neural correlates of
recognition memory: An electrophysiological study. Neuron, 31, 497-505.
Varnum, M. E. W., Grossmann, I., Kitayama, S., & Nisbett, R. E. (2010). The origin of cultural
differences in cognition: The social orientation hypothesis. Current Directions in
Psychological Science, 19, 9-13.
97
Varnum, M. E., Na, J., Murata, A., & Kitayama, S. (2012). Social class differences in N400
indicate differences in spontaneous trait inference. Journal of Experimental Psychology:
General, 141, 518-526.
Yao, Z, & Wang, Z. (2014). Concreteness of positive word contribution to affective priming: An
ERP study. International Journal of Psychophysiology, 93, 275-282.
Yeung, N., Botvinick, M. M., & Cohen, J. D. (2004). The neural basis of error detection:
Conflict monitoring and the error-related negativity. Psychological Review, 111, 931-959.
Yuki, M., Schug, J., Horikawa, H., Takemura, K., Sato, K., Yokota, K., & Kamaya, K. (2007).
Development of a scale to measure perceptions of relational mobility in society.
Relational mobility, culture, and self-disclosure 20 CERSS Working Paper 75, Center for
Experimental Research in Social Sciences, Hokkaido University.
Wang, H., Masuda, T., Ito, K., & Rashid, M. (2012). How much information? East Asian and
North American cultural products and information search performance. Personality and
Social Psychology Bulletin, 38, 1539-1551.
Wegner, D. M., Giuliano, T., & Hertel, P. (1985). Cognitive interdependence in close
relationships. In W. J. Ickes (Ed.), Compatible and incompatible relationships (pp. 253-
276). New York: Springer-Verlag.

98
Appendix A: Social Orientation Scale Items
1. I am careful to maintain harmony in my group. (interdependence)
2. If my brother or sisters fails, I feel responsible. (interdependence)
3. Having a lively imagination is important to me. (independence)
4. My happiness depends on the happiness of those in my group. (interdependence)
5. I enjoy being admired for my unique qualities. (independence)
6. My personal identity, independent of others, is very important to me. (independence)
7. I voice my opinions in group discussions. (independence)
8. My relationships with those in my group are more important than my personal
accomplishments. (interdependence)
9. Speaking up in a work/task group is not a problem for me. (independence)
10. It is important to consult close friends and get their ideas before making decisions.
(interdependence)
11. I act as fellow group members prefer I act. (interdependence)
12. I prefer to be self-reliant rather than dependent on others. (independence)
13. I often consider how I can be helpful to specific others in my group. (interdependence)
14. I take responsibility for my own actions. (independence)
15. It is important for me to act as an independent person. (independence)
16. I enjoy being unique and different from others. (independence)
17. The security of being an accepted member of a group is very important to me.
(interdependence)
18. I have an opinion about most things: I know what I like and I know what I don’t like.
(independence)

99
19. I don’t like depending on others. (independence)
20. I would sacrifice my self-interests for the benefit of my group. (interdependence)
21. I act as a unique person, separate from others. (independence)
22. I try to meet the demands of my group, even if it means controlling my own desires.
(interdependence)
23. Understanding myself is a major goal in my life. (independence)

100
Appendix B: Relationship Descriptions
Close Relationships
For this set of judgments we’d like you to consider the surrounding faces to be people that are
close or intimate with the center person.
Acquaintance Relationships
For this set of judgments we’d like you to consider the surrounding faces to be people that
interact with the center person regularly, but are not close with them.