Embed Size (px)
Citation preview

The Need for Quantitative Imaging in Oncology
Richard L. Schilsky, M.D.
Professor of Medicine,
Associate Dean for Clinical Research, University of Chicago
Chairman, Cancer and Leukemia Group B

The Role of Imaging in Oncology
• Detection
• Staging (assess prognosis)
• Treatment planning
• Assess response/progression (assess benefit)
• Monitor recurrence

The Role of Imaging in Oncology
• Is a tumor present?
• Where is it?
• How big is it?
• How deep is it?
• What is it near?
• Is it growing/shrinking/spreading?
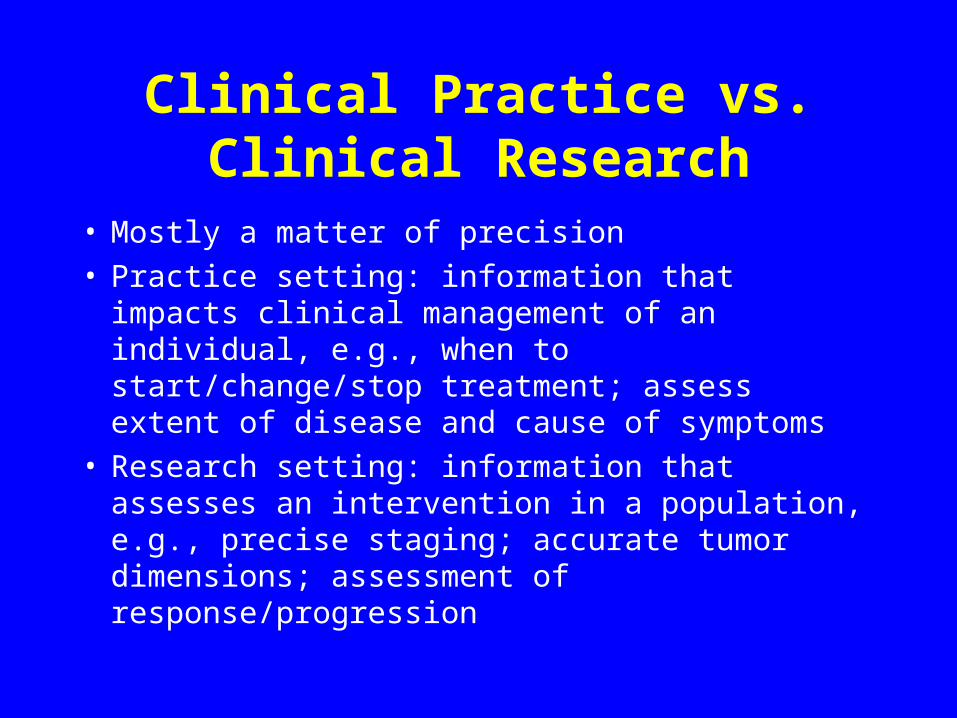
Clinical Practice vs. Clinical Research
• Mostly a matter of precision• Practice setting: information that impacts clinical
management of an individual, e.g., when to start/change/stop treatment; assess extent of disease and cause of symptoms
• Research setting: information that assesses an intervention in a population, e.g., precise staging; accurate tumor dimensions; assessment of response/progression

Clinical Benefit
• Improved survival compared to no treatment or to a known effective therapy
• Non-inferiority to a known effective therapy
• Improvement in TTP compared to known effective treatment coupled with symptomatic improvement
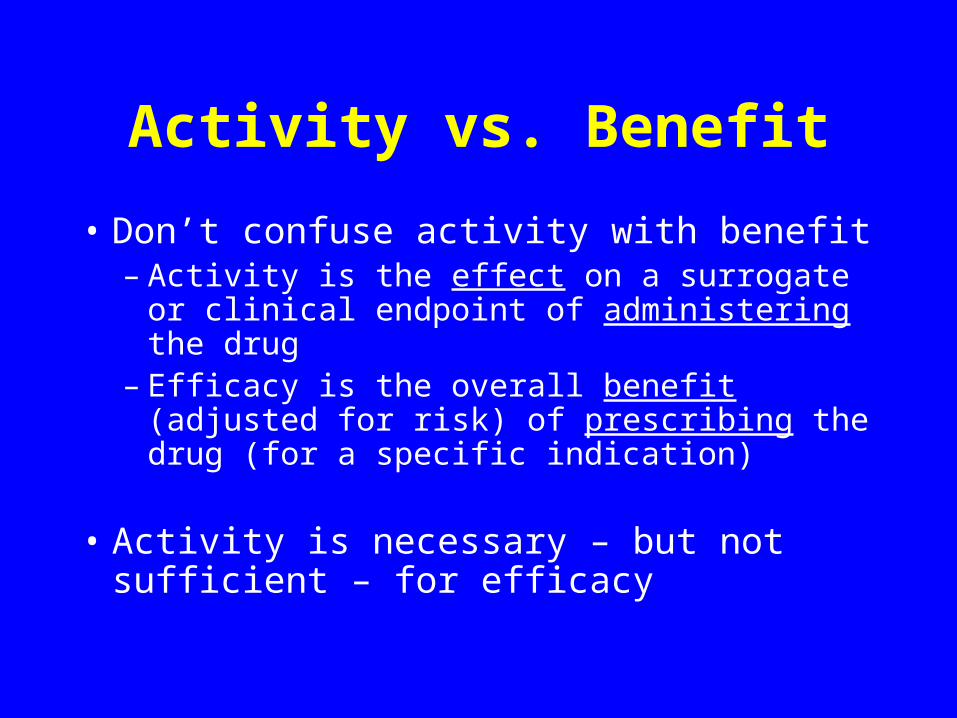
Activity vs. Benefit
• Don’t confuse activity with benefit– Activity is the effect on a surrogate or clinical
endpoint of administering the drug– Efficacy is the overall benefit (adjusted for risk)
of prescribing the drug (for a specific indication)
• Activity is necessary – but not sufficient – for efficacy

Survival
• Unambiguous endpoint that is not subject to investigator interpretation or bias from unblinded studies
• Assessed easily, frequently
• No tumor measurements required!!

Response Rate
• Treatment is “entirely” responsible for tumor reduction; unlikely due to natural history
• Endpoint reached quickly• Response criteria arbitrary• %CR and duration of response important• Classical endpoint to screen for activity;
accepted surrogate for clinical benefit

Response Criteria
• WHO: PR is > 50% decrease in the sum of the product of the perpendicular diameters of measurable lesions
• RECIST: PR is > 30% decrease in the baseline sum of the longest diameters of target lesions
• Each represents a 65% decrease in volume• Confirmation 4 weeks later required

Criteria for Progression
• WHO: PD is > 25% increase in the sum of the product of the perpendicular diameters of measurable lesions (40% increase in volume)
• RECIST: PD is > 20% in the sum of the longest diameters of target lesions (73% increase in volume)
• RECIST is biased toward stable disease

What is Measurable?
• Lesion measured in one dimension as > 20 mm with conventional techniques or > 10 mm with spiral CT (5 mm reconstruction)
• All measurable lesions up to max. of 10 are considered “target” lesions
• All of this is completely arbitrary and observer/technology-dependent!


You have to see it before you can measure it!

CT helps in the removal of most structure noise

case ctn048, ctn008 - section 17
lungnodule
Vast Amount of Data
From S. Armato

Erasmus, J. J. et al. J Clin Oncol; 21:2574-2582 2003
Measurable?

Erasmus, J. J. et al. J Clin Oncol; 21:2574-2582 2003
Measurable?

Is RR Predictive of Benefit?
• For hematologic malignancies, CR generally associated with symptomatic improvement, reduced transfusion requirement, reduced infection rates
• Buyse et. al. (Lancet, 2000): meta analysis of 25 CRC trials with fluoropyrimidines: tumor response a highly significant predictor of survival, independent of PS

Is RR Predictive of Benefit?
• Chen et. al. (JNCI, 2000): phase II response rates in patients with extensive SCLC did not correlate with median survival in phase III trials of same regimen
• Irinotecan (15%); docetaxel (38%); capecitabine (18.5%); oxaliplatin (9%) all improved survival in randomized trials
• In many other studies, a significant improvement in RR does not result in improved survival

Is RR Predictive of Benefit?
• RR is reasonably likely to predict clinical benefit, at least for certain diseases and certain drugs
• Is there a minimum RR predictive of benefit and how is it best measured?
• Is another surrogate predictive for drugs that do not cause regression?

BAY 43-9006: RDTTrial Schema
> 25% Tumor
shrinkage
-25% to +25%Tumor
stabilization
> 25%Tumor growth
BAY 43-900612 weekrun-in
ContinueBAY 43-9006
Continue BAY 43-9006
12 weeks
Placebo*12 weeks
Off study
% SD24 weeks
*Placebo pts with PD may cross over to BAY 43-9006

BAY 43-9006: RDT Design
• All patients initially receive BAY 43-9006• Enrichment of randomized population for endpoint
of interest– Distinguishes antiproliferative activity of drug vs. the
natural history of disease – Requires less overall sample size compared to RCT
• Design controls, in part, for heterogeneity in enrolled patients, as rapid progressors drop out

-100
-80
-60
-40
-20
0
20
40
60
80
100
120
BAY 43-9006 (sorafenib) Study RCC Bidimensional Tumor Measurements* at Week 12:
Change from Baseline in Target Lesions (n=89)%
Ch
an
ge
in
Tu
mo
r M
ea
su
rem
en
t
Number of Patients
> 25% Growth
< 25% to >-25% Change
>-25% to -49% Shrinkage
> -50% Shrinkage
7
45** 24 13
* Investigator assessed
* * 7 of 45 patients not randomized

Response vs. Stable Disease
• The distinction between “minor responses” and partial responses is based on arbitrary criteria
• The patient doesn’t care whether the tumor shrank by 40% (bidimensional) or 60%– So why should we?

BAY 43-9006 (sorafenib) Study Progression-Free Survival in RCC Patients Continuing
Beyond Initial 12 Weeks
* Responders at 12 week assessment with >25% tumor shrinkage
12 Weeks 24 Weeks
Open Label BAY (n=37)Median = 48 weeks(88% progression free at 24 weeks)
Randomized (n=38) Median = 23 weeks(41% progression free at 24 weeks)

Time to Progression• Includes all patients in analysis• Endpoint sooner than survival; no crossover effect• Definition of progression
-death due to cancer
-new lesions
-increase in size of existing lesions (?)
-?increase in tumor metabolism
-? increase in plasma level of tumor marker
-? decline in PS or increase in symptoms

• Tumor assessment frequency should be the same across study arms even when cycles are of different lengths
Time to Progression Measurement Considerations
• Minimum interval between tumor assessments should be less than the expected treatment effect size

Time to Progression
• Precision depends on identification of all lesions at baseline and on frequency of evaluation
• Always an estimate since actual progression occurs between observations
• Requires control for rate of progression in absence of treatment effect
• Unblinded studies subject to ascertainment bias

ResponseResponse
PD at 18 wksPD at 18 wks
TTP Better Categorizes Tumor Control Than Response Rate
Progressive DiseaseProgressive Disease
PD at 6 wksPD at 6 wks
00
1010
2020
3030
4040
5050
6060
7070
8080
00 66 1212 1818 2424 3030 3636 4242 4848 5454
Time (weeks)Time (weeks)
To
tal T
arg
et T
um
or
Len
gth
(cm
) T
ota
l Tar
get
Tu
mo
r L
eng
th (
cm)
Response StatusResponse Status Stable DiseaseStable Disease
PD at 54 wksPD at 54 wks
How Things Are Changing
• Non invasive staging
• Imaging targets for dose finding
• Neoadjuvant chemotherapy to assess response
• Early response assessment
• Greater reliance on time to progression
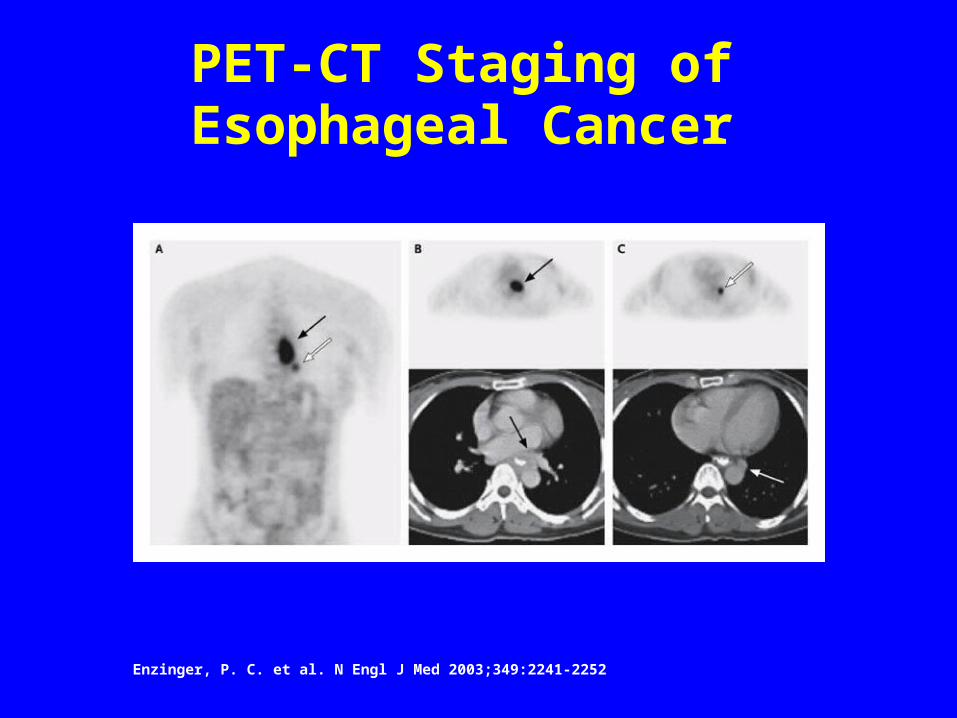
Enzinger, P. C. et al. N Engl J Med 2003;349:2241-2252
PET-CT Staging of Esophageal Cancer

Lardinois, D. et al. N Engl J Med 2003;348:2500-2507
PET-CT Staging of NSCLC

DCE MRI in CRC Patient Treated with PTK 787
Ki dropped from 100% baseline to: 31% on day 234% at end cycle 115% at end cycle 2
Baseline Day 2
Thomas et al. EORTC-NCI-AACR 2002.

PTK/ZK: Changes in Ki Correlate With Changes in Size of Liver
Metastases
Mean Baseline MRI Ki, %Day 28
20 40 60 80 100 120 140 160
60
50
40
30
20
10
0
– 10
– 20
– 30
– 40
– 50Ch
ang
e in
tu
mo
r si
ze a
t d
ay 5
2, %
0
Progressors
Nonprogressors
P = .0001

0
20
40
60
80
100
120
140
160P = .006
• Significant correlation between reduction in tumor blood flow and clinical outcome after treatment with PTK/ZK
PTK/ZK: Ki Correlation With Clinical Outcome
0
Progressors (n = 9)
Nonprogressors (n = 12)
160
140
120
100
80
60
40
20Mea
n B
asel
ine
MR
I-K
i, %
Day 2 Day 28
Mea
n B
asel
ine
MR
I-K
i, %

PTK/ZK: Optimal DosingM
ean
Bas
elin
e M
RI,
%
160
140
120
100
80
60
40
20
0
0 20 40 60 80 100
120
140
160
180
200
Progressors
Nonprogressors
AUC 0-24, hr•µM
260
240
220
200
180
160
140
120
100
80
60
40
20
0
Dose, mg
Day 28
0
200
400
600
800
1,00
0
1,20
0
1,40
0
1,60
0
1,80
0
2,00
0
2,20
0
AU
C 0
-24,
hr•
µM
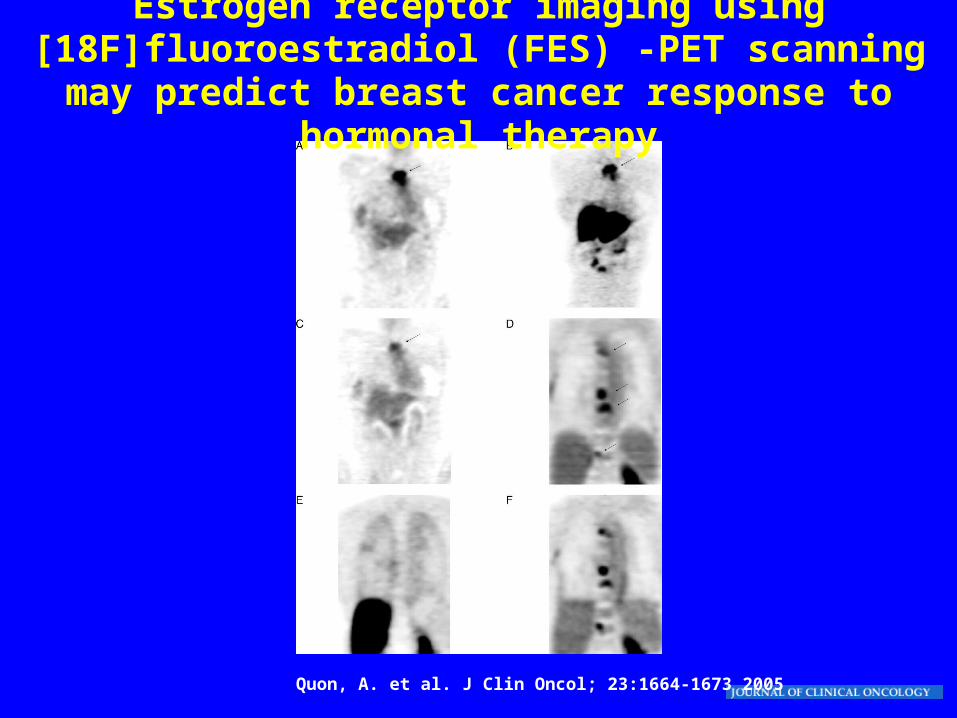
Quon, A. et al. J Clin Oncol; 23:1664-1673 2005
Estrogen receptor imaging using [18F]fluoroestradiol (FES) -PET scanning may predict breast cancer response
to hormonal therapy

Early Response Assessment in GIST
Dec 7, 2000 Jan 1, 2001
After Gleevec™
Before Gleevec™
Is quantitation necessary?

Weber, W. A. et al. J Clin Oncol; 21:2651-2657 2003
FDG PET to Assess Response

Weber, W. A. et al. J Clin Oncol; 21:2651-2657 2003
PET Association with Clinical Benefit
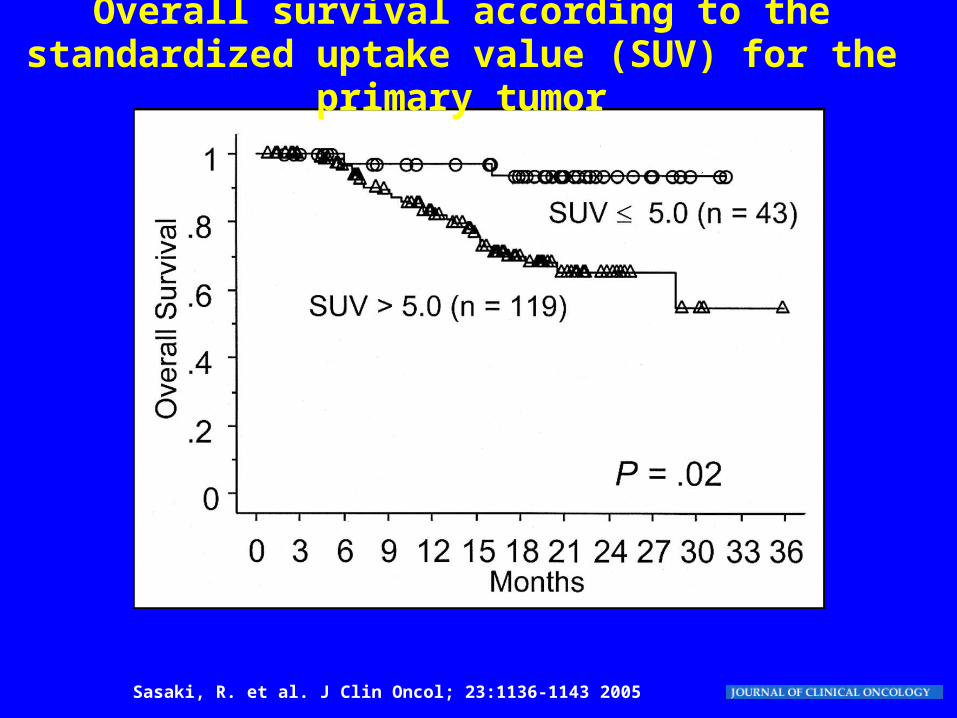
Sasaki, R. et al. J Clin Oncol; 23:1136-1143 2005
Overall survival according to the standardized uptake value (SUV) for the primary tumor

Conclusions
• Imaging is vitally important for staging and assessment of drug activity/tumor progression
• Quantitative imaging provides information that can be a surrogate for clinical benefit but refinements are needed in response criteria
• Functional imaging is increasingly useful for target assessment, dose-finding and early response assessment
• Oncologists and imagers must work as partners in cancer care and research