Embed Size (px)
Citation preview
Framework & Psychometric Properties
Page 1 of 26
The National Survey of Student Engagement: Conceptual Framework and Overview of Psychometric Properties
George D. Kuh Indiana University Center for Postsecondary Research and Planning What students do during college counts more in terms of desired outcomes than who they are or even where they go to college. That is, the voluminous research on college student development shows that the time and energy students devote to educationally purposeful activities is the single best predictor of their learning and personal development (Astin, 1993; Pascarella & Terenzini, 1991; Pace, 1980). The implication for estimating collegiate quality is clear. Those institutions that more fully engage their students in the variety of activities that contribute to valued outcomes of college can claim to be of higher quality in comparison with similar types of colleges and universities. Certain institutional practices are known to lead to high levels of student engagement (Astin, 1991; Chickering & Reisser, 1993; Kuh, Schuh, Whitt & Associates, 1991; Pascarella & Terenzini, 1991). Perhaps the best known set of engagement indicators is the "Seven Principles for Good Practice in Undergraduate Education" (Chickering & Gamson, 1987). These principles include student-faculty contact, cooperation among students, active learning, prompt feedback, time on task, high expectations, and respect for diverse talents and ways of learning. Also important to student learning are institutional environments that are perceived by students as inclusive and affirming and where expectations for performance are clearly communicated and set at reasonably high levels (Education Commission of the States,
1995; Kuh, 2001; Kuh et al., 1991; Pascarella, 2001). All these factors and conditions are positively related to student satisfaction and achievement on a variety of dimensions (Astin, 1984, 1985, 1993; Bruffee, 1993; Goodsell, Maher, & Tinto, 1992; Johnson, Johnson, & Smith, 1991; McKeachie, Pintrich, Lin, & Smith, 1986; Pascarella & Terenzini, 1991; Pike, 1993; Sorcinelli, 1991). Thus, educationally effective colleges and universities -- those that add value -- channel students' energies toward appropriate activities and engage them at a high level in these activities (Educational Commission of the States, 1995; The Study Group, 1984). Emphasizing good educational practice helps focus faculty, staff, students, and others on the tasks and activities that are associated with higher yields in terms of desired student outcomes. Toward these ends, faculty and administrators would do well to arrange the curriculum and other aspects of the college experience in accord with these good practices, thereby encouraging students to put forth more effort (e.g., write more papers, read more books, meet more frequently with faculty and peers, use information technology appropriately) which will result in greater gains in such areas as critical thinking, problem solving, effective communication, and responsible citizenship.
Framework & Psychometric Properties Page 2 of 26
Overview and Content of the NSSE Project and Questionnaire
The National Survey of Student Engagement (NSSE) is specifically designed to assess the extent to which students are engaged in empirically derived good educational practices and what they gain from their college experience (Kuh, 2001). The main content of the NSSE instrument, The College Student Report, represents student behaviors that are highly correlated with many desirable learning and personal development outcomes of college. Responding to the questionnaire requires that students reflect on what they are putting into and getting out of their college experience. Thus, completing the survey itself is consistent with effective educational practice. The results from the NSSE project have been used to produce a set of national benchmarks of good educational practice that participating schools are using to estimate the efficacy of their improvement efforts (Kuh, 2001). For example, administrators and faculty members at dozens of schools are using their NSSE results to discover patterns of student-faculty interactions and the frequency of student participation in other educational practices that they can influence directly and indirectly to improve student learning. In addition, some states are using NSSE data in their performance indicator systems and for other public accountability functions. Structure of the Instrument The College Student Report asks students to report the frequency with which they engage in dozens of activities that represent good educational practice, such as using the institution's human resources, curricular programs, and other opportunities for learning and development that the college provides. Additional items assess the amount of reading and writing students did during the current school year, the number of hours per week
they devoted to schoolwork, extracurricular activities, employment, and family matters, and the nature of their examinations and coursework. Seniors report whether they participated in or took advantage of such learning opportunities as being a part of a learning community, working with a faculty member on a research project, internships, community service, and study abroad. First-year students indicate whether they have done or plan to do these things. Students also record their perceptions of features of the college environment that are associated with achievement, satisfaction, and persistence including the extent to which the institution offers the support students need to succeed academically and the quality of relations between various groups on campus such as faculty and students (Astin, 1993; Pascarella & Terenzini, 1991; Tinto, 1993). Then, students estimate their educational and personal growth since starting college in the areas of general knowledge, intellectual skills, written and oral communication skills, personal, social and ethical development, and vocational preparation. These estimates are mindful of a value-added approach to outcomes assessment whereby students make judgments about the progress or gains they have made (Pace, 1984). Direct measures of student satisfaction are obtained from two questions: "How would you evaluate your entire educational experience at this institution?" "If you could start over again, would you go to the same institution you are now attending?" Students also provide information about their background, including age, gender, race or ethnicity, living situation, educational status, and major field. Finally, up to 20 additional questions can be added to obtain information specific to an institutional consortium. Schools have the option of linking their students' responses with their own institutional data base in order to examine other aspects of the undergraduate experience
Framework & Psychometric Properties
Page 3 of 26
or to compare their students= performance with data from other institutions on a mutually-determined basis for purposes of benchmarking and institutional improvement.
Validity, Reliability, and Credibility of Self-Report Data
As with all surveys, the NSSE relies on self-reports. Using self-reports from students to assess the quality of undergraduate education is common practice. Some outcomes of interest cannot be measured by achievement tests, such as attitudes and values or gains in social and practical competence. For many indicators of educational practice, such as how students use their time, student reports are often the only meaningful source of data. The validity and credibility of self-reports have been examined extensively (Baird, 1976; Berdie, 1971; Pace, 1985; Pike, 1995; Pohlmann & Beggs, 1974; Turner & Martin, 1984). The accuracy of self-reports can be affected by two general problems. The most important factor (Wentland & Smith, 1993) is the inability of respondents to provide accurate information in response to a question. The second factor is unwillingness on the part of respondents to provide what they know to be truthful information (Aaker, Kumar, & Day, 1998). In the former instance, students simply may not have enough experience with the institution to render a precise judgment or they may not understand the question. The second problem represents the possibility that students intentionally report inaccurate information about their activities or backgrounds. Research shows that people generally tend to respond accurately when questions are about their past behavior with the exception of items that explore sensitive areas or put them in an awkward, potentially embarrassing position (Bradburn & Sudman, 1988).
The validity of self-reported time use has also been examined (Gershuny & Robinson, 1988). Estimates of time usage tend to be less accurate than diary entries. However, this threat to validity can be ameliorated somewhat by asking respondents about relatively recent activities (preferably six months or less), providing a frame of reference or landmark to use, such as the period of time to be considered (Converse & Presser, 1989). Such landmarks aid memory recall and reduce distortion by telescoping, the tendency for respondents to remember events as happening more recently than they actually did (Singleton, Straits, & Straits, 1993). Requesting multiple time estimates also makes it possible to control for outliers, those whose combined estimates of time are either so high that the total number of hours reported exceeds the number available for the set of activities or those that are unreasonably low. Student self-reports are also subject to the halo effect, the possibility that students may slightly inflate certain aspects of their behavior or performance, such as grades, the amount that they gain from attending college, and the level of effort they put forth in certain activities. To the extent this Ahalo effect@ exists, it appears to be relatively constant across different types of students and schools (Pike, 1999). This means that while the absolute value of what students report may differ somewhat from what they actually do, the effect is consistent across schools and students so that the halo effect does not appear to advantage or disadvantage one institution or student group compared with another. With this in mind, self-reports are likely to be valid under five general conditions (Bradburn & Sudman, 1988; Brandt, 1958; Converse & Presser, 1989; DeNisi & Shaw, 1977; Hansford & Hattie, 1982; Laing, Swayer, & Noble 1989; Lowman & Williams, 1987; Pace, 1985; Pike, 1995). They are: (1) when
Framework & Psychometric Properties Page 4 of 26
the information requested is known to the respondents; (2) the questions are phrased clearly and unambiguously; (3) the questions refer to recent activities; (4) the respondents think the questions merit a serious and thoughtful response; and (5) answering the questions does not threaten, embarrass, or violate the privacy of the respondent or encourage the respondent to respond in socially desirable ways. The College Student Report was intentionally designed to satisfy all these conditions. The NSSE survey is administered during the spring academic term. The students randomly selected to complete The Report are first-year students and seniors who were enrolled the previous term. Therefore, all those who are sent the survey have had enough experience with the institution to render an informed judgment. The questions are about common experiences of students within the recent past. Memory recall with regard to time usage is enhanced by asking students about the frequency of their participation in activities during the current school year, a reference period of six months or less. To eliminate the variability in week-to-week fluctuations, students report the number of hours spent in each of six activities during a typical week, which also allows an accuracy check on the total number of hours students report. The format of most of the response options is a simple rating scale, which helps students to accurately recall and record the requested information, thereby minimizing this as a possible source of error. Most of the items on The Report have been used in other long-running, well-regarded college student research programs, such as UCLA's Cooperative Institutional Research Program (Astin, 1993; Sax, Astin, Korn, & Mahoney, 1997) and Indiana University's College Student Experiences Questionnaire Research Program (Kuh, Vesper, Connolly, & Pace, 1997; Pace, 1984, 1990). Responses to the Educational and Personal Growth items
have been shown to be generally consistent with other evidence, such as results from achievement tests (Brandt, 1958; Davis & Murrell, 1990; DeNisi & Shaw, 1977; Hansford & Hattie, 1982; Lowman & Williams, 1987; Pike, 1995; Pace, 1985). For example, Pike (1995) found that student reports to gains items from the CSEQ, an instrument conceptually similar to The College Student Report, were highly correlated with relevant achievement test scores (also see Anaya, 1999). He concluded that self-reports of progress could be used as proxies for achievement test results if there was a high correspondence between the content of the criterion variable and proxy indicator. In summary, a good deal of evidence shows that students are accurate, credible reporters of their activities and how much they have benefited from their college experience, provided that items are clearly worded and students have the information required to accurately answer the questions. In addition, students typically respond carefully and in many cases with personal interest to the content of such questionnaires. Because their responses are congruent with other judgments, and because for some areas students may be the best qualified to say in what ways they are different now than when they started college, it is both reasonable and appropriate that we should pay attention to what college students say about their experiences and what they’ve gained from them (Pace, 1984; Pascarella, 2001).
Framework & Psychometric Properties
Page 5 of 26
Psychometric Properties of the NSSE Validity is arguably the most important property of an assessment tool. For this reason the Design Team that developed the NSSE instrument devoted considerable time during 1998 and 1999 making certain the items on the survey were clearly worded, well-defined, and had high face and content validity. Logical relationships exist between the items in ways that are consistent with the results of objective measures and with other research. The responses to the survey items are approximately normally distributed and the patterns of responses to different clusters of items (College Activities, Educational and Personal Growth, Opinions About Your School) discriminate among students both within and across major fields and institutions. For example, factor analysis (principal components extraction with oblique rotation) is an empirical approach to establishing construct validity (Kerlinger, 1973). We used factor analysis to identify the underlying properties of student engagement represented by items on The Report. These and other analyses will be described in more detail later. The degree to which an instrument is reliable is another important indicator of an instrument=s psychometric quality. Reliability is the degree to which a set of items consistently measures the same thing across respondents and institutional settings. Another characteristic of a reliable instrument is stability, the degree to which the students respond in similar ways at two different points in time. One approach to measuring stability is test-retest, wherein the same students are asked to fill out The Report two or more times within a reasonably short period of time. Very few large-scale survey instruments have test-retest information available due to the substantial expense and effort needed to obtain such information. It=s particularly challenging and logistically problematic for a
national study of college students conducted during the spring term to collect test-retest data because of the amount of time available to implement the original survey and then in the short amount of time left in the term to locate once again and convince respondents to complete the instrument a second time. Estimating the stability aspect of reliability is problematic in two other ways. First, the student experience is somewhat of a moving target; a month=s time for some students can make a non-trivial difference in how they respond to some items because of what=s transpired between the first and second administration of the survey. Second, attempts to estimate the stability of an instrument assume that the items have not changed or been re-worded. To improve the validity and reliability of The Report, minor editing and item substitutions have been made prior to each administration. We=ll return to these points later. Two additional pertinent indicators are estimates of skewness and kurtosis. Skewness represents the extent to which scores are bunched toward the upper or lower end of a distribution, while kurtosis indicates the extent to which a distribution of scores is relatively flat or relatively peaked. Values ranging from approximately + 1.00 to - 1.00 on these indicators are generally regarded as evidence of normality. For some items, out-of-range skewness values can be expected, such as participating in a community-based project as part of a regular course where, because of a combination of factors (major, course selection, faculty interest), relatively few students will respond something other than Anever.@
To establish The Report=s validity and reliability we’ve conducted psychometric analyses following all six administrations of the instrument, beginning with the field tests in 1999. These analyses are based on 3,226
Framework & Psychometric Properties Page 6 of 26
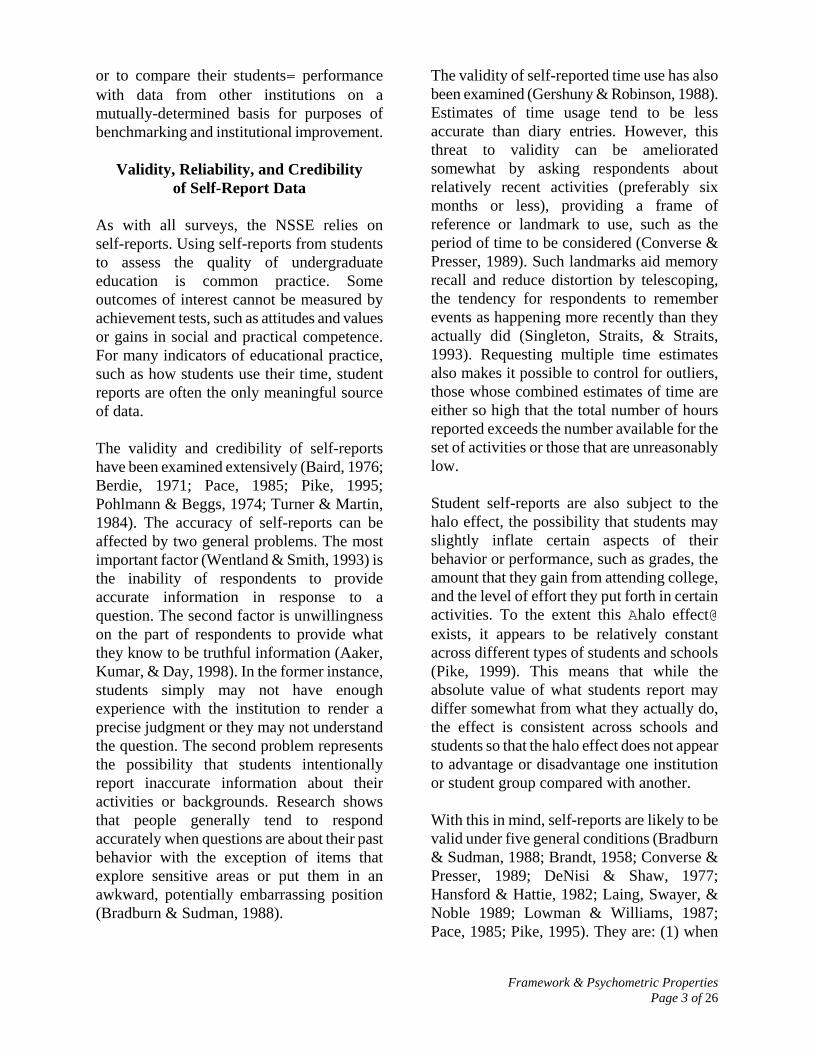
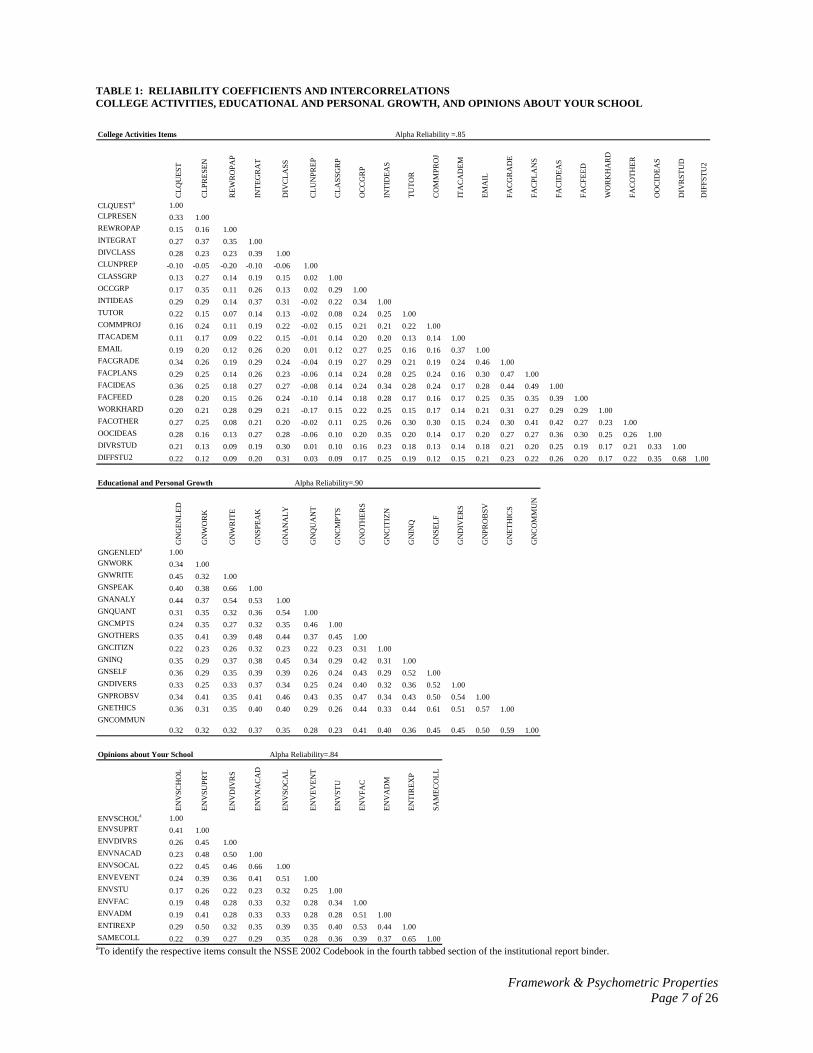
students at 12 institutions in spring, 1999, 12,472 students at 56 institutions in fall 1999, 63,517 students at 276 institutions in spring 2000, 89,917 students at 321 institutions in spring 2001, 118,355 students at 366 institutions in spring 2002, and 122,584 students at 427 institutions in spring 2003. The following sections describe some of the more important findings from the various psychometric analyses of items and scales from The College Student Report conducted between June 1999 and August 2003. Additional information about most of the analyses reported here is available on the NSSE web site (www.indiana.edu/~nsse) or from NSSE project staff. College Activities Items This section includes the 22 items on the first page of The Report that represent activities in which students engage inside and outside the classroom. The vast majority of these items are expressions of empirically derived good educational practices; that is, the research shows they are positively correlated with many desired outcomes of college. The exceptions are the item about coming to class unprepared and the two items about information technology that have yet to be empirically substantiated as good educational practice. Items from some other sections of The Report also are conceptually congruent with these activities, such as the amount of time (number of hours) students spend on a weekly basis participating in various activities (studying, socializing, working, extra- curricular involvements). As expected, the Acoming to class unprepared@ (CLUNPREP) item was not highly correlated with the other 21 College Activities (CA) items. To facilitate psychometric and other data analyses this item was reverse scored and the reliability coefficient (Cronbach=s alpha) for the 22 CA items was .85 (Table 1). Except for the
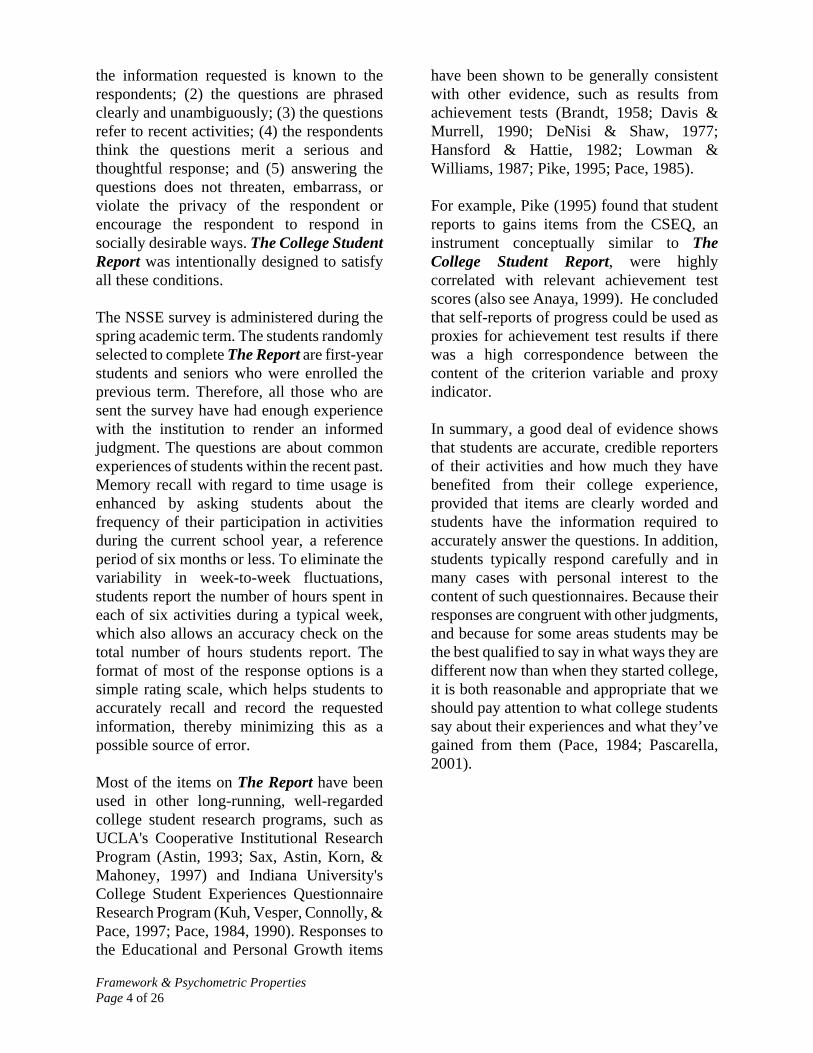
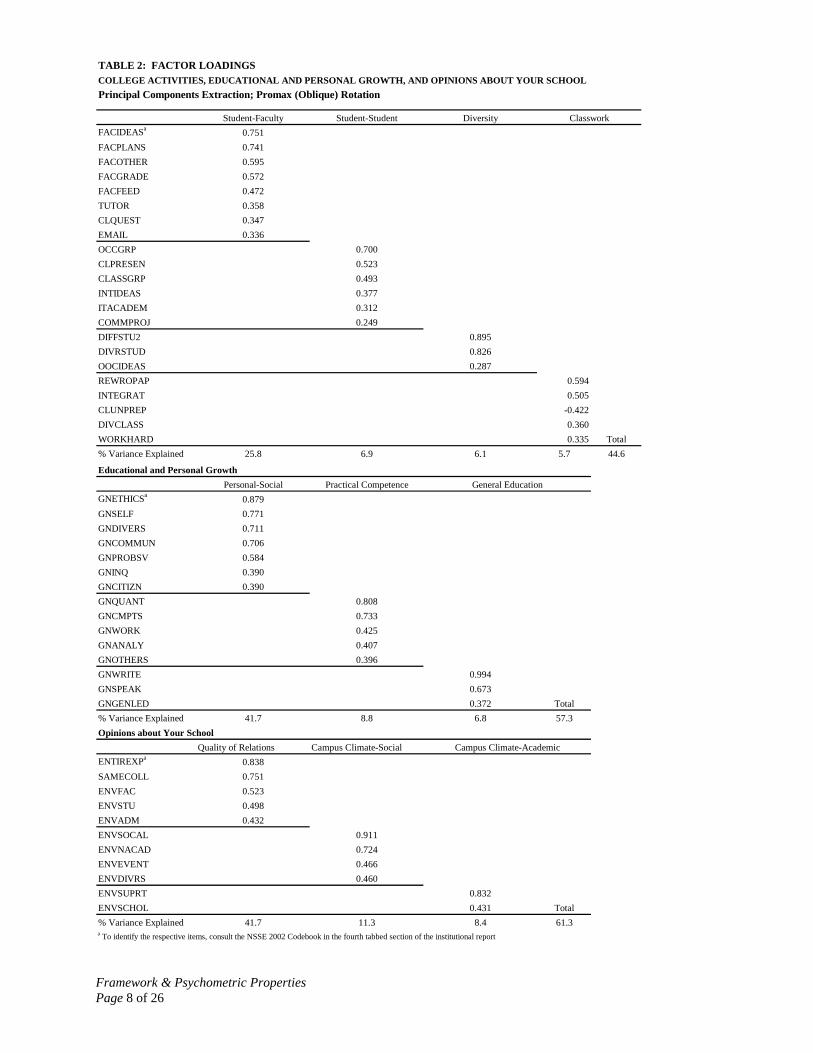
CLUNPREP item, the intercorrelations for the CA items range from 0.09 to 0.68. Most of the lowest correlations are associated with the Acoming to class unprepared@ item and the item about rewriting a paper several times. Those most highly correlated in this section include the four faculty-related items: “discussed grades or assignments with an instructor,” “talked about career plans with a faculty member or advisor,” “discussed ideas from your readings or classes with a faculty member outside of class” (FACIDEAS) and “received prompt feedback from faculty on your academic performance (written or oral)” (FACFEED). Principal components analysis of the 22 CA items with oblique rotation produced four factors accounting for about 45% of the variance in student responses (Table 2). The factors are mindful of such principles of good practice as faculty-student interaction, peer cooperation, academic effort, and exposure to diverse views. As intended, the underlying constructs of engagement represented by the 22 CA items are consistent with the behaviors that previous research has linked with good educational practice. The skewness and kurtosis estimates for the CA items are generally acceptable, indicating that responses to the individual CA and related items are relatively normally distributed. One noteworthy exception is the “participating in a community-based project as part of a regular course” which was markedly positively skewed as about 66% answered "never.”
Framework & Psychometric Properties
Page 7 of 26
TABLE 1: RELIABILITY COEFFICIENTS AND INTERCORRELATIONS COLLEGE ACTIVITIES, EDUCATIONAL AND PERSONAL GROWTH, AND OPINIONS ABOUT YOUR SCHOOL
College Activities Items
CLQ
UES
T
CLP
RES
EN
REW
RO
PAP
INTE
GR
AT
DIV
CLA
SS
CLU
NPR
EP
CLA
SSG
RP
OC
CG
RP
INTI
DEA
S
TUTO
R
CO
MM
PRO
J
ITA
CA
DEM
EMA
IL
FAC
GR
AD
E
FAC
PLA
NS
FAC
IDEA
S
FAC
FEED
WO
RK
HA
RD
FAC
OTH
ER
OO
CID
EAS
DIV
RST
UD
DIF
FSTU
2
CLQUESTa 1.00CLPRESEN 0.33 1.00REWROPAP 0.15 0.16 1.00INTEGRAT 0.27 0.37 0.35 1.00DIVCLASS 0.28 0.23 0.23 0.39 1.00CLUNPREP -0.10 -0.05 -0.20 -0.10 -0.06 1.00CLASSGRP 0.13 0.27 0.14 0.19 0.15 0.02 1.00OCCGRP 0.17 0.35 0.11 0.26 0.13 0.02 0.29 1.00INTIDEAS 0.29 0.29 0.14 0.37 0.31 -0.02 0.22 0.34 1.00TUTOR 0.22 0.15 0.07 0.14 0.13 -0.02 0.08 0.24 0.25 1.00COMMPROJ 0.16 0.24 0.11 0.19 0.22 -0.02 0.15 0.21 0.21 0.22 1.00ITACADEM 0.11 0.17 0.09 0.22 0.15 -0.01 0.14 0.20 0.20 0.13 0.14 1.00EMAIL 0.19 0.20 0.12 0.26 0.20 0.01 0.12 0.27 0.25 0.16 0.16 0.37 1.00FACGRADE 0.34 0.26 0.19 0.29 0.24 -0.04 0.19 0.27 0.29 0.21 0.19 0.24 0.46 1.00FACPLANS 0.29 0.25 0.14 0.26 0.23 -0.06 0.14 0.24 0.28 0.25 0.24 0.16 0.30 0.47 1.00FACIDEAS 0.36 0.25 0.18 0.27 0.27 -0.08 0.14 0.24 0.34 0.28 0.24 0.17 0.28 0.44 0.49 1.00FACFEED 0.28 0.20 0.15 0.26 0.24 -0.10 0.14 0.18 0.28 0.17 0.16 0.17 0.25 0.35 0.35 0.39 1.00WORKHARD 0.20 0.21 0.28 0.29 0.21 -0.17 0.15 0.22 0.25 0.15 0.17 0.14 0.21 0.31 0.27 0.29 0.29 1.00FACOTHER 0.27 0.25 0.08 0.21 0.20 -0.02 0.11 0.25 0.26 0.30 0.30 0.15 0.24 0.30 0.41 0.42 0.27 0.23 1.00OOCIDEAS 0.28 0.16 0.13 0.27 0.28 -0.06 0.10 0.20 0.35 0.20 0.14 0.17 0.20 0.27 0.27 0.36 0.30 0.25 0.26 1.00DIVRSTUD 0.21 0.13 0.09 0.19 0.30 0.01 0.10 0.16 0.23 0.18 0.13 0.14 0.18 0.21 0.20 0.25 0.19 0.17 0.21 0.33 1.00DIFFSTU2 0.22 0.12 0.09 0.20 0.31 0.03 0.09 0.17 0.25 0.19 0.12 0.15 0.21 0.23 0.22 0.26 0.20 0.17 0.22 0.35 0.68 1.00
GN
GEN
LED
GN
WO
RK
GN
WR
ITE
GN
SPEA
K
GN
AN
ALY
GN
QU
AN
T
GN
CM
PTS
GN
OTH
ERS
GN
CIT
IZN
GN
INQ
GN
SELF
GN
DIV
ERS
GN
PRO
BSV
GN
ETH
ICS
GN
CO
MM
UN
GNGENLEDa 1.00GNWORK 0.34 1.00GNWRITE 0.45 0.32 1.00GNSPEAK 0.40 0.38 0.66 1.00GNANALY 0.44 0.37 0.54 0.53 1.00GNQUANT 0.31 0.35 0.32 0.36 0.54 1.00GNCMPTS 0.24 0.35 0.27 0.32 0.35 0.46 1.00GNOTHERS 0.35 0.41 0.39 0.48 0.44 0.37 0.45 1.00GNCITIZN 0.22 0.23 0.26 0.32 0.23 0.22 0.23 0.31 1.00GNINQ 0.35 0.29 0.37 0.38 0.45 0.34 0.29 0.42 0.31 1.00GNSELF 0.36 0.29 0.35 0.39 0.39 0.26 0.24 0.43 0.29 0.52 1.00GNDIVERS 0.33 0.25 0.33 0.37 0.34 0.25 0.24 0.40 0.32 0.36 0.52 1.00GNPROBSV 0.34 0.41 0.35 0.41 0.46 0.43 0.35 0.47 0.34 0.43 0.50 0.54 1.00GNETHICS 0.36 0.31 0.35 0.40 0.40 0.29 0.26 0.44 0.33 0.44 0.61 0.51 0.57 1.00GNCOMMUN
0.32 0.32 0.32 0.37 0.35 0.28 0.23 0.41 0.40 0.36 0.45 0.45 0.50 0.59 1.00
Opinions about Your School
ENV
SCH
OL
ENV
SUPR
T
ENV
DIV
RS
ENV
NA
CA
D
ENV
SOC
AL
ENV
EVEN
T
ENV
STU
ENV
FAC
ENV
AD
M
ENTI
REX
P
SAM
ECO
LL
ENVSCHOLa 1.00ENVSUPRT 0.41 1.00ENVDIVRS 0.26 0.45 1.00ENVNACAD 0.23 0.48 0.50 1.00ENVSOCAL 0.22 0.45 0.46 0.66 1.00ENVEVENT 0.24 0.39 0.36 0.41 0.51 1.00ENVSTU 0.17 0.26 0.22 0.23 0.32 0.25 1.00ENVFAC 0.19 0.48 0.28 0.33 0.32 0.28 0.34 1.00ENVADM 0.19 0.41 0.28 0.33 0.33 0.28 0.28 0.51 1.00ENTIREXP 0.29 0.50 0.32 0.35 0.39 0.35 0.40 0.53 0.44 1.00SAMECOLL 0.22 0.39 0.27 0.29 0.35 0.28 0.36 0.39 0.37 0.65 1.00
Alpha Reliability =.85
Alpha Reliability=.90
Alpha Reliability=.84
Educational and Personal Growth
aTo identify the respective items consult the NSSE 2002 Codebook in the fourth tabbed section of the institutional report binder.
Framework & Psychometric Properties Page 8 of 26
TABLE 2: FACTOR LOADINGSCOLLEGE ACTIVITIES, EDUCATIONAL AND PERSONAL GROWTH, AND OPINIONS ABOUT YOUR SCHOOL Principal Components Extraction; Promax (Oblique) Rotation
Student-Faculty Student-Student DiversityFACIDEASa 0.751 FACPLANS 0.741 FACOTHER 0.595 FACGRADE 0.572 FACFEED 0.472 TUTOR 0.358 CLQUEST 0.347 EMAIL 0.336 OCCGRP 0.700 CLPRESEN 0.523 CLASSGRP 0.493 INTIDEAS 0.377 ITACADEM 0.312 COMMPROJ 0.249 DIFFSTU2 0.895 DIVRSTUD 0.826 OOCIDEAS 0.287 REWROPAP 0.594INTEGRAT 0.505CLUNPREP -0.422DIVCLASS 0.360WORKHARD 0.335 Total% Variance Explained 25.8 6.9 6.1 5.7 44.6
Educational and Personal GrowthPersonal-Social Practical Competence
GNETHICSa 0.879GNSELF 0.771GNDIVERS 0.711GNCOMMUN 0.706GNPROBSV 0.584GNINQ 0.390GNCITIZN 0.390GNQUANT 0.808GNCMPTS 0.733GNWORK 0.425GNANALY 0.407GNOTHERS 0.396GNWRITE 0.994GNSPEAK 0.673GNGENLED 0.372 Total% Variance Explained 41.7 8.8 6.8 57.3Opinions about Your School
Quality of Relations Campus Climate-SocialENTIREXPa 0.838SAMECOLL 0.751ENVFAC 0.523ENVSTU 0.498ENVADM 0.432ENVSOCAL 0.911ENVNACAD 0.724ENVEVENT 0.466ENVDIVRS 0.460ENVSUPRT 0.832ENVSCHOL 0.431 Total% Variance Explained 41.7 11.3 8.4 61.3a To identify the respective items, consult the NSSE 2002 Codebook in the fourth tabbed section of the institutional report
Classwork
General Education
Campus Climate-Academic
Framework & Psychometric Properties
Page 9 of 26
Reading, Writing, and Other Educational Program Characteristics Some additional items address other important aspects of how students spend their time and what the institution asks them to do, which directly and indirectly affect their engagement. The results discussed in this section are not presented in a table but are available from the NSSE website. The five items about the extent to which the institution emphasizes different kinds of mental activities represent some of the skills in Bloom=s (1956) taxonomy of educational objectives. The standardized alpha for these items is .70 when the lowest order mental function item, memorization, is included. However, the alpha jumps to .80 after deleting the memorization item. This set of items is among the best predictors of self-reported gains, suggesting that the items are reliably estimating the degree to which the institution is challenging students to perform higher order intellectual tasks. Patterns of correlations among these items are consistent with what one would expect. For example, the item related to the number of hours spent preparing for class is positively related to several questions surrounding academic rigor such as the number of assigned course readings (.25), coursework emphasis on analyzing ideas and theories (.16) and synthesizing information and experiences (.16), the number of mid-sized (5-19 pages) written papers (.15), and the challenging nature of exams (.21). Likewise, the number of assigned readings is predictably related to the number of small (.24) and mid-sized (.29) papers written. Interestingly, the quality of academic advising is positively correlated with the four higher order mental activities, analyzing (.15), synthesizing (.17), evaluating (.15), and applying (.17), and is also positively related to the challenging nature of examinations (.20).
The set of educational program experiences (e.g., internships, study abroad, community service, working with a faculty member on a research project) have an alpha of .52. Working on a research project with a faculty member is positively related to independent study (.27), culminating senior experiences (.25), and writing papers of 20 pages or more (.15). Also, students who had taken foreign language coursework were more likely to study abroad (.24). It=s worth mentioning that the national College Student Experiences Questionnaire database shows that the proportion of students saying they have worked on research with a faculty member has actually increased since the late 1980s, suggesting that collaboration on research may be increasingly viewed and used as a desirable, pedagogically effective strategy (Kuh & Siegel, 2000; Kuh, Vesper, Connolly, & Pace, 1997). Finally, the time usage items split into two sets of activities, three that are positively correlated with other aspects of engagement and educational and personal gains (academic preparation, extracurricular activities, work on campus) and three items that are either not correlated or are negatively associated with engagement (socializing, work off campus, caring for dependents). Less than 1% of full-time students reported a total of more than 100 hours across all six time allocation categories. Three quarters of all students reported spending an average of between 35 and 80 hours a week engaged in these activities plus attending class. Assuming that full-time students are in class about 15 hours per week and sleep another 55 hours or so a week, the range of 105 to 150 hours taken up in all these activities out of a 168-hour week appears reasonable. A few of these items have out-of-range but explainable skewness and kurtosis indicators. They include the number of hours spent working on campus (72% work five or fewer hours per week), the number of papers of 20
Framework & Psychometric Properties Page 10 of 26
pages or more (66% said "none"), number of non-assigned books read (78% said fewer than 5), and the number of hours students spend caring for dependents (78% reported 5 or fewer hours). Educational and Personal Growth These 15 items are at the top of page 3 on The College Student Report and have an alpha coefficient of .90 (Table 1). The intercorrelations for these items range from .22 to .65. The lowest intercorrelations are between voting in elections and analyzing quantitative problems (.22), acquiring job or work-related knowledge and skills (.22), and computer and technology skills (.23). Four correlations were at .57 or higher: between writing and speaking (.66), and between developing a personal code of values and ethics and understanding yourself (.61), understanding people of other racial and ethnic backgrounds (.51), and contributing to the welfare of your community (.59).
Principal components analysis yielded three factors (Table 2). The first is labeled Apersonal and social development@ and it is made up of seven items that represent outcomes that characterize interpersonally effective, ethically grounded, socially responsible, and civic minded individuals. The second factor has only three items and is labeled Apractical competence@ to reflect the skill areas needed to be economically independent in today=s post-college job market. The final factor labeled Ageneral education@ is composed of four items that are earmarks of a well-educated person. Taken together, the three factors account for about 57.3% of the total variance. Skewness and kurtosis estimates indicate a fairly normal distribution of responses. All skewness statistics are between –1.00 and +1.00 and only two items, understanding people of other racial and ethnic backgrounds
and developing a personal code of values and ethics are slightly platykurtic (more responses at the ends and fewer in the middle creating a flatter distribution). In an attempt to obtain concurrent validity data we obtained, with students= permission, the end-of-semester gpa and cumulative gpa for 349 undergraduates at a large research university who completed NSSE 2000 College Student Report. The self-reported gains items most likely to be a function of primarily academic performance are those represented by the general education factor. Using these four items as the dependent variable, the partial correlations for semester gpa and cumulative gpa were .16 and .13. respectively. Both are statistically significant (p<.01). Other evidence of validity of the Educational and Personal Growth items can be found from examining the scores of first-year and senior students, and students in different majors. Seniors typically report greater overall gains than first-year students, though on a few personal and social development items (self-understanding, being honest and truthful) older students sometimes reported less growth compared with traditional-age seniors on these individual items. The patterns of scores reported by students vary across majors and length of study in the same manner as has been determined through direct achievement testing. For example, science and mathematics majors report greater gains in quantitative analysis compared with other majors. Also, students in applied majors report greater gains in vocational competence compared with their counterparts majoring in history, literature, and the performing arts. As part of the ongoing NSSE project research program we are seeking additional evidence of concurrent validity of these items.
Framework & Psychometric Properties
Page 11 of 26
Opinions About Your School These items are on page 3 of the instrument and represent students= views of important aspects of their college=s environment. The alpha coefficient for these 11 items (including the two items on students= overall satisfaction with college) is .84 (Table 1). The intercorrelations range between .22 to .65, indicating that all these dimensions of the college or university environment are positively related. That is, the degree to which an institution emphasizes spending time on academics is not antithetical to providing support for academic success or friendly, supportive relations with students and faculty members. At the same time, most of the correlations are low to moderate in strength, indicating that these dimensions make distinctive contributions to an institution's learning environment. Skewness and kurtosis indicators are all in the acceptable range. Principal components analysis of these items produced three factors (Table 2) accounting for about 61% of the total variance. The first factor, Astudent satisfaction with college and quality of personal relations,@ is made up of five items. The second factor is labeled Acampus climate-social@ and consists of four items. The third factor is “campus climate-academic” that consists of two items. Thus, students perceive that their institution=s environment has three related dimensions. The first represents their level of satisfaction with the overall experience and their interactions with others. The second and the third are broad constructs that reflect the degree to which students believe the programs, policies and practices of their school are supportive and instrumental in both social and academic aspects in helping them attain their personal and educational goals. Summary. The pattern of responses from first-year students and seniors suggest the items are measuring what they are supposed to measure.
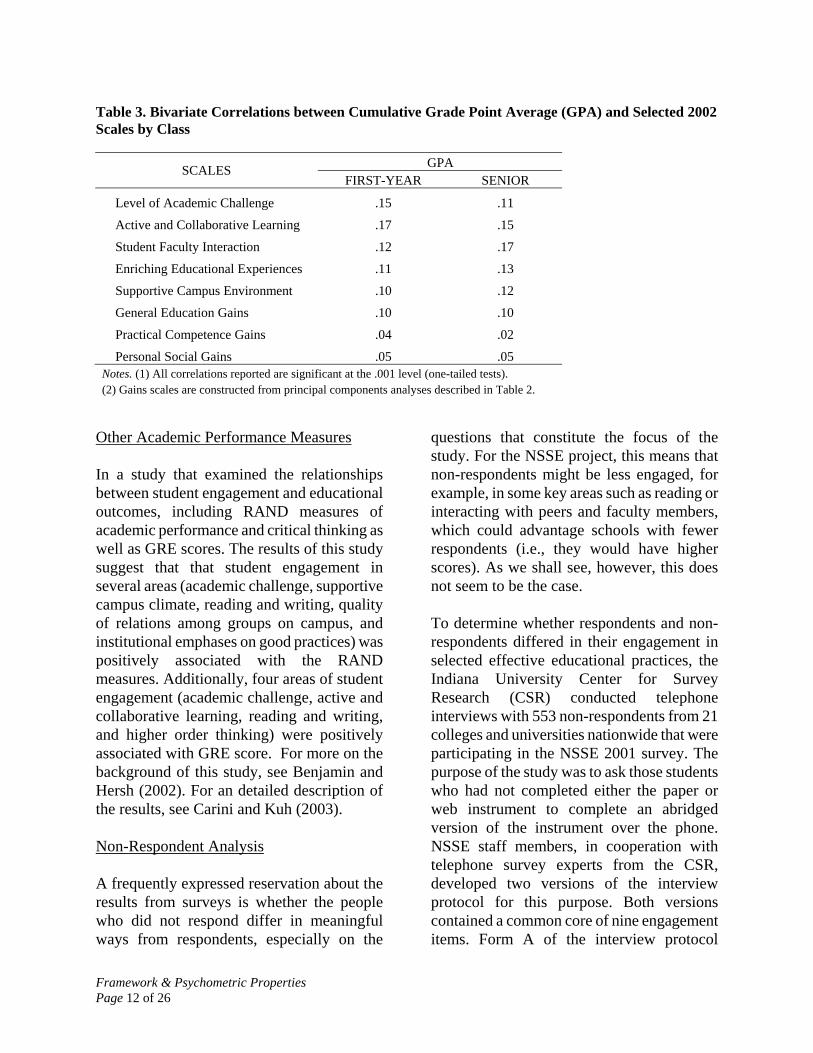
For example, one would expect seniors to be, on average, more engaged in their educational pursuits compared with first-year students. Seniors would be expected to score higher on most College Activities items and reporting that their coursework places more emphasis on higher order intellectual skills, such as analysis and synthesis as contrasted with memorization. Among the exceptions is that seniors reported re-writing papers and assignments less frequently than first-year students. This may be because first-year students are more likely to take classes that require multiple drafts of papers or because seniors have become better writers during college and need fewer drafts to produce acceptable written work. On the two other items, both of which are related to interacting with peers from different backgrounds, first-year students and seniors were comparable. Overall, the items on The Report appear to be measuring what they are intended to measure and discriminate among students in expected ways. Grades and Engagement Student-reported grade point average (GPA) is positively correlated with the five benchmarks, as well as with three additional scales that measure student-reported gains at their institution in three areas: general education, practical competence, and personal-social growth (See Table 3). These patterns hold for both first-year and senior students. These correlations likely understate the link between grades and engagement, particularly for seniors, because GPA is cumulative over the student’s college career while engagement is typically measured over the current school year. While these analyses cannot determine the degree to which engagement promotes higher grades, or higher grades promote more intense engagement, the upshot is clear: higher engagement levels and higher grades go hand-in-hand.
Framework & Psychometric Properties Page 12 of 26
Table 3. Bivariate Correlations between Cumulative Grade Point Average (GPA) and Selected 2002 Scales by Class
GPA SCALES FIRST-YEAR SENIOR
Level of Academic Challenge .15 .11
Active and Collaborative Learning .17 .15
Student Faculty Interaction .12 .17
Enriching Educational Experiences .11 .13
Supportive Campus Environment .10 .12
General Education Gains .10 .10
Practical Competence Gains .04 .02
Personal Social Gains .05 .05 Notes. (1) All correlations reported are significant at the .001 level (one-tailed tests). (2) Gains scales are constructed from principal components analyses described in Table 2.
Other Academic Performance Measures In a study that examined the relationships between student engagement and educational outcomes, including RAND measures of academic performance and critical thinking as well as GRE scores. The results of this study suggest that that student engagement in several areas (academic challenge, supportive campus climate, reading and writing, quality of relations among groups on campus, and institutional emphases on good practices) was positively associated with the RAND measures. Additionally, four areas of student engagement (academic challenge, active and collaborative learning, reading and writing, and higher order thinking) were positively associated with GRE score. For more on the background of this study, see Benjamin and Hersh (2002). For an detailed description of the results, see Carini and Kuh (2003). Non-Respondent Analysis
A frequently expressed reservation about the results from surveys is whether the people who did not respond differ in meaningful ways from respondents, especially on the
questions that constitute the focus of the study. For the NSSE project, this means that non-respondents might be less engaged, for example, in some key areas such as reading or interacting with peers and faculty members, which could advantage schools with fewer respondents (i.e., they would have higher scores). As we shall see, however, this does not seem to be the case. To determine whether respondents and non-respondents differed in their engagement in selected effective educational practices, the Indiana University Center for Survey Research (CSR) conducted telephone interviews with 553 non-respondents from 21 colleges and universities nationwide that were participating in the NSSE 2001 survey. The purpose of the study was to ask those students who had not completed either the paper or web instrument to complete an abridged version of the instrument over the phone. NSSE staff members, in cooperation with telephone survey experts from the CSR, developed two versions of the interview protocol for this purpose. Both versions contained a common core of nine engagement items. Form A of the interview protocol
Framework & Psychometric Properties
Page 13 of 26
included six additional questions and Form B included six different additional questions. Students in the non-respondent sample were randomly assigned a priori to one of two groups. Those in Group 1 were interviewed using Form A and those in Group 2 were interviewed using Form B. This procedure allowed us to ask a substantial number of questions from the survey without making the interview too long to jeopardize reliability and validity. CSR staff randomly selected between 100 and 200 students from each school (based on total undergraduate enrollment) who were judged to be non-respondents by mid-April 2001. That is, those classified as non-respondents had been contacted several times and invited to complete The College Student Survey but had not done so. The goal was to interview at least 25 non-respondents from each of the 21 institutions for a total of 525. Data were collected using the University of California Computer-Assisted Survey Methods software (CASES). All interviewers had at least 20 hours of training in interviewing techniques and an additional hour of study-specific training using the NSSE Non-Respondent Interview protocol. Students with confirmed valid telephone numbers were called at least a dozen times, unless the respondent refused or insufficient time remained before the end of the study. Multivariate analysis of variance was used to compare the two groups of respondents and non-respondents from the respective schools on 21 engagement and 3 demographic items from The College Student Report. The analyses were conducted separately for first-year and senior students. The total numbers of students with complete usable information for this analysis were as follows: first-year respondents = 3,470 and non-respondents = 291, and senior respondents = 3,391 and non-respondents =199.
Compared with first-year respondents, first-year non-respondents scored higher on nine comparisons. First-year respondents scored higher on only three items (using e-mail to contact an instructor, writing more papers fewer than 5 pages, and taking more classes that emphasized memorization). There were no differences on 7 of the 21 comparable items. For seniors, non-respondents again appeared to be somewhat more engaged than respondents as they scored higher on six items while senior respondents scored higher on the same three items as their first-year counterparts (using e-mail to contact an instructor, writing more papers fewer than 5 pages long, taking more classes that emphasized memorization). No differences were found on more than half (11) of the items. Overall, it appears that undergraduate students who do not complete the NSSE survey when invited to do so may be slightly more engaged than respondents. This is counter to what many observers believe, that non-respondents have a less educationally productive experience and, as a result, do not respond to surveys. The findings from the telephone interviews suggest that the opposite may be true, that non-respondents are busier in many dimensions of their lives and don=t take time to complete surveys. At the same time we must exercise due caution in drawing firm conclusions from these results. Telephone interviews typically are associated with a favorable mode effect, meaning that those interviewed often respond somewhat more positively to telephone surveys than when answering the same questions on a paper questionnaire (Dillman, Sangster, Tarnai & Rockwood, 1996). Thus, it appears that few meaningful differences exist between respondents and non-respondents in terms of their engagement in educationally effective practices.
Framework & Psychometric Properties Page 14 of 26
Estimates of Stability It is important that participating colleges and universities as well as others who use the results from the NSSE survey be confident that the benchmarks and norms accurately and consistently measure the student behaviors and perceptions represented on the survey. The minimum sample sizes established for various size institutions and the random sampling process used in the NSSE project assures that each school will have a reasonable number of respondents generally representative of the respective institution. It is also important to assure institutions and others who use the data that the results from The Report are relatively stable from year to year, indicating that the instrument produces reliable measurements from one year to the next. That is, are students with similar characteristics responding approximately the same way from year to year? Over longer periods of time, of course, one might expect to see statistically significant and even practically important improvements in the quality of the undergraduate experience. But changes from one year to the next should be minimal if the survey is producing reliable results. The approaches that have been developed in psychological testing to estimate stability of measurements make some assumptions about the domain to be tested that do not hold for the NSSE project. Among the most important is that the respondent and the environment in which the testing occurs do not change. This is contrary, of course, to the goals of higher education. Students are supposed to change, by learning more and changing the way they think and act. Not only is the college experience supposed to change people, the rates at which individuals change or grow are highly variable. In addition, during the past decade many colleges have made concerted efforts to improve the undergraduate experience, especially that of first-year students. All this is to say that attempts to
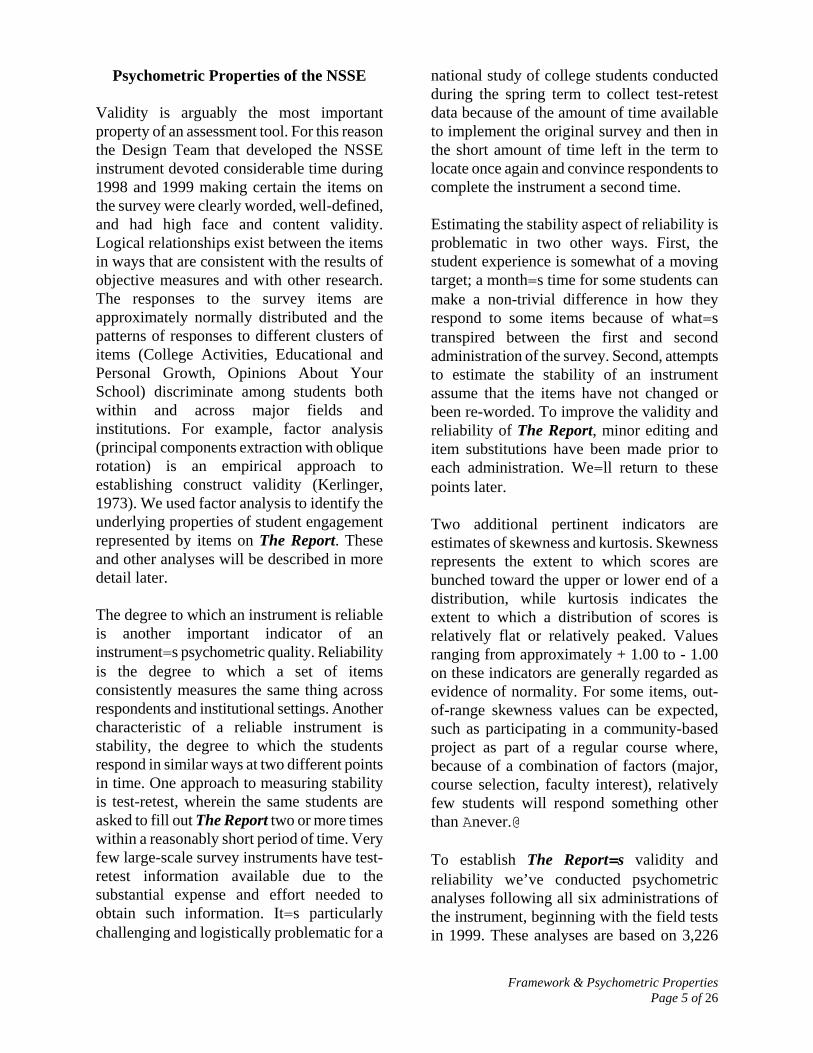
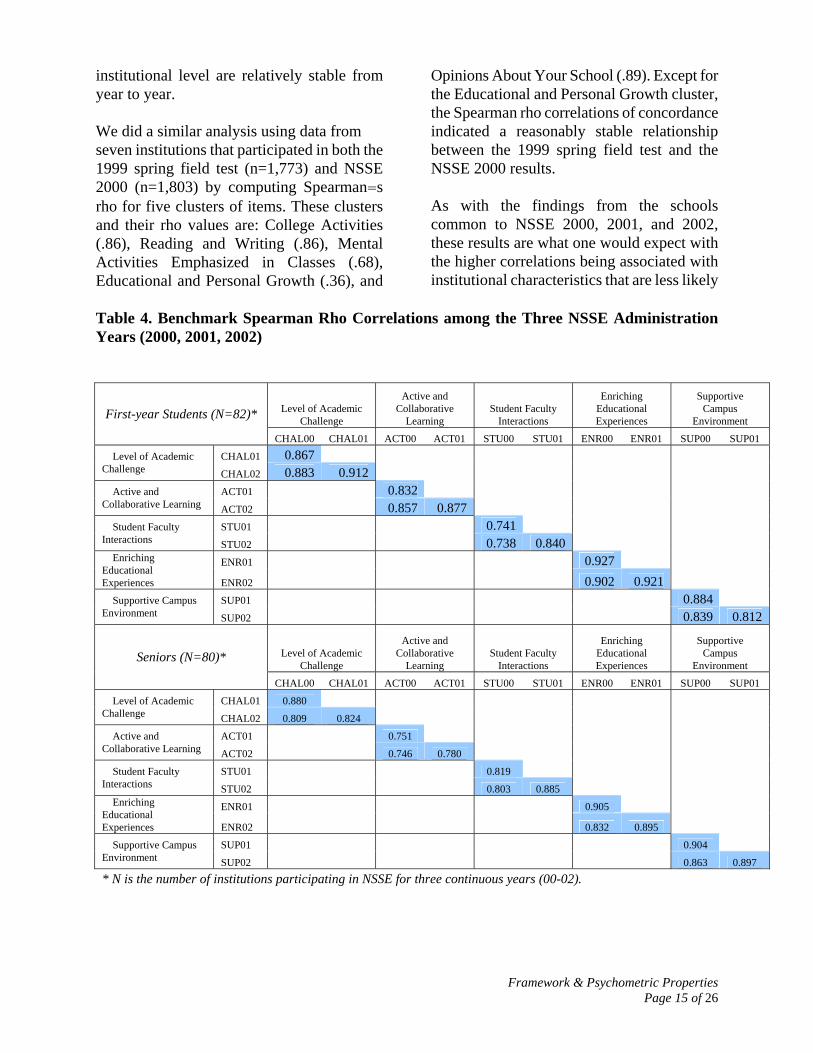
estimate the stability of students= responses to surveys about the nature of their experience are tricky at best. With these caveats in mind, we have to date estimated the stability of NSSE data in three different ways to determine if students at the same institutions report their experiences in similar ways from one year to the next. Two of these approaches are based on responses from students at the colleges and universities where the NSSE survey was administered in 2000, 2001, and 2002. Are Student Engagement Scores Stable from One Year to the Next? The first stability estimate is a correlation of concordance, which measures the strength of the association between scores from two time periods. NSSE has conducted three national administrations since 2000. This analysis is based on student responses from institutions that used NSSE two or more years. That is, 127 schools administered NSSE in both 2000 and 2001; 156 schools in 2001 and 2002; and 144 institutions used the survey in 2000 and again in 2002. In addition, we also analyzed separately the 80 colleges and universities that administered the survey all three years. This assured that institutional characteristics are fully controlled. We computed Spearman's rho correlations for the five benchmarks using the aggregated institutional level data. The benchmarks were calculated using unweighted student responses to survey items that were essentially the same for the three years. These benchmarks and their rho values range from .74 to .92 for the 2000-2001 comparison, .79 to .92 for the 2001-2002 comparison, .79 to .90 for the 2000 and 2002 comparison, and .74 to .93 for the three-year comparison (See Table 4). Additional analyses were run comparing scores for the 214 institutions that participated in NSSE in both 2002 and 2003. Spearman’s rho values for these analyses ranged from .81 to .93. Together, these findings suggest that the NSSE data at the
Framework & Psychometric Properties
Page 15 of 26
institutional level are relatively stable from year to year. We did a similar analysis using data from seven institutions that participated in both the 1999 spring field test (n=1,773) and NSSE 2000 (n=1,803) by computing Spearman=s rho for five clusters of items. These clusters and their rho values are: College Activities (.86), Reading and Writing (.86), Mental Activities Emphasized in Classes (.68), Educational and Personal Growth (.36), and
Opinions About Your School (.89). Except for the Educational and Personal Growth cluster, the Spearman rho correlations of concordance indicated a reasonably stable relationship between the 1999 spring field test and the NSSE 2000 results. As with the findings from the schools common to NSSE 2000, 2001, and 2002, these results are what one would expect with the higher correlations being associated with institutional characteristics that are less likely
Table 4. Benchmark Spearman Rho Correlations among the Three NSSE Administration Years (2000, 2001, 2002)
Level of Academic Challenge
Active and Collaborative
Learning Student Faculty
Interactions
Enriching Educational Experiences
Supportive Campus
Environment First-year Students (N=82)*
CHAL00 CHAL01 ACT00 ACT01 STU00 STU01 ENR00 ENR01 SUP00 SUP01
CHAL01 0.867 Level of Academic Challenge CHAL02 0.883 0.912
ACT01 0.832 Active and Collaborative Learning ACT02 0.857 0.877
STU01 0.741 Student Faculty Interactions STU02 0.738 0.840
ENR01 0.927 Enriching Educational Experiences ENR02 0.902 0.921
SUP01 0.884 Supportive Campus Environment SUP02 0.839 0.812
Level of Academic Challenge
Active and Collaborative
Learning Student Faculty
Interactions
Enriching Educational Experiences
Supportive Campus
Environment Seniors (N=80)*
CHAL00 CHAL01 ACT00 ACT01 STU00 STU01 ENR00 ENR01 SUP00 SUP01
CHAL01 0.880 Level of Academic Challenge CHAL02 0.809 0.824
ACT01 0.751 Active and Collaborative Learning ACT02 0.746 0.780
STU01 0.819 Student Faculty Interactions STU02 0.803 0.885
ENR01 0.905 Enriching Educational Experiences ENR02 0.832 0.895
SUP01 0.904 Supportive Campus Environment SUP02 0.863 0.897 * N is the number of institutions participating in NSSE for three continuous years (00-02).
Framework & Psychometric Properties Page 16 of 26
to change from one year to the next, such as the amount of reading and writing and the types of activities that can be directly influenced by curricular requirements, such as community service and working with peers during class to solve problems. The lower correlations are in areas more directly influenced by student characteristics, such as estimates of educational personal growth. A second approach to estimating stability from one year to the next was done using matched sample t-tests to determine if differences existed in student responses to individual survey items within a two-year period. For both first-year and senior students, about 18% of the items between 2000 and 2001 have large effect sizes and less than 16% of the items common to 2000 and 2002 have large effect size differences; only 3% of NSSE items between 2001 and 2002 have large mean difference effect sizes (> .80). For both first-year students and seniors, NSSE items are highly or moderately correlated between any of the two years, with all coefficients being statistically significant, ranging from .60 to .96. The few exceptions that fall below the .6 threshold are items where changes were made in wording or response options or where student changes may occur (e.g., using of technology, co-curricular activities, and student-reported gains in voting and elections, etc.). We used a similar approach to estimate the stability of NSSE results from the seven schools that were common to the spring 1999 pilot and the spring 2000 survey. This analysis did not yield any statistically significant differences (p<.001). We then compared item cluster means (those described earlier in this section) for the individual institutions using a somewhat lower threshold of statistical significance (p<.05, two-tailed). Only four of 35 comparisons reached statistical significance. Moreover, the effect sizes of
these differences again were relatively small, in the .25 range. Test-Retest. The third approach to estimating stability was a form of test-retest analysis. We have two sources of test-retest data that provide some clues about the relative stability of the instrument at the individual student level, though the information is far from definitive evidence. In response to a financial incentive (a $10 long distance telephone calling card), 129 students at a university participating in NSSE 2000 agreed to complete The Report a second time. Both the Atest@ (first administration) and Aretest@ were done via the Web. The other source of data is students (n=440) who completed the survey twice without any inducement. Some of these students simply completed the form twice, apparently either forgetting they had done it in response to the original mailing or, more likely according to anecdotal information obtained from the NSSE Help Line staff, that they were worried the survey they returned got lost in the mail. All these students completed the paper version, as the Web mode has a built-in security system that does not permit the same student to submit the survey more than once. Another group of students was recruited during focus groups we conducted on eight campuses in spring 2000 (we describe this project later). We asked students in the focus groups to complete The Report a second time. Some of these students used the Web, others used the paper version, others a combination! So, it=s possible that mode of administration effects are influencing in unknown ways the test-retest results, as some data were obtained using the Web, some using paper only, and some using a combination of Web (test) and paper (retest). We examine administration mode effects in the next section. Using Pearson product moment correlation as suggested by Anastasi and Urbina (1997) for test-retest analysis, the overall test-retest
Framework & Psychometric Properties
Page 17 of 26
reliability coefficient for all students (N=569) across all items on The Report was a respectable .83. This indicates a fair degree of stability in students= responses, consistent with other psychometric tools measuring attitude and experiences (Crocker & Algina, 1986). Some sections of the survey were more stable than others. For example, the reliability coefficient for the 20 College Activities items was .77. The coefficient for the 10 Opinions About Your School items was .70, for the 14 Educational and Personal Growth items .69, for the five reading, writing, and nature of examinations items .66, and for the six time usage items .63. The mental activities and program items were the least stable, with coefficients of .58 and .57 respectively. In 2002, we conducted a similar test-retest analysis with 1,226 respondents who completed the paper survey twice. For this analysis, we used the Pearson product moment correlation to examine the reliability coefficients for the items used to construct our benchmarks. For the items related to three of the benchmarks (academic challenge, enriching educational experiences, and the academic challenge), the reliability coefficients were .74. The student interaction with faculty members items and supportive campus environment items had reliability coefficients of .75 and .78 respectively. Summary. Taken together, these analyses suggest that the NSSE survey appears to be reliably measuring the constructs it was designed to measure. Assuming that respondents were representative of their respective institutions, data aggregated at the institutional level on an annual basis should yield reliable results. The correlations are high between the questions common to both years. Some of the lower correlations (e.g., nature of exams, rewriting papers, tutoring) may be a function of slight changes in item wording and modified response options for other items on the later surveys (e.g., number of papers
written). At the same time, compared with 2000, 2001 and 2002 data reflect a somewhat higher level of student engagement on a number of NSSE items, though the relative magnitude of these differences is small. Checking for Mode of Administration Effects Using multiple modes of survey administration opens up the possibility of introducing a systematic bias in the results associated with the method of data collection. That is, do the responses of students who use one mode (i.e., Web) differ in certain ways from those who use an alternative mode such as paper? Further complicating this possibility is that there are two paths by which students can use the Web to complete the NSSE survey: (1) students receive the paper survey in the mail but have the option to complete it via the Web (Web- option), or (2) students attend a Web-only school and must complete the survey on-line (Web-only). Using ordinary least squares (OLS) or logistic regressions we analyzed the data from NSSE 2000 to determine if students who completed the survey on the Web responded differently than those who responded via a traditional paper format. Specifically, we analyzed responses from 56,545 students who had complete data for survey mode and all control variables. The sample included 9,933 students from Web-exclusive institutions and another 10,013 students who received a paper survey, but exercised the Web-option. We controlled for a variety of student and institutional characteristics that may be linked to both engagement and mode. The control variables included: class, enrollment status, housing, sex, age, race/ethnicity, major field, 2000 Carnegie Classification, sector, undergraduate enrollment from IPEDS, admissions selectivity (from Barron’s, 1996), urbanicity from IPEDS, and academic support expenses per student from IPEDS. In addition to tests of statistical significance, we computed effect sizes to ascertain if the
Framework & Psychometric Properties Page 18 of 26
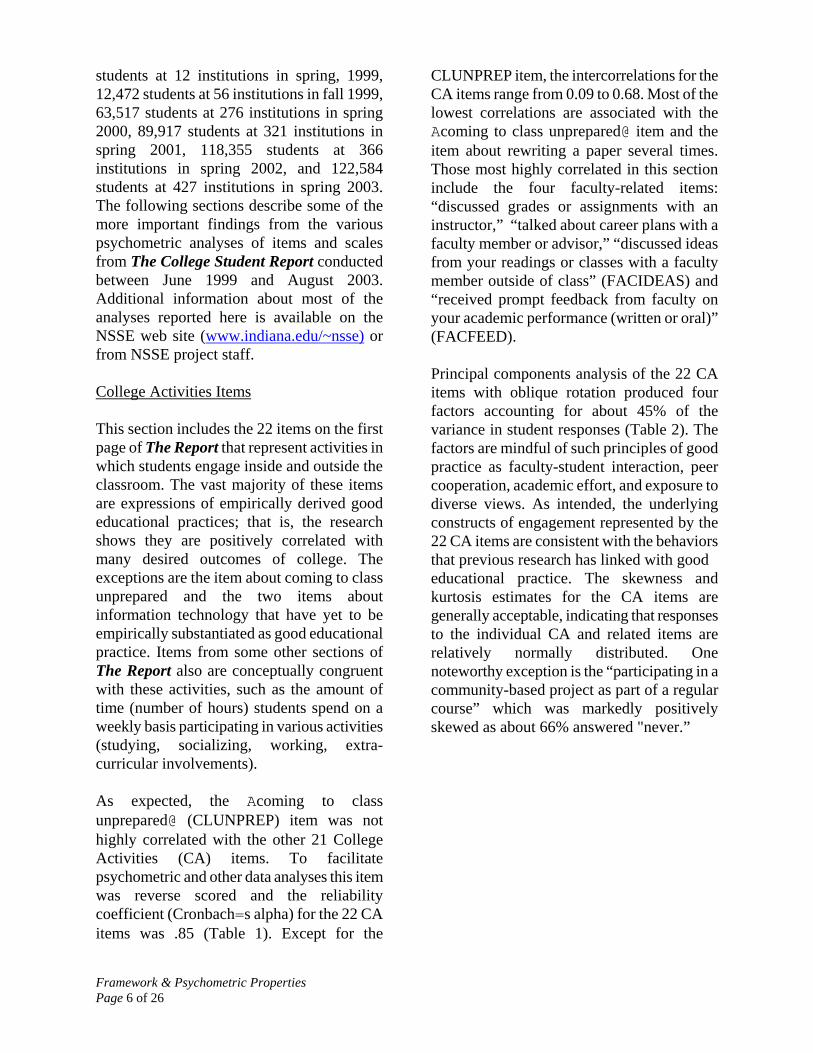
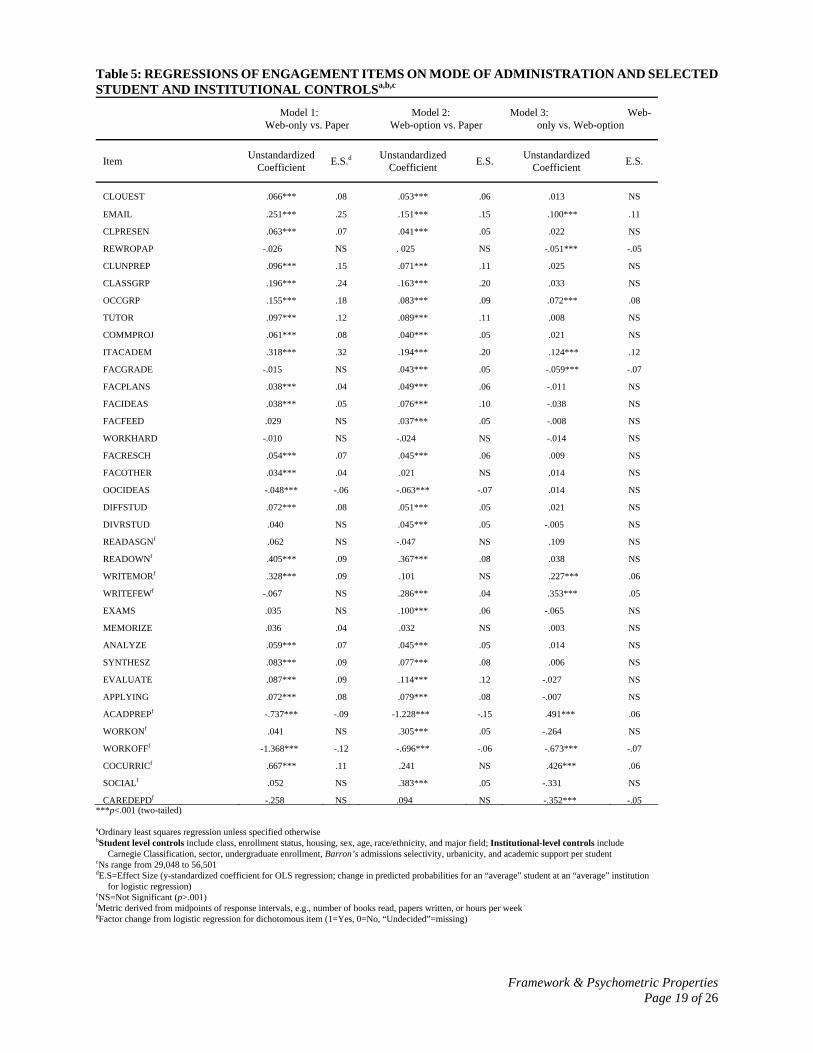
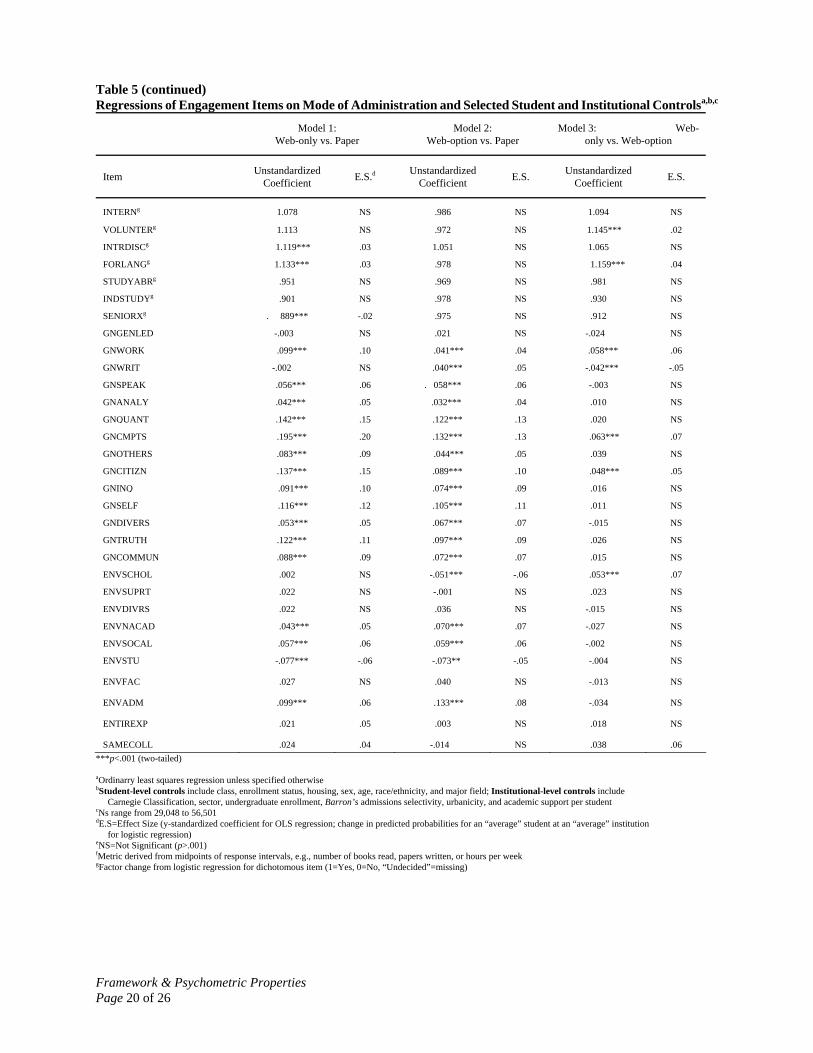
magnitude of the mode coefficients were high enough to be of practical importance to warrant attention. Finally, we applied post-stratification weights at the student-level for all survey items to minimize nonresponse bias related to sex and enrollment status. We analyzed the Web-only and Web-option results separately against paper as shown in Table 5 by Model 1 (Web-only) and Model 2 (Web-option) against paper. We compared Web-only against Web-option in Model 3. For 39 of the 67 items, the unstandardized coefficients for Model 1 favored Web-only over paper. For Model 2, 40 of the 67 items showed statistically significant effects favoring the Web option over paper. In contrast, there are only 9 statistically significant coefficients that are more favorable for paper over Web in Models 1 and 2 combined. Model 3 reveals that there are relatively few statistically significant differences between the two Web-based modes. The effect sizes for most comparisons in both Model 1 and Model 2 are not large -- generally .15 or less, with a few exceptions. Interestingly, the largest effect sizes favoring Web over paper were for the three computer-related items: “used e-mail to communicate with an instructor” (EMAIL), “used an electronic medium to discuss of complete an assignment” (ITACADEM), and self-reported gains in “using computers and information technology” GNCMPTS). These models take into account many student and school characteristics. However, the results for items related to computing and information technology might differ if a more direct measure of computing technology at particular campuses was available. That is, what appears to be a mode effect might instead be due to a preponderance of Web respondents from highly Awired@ campuses
that are, in fact, exposed to a greater array of computing and information technology. On balance, responses of college students to NSSE 2000 Web and paper surveys show small but consistent differences that favor the Web. These findings, especially for items unrelated to computing and information technology, generally dovetail with studies in single postsecondary settings (Layne, DeCristoforo, & McGinty, 1999; Olsen, Wygant, & Brown, 1999; Tomsic, Hendel, & Matross, 2000). This said, it may be premature to conclude that survey mode shapes college students= responses. First, while the responses slightly favor Web over paper on a majority of items, the differences are relatively small. Second, only items related to computing and information technology exhibited some of the largest effects favoring Web. Finally, for specific populations of students mode may have different effects than those observed here. In auxiliary multivariate analyses, we found little evidence for mode-age (net of differential experiences and expectations attributable to year in school) or mode-sex interactions, suggesting that mode effects are not shaped uniquely by either of these characteristics. Additional information about the analysis of mode effects is available in the NSSE 2000 Norms report (Kuh, Hayek et al., 2001) and from Carini, Hayek, Kuh, Kennedy and Ouimet (in press). A copy of the Carini et al. paper can is on the NSSE website. We will continue to analyze NSSE data in future years to learn more about any possible mode effects.
Framework & Psychometric Properties
Page 19 of 26
Table 5: REGRESSIONS OF ENGAGEMENT ITEMS ON MODE OF ADMINISTRATION AND SELECTED STUDENT AND INSTITUTIONAL CONTROLSa,b,c
Model 1: Web-only vs. Paper
Model 2: Web-option vs. Paper
Model 3: Web-only vs. Web-option
Item Unstandardized Coefficient E.S.d Unstandardized
Coefficient E.S. Unstandardized Coefficient E.S.
CLQUEST .066*** .08 .053*** .06 .013 NS
EMAIL .251*** .25 .151*** .15 .100*** .11
CLPRESEN .063*** .07 .041*** .05 .022 NS
REWROPAP -.026 NS . 025 NS -.051*** -.05
CLUNPREP .096*** .15 .071*** .11 .025 NS
CLASSGRP .196*** .24 .163*** .20 .033 NS
OCCGRP .155*** .18 .083*** .09 .072*** .08
TUTOR .097*** .12 .089*** .11 .008 NS
COMMPROJ .061*** .08 .040*** .05 .021 NS
ITACADEM .318*** .32 .194*** .20 .124*** .12
FACGRADE -.015 NS .043*** .05 -.059*** -.07
FACPLANS .038*** .04 .049*** .06 -.011 NS
FACIDEAS .038*** .05 .076*** .10 -.038 NS
FACFEED .029 NS .037*** .05 -.008 NS
WORKHARD -.010 NS -.024 NS -.014 NS
FACRESCH .054*** .07 .045*** .06 .009 NS
FACOTHER .034*** .04 .021 NS .014 NS
OOCIDEAS -.048*** -.06 -.063*** -.07 .014 NS
DIFFSTUD .072*** .08 .051*** .05 .021 NS
DIVRSTUD .040 NS .045*** .05 -.005 NS
READASGNf .062 NS -.047 NS .109 NS
READOWNf .405*** .09 .367*** .08 .038 NS
WRITEMORf .328*** .09 .101 NS .227*** .06
WRITEFEWf -.067 NS .286*** .04 .353*** .05
EXAMS .035 NS .100*** .06 -.065 NS
MEMORIZE .036 .04 .032 NS .003 NS
ANALYZE .059*** .07 .045*** .05 .014 NS
SYNTHESZ .083*** .09 .077*** .08 .006 NS
EVALUATE .087*** .09 .114*** .12 -.027 NS
APPLYING .072*** .08 .079*** .08 -.007 NS
ACADPREPf -.737*** -.09 -1.228*** -.15 .491*** .06
WORKONf .041 NS .305*** .05 -.264 NS
WORKOFFf -1.368*** -.12 -.696*** -.06 -.673*** -.07
COCURRICf .667*** .11 .241 NS .426*** .06
SOCIALf .052 NS .383*** .05 -.331 NS
CAREDEPDf -.258 NS .094 NS -.352*** -.05 ***p<.001 (two-tailed) aOrdinary least squares regression unless specified otherwise
bStudent level controls include class, enrollment status, housing, sex, age, race/ethnicity, and major field; Institutional-level controls include Carnegie Classification, sector, undergraduate enrollment, Barron’s admissions selectivity, urbanicity, and academic support per student
cNs range from 29,048 to 56,501
dE.S=Effect Size (y-standardized coefficient for OLS regression; change in predicted probabilities for an “average” student at an “average” institution for logistic regression)
eNS=Not Significant (p>.001)
fMetric derived from midpoints of response intervals, e.g., number of books read, papers written, or hours per week gFactor change from logistic regression for dichotomous item (1=Yes, 0=No, “Undecided”=missing)
Framework & Psychometric Properties Page 20 of 26
Table 5 (continued) Regressions of Engagement Items on Mode of Administration and Selected Student and Institutional Controlsa,b,c
Model 1: Web-only vs. Paper
Model 2: Web-option vs. Paper
Model 3: Web-only vs. Web-option
Item Unstandardized Coefficient E.S.d Unstandardized
Coefficient E.S. Unstandardized Coefficient E.S.
INTERNg 1.078 NS .986 NS 1.094 NS
VOLUNTERg 1.113 NS .972 NS 1.145*** .02
INTRDISCg 1.119*** .03 1.051 NS 1.065 NS
FORLANGg 1.133*** .03 .978 NS 1.159*** .04
STUDYABRg .951 NS .969 NS .981 NS
INDSTUDYg .901 NS .978 NS .930 NS
SENIORXg . 889*** -.02 .975 NS .912 NS
GNGENLED -.003 NS .021 NS -.024 NS
GNWORK .099*** .10 .041*** .04 .058*** .06
GNWRIT -.002 NS .040*** .05 -.042*** -.05
GNSPEAK .056*** .06 . 058*** .06 -.003 NS
GNANALY .042*** .05 .032*** .04 .010 NS
GNQUANT .142*** .15 .122*** .13 .020 NS
GNCMPTS .195*** .20 .132*** .13 .063*** .07
GNOTHERS .083*** .09 .044*** .05 .039 NS
GNCITIZN .137*** .15 .089*** .10 .048*** .05
GNINQ .091*** .10 .074*** .09 .016 NS
GNSELF .116*** .12 .105*** .11 .011 NS
GNDIVERS .053*** .05 .067*** .07 -.015 NS
GNTRUTH .122*** .11 .097*** .09 .026 NS
GNCOMMUN .088*** .09 .072*** .07 .015 NS
ENVSCHOL .002 NS -.051*** -.06 .053*** .07
ENVSUPRT .022 NS -.001 NS .023 NS
ENVDIVRS .022 NS .036 NS -.015 NS
ENVNACAD .043*** .05 .070*** .07 -.027 NS
ENVSOCAL .057*** .06 .059*** .06 -.002 NS
ENVSTU -.077*** -.06 -.073** -.05 -.004 NS
ENVFAC .027 NS .040 NS -.013 NS
ENVADM .099*** .06 .133*** .08 -.034 NS
ENTIREXP .021 .05 .003 NS .018 NS
SAMECOLL .024 .04 -.014 NS .038 .06 ***p<.001 (two-tailed) aOrdinarry least squares regression unless specified otherwise
bStudent-level controls include class, enrollment status, housing, sex, age, race/ethnicity, and major field; Institutional-level controls include Carnegie Classification, sector, undergraduate enrollment, Barron’s admissions selectivity, urbanicity, and academic support per student
cNs range from 29,048 to 56,501
dE.S=Effect Size (y-standardized coefficient for OLS regression; change in predicted probabilities for an “average” student at an “average” institution for logistic regression)
eNS=Not Significant (p>.001)
fMetric derived from midpoints of response intervals, e.g., number of books read, papers written, or hours per week gFactor change from logistic regression for dichotomous item (1=Yes, 0=No, “Undecided”=missing)
Framework & Psychometric Properties
Page 21 of 26
Interpreting The Meaning of Engagement Items: Results from Student Focus Groups The psychometric analyses show that the vast majority of items on The College Student Report are valid and reliable and have acceptable kurtosis and skewness indicators. What cannot be demonstrated from such psychometric analyses is whether respondents are interpreting the items as intended by the NSSE Design Team and whether students= responses accurately represent their behaviors and perceptions. That is, even when psychometric indicators are acceptable, students may be interpreting some items to mean different things. It is relatively rare that survey researchers go into the field and ask participants to explain the meaning of items and their responses. However, because of the importance of the NSSE project, we conducted focus groups of first-year and senior students during March and April 2000 at eight colleges and universities that participated in NSSE 2000. The schools included four private liberal arts colleges (including one woman=s college) and four public doctoral-granting universities. Between three and six student focus groups were conducted on each campus. The number of students participating in the groups ranged from 1 to 17 students, for a total of 218 student participants. More women (74%) and freshmen (52%) participated than men (26%) and seniors (48%). Approximately 37% were students of color. Although there was not enough time to discuss every item during each focus group, every section of the instrument was addressed in at least one group on each campus. In general, students found The Report to be clearly worded and easy to complete. A few items were identified where additional clarity would produce more accurate and consistent interpretations. For example, the Anumber of books read on your own@ item confused some
students who were not sure if this meant reading books for pleasure or readings to supplement those assigned for classes. This item is an illustration of a handful of items where students suggested that we provide additional prompts to assist them in understanding questions. However, students generally interpreted the item response categories in a similar manner. The meanings associated with the response sets varied somewhat from item to item, but students= interpretations of the meaning of the items were fairly consistent. For example, when students marked Avery often@ to the item Aasked questions in class or contributed to class discussions@ they agreed that this indicated a daily or during every class meeting. When answering the Amade a class presentation@ item, students told us that Avery often@ meant about once a week. The information from student focus groups allows us to interpret the results with more precision and confidence. This is because the focus group data indicated that students consistently interpreted items in a similar way and that the patterns of their responses accurately represent what they confirm to be the frequency of their behavior in various areas. We also have a better understanding of what students mean when they answer various items in certain ways. In summary, we are confident that student self-reports about the nature and frequency of their behavior are reasonably accurate indicators of these activities. For additional detail about the focus group project look at the Ouimet, Carini, Kuh, and Bunnage (2001) paper on the NSSE website. Cognitive Testing Interviews We used information from the focus groups and psychometric analyses to guide revisions to the 2001 version of The College Student Report. We also worked closely with survey expert, Don Dillman to redesign the
Framework & Psychometric Properties Page 22 of 26
instrument so that it would have a more inviting look and feel. For example, we revamped the look by substituting check boxes for the traditional bubbles so the instrument looked less test-like. These and other changes created a more inviting feel to the instrument. We then did cognitive testing on the instrument via interviews with Indiana University undergraduates in mid-November 2000 as a final check before beginning the 2001 survey cycle. The group, 14 men and 14 women, was recruited by the Center for Survey Research (CSR) staff. CSR and NSSE staff members worked together to draft the interview protocol, study information sheet, and incentive forms, all of which were approved by the Indiana University Bloomington Institutional Review Board, Human Subjects Committee. Students were compensated $10 for their participation. CSR professional staff and NSSE associates conducted the interviews. Interviews lasted between 30 and 45 minutes and were tape recorded with respondent permission. The interviews were subsequently transcribed and analyzed by two NSSE staff members. Included among the key findings are:
1. The vast majority of students indicated that the instrument was attractively formatted, straightforward, and easy to read, follow, and understand. Most agreed that they would probably complete the survey if they were invited to do so, though four students said that the survey length might give them pause. 2. All of the respondents found the directions and examples helpful. 3. The majority of students interpreted the questions in identical or nearly identical ways (e.g., the meaning of primary major and secondary major, length of typical week).
4. Several students were not entirely sure who was included in the survey item dealing with relationships with administrative personnel. 5. Of the 20 students who discussed the web versus paper survey option, nine indicated that they would prefer to complete the survey via the web. Reasons for preferring the web included that it was Amore user-friendlyY more convenientY easier." However, nine other students indicated that they preferred the paper version, and the remaining two students were undecided. This suggests that it is important to offer students alternative modes to complete the survey. Summary. The results of the cognitive interviews suggest that respondents to The College Student Survey understand what is being asked, find the directions to be clear, interpret the questions in the same way, and tend to formulate answers to questions in a similar manner. NSSE staff used these and other results from the cognitive testing to make final revisions to the instrument for 2001. These revisions included several minor changes that were mostly related to formatting of response options and a few wording changes. Next Steps The NSSE project staff is continuing to examine the psychometric properties of the instrument as a whole and on the five benchmarks of effective educational practice featured in NSSE reports. We are also working with some partner institutions and organizations on these some of these efforts. For example:
Peter Ewell of the National Center on Higher Education Management Systems is doing a special analysis of NSSE results from the universities in the South Dakota system as a cross validation study, comparing
Framework & Psychometric Properties
Page 23 of 26
NSSE data with direct outcome measures from students’ ACT and CAAP scores.
NSSE is also examining information
collected by the University of South Carolina National Resource Center for First Year Programs and Students in Transition to gauge whether students at institutions that have “model” first year experience programs are more engaged than their peers elsewhere.
Selected NSSE questions will be
included on the collegiate oversample as part of the National Assessment of Adult Learning that will be administered during 2003.
We will update this psychometric report when the results of these analyses become available.
Conclusion In general, the psychometric properties of the NSSE are very good, as the vast majority of items equal or exceed recommended measurement levels. Those items that are not in the normal range on certain indicators, such as kurtosis and skewness, are due to the nature of the student experience, not because of psychometric shortcomings of the instrument. The face and construct validity of the survey are strong. This is not surprising because national assessment experts designed the instrument and most of the items have been used for years in established college student assessment programs. In addition, we made improvements to individual items and the overall instrument based on what was learned from focus groups, cognitive testing, and the psychometric analyses on the results from the spring 1999 field test, the inaugural national administration in spring 2000, and the spring 2001 administration. The results seem to be relatively stable from one year to the next and non-respondents are generally comparable respondents in many ways, though contrary to popular belief non-respondents appear to be slightly more engaged than respondents.
Framework & Psychometric Properties Page 24 of 26
References
Aaker, D.A., Kumar, V., & Day, G.S. (1998). Marketing research (6 ed.). New York: Wiley. American Association of Higher Education. (1992). Principles of good practice for assessing student learning. Washington, DC: American Association for Higher Education. Anastasi, A., & Urbina, S. (1997). Psychological testing. Upper Saddle River, NJ: Prentice Hall. Anaya, G. (1999). College impact on student learning: Comparing the use of self-reported gains, standardized test scores, and college grades. Research in Higher Education, 40, 499-527. Astin, A.W. (1984). Student involvement: A developmental theory for higher education. Journal of College Student Personnel, 25, 297-307. Astin, A.W. (1985). Achieving educational excellence: A critical assessment of priorities and practices in higher education. San Francisco: Jossey-Bass. Astin, A.W. (1991). Assessment for excellence: The philosophy and practice of assessment and evaluation in higher education. New York: American Council on Education/Macmillan. Astin, A.W. (1993). What matters in college? Four critical years revisited. San Francisco: Jossey-Bass.
Baird, L.L. (1976). Using self-reports to predict student performance. New York: The College Board. Banta, T.W., and Associates. 1993. Making a difference: Outcomes of a decade of assessment in higher education. San Francisco: Jossey-Bass. Barron’s Profiles of American Colleges. (1996). Hauppage, NY: Barron's Educational Series. Benjamin, R. & Hersh, R.H. (2002). Measuring the difference college makes: The RAND/CAE value added assessment initiative. Peer Review, 4(2/3), 7-10. Berdie, R.F. (1971). Self-claimed and tested knowledge. Educational and Psychological Measurement, 31, 629-636. Bloom, B. (1956). Taxonomy of educational objectives: The classification of educational goals: Handbook I. Cognitive domain. London: Longmans, Green. Bradburn, N.M., & Sudman, S. (1988). Polls and surveys: Understanding what they tell us. San Francisco: Jossey-Bass. Brandt, R. M. (1958). The accuracy of self estimates. Genetic Psychology Monographs, 58, 55-99.
Bruffee, K.A. (1993). Collaborative learning: Higher education, interdependence, and the authority of knowledge. Baltimore: The Johns Hopkins University Press. Carini, R.M., Hayek, J.H., Kuh, G.D., Kennedy, J.M., & Ouimet, J.A. (in press). College student responses to web and paper surveys: Does mode matter? Research in Higher Education. Carini, R.M. & Kuh, G.D. (2003). 2002 NSSE-RAND cross-validation study: Some insights into the role of student engagement to student learning. Unpublished manuscript. Chickering, A.W., & Gamson, Z.F. (1987). Seven principles for good practice in undergraduate education. AAHE Bulletin, 39(7), 3-7. Chickering, A.W., & Reisser, L. (1993). Education and identity (2nd ed.). San Francisco: Jossey-Bass. Converse, J.M., & Presser, S. (1989). Survey questions: Handcrafting the standardized questionnaire. Newbury Park, CA: Sage. Crocker, L., & Algina, J. (1986). Introduction to classical and modern test theory. New York: Harcourt Brace Jovanovich. Davis, T.M., & Murrell, P.H. (1990). Joint factor analysis of the College Student Experiences Questionnaire and the ACT COMP objective exam. Research in Higher Education, 31, 425-442. DeNisi, A.S., & Shaw, J.B. (1977). Investigation of the uses of self-reports of abilities. Journal of Applied Psychology, 62, 641-644. Dillman, D. A. (2000). Mail and Internet surveys: The tailored design method. New York: Wiley. Dillman, D.A., Sangster, R.L., Tarnai, J., & Rockwood, T. (1996). Understanding differences in people’s answers to telephone and mail surveys. In M.T. Braverman & J.K. Slater (Eds.), New Directions for Evaluation Series, Vol. 70, (pp. 45-62). San Francisco: Jossey-Bass. Dumont, R.G., & Troelstrup, R.L. (1980). Exploring relationships between objective and subjective measures of instructional outcomes. Research in Higher Education, 12, 37-51. Education Commission of the States. (1995). Making quality count in undergraduate education. Denver, CO: Education Commission of the States.
Ethington, C. (1997). A hierarchical linear modeling approach to studying college effects. In J.C. Smart (Ed.),
Framework & Psychometric Properties
Page 25 of 26
Higher education: Handbook of theory and research (Vol. 12, pp. 165-94). New York: Agathon. Ewell, P.T., & Jones, D.P. (1993). Actions matter: The case for indirect measures in assessing higher education's progress on the National Education Goals. Journal of General Education, 42, 123-48. Ewell, P.T., & Jones, D.P. (1996). Indicators of "good practice" in undergraduate education: A handbook for development and implementation. Boulder, CO: National Center for Higher Education Management Systems. Gershuny, J., & Robinson, J.P. (1988). Historical changes in the household division of labor. Demography, 25, 537-552. Glass, G.V. (1977). Integrating findings: The meta-analysis of research. In L.S. Shulman (Ed.), Review of Research in education (Vol. 5, pp 351-379). Itasca, IL: F.E. Peacock. Goodsell, A., Maher, M., & Tinto, V. (Eds.). (1992). Collaborative learning: A sourcebook for higher education. University Park: National Center on Postsecondary Teaching, Learning and Assessment, The Pennsylvania State University. Hansford, B.C., & Hattie, J.A. (1982). The relationship between self and achievement/performance measures. Review of Educational Research, 52, 123-142.
Hu, S., & Kuh, G.D. (2001). Computing experience and good practices in undergraduate education: Does the degree of campus wiredness matter? Presented at the meeting of the American Educational Research Association, Seattle. Johnson, D.W., Johnson, R., & Smith, K.A. (1991). Cooperative learning: Increasing college faculty instructional productivity. ASHE-ERIC Higher Education Report No. 4. Washington, DC: The George Washington University, School of Education and Human Development. Kerlinger, F.N. (1973). Foundations of behavioral research (2nd ed.). New York: Holt, Rinehart and Winston. Kuh, G.D. (2001). Assessing what really matters to student learning: Inside the National Survey of Student Engagement. Change, 33(3), 10-17, 66. Kuh, G.D., Hayek J. et al. NSSE 2000 Norms. Bloomington: Indiana University Center for Postsecondary Research and Planning. Kuh, G. D., Pace, C. R., & Vesper, N. (1997). The development of process indicators to estimate student gains associated with good practices in undergraduate education. Research in Higher Education, 38, 435-454. Kuh, G.D., Schuh, J.S., Whitt, E.J., & Associates. (1991). Involving colleges: Successful approaches to fostering student learning and personal development outside the classroom. San Francisco: Jossey-Bass.
Kuh, G.D., & Siegel, M.J. (2000). College Student Experiences Questionnaire: Tentative norms for the fourth edition. Bloomington, IN: Indiana University Center for Postsecondary Research and Planning. Kuh, G. D., & Vesper, N. (1997). A comparison of student experiences with good practices in undergraduate education between 1990 and 1994. The Review of Higher Education, 21, 43-61. Kuh, G.D., & Vesper, N. (2001). Do computers enhance or detract from student learning? Research in Higher Education, 42, 87-102. Kuh, G.D., Vesper, N., Connolly, M.R., & Pace, C.R. (1997). College Student Experiences Questionnaire: Revised norms for the third edition. Bloomington, IN: Indiana University Center for Postsecondary Research and Planning. Laing, J., Swayer, R, & Noble, J. (1989). Accuracy of self-reported activities and accomplishments of college-bound seniors. Journal of College Student Development, 29, 362-368. Layne, B. H., DeCristoforo, J.R. and McGinty, D. (1999). Electronic versus traditional student ratings of instruction. Research in Higher Education, 40, 221-232. Light, R. & Pillemer, D. (1982). Numbers and narrative: Combining their strengths in research reviews. Harvard Educational Review, 52, 1-26. Long, J.S. (1997). Regression models for categorical and limited dependent variables. Thousand Oaks, CA: Sage. Lowman, R.L., & Williams, R.E. (1987). Validity of self-ratings of abilities and competencies. Journal of Vocational Behavior, 31, 1-13. McKeachie, W.J., Pintrich, P.R, Lin, Y., & Smith, D. (1986). Teaching and learning in the college classroom: A review of the research literature. Ann Arbor: National Center for Research to Improve Postsecondary Teaching and Learning, University of Michigan. National Center for Educational Statistics. (1991). Education counts: An indicator system to monitor the nation's educational health. Washington, DC: U.S. Government Printing Office. National Center for Higher Education Management Systems. (1994). A preliminary study of the feasibility and utility for national policy of instructional "good practice" indicators in undergraduate education. Boulder, CO: National Center for Higher Education Management Systems. National Survey of Student Engagement (2000). The NSSE 2000 report: National benchmarks of effective educational practice. Bloomington, IN: Indiana University Center for Postsecondary Research and Planning.
Framework & Psychometric Properties Page 26 of 26
Olsen, D. R., Wygant, S.A., & Brown, B.L. (1999). Entering the next millennium with Web-based assessment: Considerations of efficiency and reliability. Paper presented at the Conference of the Rocky Mountain Association for Institutional Research, Las Vegas. Ouimet, J.A., Carini, R.M., Kuh, G.D., & Bunnage, J. (2001, June). Using focus groups to establish the validity and reliability of a college student survey. Paper presented at the annual meeting of the Association for Institutional Research, Long Beach. Pace, C.R. (1980). Measuring the quality of student effort. Current Issues in Higher Education, 2, 10-16. Pace, C.R. (1984). Measuring the quality of college student experiences. Los Angeles: University of California, Center for the Study of Evaluation. Pace, C.R. (1985). The credibility of student self-reports. Los Angeles: University of California, The Center for the Study of Evaluation, Graduate School of Education. Pace, C.R. (1990). The undergraduates: A report of their activities and college experiences in the 1980s. Los Angeles: Center for the Study of Evaluation, UCLA Graduate School of Education. Pace, C.R. (1995, May). From good practices to good products: Relating good practices in undergraduate education to student achievement. Paper presented at the meeting of the Association for Institutional Research, Boston. Pascarell, E.T. (2001). Identifying excellence in undergraduate education: Are we even close? Change, 33(1), 18-23. Pascarella, E.T., & Terenzini, P.T. (1991). How college affects students: Findings and insights from twenty years of research. San Francisco: Jossey-Bass. Pike, G.R. (1989). Background, college experiences, and The ACT-COMP exam: Using construct validity to evaluate assessment instruments. Review of Higher Education, 13, 91-117. Pike, G.R. (1993). The relationship between perceived learning and satisfaction with college: An alternative view. Research in Higher Education, 34, 23-40. Pike, G.R. (1995). The relationships between self reports of college experiences and achievement test scores. Research in Higher Education, 36, 1-22. Pike, G. R. (1996). Limitations of using students’ self-reports of academic development as proxies for traditional
achievement measures. Research in Higher Education, 37, 89-114. Pike, G.R. (1999). The constant error of the halo in educational outcomes research. Research in Higher Education, 40, 61-86. Pohlmann, J.T., & Beggs, D.L. (1974). A study of the validity of self-reported measures of academic growth. Journal of Educational Measurement, 11, 115-119.
Sax, L.J., Astin, A.W., Korn, W.S., & Mahoney, K. (1997). The American college freshman. Los Angeles: University of California, Los Angeles, Higher Education Research Institute. Singleton, R.A. Jr., Straits, B.C. & Straits, M.M. (1993). Approaches to social research. New York: Oxford University Press. Sorcinelli, M.D. (1991). Research findings on the seven principles. In A.W. Chickering and Z.F. Gamson (Eds.), Applying the Seven Principles for Good Practice in Undergraduate Education, New Directions for Teaching and Learning, No. 47 (pp. 13-25). San Francisco: Jossey-Bass. The Study Group on the Conditions of Excellence in American Higher Education. (1984). Involvement in learning: Realizing the potential of American higher education. Washington, DC: U.S. Department of Education. Tinto, V. (1993). Leaving college: Rethinking the causes and cures of student attrition (2nd Ed.). Chicago: University of Chicago Press. Tomsic, M.L., Hendel, D.D., & Matross, R.P. (2000). A world wide web response to student satisfaction surveys: Comparisons using paper and Internet formats. Paper presented at the Annual Meeting of the Association for Institutional Research, Cincinnati. Turner, C.F., & Martin, E. (Eds.) (1984). Surveying subjective phenomena (Vol. 1). New York: Russell Sage Foundation. Wentland, E.J. & Smith, K.W. (1993). Survey responses: An evaluation of their validity. New York: Academic Press. Wingspread Group on Higher Education. (1993). An American imperative: Higher expectations for higher education. Racine, WI: Johnson Foundation. Yahoo! Internet Life. (2001). America's Most Wired Colleges 2000. http://www.zdnet.com/yil/content/college/ College2000/wired_ivy.html.