Embed Size (px)
Citation preview

The National Fund for Workforce Solutions
Tracking Progress: Data Brief 2015
Prepared by
Kendra Lodewick
Stephen Michon
Katherine Shields
Rebecca Rubin
Program and Policy Insight, LLC
December 2015

Table of Contents
Table of Contents
Executive Summary .............................................................. i
I. Introduction ..................................................................... 1
II. National Fund 2.0: Expand and Deepen Impact............ 3
III. Industry Partnerships .................................................... 8
IV. Low-Income Individuals ................................................. 17
V. Employers .................................................................... 43
VI. Conclusion .................................................................. 46

Executive Summary

Executive Summary i
Executive Summary
I. Introduction
The National Fund for Workforce Solutions (National Fund) is a national
partnership of employers, communities, workers and philanthropy that
invests in regional funder collaboratives to strengthen local economies
and implement demand-driven workforce strategies. Since 2007, the
National Fund initiative has supported the creation and development of
regionally-based funder collaboratives and industry partnerships that
create talent supply chains, close skill gaps and improve systems.
During the first five years of implementation, from 2007 to 2012, the
National Fund goals included 1) development of a network of
collaboratives and industry partnerships, 2) positive employment and
career advancement outcomes for low-income individuals, 3) positive
labor-market outcomes for employers; and 4) changes to local and
regional workforce development systems.
The 2013 launch of National Fund 2.0 marked the evolution of the
National Fund for Workforce Solutions into an initiative with a more
nuanced strategic framework and diversified leadership structure. The
goals articulated by the new strategic framework include:
Improve public systems and employer practices;
Expand and deepen impact; and
Promote learning and continuous improvement.
The 2.0 framework includes multiple objectives related to these goals, as
well as strategic principles expected to yield success. Although the 2.0
framework is clearly aligned with the original framework, it is a more
complex articulation of the model.
Executive Summary ii
This data brief provides an overall picture of the National Fund’s
progress since its inception in 2007, as reported by participating industry
partnerships through the annual reporting system.1 The data brief also
highlights key achievements and observations from the first two years of
National Fund 2.0.2 Under the National Fund 2.0 framework, this report
communicates progress related to the first National Fund 2.0 goal: to
Expand and Deepen Impact.3
The first section of the report provides greater detail on this goal within
the context of National Fund 2.0 program implementation. The next
section describes industry partnership characteristics and evolution over
time. The following sections provide evidence of achievement and
outcomes for National Fund individual participants, and a summary of
employer engagement, services and activity. The conclusion briefly
describes high-level implications for on-going initiative development and
implementation. Together, these findings illustrate National Fund
accomplishments and opportunities in its seventh year of implementation
and at the close of the first two years of National Fund 2.0.
1 The evaluation framework and related indicators continue to reflect the original reporting guidance and data collection systems.
While the stability in the data collection framework yields continuity and enables comparisons over time, there is less alignment between available data and the goals, objectives and targets articulated by the National Fund 2.0 framework.
2 Most of the report presents cumulative data for the initiative from 2008-14, for comprehensiveness and comparability with previous years. However, we have also provided information on progress in the first phase of the Fund from 2007 through 2012, the first two years of National Fund 2.0 from 2013 through 2014 ), and annual progress since 2007 inception for certain variables of interest. We present key observations selectively throughout the report.
3 The development of the 2.0 framework was accompanied by the development of a 2.0 Evaluation Framework that documents plans for assessing NFWS achievements and impact. Progress toward these goals will be assessed through a portfolio of evaluation and learning activities.

Executive Summary iii
II. National Fund 2.0:
Expand and Deepen Impact
In 2007 the National Fund initially specified three distinct goals related to
expected impacts, including 1) organizing, supporting and developing a
national network of regional funding collaboratives; 2) assisting 50,000
low-income jobseekers and workers to achieve employment and career
advancement opportunities; and 3) assisting 2,000 employers to address
human resource needs.
The National Fund 2.0 framework condensed expectations for network
development, individual impact and employer partnerships into one goal
with multiple objectives, including: 1) providing opportunities for 100,000
low-wage individuals to acquire career-relevant skills and credentials; 2)
expanding the network of collaboratives to 15 new communities; 3)
raising $20 million in national grants and leveraging $150 million in local
matching investments; 4) partnering with 3,000 employers to generate
industry intelligence; and 5) improving the performance of 50 local
industry partnerships.
National Fund 2.0 expectations related to scale and impact are aligned
with the original goals of the initiative, however, the related objectives are
more targeted and diverse. New expectations around services for low-
wage individuals emphasize skills and credential acquisition. Similarly,
the employer role has evolved to a more robust leadership position in
identifying labor market needs and developing career ladders. The 2.0
goals also articulate specific targets related to continued network
expansion, partnership performance, and leveraged funds. This data
brief highlights some of the trends that have emerged during the first two
years of National Fund 2.0 implementation, including progress made to
expand and deepen its impact, as well as opportunities to quicken the
pace and scale of gains for individuals, employers, and communities.
Although the National Fund continues to grow, there is some indication
that the pace of growth has slowed during the first two years of National
Fund 2.0 implementation. In 2014 there were 13 new industry
partnerships reporting, which brings the cumulative number of
partnerships in the National Fund over six years to 185. Despite this
overall increase in partnerships, the growth rate of added partnerships
each year is slowing. The 13 new partnerships added in 2014 is the
smallest number of partnerships added since the National Fund’s
inception in 2007, and is continuation of the contraction in growth of new
partnerships seen in the first year of National Fund 2.0.

Executive Summary iv
Exhibit X-1. The Annual Number of New Partnerships has
Decreased Since 2011 (n=185)
Source: NFWS Data Reporting System
National Fund 2.0 also continues to add to its cumulative total of
participants served year to year. By the end of 2014, National Fund 2.0
partnerships served 12,346 more participants, which brings total
participants in the two years of National Fund 2.0 to 25,211. If annual
growth continues at roughly 12,000 participants per year, the National
Fund 2.0 will fall short of its 2017 goal to enable 100,000 low wage
individuals to obtain the skills, credentials, and other supports necessary
to acquire and advance in family supporting careers.4
Exhibit X-2. The Number of Newly Reported Participants Has Been
Stable Since 2011 (n=67,209)
4 If the National Fund measures progress of its 100,000 goal by number of participants who achieve an education and training
completion or job placement, versus number of participants served, then progress is slightly different. Of the 25,221 NFWS 2.0 participants, 16,875 completed education and training, and 7,605 received job placements by the end of 2014. Another 7,016 are incumbent workers who have jobs. Using these measures, for example, at the current pace of growth, National Fund 2.0 would reach its goal of 100,000 of education or training completions by 2023.
34
25
25
39
28
21
13
0
5
10
15
20
25
30
35
40
45
2008 2009 2010 2011 2012 2013 2014

Executive Summary v
Source: NFWS Data Reporting System
There appears to be some shifts in the type of services and completions
reported among National Fund 2.0 participants. Substantially smaller
proportions of National Fund 2.0 participants received primary non-
education services, including career coaching, case management and
supportive services, compared to participants receiving services from
2008 to 2012. In addition, participants completing basic skills, workplace
readiness, and other education and training comprised smaller shares of
overall completions in National Fund 2.0. On the other hand, a greater
share of National Fund 2.0 participants received on-the-job training
(OJT), and apprenticeship and OJT completions comprise a higher
proportion of all training completions in the National Fund 2.0.
While shifts in services and completions seem to be occurring between
phases, placement outcomes in National Fund 2.0 are comparable to
those achieved from 2008 to 2012. National Fund 2.0 partnerships
reported that 7,605 of their job seeker participants received a job
placement. That represents 42 percent of National Fund 2.0’s 18,205
total jobs seekers, or the same job placement ratio as the first phase of
the National Fund from 2008 to 2012. The percent of jobseekers
achieving 6- and 12-month retention in National Fund 2.0 is slightly
lower, but roughly on pace with outcomes through 2012 when
considering the shorter timeframe of implementation and outcome
measurement in National Fund 2.0.5
5 National Fund 2.0 data reflect the first two-years of implementation since the development of the National Fund 2.0. Although we
would not expect large numbers of participants new to the Fund in the first year of National Fund 2.0 to have achieved 6 or 12 month retention, the cumulative nature of the data includes retention figures for participants who entered the program prior the first year of National Fund 2.0.
3,262
5,853
8,659
11,880 12,334
12,874 12,347
-
2,000
4,000
6,000
8,000
10,000
12,000
14,000
2008 2009 2010 2011 2012 2013 2014
Nu
mb
er
of N
ew
ly R
ep
ort
ed
Pa
rtic
ipa
nts
b
y Y
ea
r

Executive Summary vi
III. Industry Partnerships
As projected by the National Fund 2.0 framework, the National Fund
continued to reach new communities, with four new collaboratives
accepted into the network and 13 new partnerships reporting
achievements in 2014. Since its inception in 2007, the National Fund has
supported a total of 39 collaboratives and 185 partnerships across the
United States. Among those groups, 26 collaboratives and 76
partnerships were active in National Fund 2.0 in 2014.
Thirteen new industry partnerships reported in 2014; this represents
the smallest group of new industry partnerships reporting during any
other year in the initiative.
The National Fund portfolio continues to be comprised primarily of
partnerships led by community-based organizations (24 percent) and
“other nonprofits” (24 percent); these types of organizations have led
the majority of partnerships since the National Fund’s inception.
Large industry partnerships continue to account for the majority of
participant services provided since 2008. One-third of partnerships
served between 101 and 500 participants, and more than one
quarter of participants were served by the five largest partnerships
alone. The share of 2.0 partnerships serving more than 500
participants increased considerably over the past year from 4
percent of partnerships after the first year of National Fund 2.0, to 14
percent of industry partnerships after the first two years of 2.0,
reflecting growth in the scale of partnerships since the start of
National Fund 2.0.
As of 2014, the great majority of cumulative partnerships (90
percent) offered a jobseeker program, and over half (53 percent)
offered an incumbent program; more than two-fifths (44 percent)
offered services to both groups. The share of partnerships serving
incumbent workers increased substantially during the course of the
initiative, while the share serving jobseeker participants remained
relatively stable.
Exhibit X-3: The Share of Partnerships Offering both Incumbent Worker and Jobseeker Programs Has Grown Over Time

Executive Summary vii
Source: NFWS Data Reporting System
IV. Low-Income Individuals
Active industry partnerships served an additional 12,347 participants in
2014, bringing the total of individuals served to 67,209 unduplicated
participants over the first seven years of National Fund reporting. The
participants newly enrolled in 2014 represents a 23 percent increase
over the cumulative reported through 2013; participants served in 2013
and 2014 together account for 25 percent of the National Fund 2.0’s 5-
year goal to serve 100,000 individuals from 2013 to 2017.
Cumulatively, the rate of annual increase of participants has declined
over time, reflecting initial annual gain due to record growth in
number of collaboratives and related partnerships. Contraction in
annual participant growth has been particularly acute in the first two
years of National Fund 2.0. The rate of annual jobseeker growth was
relatively consistent from 2013 to 2014, however, the rate of
incumbent worker growth declined during this period.
52%
30%
41%
10%8% 9%
38%
60%
50%
0%
10%
20%
30%
40%
50%
60%
70%
All Active 2008-2012 (N=149)
All Active 2013-2014 (N=101)
New 2013-2014(N=33)
Jobseeker Only
Incumbent Only
Both

Executive Summary viii
Participant demographic characteristics have shifted since the
inception of the National Fund, with steady increases in the
proportion of male and white participants, and decreases in the
proportions of African-American and Asian participants.
Nearly two-thirds of the participants, or 39,444 individuals, received
occupational skills training, which remained the most common
education or training service received.
Provision of non-training services has declined over time. The
proportion of participants receiving selected services, including
career coaching, case management and supportive services,
declined substantially over the course of the initiative.
Exhibit X-4: Non-Education Service Participation Has Declined in
Key Services
National Fund 1.0 National Fund 2.0
# % # %
N=
41,988
25,221
Assessment
28,333 67%
12,865
51%
Asset Development
4,357
10%
2,103 8%
Career Coaching
23,340 56%
8,922
35%
Case Management
18,663 44%
7,556
30%
Job Search/Job Placement
17,365
41%
10,195 40%
Supportive Services
15,091
36%
4,964 20%
Other Non-training
7,283 17%
3,140
12%
Source: NFWS Data Reporting System
By 2014, the number of participants who had completed education
and training services reached 45,312, or 67 percent of all
participants served.
Apprenticeship and OJT completions comprised a higher proportion
of all training completions in the National Fund 2.0. In contrast, basic
skills, workplace readiness, and other education and training
completions comprised smaller shares of overall completions.
As of 2014, 19,299 jobseeker participants served by 151
partnerships had achieved job placement since the start of the

Executive Summary ix
initiative6, representing a 23 percent growth over the number of
cumulative job placements reported in 2013.
Cumulatively since the start of the Fund, over two-fifths of all
participants (41 percent) were served by healthcare partnerships.
Participants added during National Fund 2.0 were more likely to be
served by healthcare (36 percent) or manufacturing sector (30
percent) partnerships than any other sector. Moreover, among
partnerships new to the Fund since the start of National Fund 2.0,
the share of participants in manufacturing focused partnerships
reached 61 percent.
Among the workforce sectors, partnerships in energy, aerospace,
information technology and marine trades reported higher shares of
participants with placement wages above $20.00 per hour.
Substantial shares of both jobseeker and incumbent participants
achieving 12-month retention continued to experience wage gains
(39 percent and 33 percent, respectively).
V. Employers
Overall, the number of employers served by industry partnerships
increased to 5,303 in 2014, representing 13 percent growth in the
cumulative number of employers served since 2013. Data from the first
two years of National Fund 2.0 suggest a contraction in the scale of
employers served annually, as well as a shift in employer services
provided.
The growth of new employers was robust from 2008 through 2011,
with a peak growth rate of 139 percent in 2010. The growth rate
remained strong in 2011 and 2012, at 60 percent and 33 percent,
respectively. A marked decline in the rate of growth of new
employers emerged in 2013 (15 percent) and continued in 2014 (13
percent) with a cumulative addition of 629 employers over two
years.
Data on the level of employer engagement was collected for the first
time in 2014. Of the 1,110 employers reporting, nearly half (49
percent) were classified as Affiliates – employers that receive
services from the industry partnership but participate sporadically
6 Traditional placement rates compare placements to program completers. However, many of the NFWS partnerships continue to
work with individuals after completion of their training and sometimes after job placement. Therefore, this figure should not be read as presenting placement rates.

Executive Summary x
and/or at a basic level—and nearly one-third (29 percent), were
classified as Core Employers, the highest level of engagement.
Exhibit X-5: Nearly Half of All Employers Participate at the Affiliate Level
Source: NFWS Data Reporting System
By type of employer activities, most employers (60 percent) were
active in hiring of individuals trained and/or referred by the
partnership, nearly a third of employers changed practices in pursuit
of partnership goal, and almost a quarter of employers (23 percent)
participated in workforce advocacy efforts at the state or national
level.
VI. Conclusion
As of 2014, the National Fund continued to reach new communities, with
four new collaboratives accepted into the network and 13 new
partnerships reporting achievements. During the course of the initiative,
a total of 39 collaboratives and 185 partnerships across the United
States have been supported by the National Fund. The National Fund
also continued to show an increase in overall size across key metrics,
reflected by the number of participants (67,209) and employers (5,303)
served by National Fund partnerships from 2008 to 2014.
Level of Employer Engagement
# %
N= 1110
Core Employers 321 29%
Partner Employers 240 22%
Affiliate Employers 549 49%

Executive Summary xi
Despite growth in the overall number of communities and partnerships
supported throughout the initiative, only 76 partnerships actively reported
in 2014, highlighting the dynamic nature of the National Fund
intervention, including the intermittent entry and exit of collaboratives and
partnerships. Exploration of data reported by partnerships active in
National Fund 2.0 illustrate shifts to participant demographics and
services and employer relationships. The analyses also highlight a
contraction in the rate of growth of partnerships, participants, and service
outcomes. Furthermore, differences in service and outcomes between
National Fund 2.0 and the first phase of the initiative may suggest
development of targeted strategies and support. The attrition of older
partnerships, relatively low number of new partnerships and the smaller
nature of remaining partnerships has significant implications for
achievement of National Fund 2.0 goals and for overall sustainability.
Participants succeeded in completing education and training programs at
high rates in several sectors. In addition, placement outcomes varied
across sectors, with some sectors that comprise a smaller share of
participation demonstrating notable placements as a share of
jobseekers. Likewise, partnerships in some sectors have succeeded in
connecting participants with better-quality jobs. Targeted expansion
efforts could build on the experiences of these partnerships in sectors
that offer opportunities for job seekers.
The growth rate in retention outcomes improved in 2014 for non-
incumbent participants. After a dip in the number achieving 6- and 12-
month retention in 2012 compared to 2013, the past year saw a return to
an upward trend. The experiences of the partnerships driving these
successful retention outcomes could be informative as the National Fund
pursues its goal of improved partnership performance.
Finally, because the legacy data collection and reporting systems have
not been modified to reflect National Fund 2.0 strategy, the data brief
draws on progress indicators and data collections systems developed in
the first phase of the initiative, and does not provide a comprehensive
assessment of defined National Fund 2.0 objectives or measures. As the
National Fund 2.0 implementation continues, greater alignment of
systems and evaluation strategies could provide a more comprehensive
understanding of initiative outcomes, and identify important areas of
success or opportunity that are not captured through existing systems.

Executive Summary xii
The evolution of the National Fund yields both new challenges and new
opportunities. The observations from the Data Brief, when viewed in
combination with the mission, vision and principles articulated in the
National Fund 2.0 strategic framework, highlight emerging areas of
achievement, as well as opportunities to reflect on current
implementation.

I.Introduction 1
I. Introduction
The National Fund for Workforce Solutions (National Fund) is a national
partnership of employers, communities, workers and philanthropy that
invests in regional funder collaboratives to strengthen local economies
and implement demand-driven workforce strategies. Since 2007, the
National Fund initiative has supported the creation and development of
regionally-based funder collaboratives and industry partnerships that
create talent supply chains, close skill gaps and improve systems.
During the first five years of implementation, from 2007 to 2012, the
National Fund goals included 1) development of a network of
collaboratives and industry partnerships, 2) positive employment and
career advancement outcomes for low-income individuals, 3) positive
labor-market outcomes for employers; and 4) changes to local and
regional workforce development systems.
The 2013 launch of National Fund 2.0 marked the evolution of the
National Fund for Workforce Solutions into an initiative with a more
nuanced strategic framework and diversified leadership structure. The
goals articulated by the new strategic framework include:
Improve public systems and employer practices;
Expand and deepen impact; and
Promote learning and continuous improvement.
The 2.0 framework includes multiple objectives related to these goals, as
well as strategic principles expected to yield success. While the 2.0
framework is clearly aligned with the original framework, it is a more
complex articulation of the model.

I.Introduction 2
Over the course of the initiative, the National Fund has used descriptive
annual reports produced by a third-party evaluation to track the
implementation of and document progress toward National Fund goals.
A national data reporting system has been one of the key ways to
describe the characteristics and scale of National Fund implementation.
The 2015 Data Brief continues this effort by describing National Fund
progress and trends from data reported by participating industry
partnerships through the annual reporting system.7 In addition to
describing overall cumulative progress, it focuses on the National Fund
2.0 goal to Expand and Deepen Impact.8
From 2008 to 2014, the National Fund and its partners increased the
scale of participants served, the extent of education and training services
provided, and the share of degrees and certificates received by
participants. These accomplishments have expanded the Fund’s reach
and contributed to increased education and training opportunities for
jobseekers and incumbent workers.9
The first section of the report provides a summary of National Fund 2.0
progress and changing trends from those identified in the first phase of
the National Fund through 2012. The next section describes industry
partnership characteristics and evolution over time. The following
sections provide evidence of achievement and outcomes for low-income
participants, and a summary of employer services and activity. The
conclusion briefly reviews overall findings of National Fund progress
toward goals, and describes high-level implications for on-going initiative
development and implementation.
7 The evaluation framework and related indicators continue to reflect the original reporting guidance and data collection systems.
While the stability in the evaluation framework yields continuity and enables comparisons over time, there is less alignment between available data and the goals, objectives and targets articulated by the National Fund 2.0 framework.
8 Progress toward goals is presented in terms of industry partnership composition, low-income worker outcomes, and employer services. Although indicators continue to reflect the original reporting guidance and data collection systems developed in the first phase of the Fund, these data offer a comparable summary that can supplement new evaluation strategies developed to support National Fund 2.0 learnings.
9 Note that selected changes to data structure and/or outcomes have been made retrospectively based on collaborative and partnership input. As a result, some historical data presented in this report may not match the data presented in previous years.

II. National Fund 2.0: Expand and Deepen Impact
3
II. National Fund 2.0: Expand and Deepen Impact
Evolution of National Fund Goals
The first phase of the National Fund, from 2008 through 2012, specified
three distinct goals related to serving communities, individuals and
employers, including 1) organizing, supporting and developing a national
network of regional funding collaboratives; 2) assisting 50,000 low-
income jobseekers and workers to achieve employment and career
advancement opportunities; and 3) assisting 2,000 employers to address
human resource needs.
The National Fund 2.0, initiated in 2013, clarified three overarching
goals, and defined measurable objectives for each initiative goal:
Improve Public Systems and Employer Practices
Partner with employers to achieve improved career advancement
practices for low-wage workers in 100 workplaces.
Achieve federal policies supporting industry partnerships, career
pathways, and sufficient investments to meet employer needs for
skilled workers.
In 10 states, generate significant workforce and/or educational policy
changes to improve career opportunities for low-wage workers.
Complete 12 business impact studies that document the benefits of
career advancement investments and innovative workplace
practices.
Expand and Deepen Impact
Enable 100,000 low-wage individuals in 45 communities to obtain the
skills, credentials, and other supports necessary to acquire and
advance in family-supporting careers.
Enable 15 new communities to organize, develop, and sustain
successful regional funder collaboratives and industry partnerships.
Raise $150 million in local matching investments to match $20
million in national grants to regional collaboratives.

II. National Fund 2.0: Expand and Deepen Impact
4
Partner with 3,000 employers to generate industry intelligence to
guide investments in worker skills and workplace practices that yield
tangible benefits to employers and workers.
Scale up and deepen the performance of 50 local industry
partnerships by broadening employer leadership, expanding the
acquisition of industry-recognized credentials, increasing employer
investments in training and career development services, and
supporting business competitiveness.
Promote Learning and Continuous Improvement
Identify, evaluate, and document 10 key workforce-specific
investments that produce the best results and/or illustrate exemplary
industry partnerships.
Aggressively promote 10 exemplary strategies on the
implementation of industry partnerships using case studies,
research, and evaluation.
Document and disseminate processes and results for both internal
and external audiences through compelling publications, professional
development activities, peer learning events, and social media
channels.
This data brief is one of a diverse set of activities the National Fund is
pursuing to understand the initiative’s progress and opportunities for
improvement in achieving its National Fund 2.0 goals and objectives.
The data brief communicates progress and trends that can be identified
through the industry partnership and cumulative participant data
collected annually. Complimentary activities underway include the
concurrent Social Innovation Fund (SIF) evaluation, planned business
impact studies, and targeted systems change analyses.
The scope and scale of data used to inform this brief are most
responsive to the National Fund 2.0 goal to expand and deepen impact,
and can address select related objectives. National Fund 2.0
expectations related to scale and impact are aligned with the original
goals. However, the objectives have evolved. For example, new
expectations around service participation by low-wage individuals
emphasize skills and credential acquisition. Similarly, the employer role
has shifted from that providing input on skill needs and receiving
services, to leading industry partnerships, identifying labor market needs,
and developing career advancement pathways. The National Fund 2.0
goals also articulate specific targets related to continued network
expansion, partnership performance and leveraged funds.

II. National Fund 2.0: Expand and Deepen Impact
5
The data collection process enables the Fund to identify trends and
progress in the first two years of National Fund 2.0 implementation. This
section describes National Fund 2.0 highlights related to partnership
formation and characteristics, and participant demographics and
outcomes, as well as variation in trends observed between National
Fund 2.0 and those identified in the first phase of National Fund
implementation through 2012.
Although the National Fund continues to grow, there is some indication
that the pace of growth has slowed during the first two years of National
Fund 2.0 implementation. In 2014 there were 13 new industry
partnerships reporting, which brings the cumulative number of
partnerships in the National Fund over six years to 185.
Despite this overall increase in partnerships, the growth rate of added
partnerships each year is slowing. The 13 new partnerships added in
2014 is the smallest number of partnerships added since the National
Fund’s inception in 2007, and continues the contraction in growth of new
partnerships seen in 2013 -- the first year of National Fund 2.0. This
decline is due in part to a decline in the addition of new collaboratives, as
well as a decline in the number of new partnerships initiated among both
new and existing collaboratives.
National Fund 2.0 also continues to add to its cumulative total of
participants served year to year. By the end of 2014, National Fund 2.0
partnerships served 12,346 more participants, which brings total
participants in the two years of National Fund 2.0 to 25,211. Although
the number of participants in National Fund 2.0 doubled between 2013
and 2014, if the number of participants increase by roughly this amount
(12,000) over the next three years, the National Fund 2.0 will fall short of
its 2017 goal to enable 100,000 low wage individuals to obtain the skills,
credentials, and other supports necessary to acquire and advance in
family supporting careers.10
10 If the National Fund measures progress of its 100,000 goal by number of participants who achieve an education and training
completion or job placement, versus number of participants served, then progress is slightly different. Of the 25,221 NFWS 2.0 participants, 16,875 completed education and training, and 7,605 received job placements by the end of 2014. Another 7,016 are incumbent workers who have jobs. Using these measures, for example, at the current pace of growth, National Fund 2.0 would reach a goal of 100,000 of education or training completions by 2023.

II. National Fund 2.0: Expand and Deepen Impact
6
Participants in National Fund 2.0 were more likely to be served by
healthcare (36 percent) or manufacturing sector (34 percent)
partnerships than any other sector. The share of participants served by
manufacturing partnerships grew from 13 percent of participants served
through 2012, to 34 percent of participants served in National Fund 2.0.
Moreover, the share of participants in construction focused partnerships
dropped from 20 percent of participants served through 2012 to 6
percent of participants served in National Fund 2.0.
There appears to be some shifts in the type of services and completions
reported among National Fund 2.0 participants. Substantially smaller
proportions of National Fund 2.0 participants received primary non-
education services, including career coaching, case management and
supportive services, compared to participants receiving services through
2012. In addition, participants completing basic skills, workplace
readiness, and other education and training comprised smaller shares of
overall completions in National Fund 2.0. On the other hand, a greater
share of National Fund 2.0 participants received on-the-job training
(OJT), and apprenticeship and OJT completions comprise a higher
proportion of all training completions in the National Fund 2.0.
Partnerships reported 12,534 degrees and credentials achieved in
National Fund 2.0. The composition of degrees and credentials achieved
varies somewhat between National 2.0 and cumulative progress through
2012. National Fund 2.0 has produced a greater share of workplace
readiness credentials as a share of total degrees/credentials (48 percent
compared to 19 percent), and proportionately fewer occupational skills
credentials or certificates (39 percent compared to 72 percent).
While shifts in services and completions seem to be occurring between
phases, placement outcomes in National Fund 2.0 are comparable to
those achieved from 2008 to 2012. National Fund 2.0 partnerships
reported that 7,605 of their job seeker participants received a job
placement. That represents 42 percent of National Fund 2.0’s 18,205
total jobs seekers, or the same job placement ratio as the first phase of
the National Fund from 2008 to 2012. The percent of jobseekers
achieving 6- and 12-month retention in National Fund 2.0 is slightly
lower, but roughly on pace with outcomes through 2012 when
considering the shorter timeframe of implementation and outcome
measurement in National Fund 2.011.
11 National Fund 2.0 data reflect the first two-years of implementation since the development of the National Fund 2.0. Although we
would not expect large numbers of participants new to the Fund in the first year of National Fund 2.0 to have achieved 6 or 12 month retention, the cumulative nature of the data includes retention figures for participants who entered the program prior the first year of National Fund 2.0.

II. National Fund 2.0: Expand and Deepen Impact
7

III. Industry Partnerships 8
III. Industry Partnerships
Industry Partnership Characteristics
and Variation
Number of Partnerships
In 2014, thirteen new partnerships reported in the National Fund online
system, bringing the cumulative number of reporting industry
partnerships over seven years to 185. This is the lowest number of newly
reporting industry partnerships since the initiation of the Fund. This
decline is due in part to a decline in the addition of new collaboratives, as
well as slower partnership growth among both new and existing
collaboratives. In 2014, 76 partnerships actively reported participant
data, representing just over 40 percent of the 185 partnerships supported
during the course of the initiative.12 (See Exhibit III-1)
Exhibit III-I: The Annual Number of New Partnerships has
Decreased Since 2011 (n=185)
Source: NFWS Data Reporting System
12 The reasons for ceasing reporting included 1) the partnership was no longer active and/or supported by the collaborative; 2) the
collaborative was no longer active and/or funded by NFW. We do not have consistent data about the post-NFWS experience of the 109 partnerships that ceased reporting.
34
25
25
39
28
21
13
0
5
10
15
20
25
30
35
40
45
2008 2009 2010 2011 2012 2013 2014
III. Industry Partnerships 9
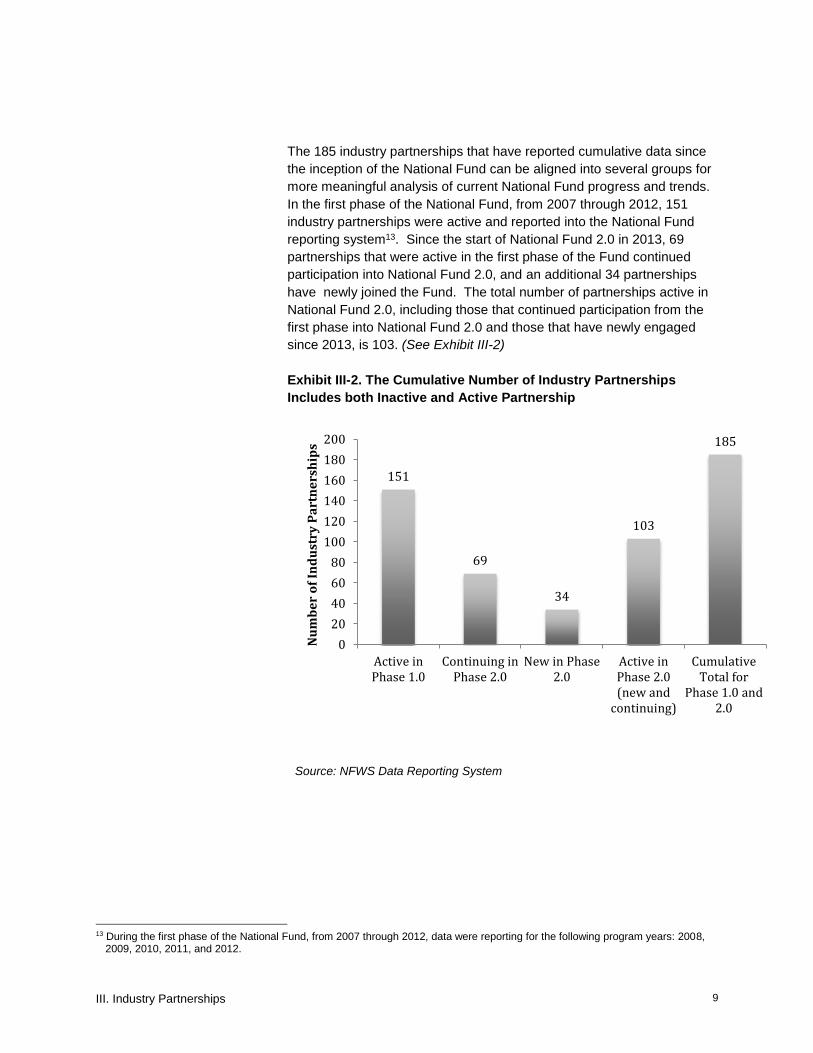
The 185 industry partnerships that have reported cumulative data since
the inception of the National Fund can be aligned into several groups for
more meaningful analysis of current National Fund progress and trends.
In the first phase of the National Fund, from 2007 through 2012, 151
industry partnerships were active and reported into the National Fund
reporting system13. Since the start of National Fund 2.0 in 2013, 69
partnerships that were active in the first phase of the Fund continued
participation into National Fund 2.0, and an additional 34 partnerships
have newly joined the Fund. The total number of partnerships active in
National Fund 2.0, including those that continued participation from the
first phase into National Fund 2.0 and those that have newly engaged
since 2013, is 103. (See Exhibit III-2)
Exhibit III-2. The Cumulative Number of Industry Partnerships
Includes both Inactive and Active Partnership
Source: NFWS Data Reporting System
13 During the first phase of the National Fund, from 2007 through 2012, data were reporting for the following program years: 2008,
2009, 2010, 2011, and 2012.
151
69
34
103
185
0
20
40
60
80
100
120
140
160
180
200
Active inPhase 1.0
Continuing inPhase 2.0
New in Phase2.0
Active inPhase 2.0(new and
continuing)
CumulativeTotal for
Phase 1.0 and2.0
Nu
mb
er
of
Ind
ust
ry P
art
ne
rsh
ips

III. Industry Partnerships 10
Scale/Size
By the end of 2014, National Fund partnerships had enrolled 67,209
participants since the inception of the Fund. Among partnerships that
reported serving participants, the size of the partnerships ranged from a
low of four participants to a high of 5,982 participants.14 The largest
distribution of partnerships (31 percent) served a range of 101 to 500
participants.
As of 2014, 38 partnerships had served more than 500 participants. Out
of 185 industry partnerships, twenty were responsible for more than half
(56 percent) of all participants served. The top five partnerships, each of
which reported more than 2,000 participants, served over one-quarter of
all participants.15 The share of 2.0 partnerships serving more than 500
participants increased considerably over the past year from 4 percent of
partnerships after the first year of National Fund 2.0, to 14 percent of
industry partnerships after the first two years of 2.0, reflecting continued
growth in the scale of partnerships since the start of National Fund 2.0.
Similar to cumulative findings, the greatest share of National Fund 2.0
partnerships (38 percent) served between 101 and 500 participants.
As might be expected, given the iterative and flexible granting process,
the National Fund portfolio included a mixture of both older and newly
contracted partnerships. The National Fund portfolio also includes both
more and less experienced partnerships, based on the reported year of
formation, with nearly two-thirds (62 percent) formed in 2010 or earlier.
Partnerships formed in2010 or earlier also served nearly three-quarters
of all participants (70 percent).
The growth rate in number of participants served tends to be higher in
earlier years of partnerships’ National Fund participation, often peaking
in the second year of their grant. Exhibit III-3 illustrates median
participant growth rate in cumulative numbers served across all National
Fund partnerships, and by length of time a partnership has been
engaged and reporting through the Fund.
14 An additional three partnerships submitted a report, but did not report serving any participants. 15 The largest partnership is the Health Careers Collaborative of Greater Cincinnati. The next four largest include Port Jobs in
Seattle, WRTP Construction in Milwaukee, the Worker Education and Resource Center (WERC) in Los Angeles, and Pittsburgh Works. However, WRTP Construction and WERC are no longer considered active NFWS partnerships.

III. Industry Partnerships 11
Exhibit III-3: The Annual Growth Rate of Participants Peaks in the Second Year of Fund
Participation
Source: NFWS Data Reporting System
The growth rate of cumulative participants across all partnerships may
be influenced by the composition of partnerships maturity across
reporting partnerships. If the second year of National Fund participation
is generally the year of the greatest increase in participant growth, the
percentage of partnerships in that stage may affect the overall annual
rate of enrollment.
Sector Focus
Analyzing the distribution of partnerships cumulatively by sector focus
since the start of the Fund, the largest proportions belong to healthcare
(37 percent of all partnership), manufacturing (17 percent), and
construction (14 percent). As shown in Exhibit III-5, National Fund 2.0
partnerships are similarly focused on healthcare (31 percent) and
manufacturing (24 percent). Industry partnerships that are new to the
Fund since the start of 2.0 magnify this trend, with 35 percent focused on
manufacturing and 24 percent focused on healthcare. (See Exhibit III-4)
0%
20%
40%
60%
80%
100%
120%
140%
160%
180%
200%
Year 2 Year 3 Year 4 Year 5 Year 6 Year 7
All WPs reporting at least 3 years 7 years reported
6 years reported 5 years reported
4 years reported 3 years reported
III. Industry Partnerships 12
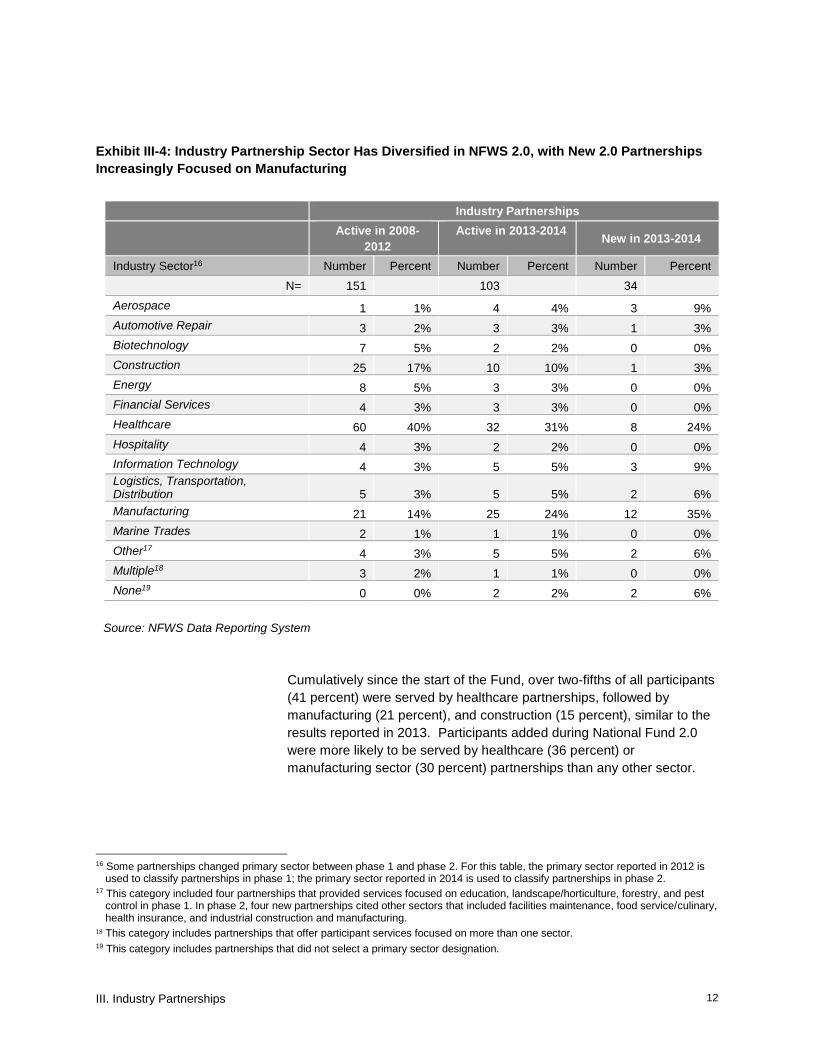
Exhibit III-4: Industry Partnership Sector Has Diversified in NFWS 2.0, with New 2.0 Partnerships
Increasingly Focused on Manufacturing
Industry Partnerships
Active in 2008-
2012
Active in 2013-2014 New in 2013-2014
Industry Sector16 Number Percent Number Percent Number Percent
N= 151 103 34
Aerospace 1 1% 4 4% 3 9%
Automotive Repair 3 2% 3 3% 1 3%
Biotechnology 7 5% 2 2% 0 0%
Construction 25 17% 10 10% 1 3%
Energy 8 5% 3 3% 0 0%
Financial Services 4 3% 3 3% 0 0%
Healthcare 60 40% 32 31% 8 24%
Hospitality 4 3% 2 2% 0 0%
Information Technology 4 3% 5 5% 3 9% Logistics, Transportation, Distribution 5 3% 5 5% 2 6%
Manufacturing 21 14% 25 24% 12 35%
Marine Trades 2 1% 1 1% 0 0%
Other17 4 3% 5 5% 2 6%
Multiple18 3 2% 1 1% 0 0%
None19 0 0% 2 2% 2 6%
Source: NFWS Data Reporting System
Cumulatively since the start of the Fund, over two-fifths of all participants
(41 percent) were served by healthcare partnerships, followed by
manufacturing (21 percent), and construction (15 percent), similar to the
results reported in 2013. Participants added during National Fund 2.0
were more likely to be served by healthcare (36 percent) or
manufacturing sector (30 percent) partnerships than any other sector.
16 Some partnerships changed primary sector between phase 1 and phase 2. For this table, the primary sector reported in 2012 is
used to classify partnerships in phase 1; the primary sector reported in 2014 is used to classify partnerships in phase 2. 17 This category included four partnerships that provided services focused on education, landscape/horticulture, forestry, and pest
control in phase 1. In phase 2, four new partnerships cited other sectors that included facilities maintenance, food service/culinary, health insurance, and industrial construction and manufacturing.
18 This category includes partnerships that offer participant services focused on more than one sector. 19 This category includes partnerships that did not select a primary sector designation.

III. Industry Partnerships 13
The share of participants served by manufacturing partnerships grew
from 16 percent of participants served through 2012, to 30 percent of
new participants served during National Fund 2.0. Moreover, among
partnerships new to the Fund since the start of National Fund 2.0, the
share of participants in manufacturing focused partnerships reached 61
percent. The share of participants in construction focused partnerships
dropped from 21 percent of participants served through 2012 to 4
percent of new participants served during National Fund 2.0. (See
Exhibit III-5).
Exhibit III-5 Participation in Healthcare and Manufacturing Industries Is Most Prevalent in National
Fund 2.0
Participants
Cumulative
2008-2012: All
Phase 1
Partnerships
Added in 2013-2014:
All Phase 2
Partnerships
Added in 2013-2014:
New Partnerships Only
Industry Sector of Partnership20
Number Percent Number Percent Number Percent
N= 41,988 25,221 5,984
Aerospace 1,079 3% 1,663 7% 614 10%
Automotive Repair 192 <1% 92 <1% 22 0%
Biotechnology 764 2% 130 1% 0 0%
Construction 8,975 21% 961 4% 175 3%
Energy 528 1% 775 3% 0 0%
Financial Services 586 1% 308 1% 0 0%
Healthcare 18,404 44% 9,189 36% 521 9%
Hospitality 772 2% 83 <1% 0 0%
Information Technology 64 <1% 142 1% 42 1%
Logistics, Transportation, Distribution 2,229 5% 2,250 9% 4 <1%
Manufacturing 6,517 16% 7,546 30% 3663 61%
Marine Trades 224 1% 707 3% 0 0%
Other 232 1% 439 2% 46 1%
Multiple 1,422 3% 39 <1% 0 0%
None 0 0% 897 4% 897 15%
Source: NFWS Data Reporting System
20 Some partnerships changed primary sector between phase 1 and phase 2. For this table, the primary sector reported in 2012 is
used to classify partnerships and their participants in phase 1; the primary sector reported in 2014 is used to classify partnerships and their participants in phase 2.

III. Industry Partnerships 14
Program Type21
Industry partnerships in National Fund 2.0 were more likely to offer both
jobseeker and incumbent programs (60 percent) than partnerships in the
first phase (38 percent). Among new partnerships added in phase 2, half
offered both jobseeker and incumbent worker programs. (See Exhibit III-
6).
Exhibit III-6: The Share of Partnerships Offering both Incumbent
Worker and Jobseeker Programs Has Grown Over Time
Source: NFWS Data Reporting System
21 For NFWS reporting purposes, incumbent worker programs were defined as “a program…serving employed individuals that is
typically coordinated directly with the participants’ current employer”, while jobseeker programs were defined as those “not directly offered through an employer and serving participants who are not employed, or those who are employed, but seeking new employment”.
52%
30%
41%
10%8% 9%
38%
60%
50%
0%
10%
20%
30%
40%
50%
60%
70%
All Active 2008-2012 (N=149)
All Active 2013-2014 (N=101)
New 2013-2014(N=33)
Jobseeker Only
Incumbent Only
Both

III. Industry Partnerships 15
Program Type by Sector
As of 2014, cumulative program offerings differed slightly by sector, but
followed patterns observed in recent reporting years. Two-thirds of both
manufacturing and healthcare partnerships offered incumbent worker
programs. Just under one-third (31 percent) of construction
partnerships offered incumbent worker programs. Among other sectors,
75 percent of aerospace partnerships offered incumbent worker
programs, as well as 63 percent of energy-sector partnerships, and both
(100 percent) of the partnerships focused on marine trades. In contrast,
all of construction partnerships (100 percent), and over three-quarters of
manufacturing partnerships and healthcare partnerships (94 and 79
percent, respectively) offered jobseeker services.
Due to the underlying distribution of program type, partnerships in all
sectors except energy served a greater proportion of jobseekers than
incumbent workers; in most sectors, the vast majority of participants
served were jobseekers. Energy, health-care, and manufacturing
continued to show the greatest equivalence between the number of
incumbent and jobseeker participants served, with incumbent workers
comprising 55 percent, 47 percent and 32 percent, respectively, of all
participants within each sector.
Lead Organization and Types of Participating
Organizations
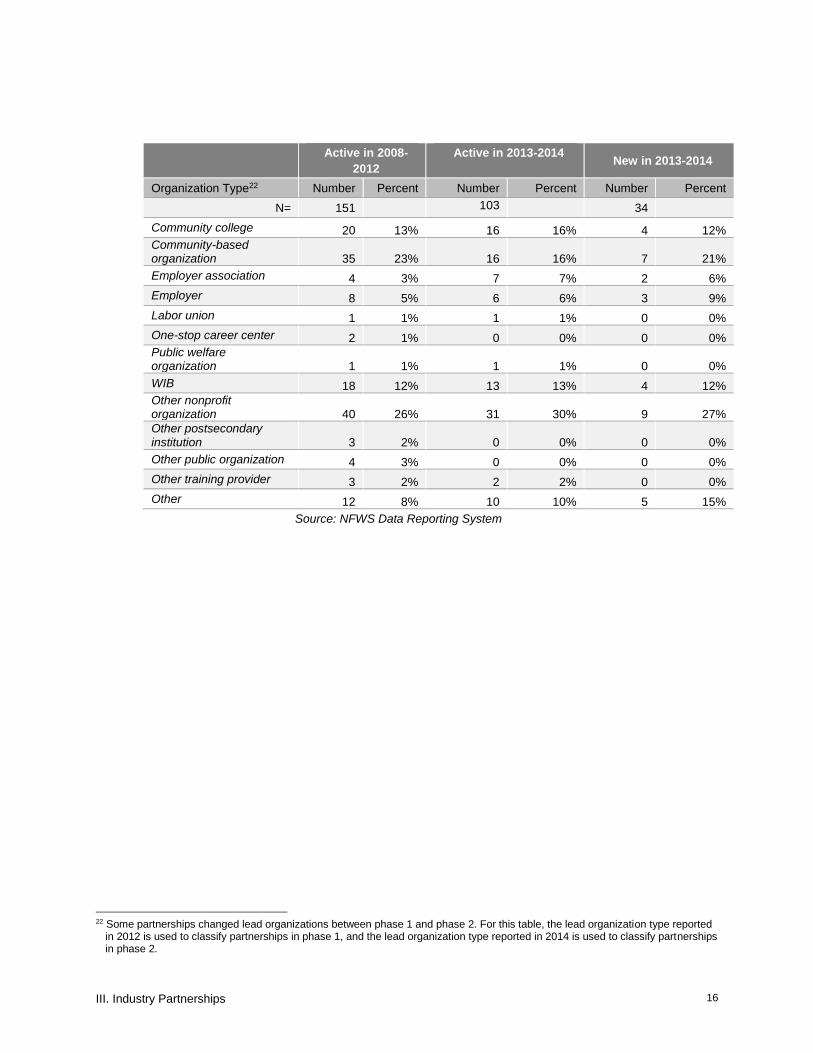
As seen in phase 1, community-based organizations (21 percent) and
other nonprofits (27 percent) continued to comprise the largest share of
new partnerships added in phase 2; these types of organizations have
led the largest share of partnerships since the National Fund’s
inception.(See Exhibit III-7)
Exhibit III-7: Most Industry Partnerships Are Led by Community
Based Organizations or Other Non-profits
Industry
Partnerships
III. Industry Partnerships 16
Active in 2008-
2012
Active in 2013-2014 New in 2013-2014
Organization Type22 Number Percent Number Percent Number Percent
N= 151 103 34
Community college 20 13% 16 16% 4 12%
Community-based organization 35 23% 16 16% 7 21%
Employer association 4 3% 7 7% 2 6%
Employer 8 5% 6 6% 3 9%
Labor union 1 1% 1 1% 0 0%
One-stop career center 2 1% 0 0% 0 0%
Public welfare organization 1 1% 1 1% 0 0%
WIB 18 12% 13 13% 4 12%
Other nonprofit organization 40 26% 31 30% 9 27%
Other postsecondary institution 3 2% 0 0% 0 0%
Other public organization 4 3% 0 0% 0 0%
Other training provider 3 2% 2 2% 0 0%
Other 12 8% 10 10% 5 15%
Source: NFWS Data Reporting System
22 Some partnerships changed lead organizations between phase 1 and phase 2. For this table, the lead organization type reported
in 2012 is used to classify partnerships in phase 1, and the lead organization type reported in 2014 is used to classify partnerships in phase 2.

IV. Low-Income Individuals 17
IV. Low-Income Individuals
Participants Served
The cumulative total of participants served over the life of the National
Fund is 67,209. 23 However, after rapid growth in the first three years of
NFWS (2008 to 2011), the number of new participants added per year
leveled off between 2011 and 2014. (See Exhibit IV-1)
.
Exhibit IV-1: The Number of Newly Reported Participants Has Been
Stable Since 2011 (n=67,209)
Source: NFWS Data Reporting System
2323 Modifications to cumulative incumbent data at multiple partnerships are likely partially responsible for the significant decrease in
the rate of incumbent participation in 2014.
3,262
5,853
8,659
11,880 12,334
12,874 12,347
-
2,000
4,000
6,000
8,000
10,000
12,000
14,000
2008 2009 2010 2011 2012 2013 2014
Num
be
r o
f N
ew
ly R
ep
ort
ed
Pa
rtic
ipa
nts
b
y Y
ea
r

IV. Low-Income Individuals 18
The Fund 2.0 5-year goal is to serve 100,000 new individuals by 2017.
The 25,221participants served since National Fund 2.0 inception
represents 25 percent of this 5-year goal.
The National Fund partnerships added 12,347 new participants served in
2014 -- 10,335 job-seekers and 2,012 incumbent workers. Between
2013 and 2014, the cumulative number of participants served by
jobseeker programs grew by 29 percent to reach 46,256, similar to the
rate of growth in previous years. The number of reported participants in
incumbent worker programs reached 20,953; this signifies a
considerable decrease in annual growth rate of incumbent participation.
24, 25
Exhibit IV-2: The Rate of New Participants Added each Year has
Declined Since 2011
24 For NFWS reporting purposes, incumbent worker programs were defined as those “serving employed individuals that is typically
coordinated directly with the participants’ current employer”, while jobseeker programs were defined as those “not directly offered through an employer and serving participants who are not employed or employed, but seeking new employment”. Participant outcomes were reported separately according to these definitions.
25 Although this cumulative total is a marked decrease in percent growth of incumbent participants from the previous reporting year
(11 percent versus 36 percent), this decrease in growth is in part attributed to the data cleaning measures newly employed at select
incumbent partnerships, which resulted in large downward adjustments to incumbent participation figures relative to previous years.
To assess growth in incumbent participation, incumbent partnerships with adjusted data in 2014 were removed from the analysis.
Among non-adjusted incumbent partnerships, the percent growth in 2014 was 18 percent, compared to 33 percent the preceding
year among the same group of industry partnerships, indicating considerable decrease in the growth of incumbent participation
independent of data adjustments. In future analysis, because of the significant changes in data reporting at multiple partnerships in
2014, the new incumbent worker cumulative total should be considered a new baseline for measuring future growth and progress
among these partnerships.
-
2,000
4,000
6,000
8,000
10,000
12,000
14,000
2008 2009 2010 2011 2012 2013 2014Num
ber
of
Annual N
ew
Part
icip
ants
Non-Incumbent Incumbent All Programs

IV. Low-Income Individuals 19
Source: NFWS Data Reporting System
Participant Demographics and Background
Gender
The share of men served cumulatively by the National Fund increased
from 34 percent in 2008 to 45 percent in 2014, however, the composition
by gender across the first five years of the National Fund through 2012,
and the first two years of National Fund 2.0 varies.26 The proportion of
missing gender data jumped in 2014 from less than 20 percent in prior
years to 37 percent in 2014, limiting the ability to understand underlying
gender trends. This gap was primarily in the incumbent programs. (See
Exhibit IV-3).
Exhibit IV-3: The Reported Share of Female Participants Has
Decreased in National Fund 2.0
Source: NFWS Data Reporting System
26 In National Fund participation through 2012, 42 percent of participants served were male, 50 percent were female, and gender
was missing for 8 percent of participants. In National Fund 2.0, 41 percent of participants served thus far are male, 37 percent are female, and data are missing for 22 percent of participants. When including only available data (excluding participants for whom gender is missing), 52 percent of participants were male in National Fund 2.0, versus 46 percent through 2012
0%
10%
20%
30%
40%
50%
60%
70%
80%
90%
100%
National Fund 1.0 National Fund 2.0
Male Female Gender Unknown
IV. Low-Income Individuals 20
Since the start of the Fund, jobseeker programs have tended to serve
more males (46 percent of jobseeker participants), and incumbent
programs have tended to serve more females (49 percent of incumbent
participants). Although the large proportion of unknown or missing data
obscures gender trends, the large share of female participants in
incumbent worker programs may reflect underlying gender participation
trends by sector, since healthcare programs often serve a
disproportionate share of female participants. Cumulatively, 45 percent
of all incumbent programs were in the healthcare sector, compared to 33
percent of all jobseeker programs.
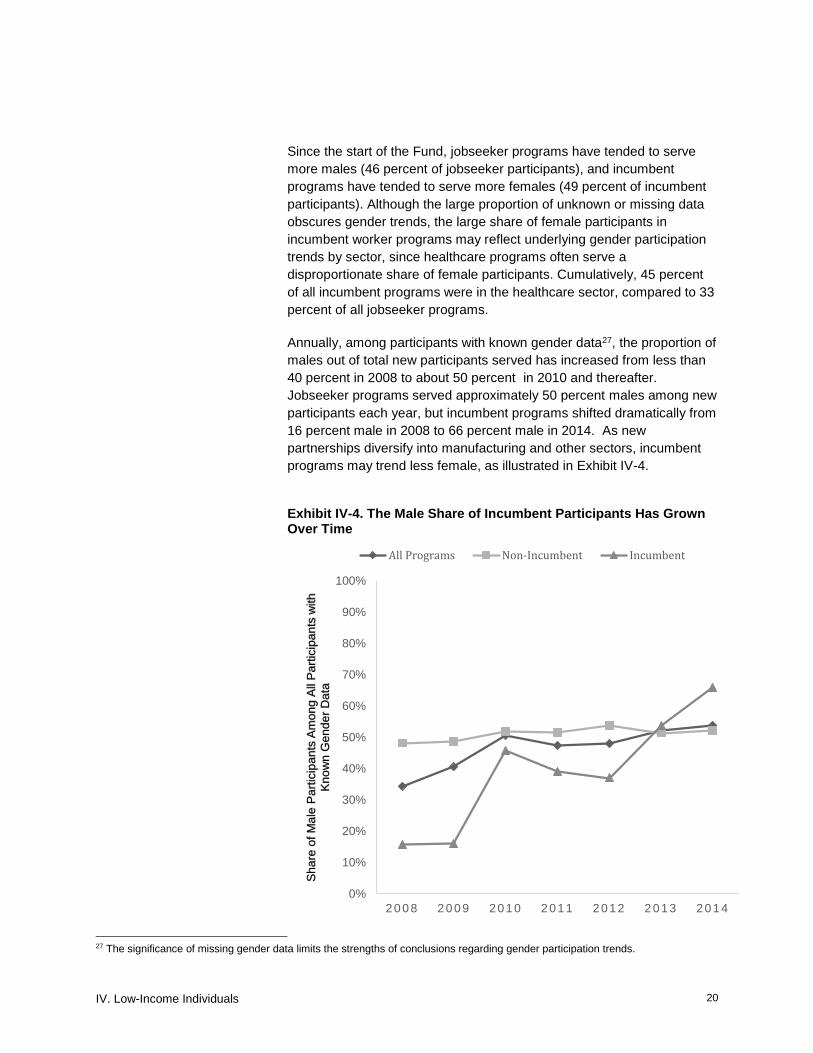
Annually, among participants with known gender data27, the proportion of
males out of total new participants served has increased from less than
40 percent in 2008 to about 50 percent in 2010 and thereafter.
Jobseeker programs served approximately 50 percent males among new
participants each year, but incumbent programs shifted dramatically from
16 percent male in 2008 to 66 percent male in 2014. As new
partnerships diversify into manufacturing and other sectors, incumbent
programs may trend less female, as illustrated in Exhibit IV-4.
Exhibit IV-4. The Male Share of Incumbent Participants Has Grown Over Time
27 The significance of missing gender data limits the strengths of conclusions regarding gender participation trends.
0%
10%
20%
30%
40%
50%
60%
70%
80%
90%
100%
2008 2009 2010 2011 2012 2013 2014
Sh
are
of M
ale
Pa
rtic
ipa
nts
Am
on
g A
ll P
art
icip
an
ts w
ith
K
no
wn
Gen
de
r D
ata
All Programs Non-Incumbent Incumbent
IV. Low-Income Individuals 21
Source: NFWS Data Reporting System
Female participants predominated sector-based partnerships focused on
healthcare (72 percent female), hospitality (67 percent), and
biotechnology (57 percent).Male participants predominated in aerospace
(81 percent), construction (79 percent), and energy (95 percent) related
partnerships.
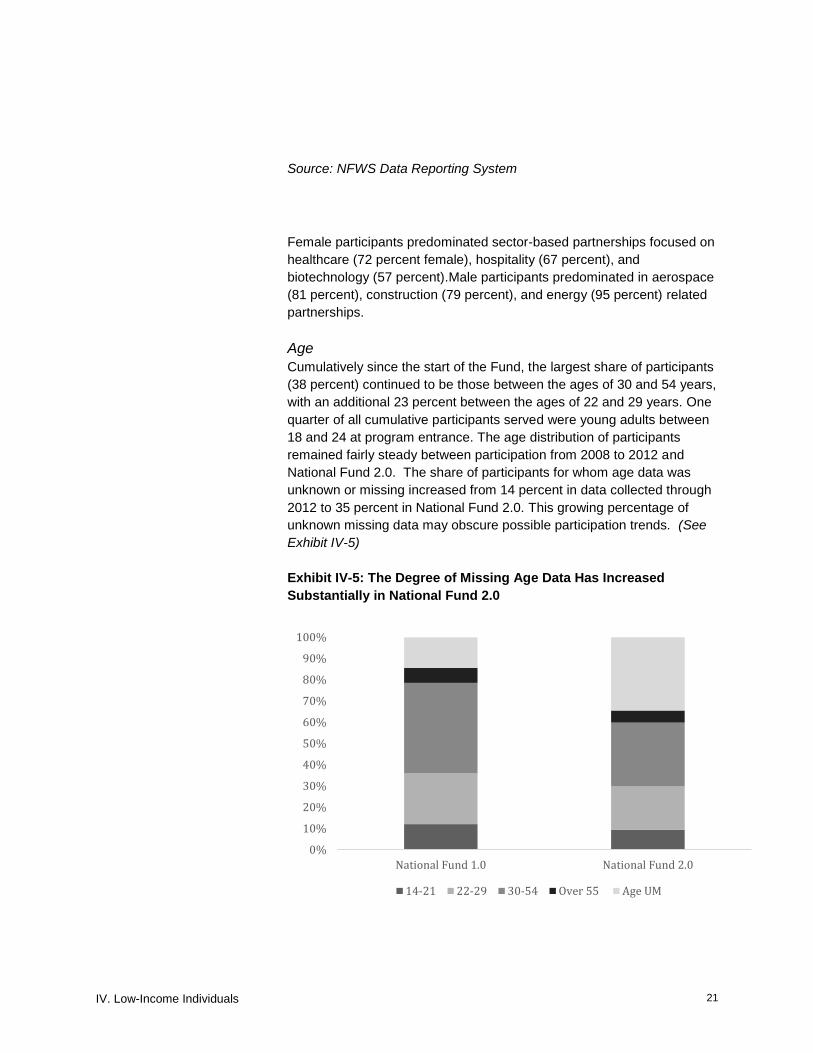
Age
Cumulatively since the start of the Fund, the largest share of participants
(38 percent) continued to be those between the ages of 30 and 54 years,
with an additional 23 percent between the ages of 22 and 29 years. One
quarter of all cumulative participants served were young adults between
18 and 24 at program entrance. The age distribution of participants
remained fairly steady between participation from 2008 to 2012 and
National Fund 2.0. The share of participants for whom age data was
unknown or missing increased from 14 percent in data collected through
2012 to 35 percent in National Fund 2.0. This growing percentage of
unknown missing data may obscure possible participation trends. (See
Exhibit IV-5)
Exhibit IV-5: The Degree of Missing Age Data Has Increased
Substantially in National Fund 2.0
0%
10%
20%
30%
40%
50%
60%
70%
80%
90%
100%
National Fund 1.0 National Fund 2.0
14-21 22-29 30-54 Over 55 Age UM

IV. Low-Income Individuals 22
Source: NFWS Data Reporting System
Race and Ethnicity
Cumulatively since the start of the Fund, African-Americans remain the
largest racial/ethnic group. However, over the course of the initiative, the
cumulative share of African-Americans has steadily declined, from 45
percent in 2008 to 35 percent in 2014. The share of Asians also declined
from 10 percent in 2008 to 4 percent in 2014, while the share of whites
increased from 18 percent to 29 percent. Although the demographic
composition of participants appears to have remained relatively stable
during the last few years, the share of participants with unknown or
missing race information has increased substantially over the course of
the initiative, limiting observations about the composition of the
participant population.28. (See Exhibit IV-5)
Exhibit IV-5: The Majority of Participants Served Across Both
Phases of the National Fund are White or African American
Source: NFWS Data Reporting System
28 When excluding data for participants on whom race information was unknown or missing, National Fund 2.0 appears to be serving
a much greater share of participants who are either white or African American (91 percent combined), versus the racial composition reported from 2008 to 2012, when 78 percent of participants were reported as white or African American. However, the large degree of missing data, particularly in National Fund 2.0, limits related conclusions.
0%
10%
20%
30%
40%
50%
60%
70%
80%
90%
100%
National Fund 1.0 National Fund 2.0
Share
of
Overa
ll P
aticip
ants
Asian Black or African American White Multiple Other Race UM

IV. Low-Income Individuals 23
The proportion of white participants out of all new participants with race
data available has fluctuated over time; it has been less than 50 percent
of all new participants served in every year of Fund implementation, with
a slight dip in 2014 to 38 percent. Within incumbent programs, white
participants have comprised increasing proportions of new participants
with known race data, jumping to 86 percent in 2014. However,
incumbent programs have suffered from poor race data collection, and
these data were missing for two-thirds of incumbent new participants in
2014.
Exhibit IV-6. The Percentage of White Participants Among those with
Known Race has Increased Substantially in Incumbent Programs, but Data
Quality is a Concern
Source: NFWS Data Reporting System
0%
10%
20%
30%
40%
50%
60%
70%
80%
90%
100%
2008 2009 2010 2011 2012 2013 2014
Sh
are
of W
hite
Pa
rtic
ipa
nts
Am
on
g A
ll P
art
icip
an
ts w
ith
Kn
ow
n R
ace
Data
All Programs Non-Incumbent Incumbent

IV. Low-Income Individuals 24
Cumulatively, among the largest sectors, African-Americans were the
largest share of participants in the construction (55 percent),
biotechnology (44 percent), hospitality (42 percent), and healthcare (35
percent) partnerships. In contrast, Whites comprised the largest shares
in the energy and manufacturing sectors (61 and 31 percent,
respectively). There also was a significant difference in the racial/ethnic
composition of incumbent and jobseeker programs. Cumulatively,
jobseeker programs were 40 percent African-American and 26 percent
White, while incumbent programs were 25 percent African-American and
35 percent White.
Nearly one-third (29 percent) of all partnerships reported having
cumulatively served a population that was at least half African-American,
similar to observations over the past two years of cumulative data.
Educational Attainment at Enrollment
Cumulatively as of 2014, forty-three percent of participants had a high
school diploma or less at program entrance, and 25 percent had some
college or greater education, including 5 percent with a bachelor’s
degree. The degree of unknown or missing data for education level at
entrance was pronounced in National Fund 2.0. Data is unknown or
missing for 43 percent of participants in 2.0, compared to 3 percent in
National Fund data collected through 2012. When excluding data for
individuals on whom education data was missing, National Fund 2.0
partnerships appear to be serving a higher share of individuals with
college degrees (8 percent versus 1 percent), as well as a relatively
smaller share of individuals with a high school diploma or less (62 versus
71). However, it is difficult to know if these trends would remain with
complete data. (See Exhibit IV-7)

IV. Low-Income Individuals 25
Exhibit IV-7: Missing Data on Education Level at Program Start
Limits Assessment of National Fund 2.0 Participation Trends
Source: NFWS Data Reporting System
As of 2014, fewer than half of all partnerships (45 percent) provided
services to a cumulative participant population made up primarily of
individuals with a high school diploma or less. There continued to be
clear variations by sector. Among the largest sectors, partnerships in the
marine trades, construction, financial services, and energy sectors
served the highest proportions of cumulative participants with a high
school diploma or less (74, 68, 62, and 57 percent, respectively).
0%
10%
20%
30%
40%
50%
60%
70%
80%
90%
100%
National Fund 1.0 National Fund 2.0
12 grade or less (no HS diploma) HS diploma or equivalent
Some college AA degree
BA or higher Ed UM

IV. Low-Income Individuals 26
Participant Services
Education and Training Services
The portfolio and distribution of participation in education and training
services has remained fairly consistent over time. Similar to previous
years, occupational skills training was provided to the largest share of
participants, reaching 39,444 individuals, or 59 percent of all participants,
during the course of the initiative. Education and training services
received by participants in National Fund 2.0 partnerships were similar to
the distribution in the initiative overall. However, a greater proportion of
National Fund 2.0 participants (18 percent) received on-the-job training
compared to participants from 2008 to 2012 (9 percent).. (See Exhibit IV-
8)
Exhibit IV-8: Occupational Training Is Consistently Provided to the
Largest Share of Participants
National Fund 1.0 National Fund 2.0
# % # %
N=
41,988
25,221
Apprenticeship
2,525 6%
2,525
10%
Basic Skills/ESL
5,590 13%
1,915
8%
Computer Literacy
5,054 12%
3,251
13%
Occupational Skills
25,258 60%
14,186
56%
On-the-Job Training
3,619 9%
4,654
18%
Workplace Readiness Life Skills
16,692
40%
9,832 39%
Other Education/Training
7,756
18%
3,525 14%
Source: NFWS Data Reporting System
The education or training services experiencing the most annual growth
in participation were apprenticeships and on-the-job training. The
proportion of individuals participating in apprenticeships grew from 4
percent in 2008 to 8 percent in 2014, with a growth rate of 40 percent
over the last year. The proportion of cumulative individuals participating
on-the-job training grew to 12 percent in 2014 at 8,273 participants,
reflecting a growth rate of 52 percent over the last year, also similar to
growth observed in 2013.

IV. Low-Income Individuals 27
Non-Education Services
Cumulatively, non-education services have also experienced continued
growth in all categories, although the shares receiving selected services,
including career coaching, case management and supportive services
declined substantially over the course of the initiative. Furthermore, the
proportion of cumulative participants receiving services in all categories
except asset development and job placement/job development declined
between 2013 and 2014.
Substantially smaller proportions of National Fund 2.0 participants
received key non-education services, including career coaching, case
management and supportive services, compared to participants from
2008 to 2012. Similar proportions of National Fund 2.0 participants
received asset development and job search/placement services
compared to participants from 2008 to 2012. This finding may suggest
that program models and the implementation of non-training services are
changing over time, reflecting the decrease in participation across key
non-training services in the initiative as a whole. (See Exhibit IV-9)
Exhibit IV-9: Non-Education Service Participation Has Declined in
Key Services
National Fund 1.0 National Fund 2.0
# % # %
N=
41,988
25,221
Assessment
28,333 67%
12,865
51%
Asset Development
4,357
10%
2,103 8%
Career Coaching
23,340 56%
8,922
35%
Case Management
18,663 44%
7,556
30%
Job Search/Job Placement
17,365
41%
10,195 40%
Supportive Services
15,091
36%
4,964 20%
Other Non-training
7,283 17%
3,140
12%
Source: NFWS Data Reporting System

IV. Low-Income Individuals 28
Services by Job Seeker and Incumbent Program Types
Occupational skills training continued to be the education/training service
received by the largest share of both jobseeker and incumbent
participants (56 and 64 percent, respectively). To be expected,
workplace readiness training was provided to a much larger share (52
percent) of jobseeker participants than incumbent participants (13
percent), reflecting incumbent workers’ employed status during
participation. (See Exhibit IV-10)
Exhibit IV-10: Education/Training Service Participation Varied by
Program Type, 2014
Education/Training Service Participants
Jobseeker Incumbent
# % # %
N= 46,256 20,953
Apprenticeship Program 3,811 8% 1,293 6%
Basic Skills/ESL Training 5,606 12% 1,899 9%
Computer Literacy Training 6,277 14% 2,028 10%
Occupational Skills Training 26,071 56% 13,373 64%
On-the-Job Training 5,462 12% 2,811 13%
Workplace Readiness/Life
Skills Training 23,887 52% 2,637 13%
Other Education Training
Program 6,813 15% 4,468 21%
Source: NFWS Data Reporting System
Services by Sector
The services received by participants also varied substantially by
industry sector. As of 2014, over 90 percent of participants in the
biotechnology and energy sectors (91 and 97 percent respectively) had
received occupational skills training, as did 84 percent of information
technology participants and 79 percent of automotive participants.
Construction participants receiving occupational skills training grew
slightly over the last year to 61 percent. The cumulative share of
manufacturing participants in occupational skills training dropped from 66
percent in 2013 to 53 percent in 2014.
IV. Low-Income Individuals 29
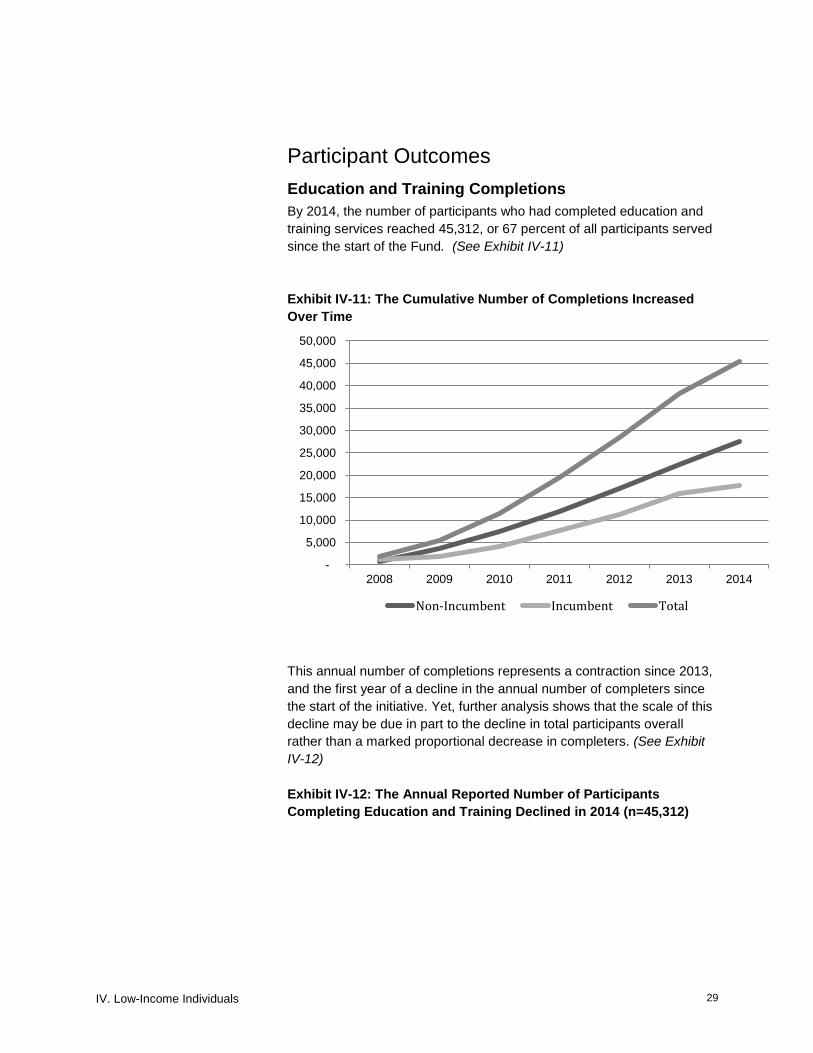
Participant Outcomes
Education and Training Completions
By 2014, the number of participants who had completed education and
training services reached 45,312, or 67 percent of all participants served
since the start of the Fund. (See Exhibit IV-11)
Exhibit IV-11: The Cumulative Number of Completions Increased
Over Time
This annual number of completions represents a contraction since 2013,
and the first year of a decline in the annual number of completers since
the start of the initiative. Yet, further analysis shows that the scale of this
decline may be due in part to the decline in total participants overall
rather than a marked proportional decrease in completers. (See Exhibit
IV-12)
Exhibit IV-12: The Annual Reported Number of Participants
Completing Education and Training Declined in 2014 (n=45,312)
-
5,000
10,000
15,000
20,000
25,000
30,000
35,000
40,000
45,000
50,000
2008 2009 2010 2011 2012 2013 2014
Non-Incumbent Incumbent Total

IV. Low-Income Individuals 30
Source: NFWS Data Reporting System
It is important to note that several Industry Partnerships undertook
extensive data quality improvement processes over the preceding year,
resulting in decreased reported cumulative numbers of incumbent
workers served across five partnerships. This data quality improvement
process has implications for assessing trends since the same data
cleaning measures have not been applied to data reported prior to 2014.
Including all National Fund Partnerships, the proportion of completions
as a share of all services received increased through 2013 across all
programs, and decreased in 2014. (See Exhibit IV-13)
Exhibit IV-13. The Rate of Completions as a Share of All Services
Received Increased through 2013
1,931
3,574
5,900
8,2048,828
9,786
7,089
0
2,000
4,000
6,000
8,000
10,000
12,000
2008 2009 2010 2011 2012 2013 2014
Annual N
um
ber
of
Part
icip
ant
Com
ple
tions

IV. Low-Income Individuals 31
When we exclude the partnerships with significant data adjustments in
2014, the annual growth rate in the number of participants completing
education and training in 2014 was 21 percent, compared to 31 percent
in 2013. When we identify the percent of participants completing
education and training as a proportion of total served, however, the
portion is relatively stable over the preceding years, from 64 percent in
2012, 65 percent in 2013, and 63 percent in 2014. This suggests a
decline in participant completion related to the decreased growth rate of
participants overall, and a relatively stable completion rate over recent
program years.
Occupational skills training continued to be the training service
completed by the greatest share of participants, increasing from 38
percent of all completers in the first phase of the Fund, to 41 percent of
all completers in National Fund 2.0. Apprenticeship and OJT completions
comprise a higher proportion of all training completions in National Fund
2.0 than in National Fund participation through 2012. In contrast, basic
skills, workplace readiness, and other education and training completions
comprised smaller shares of overall completions in National Fund 2.0.
(See Exhibit IV-14)
Exhibit IV-14: Occupational Skills Training Remains the Training Service Completed by the
Greatest Share of Participants
Education/Training Service Completions
Cumulative 2008-2012:
All Phase 1
Partnerships
Added in 2013-2014:
All Phase 2
Partnerships
Added in 2013-2014:
New Partnerships Only
0%
10%
20%
30%
40%
50%
60%
70%
80%
90%
100%
2008 2009 2010 2011 2012 2013 2014
Jobseeker Programs Incumbent Programs All Programs

IV. Low-Income Individuals 32
# % # % # %
N= 49,403 25,739 5,367
Apprenticeship Program 1,076 2% 1,651 6% 46 1%
Basic Skills/ESL Training 4,076 8% 1,218 5% 268 5%
Computer Literacy Training 3,920 8% 1,978 8% 746 14%
Occupational Skills Training 18,932 38% 10,565 41% 2,316 43%
On-the-Job Training 2,845 6% 3,211 12% 369 7%
Workplace Readiness/Life Skills Training 12,681 26% 5,336 21% 1,153 21%
Other Education Training
Program 5,873 12% 1,780 7% 469 9%
Source: NFWS Data Reporting System
Education and training completions varied somewhat by key participant
demographic characteristics. Among partnerships that served a majority
of participants with criminal backgrounds, participants were equally likely
to complete occupational skills training (64 percent), more likely to
complete workplace readiness (66 percent) and other education and
training (20 percent), and slightly less likely to complete other education
and training options.
Among partnerships that served young adults, a greater share of
participants completed apprenticeships (14 percent), occupational skills
training (74 percent), on-the-job training (21 percent), workplace
readiness (57 percent) and other education or training (26 percent). A
smaller share of participants at partnerships that served primarily young
adults completed computer literacy training (4 percent).
The completion ratios were high for participants enrolling in occupational
skills (75 percent completion), on-the-job training (73 percent), computer
literacy training (71 percent), and basic skills ESL training (71 percent).
Among partnerships that served primarily individuals with criminal
backgrounds, the completion rate for participants who received a given
service was higher for computer literacy (88 percent), occupational
training (81 percent), and workplace readiness (79 percent), and lower
for apprenticeship (26 percent) and on-the-job training (40 percent).
Partnerships appeared to have greater success with skills development
outside the workplace than with training in the workplace among this
population. Among partnerships serving primarily young adults, the
completion rate for participants who had received any given service was
smaller across all education and training categories, ranging from 57
percent to 68 percent.

IV. Low-Income Individuals 33
The completion rate for incumbent worker completion was consistently
higher than the rate for jobseekers across all education/training
categories. (See Exhibit IV-15).
Exhibit IV-15: The Share of Incumbent Workers Completing Services was Consistently Higher than
Jobseekers across the Majority of Education and Training Services, 2014
Education/Training Service Participants Completing Education and Training Services
Jobseeker Incumbent
# % # %
N= varied varied
Apprenticeship Program 1,612 42% 1,115 90%
Basic Skills/ESL Training 3,842 69% 1,452 76%
Computer Literacy Training 4,213 67% 1,685 83%
Occupational Skills Training 18,589 71% 10,908 82%
On-the-Job Training 3,572 65% 2,484 88%
Workplace Readiness/Life Skills Training 16,318 68% 1,699 64%
Other Education Training Program 4,217 62% 3,436 77%
Source: NFWS Data Reporting System
In National Fund 2.0, a greater share of apprentices (65 percent)
completed their training compared to apprentices from 2008 to 2012 (43
percent. A similar share of occupational skills training participants
completed training in each National Fund phase. Across all other
services, a smaller share of National Fund 2.0 participants completed
their service. Despite the increase in the share of individuals completing
their apprentice training in National Fund 2.0, the decline in completion
rate among other trainings may reflect a true decline in completion
outcomes, or reflect participants in earlier stages of participation since
National Fund 2.0 commenced. It will be important to track this trend to
assess whether the results are due to participants’ stage in training or
underlying delivery dynamics.
By sector, hospitality, logistics and transportation, and energy had
significantly higher shares of occupational skills training completion
among participants who received occupational training (97 percent, 98
percent and 98 percent, respectively). All 58 individuals that participated
in on-the-job training in the marine trades completed the training (100
percent), and both hospitality and aerospace saw greater shares of
completions among their workplace readiness participants (98 percent
and 95 percent, respectively).

IV. Low-Income Individuals 34
Degrees and Credentials
Partnerships reported a cumulative total of 43,465 credentials attained
through 2014, including 6,322 newly reported degrees/credentials.
These newly reported degrees/credentials represent a 17 percent
increase in the cumulative number of degrees and credentials achieved
since 2013. The fastest rate of growth occurred in 2011, with growth in
credential attainment contracting each subsequent year; some of this
decline may represent the slower growth in the overall number of
participants. (See Exhibit IV-16)
Exhibit IV-16: Number of Newly Reported Degrees and Credentials
Attained by Reporting Year (n=43,465)
Source: NFWS Data Reporting System
The composition of degrees and credentials varies somewhat between
National 2.0 and Fund implementation through 2012. National Fund 2.0
has produced a greater share of workplace readiness credentials as a
share of total degrees/credentials (48 percent compared to 19 percent),
and proportionately fewer occupational skills credentials or certificates
(39 percent compared to 72 percent). (See Exhibit IV-17.)29
29 Due to the aggregate nature and reporting format of National Fund data, we cannot identify a valid credential rate. However, an
analysis of the ratio of various credentials to the number of related program completions can offer a suggestive trend in outcomes as a means of identifying opportunities for fuller investigation with appropriate data and analysis. The ratio of workplace readiness credentials to workplace readiness completions is 61 percent, the ratio of associate degrees, bachelor degrees, and occupational skills credentials as a share of completions in apprenticeship, occupational skills training, and OJT is 66 percent, and the ratio of GED credentials as a share of Adult Basic Education/ English as a Second Language completions is 17 percent.
679
4,155
4,947
8,362
9,2649,736
6,322
0
2000
4000
6000
8000
10000
12000
2008 2009 2010 2011 2012 2013 2014
Num
ber
of
New
ly R
eport
ed D
egre
es
and C
redentials

IV. Low-Income Individuals 35
Exhibit IV-17: The Share of Workplace Readiness Credentials
Received Increased as the Share of Occupational Skills Credentials
Decreased Over Time
Cumulative 2008-2012:
All Phase 1.0
Partnerships
Added in 2013-2014:
All Phase 2 .0
Partnerships
Added in 2013-2014:
New Partnerships Only
# % # % # %
N= 27,407 12,534 3,734
AA or AS Degree 306 1% 262 2% 0 0%
BA or BS Degree 160 1% 114 1% 3 0%
GED/H.S. Equivalency 517 2% 388 3% 170 5%
Occupational Skills
Certificate/Credential/Licensure 19,731 72% 4,852 39% 2,008 54%
Workplace Readiness Credential 5,075 19% 5,998 48% 1300 35%
Other 1,618 6% 920 7% 253 7%
Source: NFWS Data Reporting System
Among partnerships that served primarily individuals with criminal
backgrounds, a greater share of participants completed AA or AS
degrees (10 percent), and a smaller share completed workplace
readiness credentials (12 percent), which is surprising given the
relatively higher rate of workforce readiness training completion among
this group. The readiness training programs available to this population
may not have been designed to culminate in a credential. Participants in
partnerships that served primarily young adults were also less likely to
receive workplace readiness credentials (5 percent), and their remaining
outcomes were similar to the overall partnership findings.

IV. Low-Income Individuals 36
Job Placement
Participant Job Placement Achievements
As of the end of 2014, 19,299 jobseeker participants served by 151
partnerships had achieved job placement over the course of the initiative;
this number represents 23 percent growth over the number of cumulative
job placements reported in 2013. The individuals achieving job
placement represent 69 percent of all jobseekers that completed
education and training.30 Industry partnerships have facilitated 7,605 job
placements reported since the start of National Fund 2.0, or 73 percent
of all jobseekers completing education and training since the start of
National Fund 2.0.
The 3,659 job placements reported in 2014 suggest continuing
contraction, first noted in last year’s report, in both the annual number of
placements and related annual percentage growth (34 percent in 2013
compared to 23 percent in 2014, among all partnerships as well as the
subset of partnerships that did not experience significant data adjustment
in 2014), mirroring overall participation trends. (See Exhibit IV-18)
Exhibit IV-18: The Annual Number of Job Placements Has Declined
Since 2012, Mirroring Overall Participation Trends (n=19,299)
Source: NFWS Data Reporting System
30Due to the aggregate nature of the National Fund data, we cannot provide a true placement rate and the descriptive ratios included in the data brief should not be interpreted as such.
566
1,400
3,103
2,602
4,023 3,946
3,659
0
500
1000
1500
2000
2500
3000
3500
4000
4500
2008 2009 2010 2011 2012 2013 2014
Annual N
um
ber
of
Job P
lacem
ents

IV. Low-Income Individuals 37
The number of placements as a share of all jobseeker completions has
ranged from 49 to 78 percent over the course of the initiative. Most
recently the share of placements decreased from 76 percent in 2013 to
69 percent in 2014. (See Exhibit IV-19)
Exhibit IV-19. The Annual Number of Placements as a Share of
Completions Has Varied Over Time
The share of job placements was less dominated by the healthcare,
construction, and manufacturing sectors than it has been in previous
years. Although healthcare partnerships still accounted for the largest
share of all job placements, that share dropped from 50 percent of
cumulative placements through the end of 2013, to 37 percent of
cumulative placements through the end of 2014. This may reflect the
overall decline of the healthcare sector’s share of industry partnerships.
It also suggests that programs in other sectors are increasing their share
of placement outcomes. Construction comprised 20 percent of job
placements (compared to 29 percent at the end of 2013), and
manufacturing followed with 17 percent (compared to 20 percent at the
end of 2013).
In 2014 alone, L/T/D reported the highest proportion of completers
achieving job placement (89 percent), followed by construction (73
percent), and energy (72 percent). (See Exhibit IV-20.) Among some of
the smaller sectors, Marine Trades and Financial Services partnerships
also placed over half of all participants (75 and 55 percent, respectively),
and 97 percent and 77 percent, respectively, off all completers.
0%
10%
20%
30%
40%
50%
60%
70%
80%
90%
2008 2009 2010 2011 2012 2013 2014
Pla
cem
ents
as S
hare
of
Jobseeker
Com
ple
tions

IV. Low-Income Individuals 38
Exhibit IV-20: Proportion of Participants Achieving Job Placement Varied by Sector, 2014
Aerospace Construction Energy Healthcare L/T/D Manufacturing
# % # % # % # % # % # %
N= 2,450 9,426 586 14,726 3,247 9,512
Job Placements
1,336
61% 3,766
73%
398
72% 7,141
68%
527
89% 3,353
67%
Source: NFWS Data Reporting System
Placement-related Outcomes
Large amounts of unknown/missing data from a few partnerships
continue to affect placement related indicators. Partnerships with large
amounts of missing placement-related data were excluded from the
following placement-related analyses.31 Similar to the first phase, the
degree of unknown or missing placement-related data continues to
hinder analysis of National Fund 2.0 progress.
Placements in Targeted Sector. The vast majority of job placements
achieved by partnerships were in the targeted sector for which
participants were trained. As of 2014, 78 percent of job placements
achieved by industry partnership participants were in their targeted
sector, similar to cumulative results over the past two years. Placement
in target sector was comparable in National Fund 2.0, at 78 percent, to
the first phase of the initiative.
Wages at placement. As of 2014, a little over one-quarter (26 percent)
of cumulative jobseeker participants were placed in jobs paying greater
than $15.00 per hour. The largest share of participants received wages
between $10.00 and $14.99 per hour (38 percent). Twenty-one percent
of cumulative participants received starting wages less than $10.00 per
hour, similar to the wage composition reported last year. (See Exhibit IV-
21.) Placement wages in National Fund 2.0 is of similar distribution to
placement wages from 2017 through 2012.
31 Excluded from all subsequent placement-related analyses were partnerships that: a) accounted for 5 percent or more of the total
number of placements; and b) were missing data for more than 50 percent of participants for a majority of placement-related indicators.

IV. Low-Income Individuals 39
Exhibit IV-21: The Largest Share of Jobseekers Received Placement
Wages between $10.00 and $14.99 per Hour, 2014
Job Placements
# %
N= 15,035
<$10.00 3,155 21%
$10.00-$14.99 5,687 38%
$15.00-$19.99 2,313 15%
>$20.00 1,633 11%
Wage at Placement Unknown/Missing 2,247 15%
Source: NFWS Data Reporting System
Among the largest sectors, partnerships in the energy sector reported
that more than half of participants (57 percent) achieved placement
wages of $20.00 per hour or more, a much higher share than in any
other sector, though a relative decrease from the end of 2013, when 70
percent of energy participants had achieved starting wages greater than
$20.00 an hour. Among the remaining largest sectors, aerospace saw
the next highest proportion of participants (20 percent) with starting
wages above $20.00 per hour. Among sectors serving smaller
proportions of participants, information technology saw a large share of
participants (59 percent), comparable to energy partnerships, receiving
starting wages at or above $20.00 per hour.
Hours and benefits at placement. Sixty-two percent of all cumulative
placements were in full-time jobs (35 or more hours per week),
comparable to findings reported in 2013. Over one-third of all
placements (42 percent) were reported eligible for benefits, such as
health insurance and retirement savings. The degree of missing data for
hours at placement (20 percent) and benefits at placement (36 percent),
continue to limit the implications of these findings. (See Exhibit III-25)
Job Retention
Participant Job Retention Achievements
Six- and 12-month retention data continued to be missing for a
substantial number of partnerships.32 While some of these partnerships
may have been too new for participants to have met the 12-month
retention milestone, many partnerships continued to face difficulty with
participant follow-up. Where noted, retention findings are also presented
for the select group of partnerships that provided 12-month retention
data.
32 Among 151 partnerships that reported positive jobseeker job placements, 72 percent provided positive overall six-month retention
data, and 48 percent provided positive overall 12-month retention data. Among 94 partnerships that reported positive incumbent participation, 54 percent provided positive six-month retention data, and 41 percent provided positive 12-month retention data.

IV. Low-Income Individuals 40
Jobseeker Participant Retention. The total number of both new six-
month and new 12-month retentions increased considerably between
2013 and 2014. A cumulative total of 9,924 jobseeker participants were
reported as having achieved six-month retention, reflecting a 25 percent
increase in the cumulative number of participants achieving six-month
retention since 2013. A total of 5,542 participants were reported by
partnerships as having achieved the 12-month retention milestone, which
represents a 21 percent increase in the cumulative number of jobseeker
participants achieving 12-month retention since 2013. These 2014
figures represent a return to growth after a substantial drop in the
number retained in 2013 (See Exhibit IV-22)
Exhibit IV-22: The Number of Jobseeker Participants Achieving Six-
and 12-month Retention Increased in 2014 (n=9,924; n=5,542)
Source: NFWS Data Reporting System
155
613
1,297 1,242
3,243
1,380
1,994
73218
412564
2,595
714
966
0
500
1000
1500
2000
2500
3000
3500
2008 2009 2010 2011 2012 2013 2014
An
nu
al N
um
ber
of
Job
seek
ers
Ach
iev
ing
6 a
nd
12
-mo
nth
Ret
enti
on
6-month Retention 12-month Retention
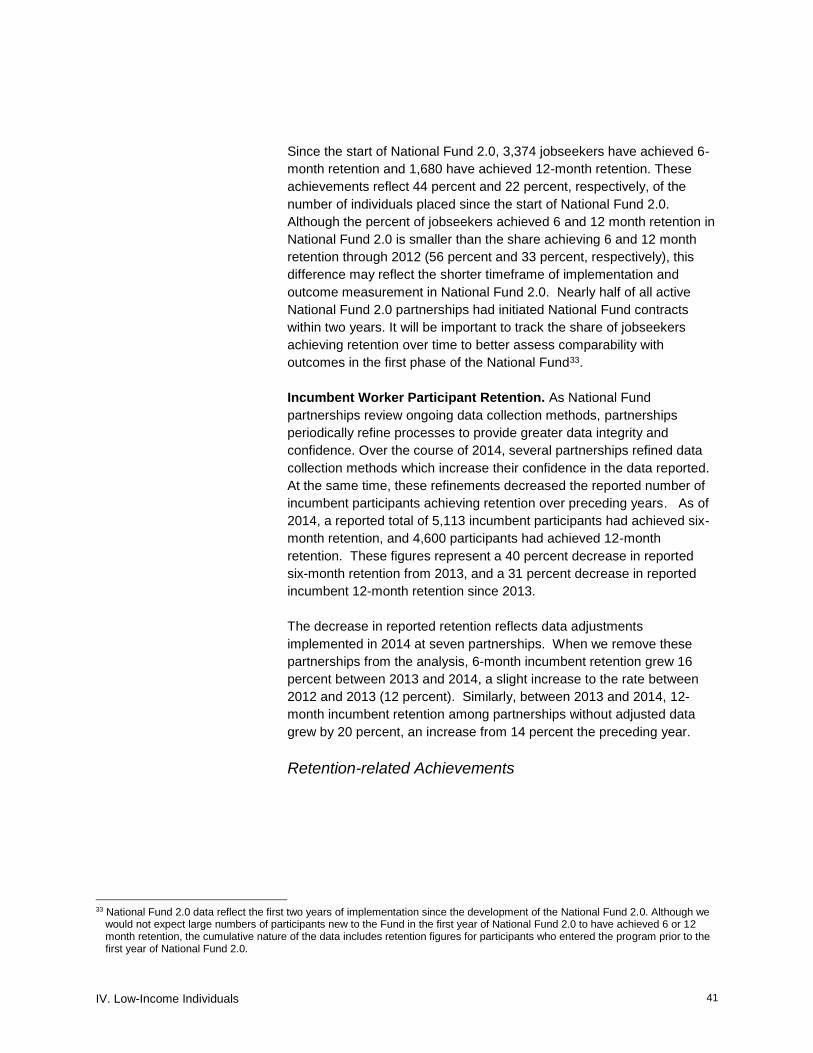
IV. Low-Income Individuals 41
Since the start of National Fund 2.0, 3,374 jobseekers have achieved 6-
month retention and 1,680 have achieved 12-month retention. These
achievements reflect 44 percent and 22 percent, respectively, of the
number of individuals placed since the start of National Fund 2.0.
Although the percent of jobseekers achieved 6 and 12 month retention in
National Fund 2.0 is smaller than the share achieving 6 and 12 month
retention through 2012 (56 percent and 33 percent, respectively), this
difference may reflect the shorter timeframe of implementation and
outcome measurement in National Fund 2.0. Nearly half of all active
National Fund 2.0 partnerships had initiated National Fund contracts
within two years. It will be important to track the share of jobseekers
achieving retention over time to better assess comparability with
outcomes in the first phase of the National Fund33.
Incumbent Worker Participant Retention. As National Fund
partnerships review ongoing data collection methods, partnerships
periodically refine processes to provide greater data integrity and
confidence. Over the course of 2014, several partnerships refined data
collection methods which increase their confidence in the data reported.
At the same time, these refinements decreased the reported number of
incumbent participants achieving retention over preceding years. As of
2014, a reported total of 5,113 incumbent participants had achieved six-
month retention, and 4,600 participants had achieved 12-month
retention. These figures represent a 40 percent decrease in reported
six-month retention from 2013, and a 31 percent decrease in reported
incumbent 12-month retention since 2013.
The decrease in reported retention reflects data adjustments
implemented in 2014 at seven partnerships. When we remove these
partnerships from the analysis, 6-month incumbent retention grew 16
percent between 2013 and 2014, a slight increase to the rate between
2012 and 2013 (12 percent). Similarly, between 2013 and 2014, 12-
month incumbent retention among partnerships without adjusted data
grew by 20 percent, an increase from 14 percent the preceding year.
Retention-related Achievements
33 National Fund 2.0 data reflect the first two years of implementation since the development of the National Fund 2.0. Although we
would not expect large numbers of participants new to the Fund in the first year of National Fund 2.0 to have achieved 6 or 12 month retention, the cumulative nature of the data includes retention figures for participants who entered the program prior to the first year of National Fund 2.0.

IV. Low-Income Individuals 42
Substantial shares of both jobseeker and incumbent participants
achieving 12-month retention continued to experience wage gains (39
percent and 33 percent cumulatively, respectively), similar to shares
noted in previous years’ findings. A smaller share of participants
experienced promotion at 12 months: 13 percent of jobseekers and 6
percent of incumbent workers, also similar to previous findings.

V. Employers 43
V. Employers
Employers Served
The evolution of the National Fund in recent years emphasized the role
of employers as active program partners engaged in the development
and implementation of policies, programs, and advocacy that benefit the
workforce development system as a whole. Overall, the number of
employers served by industry partnerships increased to 5,303 in 2014,
representing 13 percent growth in the cumulative number of employers
served since 2013. The annual growth rate of new employers was
robust from 2008 through 2011, with a peak of 139 percent in 2010 and
remaining strong in 2011 and 2012 (60 percent and 33 percent,
respectively). A marked decline in growth emerged in 2013 (15 percent)
and continued in 2014 (13 percent) with the addition of 629 employers.
The decline in growth rate in recent years may also reflect the decline in
growth of new partnerships and corresponding employer engagement,
and may also represent the shift in the National Fund framework of
employers as service recipients to employers as engaged partners.
Exhibit V.1:The Growth of New Employers Served Has Declined
Over Time
418380
1,1121,142
1,012
610 629
0
200
400
600
800
1000
1200
2008 2009 2010 2011 2012 2013 2014
Num
ber
of
New
Em
plo
yers
Serv
ed

V. Employers 44
Level of Employer Engagement
Data on the level of employer engagement was collected for the first time
in 2014. Of the 1,110 employers reporting, nearly half (49 percent) were
classified as Affiliates – employers that receive services from the industry
partnership but participate sporadically and/or at a basic level. Core
Employers – those that consistently contribute to the success of the
partnership through strategic decision-making, changes in practice,
and/or contribution of resources – constituted 29 percent. Partner
Employers who consistently participate in the partnership but are not
partnership leaders, have the lowest level of engagement at 22 percent.
Exhibit V.2: Nearly Half of all Employers Participate at the Affiliate
Level
Employer Activity
Across engagement levels, employers were most active in the hiring of
individuals trained and/or referred by the partnership (60 percent).
Employers were next most active in their industry partnerships by
contributing resources (42 percent), followed by regular contributions to
strategic decision-making (39 percent). Nearly a third of employers
changed practices in pursuit of partnership goals, and almost a quarter of
employers (23 percent) participated in workforce advocacy efforts at the
state or national level.
Exhibit V.3: Employers’ Primary Activity Was Hiring Individuals
Trained or Referred by the Industry Partnership
Level of Employer Engagement
# %
N= 1110
Core Employers 321 29%
Partner Employers 240 22%
Affiliate Employers 549 49%

V. Employers 45
Activity Performed by Employer
# %
N= 1541
Hire Individuals Trained and/or Referred by the Partnership
921 60%
Contribute Resources to Help Achieve Partnership Goals 647 42%
Contribute Regularly to Strategic Decision-Making 605 39%
Change Practices in Pursuit of Partnership Goals 480 31%
Participate in Workforce Advocacy Efforts at State or National Level
356 23%

V. Conclusion 46
VI. Conclusion
The overarching purpose of the National Fund is to meet employer
demand for talent and to expand employment opportunities for low-
income individuals. In 2012, The National Fund established an ambitious
new framework to guide its activities and measure its progress. The
goals articulated by the new strategic framework include:
Expand and deepen impact;
Improve public systems and employer practices; and
Promote learning and continuous improvement.
The data brief provides a measure of National Fund progress on its goals
to Expand and Deepen Impact over the past seven reporting years
(2008-2014), and highlights partnership progress in the first two years of
the National Fund 2.0. As projected by the National Fund 2.0 framework,
the National Fund continued to reach new communities, with four new
collaboratives accepted into the network and 13 new partnerships
reporting achievements in 2014. During the course of the initiative, a total
of 39 collaboratives and 185 partnerships across the United States have
been supported by the National Fund. The National Fund also continued
to show an increase in overall size across all relevant metrics, reflected
by the number participants (67,209) and employers (5,303) served by
National Fund partnerships from 2008 to 2014.
In addition, the National Fund continued to demonstrate slight expansion
in the areas of overall participant services, education/training
completions and achievement of degrees/credentials. However, data
reported by National Fund 2.0 partnerships also continue to suggest a
slight contraction in the rate of partnership and participant growth and the
scale of job placement, job retention and employer services achieved
among these partnerships.

V. Conclusion 47
The evolution of the National Fund 2.0 strategic framework and related
evaluation framework has not been accompanied by changes to legacy
data collection and reporting systems. The data brief draws on progress
indicators and data collections systems developed in the first phase of
the initiative, and does not provide a comprehensive assessment of
defined National Fund 2.0 objectives or measures.
More detailed exploration of the findings highlights several implications
for continuing National Fund implementation, including:
The introduction of four new collaboratives reflects a relatively small
step toward the National Fund 2.0 goal of enabling 15 new
communities to implement the national fund model by 2017.
Although the absolute number of participants has grown annually,
the rate of growth has declined over time, with particular contraction
since the start of National Fund 2.0. This reflects both addition of
fewer new collaboratives each year, initiation of fewer new
partnerships per collaborative, and termination of select partnerships
over time, stemming new growth from those partnerships.
Although the annual rate of growth of new participants has
decreased over the preceding three years, the annual number of
new participants has held relatively steady over this time, yet these
participants represent a smaller percentage of the total each
cumulative year. In part, continued stability in new participation over
time can be viewed as an indicator of sustainability. At the current
rate of cumulative growth, however, the Fund will not reach its 2017
National Fund 2.0 goal of enabling 100,000 low wage individuals in
45 communities to obtain the skills, credentials, and other supports
necessary to acquire and advance in family supporting careers. The
National Fund will need to assess the opportunity for growth among
collaboratives and partnerships to reach its s National Fund 2.0
goals for increased scale in partnerships, employers, and
participants.
The decline in the rate of growth in new collaboratives, partnerships,
and participants over time in turn limits the rate of growth of
corresponding outcomes, including training completion, credentials,
and placements. However, several of these outcomes, including
completion rate, appear more stable when analyzed as a portion of
annual participants, suggesting that the decline in growth rates of
key indicators is affected by the decreased growth rate of
participants overall, with a relatively stable completion rate over
recent program years. This buttresses support for additional targeted
funding and capacity building to add new collaboratives and bring
partnerships to scale.

V. Conclusion 48
The demographic composition of program participants has changed
over time. As the share of male and white participants has increased
steadily over time, African American and Asian individuals, in
particular, comprise a substantially smaller share of overall
participants. These changes may reflect traditional norms or
expectations in certain industry sectors or geographic areas of
growth, or may signal limitations in outreach to typically underserved
populations. Moreover, poor data quality among key demographic
indicators impede the ability to understand underlying demographic
trends. Further exploration of these shifts can help the National Fund
identify outreach and service strategies that maintain support for
diverse participant populations.
Participation in non-education and training services has decreased
considerably over the implementation of the initiative. This change
may reflect an intentional focus on training and away from non-
training services, new arrangements of supportive service bundles
that are not captured by existing data collection categories, or poor
reporting capacity to capture these activities. It is important to
understand the dynamics of this change and whether it reflects a
larger shift in the underlying model of service delivery across
National Fund partnerships. Moreover, it will be valuable to find out
how or if these changes affect participant outcomes and
achievement.
Partnerships continue to focus their efforts in three key industries:
healthcare, construction, and manufacturing. Partnerships have not
yet penetrated the same level of engagement and scale with other
industry sectors, although 2014 yielded greater participant dispersion
among sectors and a decline in the dominance of number of
participants served by healthcare partnerships. There may be
continued opportunities for the National Fund to diversify its focus
and take new, concerted effort and, at times, different approaches to
support new partnerships in new industries. Diversifying sector focus
could tap new career pathways for low-income individuals, reach a
new set of employers, and extend the National Fund’s influence to
different parts of the economy.

V. Conclusion 49
Partnerships in some sectors have achieved more successful
outcomes in placement rates and retention and wage levels than
others. For example, construction and manufacturing partnerships in
the Fund have not experienced as robust placement as other
sectors. In part, this may be due to lingering effects of the recession
and overall lower and slower demand for jobs. Regardless,
construction and manufacturing partnerships may benefit from new
strategies and approaches to ramp up placement, wage levels, and
retention. One area to look could be those partnerships in sectors
with higher placement, wage and retention outcomes. The small
number of marine trades and financial services partnerships have
achieved job placement rates greater than 50 percent. The majority
of participants placed in jobs through partnerships in the energy and
information technology sectors have placement wages starting at
$20 per hour, and there are a handful of partnerships with high-
retention outcomes. Cross-sector learning from partnerships in
sectors like these could hold valuable lessons to help increase job
outcomes for construction and manufacturing partnerships, or other
sectors, depending on the issue.
The same kind of benefits for cross-sector learning could hold for
those partnership in sectors that have achieved high completion
rates in education and training. Almost 100 percent of participants in
occupational skills training achieved completion in the hospitality,
logistics and transportation, and energy sectors. 100 percent of
participants in on-the-job training achieved completion in marine
trades partnerships.
While these and other observations from the Data Brief highlight
areas of progress and identify opportunities for support and
adaptation, analysis is limited by the overall quality and structure of
the data available to the evaluation. For one, National Fund 2.0
partnerships are reporting greater amounts of missing or unknown
data in key areas, such as participant demographics. This limits the
Fund’s ability to understand trends and perform substantive
subgroup analyses.
Second, as noted in 2013, the National Fund evaluation framework
has evolved into a diversified portfolio of activities that respond to
different opportunities for learning. The online data collection system
developed in 2008 is a critical vehicle, and currently the sole
opportunity, for collecting consistent data across sites to track
progress on key priorities. However, the online data collection no
longer fully responds to the overall objectives articulated in National
Fund 2.0. Further, its cumulative nature limits capacity to track
annual variance in program activities and results, and may decrease

V. Conclusion 50
data reliability over time as sites may revise recent data without
retroactive adjustments. In part, these limits are inherent when
tracking a long-term initiative. However, there may be opportunities
to correct some of these limitations by considering alternative data
collection systems and analysis frameworks, such as annual
aggregate reporting or annual participant level data on limited key
indicators.
The observations from the Data Brief highlight emerging areas of
achievement, as well as opportunities to refine implementation strategies
and target additional support.