Embed Size (px)
Citation preview

The National Crash The National Crash Analysis CenterAnalysis CenterThe George Washington The George Washington UniversityUniversity
Prepared by: Fadi [email protected]
(703) 726-8327
Slide 2
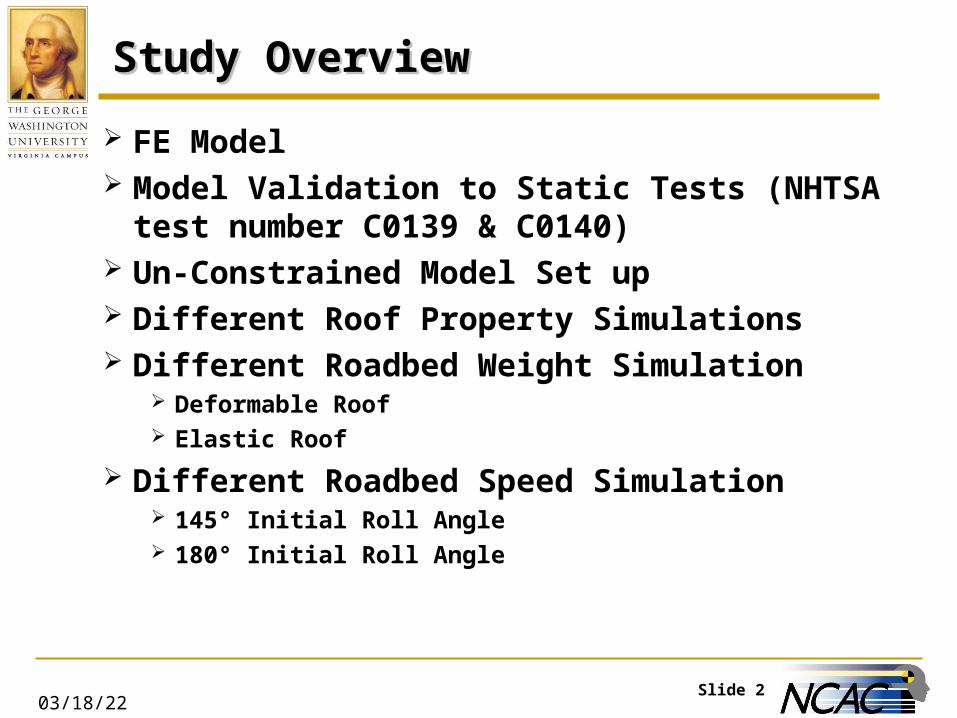
Study OverviewStudy Overview
FE Model Model Validation to Static Tests (NHTSA test number
C0139 & C0140) Un-Constrained Model Set up Different Roof Property Simulations Different Roadbed Weight Simulation
Deformable Roof Elastic Roof
Different Roadbed Speed Simulation 145° Initial Roll Angle 180° Initial Roll Angle
04/18/23
Slide 304/18/23
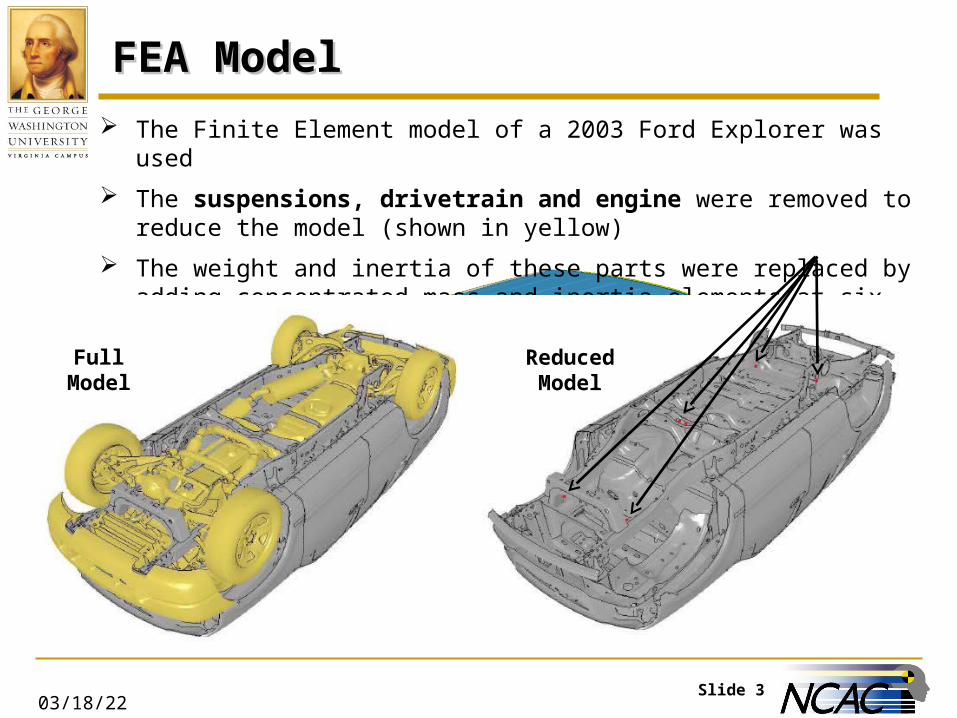
FEA ModelFEA Model
The Finite Element model of a 2003 Ford Explorer was used
The suspensions, drivetrain and engine were removed to reduce the model (shown in yellow)
The weight and inertia of these parts were replaced by adding concentrated mass and inertia elements at six points on the ladder frame (shown in red)
Full Model Reduced Model
Slide 4
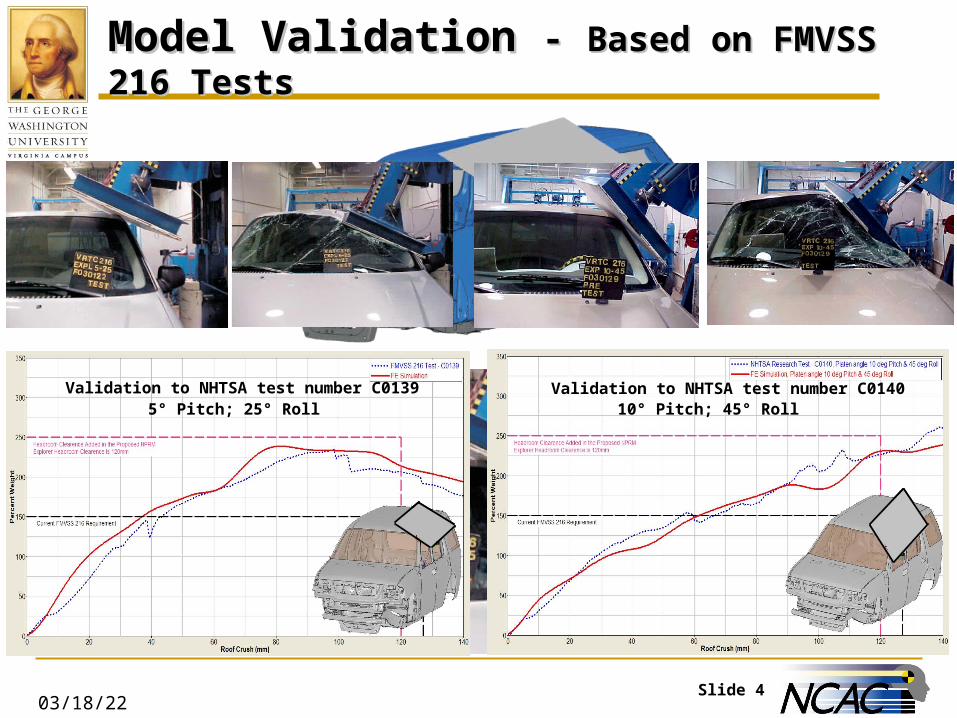
Model Validation Model Validation - - Based on FMVSS 216 TestsBased on FMVSS 216 Tests
04/18/23
Validation to NHTSA test number C0139 Validation to NHTSA test number C01405° Pitch; 25° Roll 10° Pitch; 45° Roll

Slide 504/18/23
Roof Material Properties Effect On
Un-Constrained Model
(Elastic Roof – Production Roof – Strong Pillars Properties)

Slide 6
3 Different Roof Models – 3 Different Roof Models – Material ChangeMaterial Change
04/18/23
Elastic Roof Model; SWR is measured to be 3.9Components shown in blue have pure elastic properties (Properties shown in next slide)
Production Roof Model; (No material change) SWR =
Strong Pillars & Production Roof Rails Model; SWR =Components shown in green are made from DF140T (Properties shown in next slide)
E= 200GPaWith No Yielding
Strong Roof & Production Roof Rails MaterialsE= 200GPa; Yield at ~775 MPa
Slide 7
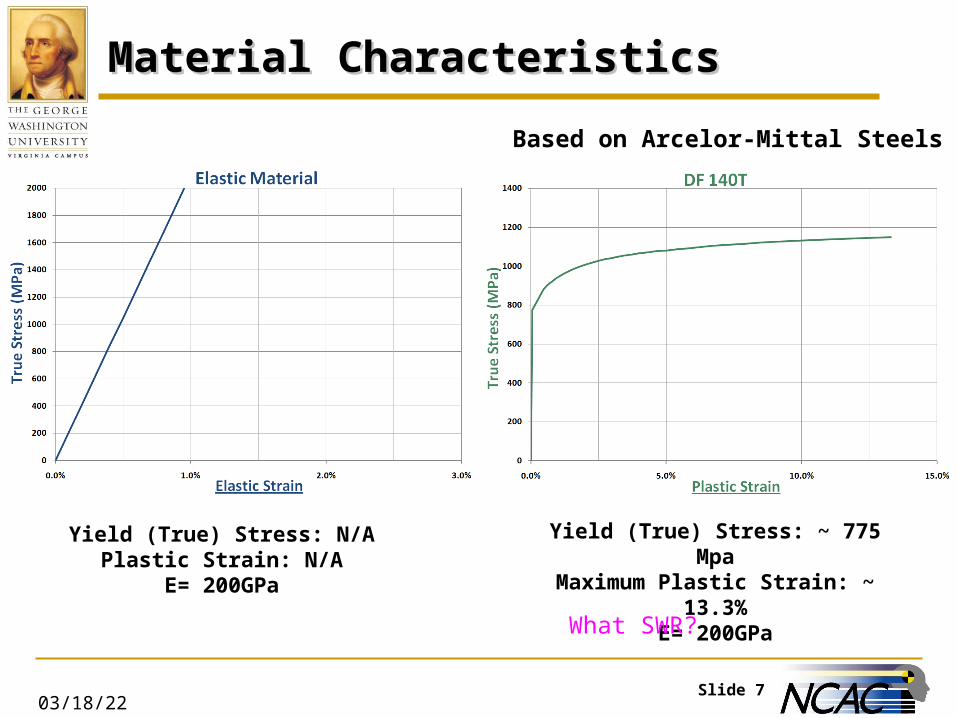
Material CharacteristicsMaterial Characteristics
04/18/23
Yield (True) Stress: ~ 775 MpaMaximum Plastic Strain: ~ 13.3%
E= 200GPa
Yield (True) Stress: N/APlastic Strain: N/A
E= 200GPa
Based on Arcelor-Mittal Steels
What SWR?
Slide 804/18/23
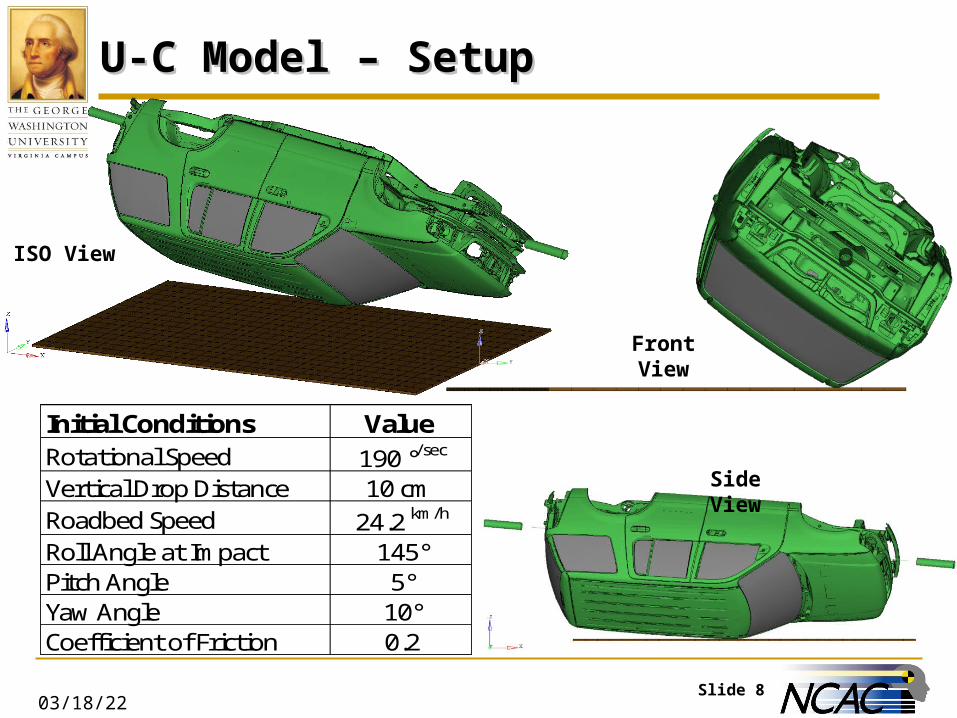
U-C Model – SetupU-C Model – Setup
Front View
Side View
ISO View
Initial Conditions Value Rotational Speed 190 °/sec
Vertical Drop Distance 10 cm Roadbed Speed 24.2 km/h
Roll Angle at Impact 145°Pitch Angle 5°Yaw Angle 10°Coefficient of Friction 0.2
Slide 9
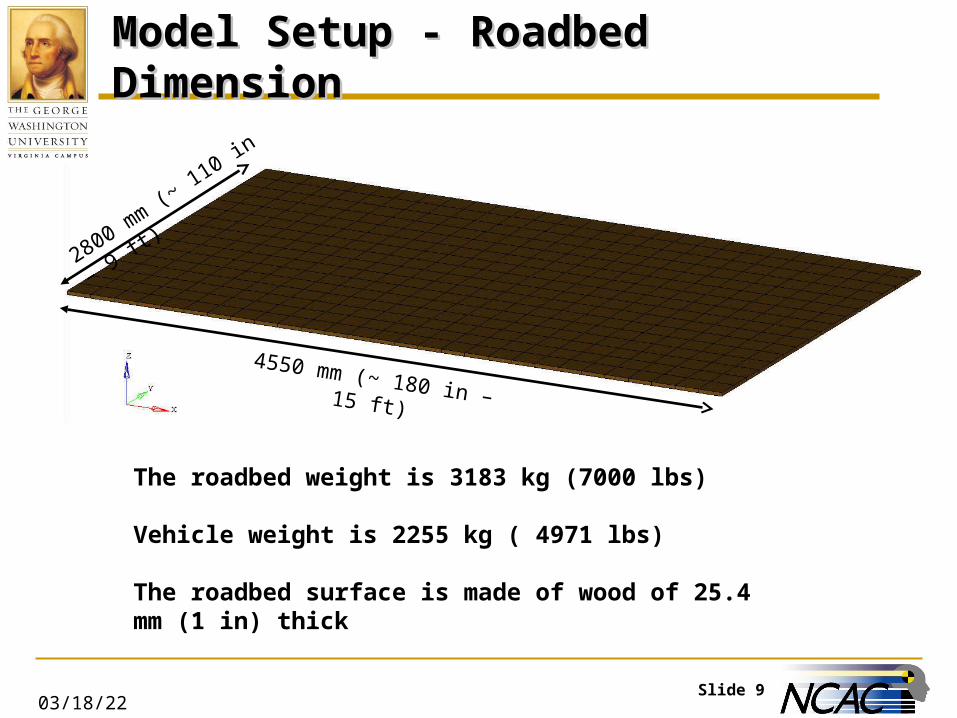
Model Setup - Roadbed DimensionModel Setup - Roadbed Dimension
04/18/23
4550 mm (~ 180 in – 15 ft)
2800 mm (~
110 in – 9 ft)
The roadbed weight is 3183 kg (7000 lbs)
Vehicle weight is 2255 kg ( 4971 lbs)
The roadbed surface is made of wood of 25.4 mm (1 in) thick
Slide 10
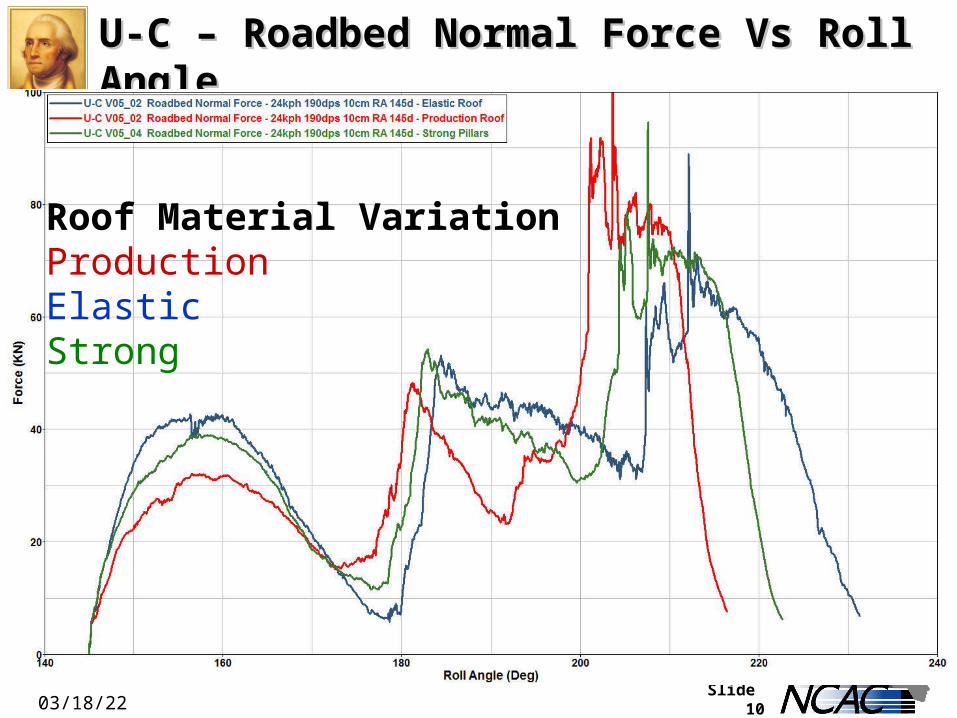
U-C – Roadbed Normal Force Vs Roll AngleU-C – Roadbed Normal Force Vs Roll Angle
04/18/23
Roof Material VariationProductionElastic Strong
Slide 11
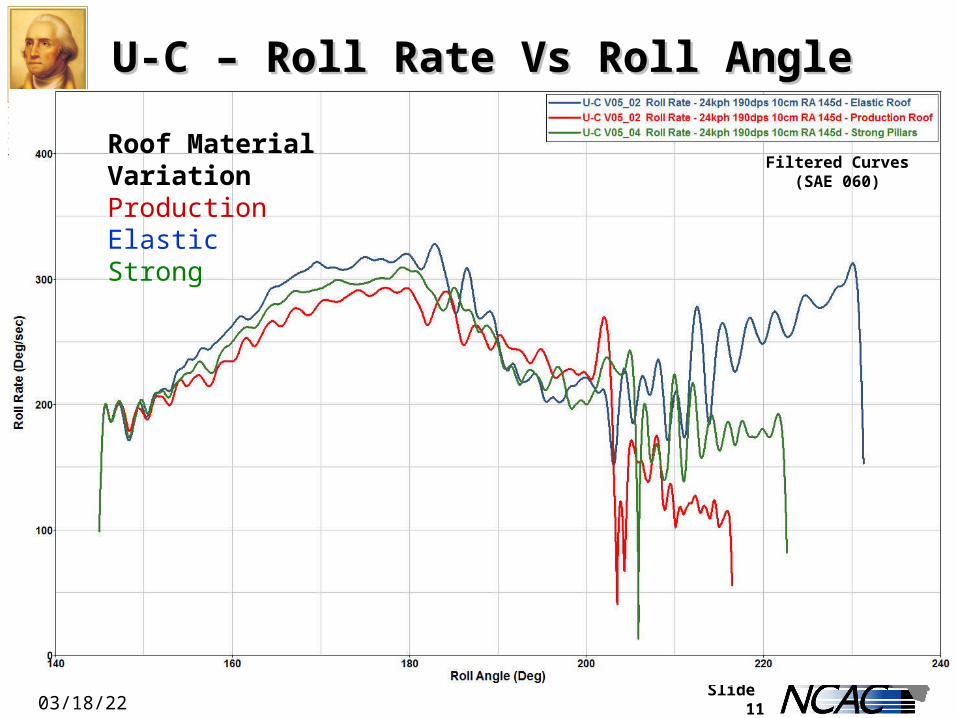
U-C – Roll Rate Vs Roll AngleU-C – Roll Rate Vs Roll Angle
04/18/23
Filtered Curves (SAE 060)Roof Material VariationProductionElastic Strong
Slide 12
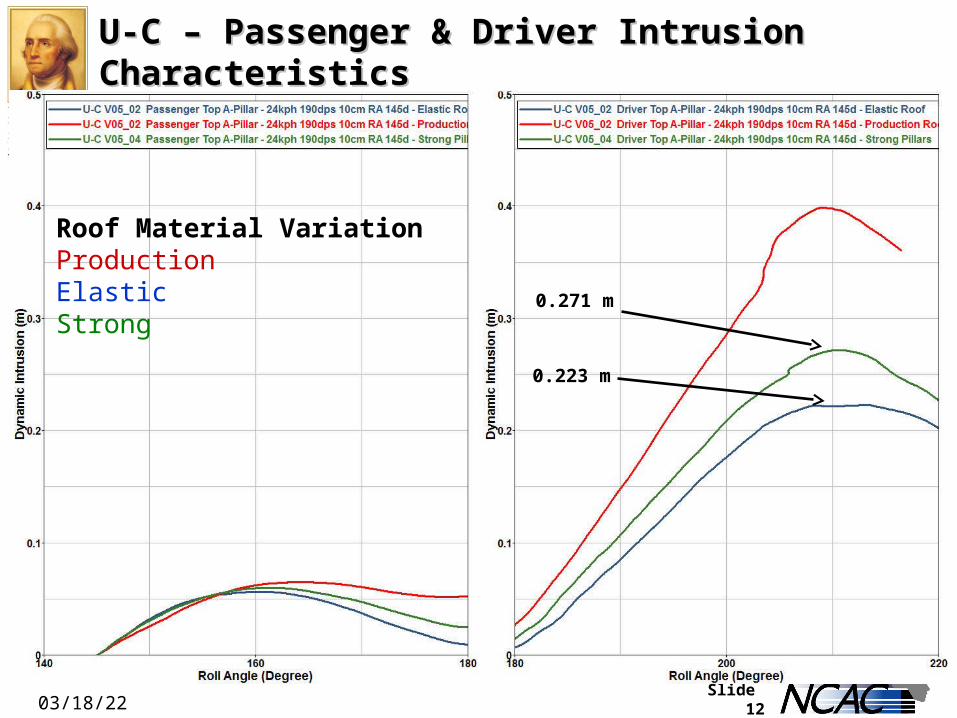
U-C – Passenger & Driver Intrusion CharacteristicsU-C – Passenger & Driver Intrusion Characteristics
04/18/23
0.271 m
0.223 m
Roof Material VariationProductionElastic Strong
Slide 13
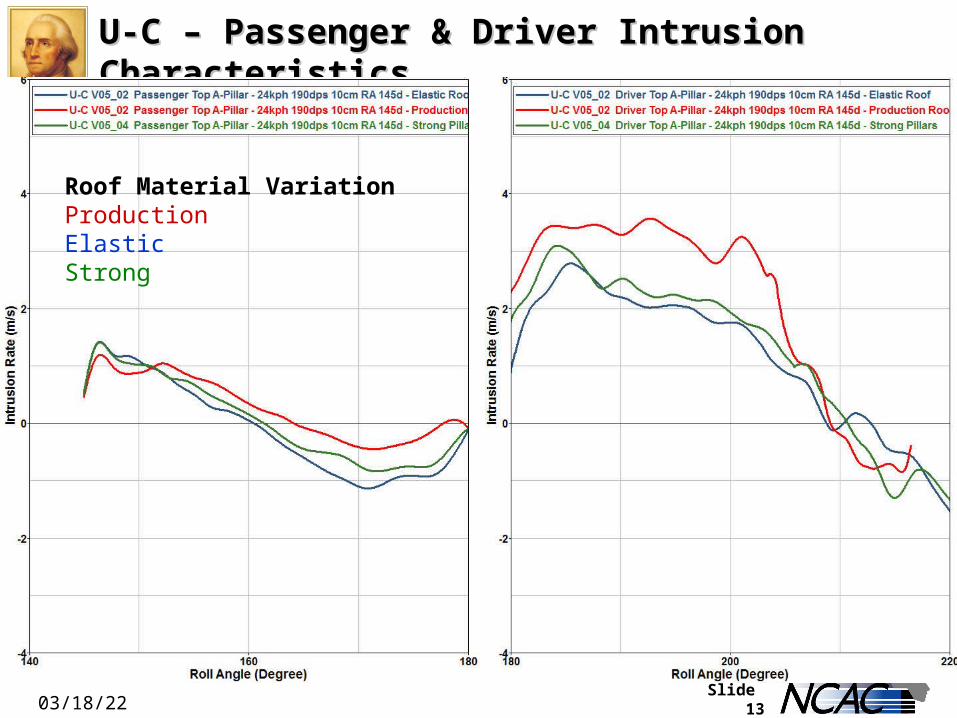
U-C – Passenger & Driver Intrusion CharacteristicsU-C – Passenger & Driver Intrusion Characteristics
04/18/23
Roof Material VariationProductionElastic Strong
Slide 14
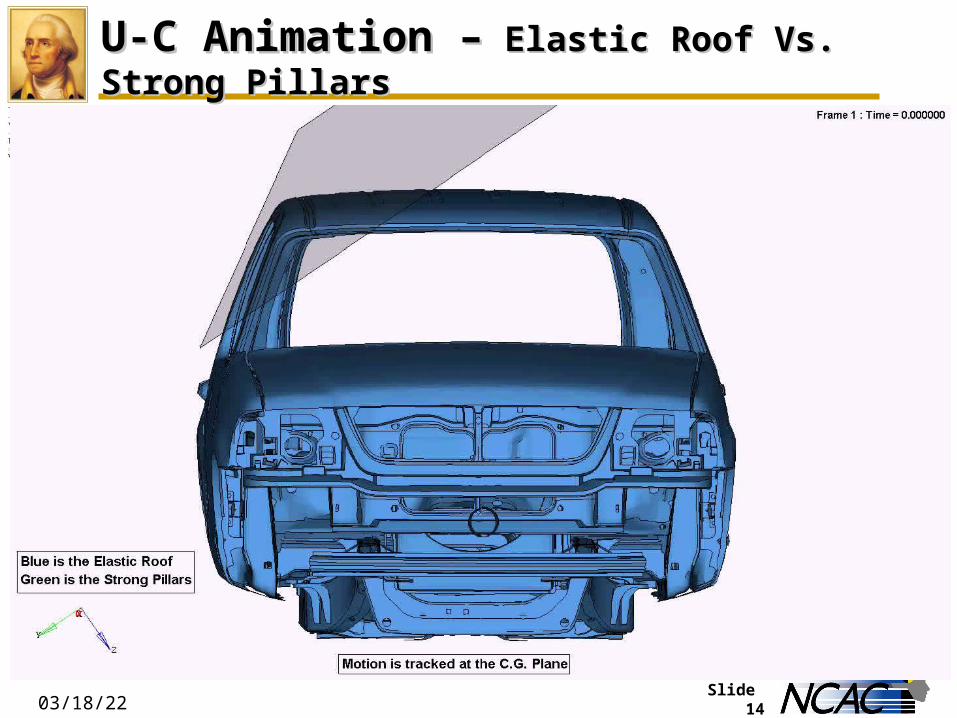
U-C Animation –U-C Animation – Elastic Roof Vs. Strong Pillars Elastic Roof Vs. Strong Pillars
04/18/23
Slide 15
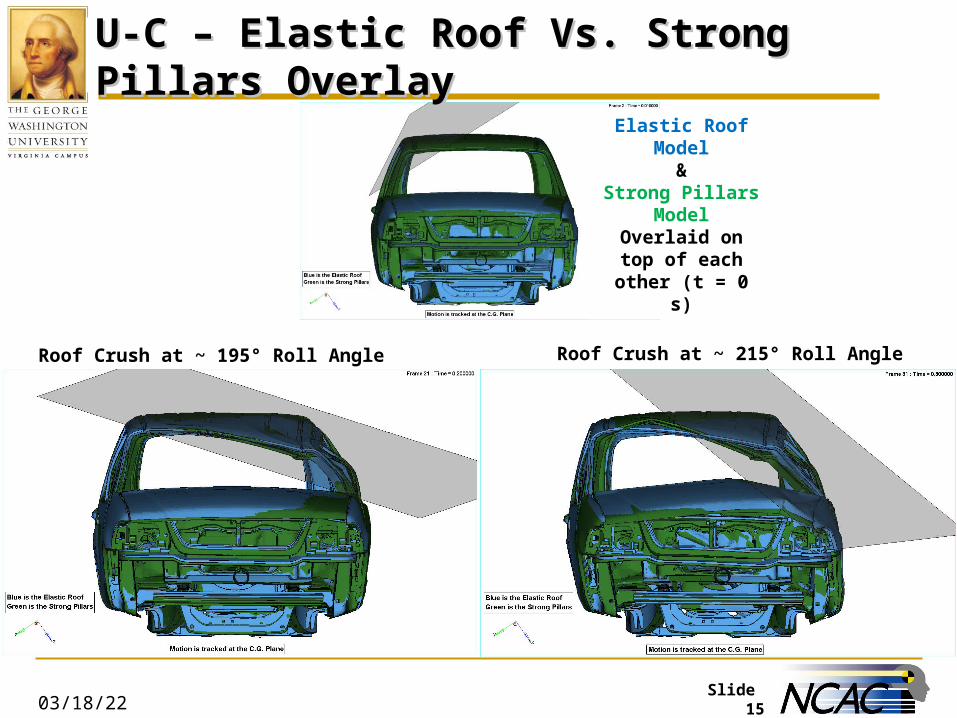
U-C – Elastic Roof Vs. Strong Pillars OverlayU-C – Elastic Roof Vs. Strong Pillars Overlay
04/18/23
Elastic Roof Model&
Strong Pillars Model
Overlaid on top of each other (t = 0 s)
Roof Crush at ~ 195° Roll Angle (t = 0.2 s) Roof Crush at ~ 215° Roll Angle (t = 0.3 s)
Slide 16
Conclusion For Different Roof PropertiesConclusion For Different Roof Properties
It is assumed that using an elastic roof model can be used for
simplification for the rollover parametric study since:
The roadbed normal force for the strong pillars model follows
similar pattern as the elastic model
The roof crush mode is attributed to the location of the buckling at
the structure or excessive elasticity for elastic model
The driver side intrusion for the strong pillar model is only 21%
more than the elastic model
04/18/23
Slide 1704/18/23
Roadbed Weight Effect On
Un-Constrained Model
(4 Different Weights)

Slide 1804/18/23
U-C Model – SetupU-C Model – Setup
Front View
Side View
ISO View
Initial Conditions Value Rotational Speed 190 °/sec
Vertical Drop Distance 10 cm Roadbed Speed 24.2 km/h
Roll Angle at Impact 145°Pitch Angle 5°Yaw Angle 10°Coefficient of Friction 0.2
Slide 19
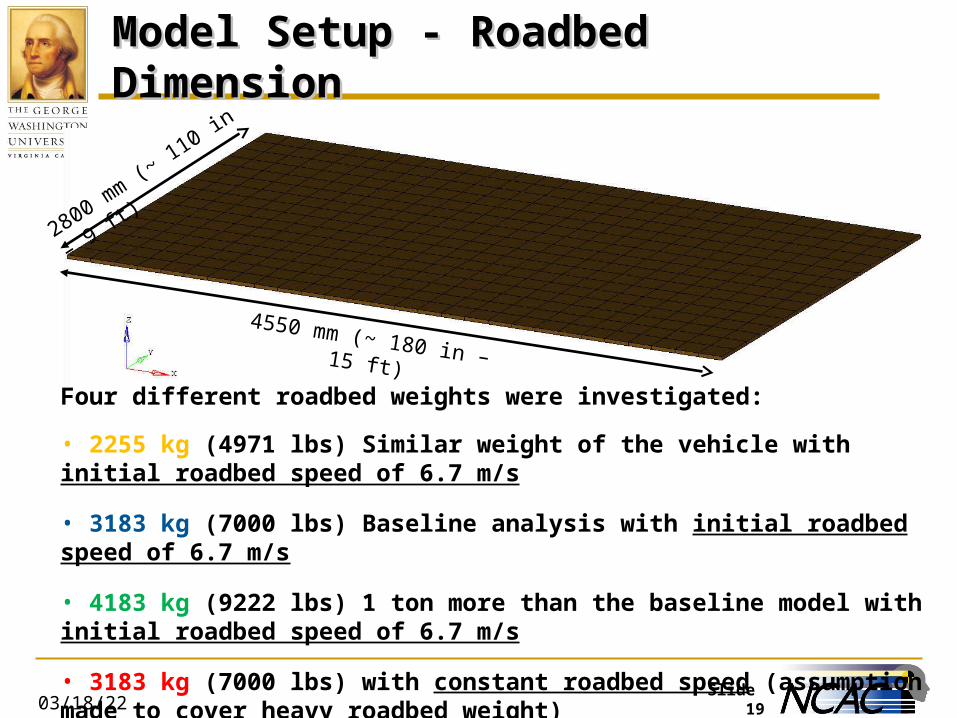
Model Setup - Roadbed DimensionModel Setup - Roadbed Dimension
04/18/23
4550 mm (~ 180 in – 15 ft)
2800 mm (~
110 in – 9 ft)
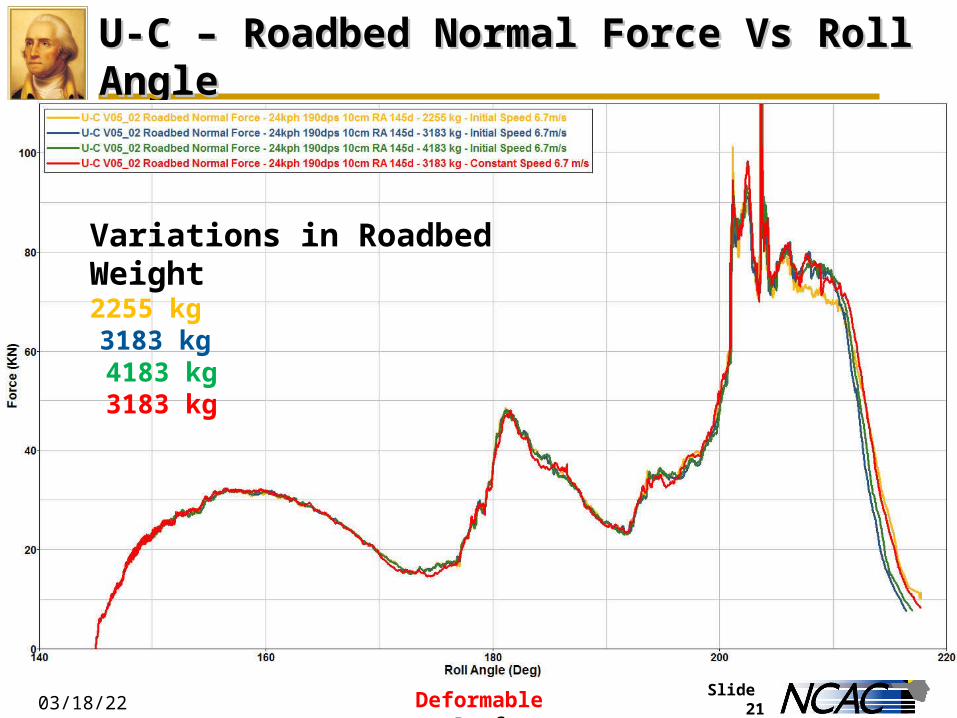
Four different roadbed weights were investigated:
• 2255 kg (4971 lbs) Similar weight of the vehicle with initial roadbed speed of 6.7 m/s
• 3183 kg (7000 lbs) Baseline analysis with initial roadbed speed of 6.7 m/s
• 4183 kg (9222 lbs) 1 ton more than the baseline model with initial roadbed speed of 6.7 m/s
• 3183 kg (7000 lbs) with constant roadbed speed (assumption made to cover heavy roadbed weight)
Slide 20
Roadbed Force, Roll Angle & Intrusion Characteristics Roadbed Force, Roll Angle & Intrusion Characteristics
ComparisonsComparisons
Deformable Deformable Roof Roof
04/18/23
Slide 21
U-C – Roadbed Normal Force Vs Roll AngleU-C – Roadbed Normal Force Vs Roll Angle
04/18/23 Deformable Roof
Variations in Roadbed Weight2255 kg 3183 kg 4183 kg 3183 kg
Slide 22
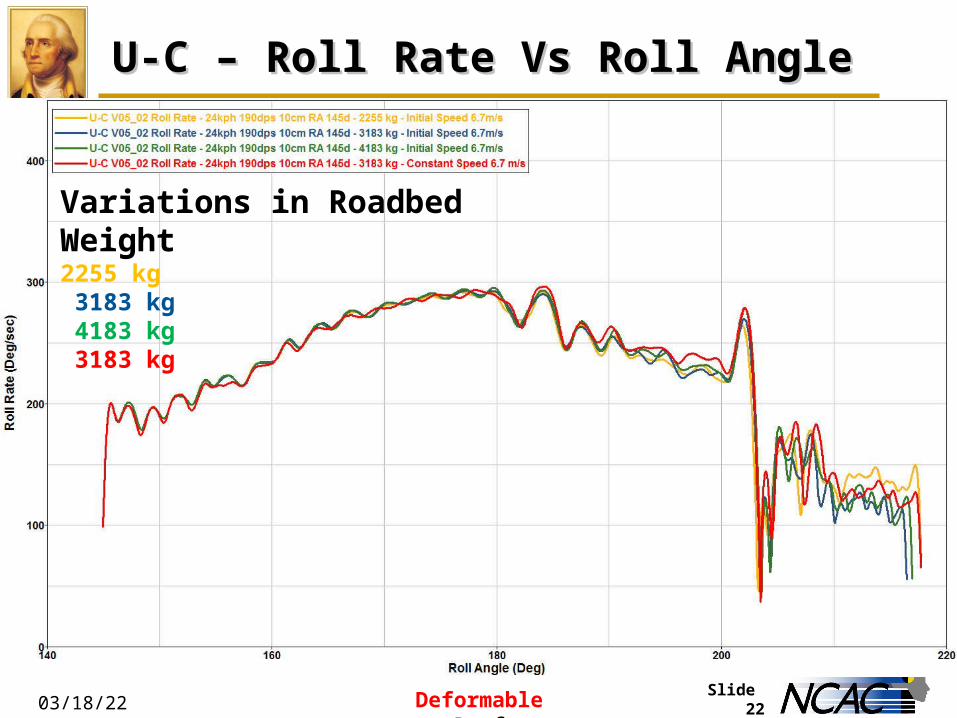
U-C – Roll Rate Vs Roll AngleU-C – Roll Rate Vs Roll Angle
04/18/23
Filtered Curves (SAE 060)
Deformable Roof
Variations in Roadbed Weight2255 kg 3183 kg 4183 kg 3183 kg
Slide 23
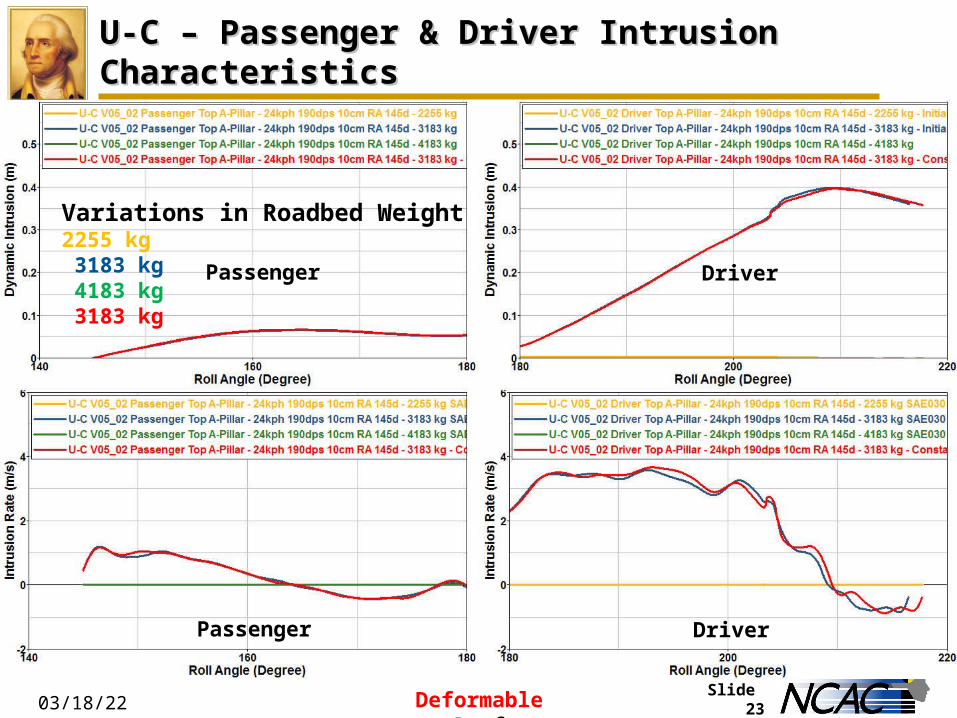
U-C – Passenger & Driver Intrusion CharacteristicsU-C – Passenger & Driver Intrusion Characteristics
04/18/23 Deformable Roof
Passenger Driver
Passenger Driver
Variations in Roadbed Weight2255 kg 3183 kg 4183 kg 3183 kg
Slide 24
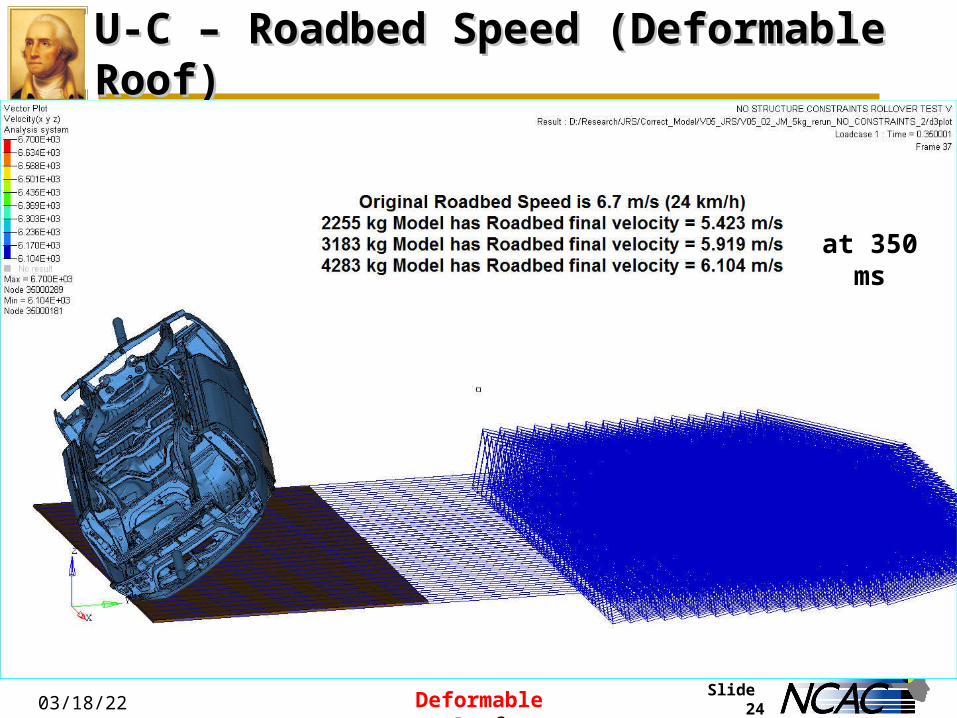
U-C – Roadbed Speed (Deformable Roof)U-C – Roadbed Speed (Deformable Roof)
04/18/23 Deformable Roof
at 350 ms
Slide 25
Roadbed Force, Roll Angle & Intrusion Characteristics Roadbed Force, Roll Angle & Intrusion Characteristics
ComparisonsComparisons
ElasticElastic Roof Roof
04/18/23
Slide 26
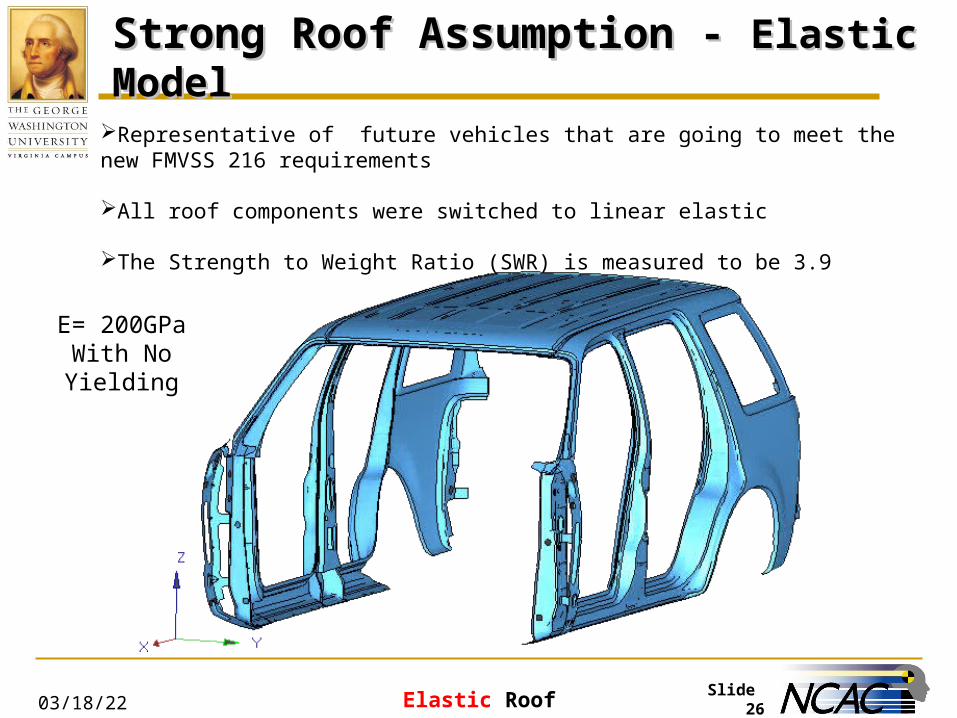
Strong Roof Assumption - Strong Roof Assumption - Elastic ModelElastic Model
04/18/23
E= 200GPaWith No Yielding
Representative of future vehicles that are going to meet the new FMVSS 216 requirements
All roof components were switched to linear elastic
The Strength to Weight Ratio (SWR) is measured to be 3.9
Elastic Roof
Slide 27
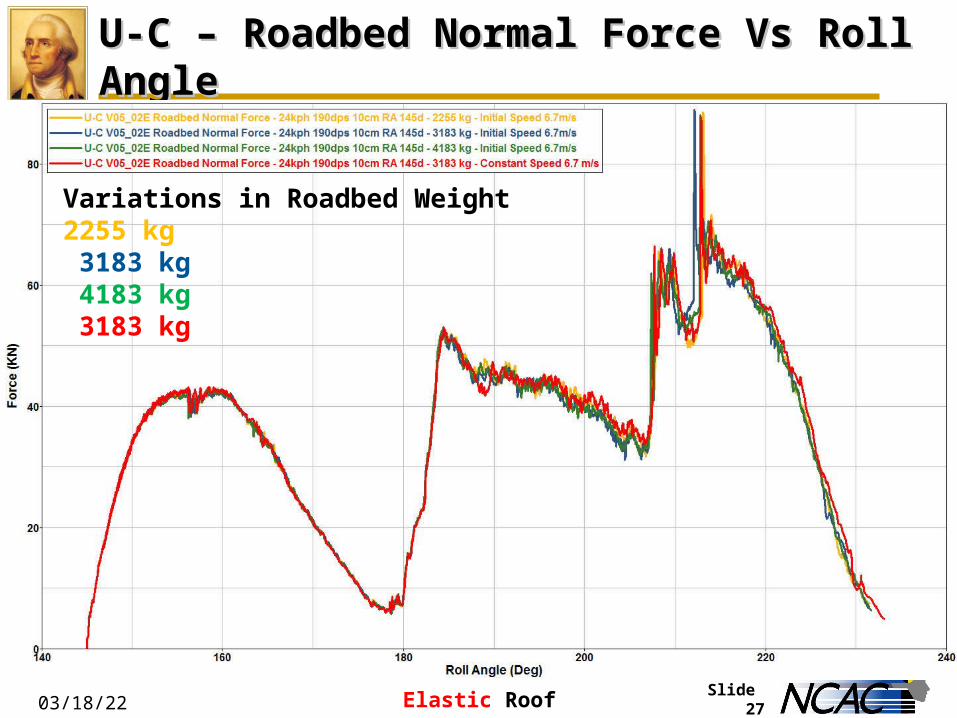
U-C – Roadbed Normal Force Vs Roll AngleU-C – Roadbed Normal Force Vs Roll Angle
04/18/23 Elastic Roof
Variations in Roadbed Weight2255 kg 3183 kg 4183 kg 3183 kg
Slide 28
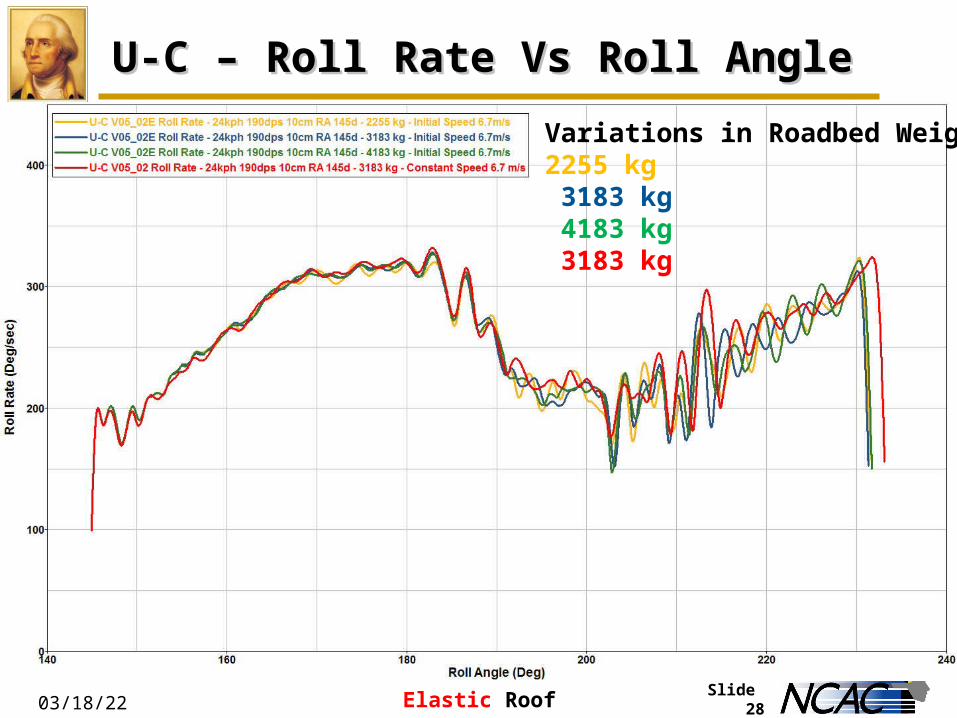
U-C – Roll Rate Vs Roll AngleU-C – Roll Rate Vs Roll Angle
04/18/23
Filtered Curves (SAE 060)
Elastic Roof
Variations in Roadbed Weight2255 kg 3183 kg 4183 kg 3183 kg
Slide 29
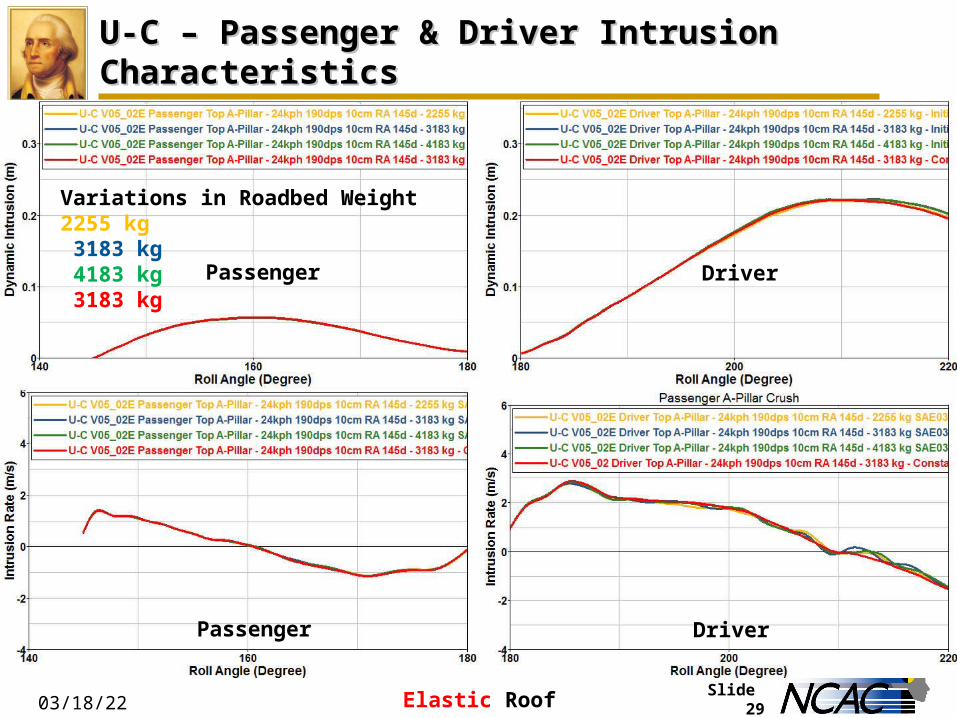
U-C – Passenger & Driver Intrusion CharacteristicsU-C – Passenger & Driver Intrusion Characteristics
04/18/23 Elastic Roof
Passenger Driver
Passenger Driver
Variations in Roadbed Weight2255 kg 3183 kg 4183 kg 3183 kg
Slide 30
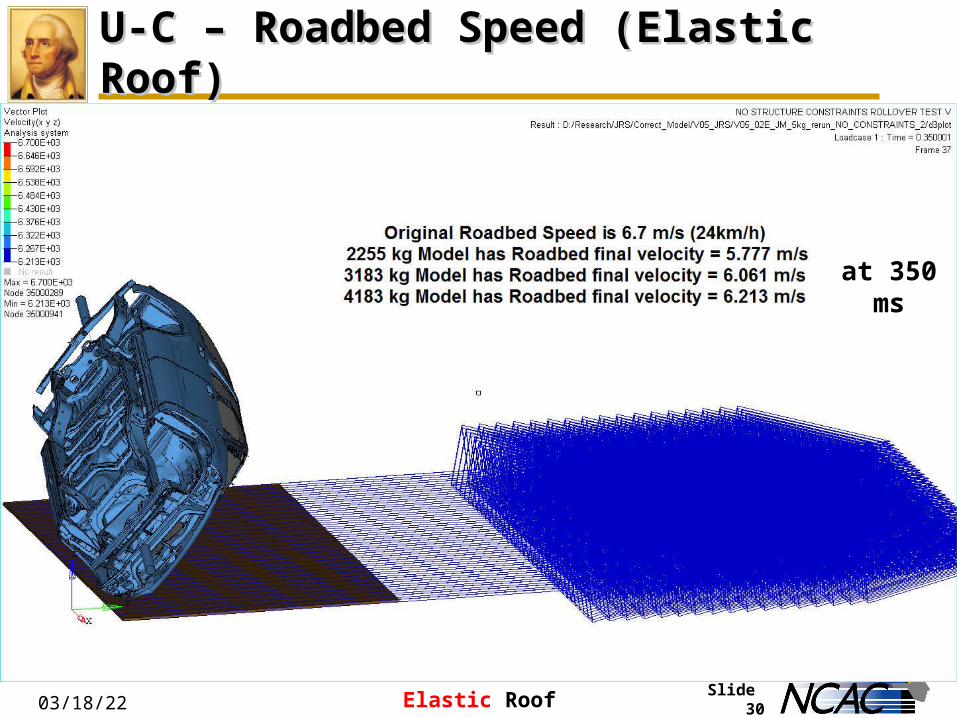
U-C – Roadbed Speed (Elastic Roof)U-C – Roadbed Speed (Elastic Roof)
04/18/23
at 350 ms
Elastic Roof
Slide 31
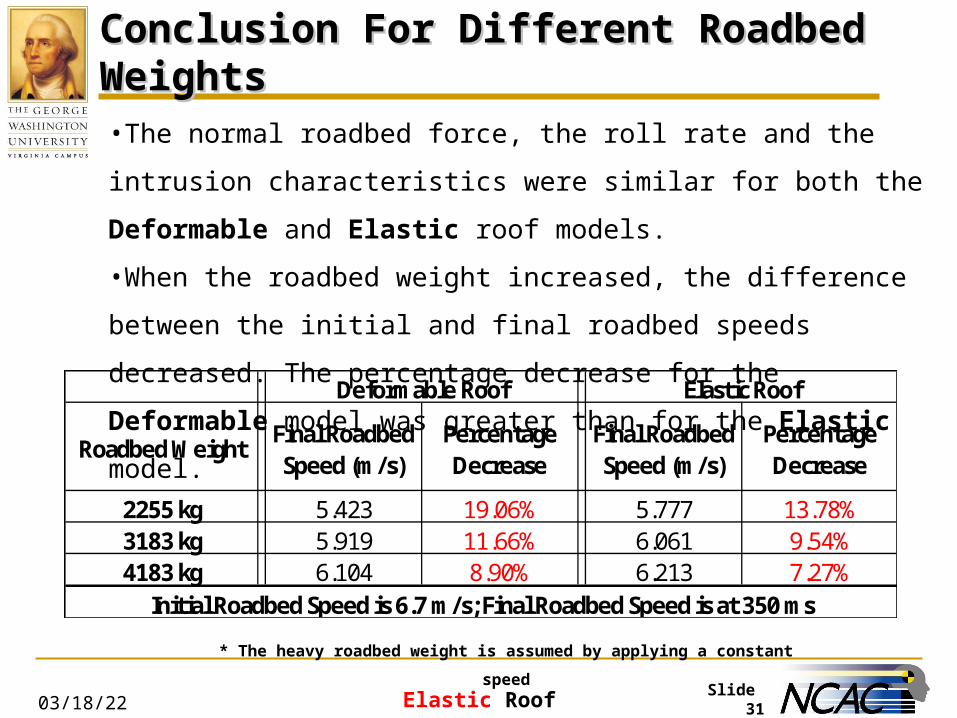
Conclusion For Different Roadbed WeightsConclusion For Different Roadbed Weights
04/18/23 Elastic Roof
•The normal roadbed force, the roll rate and the intrusion characteristics were
similar for both the Deformable and Elastic roof models.
•When the roadbed weight increased, the difference between the initial and
final roadbed speeds decreased. The percentage decrease for the Deformable
model was greater than for the Elastic model.
Roadbed WeightFinal Roadbed Speed (m/s)
Percentage Decrease
Final Roadbed Speed (m/s)
Percentage Decrease
2255 kg 5.423 19.06% 5.777 13.78%3183 kg 5.919 11.66% 6.061 9.54%4183 kg 6.104 8.90% 6.213 7.27%
Deformable Roof Elastic Roof
Initial Roadbed Speed is 6.7 m/s; Final Roadbed Speed is at 350 ms
* The heavy roadbed weight is assumed by applying a constant speed

Slide 32
Conclusions Roadbed Weight
What difference does it make on the test?
What weight to I need?
Slide 3304/18/23
Roadbed Speed Effect On
Un-Constrained Model
(6 Different Speeds)
Slide 34
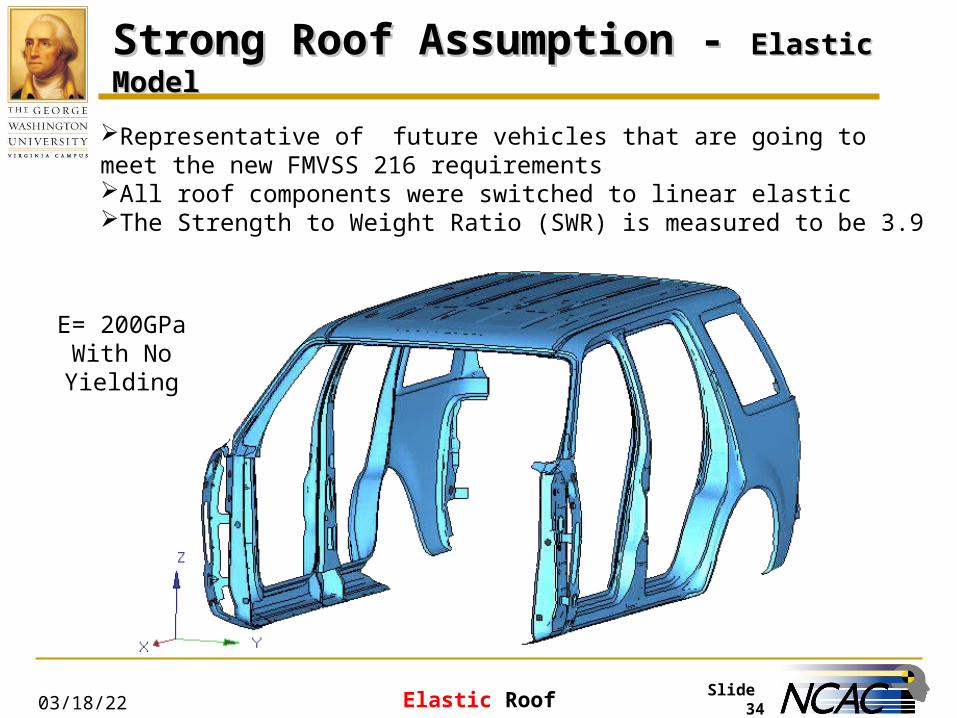
Strong Roof Assumption - Strong Roof Assumption - Elastic ModelElastic Model
04/18/23
E= 200GPaWith No Yielding
Representative of future vehicles that are going to meet the new FMVSS 216 requirementsAll roof components were switched to linear elasticThe Strength to Weight Ratio (SWR) is measured to be 3.9
Elastic Roof
Slide 3504/18/23
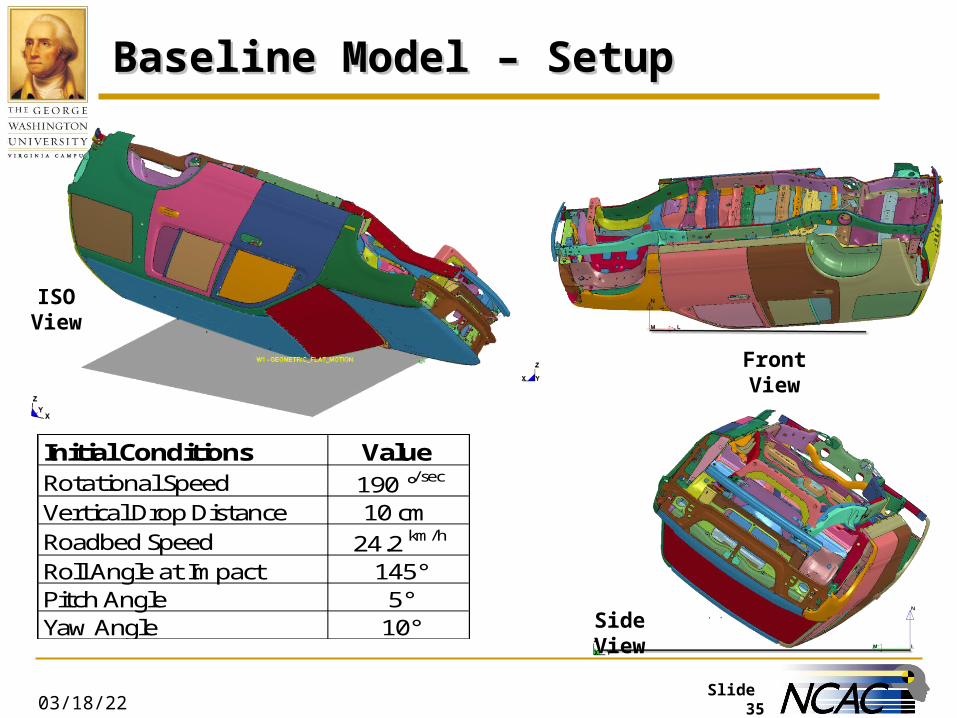
Baseline Model – SetupBaseline Model – Setup
ISO View
Side View
Front View
Initial Conditions Value Rotational Speed 190 °/sec
Vertical Drop Distance 10 cm Roadbed Speed 24.2 km/h
Roll Angle at Impact 145°Pitch Angle 5°Yaw Angle 10°Coefficient of Friction 0.2
Slide 36
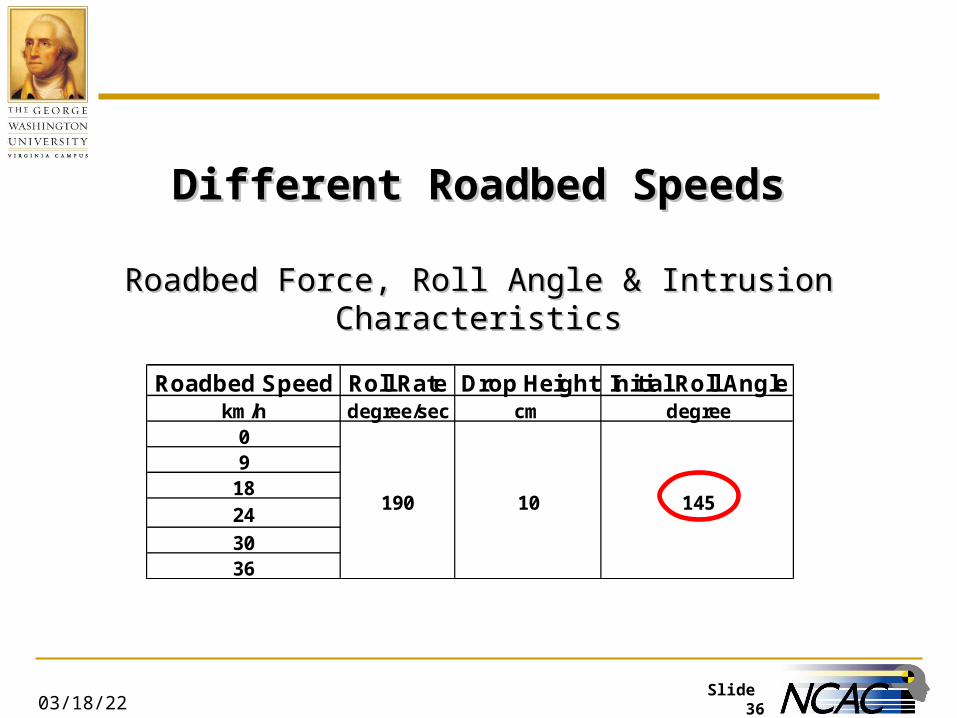
Different Roadbed SpeedsDifferent Roadbed Speeds
Roadbed Force, Roll Angle & Intrusion CharacteristicsRoadbed Force, Roll Angle & Intrusion Characteristics
04/18/23
Roadbed Speed Roll Rate Drop Height Initial Roll Anglekm/h degree/sec cm degree
09
1824
3036
190 10 145
Slide 37
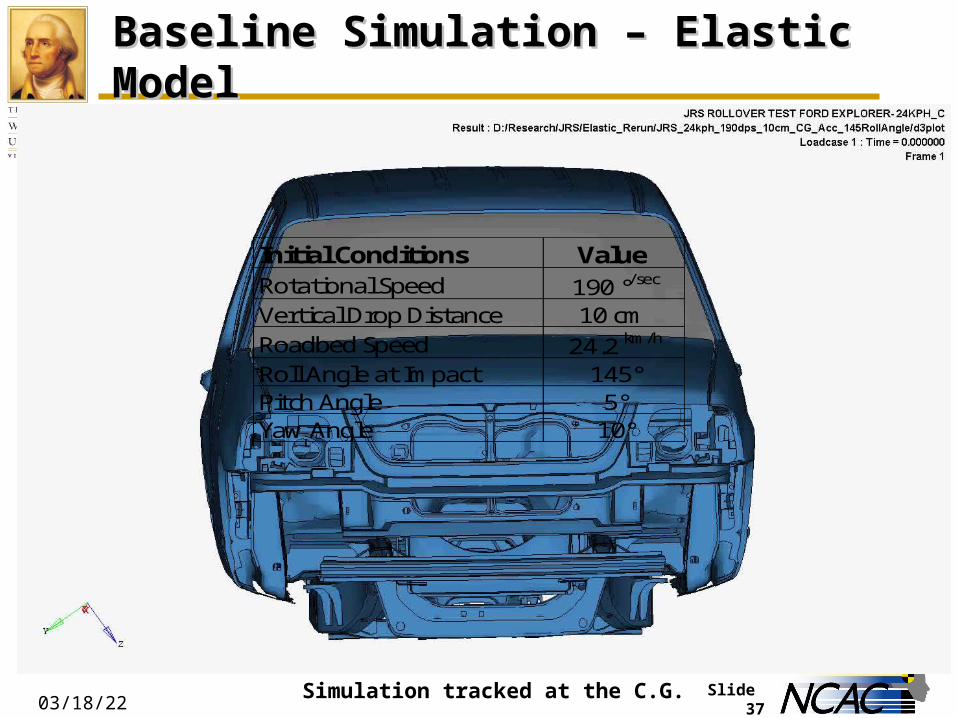
Baseline Simulation – Elastic ModelBaseline Simulation – Elastic Model
04/18/23
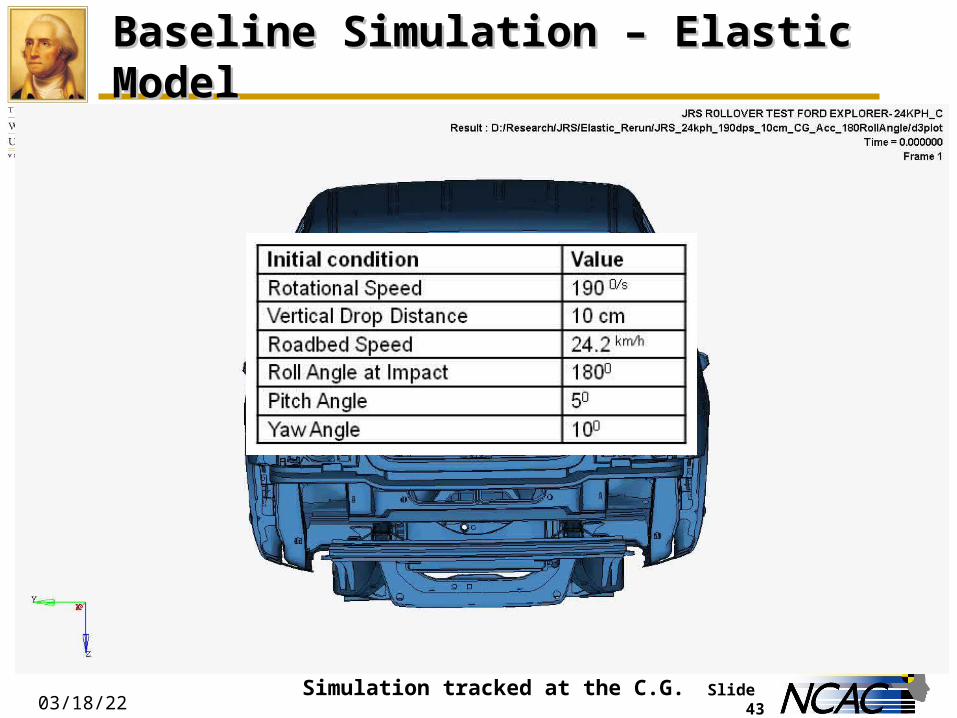
Initial Conditions Value Rotational Speed 190 °/sec
Vertical Drop Distance 10 cm Roadbed Speed 24.2 km/h
Roll Angle at Impact 145°Pitch Angle 5°Yaw Angle 10°Coefficient of Friction 0.2
Simulation tracked at the C.G.
Slide 38
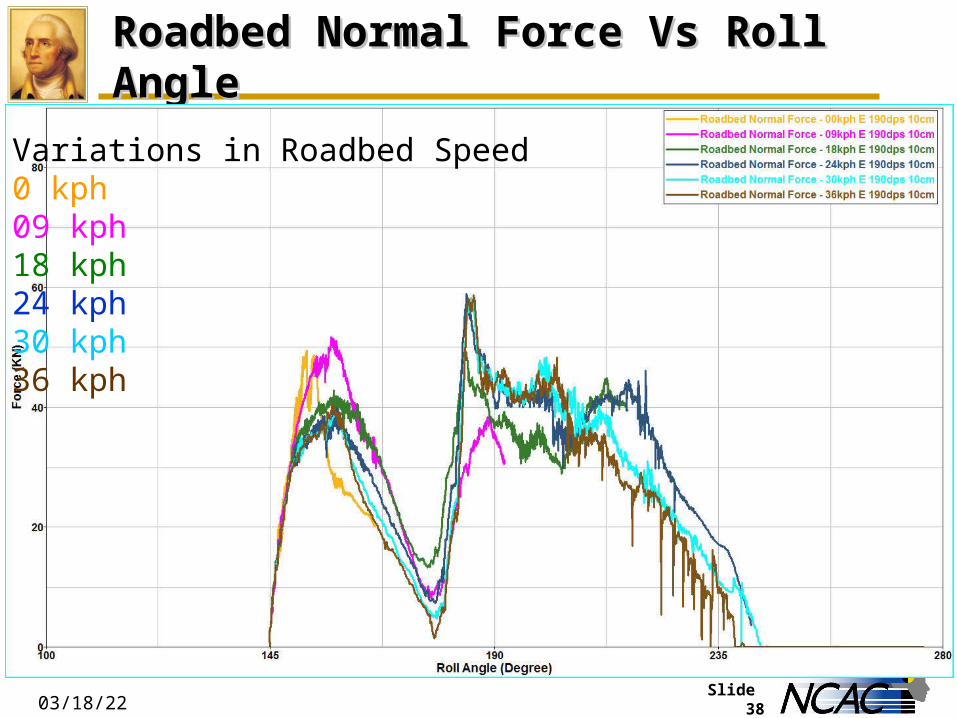
Roadbed Normal Force Vs Roll AngleRoadbed Normal Force Vs Roll Angle
04/18/23
Variations in Roadbed Speed0 kph09 kph18 kph24 kph30 kph36 kph
Slide 39
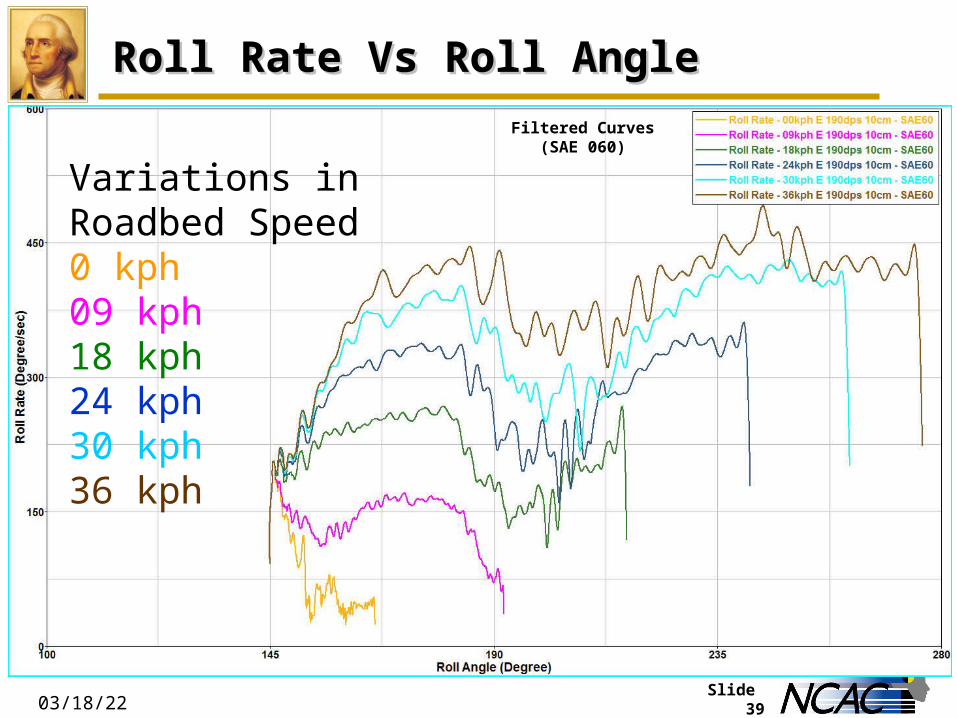
Roll Rate Vs Roll AngleRoll Rate Vs Roll Angle
04/18/23
Filtered Curves (SAE 060)
Variations in Roadbed Speed0 kph09 kph18 kph24 kph30 kph36 kph
Slide 40
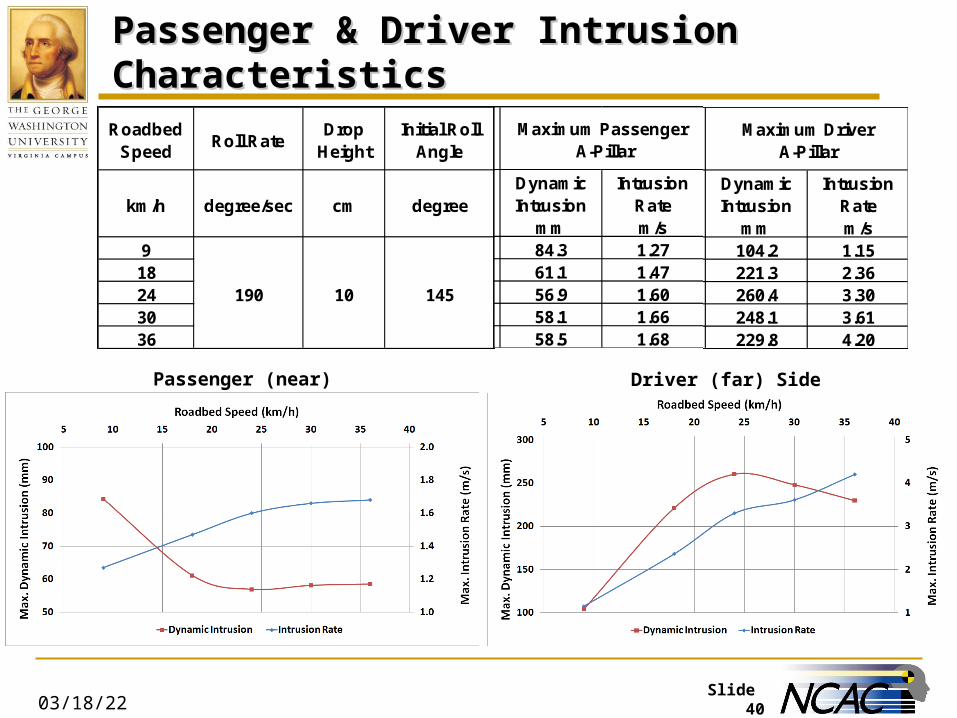
Passenger & Driver Intrusion CharacteristicsPassenger & Driver Intrusion Characteristics
04/18/23
Roadbed Speed
Roll RateDrop
HeightInitial Roll
Angle
km/h degree/sec cm degree
9 84.3 1.27 104.2 1.1518 61.1 1.47 221.3 2.3624 56.9 1.60 260.4 3.3030 58.1 1.66 248.1 3.6136 58.5 1.68 229.8 4.20
190 10 145
Passenger (near) Side Driver (far) Side
Roll Rate
km/h degree/sec cm degreeDynamic Intrusion
mm
Intrusion Ratem/s
9 84.3 1.27 104.2 1.1518 61.1 1.47 221.3 2.3624 56.9 1.60 260.4 3.3030 58.1 1.66 248.1 3.6136 58.5 1.68 229.8 4.20
Maximum Passenger A-Pillar
Roll Rate
km/h degree/sec cm degreeIntrusion
Ratem/s
Dynamic Intrusion
mm
Intrusion Ratem/s
9 84.3 1.27 104.2 1.1518 61.1 1.47 221.3 2.3624 56.9 1.60 260.4 3.3030 58.1 1.66 248.1 3.6136 58.5 1.68 229.8 4.20
Maximum Passenger A-Pillar
Maximum Driver A-Pillar
Slide 41
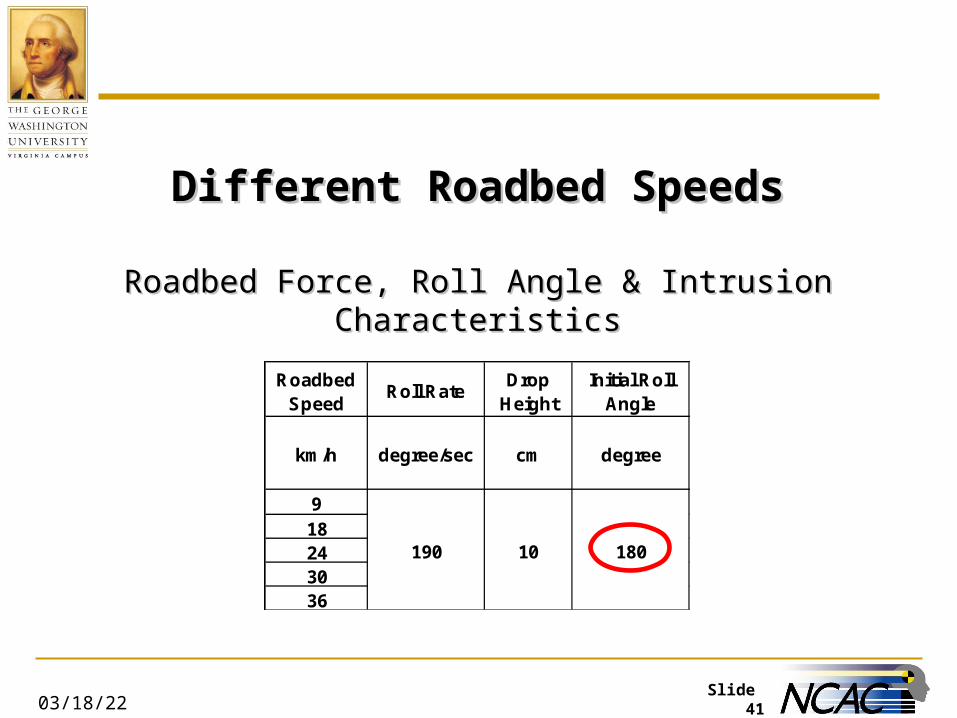
Different Roadbed SpeedsDifferent Roadbed Speeds
Roadbed Force, Roll Angle & Intrusion CharacteristicsRoadbed Force, Roll Angle & Intrusion Characteristics
04/18/23
Roadbed Speed
Roll RateDrop
HeightInitial Roll
Angle
km/h degree/sec cm degree
9 91.4 1.5618 125.7 1.8824 141.5 1.8630 163.5 2.5036 192.5 3.40
190 10 180
Slide 42
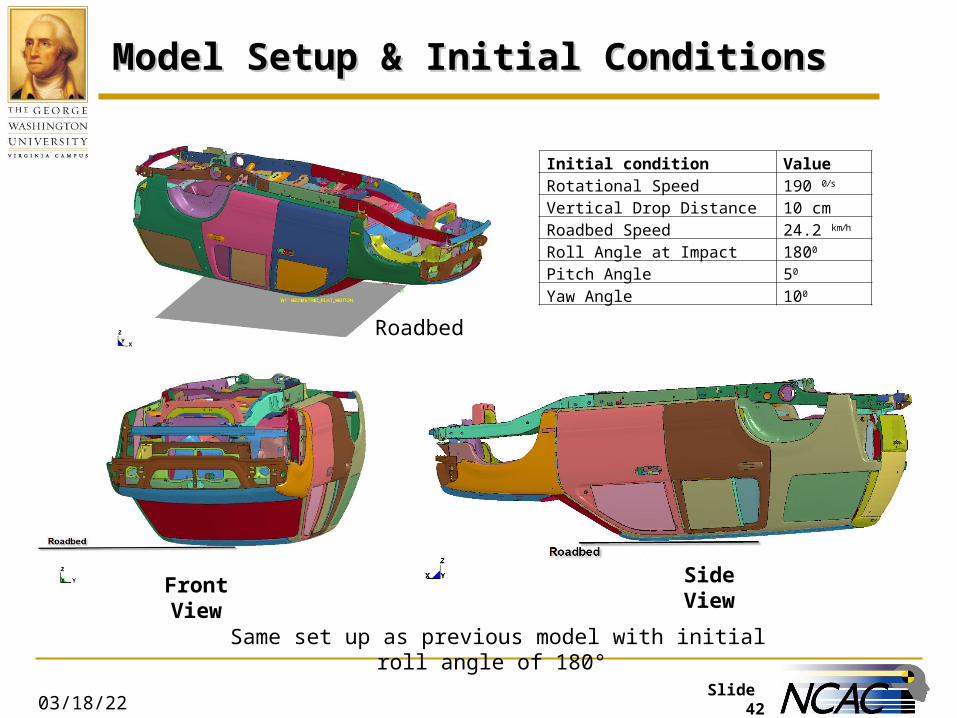
Model Setup & Initial ConditionsModel Setup & Initial Conditions
04/18/23
Initial condition ValueRotational Speed 190 0/s
Vertical Drop Distance 10 cmRoadbed Speed 24.2 km/h
Roll Angle at Impact 1800
Pitch Angle 50
Yaw Angle 100
Front View Side View
Same set up as previous model with initial roll angle of 180°
Roadbed
Slide 43
Baseline Simulation – Elastic ModelBaseline Simulation – Elastic Model
04/18/23Simulation tracked at the C.G.
Slide 44
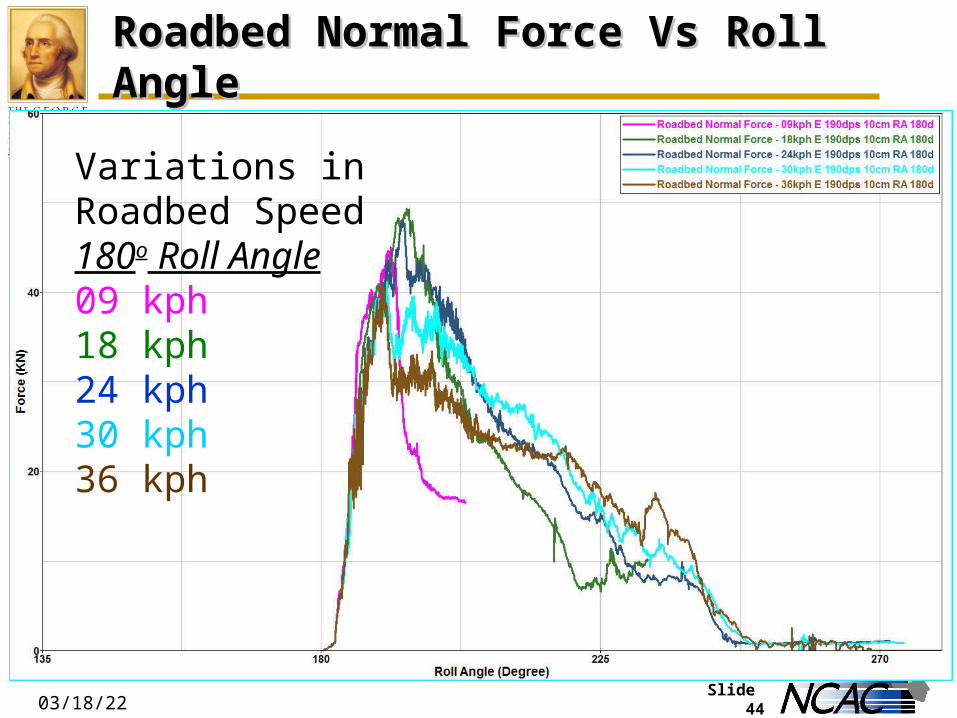
Roadbed Normal Force Vs Roll AngleRoadbed Normal Force Vs Roll Angle
04/18/23
Variations in Roadbed Speed180o Roll Angle09 kph18 kph24 kph30 kph36 kph

Slide 45
Roll Rate Vs Roll AngleRoll Rate Vs Roll Angle
04/18/23
Filtered Curves (SAE 060)
Variations in Roadbed Speed180o Roll Angle09 kph18 kph24 kph30 kph36 kph
Slide 46
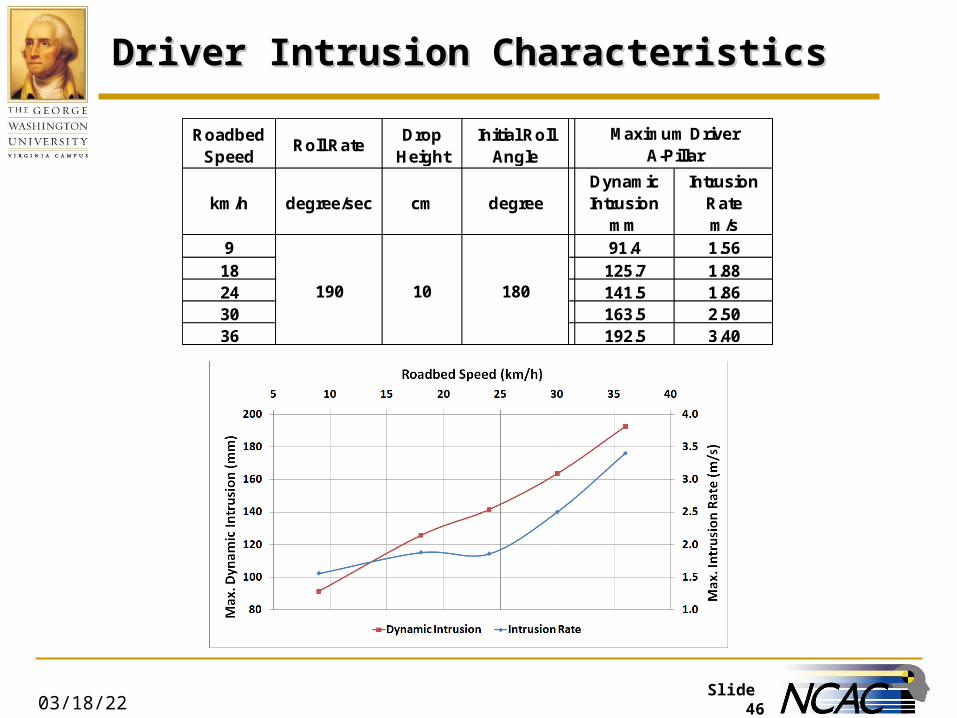
Driver Intrusion CharacteristicsDriver Intrusion Characteristics
04/18/23
Roadbed Speed
Roll RateDrop
HeightInitial Roll
Angle
km/h degree/sec cm degreeDynamic Intrusion
mm
Intrusion Ratem/s
9 91.4 1.5618 125.7 1.8824 141.5 1.8630 163.5 2.5036 192.5 3.40
190 10 180
Maximum Driver A-Pillar
Slide 47
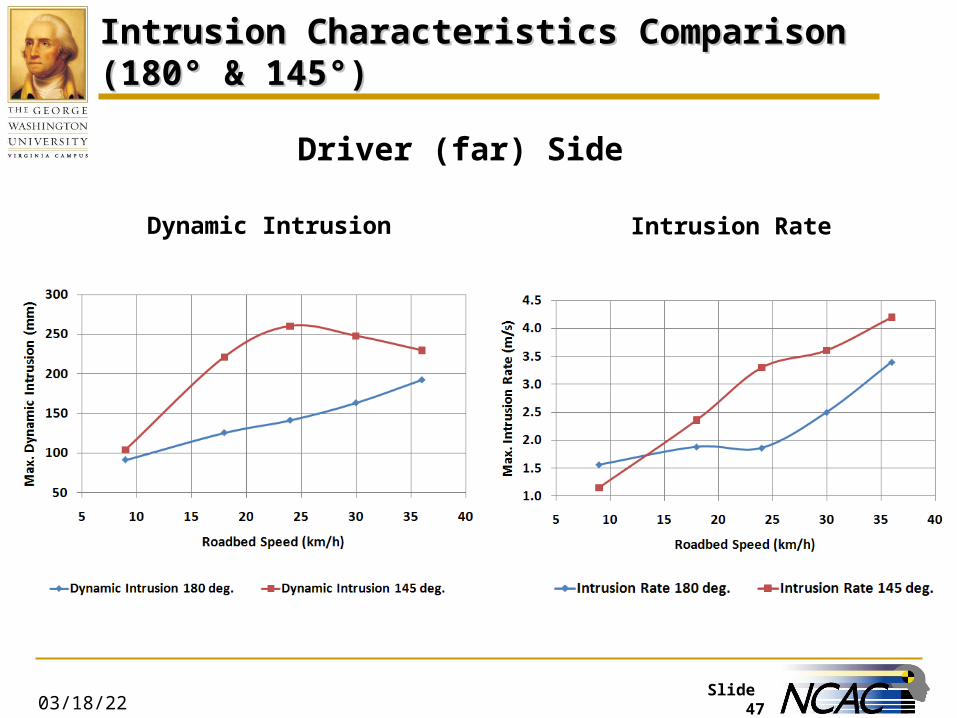
Intrusion Characteristics Comparison (180° & 145°)Intrusion Characteristics Comparison (180° & 145°)
04/18/23
Dynamic Intrusion Intrusion Rate
Driver (far) Side
Slide 48
Conclusion For Different Roadbed SpeedsConclusion For Different Roadbed Speeds
The minimum roadbed speeds necessary to obtain 3 quarter turns rollover is of 24 km/h (14.9 mph) (Have you tried 20 and 22?)
The roadbed normal forces follow the same pattern for roadbed speeds between 24 and 36 km/h (14.9 - 22.4 mph) for initial roll angle of 145°
When the roadbed speed increases, the roll rate after initial contact increases for speeds above 18 km/h (11.2 mph)
For different roadbed speeds and the baseline initial conditions, the dynamic intrusion and the intrusion rate for initial roll angle of 145° are higher than for 180° initial roll angle
04/18/23

Slide 4904/18/23
QUESTIONS?QUESTIONS?