Embed Size (px)
Citation preview

The National Campaign to Prevent Falls in Construction
Final Report on the 2016 Safety Stand‐Down: A follow‐up report to the Final Report on the 2014 & 2015 Safety Stand‐Downs:
A quantitative and qualitative analysis on data collected from OSHA’s Stand‐Down Certificate of
Participation database1
Jessica Bunting, MPH
CPWR – The Center for Construction Research & Training
March 2017
1 http://www.cpwr.com/sites/default/files/2015 vs 2014 Stand‐Down data ‐ final report 12‐1‐15.pdf
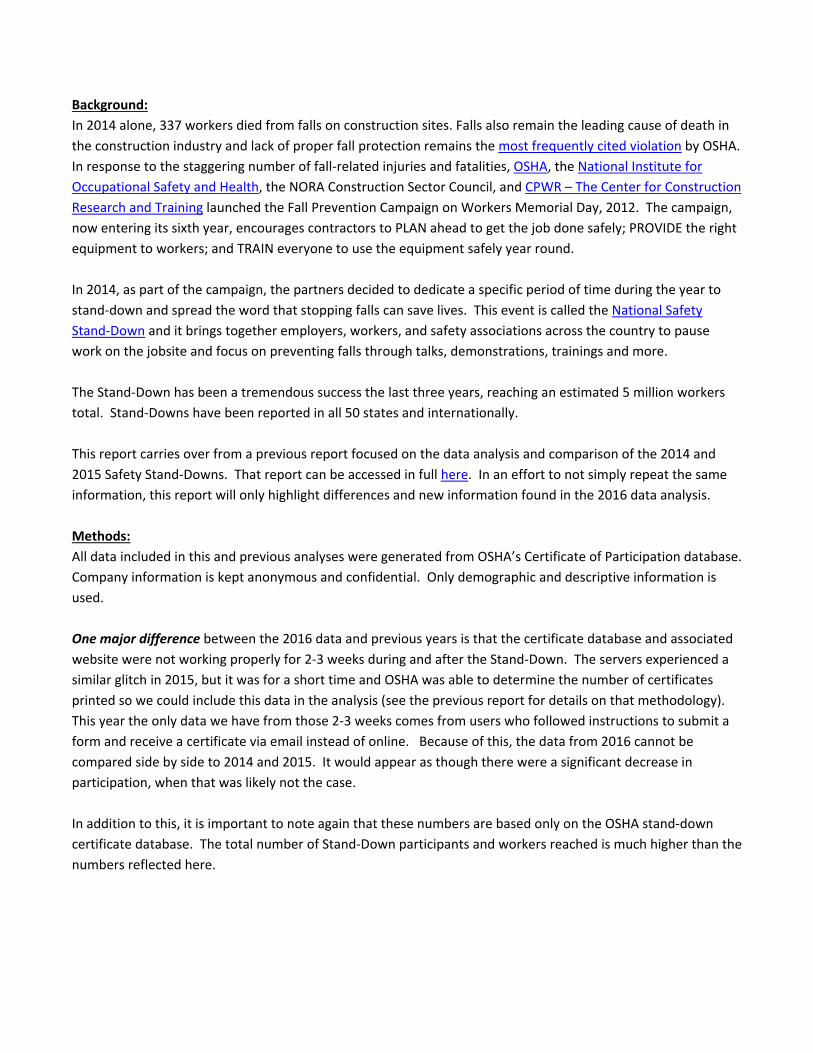
Background:
In 2014 alone, 337 workers died from falls on construction sites. Falls also remain the leading cause of death in
the construction industry and lack of proper fall protection remains the most frequently cited violation by OSHA.
In response to the staggering number of fall‐related injuries and fatalities, OSHA, the National Institute for
Occupational Safety and Health, the NORA Construction Sector Council, and CPWR – The Center for Construction
Research and Training launched the Fall Prevention Campaign on Workers Memorial Day, 2012. The campaign,
now entering its sixth year, encourages contractors to PLAN ahead to get the job done safely; PROVIDE the right
equipment to workers; and TRAIN everyone to use the equipment safely year round.
In 2014, as part of the campaign, the partners decided to dedicate a specific period of time during the year to
stand‐down and spread the word that stopping falls can save lives. This event is called the National Safety
Stand‐Down and it brings together employers, workers, and safety associations across the country to pause
work on the jobsite and focus on preventing falls through talks, demonstrations, trainings and more.
The Stand‐Down has been a tremendous success the last three years, reaching an estimated 5 million workers
total. Stand‐Downs have been reported in all 50 states and internationally.
This report carries over from a previous report focused on the data analysis and comparison of the 2014 and
2015 Safety Stand‐Downs. That report can be accessed in full here. In an effort to not simply repeat the same
information, this report will only highlight differences and new information found in the 2016 data analysis.
Methods:
All data included in this and previous analyses were generated from OSHA’s Certificate of Participation database.
Company information is kept anonymous and confidential. Only demographic and descriptive information is
used.
One major difference between the 2016 data and previous years is that the certificate database and associated
website were not working properly for 2‐3 weeks during and after the Stand‐Down. The servers experienced a
similar glitch in 2015, but it was for a short time and OSHA was able to determine the number of certificates
printed so we could include this data in the analysis (see the previous report for details on that methodology).
This year the only data we have from those 2‐3 weeks comes from users who followed instructions to submit a
form and receive a certificate via email instead of online. Because of this, the data from 2016 cannot be
compared side by side to 2014 and 2015. It would appear as though there were a significant decrease in
participation, when that was likely not the case.
In addition to this, it is important to note again that these numbers are based only on the OSHA stand‐down
certificate database. The total number of Stand‐Down participants and workers reached is much higher than the
numbers reflected here.
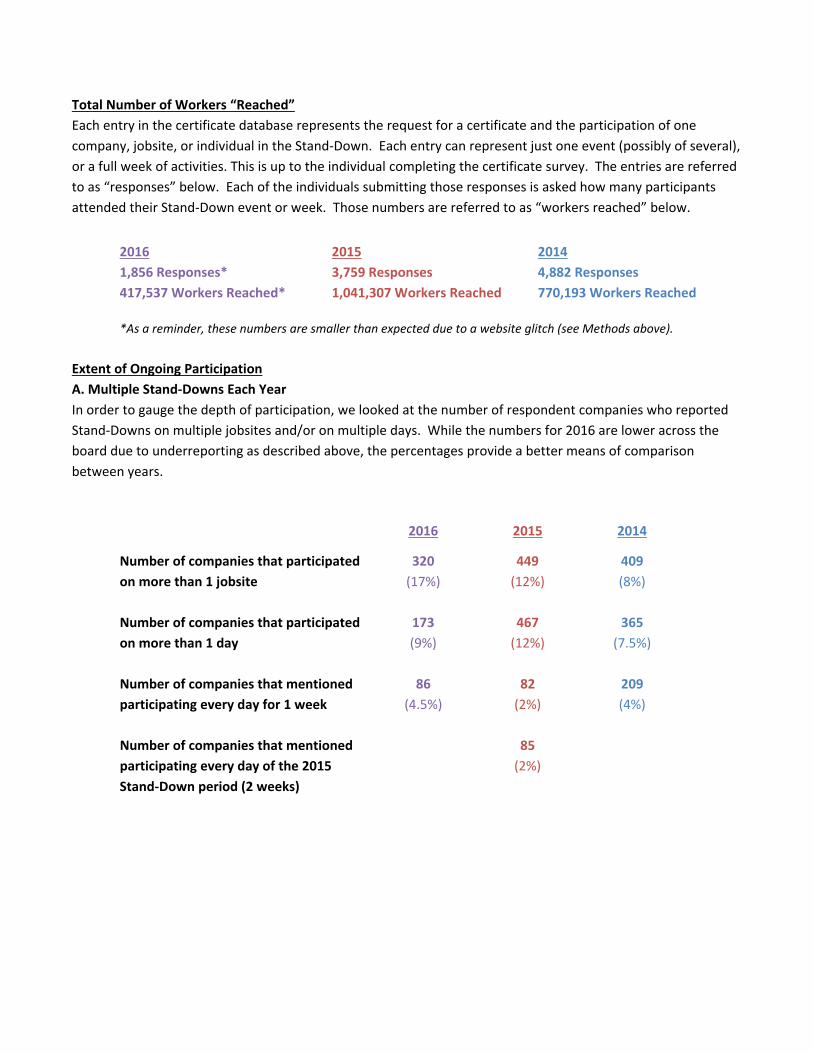
Total Number of Workers “Reached”
Each entry in the certificate database represents the request for a certificate and the participation of one
company, jobsite, or individual in the Stand‐Down. Each entry can represent just one event (possibly of several),
or a full week of activities. This is up to the individual completing the certificate survey. The entries are referred
to as “responses” below. Each of the individuals submitting those responses is asked how many participants
attended their Stand‐Down event or week. Those numbers are referred to as “workers reached” below.
2016 2015 2014
1,856 Responses* 3,759 Responses 4,882 Responses
417,537 Workers Reached* 1,041,307 Workers Reached 770,193 Workers Reached
*As a reminder, these numbers are smaller than expected due to a website glitch (see Methods above).
Extent of Ongoing Participation
A. Multiple Stand‐Downs Each Year
In order to gauge the depth of participation, we looked at the number of respondent companies who reported
Stand‐Downs on multiple jobsites and/or on multiple days. While the numbers for 2016 are lower across the
board due to underreporting as described above, the percentages provide a better means of comparison
between years.
2016 2015 2014
Number of companies that participated
on more than 1 jobsite
320
(17%)
449
(12%)
409
(8%)
Number of companies that participated
on more than 1 day
173
(9%)
467
(12%)
365
(7.5%)
Number of companies that mentioned
participating every day for 1 week
86
(4.5%)
82
(2%)
209
(4%)
Number of companies that mentioned
participating every day of the 2015
Stand‐Down period (2 weeks)
85
(2%)
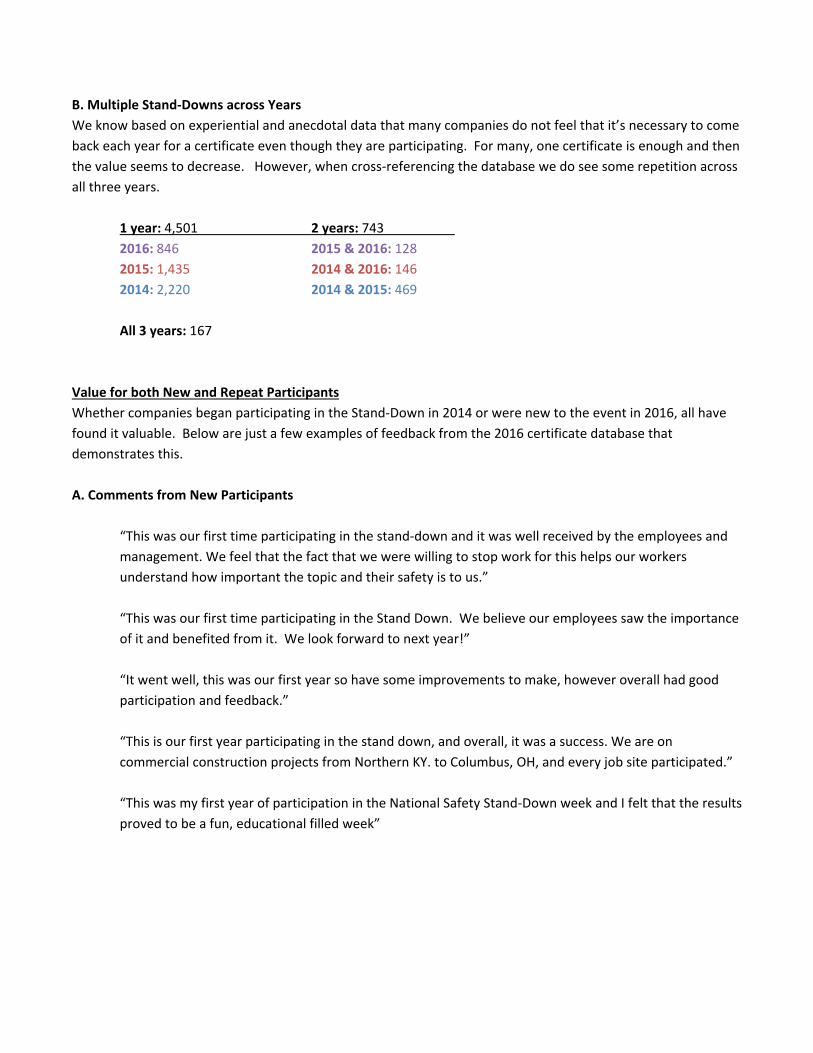
B. Multiple Stand‐Downs across Years
We know based on experiential and anecdotal data that many companies do not feel that it’s necessary to come
back each year for a certificate even though they are participating. For many, one certificate is enough and then
the value seems to decrease. However, when cross‐referencing the database we do see some repetition across
all three years.
1 year: 4,501
2016: 846
2015: 1,435
2014: 2,220
2 years: 743
2015 & 2016: 128
2014 & 2016: 146
2014 & 2015: 469
All 3 years: 167
Value for both New and Repeat Participants
Whether companies began participating in the Stand‐Down in 2014 or were new to the event in 2016, all have
found it valuable. Below are just a few examples of feedback from the 2016 certificate database that
demonstrates this.
A. Comments from New Participants
“This was our first time participating in the stand‐down and it was well received by the employees and
management. We feel that the fact that we were willing to stop work for this helps our workers
understand how important the topic and their safety is to us.”
“This was our first time participating in the Stand Down. We believe our employees saw the importance
of it and benefited from it. We look forward to next year!”
“It went well, this was our first year so have some improvements to make, however overall had good
participation and feedback.”
“This is our first year participating in the stand down, and overall, it was a success. We are on
commercial construction projects from Northern KY. to Columbus, OH, and every job site participated.”
“This was my first year of participation in the National Safety Stand‐Down week and I felt that the results
proved to be a fun, educational filled week”
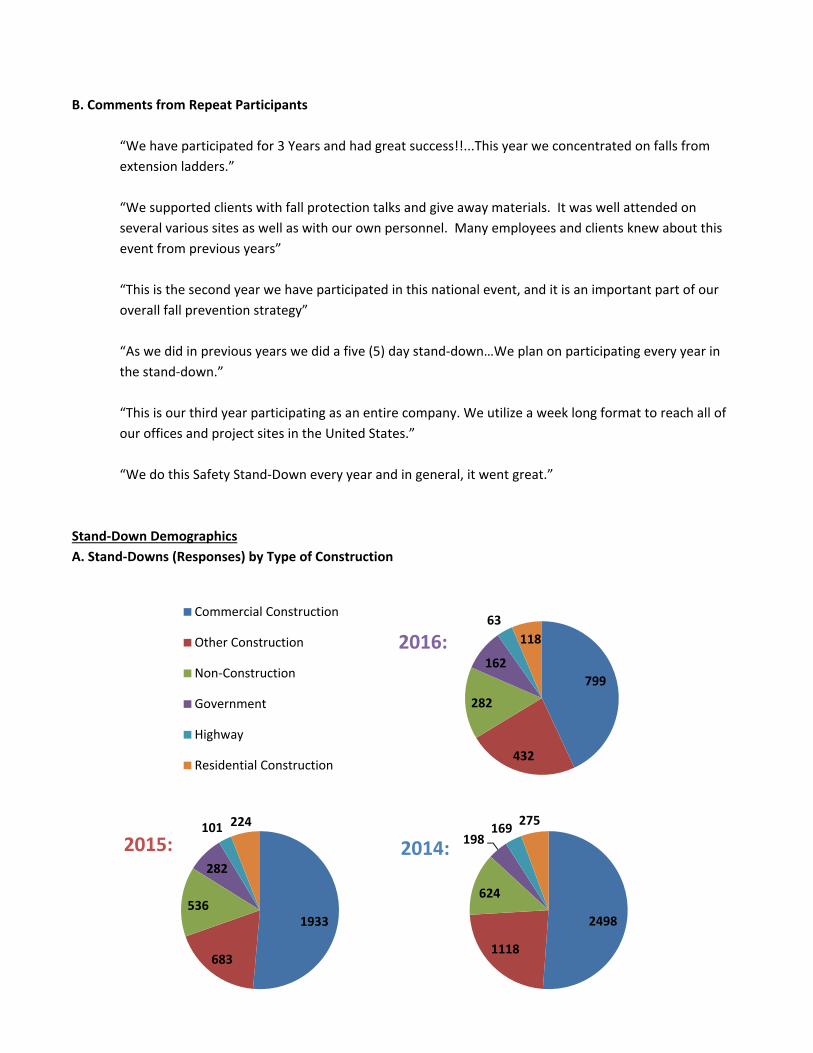
B. Comments from Repeat Participants
“We have participated for 3 Years and had great success!!...This year we concentrated on falls from
extension ladders.”
“We supported clients with fall protection talks and give away materials. It was well attended on
several various sites as well as with our own personnel. Many employees and clients knew about this
event from previous years”
“This is the second year we have participated in this national event, and it is an important part of our
overall fall prevention strategy”
“As we did in previous years we did a five (5) day stand‐down…We plan on participating every year in
the stand‐down.”
“This is our third year participating as an entire company. We utilize a week long format to reach all of
our offices and project sites in the United States.”
“We do this Safety Stand‐Down every year and in general, it went great.”
Stand‐Down Demographics
A. Stand‐Downs (Responses) by Type of Construction
Commercial Construction 63
Other Construction 2016: Non‐Construction
Government
Highway
Residential Construction
799
432
282
162
118
1933
282
101 224
2498
169 275
2015: 2014: 198
683
536
1118
624

B. Workers Reached (Participants) by Type of Construction
Commercial Construction
Other Construction
Non‐Construction
Government
Highway
Residential Construction
2015:
9,802 8,967
2016:
240,817
35,858
70,218
51,875
391,115
88,094117,876
406,318
14,162 23,742
499,202 134,718
80,588
26,338
10,480 18,867
2014:
C. Stand‐Down Size
One of the original goals of the Campaign to Prevent Falls in Construction when it began in 2012 was to reach
small, residential contractors, a consistently difficult to reach segment of the industry. While the campaign
expanded over the years to include not only construction, but also military, mining, and general industry, we still
want to check in to see if we are meeting our goal of including vulnerable, hard‐to‐reach workers. Below is the
data on “small stand‐downs.”
Participants were not asked to indicate the size of their company so it is important that the distinction be made
between companies of 25 (or 10) or fewer individuals and stand‐downs with 25 or fewer individuals in
attendance. The information contained here refers strictly to stand‐downs that included 25 individuals or less.
This includes large companies who simply divided their stand‐downs by site, companies that only employ a small
number of workers, companies who only targeted their safety teams, and a number of other types of stand‐
downs. It is also worth noting that many of the larger stand‐downs conducted by large contractors also included
their subcontractors who employ 25 or fewer individuals and those may not be accounted for here.
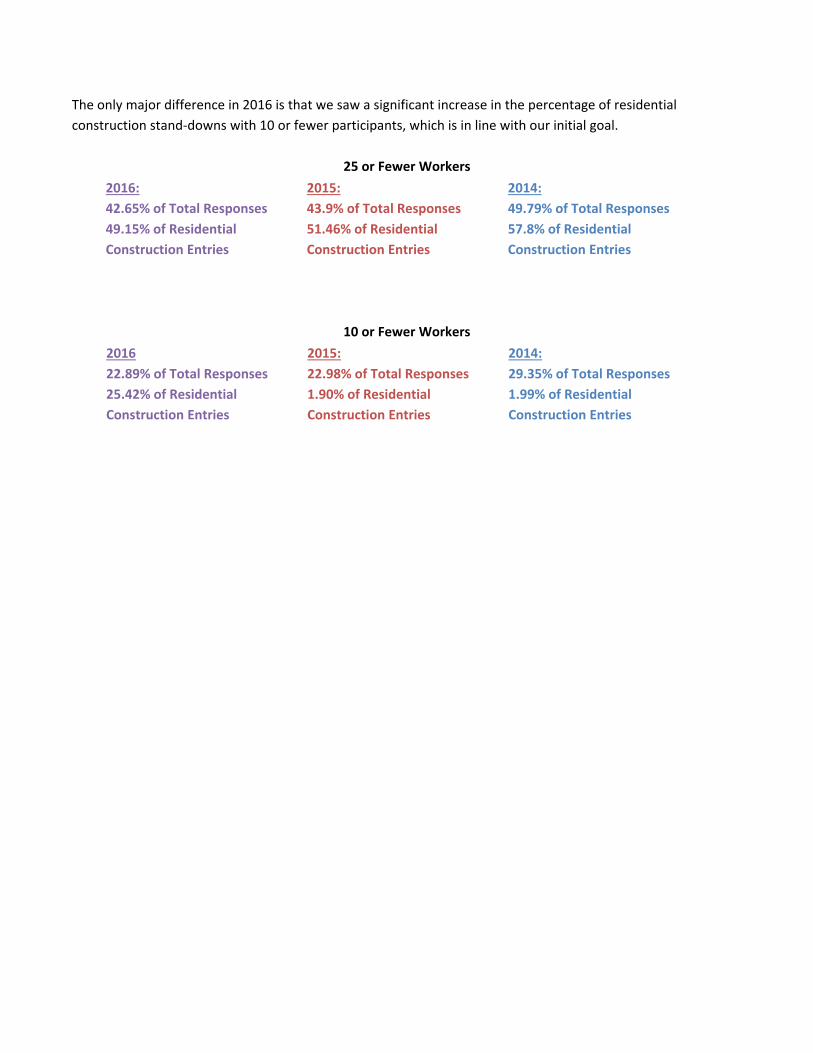
The only major difference in 2016 is that we saw a significant increase in the percentage of residential
construction stand‐downs with 10 or fewer participants, which is in line with our initial goal.
25 or Fewer Workers
2016: 2015: 2014:
42.65% of Total Responses 43.9% of Total Responses 49.79% of Total Responses
49.15% of Residential 51.46% of Residential 57.8% of Residential
Construction Entries Construction Entries Construction Entries
10 or Fewer Workers
2016 2015: 2014:
22.89% of Total Responses 22.98% of Total Responses 29.35% of Total Responses
25.42% of Residential 1.90% of Residential 1.99% of Residential
Construction Entries Construction Entries Construction Entries

D. Stand‐Downs (Responses) by State
In addition to the states shown on the following map, there were also four stand‐downs in Guam, two in Puerto
Rico, and one in the U.S. Virgin Islands. There were 41 international stand‐downs reported.
While the numbers on 2016’s map are smaller than past years’ (available in the report) due to the website being
down, they remained consistent in that the states with the highest number of stand‐downs include California,
Texas, Florida, Pennsylvania, and New York, and the states with the lowest number of stand‐downs include
Montana, North Dakota, South Dakota, Vermont, and Rhode Island.
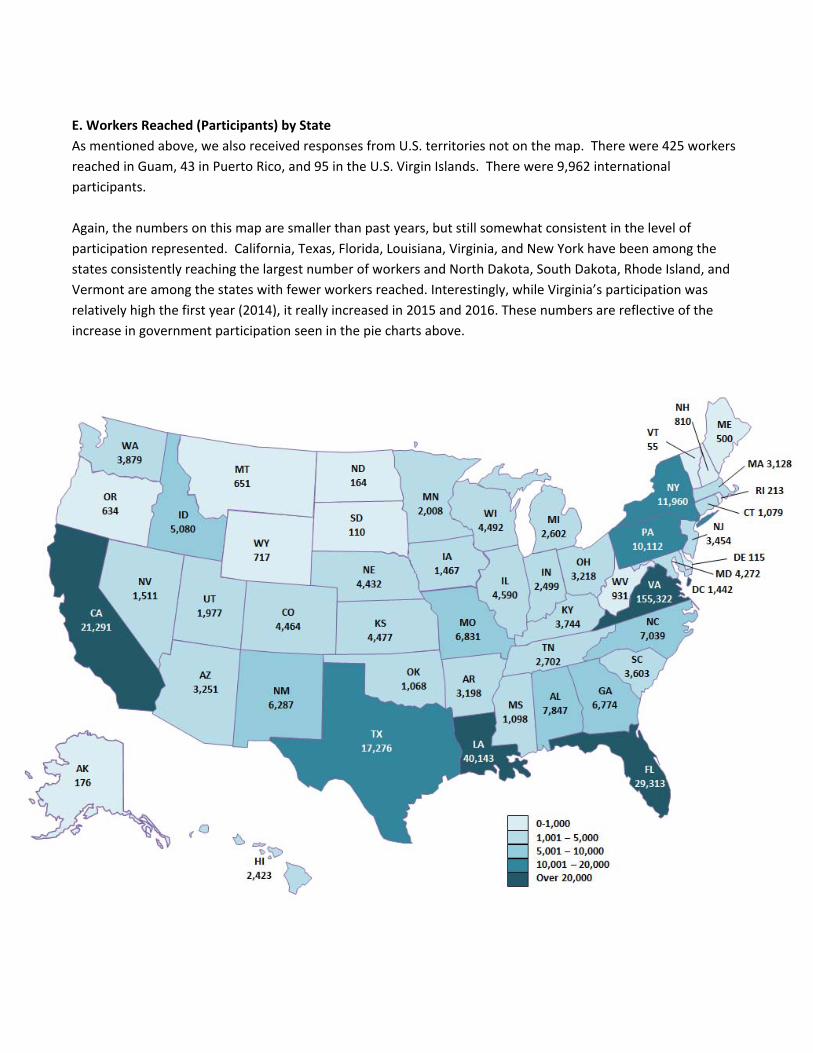
E. Workers Reached (Participants) by State
As mentioned above, we also received responses from U.S. territories not on the map. There were 425 workers
reached in Guam, 43 in Puerto Rico, and 95 in the U.S. Virgin Islands. There were 9,962 international
participants.
Again, the numbers on this map are smaller than past years, but still somewhat consistent in the level of
participation represented. California, Texas, Florida, Louisiana, Virginia, and New York have been among the
states consistently reaching the largest number of workers and North Dakota, South Dakota, Rhode Island, and
Vermont are among the states with fewer workers reached. Interestingly, while Virginia’s participation was
relatively high the first year (2014), it really increased in 2015 and 2016. These numbers are reflective of the
increase in government participation seen in the pie charts above.
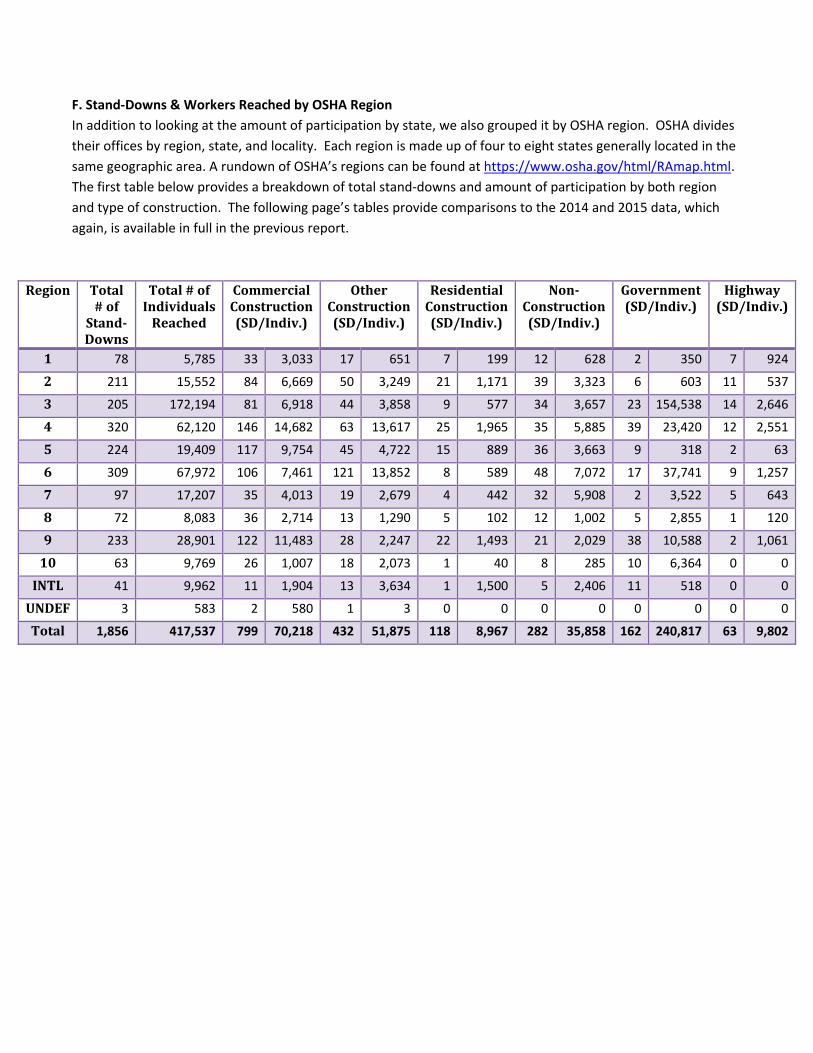
F. Stand‐Downs & Workers Reached by OSHA Region
In addition to looking at the amount of participation by state, we also grouped it by OSHA region. OSHA divides
their offices by region, state, and locality. Each region is made up of four to eight states generally located in the
same geographic area. A rundown of OSHA’s regions can be found at https://www.osha.gov/html/RAmap.html.
The first table below provides a breakdown of total stand‐downs and amount of participation by both region
and type of construction. The following page’s tables provide comparisons to the 2014 and 2015 data, which
again, is available in full in the previous report.
Region Total # of Stand‐Downs
Total # of Individuals Reached
Commercial Construction (SD/Indiv.)
Other Construction (SD/Indiv.)
Residential Construction (SD/Indiv.)
Non‐Construction (SD/Indiv.)
Government (SD/Indiv.)
Highway (SD/Indiv.)
1 78 5,785 33 3,033 17 651 7 199 12 628 2 350 7 924
2 211 15,552 84 6,669 50 3,249 21 1,171 39 3,323 6 603 11 537
3 205 172,194 81 6,918 44 3,858 9 577 34 3,657 23 154,538 14 2,646
4 320 62,120 146 14,682 63 13,617 25 1,965 35 5,885 39 23,420 12 2,551
5 224 19,409 117 9,754 45 4,722 15 889 36 3,663 9 318 2 63
6 309 67,972 106 7,461 121 13,852 8 589 48 7,072 17 37,741 9 1,257
7 97 17,207 35 4,013 19 2,679 4 442 32 5,908 2 3,522 5 643
8 72 8,083 36 2,714 13 1,290 5 102 12 1,002 5 2,855 1 120
9 233 28,901 122 11,483 28 2,247 22 1,493 21 2,029 38 10,588 2 1,061
10 63 9,769 26 1,007 18 2,073 1 40 8 285 10 6,364 0 0
INTL 41 9,962 11 1,904 13 3,634 1 1,500 5 2,406 11 518 0 0
UNDEF 3 583 2 580 1 3 0 0 0 0 0 0 0 0
Total 1,856 417,537 799 70,218 432 51,875 118 8,967 282 35,858 162 240,817 63 9,802
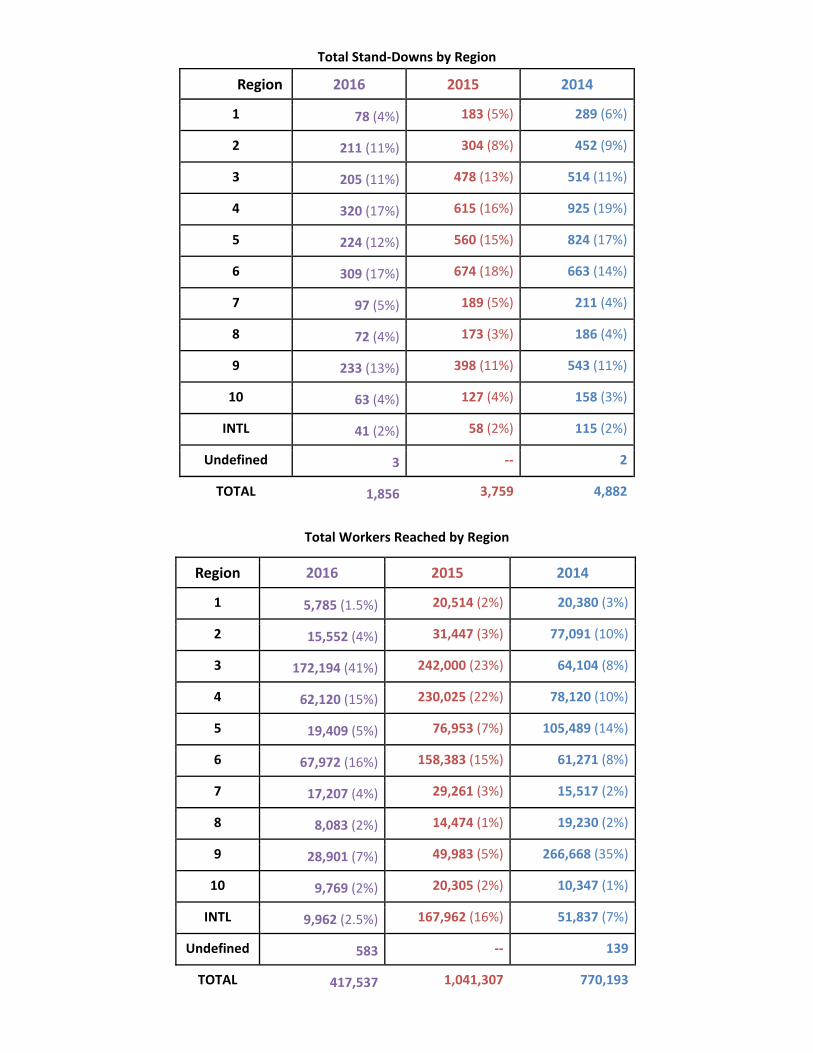
Total Stand‐Downs by Region
Region 2016 2015 2014
1 78 (4%) 183 (5%) 289 (6%)
2 211 (11%) 304 (8%) 452 (9%)
3 205 (11%) 478 (13%) 514 (11%)
4 320 (17%) 615 (16%) 925 (19%)
5 224 (12%) 560 (15%) 824 (17%)
6 309 (17%) 674 (18%) 663 (14%)
7 97 (5%) 189 (5%) 211 (4%)
8 72 (4%) 173 (3%) 186 (4%)
9 233 (13%) 398 (11%) 543 (11%)
10 63 (4%) 127 (4%) 158 (3%)
INTL 41 (2%) 58 (2%) 115 (2%)
Undefined 3 ‐‐ 2
TOTAL 1,856 3,759 4,882
Total Workers Reached by Region
Region 2016 2015 2014
1 5,785 (1.5%) 20,514 (2%) 20,380 (3%)
2 15,552 (4%) 31,447 (3%) 77,091 (10%)
3 172,194 (41%) 242,000 (23%) 64,104 (8%)
4 62,120 (15%) 230,025 (22%) 78,120 (10%)
5 19,409 (5%) 76,953 (7%) 105,489 (14%)
6 67,972 (16%) 158,383 (15%) 61,271 (8%)
7 17,207 (4%) 29,261 (3%) 15,517 (2%)
8 8,083 (2%) 14,474 (1%) 19,230 (2%)
9 28,901 (7%) 49,983 (5%) 266,668 (35%)
10 9,769 (2%) 20,305 (2%) 10,347 (1%)
INTL 9,962 (2.5%) 167,962 (16%) 51,837 (7%)
Undefined 583 ‐‐ 139
TOTAL 417,537 1,041,307 770,193
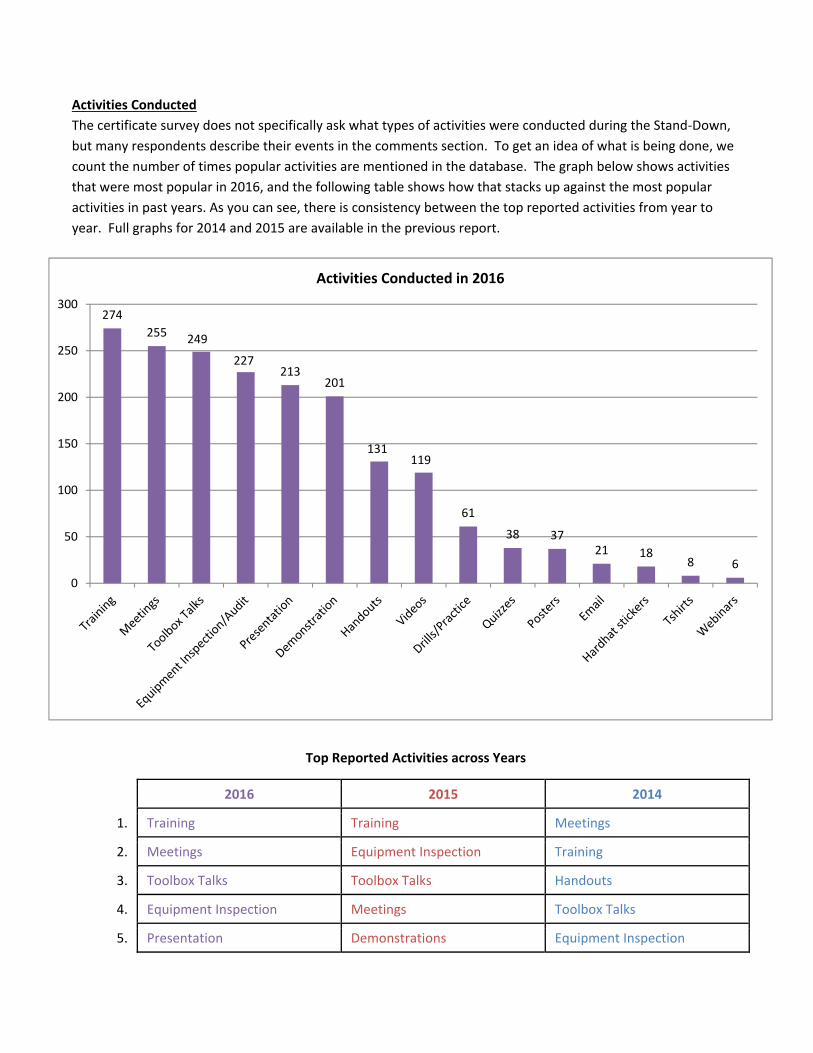
Activities Conducted
The certificate survey does not specifically ask what types of activities were conducted during the Stand‐Down,
but many respondents describe their events in the comments section. To get an idea of what is being done, we
count the number of times popular activities are mentioned in the database. The graph below shows activities
that were most popular in 2016, and the following table shows how that stacks up against the most popular
activities in past years. As you can see, there is consistency between the top reported activities from year to
year. Full graphs for 2014 and 2015 are available in the previous report.
Activities Conducted in 2016
300
250
200
150
100
50
0
274 255 249
227 213
201
131 119
61
38 37 21 18
8 6
Top Reported Activities across Years
1.
2.
3.
4.
5.
2016 2015 2014
Training Training Meetings
Meetings Equipment Inspection Training
Toolbox Talks Toolbox Talks Handouts
Equipment Inspection Meetings Toolbox Talks
Presentation Demonstrations Equipment Inspection
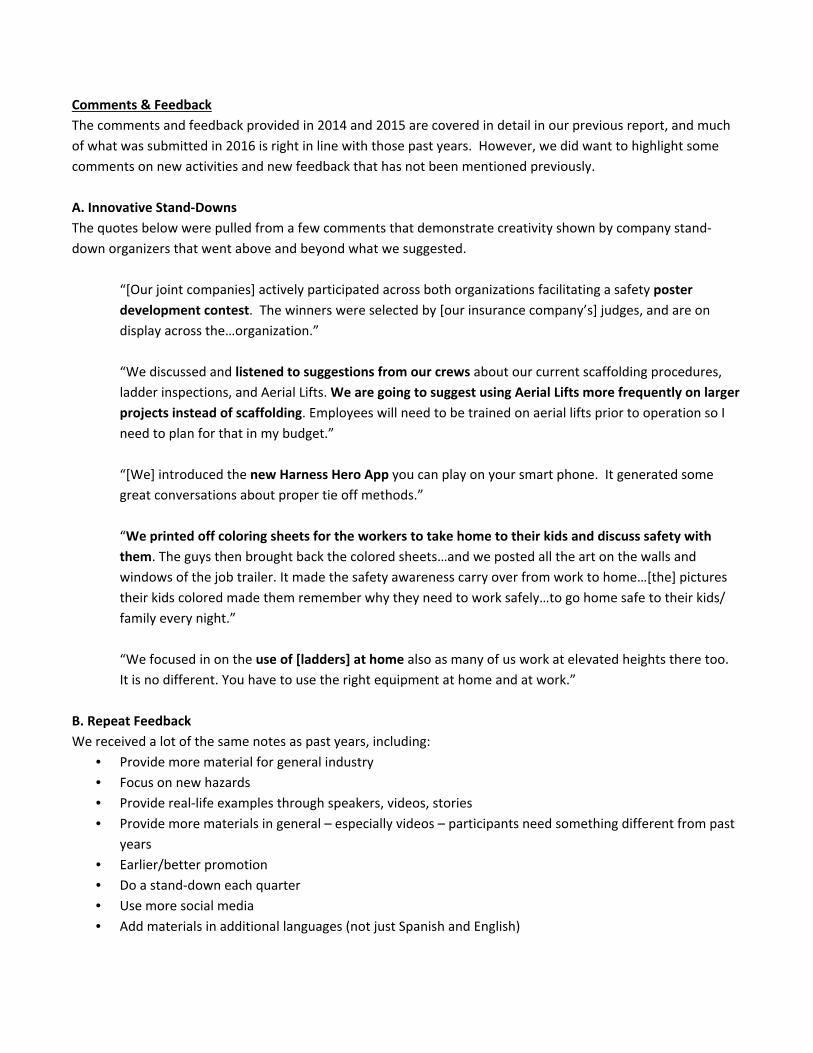
Comments & Feedback
The comments and feedback provided in 2014 and 2015 are covered in detail in our previous report, and much
of what was submitted in 2016 is right in line with those past years. However, we did want to highlight some
comments on new activities and new feedback that has not been mentioned previously.
A. Innovative Stand‐Downs
The quotes below were pulled from a few comments that demonstrate creativity shown by company stand‐
down organizers that went above and beyond what we suggested.
“[Our joint companies] actively participated across both organizations facilitating a safety poster
development contest. The winners were selected by [our insurance company’s] judges, and are on
display across the…organization.”
“We discussed and listened to suggestions from our crews about our current scaffolding procedures,
ladder inspections, and Aerial Lifts. We are going to suggest using Aerial Lifts more frequently on larger
projects instead of scaffolding. Employees will need to be trained on aerial lifts prior to operation so I
need to plan for that in my budget.”
“[We] introduced the new Harness Hero App you can play on your smart phone. It generated some
great conversations about proper tie off methods.”
“We printed off coloring sheets for the workers to take home to their kids and discuss safety with
them. The guys then brought back the colored sheets…and we posted all the art on the walls and
windows of the job trailer. It made the safety awareness carry over from work to home…[the] pictures
their kids colored made them remember why they need to work safely…to go home safe to their kids/
family every night.”
“We focused in on the use of [ladders] at home also as many of us work at elevated heights there too.
It is no different. You have to use the right equipment at home and at work.”
B. Repeat Feedback
We received a lot of the same notes as past years, including:
• Provide more material for general industry
• Focus on new hazards
• Provide real‐life examples through speakers, videos, stories
• Provide more materials in general – especially videos – participants need something different from past
years
• Earlier/better promotion
• Do a stand‐down each quarter
• Use more social media
• Add materials in additional languages (not just Spanish and English)

C. New Feedback
We did receive a few comments and suggestions that were not mentioned in previous years as well:
• Many highlighted the importance of creating an open conversation for employees (improving overall
safety culture)
• Training specifically on CFR 1926 Subpart M was mentioned several times
• Some participated for 2 weeks or even a month on their own, despite the Stand‐Down officially lasting 1
week
• Heavier involvement from insurance companies
• Increased focus on the importance of daily equipment inspections and requests for materials that
provide better guidance on inspection and what issues to look for (i.e. of harnesses and lanyards)
• Suggestion to allow people to sign up for OSHA email alerts separate from other distribution lists like
QuickTakes, just to provide information on programs such as this
As always, this feedback will be incorporated into our planning and promotional efforts for the 2017 Safety
Stand‐Down, to be held May 8th – 12th!
For more information on the Campaign to Stop Falls in Construction and the National Safety Stand‐Down, visit
the joint OSHA‐NIOSH‐CPWR campaign site stopconstructionfalls.com.