Embed Size (px)
Citation preview

© The Aerospace Corporation 2010© The Aerospace Corporation 2011
Dynamic Concepts, Inc.
Huntsville, Alabama
THE NASA ENGINEERING
& SAFETY CENTER (NESC)
SHOCK & VIBRATION TRAINING PROGRAM
By
Tom Irvine, Dynamic Concepts, Inc.
And
Dr. Curtis E. Larsen
NASA Technical Fellow for Loads and Dynamics

© The Aerospace Corporation 2010© The Aerospace Corporation 2011
NESC is an independently funded program with a dedicated team of technical experts
NESC was Formed in 2003 in response to the Space Shuttle Columbia Accident Investigation
NESC’s fundamental purpose is provide to objective engineering and safety assessments of critical, high-risk NASA projects to ensure safety and mission success
The National Aeronautics and Space Act of 1958
NESC is currently expanding its services to benefit United States:
MilitaryGovernment AgenciesCommercial Space

© The Aerospace Corporation 2010© The Aerospace Corporation 2011
NESC Engineers Provide a Second Pair of Eyes
Design and Analysis Reviews
Test Support
Flight Accelerometer Data Analysis
Tutorial Papers
Perform Research as Needed
NESC Academy
We already have a charge number.

© The Aerospace Corporation 2010© The Aerospace Corporation 2011
NESC Sample Projects
NASA/Wallops
Terrier-Black
Brant Flight
Orion LAS PA-1 Test
NASA/Stennis
A-3 Test Stand

5e-mail address
Department/subdivision name
Dynamic Concepts, Inc.
Huntsville, Alabama
The authors have prepared self-study course units for:
• Shock
• Vibration
• Acoustics
• Structural Dynamics
• Signal Processing
These taxpayer-funded materials are available upon request to U.S. civil servants and contractors working on NASA, commercial space, and military projects.

6e-mail address
Department/subdivision name
Students learn best by doing!
Challenges
Most engineering students do not take a vibrations course in college
College-level vibration courses focus on theory rather than on practical applications
Pedagogy . . .
These NESC course units contain
Slide presentations
Software exercises using actual accelerometer data samples & synthesized time histories
Software is mainly written in Matlab with some visual C++ programs
Students keep software for use on their own projects, including source code
7e-mail address
Department/subdivision name
Work-in-Progress . . . 18 Units completed, hundreds more to go!
Topics (planned or completed)
Signal Identification, Natural Frequencies, and Damping Ratios
Structural Dynamics, Rods, Beams & Plates
Avionics Isolation Octave Rule Sine & Sine Sweep Vibration Random Vibration Fourier Transforms Power Spectral Density Shock Response Spectra Vibration Response Spectra Fatigue, Miners Rule, Rainflow Steinberg Electronic Formulas Aliasing, Nyquist Frequency Digital Filtering Sound Pressure Levels Finite element methods

8e-mail address
Department/subdivision name
Wind speed of 42 miles per hour
Torsional vibration mode at 0.2 Hz.
The two halves vibration 180° out-of-
phase.
Torsion mode response due to
aerodynamic self-excitation.
Not due to resonance.
Strouhal frequency
fs = S U/D
fs = 0.84 Hz at 42 mph
0.2 Hz oscillation sinusoidal with an amplitude up to 28 feet.
Acceleration = ω^2 Displacement
0.5 (336 in peak-to-peak ) [ 2 0.2 Hz ]^2 (1 G /386 in/sec^2 )
= 0.69 G
Tacoma Narrows Bridge 1940

9e-mail address
Department/subdivision name
Sine Vibration: Gemini Program Titan II Pogo
Astronaut Michael Collins wrote:
The first stage of the Titan II vibrated longitudinally, sothat someone riding on it would be bounced up anddown as if on a pogo stick. The vibration was at arelatively high frequency, about 11 cycles per second,with an amplitude of plus or minus 5 Gs in the worstcase.
10e-mail address
Department/subdivision name
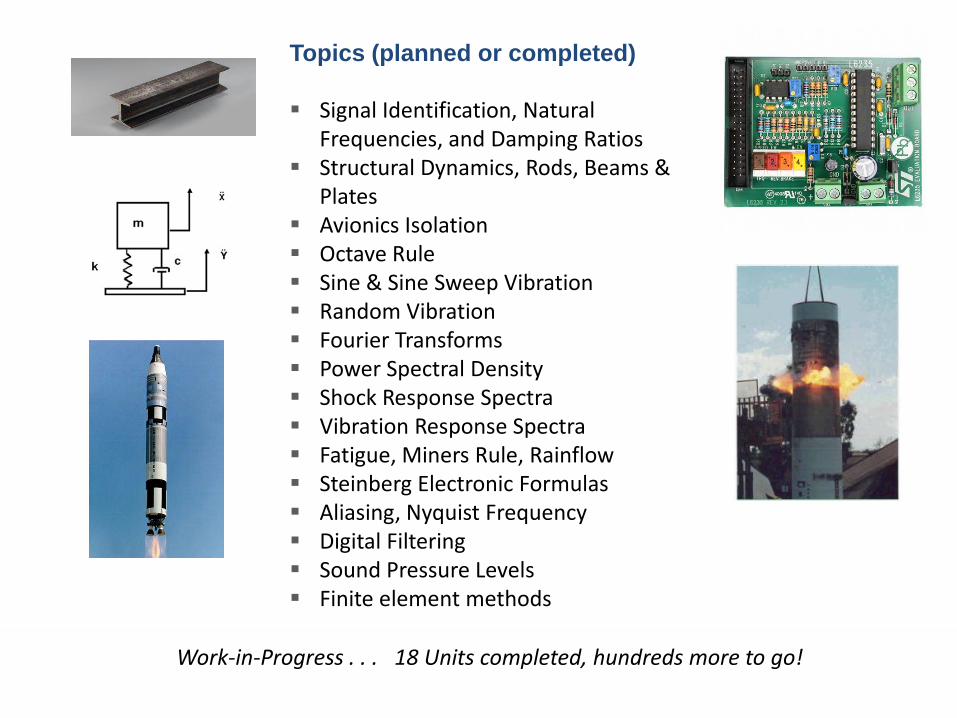
Suborbital Launch Vehicle Flight Accelerometer Data
-50
-40
-30
-20
-10
0
10
20
30
40
50
0 5 10 15 20 25 30 35 40 45 50 55 60 65
TIME (SEC)
AC
CE
L (
G)
FLIGHT ACCELEROMETER DATA
Liftoff Transonic, max-Q ACS Thrusters

11e-mail address
Department/subdivision name
Pegasus Drop Transient – Damped Sinusoid
-1.5
-1.0
-0.5
0
0.5
1.0
1.5
-1 0 1 2 3 4 5 6
Input DataSynthesis
TIME (SEC)
Accel(G)
Results
Case Amplitude fn(Hz) damp Phase(rad) Delay(sec)
1 0.7306 9.5715 0.0118 3.8999 0.1055
How does the octave rule apply?
12e-mail address
Department/subdivision name
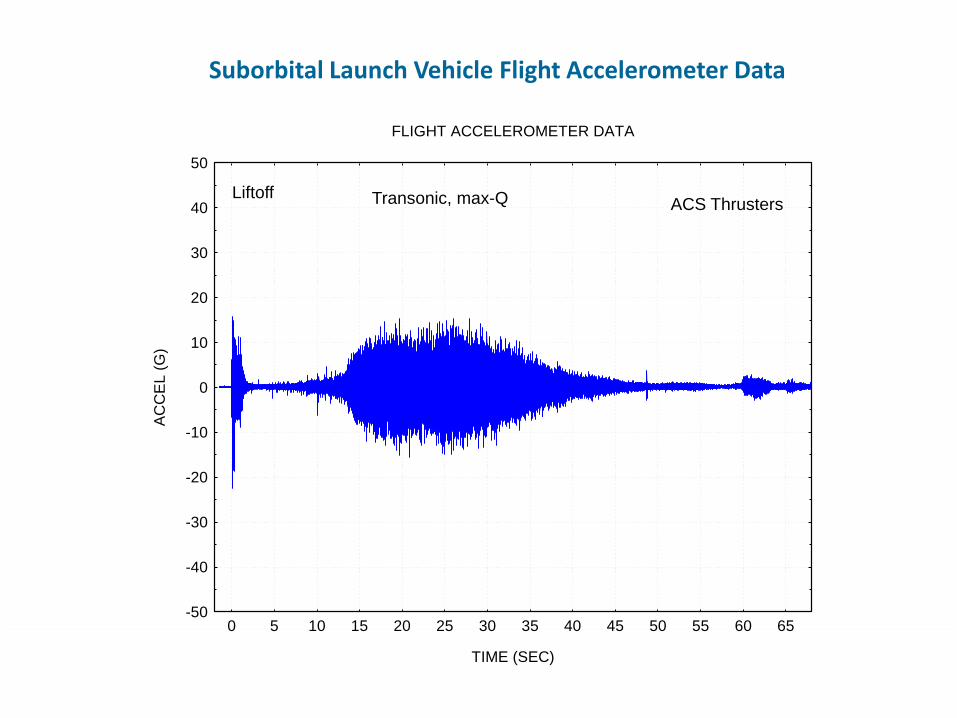
FFT Sound Pressure from an Apache Helicopter Fly-over
Main rotor hub frequency = 5.25 Hz & BPF = 21 Hz (Doppler shifted)

13e-mail address
Department/subdivision name
Sounding Rocket Flight Accelerometer Data
Waterfall FFT Ch 1 X-axis 36.258 Mission
Frequency (Hz)
Time (sec)
Waterfall FFT 3D Plot - Time, Frequency, Magnitude
Fundamental body-bending frequency 10 to 13 Hz.
Rigid-body rotation frequency at 4 Hz.
Terrier-Black Brant

14e-mail address
Department/subdivision name
Power Spectral Density
NAVMAT P9492 level
Learn how to calculate the overall GRMS level
G^2/Hz is really GRMS^2/Hz
15e-mail address
Department/subdivision name
Division/OrganizationJune 7–9, 2011 – 18 point Arial
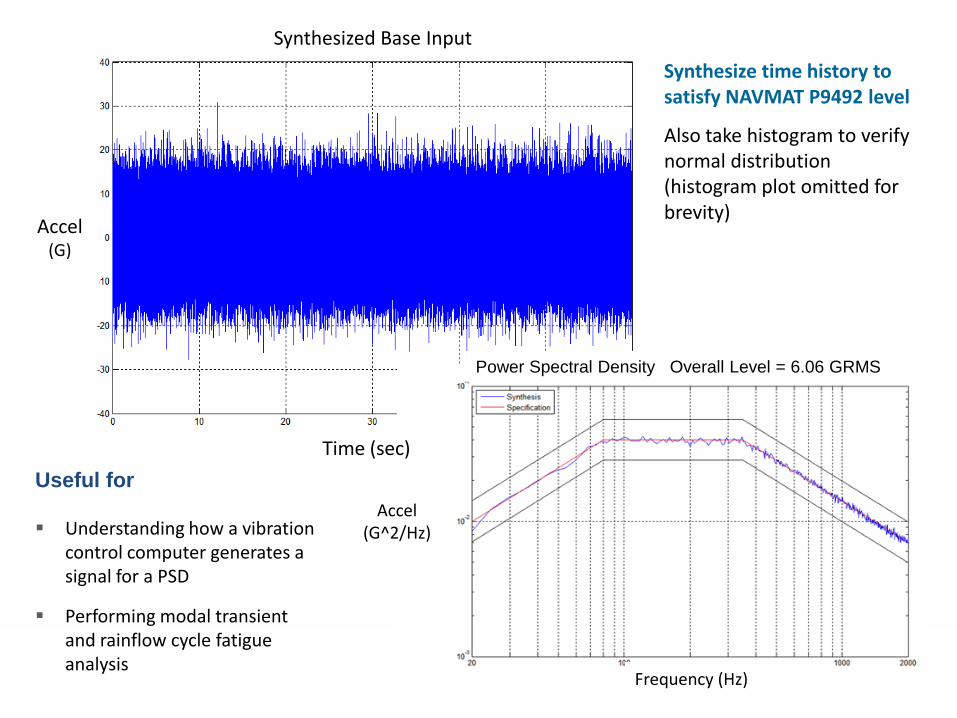
Synthesize time history to satisfy NAVMAT P9492 level
Also take histogram to verify normal distribution (histogram plot omitted for brevity)
Power Spectral Density Overall Level = 6.06 GRMS
Accel(G)
Time (sec)
Accel(G^2/Hz)
Frequency (Hz)
Useful for
Understanding how a vibration control computer generates a signal for a PSD
Performing modal transient and rainflow cycle fatigue analysis
Synthesized Base Input
16e-mail address
Department/subdivision name
Division/OrganizationJune 7–9, 2011 – 18 point Arial
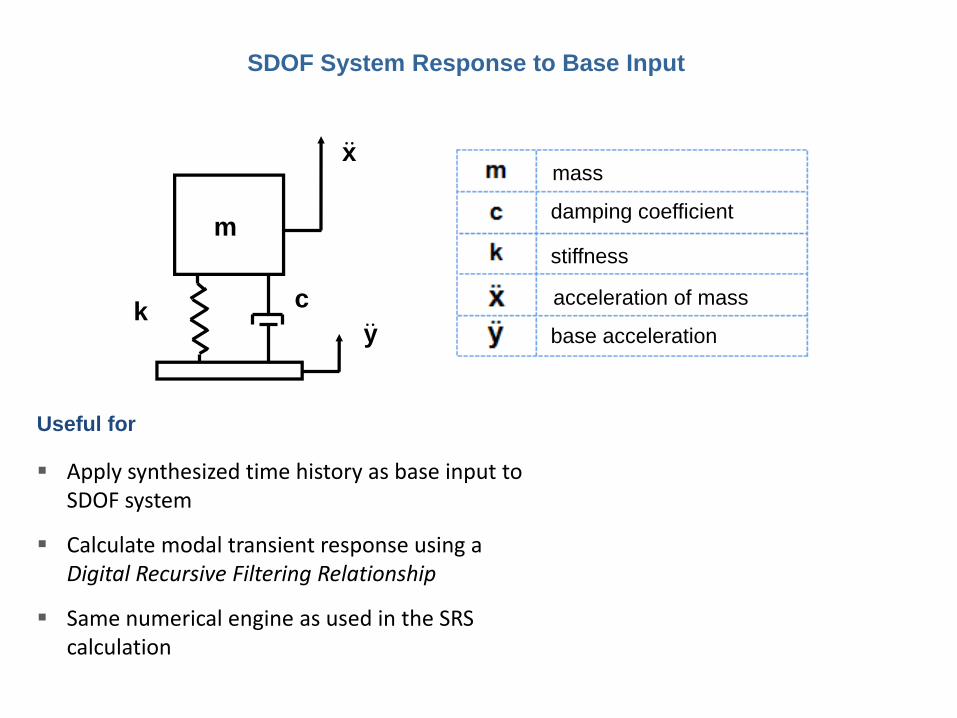
SDOF System Response to Base Input
m
k c
x
y
Useful for
Apply synthesized time history as base input to SDOF system
Calculate modal transient response using a Digital Recursive Filtering Relationship
Same numerical engine as used in the SRS calculation
mass
damping coefficient
stiffness
acceleration of mass
base acceleration
17e-mail address
Department/subdivision name
Division/OrganizationJune 7–9, 2011 – 18 point Arial
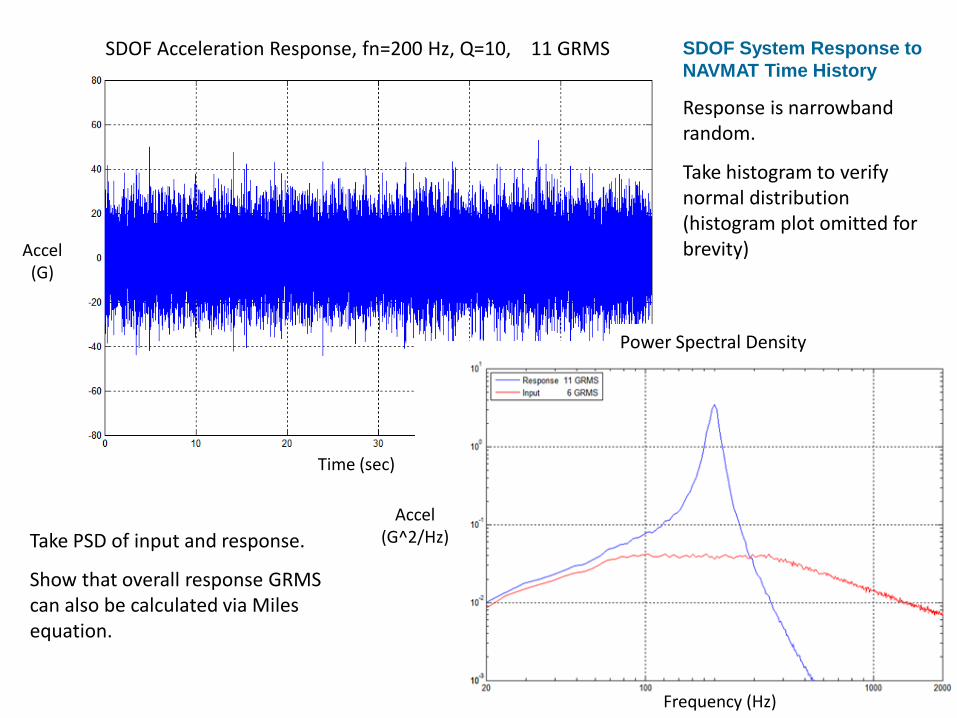
SDOF Acceleration Response, fn=200 Hz, Q=10, 11 GRMS SDOF System Response to
NAVMAT Time History
Response is narrowband random.
Take histogram to verify normal distribution (histogram plot omitted for brevity)
Take PSD of input and response.
Show that overall response GRMS can also be calculated via Miles equation.
Accel(G)
Time (sec)
Accel(G^2/Hz)
Power Spectral Density
Frequency (Hz)

18e-mail address
Department/subdivision name
Division/OrganizationJune 7–9, 2011 – 18 point Arial
Half-power Bandwidth
Q = fn / Δf
fn = natural frequency
Δf = frequency bandwidth for -3 dB points
Q = 200 Hz / 20 Hz
= 10
Power Transmissibility
Frequency20 Hz
Trans
(G^2/G^2)
3 dB

19e-mail address
Department/subdivision name
Shock Response Spectrum
Subject a system of independent SDOF systems to a common base input
fn1 < fn2 < fn3 < … < fn L
20e-mail address
Department/subdivision name
Division/OrganizationJune 7–9, 2011 – 18 point Arial
-20
-15
-10
-5
0
5
10
15
20
0 0.05 0.10 0.15 0.20
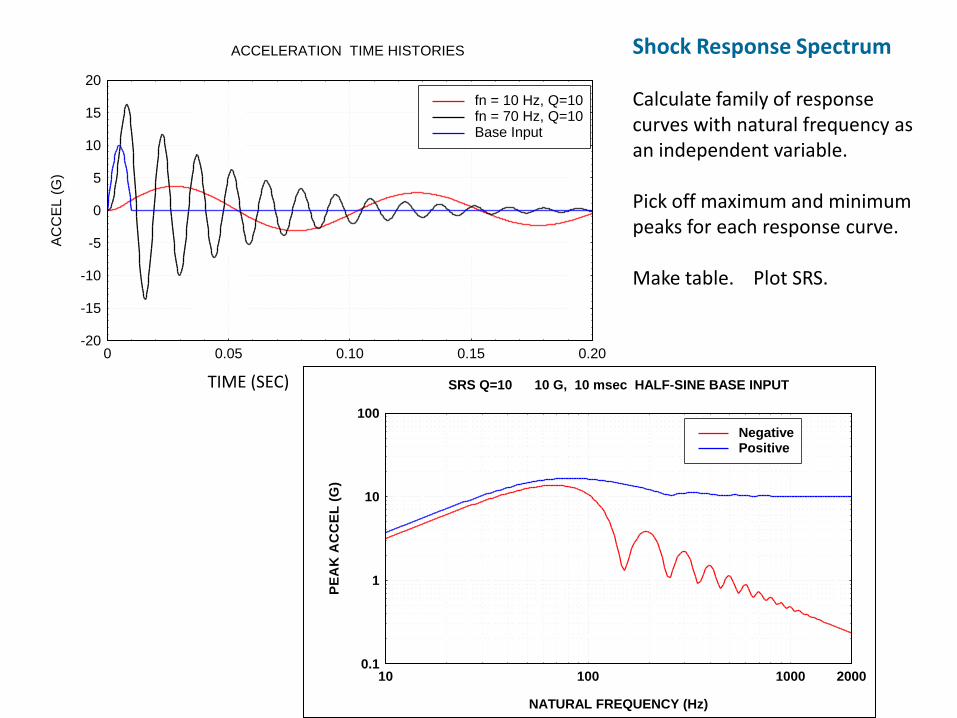
fn = 10 Hz, Q=10fn = 70 Hz, Q=10Base Input
TIME (SEC)
AC
CE
L (
G)
ACCELERATION TIME HISTORIES
TIME (SEC)
0.1
1
10
100
10 100 1000 2000
NegativePositive
NATURAL FREQUENCY (Hz)
PE
AK
AC
CE
L (
G)
SRS Q=10 10 G, 10 msec HALF-SINE BASE INPUT
Shock Response Spectrum
Calculate family of response curves with natural frequency as an independent variable.
Pick off maximum and minimum peaks for each response curve.
Make table. Plot SRS.

21e-mail address
Department/subdivision name
Division/OrganizationJune 7–9, 2011 – 18 point Arial
-20
-15
-10
-5
0
5
10
15
20
0 0.05 0.10 0.15 0.20 0.25
TIME (SEC)A
CC
EL
(G
)
ACCELERATION - WAVELET SERIES
Shaker Shock using Wavelets
Optimized to Minimize Displacement, Velocity & Acceleration
1
10
100
1000
10 100 1000 2000
Spec & TolNegativePostive
NATURAL FREQUENCY (Hz)
PE
AK
AC
CE
L (
G)
SHOCK RESPONSE SPECTRUM Q=10
22e-mail address
Department/subdivision name
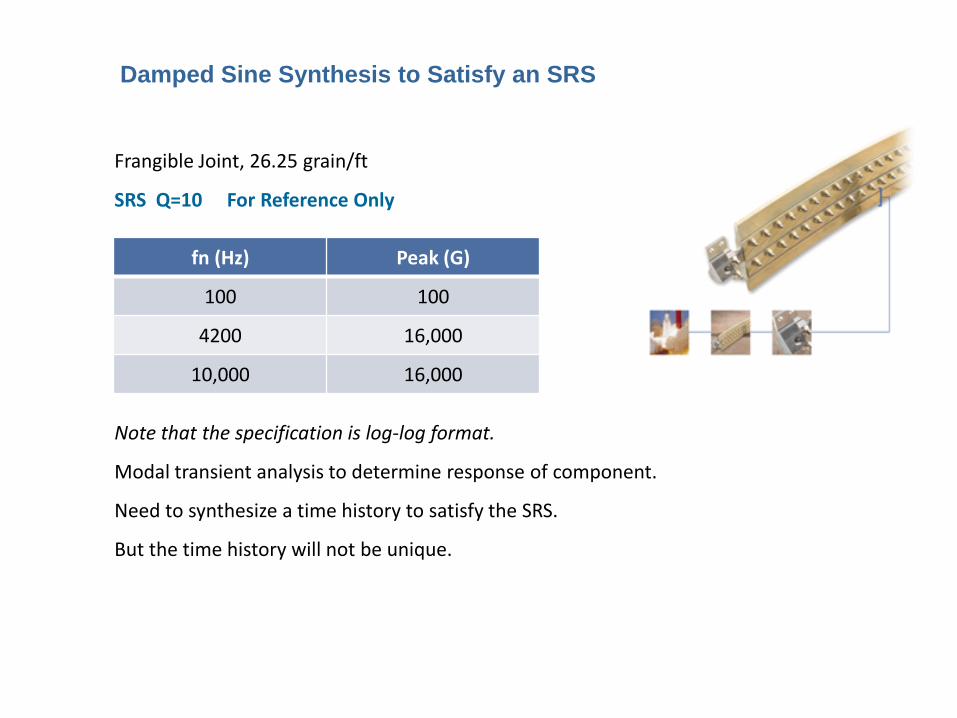
Frangible Joint, 26.25 grain/ft
SRS Q=10 For Reference Only
fn (Hz) Peak (G)
Note that the specification is log-log format.
Modal transient analysis to determine response of component.
Need to synthesize a time history to satisfy the SRS.
But the time history will not be unique.
Damped Sine Synthesis to Satisfy an SRS
fn (Hz) Peak (G)
100 100
4200 16,000
10,000 16,000

23e-mail address
Department/subdivision name
-10000
-5000
0
5000
10000
0 0.01 0.02 0.03
TIME (SEC)
AC
CE
L (
G)
ACCELERATION TIME HISTORY DAMPED SINUSOIDS
102
103
104
105
100 1000 10000
SpecificationNegativePositive
NATURAL FREQUENCY (Hz)
PE
AK
AC
CE
L (
G)
SRS Q=10 DAMPED SINUSOIDSSRS Q=10 DAMPED SINUSOIDS
ACCELERATION TIME HISTORY DAMPED SINUSOIDS
Pyrotechnic Shock Simulation for Modal Transient Analysis
TIME (SEC)
NATURAL FREQUENCY (Hz)
ACCEL (G)
PEAK ACCEL
(G)

24e-mail address
Department/subdivision name
-20000
-15000
-10000
-5000
0
5000
10000
15000
20000
0 0.0001 0.0002 0.0003 0.0004
Decimated, SR=78.125 KHzOriginal, SR = 2.5 MHz
TIME (SEC)
AC
CE
L (
G)
SYNTHESIZED TIME HISTORY, EXAMPLE 2
Aliasing Errors in Signal Analysis - Numerical Experiment
Aliasing occurs in the Decimated time history.
Synthesized Time History – Near Field Shock Simulation
25e-mail address
Department/subdivision name
101
102
103
104
105
102
103
104
105
106
Decimated, SR=78.125 KHzOriginal, SR=2.5 MHz
NATURAL FREQUENCY (Hz)
PE
AK
AC
CE
L (
G)
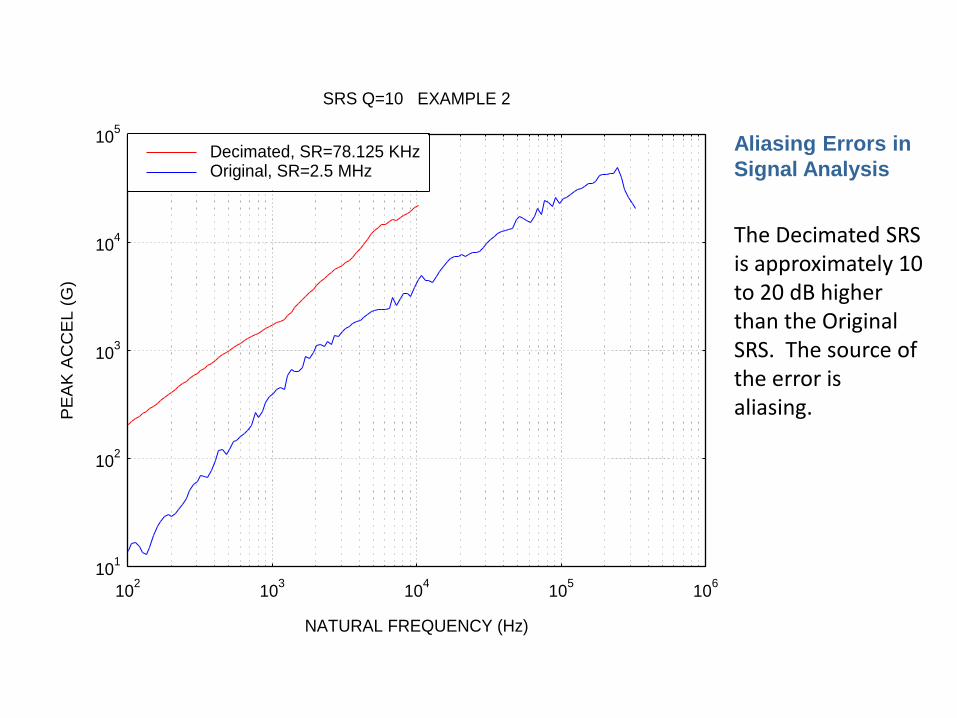
SRS Q=10 EXAMPLE 2
Aliasing Errors in
Signal Analysis
The Decimated SRS is approximately 10 to 20 dB higher than the Original SRS. The source of the error is aliasing.

© The Aerospace Corporation 2010© The Aerospace Corporation 2011
Conclusions
NESC engineers are available to help with design reviews, test support, research projects, flight accelerometer data reduction, etc.
NESC is independently funded
NESC offers shock & vibration training units, which include software programs
How may we serve you?Contact:
Dr. Curtis Larsen Email: [email protected]
Tom Irvine Email: [email protected]