Embed Size (px)
Citation preview
This is an electronic reprint of the original article.This reprint may differ from the original in pagination and typographic detail.
Powered by TCPDF (www.tcpdf.org)
This material is protected by copyright and other intellectual property rights, and duplication or sale of all or part of any of the repository collections is not permitted, except that material may be duplicated by you for your research use or educational purposes in electronic or print form. You must obtain permission for any other use. Electronic or print copies may not be offered, whether for sale or otherwise to anyone who is not an authorised user.
Al-juboori, Raed A.; Naji, Osamah; Bowtell, Les; Alpatova, Alla; Soukane, Sofiane; Ghaffour,NoreddinePower effect of ultrasonically vibrated spacers in air gap membrane distillation : Theoreticaland experimental investigations
Published in:Separation and Purification Technology
DOI:10.1016/j.seppur.2021.118319
Published: 01/05/2021
Document VersionPublisher's PDF, also known as Version of record
Published under the following license:CC BY-NC-ND
Please cite the original version:Al-juboori, R. A., Naji, O., Bowtell, L., Alpatova, A., Soukane, S., & Ghaffour, N. (2021). Power effect ofultrasonically vibrated spacers in air gap membrane distillation : Theoretical and experimental investigations.Separation and Purification Technology, 262, [118319]. https://doi.org/10.1016/j.seppur.2021.118319
Separation and Purification Technology 262 (2021) 118319
Available online 17 January 20211383-5866/© 2021 The Authors. Published by Elsevier B.V. This is an open access article under the CC BY-NC-ND license(http://creativecommons.org/licenses/by-nc-nd/4.0/).
Power effect of ultrasonically vibrated spacers in air gap membrane distillation: Theoretical and experimental investigations
Raed A. Al-juboori a,b,*, Osamah Naji b,c, Les Bowtell b, Alla Alpatova d, Sofiane Soukane d, Noreddine Ghaffour d
a Water and Environmental Engineering Research Group, Department of Built Environment, Aalto University, P.O. Box 15200, Aalto FI-00076, Espoo, Finland b Faculty of Health, Engineering and Sciences, University of Southern Queensland, Toowoomba, QLD 4350, Australia c Centre for Technologies for Water and Wastewater, School of Civil and Environmental Engineering, University of Technology Sydney, 15 Broadway, NSW, 2007 d King Abdullah University of Science and Technology (KAUST), Water Desalination and Reuse Center (WDRC), Biological and Environmental Science and Engineering (BESE), 23955-6900 Thuwal, Saudi Arabia
A R T I C L E I N F O
Keywords: AGMD Ultrasonically vibrated spacers Fouling Groundwater RO reject
A B S T R A C T
This study investigates the efficiency of low-power ultrasound in the range of 3.5–30.0 W to improve permeate flux and alleviate membrane fouling in an air–gap membrane distillation (AGMD) system. Natural groundwater and reverse osmosis (RO) reject water were fed into the AGMD system on which fouling experiments were conducted with hydrophobic polyvinylidene fluoride (PVDF) membrane. After 35 h of AGMD system operation with groundwater and RO reject water, fouling caused the permeate flux to decrease by 30% and 40% respec-tively. Concentration polarization, intermediate pore blocking, and cake filtration appear to be the main reasons for flux decline with both feedwater types. Ultrasound application for a short period of 15 min resulted in flux improvement by as high as 400% and 250% for RO reject and groundwater, respectively. Modelling of the heat and mass transfers showed that the flux increase was mainly due to membrane permeability improvements under ultrasonic vibration. Fouling visualisation using Scanning Electron Microscopy revealed that ultrasound effec-tively removed membrane fouling without compromising the membrane’s structure. Importantly, permeate flux improvements with targeted low-power ultrasound appears to be proportionally higher than those of high-power ultrasound applied to the whole system, on a flux improvement per ultrasound W/m2 basis.
1. Introduction
Globally, safe drinking water is an essential component underpin-ning sustainable development goals [1–4]. Freshwater scarcity has become one of the key challenges facing our world, especially in arid and semi-arid regions [5,6]. Hence, recycling wastewater and/or treat-ing brackish water can be an effective remedy for this challenge. Reverse osmosis (RO) is one of the most commonly used technologies for treating these water types [7], however it produces large amounts of brine that require further treatment [8].
There are several techniques used for treating groundwater and RO reject water [9,10]. However, the focus of this study is directed towards the use of membrane technologies. For the RO reject case, the concen-trate is traditionally discharged into the sea or treated with advanced techniques to minimize the amount of waste. Some modified membrane technologies such as shear-enhanced membrane nanofiltration or RO
have recently been reported as potential techniques for treating RO reject water [11]. However, these technologies are quite expensive and need qualified supervision, [12]. Thus, alternative treatments require investigation.
Membrane distillation (MD) is an emerging technology that has the potential for treating various highly saline water sources. Due to recent technology developments, MD has witnessed impressive advancements that now have make it a promising candidate for producing high purity water from heavily contaminated water sources [13,14]. MD is one of the very few purification technologies which can produce high quality distilled water with low thermal energy demand, primarily because it operates under atmospheric pressure within a relatively low tempera-ture range as compared to conventional thermal processes [15,16]. Other advantages include less membrane damage than pressure-driven filtration approaches [17], ability to operate using low grade solar or geothermal energies [18], and great potential to be integrated with
* Corresponding author. E-mail address: [email protected] (R.A. Al-juboori).
Contents lists available at ScienceDirect
Separation and Purification Technology
journal homepage: www.elsevier.com/locate/seppur
https://doi.org/10.1016/j.seppur.2021.118319 Received 1 July 2020; Received in revised form 2 December 2020; Accepted 6 January 2021
Separation and Purification Technology 262 (2021) 118319
2
other processes [18,19]. Just like any other membrane separation process, the MD membrane
is susceptible to fouling which can be caused by organic, inorganic or biological contaminants of the feedwater [20–22]. Membrane fouling alters the membrane surface characteristics by partially or fully blocking pores and forming gel and cake layers [23]. These changes decrease permeate flux and negatively impact permeate quality [20,24]. Sus-taining productivity requires pressure increases inside the feed channel which then in turn can increase the likelihood of pore wetting by reaching the liquid entry pressure (LEP) [25]. In addition to the fouling problem, concentration (CP) and temperature (TP) polarizations can also impede water vapour flux through the membrane. CP reflects the extent of rejected solute accumulation at vicinity of the membrane leading to diffusive back flow to the bulk feed [26]. TP is a phenomenon related to latent heat removal which results in feedwater temperature decline near the membrane surface. This thin layer of feedwater at the membrane surface layer has a temperature below that of the bulk feed [27]. Both of these phenomena reduce the mass transfer driving forces represented by concentration and vapour pressure difference [28]. Thus, developing suitable strategies to tackle these problems in the MD system is imperative.
A number of mitigation techniques have been suggested to reduce fouling, CP and TP issues in MD systems. Some of fouling removal techniques are expensive or not environmentally friendly, such as feedwater pre-treatment and chemical cleaning of the membranes [29,30]. Other methods such as increasing the feedwater flow-rate during hydraulic cleaning [31,32] and use of spacers [33] may cause negative effects on the membrane’s lifespan and also increase the required system energy. CP and TP mitigation techniques include the use of composite membranes impregnated with nanoparticles or creating turbulence near the membrane’s surface by rotating membranes or the use of air sparging [27,34]. These techniques have some shortcomings such as the low stability of nanoparticles in the membrane matrix and associated health concerns [35,36], the high cost of rotating mem-branes, or the loss of membrane contact area and decline of vapour pressure caused by the injected air [34]. There are some other tech-niques that can be used for alleviating TP effects such the use of metallic, self-heating and corrugated membranes [37]. These techniques also have their own inherent issues of high energy requirements for shelf- heating and corrugated membranes and lower flux production of metallic membranes, compared to conventional polymeric membranes. In this study, we propose the use of an in-situ low-power ultrasound vibration for in-line cleaning of the MD membrane and subsequent flux improvements through the induction of hydrodynamic agitation near the membrane surface.
Ultrasound is sound waves with a frequency higher than the human hearing limit of around 16 kHz [38]. Ultrasound propagation through a media creates negative and positive pressure swings that, if the applied energy is high enough (i.e., exceeding the resistance of the medium’s cohesive forces such as viscosity) would result in the creation of bubbles (cavitation) [39]. The travel of sound waves across a medium produces a series of physical and chemical effects. Most of these effects such as micro jets, shock waves and microstreaming occur at a power level higher than the cavitation threshold [40]. The only effect that occurs at a power level lower than the cavitation threshold is the turbulences caused by vibration of the medium being driven by the ultrasound waves (“acoustic streaming”) [41]. The safe ultrasound fouling removal/pre-vention mechanism lies in these non-cavitational effects that do not cause damage to the membrane structure.
Ultrasound cleaning techniques have previously been used for fouling alleviation, although mostly in pressure-driven membrane pro-cesses [42,43]. In fact, there are a number of studies that investigated the application of ultrasound for improving permeability and reducing fouling accumulation in pressure-driven membrane separation processes [44,45]. However, the case is different for MD as the exploration of ultrasound applications for reducing fouling, concentration and
temperature polarization problems is still in its infancy. Most of these studies applied ultrasound indirectly (i.e., in a bath configuration), which can be energy-inefficient due to ultrasound transmission losses through the conveying media [46,47]. Thus, we suggested a novel approach by use of a direct application of low-power ultrasound onto the membrane via metallic spacers. The benefit of this configuration is that we utilize the existing spacers rather than adjusting the membrane module by adding a plate or horn to convey ultrasonic waves. This also makes the integration of ultrasound into an MD setup technically easier than the use of extra vibrating parts. In addition, the low power appli-cation is expected to reduce the risk of membrane damage. This approach was tested in our previous study with the typical air gap MD (AGMD) flow rate and temperature ranges [48]. The encouraging in-crease in the AGMD flux motivated us to conduct a follow up study to provide further insights into this process. A detailed experimental and modelling investigation was carried out to understand the effects of ultrasound on vapour transport across the membrane and explore the energy saving benefits of extending the applied ultrasonic power range.
2. Ultrasound effects on mass-transfer, theoretical considerations
Low-power ultrasound is a term used in this study to refer to ultra-sonic power which is below the cavitational threshold of the tested medium. To confirm that the power level applied in this study is low, the Blake threshold was calculated by applying Eqs. (1) and (2). If the generated ultrasonic pressure is lower than this threshold, the occur-rence of cavitation is unlikely and ultrasonic effects can therefore be represented by acoustic streaming only.
Pb = Po +23
(2σ/Ro)3
3(Po + 2σ/Ro)
√
(1)
PA =2IρC
√(2)
where Pb is the cavitation threshold pressure (Blake threshold) (Pa), Po is the pressure of the water without any ultrasound effects (Pa), σ is the water surface tension (N/m), Ro is the initial bubble radius (m), PA is the acoustic pressure (Pa), C is the sound velocity in the irradiated medium (m/s), ρ is the fluid density (kg/m3) and I is the ultrasonic intensity (W/ m2).
After identifying the nature of the ultrasonic effect, it is important to study how ultrasound affects mass and heat transfer within the AGMD system. The overall mass transfer across the MD membrane can be expressed by Eq. (3) [28]:
J = KΔP (3)
where J is the permeate flux (kg/m2.s), K is the membrane permeability (s.m−1) and ΔP is the pressure difference between the extremities of the hot and cold sides (Pa).
Vapour transfer through a porous membrane takes place through three possible mechanisms: molecular (Fickian) diffusion, Knudsen diffusion and Poiseuille (convective) flow [49]. Poiseuille flow occurs in deaerated pores caused by temperature-induced vapour pressure gra-dients or in a vacuum, and hence it is not applicable to AGMD [28]. The prominent transfer mechanism can be identified through computing Knudsen number (Kn) from Eqs. (4) and (5) [20]:
Kn =λdp
(4)
λ =KBTav
π[0.5(σw + σa) ]2Pt
.1
[
1 + MwMa
]0.5 (5)
where λ is the mean free path (m), dp is the pore diameter (m), KB is
R.A. Al-juboori et al.
Separation and Purification Technology 262 (2021) 118319
3
Boltzmann’s constant, 1.38 × 10⁻²³ (J/K), σw and σa are collision di-ameters (m) of water (2.7 × 10⁻¹⁰) and air (3.7 × 10⁻¹⁰), respectively, Pt the total gas pressure in the membrane pores (Pa), Ma is the molecular weight of air (~29 kg/kmol) and Mw is the molecular weight of water (18 kg/kmol).
If Kn < 0.01, the molecular diffusion is the dominating mechanism. If 0.01 < Kn < 10, the diffusion of the vapour falls in the molecular- Knudsen diffusion region. For Kn > 10, the vapour transfer across the membrane follows the Knudsen diffusion mechanism [28,50]. With a membrane pore diameter of 0.3 µm, the likely flow mechanism is molecular-Knudsen diffusion [51], and this will be discussed further in the results and discussion section where the calculated Kn for the set parameters of this study will be presented.
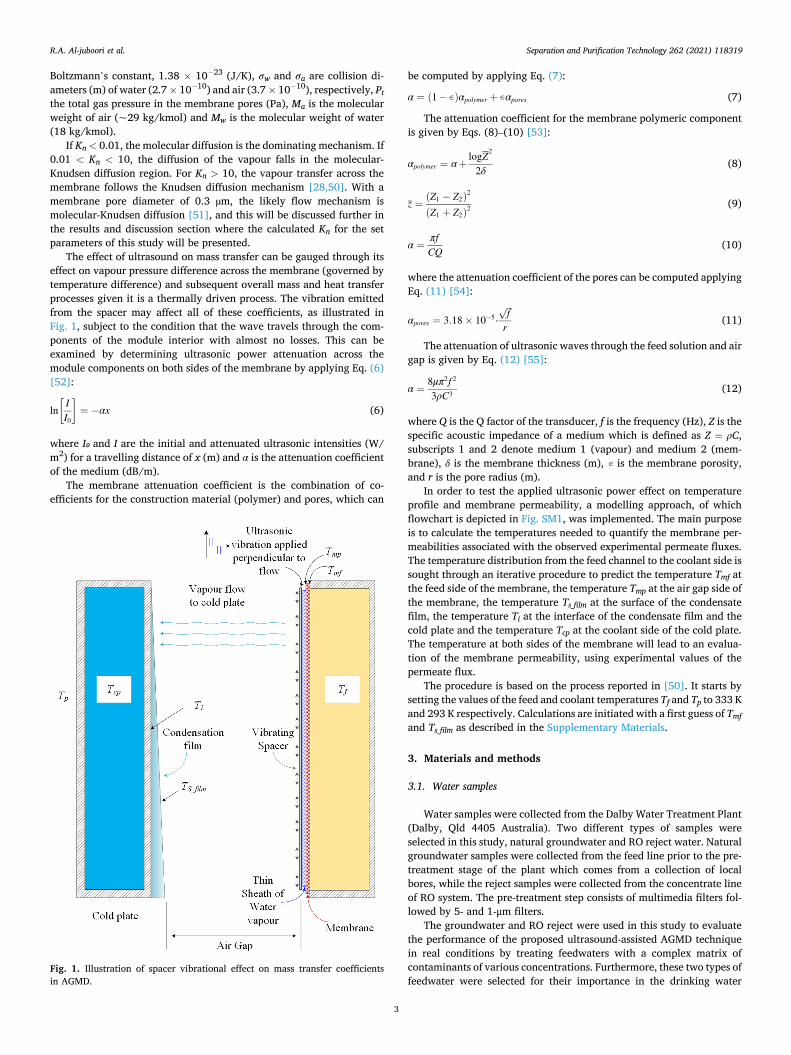
The effect of ultrasound on mass transfer can be gauged through its effect on vapour pressure difference across the membrane (governed by temperature difference) and subsequent overall mass and heat transfer processes given it is a thermally driven process. The vibration emitted from the spacer may affect all of these coefficients, as illustrated in Fig. 1, subject to the condition that the wave travels through the com-ponents of the module interior with almost no losses. This can be examined by determining ultrasonic power attenuation across the module components on both sides of the membrane by applying Eq. (6) [52]:
ln[
II0
]
= −αx (6)
where I₀ and I are the initial and attenuated ultrasonic intensities (W/ m2) for a travelling distance of x (m) and α is the attenuation coefficient of the medium (dB/m).
The membrane attenuation coefficient is the combination of co-efficients for the construction material (polymer) and pores, which can
be computed by applying Eq. (7):
α = (1 − ∊)αpolymer + ∊αpores (7)
The attenuation coefficient for the membrane polymeric component is given by Eqs. (8)–(10) [53]:
αpolymer = α +logZ2
2δ(8)
z =(Z1 − Z2)
2
(Z1 + Z2)2 (9)
α =πfCQ
(10)
where the attenuation coefficient of the pores can be computed applying Eq. (11) [54]:
αpores = 3.18 × 10⁻⁵⋅f
√
r(11)
The attenuation of ultrasonic waves through the feed solution and air gap is given by Eq. (12) [55]:
α =8μπ2f 2
3ρC3 (12)
where Q is the Q factor of the transducer, f is the frequency (Hz), Z is the specific acoustic impedance of a medium which is defined as Z = ρC, subscripts 1 and 2 denote medium 1 (vapour) and medium 2 (mem-brane), δ is the membrane thickness (m), ∊ is the membrane porosity, and r is the pore radius (m).
In order to test the applied ultrasonic power effect on temperature profile and membrane permeability, a modelling approach, of which flowchart is depicted in Fig. SM1, was implemented. The main purpose is to calculate the temperatures needed to quantify the membrane per-meabilities associated with the observed experimental permeate fluxes. The temperature distribution from the feed channel to the coolant side is sought through an iterative procedure to predict the temperature Tmf at the feed side of the membrane, the temperature Tmp at the air gap side of the membrane, the temperature Ts_film at the surface of the condensate film, the temperature Ti at the interface of the condensate film and the cold plate and the temperature Tcp at the coolant side of the cold plate. The temperature at both sides of the membrane will lead to an evalua-tion of the membrane permeability, using experimental values of the permeate flux.
The procedure is based on the process reported in [50]. It starts by setting the values of the feed and coolant temperatures Tf and Tp to 333 K and 293 K respectively. Calculations are initiated with a first guess of Tmf and Ts_film as described in the Supplementary Materials.
3. Materials and methods
3.1. Water samples
Water samples were collected from the Dalby Water Treatment Plant (Dalby, Qld 4405 Australia). Two different types of samples were selected in this study, natural groundwater and RO reject water. Natural groundwater samples were collected from the feed line prior to the pre- treatment stage of the plant which comes from a collection of local bores, while the reject samples were collected from the concentrate line of RO system. The pre-treatment step consists of multimedia filters fol-lowed by 5- and 1-μm filters.
The groundwater and RO reject were used in this study to evaluate the performance of the proposed ultrasound-assisted AGMD technique in real conditions by treating feedwaters with a complex matrix of contaminants of various concentrations. Furthermore, these two types of feedwater were selected for their importance in the drinking water
Fig. 1. Illustration of spacer vibrational effect on mass transfer coefficients in AGMD.
R.A. Al-juboori et al.
Separation and Purification Technology 262 (2021) 118319
4
industry. Groundwater is regarded as a major source of drinking water in large parts of the world [56], while RO reject poses a significant problem as it is produced in large quantities during water desalination and needs to be properly utilized to avoid any negative environmental impacts [8]. A summary of the physicochemical characteristics of these water sam-ples is presented in Table 1.
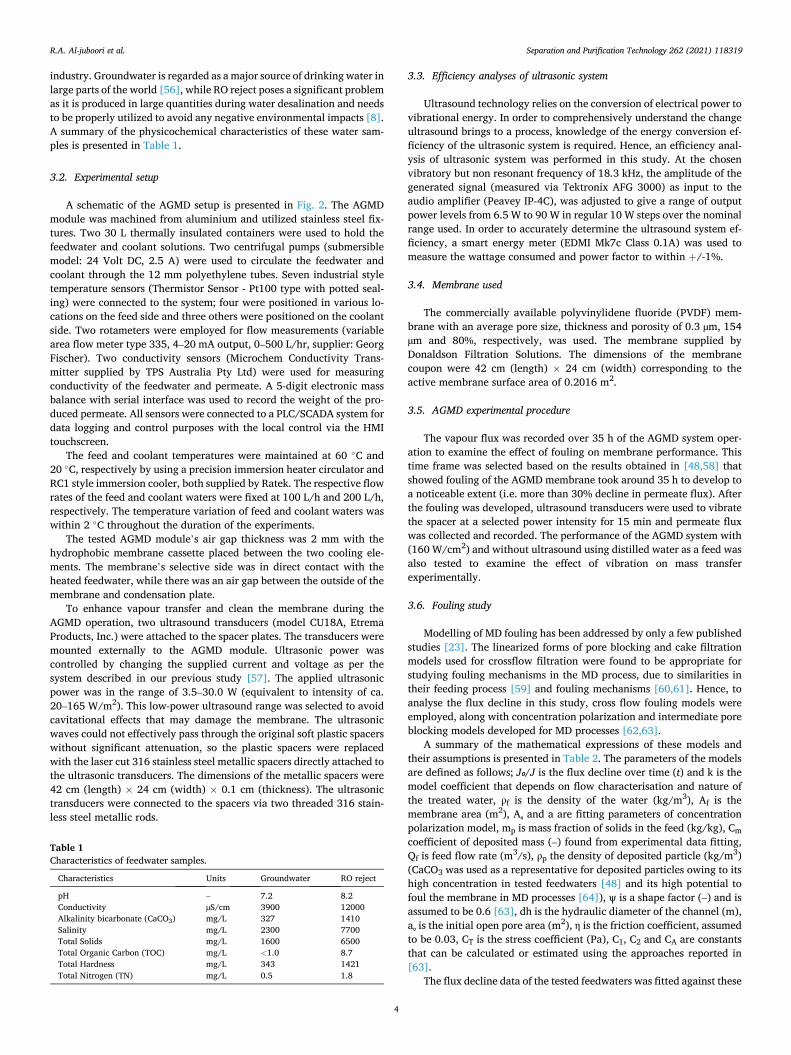
3.2. Experimental setup
A schematic of the AGMD setup is presented in Fig. 2. The AGMD module was machined from aluminium and utilized stainless steel fix-tures. Two 30 L thermally insulated containers were used to hold the feedwater and coolant solutions. Two centrifugal pumps (submersible model: 24 Volt DC, 2.5 A) were used to circulate the feedwater and coolant through the 12 mm polyethylene tubes. Seven industrial style temperature sensors (Thermistor Sensor - Pt100 type with potted seal-ing) were connected to the system; four were positioned in various lo-cations on the feed side and three others were positioned on the coolant side. Two rotameters were employed for flow measurements (variable area flow meter type 335, 4–20 mA output, 0–500 L/hr, supplier: Georg Fischer). Two conductivity sensors (Microchem Conductivity Trans-mitter supplied by TPS Australia Pty Ltd) were used for measuring conductivity of the feedwater and permeate. A 5-digit electronic mass balance with serial interface was used to record the weight of the pro-duced permeate. All sensors were connected to a PLC/SCADA system for data logging and control purposes with the local control via the HMI touchscreen.
The feed and coolant temperatures were maintained at 60 ◦C and 20 ◦C, respectively by using a precision immersion heater circulator and RC1 style immersion cooler, both supplied by Ratek. The respective flow rates of the feed and coolant waters were fixed at 100 L/h and 200 L/h, respectively. The temperature variation of feed and coolant waters was within 2 ◦C throughout the duration of the experiments.
The tested AGMD module’s air gap thickness was 2 mm with the hydrophobic membrane cassette placed between the two cooling ele-ments. The membrane’s selective side was in direct contact with the heated feedwater, while there was an air gap between the outside of the membrane and condensation plate.
To enhance vapour transfer and clean the membrane during the AGMD operation, two ultrasound transducers (model CU18A, Etrema Products, Inc.) were attached to the spacer plates. The transducers were mounted externally to the AGMD module. Ultrasonic power was controlled by changing the supplied current and voltage as per the system described in our previous study [57]. The applied ultrasonic power was in the range of 3.5–30.0 W (equivalent to intensity of ca. 20–165 W/m2). This low-power ultrasound range was selected to avoid cavitational effects that may damage the membrane. The ultrasonic waves could not effectively pass through the original soft plastic spacers without significant attenuation, so the plastic spacers were replaced with the laser cut 316 stainless steel metallic spacers directly attached to the ultrasonic transducers. The dimensions of the metallic spacers were 42 cm (length) × 24 cm (width) × 0.1 cm (thickness). The ultrasonic transducers were connected to the spacers via two threaded 316 stain-less steel metallic rods.
3.3. Efficiency analyses of ultrasonic system
Ultrasound technology relies on the conversion of electrical power to vibrational energy. In order to comprehensively understand the change ultrasound brings to a process, knowledge of the energy conversion ef-ficiency of the ultrasonic system is required. Hence, an efficiency anal-ysis of ultrasonic system was performed in this study. At the chosen vibratory but non resonant frequency of 18.3 kHz, the amplitude of the generated signal (measured via Tektronix AFG 3000) as input to the audio amplifier (Peavey IP-4C), was adjusted to give a range of output power levels from 6.5 W to 90 W in regular 10 W steps over the nominal range used. In order to accurately determine the ultrasound system ef-ficiency, a smart energy meter (EDMI Mk7c Class 0.1A) was used to measure the wattage consumed and power factor to within +/-1%.
3.4. Membrane used
The commercially available polyvinylidene fluoride (PVDF) mem-brane with an average pore size, thickness and porosity of 0.3 µm, 154 µm and 80%, respectively, was used. The membrane supplied by Donaldson Filtration Solutions. The dimensions of the membrane coupon were 42 cm (length) × 24 cm (width) corresponding to the active membrane surface area of 0.2016 m2.
3.5. AGMD experimental procedure
The vapour flux was recorded over 35 h of the AGMD system oper-ation to examine the effect of fouling on membrane performance. This time frame was selected based on the results obtained in [48,58] that showed fouling of the AGMD membrane took around 35 h to develop to a noticeable extent (i.e. more than 30% decline in permeate flux). After the fouling was developed, ultrasound transducers were used to vibrate the spacer at a selected power intensity for 15 min and permeate flux was collected and recorded. The performance of the AGMD system with (160 W/cm2) and without ultrasound using distilled water as a feed was also tested to examine the effect of vibration on mass transfer experimentally.
3.6. Fouling study
Modelling of MD fouling has been addressed by only a few published studies [23]. The linearized forms of pore blocking and cake filtration models used for crossflow filtration were found to be appropriate for studying fouling mechanisms in the MD process, due to similarities in their feeding process [59] and fouling mechanisms [60,61]. Hence, to analyse the flux decline in this study, cross flow fouling models were employed, along with concentration polarization and intermediate pore blocking models developed for MD processes [62,63].
A summary of the mathematical expressions of these models and their assumptions is presented in Table 2. The parameters of the models are defined as follows; J₀/J is the flux decline over time (t) and k is the model coefficient that depends on flow characterisation and nature of the treated water, ρf is the density of the water (kg/m3), Af is the membrane area (m2), A₀ and a are fitting parameters of concentration polarization model, mp is mass fraction of solids in the feed (kg/kg), Cm coefficient of deposited mass (–) found from experimental data fitting, Qf is feed flow rate (m3/s), ρp the density of deposited particle (kg/m3) (CaCO3 was used as a representative for deposited particles owing to its high concentration in tested feedwaters [48] and its high potential to foul the membrane in MD processes [64]), ψ is a shape factor (–) and is assumed to be 0.6 [63], dh is the hydraulic diameter of the channel (m), a₀ is the initial open pore area (m2), η is the friction coefficient, assumed to be 0.03, CT is the stress coefficient (Pa), C1, C2 and CA are constants that can be calculated or estimated using the approaches reported in [63].
The flux decline data of the tested feedwaters was fitted against these
Table 1 Characteristics of feedwater samples.
Characteristics Units Groundwater RO reject
pH – 7.2 8.2 Conductivity µS/cm 3900 12000 Alkalinity bicarbonate (CaCO3) mg/L 327 1410 Salinity mg/L 2300 7700 Total Solids mg/L 1600 6500 Total Organic Carbon (TOC) mg/L <1.0 8.7 Total Hardness mg/L 343 1421 Total Nitrogen (TN) mg/L 0.5 1.8
R.A. Al-juboori et al.
Separation and Purification Technology 262 (2021) 118319
5
models to help in identifying the prominent fouling mechanism that might have occurred during the fouling experiments. The goodness of a model’s fit was evaluated by calculating the coefficient of determination (R2) and sum of squared residual errors (SSE).
3.7. Surface morphology analysis and water quality
A scanning electron microscope (SEM Model JCM-6000 BENCHTOP, supplied by JEOL) was employed to examine the membrane surface for fouling accumulation and possible damage that may have occurred as a result of ultrasound application. Permeate conductivity was also moni-tored to check the membrane integrity after the application of ultrasound.
4. Results and discussion
4.1. Membrane fouling analysis
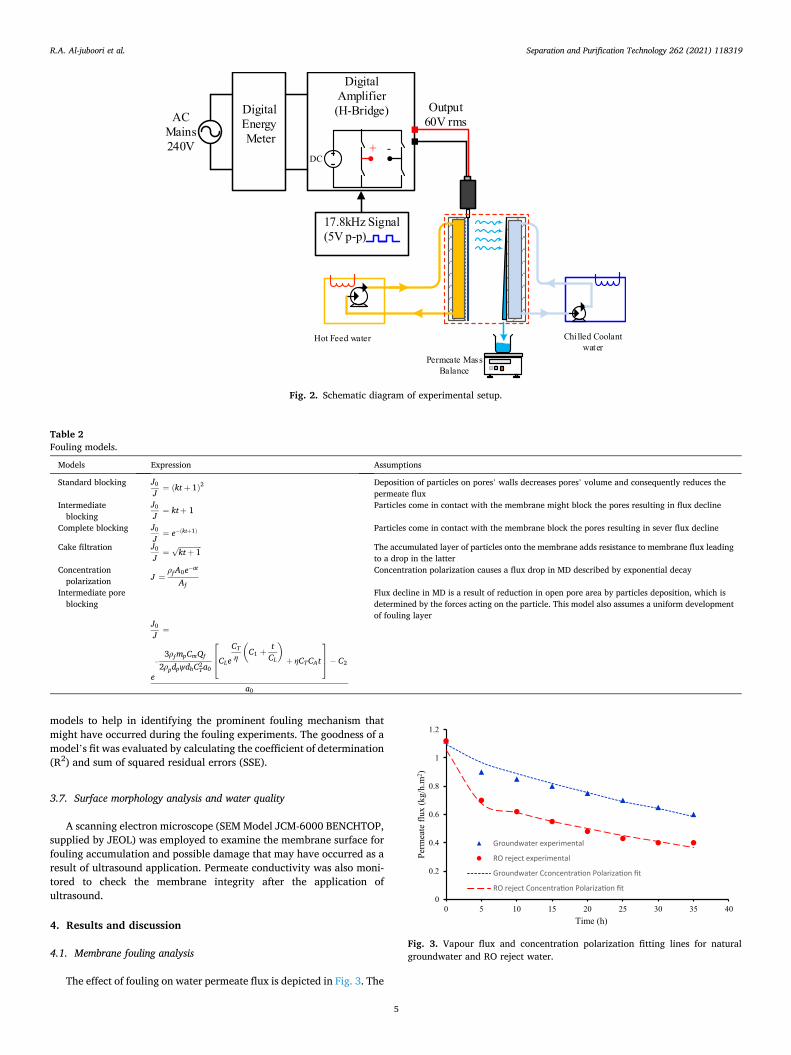
The effect of fouling on water permeate flux is depicted in Fig. 3. The
Digital Amplifier(H-Bridge)AC
Mains240V
Digital Energy Meter
Output60V rms
DC+ -
17.8kHz Signal (5V p-p)
Hot Feed water Chilled Coolant water
Permeate Mass Balance
Fig. 2. Schematic diagram of experimental setup.
Table 2 Fouling models.
Models Expression Assumptions
Standard blocking J0
J= (kt + 1)
2 Deposition of particles on pores’ walls decreases pores’ volume and consequently reduces the permeate flux
Intermediate blocking
J0
J= kt + 1 Particles come in contact with the membrane might block the pores resulting in flux decline
Complete blocking J0
J= e−(kt+1) Particles come in contact with the membrane block the pores resulting in sever flux decline
Cake filtration J0
J=
kt + 1
√ The accumulated layer of particles onto the membrane adds resistance to membrane flux leading to a drop in the latter
Concentration polarization J =
ρf A0e−at
Af
Concentration polarization causes a flux drop in MD described by exponential decay
Intermediate pore blocking
J0
J=
e
−
3ρf mpCmQf
2ρpdpψdhC2Ta0
⎡
⎢⎣CLe
CT
η
(
C1 +t
CL
)
+ ηCTCAt
⎤
⎥⎦ − C2
a0
Flux decline in MD is a result of reduction in open pore area by particles deposition, which is determined by the forces acting on the particle. This model also assumes a uniform development of fouling layer
0
0.2
0.4
0.6
0.8
1
1.2
0 5 10 15 20 25 30 35 40
Perm
eate
flux
(kg/
h.m
2 )
Time (h)
Groundwater experimental
RO reject experimental
Groundwater Cconcentration Polarization fit
RO reject Concentration Polarization fit
Fig. 3. Vapour flux and concentration polarization fitting lines for natural groundwater and RO reject water.
R.A. Al-juboori et al.
Separation and Purification Technology 262 (2021) 118319
6
goal of this experiment was to (1) investigate the membrane perfor-mance with two feedwater types and (2) to foul the membrane for subsequent testing of ultrasound capacity for membrane cleaning and flux improvement. As shown in Fig. 3, the highest drop in the flux was observed in the first 5 h with a reduction of 19.6% for groundwater and 37.5% for RO reject. The permeate flux of the PVDF membrane was reduced after that by approximately 5% − 9% and 7% − 12% every 5 h for groundwater and RO reject, respectively. The development of membrane fouling measured by the decrease in vapour flux showed a similar trend for both feedwaters. However, the permeate flux of groundwater was higher than that of the RO reject. This can be attrib-uted to the higher salinity of RO reject (7700 mg/L) as opposed to groundwater (2300 mg/L). In addition to salinity, other constituents such as organic matter and solids can also contribute to flux decline [65,66]. Groundwater samples used in this study contained 1600 mg/L of total solids and TOC of <1 mg/L in comparison to RO reject with significantly higher total solids (6500 mg/L) and TOC (8.7 mg/L). A similar trend was observed in previous studies [67,68] where the feed salinity was found to have a strong negative impact on the permeate flux of AGMD process. The increase in feed salinity reduces vapour pressure on the feedwater side and consequently decreases the resultant permeate flux [29]. Other parameters such as the presence of organic compounds and impurities in the feedwater could be responsible for the observed decline in permeate flux [69].
The permeate flux obtained with groundwater is smaller compared to the flux normally achieved with traditional separation technologies such as RO that could be several folds higher depending on quality of the treated water and operating conditions. However, MD can treat highly saline effluents that cannot be handled by other well-established tech-nologies including RO. Nevertheless, in order for MD to become economically feasible, it needs to be operated with low-grade energy sources or in combination with other separation technologies [19]. In fact, attempting to improve the treatability of RO reject with AGMD using ultrasound technology is inspired by the hybridization concept. The key parameter to improve MD competitiveness among other mem-brane technologies is to increase its yield without compromising the quality of the produced water or significantly increasing its capital or operational cost [70]. This can be achieved through many ways such as developing membrane modules with high resistance to fouling or improving mass transfer across the membrane. These two options represent the focus of this study where ultrasound is used to mitigate fouling problems and enhance vapour passage through the membrane pores.
The mechanism associated with the flux decline of groundwater and RO reject were estimated through fitting of the experimental data against each of the fouling models presented in Table 2, as illustrated in Figs. 3 and 4. The R2 and SSE of the fitted models to the experimental data are presented in Table 3. It can be seen from Fig. 4 and Table 2 that complete pore blocking is an unlikely mechanism of the observed fouling in this study for both feedwaters. Concentration polarization model fits well the flux decline of both feedwaters with high R2 and low SSE as shown in Fig. 3 and Table 3. When considering cross flow filtration and MD models, intermediate pore blocking showed good agreement with the experimental data for both feedwaters. For cake filtration, the fitted model values for flux decline were very close to the experimental ones for the RO reject (R2 = 0.98), however, the case was different for groundwater were fitted values indicated slightly lower flux decline. This suggests that concentration polarization is the likely common prominent mechanisms for flux decline for both feedwaters. The other prevailing fouling mechanism for RO reject was cake forma-tion, while for groundwater was intermediate pore blocking. This could be explained by the high foulants concentration in RO reject compared to groundwater that could promote pore blocking and development of cake layer. The results obtained in this study are in agreement with the results reported in the literature. Based on the general consensus in the literature, concentration polarization is one of the main causes for flux
decline in MD process [71]. Wong et al. [72] found that the intermediate pore blocking model provided the best fit for direct contact MD fouling with TiO2 nanoparticles where solids was the major contaminant which is similar to the case of the groundwater sample in this study. Similarly, a recent study conducted by Laqbaqbi et al. [73] has proven experi-mentally with atomic force microscope measurements the occurrence of partial pore blocking and pore volume reduction as the prominent fouling mechanisms for membrane distillation with synthetic textile wastewater samples. Cake formation is another form of fouling that was previously observed in MD process, especially in the presence of fair amounts of carbon and nitrogen in the feed solution [23,74,75], similar to the RO reject used in this study.
4.2. Effect of ultrasonic power on AGMD permeate flux
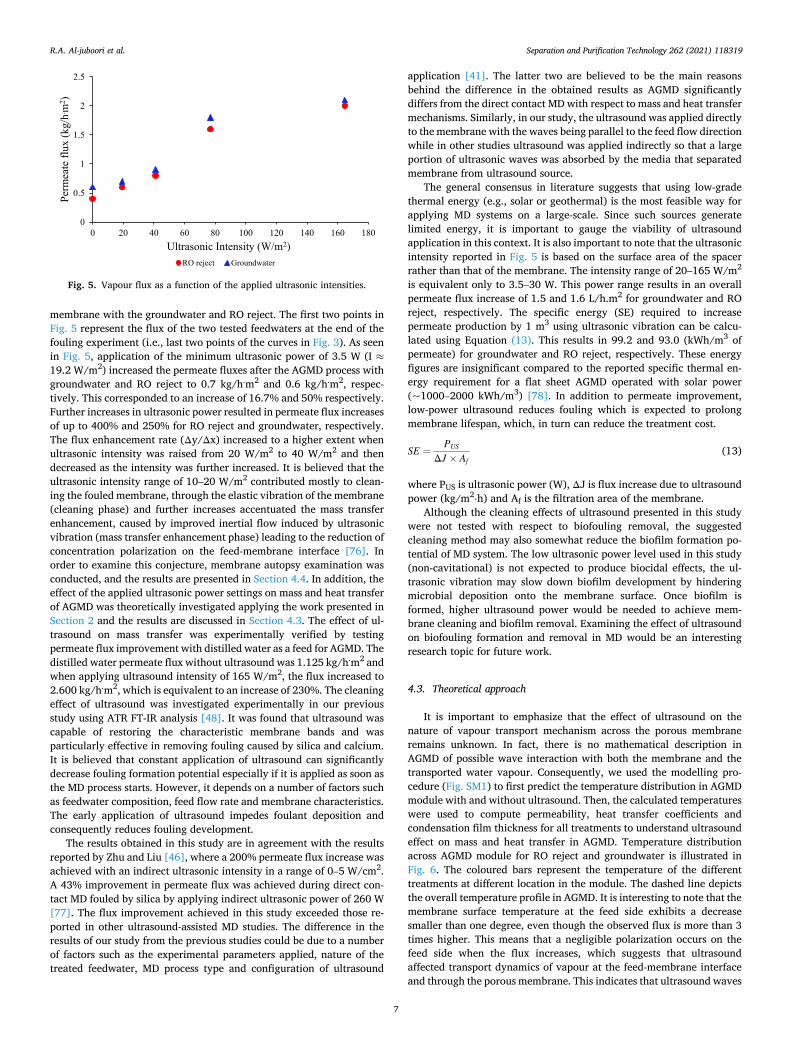
Fig. 5 shows the effect of ultrasonic power on permeate flux of PVDF
(a)
(b)
0
0.4
0.8
1.2
1.6
2
2.4
2.8
0 5 10 15 20 25 30 35 40
J/J
Time (h)
ExperimentalStandard blockingIntermediate blockingComplete blockingCake filtrationMD Intermediate pore blocking
0
0.4
0.8
1.2
1.6
2
2.4
2.8
0 5 10 15 20 25 30 35 40
J/J
Time (h)
ExperimentalStandard blockingIntermediate blockingComplete blockingCake filtrationMD Intermediate pore blocking
Fig. 4. Experimental values vs fitted fouling models’ values of flux decline for (a) RO reject and (b) groundwater.
Table 3 Models goodness of fit parameters.
Models RO reject Groundwater
Cross flow R2 SSE R2 SSE
Standard blocking 0.85 0.20 0.90 0.05 Intermediate blocking 0.90 0.11 0.92 0.04 Complete blocking 0.48 7.15 0.58 6.35 Cake filtration 0.98 0.03 0.90 0.02 MD Concentration polarization 0.97 0.04 0.97 0.01 Intermediate pore blocking 0.84 0.35 0.84 0.21
R.A. Al-juboori et al.
Separation and Purification Technology 262 (2021) 118319
7
membrane with the groundwater and RO reject. The first two points in Fig. 5 represent the flux of the two tested feedwaters at the end of the fouling experiment (i.e., last two points of the curves in Fig. 3). As seen in Fig. 5, application of the minimum ultrasonic power of 3.5 W (I ≈19.2 W/m2) increased the permeate fluxes after the AGMD process with groundwater and RO reject to 0.7 kg/h.m2 and 0.6 kg/h.m2, respec-tively. This corresponded to an increase of 16.7% and 50% respectively. Further increases in ultrasonic power resulted in permeate flux increases of up to 400% and 250% for RO reject and groundwater, respectively. The flux enhancement rate (Δy/Δx) increased to a higher extent when ultrasonic intensity was raised from 20 W/m2 to 40 W/m2 and then decreased as the intensity was further increased. It is believed that the ultrasonic intensity range of 10–20 W/m2 contributed mostly to clean-ing the fouled membrane, through the elastic vibration of the membrane (cleaning phase) and further increases accentuated the mass transfer enhancement, caused by improved inertial flow induced by ultrasonic vibration (mass transfer enhancement phase) leading to the reduction of concentration polarization on the feed-membrane interface [76]. In order to examine this conjecture, membrane autopsy examination was conducted, and the results are presented in Section 4.4. In addition, the effect of the applied ultrasonic power settings on mass and heat transfer of AGMD was theoretically investigated applying the work presented in Section 2 and the results are discussed in Section 4.3. The effect of ul-trasound on mass transfer was experimentally verified by testing permeate flux improvement with distilled water as a feed for AGMD. The distilled water permeate flux without ultrasound was 1.125 kg/h.m2 and when applying ultrasound intensity of 165 W/m2, the flux increased to 2.600 kg/h.m2, which is equivalent to an increase of 230%. The cleaning effect of ultrasound was investigated experimentally in our previous study using ATR FT-IR analysis [48]. It was found that ultrasound was capable of restoring the characteristic membrane bands and was particularly effective in removing fouling caused by silica and calcium. It is believed that constant application of ultrasound can significantly decrease fouling formation potential especially if it is applied as soon as the MD process starts. However, it depends on a number of factors such as feedwater composition, feed flow rate and membrane characteristics. The early application of ultrasound impedes foulant deposition and consequently reduces fouling development.
The results obtained in this study are in agreement with the results reported by Zhu and Liu [46], where a 200% permeate flux increase was achieved with an indirect ultrasonic intensity in a range of 0–5 W/cm2. A 43% improvement in permeate flux was achieved during direct con-tact MD fouled by silica by applying indirect ultrasonic power of 260 W [77]. The flux improvement achieved in this study exceeded those re-ported in other ultrasound-assisted MD studies. The difference in the results of our study from the previous studies could be due to a number of factors such as the experimental parameters applied, nature of the treated feedwater, MD process type and configuration of ultrasound
application [41]. The latter two are believed to be the main reasons behind the difference in the obtained results as AGMD significantly differs from the direct contact MD with respect to mass and heat transfer mechanisms. Similarly, in our study, the ultrasound was applied directly to the membrane with the waves being parallel to the feed flow direction while in other studies ultrasound was applied indirectly so that a large portion of ultrasonic waves was absorbed by the media that separated membrane from ultrasound source.
The general consensus in literature suggests that using low-grade thermal energy (e.g., solar or geothermal) is the most feasible way for applying MD systems on a large-scale. Since such sources generate limited energy, it is important to gauge the viability of ultrasound application in this context. It is also important to note that the ultrasonic intensity reported in Fig. 5 is based on the surface area of the spacer rather than that of the membrane. The intensity range of 20–165 W/m2
is equivalent only to 3.5–30 W. This power range results in an overall permeate flux increase of 1.5 and 1.6 L/h.m2 for groundwater and RO reject, respectively. The specific energy (SE) required to increase permeate production by 1 m3 using ultrasonic vibration can be calcu-lated using Equation (13). This results in 99.2 and 93.0 (kWh/m3 of permeate) for groundwater and RO reject, respectively. These energy figures are insignificant compared to the reported specific thermal en-ergy requirement for a flat sheet AGMD operated with solar power (~1000–2000 kWh/m3) [78]. In addition to permeate improvement, low-power ultrasound reduces fouling which is expected to prolong membrane lifespan, which, in turn can reduce the treatment cost.
SE =PUS
ΔJ × Af(13)
where PUS is ultrasonic power (W), ΔJ is flux increase due to ultrasound power (kg/m2⋅h) and Af is the filtration area of the membrane.
Although the cleaning effects of ultrasound presented in this study were not tested with respect to biofouling removal, the suggested cleaning method may also somewhat reduce the biofilm formation po-tential of MD system. The low ultrasonic power level used in this study (non-cavitational) is not expected to produce biocidal effects, the ul-trasonic vibration may slow down biofilm development by hindering microbial deposition onto the membrane surface. Once biofilm is formed, higher ultrasound power would be needed to achieve mem-brane cleaning and biofilm removal. Examining the effect of ultrasound on biofouling formation and removal in MD would be an interesting research topic for future work.
4.3. Theoretical approach
It is important to emphasize that the effect of ultrasound on the nature of vapour transport mechanism across the porous membrane remains unknown. In fact, there is no mathematical description in AGMD of possible wave interaction with both the membrane and the transported water vapour. Consequently, we used the modelling pro-cedure (Fig. SM1) to first predict the temperature distribution in AGMD module with and without ultrasound. Then, the calculated temperatures were used to compute permeability, heat transfer coefficients and condensation film thickness for all treatments to understand ultrasound effect on mass and heat transfer in AGMD. Temperature distribution across AGMD module for RO reject and groundwater is illustrated in Fig. 6. The coloured bars represent the temperature of the different treatments at different location in the module. The dashed line depicts the overall temperature profile in AGMD. It is interesting to note that the membrane surface temperature at the feed side exhibits a decrease smaller than one degree, even though the observed flux is more than 3 times higher. This means that a negligible polarization occurs on the feed side when the flux increases, which suggests that ultrasound affected transport dynamics of vapour at the feed-membrane interface and through the porous membrane. This indicates that ultrasound waves
0
0.5
1
1.5
2
2.5
0 20 40 60 80 100 120 140 160 180
Perm
eate
flux
(kg/
h. m2 )
Ultrasonic Intensity (W/m2)RO reject Groundwater
Fig. 5. Vapour flux as a function of the applied ultrasonic intensities.
R.A. Al-juboori et al.
Separation and Purification Technology 262 (2021) 118319
8
travelled with very minimal losses and this concords with the results of the attenuation calculations performed in this study. The maximum attenuation of ultrasonic power was found to occur in the polymeric porous membrane, while there was no attenuation in the feedwater and the air gap. The maximum attenuation with the intensity of 165 W/m2
was only about 0.32 W/m2 which represents a negligible fraction from the overall intensity (~0.2%).
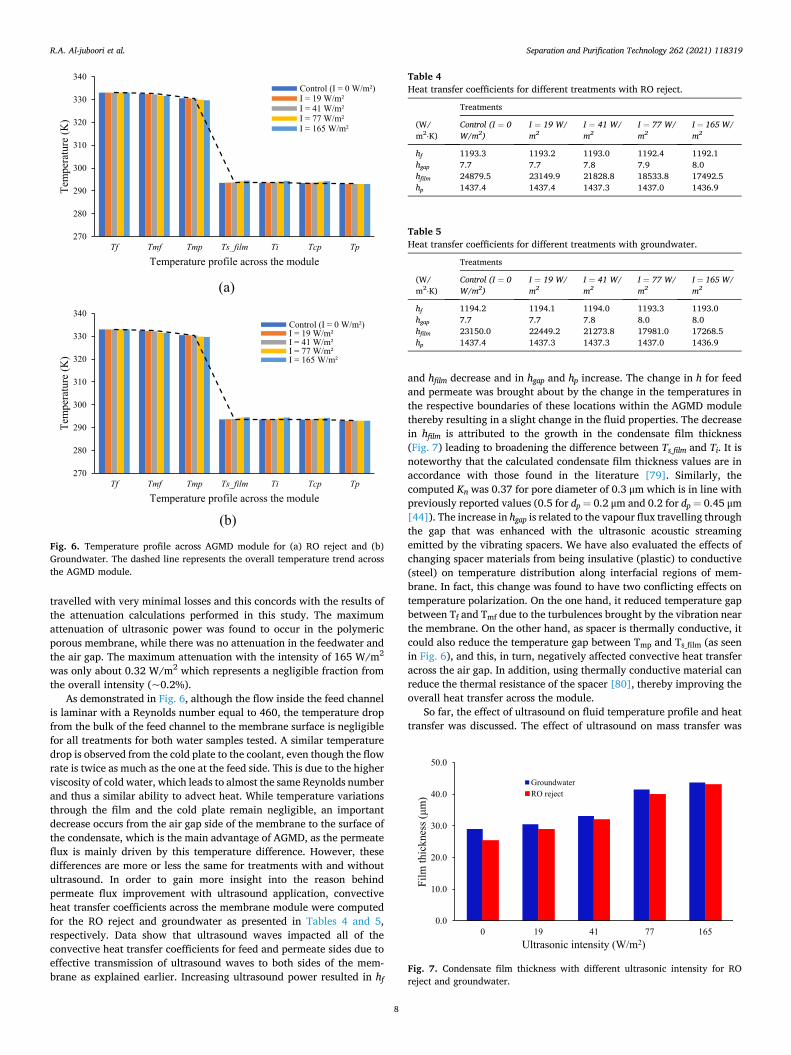
As demonstrated in Fig. 6, although the flow inside the feed channel is laminar with a Reynolds number equal to 460, the temperature drop from the bulk of the feed channel to the membrane surface is negligible for all treatments for both water samples tested. A similar temperature drop is observed from the cold plate to the coolant, even though the flow rate is twice as much as the one at the feed side. This is due to the higher viscosity of cold water, which leads to almost the same Reynolds number and thus a similar ability to advect heat. While temperature variations through the film and the cold plate remain negligible, an important decrease occurs from the air gap side of the membrane to the surface of the condensate, which is the main advantage of AGMD, as the permeate flux is mainly driven by this temperature difference. However, these differences are more or less the same for treatments with and without ultrasound. In order to gain more insight into the reason behind permeate flux improvement with ultrasound application, convective heat transfer coefficients across the membrane module were computed for the RO reject and groundwater as presented in Tables 4 and 5, respectively. Data show that ultrasound waves impacted all of the convective heat transfer coefficients for feed and permeate sides due to effective transmission of ultrasound waves to both sides of the mem-brane as explained earlier. Increasing ultrasound power resulted in hf
and hfilm decrease and in hgap and hp increase. The change in h for feed and permeate was brought about by the change in the temperatures in the respective boundaries of these locations within the AGMD module thereby resulting in a slight change in the fluid properties. The decrease in hfilm is attributed to the growth in the condensate film thickness (Fig. 7) leading to broadening the difference between Ts_film and Ti. It is noteworthy that the calculated condensate film thickness values are in accordance with those found in the literature [79]. Similarly, the computed Kn was 0.37 for pore diameter of 0.3 μm which is in line with previously reported values (0.5 for dp = 0.2 μm and 0.2 for dp = 0.45 μm [44]). The increase in hgap is related to the vapour flux travelling through the gap that was enhanced with the ultrasonic acoustic streaming emitted by the vibrating spacers. We have also evaluated the effects of changing spacer materials from being insulative (plastic) to conductive (steel) on temperature distribution along interfacial regions of mem-brane. In fact, this change was found to have two conflicting effects on temperature polarization. On the one hand, it reduced temperature gap between Tf and Tmf due to the turbulences brought by the vibration near the membrane. On the other hand, as spacer is thermally conductive, it could also reduce the temperature gap between Tmp and Ts_film (as seen in Fig. 6), and this, in turn, negatively affected convective heat transfer across the air gap. In addition, using thermally conductive material can reduce the thermal resistance of the spacer [80], thereby improving the overall heat transfer across the module.
So far, the effect of ultrasound on fluid temperature profile and heat transfer was discussed. The effect of ultrasound on mass transfer was
(a)
(b)
270
280
290
300
310
320
330
340
Tf Tmf Tmp Ts_film Ti Tcp Tp
Tem
pera
ture
(K)
Temperature profile across the module
Control (I = 0 W/m²)I = 19 W/m²I = 41 W/m²I = 77 W/m²I = 165 W/m²
270
280
290
300
310
320
330
340
Tf Tmf Tmp Ts_film Ti Tcp Tp
Tem
pera
ture
(K)
Temperature profile across the module
Control (I = 0 W/m²)I = 19 W/m²I = 41 W/m²I = 77 W/m²I = 165 W/m²
Fig. 6. Temperature profile across AGMD module for (a) RO reject and (b) Groundwater. The dashed line represents the overall temperature trend across the AGMD module.
Table 4 Heat transfer coefficients for different treatments with RO reject.
Treatments
(W/ m2⋅K)
Control (I = 0 W/m2)
I = 19 W/ m2
I = 41 W/ m2
I = 77 W/ m2
I = 165 W/ m2
hf 1193.3 1193.2 1193.0 1192.4 1192.1 hgap 7.7 7.7 7.8 7.9 8.0 hfilm 24879.5 23149.9 21828.8 18533.8 17492.5 hp 1437.4 1437.4 1437.3 1437.0 1436.9
Table 5 Heat transfer coefficients for different treatments with groundwater.
Treatments
(W/ m2⋅K)
Control (I = 0 W/m2)
I = 19 W/ m2
I = 41 W/ m2
I = 77 W/ m2
I = 165 W/ m2
hf 1194.2 1194.1 1194.0 1193.3 1193.0 hgap 7.7 7.7 7.8 8.0 8.0 hfilm 23150.0 22449.2 21273.8 17981.0 17268.5 hp 1437.4 1437.3 1437.3 1437.0 1436.9
0.0
10.0
20.0
30.0
40.0
50.0
0 19 41 77 165
Film
thic
knes
s (μm
)
Ultrasonic intensity (W/m2)
GroundwaterRO reject
Fig. 7. Condensate film thickness with different ultrasonic intensity for RO reject and groundwater.
R.A. Al-juboori et al.
Separation and Purification Technology 262 (2021) 118319
9
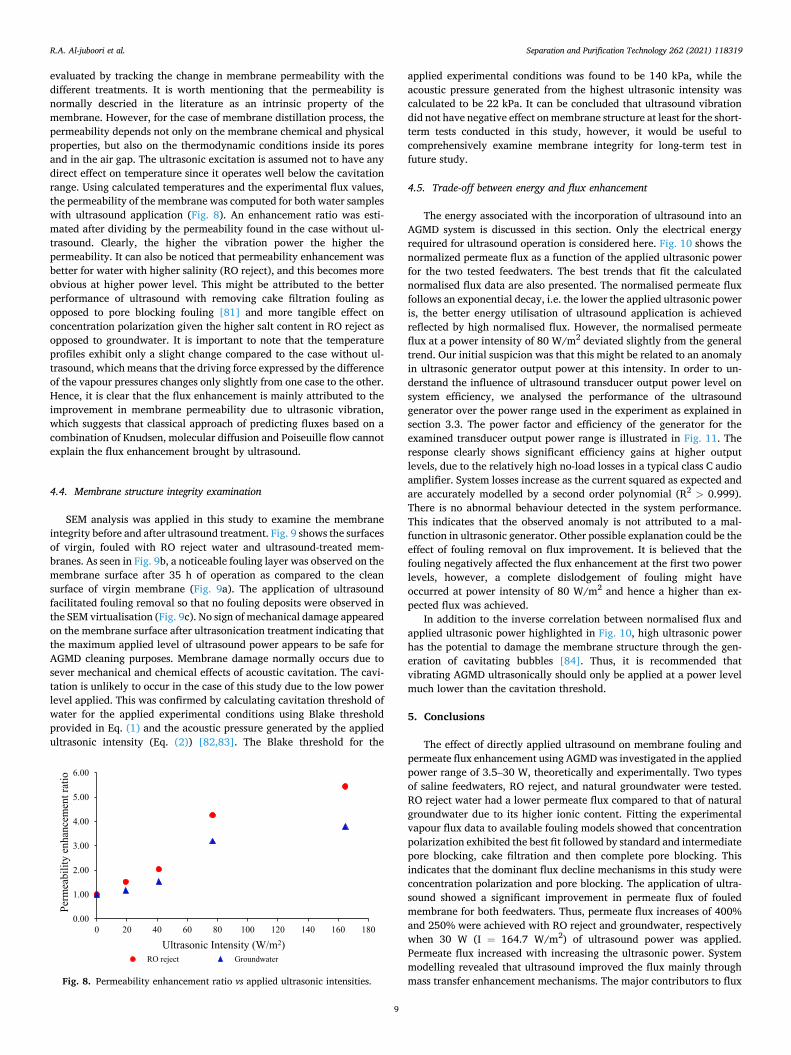
evaluated by tracking the change in membrane permeability with the different treatments. It is worth mentioning that the permeability is normally descried in the literature as an intrinsic property of the membrane. However, for the case of membrane distillation process, the permeability depends not only on the membrane chemical and physical properties, but also on the thermodynamic conditions inside its pores and in the air gap. The ultrasonic excitation is assumed not to have any direct effect on temperature since it operates well below the cavitation range. Using calculated temperatures and the experimental flux values, the permeability of the membrane was computed for both water samples with ultrasound application (Fig. 8). An enhancement ratio was esti-mated after dividing by the permeability found in the case without ul-trasound. Clearly, the higher the vibration power the higher the permeability. It can also be noticed that permeability enhancement was better for water with higher salinity (RO reject), and this becomes more obvious at higher power level. This might be attributed to the better performance of ultrasound with removing cake filtration fouling as opposed to pore blocking fouling [81] and more tangible effect on concentration polarization given the higher salt content in RO reject as opposed to groundwater. It is important to note that the temperature profiles exhibit only a slight change compared to the case without ul-trasound, which means that the driving force expressed by the difference of the vapour pressures changes only slightly from one case to the other. Hence, it is clear that the flux enhancement is mainly attributed to the improvement in membrane permeability due to ultrasonic vibration, which suggests that classical approach of predicting fluxes based on a combination of Knudsen, molecular diffusion and Poiseuille flow cannot explain the flux enhancement brought by ultrasound.
4.4. Membrane structure integrity examination
SEM analysis was applied in this study to examine the membrane integrity before and after ultrasound treatment. Fig. 9 shows the surfaces of virgin, fouled with RO reject water and ultrasound-treated mem-branes. As seen in Fig. 9b, a noticeable fouling layer was observed on the membrane surface after 35 h of operation as compared to the clean surface of virgin membrane (Fig. 9a). The application of ultrasound facilitated fouling removal so that no fouling deposits were observed in the SEM virtualisation (Fig. 9c). No sign of mechanical damage appeared on the membrane surface after ultrasonication treatment indicating that the maximum applied level of ultrasound power appears to be safe for AGMD cleaning purposes. Membrane damage normally occurs due to sever mechanical and chemical effects of acoustic cavitation. The cavi-tation is unlikely to occur in the case of this study due to the low power level applied. This was confirmed by calculating cavitation threshold of water for the applied experimental conditions using Blake threshold provided in Eq. (1) and the acoustic pressure generated by the applied ultrasonic intensity (Eq. (2)) [82,83]. The Blake threshold for the
applied experimental conditions was found to be 140 kPa, while the acoustic pressure generated from the highest ultrasonic intensity was calculated to be 22 kPa. It can be concluded that ultrasound vibration did not have negative effect on membrane structure at least for the short- term tests conducted in this study, however, it would be useful to comprehensively examine membrane integrity for long-term test in future study.
4.5. Trade-off between energy and flux enhancement
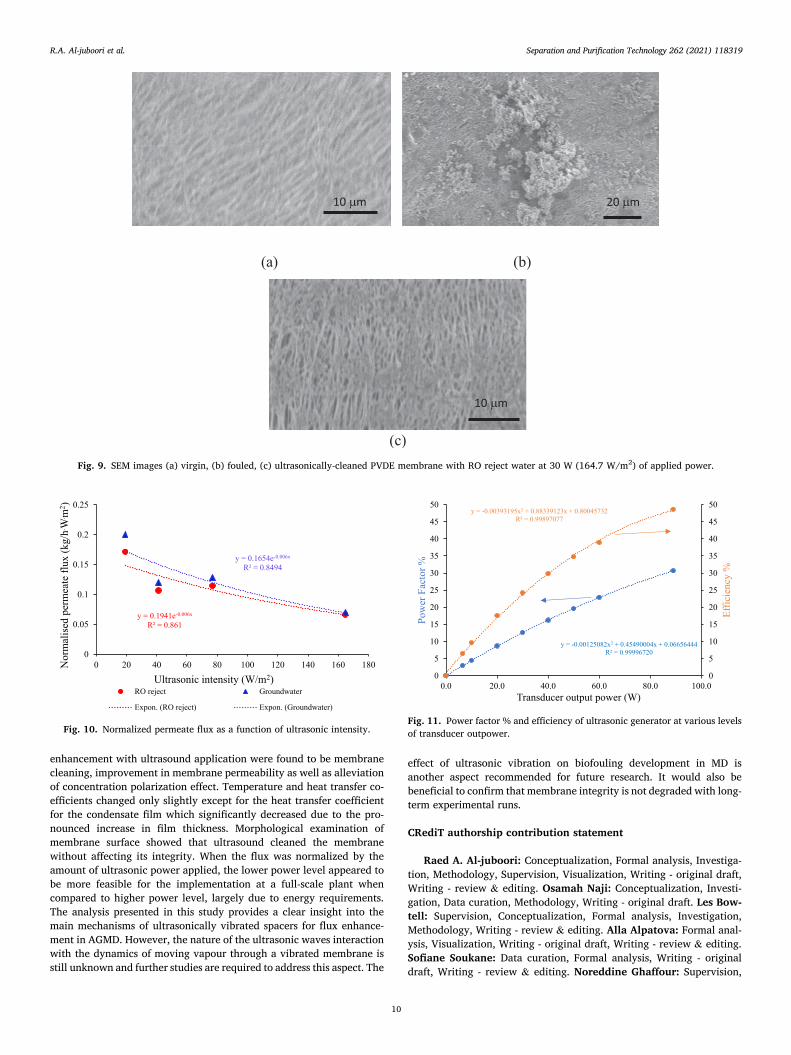
The energy associated with the incorporation of ultrasound into an AGMD system is discussed in this section. Only the electrical energy required for ultrasound operation is considered here. Fig. 10 shows the normalized permeate flux as a function of the applied ultrasonic power for the two tested feedwaters. The best trends that fit the calculated normalised flux data are also presented. The normalised permeate flux follows an exponential decay, i.e. the lower the applied ultrasonic power is, the better energy utilisation of ultrasound application is achieved reflected by high normalised flux. However, the normalised permeate flux at a power intensity of 80 W/m2 deviated slightly from the general trend. Our initial suspicion was that this might be related to an anomaly in ultrasonic generator output power at this intensity. In order to un-derstand the influence of ultrasound transducer output power level on system efficiency, we analysed the performance of the ultrasound generator over the power range used in the experiment as explained in section 3.3. The power factor and efficiency of the generator for the examined transducer output power range is illustrated in Fig. 11. The response clearly shows significant efficiency gains at higher output levels, due to the relatively high no-load losses in a typical class C audio amplifier. System losses increase as the current squared as expected and are accurately modelled by a second order polynomial (R2 > 0.999). There is no abnormal behaviour detected in the system performance. This indicates that the observed anomaly is not attributed to a mal-function in ultrasonic generator. Other possible explanation could be the effect of fouling removal on flux improvement. It is believed that the fouling negatively affected the flux enhancement at the first two power levels, however, a complete dislodgement of fouling might have occurred at power intensity of 80 W/m2 and hence a higher than ex-pected flux was achieved.
In addition to the inverse correlation between normalised flux and applied ultrasonic power highlighted in Fig. 10, high ultrasonic power has the potential to damage the membrane structure through the gen-eration of cavitating bubbles [84]. Thus, it is recommended that vibrating AGMD ultrasonically should only be applied at a power level much lower than the cavitation threshold.
5. Conclusions
The effect of directly applied ultrasound on membrane fouling and permeate flux enhancement using AGMD was investigated in the applied power range of 3.5–30 W, theoretically and experimentally. Two types of saline feedwaters, RO reject, and natural groundwater were tested. RO reject water had a lower permeate flux compared to that of natural groundwater due to its higher ionic content. Fitting the experimental vapour flux data to available fouling models showed that concentration polarization exhibited the best fit followed by standard and intermediate pore blocking, cake filtration and then complete pore blocking. This indicates that the dominant flux decline mechanisms in this study were concentration polarization and pore blocking. The application of ultra-sound showed a significant improvement in permeate flux of fouled membrane for both feedwaters. Thus, permeate flux increases of 400% and 250% were achieved with RO reject and groundwater, respectively when 30 W (I = 164.7 W/m2) of ultrasound power was applied. Permeate flux increased with increasing the ultrasonic power. System modelling revealed that ultrasound improved the flux mainly through mass transfer enhancement mechanisms. The major contributors to flux
0.00
1.00
2.00
3.00
4.00
5.00
6.00
0 20 40 60 80 100 120 140 160 180
Perm
eabi
lity
enha
ncem
ent r
atio
Ultrasonic Intensity (W/m2)RO reject Groundwater
Fig. 8. Permeability enhancement ratio vs applied ultrasonic intensities.
R.A. Al-juboori et al.
Separation and Purification Technology 262 (2021) 118319
10
enhancement with ultrasound application were found to be membrane cleaning, improvement in membrane permeability as well as alleviation of concentration polarization effect. Temperature and heat transfer co-efficients changed only slightly except for the heat transfer coefficient for the condensate film which significantly decreased due to the pro-nounced increase in film thickness. Morphological examination of membrane surface showed that ultrasound cleaned the membrane without affecting its integrity. When the flux was normalized by the amount of ultrasonic power applied, the lower power level appeared to be more feasible for the implementation at a full-scale plant when compared to higher power level, largely due to energy requirements. The analysis presented in this study provides a clear insight into the main mechanisms of ultrasonically vibrated spacers for flux enhance-ment in AGMD. However, the nature of the ultrasonic waves interaction with the dynamics of moving vapour through a vibrated membrane is still unknown and further studies are required to address this aspect. The
effect of ultrasonic vibration on biofouling development in MD is another aspect recommended for future research. It would also be beneficial to confirm that membrane integrity is not degraded with long- term experimental runs.
CRediT authorship contribution statement
Raed A. Al-juboori: Conceptualization, Formal analysis, Investiga-tion, Methodology, Supervision, Visualization, Writing - original draft, Writing - review & editing. Osamah Naji: Conceptualization, Investi-gation, Data curation, Methodology, Writing - original draft. Les Bow-tell: Supervision, Conceptualization, Formal analysis, Investigation, Methodology, Writing - review & editing. Alla Alpatova: Formal anal-ysis, Visualization, Writing - original draft, Writing - review & editing. Sofiane Soukane: Data curation, Formal analysis, Writing - original draft, Writing - review & editing. Noreddine Ghaffour: Supervision,
Fig. 9. SEM images (a) virgin, (b) fouled, (c) ultrasonically-cleaned PVDE membrane with RO reject water at 30 W (164.7 W/m2) of applied power.
y = 0.1654e-0.006x
R² = 0.8494
y = 0.1941e-0.006x
R² = 0.861
0
0.05
0.1
0.15
0.2
0.25
0 20 40 60 80 100 120 140 160 180Nor
mal
ised
per
mea
te fl
ux (k
g/h. W
. m2 )
Ultrasonic intensity (W/m2)RO reject Groundwater
Expon. (RO reject) Expon. (Groundwater)
Fig. 10. Normalized permeate flux as a function of ultrasonic intensity.
y = -0.00125082x2 + 0.45490004x + 0.06656444R² = 0.99996720
y = -0.00393195x2 + 0.88339123x + 0.80045732R² = 0.99897077
0
5
10
15
20
25
30
35
40
45
50
0
5
10
15
20
25
30
35
40
45
50
0.0 20.0 40.0 60.0 80.0 100.0
Effic
ienc
y %
Pow
er F
acto
r %
Transducer output power (W)
Fig. 11. Power factor % and efficiency of ultrasonic generator at various levels of transducer outpower.
R.A. Al-juboori et al.
Separation and Purification Technology 262 (2021) 118319
11
Investigation, Writing - original draft, Writing - review & editing.
Declaration of Competing Interest
The authors declare that they have no known competing financial interests or personal relationships that could have appeared to influence the work reported in this paper.
Acknowledgement
The authors would like to acknowledge the financial support received from the University of Southern Queensland and the technical discussion with filtration professionals from FILPURE water filtration systems, Australia.
Appendix A. Supplementary material
Supplementary data to this article can be found online at https://doi. org/10.1016/j.seppur.2021.118319.
References
[1] D. Griggs, M. Stafford-Smith, O. Gaffney, J. Rockstrom, M.C. Ohman, P. Shyamsundar, W. Steffen, G. Glaser, N. Kanie, I. Noble, Policy: Sustainable development goals for people and planet, Nature 495 (2013) 305.
[2] I. Ibrar, A. Altaee, J.L. Zhou, O. Naji, D. Khanafer, Challenges and potentials of forward osmosis process in the treatment of wastewater, Crit. Rev. Environ. Sci. Technol. (2019) 1–45.
[3] I. Ibrar, O. Naji, A. Sharif, A. Malekizadeh, A. Alhawari, A.A. Alanezi, A. Altaee, A review of fouling mechanisms, control strategies and real-time fouling monitoring techniques in forward osmosis, Water 11 (2019) 695.
[4] S. Yadav, H. Saleem, I. Ibrar, O. Naji, A.A. Hawari, A.A. Alanezi, S.J. Zaidi, A. Altaee, J. Zhou, Recent developments in forward osmosis membranes using carbon-based nanomaterials, Desalination 482 (2020) 114375.
[5] M. Yadav, R. Gupta, R.K. Sharma, Green and sustainable pathways for wastewater purification, in: Adv. Water Purif. Tech., Elsevier, 2019, pp. 355–383.
[6] N. Ghaffour, T.M. Missimer, G.L. Amy, Combined desalination, water reuse, and aquifer storage and recovery to meet water supply demands in the GCC/MENA region, Desalin. Water Treat. 51 (2013) 38–43.
[7] S.-Y. Pan, A.Z. Haddad, A. Kumar, S.-W. Wang, Brackish water desalination using reverse osmosis and capacitive deionization at the water-energy nexus, Water Res. (2020) 116064.
[8] X. Ji, E. Curcio, S. Al Obaidani, G. Di Profio, E. Fontananova, E. Drioli, Membrane distillation-crystallization of seawater reverse osmosis brines, Sep. Purif. Technol. 71 (2010) 76–82.
[9] K. Ikehata, Y. Zhao, H.V. Kulkarni, Y. Li, S.A. Snyder, K.P. Ishida, M.A. Anderson, Water recovery from advanced water purification facility reverse osmosis concentrate by photobiological treatment followed by secondary reverse osmosis, Environ. Sci. Technol. 52 (2018) 8588–8595.
[10] A. Pervov, R. Efremov, Membrane techniques in groundwater treatment, in: IOP Conf. Ser. Mater. Sci. Eng., IOP Publishing, 2018, p. 62025.
[11] K. Arola, B. Van der Bruggen, M. Manttari, M. Kallioinen, Treatment options for nanofiltration and reverse osmosis concentrates from municipal wastewater treatment: A review, Crit. Rev. Environ. Sci. Technol. 49 (2019) 2049–2116.
[12] A. Abejon, A. Garea, A. Irabien, Arsenic removal from drinking water by reverse osmosis: Minimization of costs and energy consumption, Sep. Purif. Technol. 144 (2015) 46–53.
[13] A.S. Alsaadi, L. Francis, H. Maab, G.L. Amy, N. Ghaffour, Evaluation of air gap membrane distillation process running under sub-atmospheric conditions: Experimental and simulation studies, J. Memb. Sci. 489 (2015) 73–80.
[14] J. Lee, A.S. Alsaadi, N. Ghaffour, Multi-stage air gap membrane distillation reversal for hot impaired quality water treatment: concept and simulation study, Desalination 450 (2019) 1–11.
[15] A.S. Alsaadi, A. Alpatova, J.-G. Lee, L. Francis, N. Ghaffour, Flashed-feed VMD configuration as a novel method for eliminating temperature polarization effect and enhancing water vapor flux, J. Memb. Sci. 563 (2018) 175–182.
[16] A. Alpatova, A.S. Alsaadi, M. Alharthi, J.-G. Lee, N. Ghaffour, Co-axial hollow fiber module for air gap membrane distillation, J. Memb. Sci. 578 (2019) 172–182.
[17] H. Susanto, Towards practical implementations of membrane distillation, Chem. Eng. Process. Process Intensif. 50 (2011) 139–150.
[18] J.B. Galvez, L. García-Rodríguez, I. Martín-Mateos, Seawater desalination by an innovative solar-powered membrane distillation system: the MEDESOL project, Desalination 246 (2009) 567–576.
[19] N. Ghaffour, S. Soukane, J.-G. Lee, Y. Kim, A. Alpatova, Membrane distillation hybrids for water production and energy efficiency enhancement: A critical review, Appl. Energy 254 (2019) 113698.
[20] E. Curcio, E. Drioli, Membrane distillation and related operations—a review, Sep. Purif. Rev. 34 (2005) 35–86.
[21] M.S. El-Bourawi, Z. Ding, R. Ma, M. Khayet, A framework for better understanding membrane distillation separation process, J. Memb. Sci. 285 (2006) 4–29.
[22] M. Gryta, Effect of iron oxides scaling on the MD process performance, Desalination 216 (2007) 88–102.
[23] G. Naidu, S. Jeong, S. Vigneswaran, T.-M. Hwang, Y.-J. Choi, S.-H. Kim, A review on fouling of membrane distillation, Desalin. Water Treat. 57 (2016) 10052–10076.
[24] M. Gryta, Long-term performance of membrane distillation process, J. Memb. Sci. 265 (2005) 153–159.
[25] M. Gryta, Fouling in direct contact membrane distillation process, J. Memb. Sci. 325 (2008) 383–394.
[26] S. Sarp, N. Hilal, Membrane-based Salinity Gradient Processes for Water Treatment and Power Generation, Elsevier, 2018.
[27] A. Politano, G. Di Profio, E. Fontananova, V. Sanna, A. Cupolillo, E. Curcio, Overcoming temperature polarization in membrane distillation by thermoplasmonic effects activated by Ag nanofillers in polymeric membranes, Desalination 451 (2019) 192–199.
[28] R.A. Johnson, M.H. Nguyen, Understanding Membrane Distillation and Osmotic Distillation, John Wiley & Sons, 2017.
[29] A. Alkhudhiri, N. Darwish, N. Hilal, Membrane distillation: A comprehensive review, Desalination 287 (2012) 2–18.
[30] M. Gryta, Calcium sulphate scaling in membrane distillation process, Chem. Pap. 63 (2009) 146–151.
[31] A. Hausmann, P. Sanciolo, T. Vasiljevic, U. Kulozik, M. Duke, Performance assessment of membrane distillation for skim milk and whey processing, J. Dairy Sci. 97 (2014) 56–71.
[32] A.M. Alklaibi, N. Lior, Membrane-distillation desalination: status and potential, Desalination 171 (2005) 111–131.
[33] Y.-D. Kim, L. Francis, J.-G. Lee, M.-G. Ham, N. Ghaffour, Effect of non-woven net spacer on a direct contact membrane distillation performance: Experimental and theoretical studies, J. Memb. Sci. 564 (2018) 193–203.
[34] A. Ali, Evaluation of Membrane Characteristics and Thermal Polarization in Membrane Distillation, Universite Paul Sabatier, 2015.
[35] Y. Wen, J. Yuan, X. Ma, S. Wang, Y. Liu, Polymeric nanocomposite membranes for water treatment: a review, Environ. Chem. Lett. (2019) 1–13.
[36] M.R. Gwinn, V. Vallyathan, Nanoparticles: health effects—pros and cons, Environ. Health Perspect. 114 (2006) 1818–1825.
[37] A. Anvari, A.A. Yancheshme, K.M. Kekre, A. Ronen, State-of-the-art methods for overcoming temperature polarization in membrane distillation process: A review, J. Memb. Sci. (2020) 118413.
[38] R.A. Al-Juboori, T. Yusaf, V. Aravinthan, P.A. Pittaway, L. Bowtell, Investigating the feasibility and the optimal location of pulsed ultrasound in surface water treatment schemes, Desalin. Water Treat. 57 (2016), https://doi.org/10.1080/ 19443994.2014.996771.
[39] R.A. Al-Jubooria, T. Yusafb, L. Bowtellc, Pulsed ultrasound as an energy saving mode for ultrasound treatment of surface water with terrestrial aquatic carbon, Desalin. Water Treat. 135 (2018) 167–176.
[40] D. Chen, S.K. Sharma, A. Mudhoo, Handbook on Applications of Ultrasound: Sonochemistry for Sustainability, CRC Press, 2011.
[41] M.O. Lamminen, H.W. Walker, L.K. Weavers, Mechanisms and factors influencing the ultrasonic cleaning of particle-fouled ceramic membranes, J. Memb. Sci. 237 (2004) 213–223.
[42] S. Muthukumaran, S.E. Kentish, G.W. Stevens, M. Ashokkumar, Application of ultrasound in membrane separation processes: a review, Rev. Chem. Eng. 22 (2006) 155–194.
[43] H.M. Kyllonen, P. Pirkonen, M. Nystrom, Membrane filtration enhanced by ultrasound: a review, Desalination 181 (2005) 319–335.
[44] M. Bayevsky, Systems and methods for ultrasonic cleaning of cross-flow membrane filters, US20040016699A1, 2004.
[45] L.K. Weavers, H.W. Walker, M.O. Lamminen, D. Chen, Ultrasonically cleaned membrane filtration system, US7008540B1, 2006.
[46] C. Zhu, G. Liu, Modeling of ultrasonic enhancement on membrane distillation, J. Memb. Sci. 176 (2000) 31–41.
[47] C. Zhu, G.L. Liu, C.S. Cheung, C.W. Leung, Z.C. Zhu, Ultrasonic stimulation on enhancement of air gap membrane distillation, J. Memb. Sci. 161 (1999) 85–93.
[48] O. Naji, R.A. Al-juboori, L. Bowtell, A. Alpatova, N. Ghaffour, Direct contact ultrasound for fouling control and flux enhancement in air-gap membrane distillation, Ultrason. Sonochem. 61 (2020) 104816.
[49] R.W. Schofield, A.G. Fane, C.J.D. Fell, Gas and vapour transport through microporous membranes. I. Knudsen-Poiseuille transition, J. Memb. Sci. 53 (1990) 159–171.
[50] H. Attia, M.S. Osman, D.J. Johnson, C. Wright, N. Hilal, Modelling of air gap membrane distillation and its application in heavy metals removal, Desalination 424 (2017) 27–36.
[51] R. Thanedgunbaworn, R. Jiraratananon, M.H. Nguyen, Vapour transport mechanism in osmotic distillation process, Int. J. Food Eng. 5 (2009).
[52] Josef Krautkramer, H. Krautkramer, Ultrasonic Testing of Materials, fourth ed., Springer, Berlin, 1990.
[53] T.E.G. Alvarez-Arenas, A nondestructive integrity test for membrane filters based on air-coupled ultrasonic spectroscopy, IEEE Trans. Ultrason. Ferroelectr. Freq. Control. 50 (2003) 676–685.
[54] L. Rozenberg, Physical Principles of Ultrasonic Technology, Springer Science & Business Media, 2013.
[55] S. Majumdar, P.S. Kumar, A.B. Pandit, Effect of liquid-phase properties on ultrasound intensity and cavitational activity, Ultrason. Sonochem. 5 (1998) 113–118.
R.A. Al-juboori et al.
Separation and Purification Technology 262 (2021) 118319
12
[56] N. Carrard, T. Foster, J. Willetts, Groundwater as a source of drinking water in southeast Asia and the Pacific: A multi-country review of current reliance and resource concerns, Water 11 (2019) 1605.
[57] R.A. Al-Juboori, L.A. Bowtell, T. Yusaf, V. Aravinthan, Insights into the scalability of magnetostrictive ultrasound technology for water treatment applications, Ultrason. Sonochem. 28 (2016), https://doi.org/10.1016/j.ultsonch.2015.08.013.
[58] O. Naji, L. Bowtell, R.A. Al-Juboori, V. Aravinthan, N. Ghaffour, Effect of air gap membrane distillation parameters on the removal of fluoride from synthetic water, Desalin. Water Treat. 124 (2018) 11–20, https://doi.org/10.5004/ dwt.2018.22694.
[59] S. Srisurichan, R. Jiraratananon, A.G. Fane, Mass transfer mechanisms and transport resistances in direct contact membrane distillation process, J. Memb. Sci. 277 (2006) 186–194.
[60] J.S. Knutsen, R.H. Davis, Deposition of foulant particles during tangential flow filtration, J. Memb. Sci. 271 (2006) 101–113.
[61] J. Altmann, S. Ripperger, Particle deposition and layer formation at the crossflow microfiltration, J. Memb. Sci. 124 (1997) 119–128.
[62] F. Banat, S. Al-Asheh, M. Qtaishat, Treatment of waters colored with methylene blue dye by vacuum membrane distillation, Desalination 174 (2005) 87–96.
[63] M. Ramezanianpour, M. Sivakumar, An analytical flux decline model for membrane distillation, Desalination 345 (2014) 1–12.
[64] D.M. Warsinger, J. Swaminathan, E. Guillen-Burrieza, H.A. Arafat, Scaling and fouling in membrane distillation for desalination applications: a review, Desalination 356 (2015) 294–313.
[65] A. Jafari, M.R.S. Kebria, A. Rahimpour, G. Bakeri, Graphene quantum dots modified polyvinylidenefluride (PVDF) nanofibrous membranes with enhanced performance for air Gap membrane distillation, Chem. Eng. Process. Intensif. 126 (2018) 222–231.
[66] L.D. Tijing, Y.C. Woo, J.-S. Choi, S. Lee, S.-H. Kim, H.K. Shon, Fouling and its control in membrane distillation—A review, J. Memb. Sci. 475 (2015) 215–244.
[67] A. Alkhudhiri, N. Darwish, N. Hilal, Treatment of high salinity solutions: Application of air gap membrane distillation, Desalination 287 (2012) 55–60.
[68] A. Alpatova, A. Alsaadi, N. Ghaffour, Boron evaporation in thermally-driven seawater desalination: Effect of temperature and operating conditions, J. Hazard. Mater. 351 (2018) 224–231.
[69] J.-G. Lee, S. Jeong, A.S. Alsaadi, N. Ghaffour, Influence of high range of mass transfer coefficient and convection heat transfer on direct contact membrane distillation performance, Desalination 426 (2018) 127–134.
[70] A.A. Kiss, O.M. Kattan Readi, An industrial perspective on membrane distillation processes, J. Chem. Technol. Biotechnol. 93 (2018) 2047–2055.
[71] S.O. Olatunji, L.M. Camacho, Heat and mass transport in modeling membrane distillation configurations: a review, Front. Energy Res. 6 (2018) 130.
[72] H.Y. Wong, K.K. Lau, E. Drioli, O.B. Seng, Nanoparticle separation using direct contact membrane distillation and its fouling study, J. Membr. Sci. Res. 2 (2016) 186–192.
[73] M. Laqbaqbi, M.C. García-Payo, M. Khayet, J. El Kharraz, M. Chaouch, Application of direct contact membrane distillation for textile wastewater treatment and fouling study, Sep. Purif. Technol. 209 (2019) 815–825.
[74] S. Srisurichan, R. Jiraratananon, A.G. Fane, Humic acid fouling in the membrane distillation process, Desalination 174 (2005) 63–72.
[75] A. Zarebska, D.R. Nieto, K.V. Christensen, B. Norddahl, Ammonia recovery from agricultural wastes by membrane distillation: fouling characterization and mechanism, Water Res. 56 (2014) 1–10.
[76] L.E. Kinsler, A.R. Frey, A.B. Coppens, J. V Sanders, Fundamentals of acoustics, Fundam. Acoust. 4th Ed. by Lawrence E. Kinsler, Austin R. Frey, Alan B. Coppens, James V. Sanders, Pp. 560. ISBN 0-471-84789-5. Wiley-VCH, December 1999 (1999) 560.
[77] D. Hou, L. Zhang, H. Fan, J. Wang, H. Huang, Ultrasonic irradiation control of silica fouling during membrane distillation process, Desalination 386 (2016) 48–57.
[78] G. Zaragoza, A. Ruiz-Aguirre, E. Guillen-Burrieza, Efficiency in the use of solar thermal energy of small membrane desalination systems for decentralized water production, Appl. Energy 130 (2014) 491–499.
[79] I. Hitsov, K. De Sitter, C. Dotremont, P. Cauwenberg, I. Nopens, Full-scale validated Air Gap Membrane Distillation (AGMD) model without calibration parameters, J. Memb. Sci. 533 (2017) 309–320.
[80] J. Cai, H. Yin, F. Guo, Transport analysis of material gap membrane distillation desalination processes, Desalination 481 (2020) 114361.
[81] M.-W. Wan, C.M. Futalan, C.-H. Chang, C.-C. Kan, Effect of coagulation mechanisms on the fouling and ultrasonic cleaning of PTFE membrane, Water Sci. Technol. 66 (2012) 2291–2298.
[82] M. Qasim, N.N. Darwish, S. Mhiyo, N.A. Darwish, N. Hilal, The use of ultrasound to mitigate membrane fouling in desalination and water treatment, Desalination 443 (2018) 143–164.
[83] R.A. Al-Juboori, T. Yusaf, Identifying the optimum process parameters for ultrasonic cellular disruption of E. coli, Int. J. Chem. React. Eng. 10 (2012), https://doi.org/10.1515/1542-6580.2937.
[84] D. Chen, L.K. Weavers, H.W. Walker, Ultrasonic control of ceramic membrane fouling by particles: effect of ultrasonic factors, Ultrason. Sonochem. 13 (2006) 379–387.
R.A. Al-juboori et al.

![Ultrasonically assisted machining of Titanium alloys · Ultrasonically assisted ... electrical discharge machining (EDM) in milling of Ti alloys [4] ... Superimposing ultrasonic vibration](https://img.pdfslide.us/doc/110x75/5b1e5f9d7f8b9a901f8b8ced/ultrasonically-assisted-machining-of-titanium-alloys-ultrasonically-assisted.jpg)