Embed Size (px)
Citation preview

ANNUAL REPORT 2011Year ended March 31, 2011
THE NANTO BANK, LTD.16, Hashimoto-cho, Nara City, Nara 630-8677, Japan
Phone: (0742)22-1131
010_0550701372309.indd 2 2011/09/30 18:27:34
ANNUAL REPORT 2011
CONTENTS
WAKAYAMA
TOKYO
MIE
NARA (NARA PREFECTURE)
KYOTOOSAKA
HYOGO
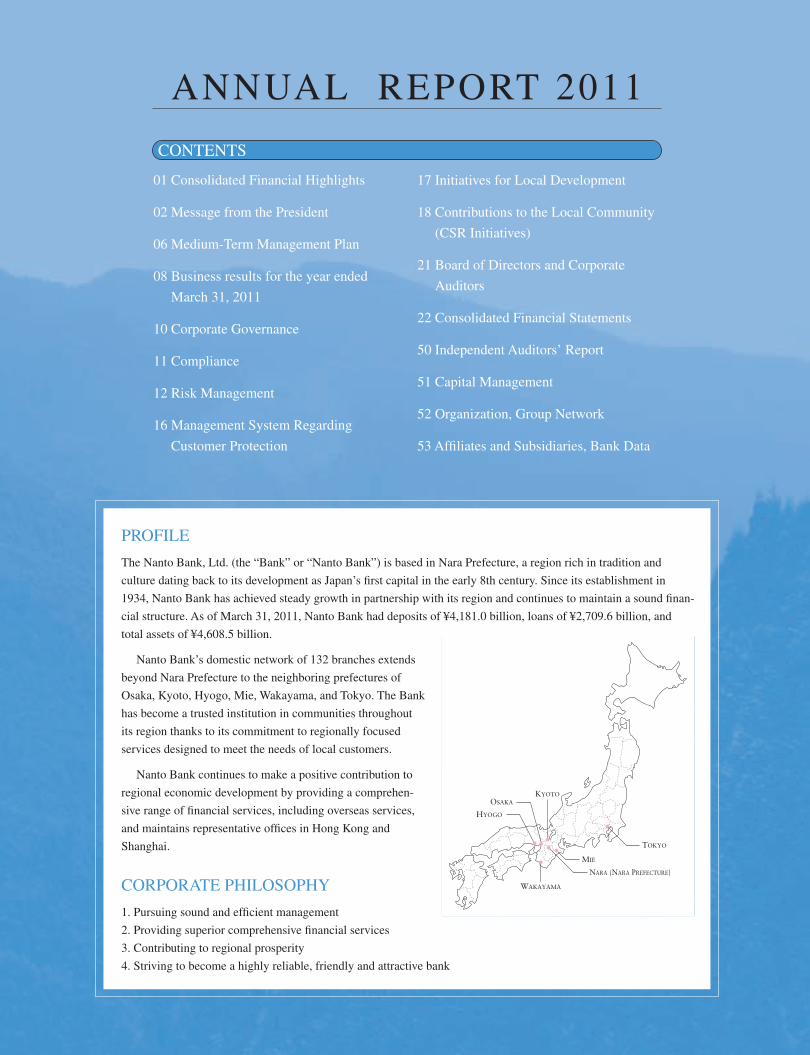
PROFILE
The Nanto Bank, Ltd. (the “Bank” or “Nanto Bank”) is based in Nara Prefecture, a region rich in tradition and
culture dating back to its development as Japan’s first capital in the early 8th century. Since its establishment in
1934, Nanto Bank has achieved steady growth in partnership with its region and continues to maintain a sound finan-
cial structure. As of March 31, 2011, Nanto Bank had deposits of ¥4,181.0 billion, loans of ¥2,709.6 billion, and
total assets of ¥4,608.5 billion.
Nanto Bank’s domestic network of 132 branches extends
beyond Nara Prefecture to the neighboring prefectures of
Osaka, Kyoto, Hyogo, Mie, Wakayama, and Tokyo. The Bank
has become a trusted institution in communities throughout
its region thanks to its commitment to regionally focused
services designed to meet the needs of local customers.
Nanto Bank continues to make a positive contribution to
regional economic development by providing a comprehen-
sive range of financial services, including overseas services,
and maintains representative offices in Hong Kong and
Shanghai.
CORPORATE PHILOSOPHY
1. Pursuing sound and efficient management
2. Providing superior comprehensive financial services
3. Contributing to regional prosperity
4. Striving to become a highly reliable, friendly and attractive bank
01 Consolidated Financial Highlights
02 Message from the President
06 Medium-Term Management Plan
08 Business results for the year ended
March 31, 2011
10 Corporate Governance
11 Compliance
12 Risk Management
16 Management System Regarding
Customer Protection
17 Initiatives for Local Development
18 Contributions to the Local Community
(CSR Initiatives)
21 Board of Directors and Corporate
Auditors
22 Consolidated Financial Statements
50 Independent Auditors’ Report
51 Capital Management
52 Organization, Group Network
53 Affiliates and Subsidiaries, Bank Data
010_0550701372309.indd 3 2011/09/30 18:27:35

1
Consolidated Financial Highlights
Millions of yenThousands ofU.S. dollars
2011 2010 2009 2008 2007 2011
For the year:
Total income ............................................ ¥ 92,751 ¥ 95,942 ¥ 109,639 ¥ 118,188 ¥ 122,121 $ 1,115,466
Total expenses ......................................... 78,711 83,145 134,276 108,262 111,789 946,614
Income (loss) before income taxes .......... 14,039 12,796 (24,637) 9,926 10,331 168,839
Net income (loss) .................................... 6,584 7,293 (22,324) 5,170 6,419 79,182
At year-end:
Total assets .............................................. 4,608,561 4,568,768 4,607,649 4,565,111 4,654,230 55,424,666
Loans and bills discounted ...................... 2,709,612 2,730,540 2,854,567 2,679,469 2,631,388 32,587,035
Securities ................................................. 1,668,948 1,560,110 1,425,966 1,540,174 1,699,653 20,071,533
Deposits and negotiable certificates of deposit ............................................... 4,181,096 4,117,975 4,083,246 4,082,565 4,155,660 50,283,776
Total liabilities ......................................... 4,401,386 4,361,672 4,445,015 4,366,001 4,426,365 52,933,084
Minority interests .................................... 25,125 24,621 24,447 24,852 24,222 302,164
Total net assets ........................................ 207,175 207,095 162,634 199,109 227,865 2,491,581
Common stock ........................................ 29,249 29,249 29,249 29,249 29,249 351,761
Per share data: Yen U.S. dollars
Net income (loss) .................................... ¥ 23.88 ¥ 26.45 ¥ (80.87) ¥ 18.67 ¥ 23.14 $ 0.28
Stockholders’ equity ............................... 660.24 661.81 501.09 630.66 734.48 7.94
Capital adequacy ratio (%) ..................... 11.74 12.12 10.06 10.78 11.15
Note: U.S. dollar amounts are included solely for the convenience of readers and are calculated at the exchange rate of ¥83.15 to US$1.00, the rate prevailing on March 31, 2011.
4,654.2
6.4
5.1
4,565.1227.8
199.1
4,607.6
162.6
2008 20092007
-22.3
Net Income(Billions of yen)
Total Assets(Billions of yen)
Total Net Assets(Billions of yen)
2008 200920072008 20092007
207.0
2010 2011
7.2
2010 20112010 2011
4,568.7
6.5
4,608.5207.1
010_0550701372309.indd 1 2011/09/30 18:27:36

2
The impact of the Great East Japan Earthquake has contribut-
ed to an overall weak Japanese economy, as production activ-
ities and consumer spending suffer. However, the restoration
of production facilities has proceeded steadily and this is
expected to contribute to a recovery in individual consumer
sentiment in the future.
A wide range of sectors in the local economy centered on
Nara Prefecture have been impacted as the earthquake has
caused interruptions in the supply chain and a decrease in
tourist numbers. However, there have been some signs of
recovery in the production activities of companies in Nara
Prefecture, accompanying the nationwide restoration of pro-
duction facilities, and tourist numbers are also expected to
gradually recover as the prevailing atmosphere of self-
restraint becomes more relaxed in the future.
The Bank’s business environment has remained difficult
due mainly to the long-term downturn in the economy and
financial markets triggered by the bankruptcy of Lehman
Brothers. Within this business environment, the Bank has
striven to expand its marketing base with the deployment of
region-based marketing activities and improve risk manage-
ment through its previous medium term management plan,
More Value “NANTO”.
The Bank launched the new medium-term management
plan, Best Value NANTO (three-year plan) in April 2011.
Targeting our 80th anniversary in June 2014, all the Bank
officers and employees are united in their commitment to
build stronger relationships of trust between stakeholders
including the local community, customers and shareholders,
in addition to efforts to improve customer satisfaction and
increase corporate value.
Aim for Further Increase of Corporate Value through Our New Medium-Term Management Plan
The purpose of this Annual Report 2011 is to disclose our performance in fiscal 2010 (the year ended March 31, 2011) and the
initiatives conducted during the fiscal year. We would appreciate it if you would read through the report for your reference.
Although there were concerns mainly over the increase in prices for raw materials in the Japanese economy, the economic
climate continued to improve, supported by a recovery in production activities, which led to gradual improvements in the
employment situation. However, it is expected that production activities will remain sluggish for the near term due to the oc-
currence of the Great East Japan Earthquake. Individual consumer sentiment has also deteriorated as a result and significant
consideration is required concerning future risks of economic downturn.
Although these events have had a wide-ranging impact on business performance in the regional economy centered on Nara
Prefecture, new development that will bring new life to the local economy has been triggered by the Commemorative Events
for the 1,300th Anniversary of Nara Heijo-kyo Capital held last year, and the plans for the Commemorative Events Following the
1,300th Anniversary are gradually being actualized.
Against this background, the Bank has launched the new medium-term management plan, Best Value NANTO (April 2011 to
March 2014). We aim for further increase of corporate value as we grow together with the region based on the four basic
policies and eight key strategies that have been set forth in this plan. We look forward to your continued support as all of our
officers and employees devote their full efforts to the achievement of this plan.
I. Our Business Environment
Message from the PresidentMessage from the President
010_0550701372309.indd 2 2011/09/30 18:27:38

3
• Promoting Relationship-based Local BankingThe Bank believes that facilitating finance for small and
medium enterprises is an important mission for regional
financial institutions and strives to facilitate finance for these
entities. Since the Act concerning Temporary Measures to
Facilitate Financing for SMEs (Small and Medium-Sized
Enterprises), etc. came into effect two years ago, we have
created a Basic Policy on Facilitating Finance and made
improvements to internal systems to enable more active facil-
itation of finance for these enterprises than in the past.
At the Corporate Finance Support Office that has been
established in the Credit Analysis Division, expert staffs pro-
vide advice and support on matters such as drafting manage-
ment improvement plans and conducting initiatives together
with companies to resolve management issues, in addition to
guidance on reducing the burdens of debt service.
We have also provided flexible and prompt response to
inquiries from clients requiring new loans or help concerning
forcible changes in existing loan terms due mainly to reduc-
tions in sales following the recent earthquake.
In addition to financing, the Bank has established a com-
prehensive support structure in response to the various needs
of customers, as it deploys solution-oriented marketing and
sales with a unified headquarters and branch office structure
that incorporates departments such as the Venture Business
Support Office and the Asia Business Support Group.
Specifically, we provide business matching opportunities
in Japan and overseas to support the expansion of our cus-
tomers’ business, in addition to actively supporting business
succession and M&A projects for our customers. We also uti-
lize our representative offices in Hong Kong and Shanghai to
provide detailed support for businesses looking to expand
and conduct business overseas, especially in Asia.
In this manner we promote Relationship-based Local
Banking which are the origin of the regional banking busi-
ness, while strengthening the coordination between the head-
quarters and branches.
• Strengthening our marketing structureThe Bank is working towards strengthening of our marketing
structure through mainly the establishment of new operation-
al bases and further buildup of loans, deposits, and assets
under management.
In addition to our existing operating area, we are increas-
ing our presence in the Osaka area, which is consider to be a
key region, by establishing new bases of operations and con-
tinuing aggressive placement of employees. When selecting
locations for new branches, we consider continuity with Nara
Prefecture and existing branches, and set up branches in
regions with deep connections in order to enhance our
branch network. Although some of our branches in Osaka are
upper-floor branches for corporate customers, we are making
a gradual shift to street-level branches.
The Sakai Branch was converted to a street-level branch
in April 2011 in order to provide full services for individual
customers. We will continue to convert upper-floor branches
to street-level branches in the future depending on market
characteristics as we make efforts to both strengthen market-
ing capabilities and improve customer satisfaction.
We are also actively promoting transactions relating to
assets under management and personal loans with individual
customers in Nara Prefecture and the rest of our existing
operating area, while we strive to maintain and improve our
loan market share, including business loans.
The Individual Sales Division was newly established in
April 2011 with the aim to strengthen marketing and plan-
ning capabilities to support individual customers. In addition,
business at eleven locations of L-Plaza was also started in
April 2011. L-Plaza provides a wide range of services,
including housing loans and respond to inquiries concerning
The new medium-term management plan, Best Value
NANTO represents the second and final stage of our long-
term vision established in 2008 of “aiming to further increase
corporate value - a bank that grows together with the region
it serves,” targeting our 80th anniversary in June 2014.
Through this plan, we will strive to strengthen our mar-
keting structure for the improvement of customer satisfaction
and strengthened earnings ability, as well as the further
enhancement of operational efficiency.
1. Improving customer satisfaction and strengthening earnings ability through deployment of community-focused marketing
II. New Medium-Term Management Plan
010_0550701372309.indd 3 2011/09/30 18:27:38

4
For the Bank to secure stable earnings in the future, in addi-
tion to the establishment of new branches and the enhance-
ment of existing branches, we also need to continue making
aggressive investments, such as investments in IT for the
advancement of our operations.
For this reason, we have made efforts to reduce business
expenses through the review and streamlining of headquar-
ters and branch operations. The medium-term management
plan also incorporates a thorough and further review of over-
all business expenses.
The fostering of the human resources who will act to pro-
mote these measures is also essential for the Bank to grow
together with the region and improve in value and satisfac-
tion for all stakeholders. Accordingly, we will strive to foster
highly-knowledgeable and experienced human resources
worthy of the trust of our customers.
The Bank considers the advancement of business manage-
ment, including the enhancement and upgrading of internal
control systems to be an important management issue, and
has made efforts to enhance our compliance framework and
incorporate more advanced and enhanced risk management.
Efforts have been made to strengthen the compliance
framework through improvements in the effectiveness of
monitoring and we have adopted preventive measures to
avoid any inappropriate transactions.
In terms of risk management, efforts have been made to
control risks and returns through initiatives that allow for
more advanced and enhanced management of risks.
In the future we will continue efforts to further enhance
and upgrade internal control systems so that we can gain
even more trust from stakeholders.
2. Efficient use of corporate resources
3. Enhancement and upgrading of internal control systems
Message from the PresidentMessage from the President
housing loans and asset management. For the convenience of
our customers, L-Plaza is open also on weekends. Female
employees serve not only as bank tellers, but also as retail
sales staff, as they provide detailed guidance for individual
customers concerning asset management.
We have also strengthened solution-oriented marketing
and sales proposals for corporate clients and business owners
as we strive to provide the detailed support that can only be
provided by regional financial institutions in our aim to be a
bank that grows together with its customers.
010_0550701372309.indd 4 2011/09/30 18:27:39

5
Since the Bank was founded, as part of our corporate philos-
ophy of contributing to regional prosperity, we have been
actively involved in community and public activities, in addi-
tion to conventional banking business such as deposits and
loans.
The “promotion of enduring community contributions”
has been established as one of the basic policies in the new
medium-term management plan, and in our aim to be “a
bank that grows together with the region it serves”, we con-
tinually promote CSR (corporate social responsibility) activi-
ties that serve as a pillar for environmental conservation ini-
tiatives and social action programs.
• Environmental conservation initiatives In 2002, we earned ISO 14001 environmental management
standard and we have continued steady programs to conserve
energy and reduced paper and waste. In addition, we have
actively implemented measures that will contribute to the
prevention of global warming, such as weeding of the Nanto
Forest in Asuka village by employee volunteers and setting
up Recycling Centers to make use of disposed documents.
From last year, the Bank started new environmental conser-
vation initiatives as it installed rooftop gardens at two newly
constructed branches in Osaka prefecture and introduced
electric cars as company cars.
We have made efforts to provide financial backing for
environmental conservation initiatives in the banking busi-
ness through the provision of environmentally-friendly finan-
cial products and services, such as the provision of preferen-
tial interest rates for loans on homes that use wood from
forests in Nara Prefecture.
• Social action programsWe have so far striven to carry out public programs that
include: the Small Kindness Society, which conducts clean-
ups and blood donation in the local community; academic
scholarships through the Nanto Scholarship Society. The
Manyo Charity Walk provides opportunities to walk around
historical sites featured in Manyoshu (a collection of
Japanese poetry) twice a year, in which donations are given
to social welfare councils in accordance with the number of
participants. The Nanto Bank Hockey Team, which was
founded in 1982, promotes social exchange programs with
the local community through hockey. We have thus long con-
tributed to society in a wide variety of ways that take advan-
tage of regional characteristics through unique initiatives.
We have supported the Yoshino Heart Project since 2009,
whose mission is forest conservation through vitalization of
the local industry of Nara Prefecture, forestry industry, and
other related industries. Through promoting the use of woods
produced in Yoshino, we are striving to stimulate the industry
in Yoshino region and preserve forests.
Nanto Bank also participates as a special member of the
Yoshino Cherry Tree Preservation Group, a group that was
founded to protect the shiroyama-zakura (cherry trees
famous for their blossoms) at Mount Yoshino. Many of our
customers supported our Yoshino Cherry Tree Time Deposit
that was made available from January to April 2011, in
which 0.01% of total deposits were donated to a Cherry Tree
Fund. Total deposits for this program amounted to ¥30 bil-
lion.
In tourism, the Commemorative Events for the 1,300th
Anniversary of Nara Heijo-kyo Capital held last year were
successful and had a large positive economic effect.
Centering on the Tourism Planning Office, the Bank will
cooperate with the promotion of activities such as the Post
1,300th Anniversary in the future.
We will continue to be actively involved in initiatives for
community contributions in the future with the local commu-
nity as we strive to increase corporate value.
President Yasuo Ueno
4. Promotion of enduring community contributions
010_0550701372309.indd 5 2011/09/30 18:27:39

Medium
-Term M
anagement Plan
6
Medium-Term Management Plan
The Medium-Term Management Plan—Best Value NANTO
The Bank has launched the Best Value NANTO medium-term management plan. The plan will be enacted from April 2011 to March 2014.
This medium-term management plan represents the sec-ond and final stage of our long-term vision of “aiming to fur-ther increase corporate value - a bank that grows together
with the region it serves”, established in 2008 (a six-year vision), targeting our 80th anniversary in June 2014. This management strategy aims to maintain a balance between profitability and efficiency while seeking sustainable growth.
Specifically, this plan will be implemented based on four basic policies and eight key strategies.
• We will devote ourselves to deployment of business together closely with the local community as we work towards creating business opportunities through improved convenience and solution-oriented marketing for the local community and customers, and strive to improve custom-er satisfaction and strengthen earnings ability.
• To expand the scope of operations and continue to grow in the future, we will work towards establishing new operational bases and strengthen our marketing structure while we make efforts to reinforce stable earnings ability in the market sector.
Key strategies1. Establish a geographically broad-based business office network, which will focus on business loans, by enhancing our office
network mainly in Osaka prefecture2. Expand of personal banking business focused on assets in custody and personal loans, and maintain or increase the loan
market share including business loans, mainly in Nara prefecture; the potential markets3. Construct a long-term and stable earnings structure by strengthening earnings ability in the market sector
I. Increase customer satisfaction and enhance profitability through relationship-based local banking
Corporate philosophy
Pursuing sound and efficient management
Providing superior comprehensive financial services
Contributing to regional prosperity
Striving to become a highly reliable, friendly and attractive bank
1
2
3
4
A positive cycle with stakeholders through improvement of our brand
Improvement in employee motivation
(Employee value)
Improvement in treatment of employees
Improvement in local community and
customer satisfaction(Local community and customer value)
Strengthened financial service provision capabilities
Improvement in shareholder value
Improvement in profitability
010_0550701372309.indd 6 2011/09/30 18:27:40

Medium
-Term M
anagement Plan
7
The Medium-Term Management Plan—Best Value NANTO
• We will invest in key fields and increase the number of sales staff. To make this possible we will streamline headquarters and branch operations, and conduct a comprehensive review of business expenses in an effort to efficiently use corporate resources.
• We will actively strive to foster human resources to support these measures.
II. Efficient use of corporate resources
Key strategies4. Foster human resources with high-level and practical marketing capabilities as well as management abilities for educating and
motivating staff5. Shift staff to the sales sector by streamlining headquarters and branch operations
Key strategies6. Further enhancement of our compliance framework7. More advanced and enhanced risk management
• We will strive towards further strengthening of our compliance framework to gain even more trust from stakeholders.
• For more efficient management of risks and returns, we will work towards more advanced and enhanced management of risks.
III. Enhancement and upgrading of internal control systems
Key strategies8. Enhancement of CSR initiatives
• We will employ corporate resources to make continual contributions to environmental preservation and the
development of the regional society and economy in order to fulfill our corporate social responsibility.
IV. Promotion of enduring community contributions
“Aiming to further increase corporate value— a bank that grows together with the region it serves”
Long-term vision
More Value “NANTO” (April 2008 to March 2011)
Stage 2
Stage 1
(April 2011 to March 2014)
Numerical target
Measures
Four basic policies
Eight key strategies
Best Value NANTO
“Aiming to further increase corporate value— a bank that grows together with the region it serves”
Long-term vision
More Value “NANTO” (April 2008 to March 2011)
Stage 2
Stage 1
(April 2011 to March 2014)
Fiscal year 2013 (the year ending March 31, 2014)
Core operational net profits: over ¥20 billion
Numerical target
Measures
Four basic policies
Eight key strategies
Best Value NANTO
To maintain the balance between profitability and soundness while seeking sustainable growth, we have established a long-term business strategy target based on the outlook on future changes in the business environment and the current awareness at the Bank.
010_0550701372309.indd 7 2011/09/30 18:27:41

Business results for the year ended M
arch 31, 2011.
8
Business results for the year ended March 31, 2011.
Earnings
Ordinary income and net income
Ordinary income increased ¥1.8 billion from the previous fis-
cal year to ¥12.7 billion, thanks to the reversal of general
reserve for possible loan losses, along with an increase in
gains (losses) on bonds (Japanese government bonds, etc.)
Net income decreased by ¥0.7 billion year on year to ¥6.5
billion due to an increase in income taxes.
Ordinary income and net income (Billions of yen)
(30)
(20)
(25)
(5)
0
5
15
10
2009
10.9
7.2
2010
(26.6)
(22.3)
12.7
6.5
2011
Ordinary income Net income
Deposits and loans
Deposits
Deposits increased by ¥63.1 billion from the previous fiscal
year to ¥4,181 billion as a result of the solid growth in both
individual and corporate deposits. This reflects our efforts to
enrich financial products and services, together with our con-
tinued focus on stable fund raising.
Deposit balance (Billions of yen)
0
3,000
3,500
4,000
2009 2010
4,083.2 4,117.9
2011
4,181.0
Loans
We focused on smooth supply of fund in a variety of forms to
meet the needs of middle market enterprises as well as small
and medium-sized enterprises on top of individual customers
in an effort to promote community-focused financial servic-
es, while actively responding to the demand for funds of the
local governments.
Nonetheless, the balance of loans decreased by ¥20.9 bil-
lion from the previous fiscal year to ¥2,709.6 billion as cor-
porate demand for funds remained stagnant under the current
severe climate in the local economy.
Loan balance (Billions of yen)
0
2,000
2009 2010
2,854.5
2,730.5
2011
2,709.6
2,500
3,000
010_0550701372309.indd 8 2011/09/30 18:27:41

Business results for the year ended M
arch 31, 2011.
9
Capital adequacy ratios
As of March 31, 2011, consolidated capital adequacy ratio
was 11.74%, which was far beyond the 4% benchmark
required of banks subject to domestic standards.
Based on the Tier 1 measure, which consists of fundamen-
tal items as core capital and retained earnings, the consolidat-
ed capital ratio stood at 10.20%, maintaining high levels.
Capital adequacy ratio (%)
0
14.00
12.00
8.00
10.00
6.00
4.00
DomesticStandards
2.00
2009 2010
10.06
12.12
2011
11.74
Tier I ratio (%)
0
3.00
6.00
9.00
12.00
20102009
9.57
2011
10.20
8.63
Bad debts
Risk-managed loans
Risk-managed loans, under the Banking Law, comprised of
Loans to Bankrupt Obligors, Delinquent Loans, Loans Past
Due Three Months or More, and Restructured Loans. They
refer to loans only. As of March 31, 2011, the balance of
risk-managed loans totaled ¥87.5 billion, representing 3.23%
of total loans outstanding, an increase of 0.03 points year on
year.
Risk-managed loans
(%)Loans(Billions of yen)
0
40
80
120
3.00
4.00
5.00
6.00
2009
2.0
23.8
67.4
3.897.1
2010
3.315.6
65.9
2.687.5
RatioLoans Past Due Three Months or MoreLoans to Bankrupt Obligors
Restructured LoansDelinquent Loans
3.40
2011
2.0
68.2
1.787.5
3.2315.43.20
010_0550701372309.indd 9 2011/09/30 18:27:41

Corporate G
overnance
10
Corporate Governance
One of our most important management priorities includes enhancing management transparency and efficiency and realiz-ing fair management. These factors earn us the strong confi-dence of our customers, stockholders and other stakeholders, allowing us to fulfill and strengthen corporate governance.
Also, they allow for continuously increasing corporate values responding to the expectations of the aforementioned parties. The main aspects of the corporate governance system are as follows (as of July 1, 2011).
Corporate Governance Structure
Stockholders’ MeetingAppointment/DismissalAppointment/Dismissal
Appointment/Dismissal/SupervisionDiscussion Session
Report
Instruction Supervision
CooperationReport Report
Consent of Appointment and Reappointment/Judgment of Reasonableness of Auditing
Appointment/Dismissal
Report
Report
Review
Evaluation
AuditingInternal Auditing
Co-operation
Assistance
Accounting A
uditor
Corporate A
uditor’s O
ffice
Internal Audit Division
Board of C
orporate Auditors
(5 Corporate A
uditors (including 3 External Corporate A
uditors))
Board of DirectorsAuditing
President
Managing Directors’ Committee
(14 Directors)
(Deliberation of Important Cases)
Headquarters Branches ConsolidatedSubsidiaries
Group Operation Conference
CommitteesALM Committee
Compliance Committee
(As of July 1, 2011)
(Titled Directors/Standing Corporate Auditors)
Matters related to Corporate Auditors and the Board of Corporate Auditors
Internal Audit and Corporate Auditors’ AuditThe Internal Audit Division consists of 41 staff members with necessary knowledge and experience. This division is responsible for internal audits, and it preserves independence from the departments that are audited. Audit results are reported to the Managing Directors’ Committee and the Board of Directors.
In regards to the corporate auditors’ audits, operational audits and accounting audits are performed at the sole discre-tion of such auditors. Audit results are reported to the Board of Corporate Auditors, Representative Directors, and the Board of Directors.
Systems to Ensure Proper Conduct of Business In order for the Bank to ensure the proper conduct of its business, the Board of Directors made a decision to manage the structure outlined below.
● System to ensure that execution of duties is conducted in conformance with laws, regulations, and articles of incorporation (Compliance system)● System for retention and control of information● System for management of risk of loss (Risk management system)● System for efficient conduct of execution of duties● System to ensure proper conduct of business in the corporate group comprising the Bank and subsidiaries ● System to ensure effectiveness and independence of auditing by corporate auditors, and other systems, etc.
Corporate Governance SystemThe Board of Directors, comprising 14 directors, plays a cen-tral role in our corporate governance system. The Board of Directors Regulations is strictly applied, and prompt and effi-cient decision making is undertaken.
The Board of Directors holds a regular meeting once a month in principle, and it convenes extraordinary meetings as necessary. At meetings of the Board of Directors, deci-sions are made on important managerial matters and opera-tional execution, and all corporate auditors attend. In addi-tion, reports concerning operational execution and various committees are made.
Additionally, the Managing Directors’ Committee Meeting, comprising the chairman, the president, the senior managing directors (1 person), and the managing directors (3 persons) is held once a week in principle as a decision mak-ing institution for important matters concerning daily man-agement. Thereby, prompt decision making is attempted.
Moreover, in order to supplement appropriate operational execution in response to diversification and advancement of operations, committees such as the ALM Committee, the Compliance Committee, and the like have been established.
The Bank is structured with a corporate auditor system con-sisting of two full-time corporate auditors with profound knowledge of bank operations, finance and accounting and three highly independent external corporate auditors (inde-pendent officers). The five corporate auditors combine their knowledge and capabilities to enhance the effectiveness and transparency of audits conducted by the corporate auditors and the Board of Corporate Auditors.
To ensure that all management decisions are fair and legal, the corporate auditors properly monitor and audit the
directors in performance of their duties in various ways, including by attending meetings of the Board of Directors, the Managing Directors’ Committee, and other committees, as well as presenting their opinions.
The Board of Corporate Auditors meeting is held once a month in principle and also on an ad-hoc basis as needed. The Corporate Auditor’s Office assists the Board of Corporate Auditors with three full-time staff members.
010_0550701372309.indd 10 2011/09/30 18:27:42

Com
pliance
11
Compliance
Compliance refers to strict observance of ethics and social
norms as well as laws, regulations, government ordinances,
and the bank’s regulations. This is essential for banks to
faithfully carry out our social responsibilities and public
missions.
The Bank takes the following approaches in order to
increase awareness of compliance and respond to legal risks.
The term “legal risk” refers to risk of incurring loss or dam-
age arising from violation of obligations resulting from neg-
ligence concerning customers and inappropriate business
and/or market practice.
The Bank has attempted to avoid and mitigate legal risks
via legal examination by external experts, such as corporate
lawyers, and the Compliance & Risk Management Division.
Responses to Legal Risk
Thorough Execution of Compliance
● In recognition of the public missions and social responsibilities that financial institutions need to perform, the Bank regards
compliance with laws and regulations as the most important management issues and established Charter of Corporate Behavior,
which consists of Basic Policies and Code of Conduct, for all officers and employees to follow to gain trust from all stakeholders
including local communities, our customers and shareholders.
● To establish a basic framework for the compliance system, we have set our compliance regulations, established rules for
disciplinary action, and demonstrate fairness and transparency in the administration of disciplinary action as means of
establishing a clear stance on compliance with laws and regulations.
● Deliberations and decisions of matters related to compliance are the responsibility of the Compliance Committee, which is
chaired by the President and operates horizontally across the bank’s organization. Plans and supervision of compliance are carried
out in the Compliance & Risk Management Division.
● A Compliance Program consisting of concrete plans to achieve compliance is drawn up each year and undergoes appropriate
review.
● The Bank strives to properly operate a Compliance Hotline internal reporting system that was established to prevent legal
violations and misconduct before they occur, to discover them promptly if they occur, and to rectify them immediately.
● To instill a compliance mindset throughout the Bank, we have compiled a Compliance Handbook, which serves as a guidebook
for achieving compliance and has been distributed to all officers and employees, and regularly conduct group training and
seminars at the workplaces of individual workgroups.
● The Bank has established the Regulations on Response to Antisocial Forces in order to take a resolute stand against anti-social
forces that pose a threat to the order and security of civil society and take strong measures to intervene and block any attempt to
create any relationship with the Bank.
010_0550701372309.indd 11 2011/09/30 18:27:42

Risk M
anagement
12
Risk Management
Risk Management Coordination
Board of Corporate Auditors
ALM Committee(ALM Small-Committee)
System Risk Committee
Board of Directors
Emergency Council(Warning Council)
External Auditing
Internal Audit Division
Divisions of Headquarters/Branches/Consolidated Subsidiaries
Committees
Supervising Division
Organization
Credit Risk
Credit AnalysisDivision
Market Risk
Compliance &Risk Management
Division
Liquidity Risk
Compliance &Risk Management
Division
Risk Categories
Main Divisionin Charge
Operation
Auditing
Compliance Committee(Compliance Small-Committee)
Risk Management Structure
Compliance & Risk Management Division Compliance & RiskManagement Division
ComplianceCompliance &
Risk ManagementDivision
Operational Risk(Compliance & Risk Management Division)
Compliance Structure
Legal RiskCompliance &
Risk ManagementDivision
Risk Management Structure
Tangible Assets RiskPersonnel RiskReputational RiskSystems RiskAdministrative RiskGeneral Affairs
DivisionPersonnelDivision
General PlanningDivision
Operations ControlDivision
Operations ControlDivision
Managing Directors’ Committee
General Managers’ Committee
Headquarters Deputy General Managers’ Committee
( ) ( ) ( ) ( )( ) ( ) ( ) ( ) ( ) ( )
( )
In recent years, the management environment surrounding financial institutions has changed drastically, and the risks they face have become more diversified and complex.
In such an environment, the Bank regards risk manage-ment as one of its most important management issues and
aims to create an advanced risk management system, so that the Bank can maintain appropriate and sound management and provide reliable services to its customers.
To cope with the various risks that the Bank faces in operat-ing its banking business, it has established specified units for each category of risk. The Bank also incorporates the Compliance & Risk Management Division responsible for the risk management coordination, in order to gain a precise understanding of areas and sizes of risks and take expeditious steps towards them.
Furthermore, it defines its basic risk management policies in risk management regulations and other requirements including the Risk Management Coordination Regulations, in an effort to appropriately manage the risks.
The Bank has adopted a policy of Risk Management Coordination, under which it quantifies various risks by
using the integrated risk management method, intending to keep the amount of risks and its capital adequacy at appropri-ate levels in the light of its management vitality. Biannually, the Bank determines risk capital (risk based amounts) for each category of risk within the scope of its capital adequacy, with a view to limiting the value of each risk (e.g. VaR) to the amount of risk capital.
The situation of each risk is evaluated at a monthly ALM Committee meeting, which decides the appropriate level of risk control to implement, aiming at conducting more effec-tive and efficient risk and return management from the view-point of maintaining sound management and higher profit-ability alongside effective utilization of capital.
010_0550701372309.indd 12 2011/09/30 18:27:42
Risk M
anagement
13
Managing Internal Capital refers to the implementation of
measures to maintain a sufficient level of internal capital,
capital adequacy assessment and computation of the capital
adequacy ratio.
The Bank conducts a quarterly assessment of its internal
capital adequacy by analyzing factors that cause the capital
adequacy ratio and Tier I ratio to fluctuate.
We also use the integrated risk management method to
quantify the various risks faced by the Bank, and we regular-
ly compare the level of these risks with internal capital so as
to control each risk and carry out the assessments of our
internal capital adequacy for each risk.
As for the capital adequacy assessment, the Bank posi-
tions itself to be able to review the allocation of its internal
capital, discuss necessary internal capital strategies and other
necessary actions through the monthly-held ALM Committee
meeting. We intend to maintain a sound management with
the help of appropriate risk control practices and increase
profitability through the effective utilization of our internal
capital, by fully operating this internal capital management
structure.
• Managing Internal Capital
To ensure the continuing soundness of its assets, the Bank
manages credit risk under a credit screening structure that
operates independently of marketing operations.
We have established the Credit Analysis Division as a risk
management body that is responsible for examining the cred-
it standing of customers, loan screening and the management
of claims.
The Credit Analysis Division consists of the Credit
Analysis Group, which handles general screening and indus-
try-specific screening; the Management Group, which inten-
sively supervises borrowers whose business performance has
deteriorated; and the Corporate Finance Support Office,
which was established to assist borrowers with business
restructuring and recovery initiatives. Together these units
form a structure that supports flexible risk management tai-
lored to the specific circumstances of each customer.
Our credit analysis and risk management measures
include rigorous self-assessment, credit rating which is con-
sistent with the borrower classifications used in self-assess-
ment and other methods, with which the Bank subjectively
recognizes and manages each customer’s credit capability. In
addition, we have a policy of setting an interest rate (Pricing)
to be applied to individual customers according to their rat-
ing-based creditworthiness. Through this, we take measures
to strengthen our credit risk management and increase profit-
ability.
The Bank regularly and appropriately reviews transaction
terms, and establishes credit limits to the borrowers with debt
exceeding a certain amount, with a view to reducing credit
risk by conducting strict credit control.
For the management of overall loan portfolios, the Bank
has worked on more efficient assessment support system by
using several systems, including segment analysis, e.g.
industry-based or rating group-based analysis, a real estate
collateral evaluation system, designed to refine the quantified
collateral evaluation of credit risk which calculates possible
losses in future by using statistical methods, etc.
• Managing Credit Risk
Asset Appraisals are for the review of individual assets held
by a financial institution in order to comprehend the accurate
status of the institution’s assets. It is an important method of
credit risk management and a preliminary procedure to
appropriately determine the amount of depreciation and
allowances. Asset assessment conducted by the financial
institution itself is referred to as a self-assessment.
The Bank carries out the following assessment of its
assets. Actual assessments are conducted by its operating
branches, in conformity to the Regulations on Self-
Assessment of Assets. Assessment results are then subjected
to a rigorous verification process, where the results are exam-
ined by the Credit Analysis Division further audited by the
Internal Audit Division. According to the audit results, the
Bank determines appropriate amounts of depreciation and
allowances. In this way, it strives to perform appropriate
asset assessment practices and maintain and improve the
soundness of assets.
• Managing Asset Appraisals
010_0550701372309.indd 13 2011/09/30 18:27:42

Risk M
anagement
14
Liquidity risk, known as fund-raising risk, is defined as the risk of the Bank making a loss, due to the possibility of encountering an obstacle in raising the required funds either because of a mismatch between the use and procurement of funds or an unexpected outflow of funds; or being forced to borrow at higher interest rates than usual.
According to monthly fund management plans formulated by the ALM Committee, the Securities and International Division closely manages the Bank’s cash flow position on a day-to-day basis and the Compliance & Risk Management
Division monitors the management conditions. The ALM Committee is also responsible for overall monitoring and management of cash flow risk, including the monitoring of assets available for liquidation and the amount of funds that the Bank can procure.
The cash flow situation is classified into one of three lev-els according to financial situations: “regular phase,” “con-cern phase” and “crisis phase.” The Bank has developed management systems that can be flexibly implemented in each of these situations.
• Managing Liquidity Risk
Operational risk is the risk of the Bank management result-ing in the Bank making a loss, due to inadequate or failed processes of banking operations, activities of executives and employees (including part-time and temporary and other similarly classified workers) or systems, as well as external events.
At the Bank, departments in charge of operational risks apply the perspectives of specialists to the management of
administrative risk, systems risk, reputational risk, personnel risk, tangible assets risk and legal risk.
Operational risk should be reduced to a minimum for smooth management of operations, therefore the Bank intends to establish better and more efficient structure and systems in order to adequately cope with the risk, aiming to prevent materialization of the risk or minimize the effect of materialized risk.
• Managing Operational Risks
Administrative risk refers to the risk of loss-making as a result of neglecting accurate administrative processes along-side occurrences of accidents or fraud.
The Bank reinforces the provisions of Administrative reg-ulations and requires strict staff compliance with the regula-tions to achieve customer confidence in its accurate and strict
administration. At the same time, the Bank aims to raise staff administrative work standards by conducting regular training programs or temporary office work guidance. Separately, the Bank intends to establish more accurate and efficient admin-istrative operations by facilitating the systemization and cen-tralization of administrative processes.
• Managing Administrative Risk
The Bank controls its market operations under a system of reciprocal checks and balances based on a clear demarcation between front office units, which implement transactions, and back office units, which carry out administrative process-ing. The middle office unit responsible for risk management is the Compliance & Risk Management Division, which develops risk management systems, checks compliance with risk management regulations and other requirements and monitors the positions and profit performance of market units. The Compliance & Risk Management Division also carries out wide-ranging analyses to quantify the risk levels of assets and liabilities, including deposits, loans and securi-ties. In its analyses, the division uses a variety of analytical techniques, including the value at risk (VaR) and basis point value (BPV) methods and interest rate fluctuation simula-tions. The results of this work are used to provide timely reports to management.
Allowable risk limits are measured based on VaR and determined by the Bank’s ALM Committee biannually, in consideration of its capital status, market conditions and other factors. Market operation staff members make efforts to gain profits while complying with these allowable risk limits. Every month, ALM Committee obtains actual risk and reve-nue results from each market operation and discusses appro-priate ways to control risks and generate earnings efficiently by taking account of the market prospects and other condi-tions. In addition to this, with regard to the stress test which measures the impact on the Bank from the markets’ extreme fluctuations exceeding VaR projections, the Bank is aware of the maximum scope of fluctuation in each market for the last 10 years, bracing up for contingency events.
• Managing Market Risk
Risk Management
010_0550701372309.indd 14 2011/09/30 18:27:43

Risk M
anagement
15
Reputational risk refers to risk of suffering a loss if an orga-nization has fallen into discredit due to the deterioration of its reputation or through damaging rumors, etc.
The Bank recognizes the danger of impact from reputa-tional risk to its operations and communities; therefore it
incorporates a system to prevent the materialization of the risk. In the event of the spread of damaging rumors about the Bank, its system will take appropriate and swift action to curtail them and retrieve the situation.
• Managing Reputational Risk
Personnel risk is the risk of that the Bank makes a loss due to talent drain or retirement, slack workplace safety manage-ment or fraudulent activities by officers or staff members.
The Bank recognizes that personnel risk can have a major impact on the Bank’s management and business operations and strives to establish, maintain and improve preparedness to effectively manage such risk.
Through day-to-day personnel management, the Bank ascertains the extent of the impact that personnel risk has on its business operations and responds with personnel develop-ment and personnel assignments that ensure the smooth con-duct of its business.
• Managing Personnel Risk
Tangible assets risk involves the risk of loss from damage to tangible assets as a result of disasters, crime, insufficient asset management, etc., or similar.
Tangible assets refer to personal property and real estate, such as owned or leased land, buildings, equipment attached to buildings and fixtures and fittings.
The Bank recognizes that the eventuation of tangible assets risk could have a major impact on the execution of business and endeavors to minimize the risk by developing, enhancing and upgrading systems for ascertaining and man-aging such risk.
• Managing Tangible Assets Risk
Along with the above risk management, in order to respond suitably to the occurrence and materialization of crises relat-ed to business operations such as a natural disaster or sys-tems malfunction, the Bank is now appropriately positioned to manage these crises, having formulated a Crisis Management Plan and response manuals to tackle each type of crisis.
When a crisis occurs, the Bank responds by having an Emergency Council, Response Headquarters or other organi-zation gather information and engage in centralized supervi-sion and command to minimize the impact of the crisis on its business operations.
Crisis Management Posture
For the enhancement and reinforcement of risk management, it is necessary to verify the effective function of the internal control and improve problems as needed.
The Internal Audit Division, an internal auditing organiza-tion, promotes risk management and strives to ensure the
soundness of management and the appropriateness of busi-ness by ascertaining the risk management situation at the division and branch levels, evaluating and verifying that internal control is appropriately maintained and functioning effectively, and providing advice as necessary.
Internal Audit Posture
The Bank incorporates a system which copes with unexpect-ed system failures or network errors and swiftly resumes operations. It is prepared for these events with stand-by equipment for each of the existing equipment in the network system and dual communication lines. Also, it has formulat-ed a manual which directs necessary action as defined by its contingency plan in the event of a large scale disaster, devel-oped a decentralized data administration system and “back-up center”.
With a view to conducting strict control of customer data and other confidential information, the Bank takes various measures to prevent unauthorized use of the computer sys-tem or leakage of information. It addresses the provision of safer and more assured services by establishing security mea-sures such as the formulation of handling regulations for classified data, encryption of computer data and important information, e.g. security codes, and others.
• Managing System Risk
010_0550701372309.indd 15 2011/09/30 18:27:43

Managem
ent System R
egarding Custom
er Protection
16
Management System Regarding Customer Protection
The Bank regards the increasing protection and convenience of our customers as one of the most important management priority, together with the compliance. We have, therefore,
put in place a management system regarding customer pro-tection to maintain the trust that customers place in us.
Arrangement of Management System regarding Customer Protection
In order to increase the protection and convenience of our customers, the Bank has established the following five cate-gories under the Management Policy Regarding Customer Protection.
The Solicitation Policy related to sales of financial instru-ments for Customer Explanation Management, the Personal
Based on the aforementioned Policies, the Bank has estab-lished Management Regulations Regarding Customer Protection. These have regulated a basic framework for the management system regarding customer protection. At the same time, associated rules and a manual have been estab-lished. Furthermore, responsible personnel and management divisions for each category related to customer protection have been established. Thereby, a regulation system and an organizational system have been arranged.
Additionally, measures related to management regarding customer protection have been included within the
Information Protection Policy related to protection and treat-ment of personal information for Customer Information Management, and the Management Policy on Conflicts of Interest for Management of Conflicts of Interest have been separately regulated and publicized.
Compliance Program, such as familiarization and dissemina-tion of the importance of management regarding customer protection for officers and employees through training imple-mentation. Such measures are discussed and formulated at the Compliance Committee. Thereby, improvement of man-agement system for customer protection has been continu-ously attempted.
As part of customer support arrangement, the Bank is sub-scribing to the service of the Japanese Bankers Association, which is one of the certified Alternative Dispute Resolution bodies under the Banking Act.
● Customer Explanation Management Appropriate and sufficient explanations for customers
● Management of Customer Support Appropriate and sufficient responses to customer’s requests
● Customer Information Management Appropriate and sufficient management of customer
information
● Outsourcing Management Appropriate management of outsourced operations
regarding customer information and communication
● Management of Conflicts of Interest Appropriate management of transactions that have the
likelihood of causing conflicts of interest in order not to illegally damage customer benefits
Management System Regarding Customer Protection
Board of Directors Managing Directors’ Committee
Compliance Committee
Management Regarding Customer Protection
Category Customer Explanation Management
Management of Customer Support
Customer Information Management Outsourcing Management Management of Conflict
of Interest
Responsible Personnel
Personnel Responsible for
Customer Explanation Management
Personnel Responsible for Management of
Customer Support
Personnel Responsible for Controlling
Information Management
Personnel Responsible for Information Management
Personnel Responsible for
Outsourcing Management
Personnel Responsible for Management of
Conflicts of Interest
Supervising Division Compliance & Risk Management Division
Main Division in Charge
General Business DivisionCredit Analysis Division
Compliance & Risk Management Division
Compliance & Risk Management Division
Compliance & Risk Management Division
Compliance & Risk Management Division
Report Instruction/SupervisionTraining/Familiarization Monitoring
Branches/Headquarters
General Manager and Branch Manager/Compliance Officer
Board of Corporate Auditors
Internal Audit Division
Supervision
Instruction
010_0550701372309.indd 16 2011/09/30 18:27:43

Initiatives for Local D
evelopment
Support Programs for L
ocal Business
17
Initiatives for Local Development
Venture Business Support Office
In addition to support for financing for venture companies
during their founding and business development stages, we
conduct business consultations in collaboration with research
institutions, including public institutions and universities.
Support Programs for Local Business . . . . . . . . . . . . . . . . . . . . . . . . . . . . . . . . . . . . . . . . . . . . . . . . . . . . . . . . . . . . . . . . . . . . . .
Corporate Solutions Team
Asia Business Support Group
The expert staff at our Value Creation Division’s Support and
Sales Group conducts solution-oriented marketing and sales
that respond accurately to the challenges that our customers
are facing by offering a wide variety of financing and consul-
tation services, including business matching, succession sup-
port, M&A advice, derivatives products and syndicate loans.
We have created an Asia Business Support Group in order to
support the overseas business of local companies, with a
focus on Asia. As of March 31, 2011, the group has provided
support a cumulative total of 2,550 times, including provi-
sion of information and business assistance by our overseas
representative offices.
Our overseas representative offices in Hong Kong and
Shanghai also offer a full range of information in addition to
organizing business fairs, exchanges, and seminars in collab-
oration with regional banks.
● Business matching● Business succession supports● M&A advisory● Derivatives● Syndicate loans● Collaboration with academic institutions
● Business venture financing program● Investment through investment funds● Support for IPOs (market driven services)
● Information about expanding overseas● Support and advice for overseas business● Support for procuring financing at overseas sites● Holding of overseas strategy seminars● Implementation of overseas inspection missions● Overseas business matching
Overseas Business Seminars in Japan and Other CountriesSeminars held included the “New Year Chinese Business Seminar ” in Osaka on January 20, 2011, the “the Second Hong Kong and South China Business Seminar” in Shenzhen, Guangdong Province, China, on March 22, and the “5th Shanghai Business Seminar”, in Shanghai, China, on March 23.
140 participants joined the seminars, including customers who are developing businesses in China. Up-to-date local information and effective strategies were presented in response to the needs for expansion of sales channels in China that attracted growing interest.
010_0550701372309.indd 17 2011/09/30 18:27:43

Contributions to the L
ocal Com
munity (C
SR Initiatives)
Promotion of environm
ental conservation initiatives
18
Contributions to the Local Community (CSR Initiatives)
Promotion of environmental conservation initiatives . . . . . . . . . . . . . . . . . . . . . . . . . . . . . . . . . . . . . . . . . . .
Commitment to Environmental Conservation
About our CSRAt Nanto Bank, one element of our business philosophy is contributing to regional prosperity. Since our establish-ment, we have provided a smooth flow of funds and business improvement support to local corporations and actively pursued financing that is strongly tied to the region. We have also fulfilled our community and public roles as a regional financial institution in various areas, including environmental preservation and contribution to society.
One of the basic policies in our medium-term management plan is promotion of enduring community contributions and we strive to enhance our CSR program.
We will fulfill our social responsibilities by making good use of the Bank’s corporate resources to take an active role in efforts toward development of local community and economy, and environmental conservation in the region.
Outside Recognition of Nanto Bank’s CSR Activities
● UK FTSE Group The Bank’s stock included in constituents of FTSE4Good, an SRI stock index (2008)
● Kinki Local Finance Bureau Award toward ‘Support and assistance for the Yoshino Heart Project’ (2009)
● Kinki Regional Agricultural Administration Office
Director-General Award in Corporate Lunch Menu Contest for Promotion of Kinki Local Production for Local Consumption (2010)
● Nara Prefecture (Governor) Letter of Appreciation to Nanto Nara Support Group, a volunteer group organized by former employees of the Bank, acting as a tour guide (2010)
* The FTSE4Good Index Series is a stock index designed by Britain’s FTSE that consists of companies meeting globally recognized standards in corporate social responsibility.
The Bank obtained ISO 14001 environmental management certification at its headquarters and Business Support Center in 2002. In January 2009, it also obtained certifications for four new locations including its Recycling Center and Training Center.
The certified divisions continue to work to preserve the environment in accordance with the ISO standard. The entire Nanto Group is united in its commitment to environmental conservation even at branches and subsidiaries not covered
by the standard, such as using cooler attire in summer and incorporating greener practices into day-to-day operations.
New initiatives include the introduction of electric vehi-cles as company cars in January of this year, in addition to using bond investment to contribute to measures against global warming by purchasing US$20 million in Green Bonds newly issued by the World Bank in February.
Our environmental conservation initiatives have been highly praised by various external institutions.
• Commitment to ISO Environmental Standard
Outside Recognition of Nanto Bank’s Environmental Preservation Activities
● City of Nara Environmental Award (2002)
● Organization of Kansai Unity Promotion of Kansai Eco-Office Award (2005)
● Nara Prefecture (Governor’s Commendation) Meritorious Service to the Environment (2006)
● Promotion of environmental conservation initiatives
● Promotion of Social Action Program
010_0550701372309.indd 18 2011/09/30 18:27:44

Contributions to the L
ocal Com
munity (C
SR Initiatives)
Promotion of Social A
ction Program
19
Promotion of Social Action Program . . . . . . . . . . . . . . . . . . . . . . . . . . . . . . . . . . . . . . . . . . . . . . . . . . . . . . . . . . . . . . . . . . . . . . . . .
Initiatives for Promotion of Forestry
Seventy-seven percent of Nara Prefecture is forested, which is above the national average for Japan, and many of its for-ests are located in the Yoshino area. In the past, forestry was a booming industry in Nara Prefecture, but in recent years lower prices for wood and the circulation of materials pro-duced overseas have led to continuing stagnation. The Bank
supports the vitalization of forestry in Nara Prefecture with a focus on the Yoshino area by using our unique corporate resources and collection of information to expand sales chan-nels for materials produced in Nara, mainly the Yoshino wood.
The Bank supports the Yoshino Heart Project as part of our CSR commitment. The project’s goal is to stimulate demand for goods and materials produced in Yoshino, by populariz-ing the Yoshino Heart brand for wood products made using cedar, cypress, and other types of wood grown in the Yoshino forest.
The project’s ultimate aims are:1. Vitalizing the forestry and related industries in Yoshino2. Protecting the global environment by absorbing CO2
through forestationA part of the proceeds from this project goes toward for-
est development and management, including tree planting and thinning.
In December 2009, the Bank received an award for this project from the Director-General, Kinki Local Finance Bureau, as an outstanding initiative to “contribute to the cre-ation of a sustainable local economy using local information assets (local restoration)” in relationship-based local bank-ing.
The Bank has strived to raise awareness of the need for forest conservation and forestry vitalization through its Kizukai Activities (the Wood Movement), by distributing dis-posable chopsticks made of Yoshino wood, and using posters and pamphlets made of Yoshino 3.9 paper utilizing materials including thinned trees. We are now working in collaboration with Nara Prefecture and other organizations to support busi-ness matching related to the development, production, and sale of wooden products like tools used in everyday life and toys that reach the consumer directly. In December of last year the “The Mori (forest) Cafe and Dinning Comfort” opened in Toranomon in Tokyo (decorated with Yoshino wood, with a menu featuring Yoshino and Nara produce) to serve as a center for information with the aim of winning new supporters for Yoshino wood and developing further demand for wood materials.
• Yoshino Heart Project
It is our belief that use of wood products contributes to forest conservation, prevention of global warming, and other posi-tive effects as an effective environmental measure. Therefore, we offer housing loans at preferential interest rates with reduction of 0.1% per annum in addition to our usual prefer-ential interest rates for new houses constructed using Nara Prefecture wood.
By promoting use of Nara Prefecture wood in new hous-ing construction, we contribute to environmental conserva-tion as well as conservation of local forests and vitalization of the industry.
• Preferential Interest Rates Housing Loans for Houses Using Woods Produced in Nara Prefecture
Kizukai Activities (the Wood Movement) and Yoshino Heart ProjectThe Wood Movement is restoring Japan’s forests to a sound cycle, by making active use of Japanese-grown wood, through tree plant-ing, thinning, and other activities, and creating healthy forests that will absorb plenty of CO2. In November 2008, the Bank became the first member of the banking industry to be authorized to use the Kizukai Activities logo promoted by Japan’s Forestry Agency.
As part of its support for the Yoshino Heart Project, the Bank highlights the importance of using wood for the environment by dis-tributing environmentally friendly wood products, and using Yoshino 3.9 Paper, and these activities are also linked to the Wood Movement.
B-(3)-080031Thank You Green Style logoYoshino Heart logo
010_0550701372309.indd 19 2011/09/30 18:27:44

Contributions to the L
ocal Com
munity (C
SR Initiatives)
Promotion of Social A
ction Program
20
Contributions to the Local Community (CSR Initiatives)
Nanto Bank Hockey Team
On the occasion of the 1982 “Wakakusa” National Sports
Festival, we created a women’s hockey team, contributing to
the promotion of sports in Nara prefecture, “the Hockey
Kingdom”, by producing excellent players, including those
representing Japan in the Olympic Games.
In addition, we make an effort to be involved with the
local community through various activities such as inviting
elementary and junior high school students to hockey schools
organized by the Bank.
Small Kindness Society
The Nanto Bank’s Small Kindness Club carries out a wide
variety of public service activities, such as cleanups and
blood donations with the aim of creating a cheerful local
community.
Nanto Scholarship Society
In order to assist with fostering human resources in the local
community, academic scholarship is provided for high school
and university students of outstanding character and academ-
ic ability, who reside in Nara Prefecture.
As of April 2011, there are 73 students currently on schol-
arship, and the total number of graduates is 1,251.
Meeting the Needs of the Visually Impaired
For all ATMs (including those outside branches), the Bank
has adopted universal design specifications with features
making them accessible to the elderly, the visually impaired,
and those in wheelchairs. In addition, at the request of cus-
tomers, we provide account balance and transaction records
in Braille, and make bank book cases and card cases with the
account name and number in Braille.
*Special features of our ATMs
• Large, easy-to-read letters (enlarged display also available)
• Easy-to-operate Voice Guidance System
• Easy access to the display screen for wheelchair users
Enhancing the Barrier-Free Environment at Branches
We strive for barrier-free construction in our branches so that
the elderly, children, and people with disabilities can use our
branches at ease.
In addition, we promote office construction that incorpo-
rates considerations toward the environmental issues by
adopting LED (light emitting diode) lighting and rooftop gar-
dens to reduce CO2 emissions, using Yoshino cedar material
for interior office panels as well as other measures.
*Special features of our barrier-free branches
• Reserved parking spaces for wheelchair users
• Textured paving blocks to guide the visually impaired
• Eliminating steps and bumps
010_0550701372309.indd 20 2011/09/30 18:27:45

Board of D
irectors and Corporate A
uditors
21
Board of Directors and Corporate Auditors(As of July 1, 2011)
Taro HayamaManaging Director(Osaka Chuo Office)
Takashi HashimotoManaging Director(Osaka Regional Headquarter)
Kohsaku YoshidaManaging Director(Securities & International Division)
Yasuo ShimakawaSenior Managing Director(Representative Director)
Masaaki HashimotoManaging Director
Hiroki MatsuokaManaging Director
Hiromune NishiguchiChairman(Representative Director)
Yasuo UenoPresident(Representative Director)
ChairmanHiromune Nishiguchi
PresidentYasuo Ueno
Senior Managing DirectorYasuo Shimakawa
Managing DirectorsMasaaki HashimotoHiroki MatsuokaTaro Hayama(Osaka Chuo Office)
Takashi Hashimoto(Osaka Regional Headquarter)
Kohsaku Yoshida(Securities & International Division)
Directors And General ManagersHideaki Mitsuhashi(General Planning Division)
Yoshihiko Kita(Tokyo Branch and Tokyo Liaison Office)
Naoki Minowa(Head Office)
Takeyoshi Tamura(Value Creation Division)
Hideaki Nishimoto(Operations Control Division)
Yoshiaki Morita(General Business Division)
Standing Corporate AuditorTakahiko Sakamoto
Corporate AuditorsYasuo HoriuchiHiroyuki SakaiAkihiko MinatoMitsuhiko Noguchi
Note: Hiroyuki Sakai, Akihiko Minato and Mitsuhiko Noguchi are outside corporate auditors pursuant to Item
16, Article 2 of the Company Law.
010_0550701372309.indd 21 2011/09/30 18:27:49

2222
Consolidated Financial Statements
Consolidated Balance Sheets
Millions of yen
Thousands ofU.S. dollars
(Note 1)
2011 2010 2011
Assets:Cash and due from banks (Notes 5 and 6) .................................................... ¥ 91,151 ¥ 124,821 $ 1,096,223 Call loans and bills bought (Note 6) ............................................................. 3,429 2,145 41,238 Commercial paper and other debt purchased (Note 6) .................................. 4,716 4,421 56,716 Trading account securities (Notes 6 and 7) ................................................... 786 1,831 9,452 Money held in trust (Notes 6 and 7) .............................................................. 24,500 24,500 294,648 Securities (Notes 7 and 14) ........................................................................... 1,668,948 1,560,110 20,071,533 Loans and bills discounted (Notes 6 and 14) ................................................ 2,709,612 2,730,540 32,587,035 Foreign exchanges ......................................................................................... 1,434 1,241 17,245 Lease receivables and lease investment assets .............................................. 15,472 16,593 186,073 Other assets ................................................................................................... 21,468 31,703 258,184 Tangible fixed assets (Note 8) ....................................................................... 41,999 42,462 505,099
Building .................................................................................................... 12,264 11,928 147,492 Land .......................................................................................................... 24,798 24,733 298,232 Construction in progress ........................................................................... 307 741 3,692 Other tangible fixed assets ........................................................................ 4,629 5,058 55,670
Intangible fixed assets ................................................................................... 10,168 11,808 122,285 Software .................................................................................................... 9,083 8,658 109,236 Other intangible fixed assets ..................................................................... 1,084 3,150 13,036
Deferred tax assets (Note 9) .......................................................................... 31,086 34,278 373,854 Customers’ liabilities for acceptances and guarantees .................................. 15,410 17,809 185,327 Reserve for possible loan losses (Notes 6 and 10) ........................................ (31,624) (35,499) (380,324)
Total assets ................................................................................................ ¥ 4,608,561 ¥ 4,568,768 $ 55,424,666
Liabilities and net assets:Liabilities:
Deposits and negotiable certificates of deposit (Notes 6 and 14) ................. 4,181,096 4,117,975 50,283,776 Payable under securities lending transactions (Notes 6 and 14) ................... 116,109 83,573 1,396,380 Borrowed money (Notes 6 and 14) ............................................................... 27,369 62,890 329,152 Foreign exchanges ......................................................................................... 150 253 1,803 Bonds/subordinated bonds, payable in yen (Note 6) ..................................... 20,000 40,000 240,529 Other liabilities .............................................................................................. 27,497 26,007 330,691 Reserve for employee retirement benefits (Note 11) ..................................... 11,477 10,508 138,027 Reserve for executive retirement benefits ..................................................... — 454 — Reserve for reimbursement of deposits ......................................................... 121 93 1,455 Reserve for contingent loss ........................................................................... 2,153 2,106 25,892 Acceptances and guarantees .......................................................................... 15,410 17,809 185,327
Total liabilities .......................................................................................... ¥ 4,401,386 ¥ 4,361,672 $ 52,933,084
Net assets:Common stock: Authorized 640,000 thousand shares
and issued 281,756 thousand shares .................................... 29,249 29,249 351,761 Capital surplus ............................................................................................... 18,830 18,830 226,458 Retained earnings .......................................................................................... 121,094 116,163 1,456,331 Less treasury stock: Issued 6,073 thousand shares in 2011
and 6,037 thousand shares in 2010 ................................ (2,990) (2,973) (35,959)
Total stockholders’ equity ........................................................................... 166,184 161,270 1,998,604 Net unrealized gains on securities available for sale, net of taxes (Note 7) .. 16,540 21,739 198,917 Net deferred gains on hedging instruments, net of taxes .............................. (706) (536) (8,490)Total Accumulated other comprehensive income ..................................... 15,834 21,203 190,426 Stock acquisition rights ............................................................................... 31 — 372 Minority interests ........................................................................................ 25,125 24,621 302,164
Total net assets .......................................................................................... 207,175 207,095 2,491,581 Total liabilities and net assets ................................................................... ¥ 4,608,561 ¥ 4,568,768 $ 55,424,666
See Notes to Consolidated Financial Statements.
Consolidated Financial Statem
ents
The Nanto Bank, Ltd. and Consolidated Subsidiaries as of March 31, 2011 and 2010
011_0550701372309.indd 22 2011/09/30 18:13:11

2323
Consolidated Statements of Income
Consolidated Statements of Comprehensive Income
Millions of yen
Thousands ofU.S. dollars
(Note 1)
2011 2010 2011
Income:Interest income:
Interest on loans and bills discounted ....................................................... ¥ 46,236 ¥ 50,878 $ 556,055 Interest and dividends on securities .......................................................... 18,646 17,964 224,245 Other interest income ................................................................................ 393 314 4,726
Fees and commissions ................................................................................... 18,860 18,540 226,819 Gains on sales and redemption of bonds ....................................................... 4,992 3,952 60,036 Other income (Note 16) ................................................................................. 3,622 4,291 43,559
Total income ......................................................................................... 92,751 95,942 1,115,466
Expenses:Interest expense :
Interest on deposits ................................................................................... 5,777 8,269 69,476 Interest on borrowings and rediscounts .................................................... 481 453 5,784 Interest on subordinated bonds ................................................................. 410 227 4,930 Other interest expense ............................................................................... 472 373 5,676
Fees and commissions ................................................................................... 9,172 9,184 110,306 Losses on sales and redemption of bonds ..................................................... 1,785 921 21,467 General and administrative expenses ............................................................ 53,006 53,064 637,474 Other expenses (Note 17) .............................................................................. 7,603 10,651 91,437
Total expenses ....................................................................................... 78,711 83,145 946,614
Income before income taxes ............................................................................ 14,039 12,796 168,839 Income taxes:
Current ........................................................................................................... 517 188 6,217 Deferred ......................................................................................................... 5,755 4,512 69,212
Total income taxes ................................................................................ 6,273 4,701 75,441 Minority interests ............................................................................................ 1,181 802 14,203 Net income ........................................................................................................ ¥ 6,584 ¥ 7,293 $ 79,182
YenU.S. dollars
(Note 1)
Per share of common stock: (Note 22)Net income - basic ......................................................................................... ¥23.88 ¥26.45 $0.287 Net income - diluted ...................................................................................... 23.87 — 0.287 Dividends ...................................................................................................... 6.00 6.00 0.072
See Notes to Consolidated Financial Statements.
Millions of yen
Thousands ofU.S. dollars
(Note 1)
2011 2010 2011
Income before minority interests (Note 24) ...................................................... ¥ 7,766 ¥ — $ 93,397 Other comprehensive income
Net unrealized gains on securities available for sale, net of taxes ................ (5,201) — (62,549)Net deferred gains on hedging instruments, net of taxes .............................. (170) — (2,044)
Total other comprehensive income ........................................................... (5,371) — (64,594)Total comprehensive income for the year .......................................................... ¥ 2,395 ¥ — $ 28,803
Total comprehensive income attributable to:Owners of the parent ..................................................................................... ¥ 1,215 ¥ — $ 14,612 Minority interests .......................................................................................... 1,179 — 14,179
See Notes to Consolidated Financial Statements.
Consolidated Financial Statem
ents
The Nanto Bank, Ltd. and Consolidated subsidiaries for the Years Ended March 31, 2011 and 2010
The Nanto Bank, Ltd. and Consolidated subsidiaries for the Years Ended March 31, 2011 and 2010
011_0550701372309.indd 23 2011/09/30 18:13:12

2424
Consolidated Financial Statements
Consolidated Financial Statem
ents
Consolidated Statements of Stockholders’ Equity
Number of shares of
common stock (thousands)
Millions of yen
Common stock
Capital surplus
Retained earnings
Less treasury stock
Net unrealized gains on securities
available for sale, net of
taxes
Net deferred gains on hedging
instruments, net of taxes
Stock acquisition
rightsMinority interests
Balance at March 31, 2009 ............. 281,756 ¥29,249 ¥18,830 ¥110,525 ¥(2,945) ¥(17,048) ¥(425) — ¥24,447 Cash dividends .............................. — — — (1,654) — — — — —Net Income ................................... — — — 7,293 — — — — —Net changes in the items other than stockholders’ equity ...................... — — — — — 38,788 (111) — 173 Treasury stock ............................... — — 0 — (27) — — — —
Balance at March 31, 2010 ............. 281,756 ¥29,249 ¥18,830 ¥116,163 ¥(2,973) ¥21,739 ¥(536) — ¥24,621 Cash dividends .............................. — — — (1,654) — — — — —Net income .................................... — — — 6,584 — — — — —Net changes in the items other than stockholders’ equity ...................... — — — — — (5,198) (170) 31 504 Treasury stock ............................... — — (0) — (16) — — — —
Balance at March 31, 2011 (Note 4) .. 281,756 ¥29,249 ¥18,830 ¥121,094 ¥(2,990) ¥16,540 ¥(706) ¥31 ¥25,125
Thousands of U.S. dollars (Note 1)
Common stock Capital surplusRetained earnings
Less treasury stock
Net unrealized gains on securities
available for sale, net of
taxes
Net deferred gains on hedging
instruments, net of taxes
Stock acquisition
rightsMinority interests
Balance at March 31, 2010 ......................... $351,761 $226,458 $1,397,029 $(35,754) $261,443 $(6,446) — $296,103 Cash dividends .......................................... — — (19,891) — — — — —Net income ................................................ — — 79,182 — — — — —Net changes in the items other than stockholders’ equity .................................. — — — — (62,513) (2,044) 372 6,061 Treasury stock ........................................... — (1) — (192) — — — —
Balance at March 31, 2011 ......................... $351,761 $226,458 $1,456,331 $(35,959) $198,917 $(8,490) $372 $302,164
See Notes to Consolidated Financial Statements.
The Nanto Bank, Ltd. and Consolidated Subsidiaries for the Years Ended March 31, 2011 and 2010
011_0550701372309.indd 24 2011/09/30 18:13:12

2525
Consolidated Financial Statem
ents
Consolidated Statements of Cash Flows
Millions of yen
Thousands ofU.S. dollars
(Note 1)
2011 2010 2011
Cash flows from operating activitiesIncome before income taxes .......................................................................... ¥ 14,039 ¥ 12,796 $ 168,839Depreciation ................................................................................................... 6,206 5,672 74,636Loss on impairment of fixed assets ................................................................ 98 77 1,178Decrease in reserve for possible loan losses .................................................. (3,875) (1,259) (46,602)Increase in reserve for retirement benefits ..................................................... 968 2,143 11,641 (Decrease) increase in reserve for executive retirement benefits ................... (454) 60 (5,460)Increase (decrease) in reserve for reimbursement of deposits ....................... 27 (12) 324 Increase in reserve for contingent loss ........................................................... 47 2,106 565 Interest income ............................................................................................... (65,276) (69,157) (785,039)Interest expense .............................................................................................. 7,143 9,324 85,904 Gain on investment securities ......................................................................... (2,347) (2,542) (28,226)Loss (gain) on money held in trusts ............................................................... 98 (580) 1,178 Foreign exchange losses ................................................................................. 13,177 3,801 158,472 Losses on disposal of fixed assets .................................................................. 17 64 204 Loss on adjustment for changes of accounting standard for asset retirement obligations ....... 325 — 3,908 Net decrease in due from banks ..................................................................... 2,745 482 33,012 Net decrease in loans and bills discounted ..................................................... 20,927 124,027 251,677 Net increase in deposits .................................................................................. 80,306 52,578 965,796 Net decrease in negotiable certificates of deposit .......................................... (17,185) (17,850) (206,674)Net (increase) decrease in call loans and bills bought ................................... (1,395) 1,324 (16,776)Net decrease in borrowed money ................................................................... (35,521) (196,399) (427,191)Net increase in foreign exchange assets ......................................................... (193) (605) (2,321)Net (decrease) increase in foreign exchange liabilities .................................. (103) 53 (1,238)Net increase in payables under securities lending transactions...................... 32,536 58,592 391,292 Net decrease (increase) in lease receivable and lease investment assets ........ 892 (111) 10,727 Interest received ............................................................................................ 67,422 69,099 810,847 Interest paid .................................................................................................... (7,389) (9,465) (88,863)Other .............................................................................................................. 9,395 5,741 112,988
Subtotal ...................................................................................................... 122,635 49,963 1,474,864 Income taxes paid ........................................................................................... (322) (317) (3,872)
Net cash provided by operating activities .................................................. 122,312 49,645 1,470,980
Cash flows from investing activitiesPurchases of securities .................................................................................. (477,226) (452,172) (5,739,338)Proceeds from sales of securities .................................................................. 217,173 243,648 2,611,822 Proceeds from maturities of securities .......................................................... 129,654 121,400 1,559,278 Increase in money held in trust ..................................................................... (163) (54) (1,960)Decrease in money held in trust .................................................................... 3,523 4,677 42,369 Purchase of tangible fixed assets ................................................................... (2,283) (2,666) (27,456)Proceeds from sales of tangible fixed assets ................................................. 67 — 805 Purchase of intangible fixed assets ................................................................ (1,584) (3,523) (19,049)Other .............................................................................................................. (37) — (444)
Net cash used in investing activities ......................................................... (130,874) (88,690) (1,573,950)
Cash flows from financing activitiesProceeds from issuance of subordinated bonds ............................................. — 19,878 —Payment for redemption of subordinated bonds ........................................... (20,000) — (240,529)Dividends paid ............................................................................................... (1,650) (1,652) (19,843)Dividends paid by subsidiaries to minority stockholders .............................. (675) (672) (8,117)Purchases of treasury stock ........................................................................... (18) (30) (216)Other .............................................................................................................. 2 2 24
Net cash (used in) provided by financing activities .................................. (22,342) 17,526 (268,695)Effect of exchange rate changes on cash and cash equivalents ................... (20) (7) (240)Net decrease in cash and cash equivalents .................................................... (30,924) (21,525) (371,906)Cash and cash equivalents at beginning of year ........................................... 99,027 120,553 1,190,944 Cash and cash equivalents at end of year (Note 5) ....................................... ¥ 68,103 ¥ 99,027 $ 819,037
See Notes to Consolidated Financial Statements.
The Nanto Bank, Ltd. and Consolidated Subsidiaries for the Years Ended March 31, 2011 and 2010
011_0550701372309.indd 25 2011/09/30 18:13:12

2626
Consolidated Financial Statements
1. BASIS OF PRESENTATIONThe accompanying consolidated financial statements of The Nanto Bank, Ltd. (the “Bank”) and its consolidated subsidiaries (together, the “Compa-nies”) have been prepared in accordance with the provision set forth in the Japanese Financial Instruments and Exchange Act, its related accounting regulations, Ordinance for Enforcement of the Banking Law and in con-formity with accounting principles generally accepted in Japan, which are different in certain respects from the application and disclosure require-ments of International Financial Reporting Standards.
The accompanying consolidated financial statements have been re-structured and translated into English, with some expanded descriptions from the consolidated financial statements of the Bank prepared in accor-dance with Japanese GAAP and filed with the appropriate Local Finance Bureau of the Ministry of Finance as required by the Financial Instru-ments and Exchange Act. Some supplemental information included in the statutory Japanese language consolidated financial statements, but not re-quired for fair presentation, is not presented in the accompanying consoli-dated financial statements.
As permitted by the Financial Instruments and Exchange Act of Japan, amounts less than one million yen have been omitted. As a result, the to-tals shown in the financial statements do not necessarily agree with the sum of the individual amounts.
The translation of the Japanese yen amounts into U.S. dollar amounts is included solely for the convenience of the readers outside Japan, using the prevailing exchange rate at March 31, 2011, which were ¥83.15 to US$1.00. The translations should not be construed as representations that the Japanese yen amounts have been, could have been, or could in the fu-ture be converted into U.S. dollars at this or any other rate of exchange.
2. SUMMARY OF SIGNIFICANT ACCOUNTING POLICIESa. Principles of consolidationThe accompanying consolidated financial statements include the accounts of the Bank and its all twelve subsidiaries at March 31, 2011 and 2010, re-spectively. The Bank has no affiliates over which it has the ability to exer-cise significant influence over operating and financial policies.
All consolidated subsidiaries except for Nanto Preferred Capital Cay-man Limited have fiscal years ending on March 31. Nanto Preferred Capi-tal Cayman Limited changed its closing date from March 31 to January 31 in 2010 and prepared, therefore, the additional financial statement as of the same date as the Bank’s financial statement for the consolidation pur-pose. All significant intercompany accounts, transactions and unrealized profits on transactions are eliminated.
b. Cash and cash equivalentsIn preparing the consolidated statements of cash flows, cash and cash equivalents represents cash and deposits with the Bank of Japan.
c. Finance leasesAs lessor:Finance leases are accounted for in a similar manner with ordinary sale transactions. Revenue from finance lease transactions and related cost are recognized upon receipt of lease payments. Finance leases which transfer ownership of the lease assets to the lessee are recognized as lease receiv-ables, and all finance leases which do not transfer ownership of the leased assets to the lessee are recognized as lease investment assets.
As for finance leases which commenced before April 1, 2008 and do not transfer ownership of the leased assets to the lessee, the appropriate book value (net of accumulated depreciation and amortization) of tangible and intangible fixed assets as of March 31, 2008 was recorded as the be-ginning balance of “Lease receivables and lease investment assets” and the total amount of interest equivalent for the remaining lease term after the adoption of “Accounting Standard for Lease Transactions” Accounting Standards Board of Japan (“ASBJ”), (ASBJ Statement No. 13, issued on
March 30, 2007) is allocated over the remaining lease term using the straight-line method.
Differences between income before income taxes for the fiscal year ending March 31, 2011 and 2010, and income before income taxes calcu-lated if accounting treatment for the ordinary sale transaction would have been applied to the finance leases which do not transfer ownership of the leased assets to the lessee are not material.
d. SecuritiesTrading securities are stated at fair market value. Gains and losses realized on disposal and unrealized gains and losses from market value fluctuations are recognized as gains or losses in the period of the disposal or the change. Held-to-maturity debt securities are stated at amortized cost, net of the amount considered not collectible. Available-for-sale securities with available fair market values are stated at fair market value. Unrealized gains and losses on these securities are reported, net of applicable income taxes, as a separate component of accumulated other comprehensive in-come. Other securities with no available fair market value are stated at moving average cost.
If the market value of held-to-maturity debt securities or available-for-sale securities declines significantly, such securities are stated at fair mar-ket value, and the difference between fair market value and the carrying amount is recognized as loss in the period of the decline. The fair market value will be the carrying amount of the securities at the beginning of the next fiscal year.
Money held in trust for trading purposes is reported at fair market value.
e. Derivatives and hedge accountingTo account for hedging transactions in connection with interest rate risk arising from financial assets and liabilities, the Bank applies the deferred hedge accounting method stipulated in “Treatment for Accounting and Auditing of Application of Accounting Standard for Financial Instruments in the Banking Industry” (JICPA Industry Audit Committee Report No. 24). The Bank assesses the effectiveness of such hedge in offsetting move-ment in the fair value from changes in interest rates by classifying the hedged items, such as deposits and loans, and the hedging instruments, such as interest rate swaps, by their maturity. Regarding cash flow hedges, the Bank assesses the effectiveness through verifying the correlation of the hedged items with the hedging instruments.
A portion of the deferred hedge losses and gains that was previously accounted for under the “macro hedge method,” which had been applied in order to manage interest rate risk arising from large volume transactions in loans, deposits and other interest earning assets and interest bearing lia-bilities as a whole using derivatives pursuant to “Temporary Treatment for Accounting and Auditing of Application of Accounting Standard for Fi-nancial Instruments in Banking Industry” (JICPA Industry Audit Commit-tee Report No. 15), is no longer subject to hedge accounting. The deferred hedge losses and gains are being charged to “Interest income” or “Interest expenses” over a 15-year period (maximum) from March 31, 2004 accord-ing to their maturity and notional principal amount. The total amount of deferred hedge losses under the “macro hedge method” was ¥29 million ($348 thousand) in 2011 and ¥53 million in 2010.
In order to hedge risk arising from volatility of exchange rates for the securities (excluding bonds) denominated in foreign currencies, the Bank applies fair value hedge accounting, on the conditions that the hedged se-curities are designated in advance and that sufficient on balance (actual) or off-balance (forward) liability exposure exists to cover the cost of the hedged securities denominated in the same foreign currency.
f. Tangible fixed assetsDepreciation of tangible fixed assets of the Bank is computed by the de-clining-balance method. The estimated useful lives of major items are as follows.
Consolidated Financial Statem
ents
Notes to Consolidated Financial StatementsThe Nanto Bank, Ltd. and Consolidated Subsidiaries
011_0550701372309.indd 26 2011/09/30 18:13:13

2727
Consolidated Financial Statem
ents
Buildings 6 to 50 yearsOthers 3 to 20 years Depreciation of the assets of the consolidated subsidiaries is principal-
ly provided on the declining balance method over the estimated useful life of the asset.
g. Reserve for possible loan lossesThe reserve for possible loan losses is provided according to predeter-mined standards. For loans to insolvent customers who are undergoing bankruptcy or other special liquidation (“bankrupt borrowers”) or who are in a similar financial condition (“effectively bankrupt borrowers”), the re-serve for possible loan losses is provided based on the amount of the claims net of the amount expected to be recovered from collateral and guarantees and net of the deducted amount mentioned below. For the un-secured and unguaranteed portions of loans to customers not presently in the above circumstances, but for whom there is a high probability of so becoming (“likely to become bankrupt borrowers”), the reserves for possi-ble loan losses is provided for the estimated unrecoverable amounts deter-mined after an evaluation of the customer's overall financial condition. For other loans, the reserve for possible loan losses is provided for based on the Bank's actual rate of loan losses in the past.
For claims against “bankrupt borrowers” and “effectively bankrupt borrowers,” the amount exceeding the estimated value of collateral and guarantees is deemed uncollectible and deducted directly from those claims. At March 31, 2011 and 2010, the deducted amounts were ¥21,985 million ($264,401 thousand) and ¥30,039 million, respectively. The re-serve for possible loan losses of the consolidated subsidiaries is provided for general claims by the amount deemed necessary based on the histori-cal loan-loss ratio and for certain doubtful claims by the amount deemed uncollectible based on an assessment of each claim.
h. Employee retirement benefitsThe reserve for retirement benefits, which is provided for future pension payments to employees, is recorded based on the projected benefit obliga-tion and the estimated value of pension plan assets at the end of the fiscal year.
Prior service costs are recognized as profit or loss at the time of occur-rence, and actuarial gains or losses are recognized in gains or expenses in equal amounts from the following fiscal year by the straight-line method over ten years, which is within the average remaining service years of the current employees.
i. Executive retirement benefitsTo provide for the executive retirement benefits based on the provisions in executive retirement benefits, the Bank had accounted the “reserve for ex-ecutive retirement benefits” amount deemed accrued at the fiscal year-end. However, the executive retirement benefit was abolished and resolved to make a discontinuation payment at the 122nd General Meeting of Share-holders held on June 29, 2010. Thus, in the current fiscal year, “reserve for executive retirement” is fully reversed, unpaid amount of ¥464 million ($5,580 thousand) within the discontinuation payment is include in “Other liabilities.”
j. Income taxesDeferred income taxes are recorded to reflect the tax effects of temporary differences between the carrying amounts of assets and liabilities for tax and financial reporting purposes.
The asset and liability approach is used to recognize deferred tax as-sets and liabilities for the expected future tax consequences of temporary differences between the carrying amounts of assets and liabilities for fi-nancial reporting purposes and the amounts for income tax purposes.
k. Intangible fixed assetsAmortizations of intangible fixed assets are computed by the straight-line method. Acquisition costs of software to be used internally are capitalized and amortized by the straight-line method primarily over a useful life of five years.
l. Lease assetsLease assets with respect to finance leases that do not transfer ownership of tangible fixed assets and intangible fixed assets are depreciated or am-ortized using the straight-line method with the assumption that the term of the lease is the useful life. Residual values of leased assets are the guaran-teed value determined in the lease contracts or zero for assets without such guaranteed value.
m. Foreign currency translationsForeign currency assets and liabilities are translated at fiscal year-end ex-change rates.
n. Standards for recognizing lease-related income and expensesSales and costs are recognized at the time of receiving lease fees.
o. Reserve for reimbursement of depositsA reserve for reimbursement of deposits which were derecognized as lia-bilities under certain conditions is provided for possible losses on the fu-ture claims of withdrawal based on historical reimbursement experience.
p. Reserve for contingent lossProviding for the payment of contribution to Credit Guarantee Corpora-tion, the Bank provides a reserve for contingent liabilities not covered by other reserves in an amount deemed necessary based on estimated losses in the future.
q. Consumption taxesTransactions subject to national and local consumption taxes are recorded at amounts exclusive of consumption taxes.
r. Asset retirement obligationsEffective April 1, 2010, the Bank and its consolidated domestic subsidiar-ies adopted the “Accounting Standard for Asset Retirement Obligations” (ASBJ Statement No. 18, issued on March 31, 2008) and “Guidance on Accounting Standard for Asset Retirement Obligations” (ASBJ Guidance No. 21, issued on March 31, 2008). As a result, income before income taxes was ¥333 million ($4,004 thousand less than the amount that would have been recorded without the adoption).
s. Presentation of income before minority interestsEffective March 31, 2011, the Bank has adopted the “Cabinet Office Ordi-nance for partial amendments of regulations on financial statements” (Cabinet Office Ordinance No. 5, issued on March 24, 2009), correspond-ing to “Accounting Standard for Consolidated Financial Statements” (ASBJ Statement No. 22, issued on December 26, 2008), and presented using an account of income before minority interests.
t. Presentation of comprehensive incomeEffective March 31, 2011, the Bank adopted the “Accounting Standard for Presentation of Comprehensive Income” (ASBJ Statement No. 25, issued on June 30, 2010). However, the amounts for the “total accumulated other comprehensive income” in the previous year is reported using the figures of “total valuation and translation adjustments” in the previous consolidat-ed balance sheets.
011_0550701372309.indd 27 2011/09/30 18:13:13

2828
Consolidated Financial Statements
3. SEGMENT AND RELATED INFORMATION(1) Overview of the Reportable SegmentsThe Bank’s reportable segments are determined on the basis that separate financial information of such segments are available and examined periodically by the Board of Directors to make decisions regarding the allocation of management resources and assess the business performances of such segments within the Group. The Group’s main operation is banking, as well as securities services, credit guarantee business, leasing and credit card business. The Group has divided its business operations into the two reportable segments of “Banking and Securities” and “Leasing.” Banking and Securities includes banking and security business, and Leasing includes leasing.
(2) Basis of measurement about reported segment profit (loss), segment assets, segment liabilities and other material itemsThe accounting method for reportable business segments is presented in accordance with “Summary of significant accounting policies.” The reportable segment profit figures are based on operating profit. Intersegment internal rates of return and the amounts transferred are presented based on current mar-ket prices at the time of this report.
(3) Information about reported segment profit (loss), segment assets, segment liabilities and other material itemsSegment information for the years ended March 31, 2011 and 2010 is summarized as follows:
Millions of yen
2011
Reportable Segment
Banking andSecurities Leasing Total Other Total Adjustment Consolidated
Ordinary income:Outside customers ...................................... ¥ 82,370 ¥ 6,653 ¥ 89,023 ¥ 1,957 ¥ 90,981 ¥ — ¥ 90,981Intersegment income .................................. 493 1,838 2,332 4,679 7,011 (7,011) —
Total ....................................................... 82,863 8,492 91,355 6,637 97,993 (7,011) 90,981Segment profit ................................................ 11,445 255 11,701 980 12,681 100 12,781Segment assets ............................................... 4,597,833 23,059 4,620,893 35,918 4,656,812 (48,250) 4,608,561Segment liabilities .......................................... 4,418,267 20,365 4,438,632 9,272 4,447,905 (46,519) 4,401,386Other item
Depreciation ............................................... 4,710 279 4,990 80 5,070 1,136 6,206Fund management income ......................... 65,362 1 65,364 839 66,203 (927) 65,276Financing cost ............................................ 7,784 303 8,088 31 8,119 (976) 7,143Extraordinary gain ..................................... 1,480 34 1,514 255 1,770 — 1,770Extraordinary loss ...................................... 469 0 469 42 512 — 512Tax expense ............................................... 5,871 119 5,991 239 6,231 41 6,273
Increase in tangible and intangible fixed assets .......................... 3,672 22 3,695 80 3,775 91 3,867
Notes: 1. “Other” includes business segments excepting the reporting segments, which includes credit guarantees, real estate leasing and management, software development and credit cards.
2. Adjustments to each segment item are due to elimination of transactions among reportable segments except for adjustment to increase in tangible fixed assets and intangible fixed assets which arose from transactions among reportable segments.
Consolidated Financial Statem
ents
011_0550701372309.indd 28 2011/09/30 18:13:13

2929
Consolidated Financial Statem
ents
Millions of yen
2010
Reportable Segment
Banking andSecurities Leasing Total Other Total Adjustment Consolidated
Ordinary income:Outside customers ...................................... ¥ 85,342 ¥ 6,653 ¥ 91,996 ¥ 1,935 ¥ 93,932 ¥ — ¥ 93,932Intersegment income .................................. 552 1,780 2,332 4,401 6,734 (6,734) —
Total ....................................................... 85,894 8,433 94,328 6,337 100,666 (6,734) 93,932Segment profit ................................................ 10,401 302 10,703 403 11,107 (178) 10,928Segment assets ............................................... 4,557,943 23,749 4,581,692 35,229 4,616,921 (48,153) 4,568,768Segment liabilities .......................................... 4,377,952 21,220 4,399,172 8,861 4,408,033 (46,360) 4,361,672Other item
Depreciation ............................................... 3,814 270 4,084 67 4,152 1,519 5,672Fund management income ......................... 69,239 1 69,240 879 70,119 (962) 69,157Financing cost ............................................ 9,942 340 10,282 32 10,315 (991) 9,324Extraordinary gain ..................................... 1,735 71 1,807 202 2,009 — 2,009Extraordinary loss ...................................... 141 — 141 1 142 — 142Tax expense ............................................... 4,670 148 4,818 (33) 4,784 (83) 4,701
Increase in tangible and intangible fixed assets .......................... 5,800 271 6,071 10 6,082 107 6,189
Notes: 1. “Other” includes business segments excepting the reporting segments, which includes credit guarantees, real estate leasing and management, software development and credit cards.
2. Adjustments to each segment item are due to elimination of transactions among reportable segments except for adjustment to increase in tangible fixed assets and intangible fixed assets which arose from transactions among reportable segments.
Thousands of U.S. dollars
2011
Reportable Segment
Banking andSecurities Leasing Total Other Total Adjustment Consolidated
Ordinary income:Outside customers ...................................... $ 990,619 $ 80,012 $ 1,070,631 $ 23,535 $ 1,094,179 $ — $ 1,094,179Intersegment income .................................. 5,929 22,104 28,045 56,271 84,317 (84,317) —
Total ....................................................... 996,548 102,128 1,098,677 79,819 1,178,508 (84,317) 1,094,179Segment profit ................................................ 137,642 3,066 140,721 11,785 152,507 1,202 153,710Segment assets ............................................... 55,295,646 277,318 55,572,976 431,966 56,004,954 (580,276) 55,424,666Segment liabilities .......................................... 53,136,103 244,918 53,381,022 111,509 53,492,543 (559,458) 52,933,084Other item
Depreciation ............................................... 56,644 3,355 60,012 962 60,974 13,662 74,636Fund management income ......................... 786,073 12 786,097 10,090 796,187 (11,148) 785,039Financing cost ............................................ 93,613 3,644 97,269 372 97,642 (11,737) 85,904Extraordinary gain ..................................... 17,799 408 18,208 3,066 21,286 — 21,286Extraordinary loss ...................................... 5,640 0 5,640 505 6,157 — 6,157Tax expense ............................................... 70,607 1,431 72,050 2,874 74,936 493 75,441
Increase in tangible and intangible fixed assets .......................... 44,161 264 44,437 962 45,399 1,094 46,506
Notes: 1. “Other” includes business segments excepting the reporting segments, which includes credit guarantees, real estate leasing and management, software development and credit cards.
2. Adjustments to each segment item are due to elimination of transactions among reportable segments except for adjustment to increase in tangible fixed assets and intangible fixed assets which arose from transactions among reportable segments.
011_0550701372309.indd 29 2011/09/30 18:13:14

3030
Consolidated Financial Statements
(Additional information)Effective April 1, 2010, the Company and its domestic consolidated subsidiaries have adopted the “Accounting Standard for Disclosures about Segment of an Enterprise and Related Information” (ASBJ Statement No. 17, issued on March 27, 2009) and “Guidance on Accounting Standard for Disclosures about Segment of an Enterprise and Related Information” (ASBJ Guidance No. 20, issued on March 21, 2008). Under the new accounting standard and guidance, an entity is required to report financial and descriptive information about its reportable segments. Reportable segments are operating segments or aggregations of operating segments that meet specified criteria. Operating segments are components of an entity about which separate financial information is available and such information is evaluated regularly by the chief operating decision maker in deciding how to allocate resources and in assessing performance. Generally, segment information is required to be reported on the same basis as is used internally for evaluating operating segment performance and deciding how to allocate resources to operating segments.
(4) Information about services
Millions of yen
2011
BankingSecurities and investments Leasing Others Total
Ordinary income from outside customers ..... ¥ 46,214 ¥ 23,993 ¥ 6,653 ¥ 14,119 ¥ 90,981
Thousands of U.S. dollars
2011
BankingSecurities and investments Leasing Others Total
Ordinary income from outside customers ..... $ 555,790 $ 288,550 $ 80,012 $ 169,801 $ 1,094,179
Notes: ordinary income is stated as in sales of general enterprises.
(5) Information about geographic areasa. Ordinary incomeThe ratio of ordinary income from outside customers within Japan to the total ordinary income in consolidated statement of income exceeded 90% for the both fiscal years ended March 31, 2011 and 2010; therefore, no information about geographic area is required to be disclosed.
b. Tangible fixed assetsThe ratio of tangible fixed assets located in Japan to the total tangible fixed assets in consolidated balance sheet exceeded 90% for the both fiscal years ended March 31, 2011 and 2010; therefore, no information about geographic area is required to be disclosed.
(6) Information about major customersOrdinary income from a specific customer exceeding 10% of the total consolidated ordinary income did not exist for either fiscal year ended March 31, 2011 or 2010. Therefore information about major customers is not required to be disclosed.
(7) Information on Impairment of Fixed Assets for Each Reportable Segment
Millions of yen
2011
Reportable segment
Banking and Securities Leasing Total Others Total
Impairment .................................................... ¥ 98 — ¥ 98 — ¥ 98
Thousands of U.S. dollars
2011
Reportable segment
Banking and Securities Leasing Total Others Total
Impairment .................................................... $ 1,178 — $ 1,178 — $ 1,178
(8) Information on amortization of goodwill and its remaining balance for each reportable segmentThere is no information to be reported on amortization of goodwill and its remaining balance.
(9) Information on gain on negative goodwill for each reportable segmentThere is no information to be reported on gain on negative goodwill.
Consolidated Financial Statem
ents
011_0550701372309.indd 30 2011/09/30 18:13:14

3131
Consolidated Financial Statem
ents
4. CHANGES IN NET ASSETS(1) Type and numbers of shares issued and treasury stocks for the fiscal year ended March 31, 2011 and 2010 are as follows:
(Thousands of shares)
2011March 31, 2010 Increase Decrease March 31,2011
Shares issuedCommon stock .......................................... 281,756 — — 281,756
Total ...................................................... 281,756 — — 281,756Treasury stocks
Common stock .......................................... 6,037 41 4 6,073Total ...................................................... 6,037 41 4 6,073
Note: Increase/decrease in number of treasury stocks is due to purchase/sale of fractional shares and shares less than one unit.
(Thousands of shares)
2010March 31, 2009 Increase Decrease March 31,2010
Shares issuedCommon stock .......................................... 281,756 — — 281,756
Total ...................................................... 281,756 — — 281,756Treasury stocks
Common stock .......................................... 5,985 56 4 6,037Total ...................................................... 5,985 56 4 6,037
Note: Increase/decrease in number of treasury stocks is due to purchase/sale of fractional shares and shares less than one unit.
(2) Matters concerning Stock Acquisition RightsFor the year ended March 31, 2011
Shares expected to be acquired upon exercise of stock acquisition rightsBalance at the end of
current fiscal year(Millions of yen)
(Thousands of U.S. dollars)Number of shares
classification breakdown March 31,2010 Increase Decrease March 31,2011
The Bank
2011 stock acquisition rights granted as stock
option
— — — — ¥31 $372
Total — — — — ¥31 $372
(3) Information on dividends is as follows:(a) Dividends paid in the fiscal year ended March 31, 2011
Millions of yen, except per share amount
Resolution Type of sharesAggregate amount of
dividendsCash dividends
per share Record date Effective date
Annual shareholders meeting held on June 29, 2010 Common stock ¥827 ¥3.00 March 31, 2010 June 30, 2010
Board of Directors meeting held on November 12, 2010 Common stock ¥827 ¥3.00 September 30, 2010 December 10, 2010
Dividends paid in the fiscal year ended March 31, 2010
Millions of yen, except per share amount
Resolution Type of sharesAggregate amount of
dividendsCash dividends
per share Record date Effective date
Annual shareholders meeting held on June 26, 2009 Common stock ¥828 ¥3.00 March 31, 2009 June 26, 2009
Board of Directors meeting held on November 13, 2009 Common stock ¥827 ¥3.00 September 30, 2009 December 10, 2009
(b) Dividends to be paid in the fiscal year ending March 31, 2012Millions of yen, except per share amount
Resolution Type of sharesAggregate amount of
dividendsSource of dividends
Cash dividends per share Record date Effective date
Annual shareholders meeting held on June 29, 2011 Common stock ¥827 Retained
earnings ¥3.00 March 31, 2011 June 30, 2011
011_0550701372309.indd 31 2011/09/30 18:13:14
3232
Consolidated Financial Statements
Consolidated Financial Statem
ents
6. FINANCIAL INSTRUMENTS AND RELATED DISCLOSURESa. Matters relating to the status of financial instruments(1) Policy on financial instrumentsThe Group (the Bank and its subsidiaries) is composed of the Bank and twelve consolidated subsidiaries, and provides financial services such as banking, securities, credit guarantee and leasing businesses.
Major banking business includes (i) acceptance of deposit, lending services, bills discounting and remittance, and (ii) guarantee of debt, ac-ceptance of bills, and other services related to banking business. Securities business includes underwriting and dealing securities, over-the-counter derivative transaction, and other related services including security index future transactions in accordance with Financial Instruments and Ex-change Act.
On the other hand, the Bank, in addition to being money lender and borrower in the interbank market to adjust the surplus funds, raises the funds by loans and bonds with considering the balance of financial market conditions and length.
The Bank conducts asset and liability management (ALM) and man-ages the risks identifying various types of risk exposures associated with the banking business, since the Bank holds financial assets and liabilities exposed to the market risk associated with the fluctuation of interest rate. As part of the risk management, the Bank utilizes derivative transactions such as interest rate swap, and also operates derivative transaction for trad-ing purpose with certain position limit.
(2) Contents and risk of financial instrumentsFinancial assets held by the Group mainly are composed of loans to cor-porate and individual customers which are exposed to credit risk arising from nonperformance of the customers. In addition, the loan balances are significantly concentrated to Nara prefecture where the head office of the Bank is located and accordingly, the changes in the economic circum-stances of the region may have a great impact on the credit risk.
Securities principally consist of Japanese government bonds, Japanese local government bonds, equity securities, foreign securities, and invest-ment trust that are classified as other securities (available-for-sale), private bonds guaranteed by the Bank that is classified as held-to-maturity debt security, and Japanese government bonds is classified as trading purpose security. These securities are exposed to credit risk of issuers and market risks of fluctuation in interest rates and market prices. In addition, since fi-nancial assets denominated in foreign currencies are exposed to exchange rate risk, currency-related derivative etc, transactions are used to balance the amount of each currency to reduce the risk.
On the other hand, in the banking business financial liabilities consist of principally deposits from retail clients in Japan and those are exposed to interest rate risk. In addition, foreign currency deposits are exposed to exchange rate risk. With respect to borrowed money and bonds, the Group may be forced to raise fund under unfavorable conditions and accordingly, significantly exposed to liquidity risk in case that fund raising capacity of
the Group significantly declined and failed to repay under certain circum-stances such as significant deterioration of financial positions of the Group. Furthermore, the borrowed money with floating interest rate is ex-posed to interest rate risk.
Derivative transactions include interest rate swap for interest rate relat-ed transaction, currency swap, and forward foreign exchange transaction for currency related transactions, and bond future transaction for bond re-lated transaction. In addition, certain credit derivatives are embedded in the financial instruments. The Bank utilizes those derivative transactions in order to hedge the position of the customers as well as to capture vari-ous risk associated with the transactions with the customers and control those risk properly. The Bank also uses derivative for trading purpose with certain position limit. The Bank applies the deferred hedge accounting method for the derivative transaction when used as hedging instruments. Interest rate swap is used as hedging instrument to avoid interest rate risk of the hedged items such as loans with fixed interest rate and deposits with fixed interest rate. Deferred hedge accounting has been applied to deriva-tives used as hedging instruments.
The Bank assesses the effectiveness of hedges in offsetting movement in the fair value from changes in interest rates by classifying the hedged items, such as deposits and loans, and the hedging instruments, such as in-terest rate swaps, by their maturity. For cash flow hedges, the Bank assess-es the effectiveness by verifying the correlation between the hedged items and the hedging instruments. Transactions which do not meet the require-ment of hedge accounting and derivative transaction for trading purpose are exposed to interest rate risk, currency risk, price fluctuation risk and credit risk.
(3) Risk management system for financial instrumentsCredit risk management:The Group establishes the framework for the credit control which includes the credit review by individual transaction, credit limit, credit information management, internal credit rating, guarantees and collateral, and self-as-sessment in accordance with the Group’s “Rules on credit risk manage-ment” and “Rules on self-assessment of the assets.” These credit controls are performed by each branch and the Credit Analysis Division, and the independent Audit Department audits the status of credit risk controls and its results. The status of credit risk controls are periodically consulted and reported to managing directors’ committee and board meeting.
Credit risks associated with the issuers of securities are managed by Securities & International Division and Compliance & Risk Management Division. With respect to the credit risks associated with the issuer of the securities and counterparty risk associated with the derivative transaction, related credit information and fair values of the securities are periodically checked to monitor those risks.
5. STATEMENTS OF CASH FLOWS The reconciliation between cash and due from banks in the consolidated balance sheets at March 31, 2011 and 2010 and cash and cash equivalents in the consolidated statements of cash flows for the years then ended is as follows:
Millions of yenThousands ofU.S. dollars
2011 2010 2011
Cash and due from banks on the consolidated balance sheet ¥91,151 ¥124,821 $1,096,223Time deposits due from banks (21,000) (23,000) (252,555)Other due from banks (2,048) (2,793) (24,630)Cash and cash equivalents on the consolidated statements of cash flows ¥68,103 ¥ 99,027 $ 819,037
011_0550701372309.indd 32 2011/09/30 18:13:14
3333
Market risk management:(a) Interest rate risk From the perspective of ALM, the Group manages market risk such as in-terest rate risk associated with the assets and the liabilities including loans, deposits and securities comprehensively. The Group’s “Rule on the market risk management” articulates that the Bank makes efforts to manage mar-ket sector effectively taking risk and reward into accounts, as well as to avoid excessive risk taken, by setting appropriate risk limit based on the Group’s ability to take risk and identifying market risk properly.
The ALM Committee, the decision-making entity on the management of market risks, sets semiannually certain risk limit determined by VaR based upon the Bank’s capital adequacy and market conditions. The Bank pursues the profit opportunity within the risk limit above. Compliance & Risk Management Division assesses the interest rate risk by VaR, reports to the ALM Committee on a monthly basis, and properly monitors its op-eration. Other methodology such as BPV and simulation of the interest rate fluctuation are also used so that the Bank can capture and analyze the risk from a broader point of view.
(b) Foreign currency riskWith regard to foreign currency risk associated with operation and pro-curement of financial instruments denominated in foreign currency, the Group manages risk by balancing the amount of funding and amount of operation for each currency. In addition, as for the foreign currency ex-change transaction for investment purposes, Compliance & Risk Manage-ment Division assesses the foreign currency risk by VaR, reports to the ALM committee on a monthly basis, and properly monitors its operation.
(c) Price fluctuation riskWith regard to investment in securities, the Group prepares the asset man-agement plan semiannually and makes investment decision at the ALM Committee based upon the expected return and correlations between in-vestment items and related market fluctuation risk. Securities & Interna-tional Division plays a part in investment for investment purposes, and General Business Division plays a part in investment for the purpose of business alliance and capital affiliation. Continuous monitor on the market condition and restriction on the riskier assets such as securitized instru-ments facilitate to avoid unnecessary price fluctuation risk.
Compliance & Risk Management Division assesses the price fluctua-tion risk of equity securities, etc. by VaR, reports monthly to the ALM Committee about the compliance of the risk limit, and properly manages the risk.
(d) Derivative transactionsWith respect to derivative transactions for the hedging purpose, the Group establishes internal rules defining the authority and hedge policies which are governed by Compliance & Risk Management Division. With respect to the derivative transactions for the trading purpose, on the other hand, certain trading limit and loss limit rule have been set semiannually by the ALM Committee. Compliance & Risk Management Division, which
serves as the function of the middle office, monitors the compliance and calculates total amount of risk. Securities & International Division, which serves as the back office, checks each derivative transaction, marked-to-market position, and understands the profit and loss from the transaction on a daily basis. Combined with those functions, the related divisions check each other not to exceed limit of loss.
The directors of the Bank are reported from the middle office and back office respectively, and monitor the risk condition associated with the Bank’s portfolio as a whole including loans, deposits, and securities at the ALM Committee.
(e) Quantitative information relating to market riskThe Group manages market risk quantity for financial instruments such as loans, deposits, securities and derivatives by VaR. To calculate VaR, the historical method (confidence level of 99%, observation period of 1250 business days, holding period of 60 business days [holding period for the shares other than net investment purpose are 120 business days], correla-tion of risk categories are not considered.) has been adopted. Risk mea-surement method has been changed from the delta method to the historical method in the fiscal year of 2010.
At March 31, 2011, the Group’s market risk quantity (decrease in esti-mated economic value) in total is ¥57,576 million ($692,435 thousand). In addition, the Group conducted back test to compare the actual income ver-sus VaR calculated by the model. As a result of back test conducted in 2010, the measurement model captures the market risk quantity in suffi-cient accuracy. However, VaR is a statistic measure of market risk quantity based on the past fluctuations of market and certain probability of occur-rence. It may not be possible to capture the risk if the market fluctuates rapidly, under extraordinary circumstances.
Management of liquidity risk associated with financing activitySecurities & International Division manages the Bank’s cash position based upon the monthly fund plan designed by the ALM Committee, while Compliance & Risk Management Division monitors the situation. The ALM Committee manages the financing risk comprehensively by un-derstanding the amount of cash for which the Bank can liquidate and also can raise funds from the market on a regular basis.
In addition the Group categorizes financing situation into “Regular Phase,” “Concern Phase” and “Crisis Phase,” and prepares appropriate management structure for each phase so that the Group can take proper action accordingly.
(4) Supplementary explanation on the fair value of financial instru-mentsThe fair values of financial instruments comprise the values determined based on the quoted market prices and the values calculated on a reason-able basis where no market price is available. Certain assumptions are used for the calculation of such amount and accordingly, the result of such calculation may vary if different assumptions are used.
Consolidated Financial Statem
ents
011_0550701372309.indd 33 2011/09/30 18:13:14

3434
Consolidated Financial Statements
Consolidated Financial Statem
ents
b. Fair value of financial instrumentsThe following table summarizes the carrying amounts, fair values and differences of financial instruments as of March 31, 2011 and 2010. Note that equi-ty securities whose fair value is extremely difficult to estimate and immaterial accounts on the consolidated balance sheets are not included in the table (see note 2 below).
Millions of yen
2011
Carrying amount Fair value Difference
Cash and due from banks .......................................................................... ¥ 91,151 ¥ 91,151 ¥ —Call loans and bills bought ........................................................................ 3,429 3,429 —Commercial paper and other debt purchased ............................................ 4,716 4,716 —Trading account securities:
Trading securities .................................................................................. 786 786 —Money held in trust ................................................................................... 24,500 24,500 —Securities:
Held-to-maturity debt securities ........................................................... 4,756 4,804 47 Other securities ..................................................................................... 1,661,168 1,661,168 —
Loans and bills discounted ........................................................................ 2,709,612Reserve for possible loan losses (*1) ................................................... (31,079)
2,678,533 2,690,252 11,718Total assets ................................................................................................ ¥ 4,469,043 ¥ 4,480,810 ¥ 11,766Deposits ..................................................................................................... ¥ 4,117,087 ¥ 4,120,691 ¥ 3,603Negotiable certificates of deposit .............................................................. 64,008 64,008 —Payable under securities lending transactions ........................................... 116,109 116,109 —Borrowed money ....................................................................................... 27,369 27,417 48 Bonds ........................................................................................................ 20,000 20,221 221Total liabilities ........................................................................................... ¥ 4,344,575 ¥ 4,348,448 ¥ 3,873Derivative transactions (*2)
To which hedge accounting is not applied ............................................ (1,192) (1,192) —To which hedge accounting is applied .................................................. (1,296) (1,316) (19)
Total derivative transactions ...................................................................... ¥ (2,489) ¥ (2,509) ¥ (19)
Millions of yen
2010
Carrying amount Fair value Difference
Cash and due from banks .......................................................................... ¥ 124,821 ¥ 124,826 ¥ 4Call loans and bills bought ........................................................................ 2,145 2,145 —Commercial paper and other debt purchased ............................................ 4,421 4,421 —Trading account securities:
Trading securities .................................................................................. 1,831 1,831 —Money held in trust ................................................................................... 24,500 24,500 —Securities:
Held-to-maturity debt securities ........................................................... 5,231 5,302 71 Other securities ..................................................................................... 1,551,696 1,551,696 —
Loans and bills discounted ........................................................................ 2,730,540Reserve for possible loan losses (*1) ................................................... (34,974)
Total assets ................................................................................................ ¥ 4,410,214 ¥ 4,423,091 ¥ 12,877Deposits ..................................................................................................... ¥ 4,036,781 ¥ 4,041,464 ¥ 4,682Negotiable certificates of deposit .............................................................. 81,193 81,193 —Payable under securities lending transactions ........................................... 83,573 83,573 —Borrowed money ....................................................................................... 62,890 62,939 48 Bonds ........................................................................................................ 40,000 39,988 (11)Total liabilities ........................................................................................... ¥ 4,304,439 ¥ 4,309,159 ¥ 4,719Derivative transactions (*2)
To which hedge accounting is not applied ............................................ 7,045 7,045 —To which hedge accounting is applied .................................................. (983) (1,013) (29)
Total derivative transactions ...................................................................... ¥ 6,061 ¥ 6,031 ¥ (29)
011_0550701372309.indd 34 2011/09/30 18:13:15

3535
Thousands of U.S. dollars
2011
Carrying amount Fair value Difference
Cash and due from banks .......................................................................... $ 1,096,223 $ 1,096,223 $ —Call loans and bills bought ........................................................................ 41,238 41,238 —Commercial paper and other debt purchased ............................................ 56,716 56,716 —Trading account securities:
Trading securities .................................................................................. 9,452 9,452 —Money held in trust ................................................................................... 294,648 294,648 —Securities:
Held-to-maturity debt securities ........................................................... 57,197 57,775 565 Other securities ..................................................................................... 19,977,967 19,977,967 —
Loans and bills discounted ........................................................................ 32,587,035Reserve for possible loan losses (*1) ................................................... (373,770)
32,213,265 32,354,203 140,926Total assets ................................................................................................ $ 53,746,758 $ 53,888,274 $ 141,503Deposits ..................................................................................................... $ 49,513,974 $ 49,557,318 $ 43,331Negotiable certificates of deposit .............................................................. 769,789 769,789 —Payable under securities lending transactions ........................................... 1,396,380 1,396,380 —Borrowed money ....................................................................................... 329,152 329,729 577Bonds ........................................................................................................ 240,529 243,187 2,657Total liabilities ........................................................................................... $ 52,249,849 $ 52,296,428 $ 46,578Derivative transactions (*2)
To which hedge accounting is not applied ............................................ (14,335) (14,335) —To which hedge accounting is applied .................................................. (15,586) (15,826) (228)
Total derivative transactions ...................................................................... $ (29,933) $ (30,174) $ (228)(*1) General reserve for possible loan losses and specific reserve for possible loan losses corresponding to loans are deducted.(*2) Derivative transactions recorded under other assets and other liabilities are presented on a net basis, and total amounts of net liabilities are presented in parentheses.
Consolidated Financial Statem
ents
(Note 1) Computation method for fair value of financial instrumentsAssetsCash and due from banks:With respect to due from banks without maturities, the carrying amount is presented as the fair value as the fair value approximates the carrying amount. With respect to due from banks with maturities, the fair value is calculated, by discounting its cash flow at the interest rate assumed if the same due from banks were newly executed, for each category of maturi-ties. The fair value of the derivative embedded due from banks is deter-mined based on the prices presented by the financial institutions with which they are transacted.
Call loans and bills bought:The carrying amount is presented as the fair value as the residual maturity is less than one year and the fair value approximates the carrying amount.
Commercial paper and other debt purchased:The carrying amount of the lump sum factoring receivables is presented as the fair value as the residual maturity is less than one year and the fair val-ue approximates the carrying amount. The fair value of the trust beneficia-ry right is determined based on the prices presented by the financial insti-tutions with which they are transacted.
Trading account securities:The fair values of the securities held for the trading purpose are deter-mined based on the quoted market prices, or the values calculated on a reasonable basis if no market price is available.
Money held in trust:The fair values of the securities held in a stand-alone trust for the asset management purpose are determined based on the values presented by the trust bank. For additional information on money held in trust by holding purpose, please see Note 7 “Securities and Money held in trust.”
Securities:The fair values of equity securities are determined using the market price at the exchanges. The fair values of debt securities are determined based on the market prices or the values calculated on a reasonable basis if no market price is available. The fair values of listed investment trusts are de-termined using the market price at the exchanges and other investment trusts are determined using standard prices published by the Investment Trust Association, Japan or presented from the financial institutions with which they are transacted. The fair values of the private bonds guaranteed by the Bank are calculated, by discounting the aggregate value of principle and interest at the interest rate assumed if the same bond were newly is-sued, for each category of type of terms, redemption method, and guaran-tees. With respect to the private bonds guaranteed by the Bank issued by “bankrupt borrowers,” “effectively bankrupt borrowers” and “likely to be-come bankrupt borrowers,” the possible amounts of loan loss are comput-ed based on the present value of estimated future cash flow or the recover-able amounts from collaterals and guarantees; therefore, the fair value approximates the carrying amount, net of reserve for possible loan losses and such amount is presented as the fair value.
With regard to floating rate Japanese government bonds held as “secu-rities,” the market value is unlikely to indicate the fair value due to ex-traordinary few trading case of such bonds, and determined such bonds have been carried at their reasonably estimated amounts in this fiscal year end. As a result, “Japanese Government Bond” included in “Securities” and “Net unrealized gains on securities available for sale, net of tax” in-creased by ¥15,932 million ($191,605 thousand) and ¥9,495 million ($114,191 thousand) at March 31, 2011, and ¥18,923 million and ¥11,297 million at March 31, 2010, respectively, and “deferred tax assets” de-creased by ¥6,436 million ($77,402 thousand) at March 31, 2011, and ¥7,626 million at March 31, 2010, compared with the result using the market price.
Reasonably estimated amounts of floating-rate Japanese government bonds consists of the net value of discounted cash flow adjusting convexi-ty from the floating-rate Japanese government bonds and the net value of
011_0550701372309.indd 35 2011/09/30 18:13:15

3636
Consolidated Financial Statements
Consolidated Financial Statem
ents
discounted cash flow of zero-floor options calculated by the Black-Sholes option pricing model. The main variables of pricing decision for the above calculations are the Japanese government bond spot rate as market-yield and yen swaption volatility as forward rate volatility. The theoretical pric-es of parties of each series of floating-rate Japanese government bonds are determined from the quotes of venders and verified for their adequacy by the Bank.
For additional information on securities by holding purpose, please see Note 7 “Securities and Money held in trust.”
Loans and bills discounted:The fair value of loans with floating interest rates is presented using the carrying amount as the fair value approximates the carrying amount, as long as the credit situation of the borrowers does not vary significantly af-ter executing the loans, since they reflect the market interest rates due to their short-term nature. The fair value of loans with fixed rates is comput-ed, by discounting the aggregate value of principal and interest at the in-terest rate assumed if the same loans were newly executed, for each cate-gory of type of loans, internal ratings and maturities. As for the loans whose maturity is less than one year, the carrying amount is presented as the fair value as the fair value approximates the carrying amount.
With respect to receivables from “bankrupt borrowers,” “effectively bankrupt borrowers” and “likely to become bankrupt borrowers,” the pos-sible amounts of loan loss are computed based on the present values of the estimated future cash flow or the recoverable amounts from collaterals and guarantees; therefore, the fair value approximates the carrying amount, net of reserve for possible loan losses and such amount is presented as the fair value.
The fair value of loans without predetermined repayment date due to their characteristics which the lending amounts are limited within the val-ues of the applicable collaterals is presented using the carrying amount, as the fair value is deemed to approximate the carrying amounts considering the estimated repayment term and interest rates. The fair value of embed-ded derivative loans is presented using market prices at financial institu-tions.
LiabilitiesDeposits and negotiable certificates of deposits:With respect to on-demand deposits, the payment obligation when de-manded at the balance sheet date, which is the carrying amount, is deemed to be the fair value. The fair value of time deposits is computed using the present value by discounting future cash flows for each category of certain period. The interest rate to be applied when a new deposit is taken is used as the discount rate. Deposits whose residual maturity is less than one year, the carrying amount is presented as the fair value as the fair value approximates the carrying amount.
Payables under securities lending transactions:The carrying amount is presented as the fair value as the residual maturity is less than one year and the fair value approximate the carrying amount.
Borrowed money:The fair value of borrowed money with floating interest rate is presented using the carrying amount as the fair value approximates the carrying amount since the interest rates reflect the market interest rate due to their short-term nature and the credit situation of the Bank and its consolidated subsidiaries does not vary significantly after the executing the borrowing. The fair value of borrowed money with fixed interest rate is computed, by discounting the aggregate value of principal and interest at the interest rate assumed if the same borrowing were newly executed, for each category of type of maturities. As for the borrowed money whose maturity is less than one year, the carrying amount is presented as the fair value as the fair val-ue approximates the carrying amount.
Bonds:The fair value of bonds issued by the Bank is determined using market price.
Derivative transactionsFor the derivative transactions, please see Note 20 “Derivative Transac-tions.”
(Note 2) The following table summarizes financial instruments whose fair value is extremely difficult to estimate: Note that these instruments are not in-cluded in the aforementioned table regarding the fair value of financial instruments.
Carrying amount
Millions of yenThousands ofU.S. dollars
2011 2010 2011
Unlisted equity securities (*1) (*2) ................................................................... ¥2,270 ¥2,276 $27,300Investment in Partnership (*3) ........................................................................... 752 905 9,043Total ................................................................................................................... ¥3,023 ¥3,182 $36,355
(*1) The fair value of unlisted equity securities is not disclosed, since there is no market price and it is extremely difficult to estimate the fair value.(*2) The Bank recognized loss on impairment of ¥6 million ($72 thousand) and ¥17 million on unlisted equity securities for the year ended March 31, 2011 and 2010, respectively.(*3) The fair value of unlisted equity securities among the investment in partnership is not disclosed, since there is no market price and it is extremely difficult to estimate the fair value.
011_0550701372309.indd 36 2011/09/30 18:13:15

3737
Consolidated Financial Statem
ents
(Note 3) Redemption schedule of monetary claims and securities with maturities
Millions of yen
2011
Due within one year or less
Due after one year through three years
Due after three years through
five years
Due after five years through seven years
Due after seven years through ten
yearsDue after ten
years
Due from banks ............................................. ¥ 41,182 ¥ — ¥ — ¥ — ¥ — ¥ —Call loans and bills bought ............................ 3,429 — — — — —Commercial paper and other debt purchased .. 4,523 — 192 — — —Securities: ...................................................... 95,179 289,596 322,615 192,450 565,140 72,500
Held-to-maturity debt securities: .............. 580 1,636 1,951 588 — —Bonds .................................................... 580 1,636 1,951 588 — —
Other securities with contractual maturities: .................................................. 94,599 287,959 320,663 191,861 565,140 72,500
Japanese government bonds ................. 62,100 162,600 161,500 150,000 442,500 42,500Japanese local government bonds ........ 4,132 19,315 72,543 28,456 58,626 —Corporate bonds ................................... 9,590 22,910 8,405 1,405 8,014 —Other ..................................................... 18,776 83,133 78,214 12,000 56,000 30,000
Loans and bills discounted (*) ...................... 783,764 391,149 258,114 168,232 211,531 514,582Total .............................................................. ¥ 928,080 ¥ 680,745 ¥ 580,922 ¥ 360,682 ¥ 776,671 ¥ 587,082
Millions of yen
2010
Due within one year or less
Due after one year through three years
Due after three years through
five years
Due after five years through seven years
Due after seven years through ten
yearsDue after ten
years
Due from banks ............................................. ¥ 70,567 ¥ — ¥ 2,000 ¥ — ¥ — ¥ —Call loans and bills bought ............................ 2,145 — — — — —Commercial paper and other debt purchased .. 3,578 500 545 — — —Securities: ...................................................... 110,535 212,244 227,884 203,450 476,186 201,000
Held-to-maturity debt securities: .............. 770 1,120 2,331 1,010 — —Bonds .................................................... 770 1,120 2,331 1,010 — —
Other securities with contractual maturities: .................................................. 109,765 211,124 225,553 202,440 476,186 201,000
Japanese government bonds ................. 65,000 127,800 123,500 92,000 361,500 115,000Japanese local government bonds ........ 2,271 9,944 41,021 67,425 101,176 —Corporate bonds ................................... 6,644 11,059 14,061 1,001 7,508 —Other ..................................................... 35,849 62,320 46,969 42,013 6,002 86,000
Loans and bills discounted (*) ...................... 800,106 353,810 280,677 187,771 204,619 512,009Total .............................................................. ¥ 986,932 ¥ 566,555 ¥ 511,107 ¥ 391,221 ¥ 680,805 ¥ 713,099
Thousands of U.S. dollars
2011
Due within one year or less
Due after one year through three years
Due after three years through
five years
Due after five years through seven years
Due after seven years through ten
yearsDue after ten
years
Due from banks ............................................. $ 495,273 $ — $ — $ — $ — $ —Call loans and bills bought ............................ 41,238 — — — — —Commercial paper and other debt purchased .. 54,395 — 2,309 — — —Securities: ...................................................... 1,144,666 3,482,814 3,879,915 2,314,491 6,796,632 871,918
Held-to-maturity debt securities: .............. 6,975 19,675 23,463 7,071 — —Bonds .................................................... 6,975 19,675 23,463 7,071 — —
Other securities with contractual maturities: .................................................. 1,137,690 3,463,126 3,856,440 2,307,408 6,796,632 871,918
Japanese government bonds ................. 746,843 1,955,502 1,942,273 1,803,968 5,321,707 511,124Japanese local government bonds ........ 49,693 232,291 872,435 342,224 705,063 —Corporate bonds ................................... 115,333 275,526 101,082 16,897 96,380 —Other ..................................................... 225,808 999,795 940,637 144,317 673,481 360,793
Loans and bills discounted (*) ...................... 9,425,904 4,704,137 3,104,197 2,023,235 2,543,968 6,188,598Total .............................................................. $11,161,515 $8,186,951 $6,986,434 $4,337,726 $9,340,601 $7,060,517
(*) Loans from “bankrupt,” “effectively bankrupt” and “likely to become bankrupt” borrowers, which are not expected to be repaid, amounting to ¥65,064 million ($782,489 thousand) and ¥96,379 million at March 31, 2011 and 2010, are not included respectively. Loans, whose payment term is not determined, amounting to ¥338,225 million ($4,067,648 thousand) and ¥324,081 million at March 31, 2011 and 2010, are not included respectively.
011_0550701372309.indd 37 2011/09/30 18:13:16

3838
Consolidated Financial Statements
Consolidated Financial Statem
ents
(Note 4) Redemption schedule of bonds, borrowed money and interest-bearing liabilities
Millions of yen
2011
Due within one year or less
Due after one year through three years
Due after three years through
five years
Due after five years through seven years
Due after seven years through ten
yearsDue after ten
years
Deposits (*) ................................................... ¥3,532,229 ¥476,374 ¥108,484 ¥— ¥ — ¥—Negotiable certificates of deposits ................ 64,008 — — — — —Payables under securities lending transactions .. 116,109 — — — — —Borrowed money ........................................... 22,829 3,265 1,275 — — —Bonds ............................................................ — — — — 20,000 —Total .............................................................. ¥3,735,176 ¥479,639 ¥109,759 ¥— ¥ 20,000 ¥—
Millions of yen
2010
Due within one year or less
Due after one year through three years
Due after three years through
five years
Due after five years through seven years
Due after seven years through ten
yearsDue after ten
years
Deposits (*) ................................................... ¥3,437,050 ¥513,459 ¥86,271 ¥— ¥ — ¥—Negotiable certificates of deposits ................ 81,193 — — — — —Payables under securities lending transactions .. 83,573 — — — — —Borrowed money ........................................... 58,806 3,164 920 — — —Bonds ............................................................ 20,000 — — — 20,000 —Total .............................................................. ¥3,680,624 ¥516,623 ¥87,191 ¥— ¥ 20,000 ¥—
Thousands of U.S. dollars
2011
Due within one year or less
Due after one year through three years
Due after three years through
five years
Due after five years through seven years
Due after seven years through ten
yearsDue after ten
years
Deposits (*) ................................................... $42,480,204 $5,729,092 $1,304,678 $— $ — $—Negotiable certificates of deposits ................ 769,789 — — — — —Payables under securities lending transaction .. 1,396,380 — — — — —Borrowed money ........................................... 274,552 39,266 15,333 — — —Bonds ............................................................ — — — — 240,529 —Total .............................................................. $44,920,938 $5,768,358 $1,320,012 $— $ 240,529 $—
(*) Demand deposits are included in “Due within one year or less.”
7. SECURITIES AND MONEY HELD IN TRUST The securities in this note include the “securities,” “trading securities” and trust beneficiary right under the “commercial paper and other debt purchased” classified on the consolidated balance sheet.
(1) Information on trading account securities and securities with available market prices at March 31, 2011 and 2010 was as follows:(a) Trading securities
Millions of yenThousands of U.S. dollars
2011 2010 2011
Carrying amount (fair market value) ................................................................. ¥786 ¥1,831 $9,452Amount of net unrealized gains (losses) included in the statements of income ... 0 11 —
011_0550701372309.indd 38 2011/09/30 18:13:16

3939
Consolidated Financial Statem
ents
(b) Held-to-maturity debt securities The carrying amount and fair value of held-to-maturity debt securities which have a readily determinable fair value and the related unrealized gain and loss at March 31, 2011 was as follows:
Millions of yen
2011Carrying amount Fair value Difference Gain Loss
Corporate bonds ......................................................................... ¥4,756 ¥4,804 ¥47 ¥54 ¥6
Millions of yen
2010Carrying amount Fair value Difference Gain Loss
Corporate bonds ......................................................................... ¥5,231 ¥5,302 ¥71 ¥71 ¥ —
Thousands of U.S. dollars
2011
Carrying amount Fair value Difference Gain Loss
Corporate bonds ......................................................................... $57,197 $57,775 $565 $649 $72
(c) Other securities
Millions of yen
2011Acquisition cost Carrying amount Difference Unrealized Gains Unrealized Losses
Stocks ......................................................................................... ¥ 69,761 ¥ 77,023 ¥ 7,262 ¥11,494 ¥ 4,232Bonds: ........................................................................................ 1,274,264 1,301,023 26,760 27,910 1,150
Japanese government bonds .................................................. 1,037,462 1,058,984 21,522 22,263 741Japanese local government bonds .......................................... 183,473 188,449 4,975 5,060 85Japanese corporate bonds ...................................................... 53,326 53,588 263 586 323
Others: ........................................................................................ 294,604 283,313 (11,292) 3,527 14,819Foreign securities included .................................................... 276,745 265,508 (11,237) 3,004 14,241
Total ........................................................................................... ¥1,638,631 ¥1,661,361 ¥22,729 ¥42,933 ¥20,203
Millions of yen
2010Acquisition cost Carrying amount Difference Unrealized Gains Unrealized Losses
Stocks ......................................................................................... ¥ 71,745 ¥ 86,625 ¥14,881 ¥16,071 ¥ 1,190Bonds: ........................................................................................ 1,163,894 1,188,791 24,897 25,693 796
Japanese government bonds .................................................. 898,355 917,400 19,044 19,267 223Japanese local government bonds .......................................... 222,264 227,592 5,329 5,562 233Japanese corporate bonds ...................................................... 43,273 43,797 524 863 339
Others: ........................................................................................ 286,520 277,121 (9,398) 5,091 14,489Foreign securities included .................................................... 272,527 263,415 (9,112) 4,575 13,687
Total ........................................................................................... ¥1,522,161 ¥1,552,539 ¥30,378 ¥46,855 ¥16,477
Thousands of U.S. dollars
2011Acquisition cost Carrying amount Difference Unrealized Gains Unrealized Losses
Stocks ......................................................................................... $ 838,977 $ 926,313 $ 87,336 $138,232 $ 50,895 Bonds: ........................................................................................ 15,324,882 15,646,698 321,828 335,658 13,830
Japanese government bonds .................................................. 12,476,993 12,735,826 258,833 267,745 8,911Japanese local government bonds .......................................... 2,206,530 2,266,374 59,831 60,853 1,022Japanese corporate bonds ...................................................... 641,322 644,473 3,162 7,047 3,884
Others: ........................................................................................ 3,543,042 3,407,251 (135,802) 42,417 178,220Foreign securities included .................................................... 3,328,262 3,193,120 (135,141) 36,127 171,268
Total ........................................................................................... $19,706,927 $19,980,288 $273,349 $516,331 $242,970
011_0550701372309.indd 39 2011/09/30 18:13:16

4040
Consolidated Financial Statements
Consolidated Financial Statem
ents
(2) Held-to-maturity debt securities sold for the years ended March 31, 2011 and 2010:Not applicable.
(3) Available-for-sale securities sold for the years ended March 31, 2011 and 2010:
Millions of yen
2011Sales amount Gains on sales Losses on sales
Stocks ........................................................................................................ ¥ 4,317 ¥ 471 ¥ 516Bonds: ....................................................................................................... 185,887 2,809 1,240
Japanese government bonds ................................................................. 127,040 1,549 1,199Japanese local government bonds ......................................................... 53,473 1,188 40Japanese corporate bonds ..................................................................... 5,372 72 —
Others: ....................................................................................................... 25,102 1,752 263Foreign securities included ................................................................... 23,926 1,719 17
Total .......................................................................................................... ¥215,307 ¥5,034 ¥2,019
Thousands of U.S. dollars
2011Sales amount Gains on sales Losses on sales
Stocks ........................................................................................................ $ 51,918 $ 5,664 $ 6,205 Bonds: ....................................................................................................... 2,235,562 33,782 14,912
Japanese government bonds ................................................................. 1,527,841 18,628 14,419Japanese local government bonds ......................................................... 643,090 14,287 481Japanese corporate bonds ..................................................................... 64,606 865 —
Others: ....................................................................................................... 301,888 21,070 3,162Foreign securities included ................................................................... 287,745 20,673 204
Total .......................................................................................................... $2,589,380 $60,541 $24,281
Millions of yen
2010Sales amount Gains on sales Losses on sales
Stocks ........................................................................................................ ¥ 3,891 ¥ 680 ¥157Bonds: ....................................................................................................... 209,266 1,006 561
Japanese government bonds ................................................................. 122,180 278 433Japanese local government bonds ......................................................... 53,406 485 115Japanese corporate bonds ..................................................................... 33,679 242 12
Others: ....................................................................................................... 29,064 2,705 128Foreign securities included ................................................................... 28,994 2,686 128
Total .......................................................................................................... ¥242,222 ¥4,392 ¥847
(4) Information on money held in trust at March 31, 2011 and 2010 was as follows:Money held in trust
Millions of yenThousands of U.S. dollars
2011 2010 2011
Carrying amount (fair market value) ................................................................. ¥24,500 ¥24,500 $294,648Amount of net unrealized gains (losses) included in the statement of income ... (6) 42 (72)
(5) The components of net unrealized gains on securities available for sale, net of taxes recorded under net assets at March 31, 2011 and 2010 are as follows:
Millions of yenThousands ofU.S. dollars
2011 2010 2011
Unrealized gains on securities available for sale ............................................... ¥22,729 ¥30,378 $273,349Deferred tax liabilities ....................................................................................... (6,128) (8,575) (73,698)Unrealized gains on securities available for sale (before adjustments of minority interests) ....................................................... ¥16,601 ¥21,802 $199,651Minority interests ............................................................................................... (60) (62) (721)Net unrealized gains on securities available for sale, net of taxes ..................... ¥16,540 ¥21,739 $198,917
(6) Securities reclassified for the years ended March 31, 2011 and 2010:Not applicable.
011_0550701372309.indd 40 2011/09/30 18:13:17

4141
Consolidated Financial Statem
ents
(7) Impairment loss on the securitiesIn the event that the fair value of securities, excepting trading securities, with available fair market values declines significantly compared with the acquisi-tion cost and the fair value is not expected to recover, such securities are stated at fair value, and the difference between fair value and the acquisition cost is recognized as loss in the period of the decline (“impairment loss”).
Impairment losses for equity securities and other securities incurred were ¥1,078 million ($12,964 thousand) and ¥224 million ($2,693 thousand) for the fiscal year ended March 31, 2011, respectively, and ¥753 million and ¥70 million for the fiscal year ended March 31, 2010, respectively.
The fair market value is regarded as “significantly declined” when (i) the fair market value as of the end of the fiscal year declines by more than 50% of the acquisition cost or (ii) the fair market value as of the end of the fiscal year declines by more than 30% but less than 50% of the acquisition cost, and is not expected to recover within one year.
8. TANGIBLE FIXED ASSETSAccumulated depreciation of tangible fixed assets were ¥42,886 million ($515,766 thousand), and ¥42,147 million at March 31, 2011 and 2010, respec-tively. Accumulated capital gains directly offset against the acquisition cost of tangible fixed assets to obtain tax benefits were ¥739 million ($8,887 thou-sand), and ¥739 million at March 31, 2011 and 2010, respectively. For the years ended March 31, 2011 and 2010, there was no such capital gain offset.
9. INCOME TAXESThe Companies are subject to a number of taxes based on the income, which, in the aggregate, indicate a statutory rate in Japan of approximately 40.4% and 40.3% for the years ended March 31, 2011 and 2010, respectively.
The following table summarizes the significant difference between the statutory tax rate and the Companies’ effective tax rate for financial statement purposes for the years ended March 31, 2011 and 2010.
2011 2010
Statutory tax rate .......................................................................................................................................... 40.4% 40.3%Valuation allowance ................................................................................................................................ 7.9% (0.8%)Expenses not qualifying for deduction .................................................................................................... 0.5% 0.6%Non-taxable dividend income ................................................................................................................. (2.2%) (1.9%)Tax rate difference of Special Purpose Company ................................................................................... (1.9%) (2.1%)Other ........................................................................................................................................................ 0.0% 0.7%
Effective tax rate .......................................................................................................................................... 44.6% 36.7%
Significant components of the Companies’ deferred tax assets and liabilities as of March 31, 2011 and 2010 are as follows:
Millions of yenThousands of U.S. dollars
2011 2010 2011
Deferred tax assets:Excess bad debt expenses .............................................................................. ¥18,754 ¥19,750 $225,544 Retirement benefits ........................................................................................ 7,314 6,905 87,961Depreciation .................................................................................................. 1,062 1,106 12,772Write-down of land ....................................................................................... 4,687 4,675 56,368Loss on impairment of fixed assets ............................................................... 1,734 1,694 20,853Valuation loss on securities ........................................................................... 8,843 10,285 106,349Deficit brought forward for taxation purposes .............................................. 5,793 9,068 69,669Net deferred gains on hedging instruments ................................................... 478 362 5,748
Other ......................................................................................................... 4,055 3,308 48,767Subtotal deferred tax assets: ........................................................................... 52,725 57,157 634,095Valuation allowance ........................................................................................... (15,443) (14,302) (185,724)Total deferred tax assets .................................................................................. 37,282 42,854 448,370Deferred tax liabilities:
Net unrealized gain on securities available for sale ...................................... (6,128) (8,576) (73,698)Other .............................................................................................................. (67) — (805)
Total deferred tax liabilities ............................................................................ (6,195) (8,576) (74,503)Net deferred tax assets .................................................................................... ¥31,086 ¥34,278 $373,854
10. LOAN LOSS PROVISIONSLoan loss provisions at March 31, 2011 and 2010 are as follows:
Millions of yenThousands ofU.S. dollars
2011 2010 2011
General Provision .............................................................................................. ¥15,678 ¥17,178 $188,550Specific Provision .............................................................................................. 15,946 18,321 191,773
Total ............................................................................................................... ¥31,624 ¥35,499 $380,324
011_0550701372309.indd 41 2011/09/30 18:13:17

4242
Consolidated Financial Statements
Consolidated Financial Statem
ents
11. RETIREMENT BENEFIT OBLIGATIONS(1) Outline of employees’ retirement allowanceThe Bank has contributory defined benefit pension plan and unfunded lump-sum retirement allowance plan. The Bank grants additional retirement benefits occasionally. The Bank has employer retirement benefits trusts.
The consolidated subsidiaries have unfunded lump-sum retirement allowance plans and a consolidated subsidiary have qualified pension plan.
(2) Information relating to retirement benefit obligations
Millions of yenThousands of U.S. dollars
2011 2010 2011
Projected benefit obligation ............................................................................... ¥(49,077) ¥(47,542) $(590,222)Plan assets .......................................................................................................... 27,445 26,722 330,066Unfunded projected benefit obligation .............................................................. (21,632) (20,820) (260,156)Unrecognized actuarial differences ................................................................... 10,155 10,312 122,128
(11,477) (10,508) (138,027)Prepaid pension costs ......................................................................................... — — —Reserve for retirement benefits .......................................................................... ¥(11,477) ¥(10,508) $(138,027)
Note: 1. One-time premium severance pay is not included in the table above. 2. Consolidated subsidiaries adopt the simple method in calculating the projected benefit obligations. 3. The principal assumptions used in determining benefit obligation and pension expenses at and for the years ended March 31, 2011 and 2010 are as follows: (a) Discount rate: 2.0% in 2011 and 2010. (b) Expected rate of return on plan assets: 2.0% in 2011, and 2.0% in 2010.
(3) Information relating to retirement benefit expense
Millions of yenThousands of U.S. dollars
2011 2010 2011
Service cost ........................................................................................................ ¥1,652 ¥1,659 $19,867Interest cost on projected benefit obligation ...................................................... 947 938 11,389Expected return on plan assets ........................................................................... (436) (362) (5,243)Amortization of actuarial differences ................................................................ 2,335 2,614 28,081Other .................................................................................................................. — — —
Total .............................................................................................................. ¥4,498 ¥4,850 $54,095
Note: Pension expenses of consolidated subsidiaries which adopt the simple method are included in “Service cost”.
12. GUARANTEESThe amount guaranteed by the Bank for privately-placed bonds (stipulated by Article 2-3 of the Financial Instruments Exchange Act), which are in-cluded in “Bonds” of “Securities” was ¥4,556 million ($54,792 thousand) and ¥5,031 million at March 31, 2011 and 2010, respectively.
13. STOCKHOLDERS’ EQUITYUnder the Banking Law of Japan and the Company law, the entire amount of the issue price of shares is required to be accounted for as capital, al-though the Bank may, by resolution of its Board of Directors, account for an amount not exceeding one-half of the issue price of the new shares as additional paid-in capital, which is included in capital surplus.
The Banking Law provides that an amount equal to at least 20% of cash dividends and other cash appropriations shall be appropriated and set aside as legal earnings reserve until the total amount of legal earnings re-serve and additional paid-in capital equals 100% of common stock. The total amount of legal earnings reserve and additional paid-in capital of the Bank has reached 100% of common stock. Therefore, the Bank is not re-quired to provide any more legal earnings reserve.
The legal earnings reserve and additional paid-in capital may be used to eliminate or reduce a deficit by resolution of the stockholders’ meeting or may be capitalized by resolution of the Board of Directors. On condi-tion that the total amount of legal earnings reserve and additional paid-in capital remains equal to or more than 100% of common stock, they are available for distribution by resolution of the stockholders’ meeting. Legal earnings reserve is included in retained earnings in the accompanying fi-nancial statements.
The maximum amount that the Bank can distribute as dividends is cal-culated based on the nonconsolidated financial statements of the Bank in accordance with the Company Law.
14. PLEDGED ASSETSAt March 31, 2011 and 2010, securities of ¥428,015 million ($5,147,504 thousand) and ¥396,454 million, no loans for 2011 and loans of ¥30,000 million were pledged as collateral for deposits and negotiable certificates of deposit of ¥19,801 million ($238,135 thousand) and ¥32,805 million, payables under securities lending transactions of ¥116,109 million ($1,396,380 thousand) and ¥83,573 million and borrowed money of ¥20,400 million ($245,339 thousand) and ¥56,300 million, respectively.
Other securities of ¥72,031 million ($866,277 thousand) and ¥71,766 million, were pledged for transaction guarantees at March 31, 2011 and 2010, respectively.
Unexpired lease contract claims of ¥6,806 million ($81,852 thousand) and ¥7,280 million were pledged as collateral for borrowed money of ¥6,969 million ($83,812 thousand) and ¥6,590 million at March 31, 2011 and 2010, respectively.
Other assets included initial margins of futures markets of ¥36 million ($432 thousand) and ¥39 million, guarantees of ¥1,587 million ($19,085 thousand) and ¥1,814 million, and other intangible fixed assets included surety deposits and intangibles of ¥574 million ($6,903 thousand) and ¥575 million at March 31, 2011 and 2010, respectively.
011_0550701372309.indd 42 2011/09/30 18:13:17

4343
Consolidated Financial Statem
ents
15. LOAN COMMITMENTSCommitment line contracts on overdrafts and loans are agreements to lend to customers when they apply for borrowing up to prescribed amount as long as there is no violation of any condition established in the contract.
The amounts of unused commitments at March 31, 2011 and 2010 were ¥885,641 million ($10,651,124 thousand) and ¥865,628 million, re-spectively, and the amount of unused commitments whose original con-tract terms were within one year or unconditionally cancelable at any time at March 31, 2011 and 2010 were ¥867,512 million ($10,433,096 thou-sand) and ¥853,361 million, respectively.
Since many of these commitment line contracts are expected to expire without being drawn upon, the total amount of unused commitments does not necessarily represent actual future cash flow requirements.
Many of these commitments line contracts have clauses that allow the Bank and its consolidated subsidiaries to reject the application from cus-tomers or reduce the contract amounts in case economic conditions change. In addition, the Bank and its consolidated subsidiaries may re-quest the customers to pledge collateral such as premises and securities and take other necessary measures such as scrutinizing customers’ finan-cial positions and revising contracts when need arises to secure claims.
16. OTHER INCOMEFor the fiscal years ended 2011 and 2010, other incomes were as follows:
Millions of yenThousands ofU.S. dollars
2011 2010 2011
Gains on sales of stocks and other securities ..................................................... ¥ 526 ¥ 680 $ 6,325Other ................................................................................................................... 3,096 3,611 37,233
Total ............................................................................................................... ¥3,622 ¥4,291 $43,559
17. OTHER EXPENSESFor the fiscal years ended 2011 and 2010, other expenses were as follows:
Millions of yenThousands ofU.S. dollars
2011 2010 2011
Losses on devaluation of stocks and other securities ........................................ ¥1,085 ¥ 771 $13,048Write-offs of loans ............................................................................................. 3,942 5,422 47,408Other .................................................................................................................. 2,576 4,458 30,980
Total ............................................................................................................... ¥7,603 ¥10,651 $91,437
18. LEASE TRANSACTIONSOperating leasesAs lessee:Future minimum lease payments under operating leases which are not cancelable at March 2011 and 2010 were as follows:
Millions of yenThousands ofU.S. dollars
2011 2010 2011
Due within one year ........................................................................................... ¥ 99 ¥ 97 $1,190Due after one year .............................................................................................. 668 269 8,033
Total ............................................................................................................... ¥768 ¥366 $9,236
As lessor:Future minimum lease payments under operating leases which are not cancelable at March 2011 and 2010 were as follows:
Millions of yenThousands ofU.S. dollars
2011 2010 2011
Due within one year ........................................................................................... ¥ 3 — $ 36Due after one year .............................................................................................. 13 — 156
Total ............................................................................................................... ¥16 — $192
19. NON-PERFORMING LOANSNonperforming loans at March 31, 2011 and 2010 were as follows:
Millions of yenThousands ofU.S. dollars
2011 2010 2011
Loans to bankrupt companies ............................................................................ ¥ 1,732 ¥ 2,669 $ 20,829 Past due loans .................................................................................................... 68,263 65,930 820,962Loans past due three months or more ................................................................ 2,076 3,340 24,966Loans with altered lending conditions ............................................................... 15,459 15,605 185,917
Total ............................................................................................................... ¥87,531 ¥87,546 $1,052,687
Bills discounted are accounted for as financing transactions in accordance with the JICPA Industry Audit Committee Report No. 24. This accounting treat-ment allows the Bank to have the right to sell or pledge them without restrictions. The total face value of commercial bills and purchased foreign exchange bills obtained as a result of discounting was ¥21,225 million ($255,261 thousand) and ¥19,676 million at March 31, 2011 and 2010, respectively.
011_0550701372309.indd 43 2011/09/30 18:13:17

4444
Consolidated Financial Statements
20. DERIVATIVE TRANSACTIONS(1) Derivative contracts to which hedge accounting is not applied:With respect to derivatives to which hedge accounting is not applied, contract amount or notional principal amount defined in the contract, fair value, un-realized gain (loss) and calculation method of fair value by transaction type as of March 31, 2011 and 2010 are as follows:
Note that the contract amount does not represent the market risk exposure of the derivative transactions.
(a) Interest rate related transactions
Millions of yenThousands ofU.S. dollars
2011 2011Contract amount or notional principal amount
Total Maturities over one year Unrealized gain (loss) Unrealized gain (loss)
Over-the-counter transactionsInterest rate swaps:
Receive fixed rate, pay floating rate ................. ¥1,151 ¥ 651 ¥44 $529 Receive floating rate, pay fixed rate ................. 6,151 5,651 (5) (60)
Total ............................................................. ¥ — ¥ — ¥39 $469
Millions of yen
2010Contract amount or notional principal amount
Total Maturities over one year Unrealized gain (loss)
Over-the-counter transactionsInterest rate swaps:
Receive fixed rate, pay floating rate ................. ¥1,997 ¥1,217 ¥57Receive floating rate, pay fixed rate ................. 1,997 1,217 (48)
Total ............................................................. ¥ — ¥ — ¥ 8
Notes: 1. Unrealized gains (losses) are recognized in the consolidated statement of income. 2. Market values of over-the counter transactions are based on the discounted cash flow method, option pricing model, etc.
(b) Currency related transactions
Millions of yenThousands ofU.S. dollars
2011 2011Contract amount or notional principal amount
Total Maturities over one year Unrealized gain (loss) Unrealized gain (loss)
Over-the-counter transactionsCurrency swaps .................................................... ¥84,346 ¥39,607 ¥(1,201) $(14,443)Forward foreign exchange contracts:
Sold .................................................................. 1,343 — (32) (384)Bought ............................................................. 374 — 1 12
Total ............................................................. ¥ — ¥ — ¥(1,232) $(14,816)
Millions of yen
2010Contract amount or notional principal amount
Total Maturities over one year Unrealized gain (loss)
Over-the-counter transactionsCurrency swaps .................................................... ¥72,894 ¥23,151 ¥7,048Forward foreign exchange contracts:
Sold .................................................................. 809 — 5Bought ............................................................. 226 — (17)
Total ............................................................. ¥ — ¥ — ¥7,036
Notes: 1. Unrealized gains (losses) are recognized in the consolidated statement of income. 2. Market values of over-the counter transactions are based on the discounted cash flow method.
(c) Stock related transactionsNone
(d) Bond derivativesNone
(e) Commodity derivativesNone
Consolidated Financial Statem
ents
011_0550701372309.indd 44 2011/09/30 18:13:18

4545
(f) Credit derivative transactions
Millions of yenThousands ofU.S. dollars
2011 2011Contract amount or notional principal amount
Total Maturities over one year Unrealized loss Unrealized loss
Over-the-counter transactionsCredit default swaps:
Sold ............................................................. ¥500 ¥— ¥(116) $(1,395)
Millions of yen
2010Contract amount or notional principal amount
Total Maturities over one year Unrealized gain (loss)
Over-the-counter transactionsCredit default swaps:
Sold ............................................................. ¥3,000 ¥3,000 ¥(1,180)
Notes: 1. Unrealized gains (losses) are recognized in the consolidated statement of income. 2. Market values are calculated using market prices at security corporations, etc. 3. “Sold” means the underwriting of credit risk and “Bought” means the transferring of credit risk.
(2) Derivative contracts to which hedge accounting is applied:With respect to derivatives which hedge accounting is applied, contract amount or notional principal amount defined in the contract, fair value and calcula-tion method of fair value by transaction type and by hedge accounting method as of March 31, 2011 are as follows:
Note that the contract amount does not represent the market risk exposure of the derivative transactions.
(a) Interest rate related
Millions of yen
2011
Hedge accounting method Transaction type Major hedged item Contract amountContract amount due after
one year Fair value
Fundamental method Interest rate swaps: Interest bearing assets and liabilities, such as loans and deposits
Receive fixed rate/pay floating rate — — —
Receive floating rate/pay fixed rate ¥52,596 ¥51,246 ¥(1,296)
Interest rate futures — — —Interest rate options — — —Other — — —
Exceptional accounting method for interest rate swap
Interest rate swap Borrowed moneyReceive fixed rate/pay
floating rate — — —Receive floating rate/pay
fixed rate ¥ 2,280 ¥ 2,140 ¥ (19)Total ¥(1,316)
Thousands of U.S. dollars
2011
Hedge accounting method Transaction type Major hedged item Contract amountContract amount due after
one year Fair value
Fundamental method Interest rate swaps: Interest bearing assets and liabilities, such as loans and deposits
Receive fixed rate/pay floating rate — — —
Receive floating rate/pay fixed rate $632,543 $616,307 $(15,586)
Interest rate futures — — —Interest rate options — — —Other — — —
Exceptional accounting method for interest rate swap
Interest rate swap Borrowed moneyReceive fixed rate/pay
floating rate — — —Receive floating rate/pay
fixed rate $ 27,420 $ 25,736 $ (228)Total $(15,826)
Consolidated Financial Statem
ents
011_0550701372309.indd 45 2011/09/30 18:13:18

4646
Consolidated Financial Statements
Millions of yen
2010
Hedge accounting method Transaction type Major hedged item Contract amountContract amount due after
one year Fair value
Fundamental method Interest rate swaps: Interest bearing assets and liabilities, such as loans, available-for-sale securities (bonds), deposits, negotiable certificates of deposit
Receive fixed rate/pay floating rate — — —
Receive floating rate/pay fixed rate ¥51,589 ¥51,586 ¥ (983)
Interest rate futures — — —Interest rate options — — —Other — — —
Exceptional accounting method for interest rate swap
Interest rate swap Borrowed moneyReceive fixed rate/pay
floating rateReceive floating rate/pay
fixed rate ¥ 2,896 ¥ 1,951 ¥ (29)Total ¥(1,013)
Notes: 1. Gain/loss on above contacts is deferred until maturity of the hedged items as the fundamental method in accordance with the “Treatment for Accounting and Auditing of Application of Accounting Standard for Financial Instruments in the Banking Industry” (JICPA Industry Audit Committee Report No. 24).
2. For the transaction on the exchange, the fair value is the closing price of the Tokyo International Exchange, etc. For over-the-counter transaction, the fair value is determined using the discounted cash flow method and option pricing model, etc.
(b) Currency related transactionsNone
(c) Stock related transactionsNone
(d) Bond related transactionsNone 21. RELATED-PARTY TRANSACTIONSFor the year ended March 31, 2011, related party transactions were as follows:
Relationship with the Bank Name Location
Paid-in capital
(Millions of yen)
Business line
Voting rights
ownership (%)
Relationship of related parties
Details of transactions
Transaction amount
(Millions of yen)
Accounting title
Year-end balance
(Millions of yen)
Year-end Balance
(Thousands of U.S. dollars)
Relatives of a director of the Bank
Atsushi Nakatani — — Office worker —
Husband of daughter of Tadashi Kasei
(Senior Managing Director)
Loans
Lending of money *2Interest receivable
—0
Loans—
15—
180—
Naomi Nakatani — — Officer —
Oldest daughter of Tadashi Kasei
(Senior Managing Director)
Loans
Lending of money *2Interest receivable
—0
Loans—
15—
180—
Hirokatsu Horiuchi — — Officer —
Oldest son of Yasuo Horiuchi
(Senior Managing Director)
Loans
Lending of money *2Interest receivable
—0
Loans—
14—
168—
Takashi Horiuchi — — Office worker —
Second son of Yasuo Horiuchi
(Senior Managing Director)
Loans
Lending of money *2Interest receivable
—0
Loans—
23—
276—
Shuichi Nomura — —
Member of the Board
of Directors
—
Younger brother in law of Yasuo Shimakawa
(Managing Director)Loans
Lending of money *2Interest receivable
—0
Loans—
24—
288—
Toshiko Nomura — —
Member of the Board
of Directors
—
Younger sister of Yasuo Shimakawa
(Managing Director)Loans
Lending of money *2Interest receivable
—0
Loans—
24—
288—
A company in which majority voting rights are held by relatives of a director of the Bank
Miyako Hotel Co., Ltd. *3
Nara city Nara Pref. 10
Parking Manage-
ment— Loans Lending of money *2
Interest receivable—26
Bad and doubtful loans*4
—
431—
5,183—
Nikken Blast Kogyo Co., Ltd. *5
Daito City Osaka 10 Metal
processing — Loans Lending of moneyInterest receivable
—1
Loans—
109—
1,310—
Consolidated Financial Statem
ents
011_0550701372309.indd 46 2011/09/30 18:13:18

4747
Policies regarding, and terms and conditions of, the transactionNotes: 1. Interest is reasonably determined in a manner similar to ordinary transactions, taking into account the prevailing market interest rates. 2. Loans were held with real estate in pledge. 3. Relatives of Masaaki Hashimoto (Managing Director of the Bank) have 84.0% of voting rights of this company directly. 4. Reserve for possible loans loss for ¥135 million were appropriated to bad and doubtful loans. And provision for possible loans losses for ¥135 million and loan amortization for ¥150 million were appropriated in this consolidated financial year end. 5. Relatives of Naoki Minowa (Director of the Bank) have 50.6% of voting rights of this company directly.
For the year ended March 31, 2010, related party transactions were as follows:
Relationship with the Bank Name Location
Paid-in capital
(Millions of yen)
Business line
Voting rights
ownership (%)
Relationship of related parties
Details of transactions
Transaction amount
(Millions of yen)
Accounting title
Year-end balance
(Millions of yen)
Year-end Balance
(Thousands of U.S. dollars)
Relatives of a director of the Bank
Atsushi Nakatani — — Office
worker —
Husband of daughter of Tadashi Kasei
(Senior Managing Director)
Loans
Lending of money *2Interest receivable
160
Loans—
15—
161—
Naomi Nakatani — — Officer —
Oldest daughter of Tadashi Kasei
(Senior Managing Director)
Loans
Lending of money *2Interest receivable
160
Loans—
15—
161—
Hirokatsu Horiuchi — — Officer —
Oldest son of Yasuo Horiuchi
(Senior Managing Director)
Loans
Lending of money *2Interest receivable
—0
Loans—
14—
150—
Takashi Horiuchi — — Office
worker —
Second son of Yasuo Horiuchi
(Senior Managing Director)
Loans
Lending of money *2Interest receivable
—0
Loans—
23—
247—
Shuichi Nomura — —
Member of the Board
of Directors
—
Younger brother in law of Yasuo Shimakawa
(Managing Director)Loans
Lending of money *2Interest receivable
—0
Loans—
29—
311—
Toshiko Nomura — —
Member of the Board
of Directors
—
Younger sister of Yasuo Shimakawa
(Managing Director)Loans
Lending of money *2Interest receivable
—0
Loans—
29—
311—
A company in which majority voting rights are held by relatives of a director of the Bank
Miyako Hotel Co., Ltd. *3
Nara city Nara Pref. 10
Parking Manage-
ment— Loans Lending of money *2
Interest receivable—26
Bad and doubtful loans*4
—
1,182—
12,704—
Nikken Blast Kogyo Co., Ltd. *5
Daito City Osaka 10 Metal
processing — Loans Lending of moneyInterest receivable
—1
Loans—
134—
1,440—
Policies regarding, and terms and conditions of, the transactionNotes: 1. Interest is reasonably determined in a manner similar to ordinary transactions, taking into account the prevailing market interest rates. 2. Loans were held with real estate in pledge. 3. Relatives of Masaaki Hashimoto (Managing Director of the Bank) have 84.0% of voting rights of this company directly. 4. Reserve for possible loans loss for ¥595 million were appropriated to bad and doubtful loans. And provision for possible loans losses for ¥43 million were appropriated in this consolidated financial year end. 5. Relatives of Naoki Minowa (Director of the Bank) have 50.6% of voting rights of this company directly.
22. PER SHARE INFORMATIONNet assets per share at March 31, 2011 and 2010 and net income per share for the years then ended are as follows:
yen U.S. dollars
2011 2010 2011
Net assets per share ............................................................................................ ¥660.24 ¥661.81 $7.94Net income per share-basic ................................................................................ 23.88 26.45 0.28Diluted net income per share ............................................................................. 23.87 — 0.28
Diluted net income per share for the fiscal year of 2010 is not disclosed since no potentially dilutive instruments were outstanding during the year ended March 31, 2010.
Consolidated Financial Statem
ents
011_0550701372309.indd 47 2011/09/30 18:13:19

4848
Consolidated Financial Statements
Basic information in computing above per share data is as follows:
Millions of yenThousands of U.S. dollars
2011 2010 2011
(Net assets per share)Net assets ........................................................................................................... ¥207,175 ¥207,095 $2,491,581 Amounts to be deducted from net assets ........................................................... 25,156 24,621 302,537
Acquisition Rights ......................................................................................... (31) — (372)Minority interests .......................................................................................... (25,125) (24,621) (302,164)
Net assets attributed to common stock .............................................................. 182,018 182,474 2,189,031Outstanding number of common stocks at end of year (unit: thousand shares) ..................................................................................... 275,682 275,719
(Net income per share and Diluted net income per share)Net income ........................................................................................................ ¥ 6,584 ¥ 7,293 $ 79,182 Net income to be attributed to common stock ................................................... 6,584 7,293 79,182Average outstanding number of shares during the year (unit: thousands of shares) ............................................................................... 275,703 275,733Adjustment in net income .................................................................................. — — —Increase in number of common stock ................................................................ 63 — —
Acquisition rights .......................................................................................... (63) — —Convertible securities not diluting earnings per common share ........................ — — —
23. STOCK OPTION RIGHTS(a) Item and amount expensed in the current fiscal year related to stock options is as follows:
Millions of yenThousands ofU.S. dollars
2011 2011
General and administrative expenses ....................................................................................................... ¥31 $372
(b) Stock options outstanding at March 31, 2011 are as follows:a. Outline of the stock optionsBeneficiaries qualified for stock option rights are entitled to acquire common stock upon exercise of the right. The following table summarizes the number of shares upon exercise of the stock option rights granted by the Bank outstanding at March 31, 2011:
Stock option
Persons granted
Number of options granted
Date of grant
Exercise period
Vesting conditions
Target of service period
2010 Stock Option
15 directors of the Bank
Common stock 94,400 shares
July 29, 2010 From July 30, 2010 To July 29, 2040
Not defined Not defined
b. Stock option activity:1) Number of stock options
Number of shares
2010Stock Option
Non-vestedMarch 31, 2010 – Outstanding ...................................................................................................................................................... —Granted .......................................................................................................................................................................................... 94,400Forfeited ........................................................................................................................................................................................ —Vested ............................................................................................................................................................................................ 70,800Unvested ........................................................................................................................................................................................ 23,600
VestedMarch 31, 2010 – Outstanding ...................................................................................................................................................... —Vested ............................................................................................................................................................................................ 70,800Exercised ....................................................................................................................................................................................... —Forfeited ........................................................................................................................................................................................ —March 31, 2011 – Outstanding ...................................................................................................................................................... 70,800
Consolidated Financial Statem
ents
011_0550701372309.indd 48 2011/09/30 18:13:19

4949
2) Price information
Yen U.S. dollars
2010 Stock option
2010 Stock option
Exercise price .......................................................................................................................................... ¥ 1 $0Average stock price at exercise date ........................................................................................................ — —Fair value price at grant date ................................................................................................................... 441 5
(c) Assumptions used to measure the fair value of stock optionThe assumptions used to measure the fair value of the stock option granted in the years ended March 31, 2011 and 2010 are as follows:For the year ended March 31, 2011
1) The Black-Scholes option pricing model was used as a measurement method.2) Assumptions used for the Black-Scholes option pricing model:
1. Volatility of stock price: 31.41%, calculated using the market price of the Bank’s stock through April 2007 to July 2010.2. Estimated remaining outstanding period: 3.3 years, which was the average remaining tenure of Board of Directors at the date of issue, determined
by the average time from appointment to retirement and time from appointment to the date of issue.3. Estimated dividend: ¥6 per share, which was calculated based on the actual amount of dividends for the fiscal year ended March 31, 2010.4. Risk-free interest rate: 0.18%, determined using yield of national bonds equivalent to estimated remaining outstanding period.
(d) Estimation method for the total number of vested stock option rightsThe total number of stock option rights issued is deemed to reflect the actual number of stock option rights expired due to difficulties in estimating reason-ably the number of stock option rights that will expire in future.
There have been no stock options granted for fiscal year 2010.
24. COMPREHENSIVE INCOME STATEMENT(1) Other comprehensive income for the fiscal year immediately preceding the current fiscal year is as follows:
Millions of yen
2010
Other comprehensive income ............................................................................................................................................................ ¥38,720Net unrealized gains on securities available for sale, net of taxes ................................................................................................ 38,831Net deferred gains on hedging instruments, net of taxes .............................................................................................................. (111)
(2) Total comprehensive income for the fiscal year immediately preceding the current fiscal year is as follows:
Millions of yen
2010
Total comprehensive income attributable to: ..................................................................................................................................... ¥46,815Owners of the parent ......................................................................................................................................................................... 45,969Minority interests ............................................................................................................................................................................... 845
25. SUBSEQUENT EVENTSNot applicable.
Consolidated Financial Statem
ents
011_0550701372309.indd 49 2011/09/30 18:13:19

5050
Independent Auditors’ Report
Independent Auditors’ R
eport
011_0550701372309.indd 50 2011/09/30 18:13:23

5151
Capital ManagementC
apital Managem
ent
Consolidated Capital Adequacy Ratio
Nonconsolidated Capital Adequacy Ratio
Millions of yen
2011 2010 2009 2008 2007
Tier I:Capital ...................................................................................... ¥ 190,328 ¥ 184,878 ¥ 179,138 ¥ 198,398 ¥ 200,349Tax effect amount ..................................................................... — — — — —
Tier I total (A) ...................................................................... 190,328 184,878 179,138 198,398 200,349Tier II:
General provision ..................................................................... 11,655 12,073 12,966 13,152 13,014Qualifying subordinated debt ................................................... 20,000 40,000 20,000 20,000 20,000
Tier II total ........................................................................... 31,655 52,073 32,966 33,152 33,014Of which, added to capital (B) ................................................. 31,655 52,073 32,966 33,152 33,014Deductions from capital (internal holding for other financial
institutions’ fund raising purposes) (C) ................................. 2,976 2,665 3,269 4,516 1,087[Total capital (A)+(B)-(C)] (D) ............................................ ¥ 219,007 ¥ 234,286 ¥ 208,835 ¥ 227,034 ¥ 232,276
Risk-weighted assets On-balance-sheet risk-weighted assets ..................................... 1,706,948 1,771,998 1,909,271 1,933,785 1,907,607Off-balance-sheet risk-weighted assets .................................... 28,904 29,566 35,449 41,735 48,012
Total (E) ............................................................................... ¥1,735,852 ¥1,801,565 ¥1,944,720 ¥1,975,520 ¥1,955,619Operational risk equivalent ((G)/8%) (F) ................................. 129,077 130,157 129,880 128,825 126,677(For reference) amount related to operational risk (G) ............ 10,326 10,412 10,390 10,306 10,134
[Total (E)+(F)] (H) ............................................................... ¥1,864,930 ¥1,931,722 ¥2,074,601 ¥2,104,345 ¥2,082,297Capital adequacy ratio(Based on domestic standards) (D)/(H)x100(%) ...................... 11.74% 12.12% 10.06% 10.78% 11.15%
Tier I ratio = (A)/(H)x100(%) .............................................. 10.20% 9.57% 8.63% 9.42% 9.62%
Note: The capital adequacy ratio was calculated on the basis of the formula provided by the Ministry of Finance under Provision 14, Clause 2 of the Banking Law.
Millions of yen
2011 2010 2009 2008 2007
Tier I:Capital ...................................................................................... ¥ 182,915 ¥ 177,971 ¥ 172,326 ¥ 191,215 ¥ 193,824Tax effect amount ..................................................................... — — — — —
Tier I total (A) ...................................................................... 182,915 177,971 172,326 191,215 193,824Tier II:
General provision ..................................................................... 11,529 11,951 12,847 13,030 12,898Qualifying subordinated debt ................................................... 20,000 40,000 20,000 20,000 20,000
Tier II total ........................................................................... 31,529 51,951 32,847 33,030 32,898Of which, added to capital (B) ................................................. 31,529 51,951 32,847 33,030 32,898Deductions from capital (internal holding for other financial
institutions’ fund raising purposes) (C) ................................. 2,976 2,665 3,269 4,516 1,087[Total capital (A)+(B)-(C)] (D) ............................................ ¥ 211,468 ¥ 227,257 ¥ 201,904 ¥ 219,728 ¥ 225,635
Risk-weighted assetsOn-balance-sheet risk-weighted assets ..................................... 1,693,588 1,758,780 1,895,642 1,918,719 1,893,616Off-balance-sheet risk-weighted assets .................................... 28,902 29,564 35,446 41,731 48,009
Total (E) ............................................................................... ¥1,722,491 ¥1,788,344 ¥1,931,089 ¥1,960,450 ¥1,941,626Operational risk equivalent ((G)/8%) (F) ................................. 122,271 123,903 124,515 124,411 122,115(For reference) amount related to operational risk (G) ............ 9,781 9,912 9,961 9,952 9,769
[Total (E)+(F)] (H) ............................................................... ¥1,844,762 ¥1,912,248 ¥2,055,604 ¥2,084,862 ¥2,063,742Capital adequacy ratio(Based on domestic standards) (D)/(H)x100(%) ...................... 11.46% 11.88% 9.82% 10.53% 10.93%
Tier I ratio = (A)/(H)x100(%) .............................................. 9.91% 9.30% 8.38% 9.17% 9.39%
Note: The capital adequacy ratio was calculated on the basis of the formula provided by the Ministry of Finance under Provision 14, Clause 2 of the Banking Law.
As of March 31, 2011
As of March 31, 2011
011_0550701372309.indd 51 2011/09/30 18:13:23

5252
Organization, Group Network
Organization, G
roup Netw
ork
(As of July 1, 2011)
THE NANTO BANK, LTD.
• DOMESTIC OFFICES
ORGANIZATION
STOCKHOLDERS’ MEETING
BOARD OF DIRECTORS
BOARD OF CORPORATE AUDITORS
MANAGING DIRECTORS’COMMITTEE
Standing Corporate Auditor
Corporate Auditors
Corporate Auditors’ Of�ce
HEADQUARTERS
General Secretariat
General Planning Division
Compliance & Risk Management Division
General Business Division
Individual Sales Division
Value Creation Division
Public Institutions Division
Credit Analysis Division
Securities & International Division
Operations Control Division
Operations Division
Internal Audit Division
Personnel Division
General Affairs Division
Regional Headquarters
Tokyo Liaison Of�ce
Head Of�ce and 112 Branches17 Sub-branches2 Agencies (Nangin Agency Co., Ltd.’s business of�ces)2 Representative Of�ces (Hong Kong and Shanghai)
Securities & International Division
Nanto Credit Guarantee Co., Ltd.
Nanto Lease Co., Ltd.
Nanto Computer Service Co., Ltd.
Nanto DC Card Co., Ltd.Nanto Card Services Co., Ltd.
Nanto Estate Co., Ltd.Nanto Business Service Co., Ltd.Nanto Staff Service Co., Ltd.Nanto Asset Research Co., Ltd.Nangin Agency Co., Ltd.Nanto Investment Management Co., Ltd.Nanto Preferred Capital Cayman, Ltd.
Banking
Securities
Credit Guarantees
Leasing
Other Operations
Computer SoftwareDevelopment andServices
Credit Card Business
NANTO BANK GROUP
Chairman
President
Senior Managing Directors
Managing Directors
Directors
The Nanto Group, which consists of Nanto Bank and its 12 consolidated subsidiaries, offers �nancial services related to securities, credit guarantee and leasing as well as its primary business, banking services.
Companies indicated with a pink square are consolidated subsidiaries.
011_0550701372309.indd 52 2011/09/30 18:13:24

5353
Affiliates and Subsidiaries, B
ank Data
Affiliates and Subsidiaries, Bank Data
Outline of Consolidated Subsidiaries
Subsidiaries Address EstablishedCapital (millions of yen)
Direct holdings of the Bank (%)
Indirect holdings through subsidiaries (%) Business line
Nanto Credit Guarantee Co., Ltd.
2-1, Saidaiji-Kunimi-cho 1-chome Nara City, Nara, Japan
October 9, 1984
¥10 3% 69% Credit guarantee
Nanto Lease Co., Ltd. 52-1, Omori-cho Nara City, Nara, Japan
December 22, 1984
50 5 65 Leasing
Nanto Computer Service Co., Ltd.
93-2, Minami-Kyobate-cho 1-chome, Nara City, Nara, Japan
July 1,1986
10 5 69 Computer software development and services
Nanto DC Card Co., Ltd. 61-7, Higashi-Ikoma1-chome, Ikoma City, Nara, Japan
October 12, 1990
50 5 71 Credit card business
Nanto Card Services Co., Ltd.
61-7, Higashi-Ikoma1-chome, Ikoma City, Nara, Japan
December 10, 1990
50 5 71 Credit card business
Nanto Estate Co., Ltd. 16, Hashimoto-cho Nara City, Nara, Japan
November 8, 1969
30 100 — Leasing and management of real estate
Nanto Business Service Co., Ltd.
93-2, Minami-Kyobate-cho 1-chome, Nara City, Nara, Japan
June 1,1984
10 100 — Centralized processing of clerical operations for the Bank
Nanto Staff Service Co., Ltd.
2-1, Omiya-cho 6-chome Nara City, Nara, Japan
March 18, 1991
20 100 — Dispatch of temporary staff
Nanto Asset Research Co., Ltd.
16, Hashimoto-cho Nara City, Nara, Japan
July 4,2005
20 100 — Research and appraisal of real estate
Nangin Agency Co., Ltd. 16, Hashimoto-cho Nara City, Nara, Japan
October 6, 2009
50 100 — Bank agency service
Nanto Investment Management Co., Ltd.
2-1, Omiya-cho 6-chome Nara City, Nara, Japan
November 21, 1986
120 5 68 Investment advisory service
Nanto Preferred Capital Cayman, Ltd.
PO Box 309GT, Ugland House, South Church St., George Town, Grand Cayman, Cayman Islands
January 29, 2007
20,600 100 — Issue of preferred securities
HEAD OFFICE16, Hashimoto-cho Nara City, Nara 630-8677, JapanPhone: (0742) 22-1131URL: http://www.nantobank.co.jp/
SECURITIES & INTERNATIONAL DIVISION16, Hashimoto-cho Nara City, Nara 630-8677, JapanPhone: (0742) 27-1546Fax: (0742) 26-1734SWIFT address: NANT JP JTE-mail address: [email protected]
HONG KONG REPRESENTATIVE OFFICEROOM 2104-2105, 21/F, HUTCHISON HOUSE,10 HARCOURT ROAD,HONG KONGPhone: 852-2868-9932Fax: 852-2530-1583E-mail address: [email protected]
SHANGHAI REPRESENTATIVE OFFICE16F, Hang Seng Bank Tower, 1000 Lujiazui Ring Road,Pudong New Area, Shanghai, ChinaPhone: 86-21-6841-2771Fax: 86-21-6841-2871E-mail address: [email protected]
CORPORATE DATAAuthorized shares: 640,000,000Outstanding shares: 281,756 thousandStated capital: 29,249 millionNumber of stockholders: 11,394Date of incorporation: June 1934Domestic network: 132 officesOverseas network: 2 representative officesNumber of employees: 2,882Ordinary stockholders’ meeting: June 29, 2011Stock listings: Tokyo Stock exchange,
Osaka Securities exchange
MAJOR STOCKHOLDERSNumber of shares
(thousands) Percentage
(%)
Japan Trustee Services Bank, Ltd. 21,146 7.50The Bank of Tokyo-Mitsubishi UFJ, Ltd. 10,283 3.64The Nanto Bank employees’ Shareholders Association 8,537 3.03Nippon Life Insurance Co. 8,531 3.02Meiji Yasuda Life Insurance Co. 8,430 2.99Tokio Marine and Nichido Fire Insurance Co., Ltd. 6,247 2.21Sumitomo Life Insurance Co. 5,420 1.92Mori Seiki Co., Ltd. 4,766 1.69Kitamura Forestry Co., Ltd. 4,063 1.44The Dai-ichi Life Insurance Company, Limited 4,060 1.44Total 81,486 28.92
(As of July 1, 2011)
011_0550701372309.indd 53 2011/09/30 18:13:24

ANNUAL REPORT 2011Year ended March 31, 2011
THE NANTO BANK, LTD.16, Hashimoto-cho, Nara City, Nara 630-8677, Japan
Phone: (0742)22-1131
010_0550701372309.indd 1 2011/09/30 18:27:29