Embed Size (px)
Citation preview

Information Meeting —The Year Ended March 2017—
Appendix
THE NANTO BANK, LTD.

Table of Contents
I. Current Status of the Regional Economy
1. Population and Number of Households 2
2. Number of Private Enterprises 3
3. Business Sentiment among Nara
Prefecture-based Companies 4
4. Industrial Production Index and
Employment Conditions 5
5. Business Bankruptcy 6
6 Balances of Deposits and Loans
in Nara Prefecture 7
II. Numerical Data and Metrics
1. Profits and Losses 9
2. Principal Accounts (Deposits) 10
3. Principal Accounts (Loans) 11
4. Principal Accounts
(Assets under Management) 12
5. Interest Margins 13
6. Loans by Industry 14
7. Classification of Debtors 15
8. Capital Adequacy Ratio 16
9. Total Risk Management 17
10. Composition of Shareholders 18
11. Outline and Results of the Previous
Medium-Term Management Plan 19
12. Share in Nara Prefecture 20
13. Nanto Bank Group Companies 21
14. Pursuit of CSR Activities 22
▪ ▪ ▪ ▪ ▪
▪ ▪ ▪ ▪ ▪
▪ ▪ ▪ ▪ ▪
▪ ▪ ▪ ▪ ▪
▪ ▪ ▪ ▪ ▪
▪ ▪ ▪ ▪ ▪
▪ ▪ ▪ ▪ ▪
▪ ▪ ▪ ▪ ▪
▪ ▪ ▪ ▪ ▪
▪ ▪ ▪ ▪ ▪
▪ ▪ ▪ ▪ ▪
▪ ▪ ▪ ▪ ▪
▪ ▪ ▪ ▪ ▪
▪ ▪ ▪ ▪ ▪
▪ ▪ ▪ ▪ ▪
▪ ▪ ▪ ▪ ▪
▪ ▪ ▪ ▪ ▪
▪ ▪ ▪ ▪ ▪
▪ ▪ ▪ ▪ ▪
▪ ▪ ▪ ▪ ▪

表紙Ⅰ
1
I. Current Status of the Regional
Economy
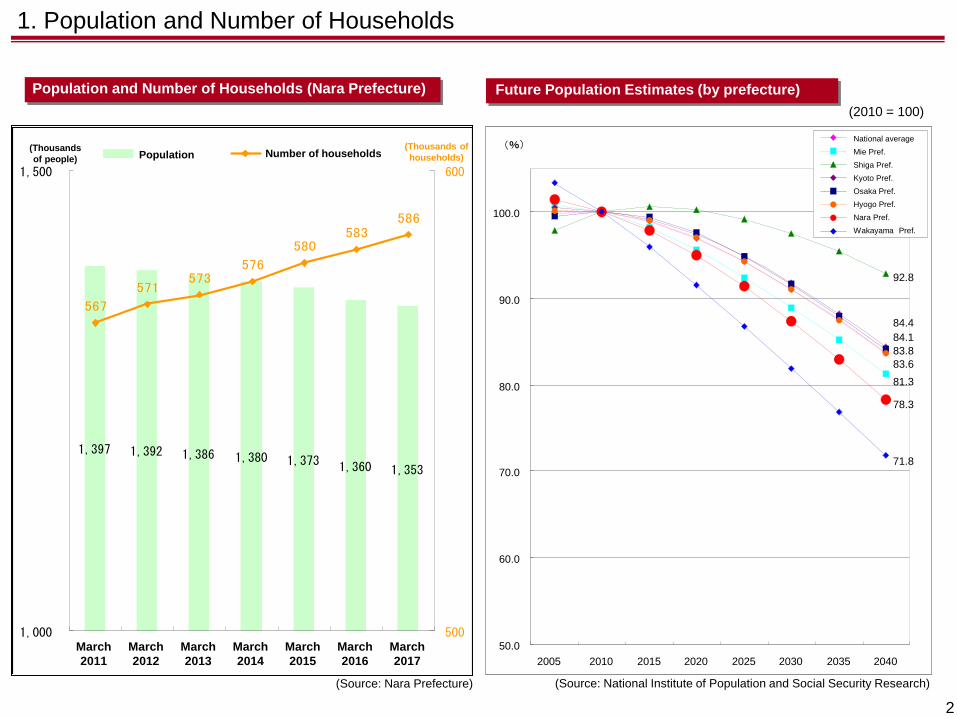
83.8
81.3
92.8
84.4
84.1
83.6
78.3
71.8
50.0
60.0
70.0
80.0
90.0
100.0
2005 2010 2015 2020 2025 2030 2035 2040
1,397 1,392 1,386 1,3731,360 1,353
1,380
567
571573
576
580583
586
1,000
1,500
500
600
1. Population and Number of Households
(Source: National Institute of Population and Social Security Research)
(2010 = 100)
2
Population and Number of Households (Nara Prefecture) Future Population Estimates (by prefecture)
(Source: Nara Prefecture)
National average
Mie Pref.
Shiga Pref.
Kyoto Pref.
Osaka Pref.
Hyogo Pref.
Nara Pref.
Wakayama Pref.
(Thousands
of people) Number of households Population
(Thousands of
households)
March
2011
March
2012
March
2013
March
2014
March
2015
March
2016
March
2017
Jul. 31,
2009
Feb. 29,
2012
Jul. 31,
2014
Change from
Feb. 29, 2012
Change
(number)
Change
(%)
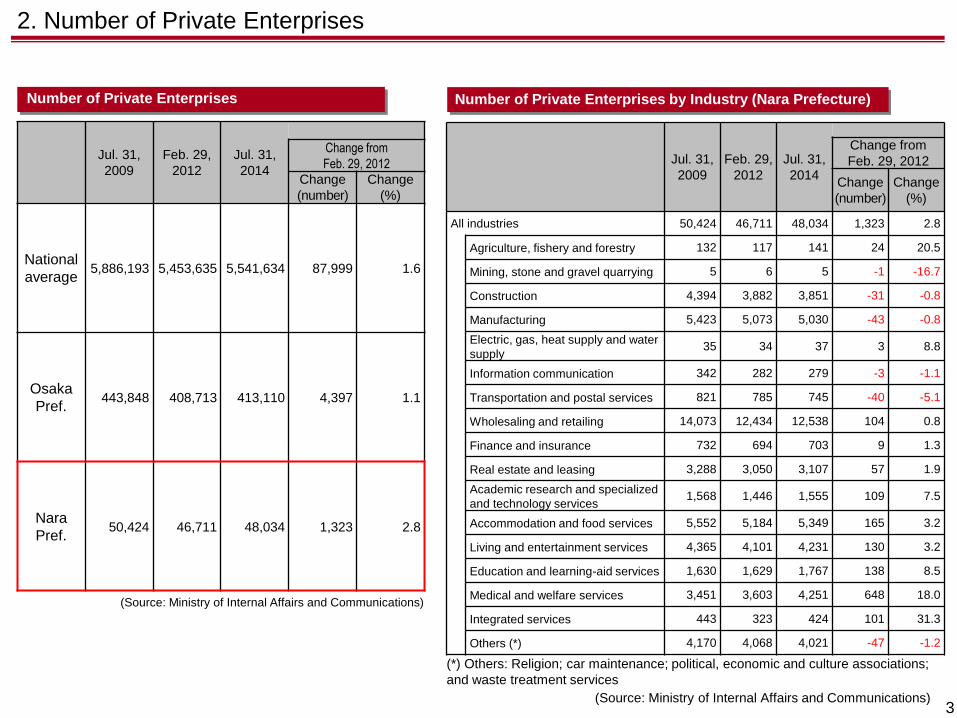
All industries 50,424 46,711 48,034 1,323 2.8
Agriculture, fishery and forestry 132 117 141 24 20.5
Mining, stone and gravel quarrying 5 6 5 -1 -16.7
Construction 4,394 3,882 3,851 -31 -0.8
Manufacturing 5,423 5,073 5,030 -43 -0.8
Electric, gas, heat supply and water
supply 35 34 37 3 8.8
Information communication 342 282 279 -3 -1.1
Transportation and postal services 821 785 745 -40 -5.1
Wholesaling and retailing 14,073 12,434 12,538 104 0.8
Finance and insurance 732 694 703 9 1.3
Real estate and leasing 3,288 3,050 3,107 57 1.9
Academic research and specialized
and technology services 1,568 1,446 1,555 109 7.5
Accommodation and food services 5,552 5,184 5,349 165 3.2
Living and entertainment services 4,365 4,101 4,231 130 3.2
Education and learning-aid services 1,630 1,629 1,767 138 8.5
Medical and welfare services 3,451 3,603 4,251 648 18.0
Integrated services 443 323 424 101 31.3
Others (*) 4,170 4,068 4,021 -47 -1.2
2. Number of Private Enterprises
(Source: Ministry of Internal Affairs and Communications)
3 (Source: Ministry of Internal Affairs and Communications)
Number of Private Enterprises Number of Private Enterprises by Industry (Nara Prefecture)
Jul. 31,
2009
Feb. 29,
2012
Jul. 31,
2014
Change from
Feb. 29, 2012
Change
(number)
Change
(%)
National
average 5,886,193 5,453,635 5,541,634 87,999 1.6
Osaka
Pref. 443,848 408,713 413,110 4,397 1.1
Nara
Pref. 50,424 46,711 48,034 1,323 2.8
(*) Others: Religion; car maintenance; political, economic and culture associations;
and waste treatment services
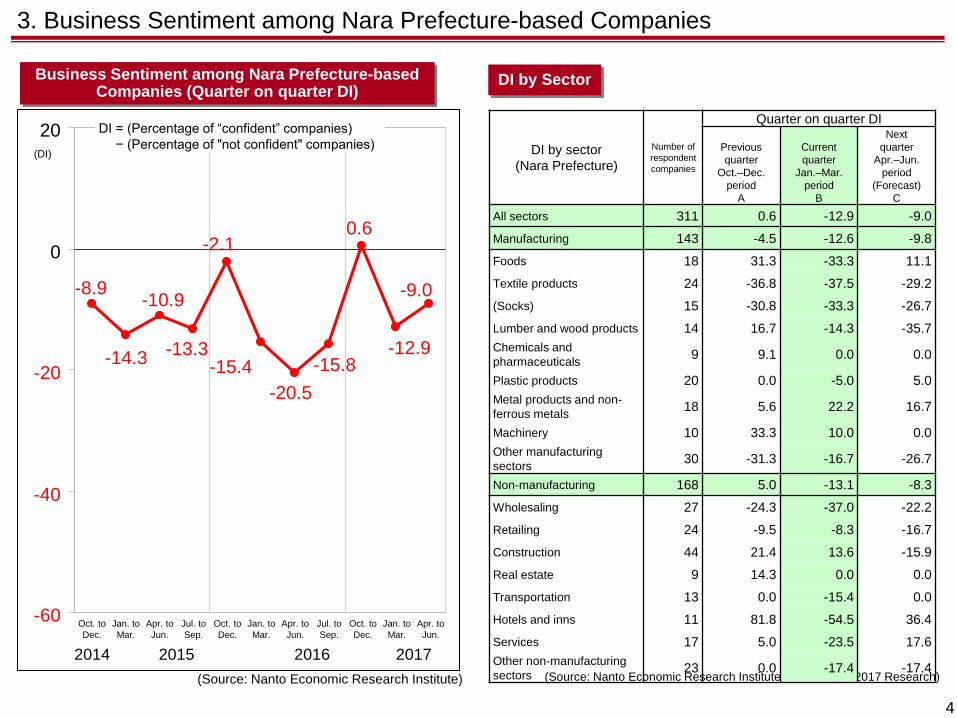
3. Business Sentiment among Nara Prefecture-based Companies
(Source: Nanto Economic Research Institute)
DI by Sector
4
(Source: Nanto Economic Research Institute, March–April 2017 Research)
Business Sentiment among Nara Prefecture-based Companies (Quarter on quarter DI)
DI by sector
(Nara Prefecture)
Number of
respondent
companies
Quarter on quarter DI
Previous
quarter
Oct.–Dec.
period
A
Current
quarter
Jan.–Mar.
period
B
Next
quarter
Apr.–Jun.
period
(Forecast)
C
All sectors 311 0.6 -12.9 -9.0
Manufacturing 143 -4.5 -12.6 -9.8
Foods 18 31.3 -33.3 11.1
Textile products 24 -36.8 -37.5 -29.2
(Socks) 15 -30.8 -33.3 -26.7
Lumber and wood products 14 16.7 -14.3 -35.7
Chemicals and
pharmaceuticals 9 9.1 0.0 0.0
Plastic products 20 0.0 -5.0 5.0
Metal products and non-
ferrous metals 18 5.6 22.2 16.7
Machinery 10 33.3 10.0 0.0
Other manufacturing
sectors 30 -31.3 -16.7 -26.7
Non-manufacturing 168 5.0 -13.1 -8.3
Wholesaling 27 -24.3 -37.0 -22.2
Retailing 24 -9.5 -8.3 -16.7
Construction 44 21.4 13.6 -15.9
Real estate 9 14.3 0.0 0.0
Transportation 13 0.0 -15.4 0.0
Hotels and inns 11 81.8 -54.5 36.4
Services 17 5.0 -23.5 17.6
Other non-manufacturing
sectors 23 0.0 -17.4 -17.4
-9.0
-12.9
0.6
-15.8
-20.5
-15.4
-2.1
-13.3
-10.9
-14.3
-8.9
-60
-40
-20
0
20 DI = (Percentage of “confident” companies)
− (Percentage of "not confident" companies)
2014 2015 2016 2017
(DI)
Oct. to
Dec.
Jan. to
Mar.
Apr. to
Jun.
Jul. to
Sep.
Oct. to
Dec.
Jan. to
Mar.
Apr. to
Jun.
Jul. to
Sep.
Oct. to
Dec.
Jan. to
Mar.
Apr. to
Jun.
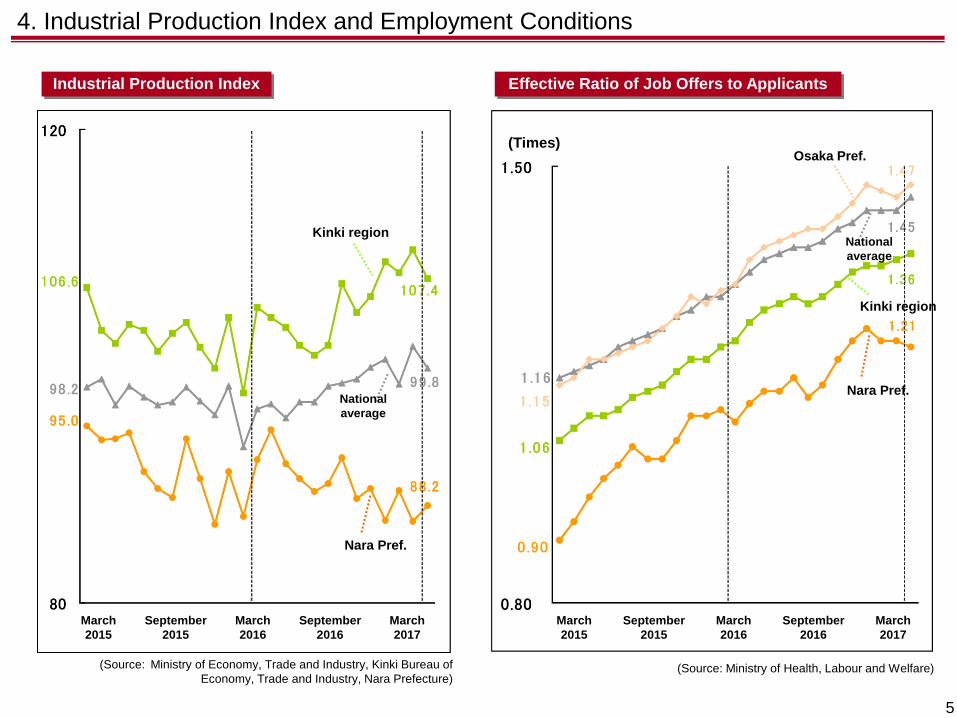
4. Industrial Production Index and Employment Conditions
(Source: Ministry of Economy, Trade and Industry, Kinki Bureau of
Economy, Trade and Industry, Nara Prefecture) (Source: Ministry of Health, Labour and Welfare)
5
Industrial Production Index Effective Ratio of Job Offers to Applicants
Kinki region
Nara Pref.
National
average
Osaka Pref.
Kinki region
Nara Pref.
National
average
(Times)
March
2015
September
2015
March
2016
September
2016
March
2017
March
2015
September
2015
March
2016
September
2016
March
2017
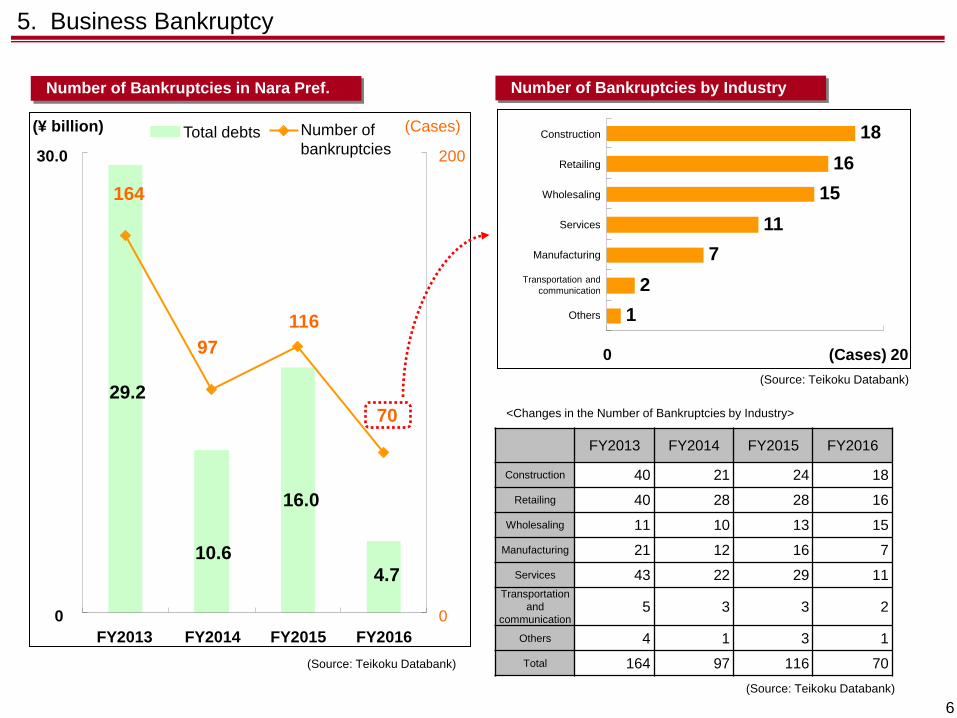
FY2013 FY2014 FY2015 FY2016
Construction 40 21 24 18
Retailing 40 28 28 16
Wholesaling 11 10 13 15
Manufacturing 21 12 16 7
Services 43 22 29 11
Transportation
and
communication 5 3 3 2
Others 4 1 3 1
Total 164 97 116 70
4.7
10.6
16.0
29.2
97
164
116
70
0
30.0
FY2013 FY2014 FY2015 FY2016
(¥ billion)
0
200
(Cases) Total debts Number of
bankruptcies
5. Business Bankruptcy
6
Number of Bankruptcies in Nara Pref. Number of Bankruptcies by Industry
(Source: Teikoku Databank)
(Source: Teikoku Databank)
(Source: Teikoku Databank)
1
2
7
11
15
16
18
0 (Cases) 20
<Changes in the Number of Bankruptcies by Industry>
Construction
Retailing
Wholesaling
Services
Manufacturing
Transportation and
communication
Others
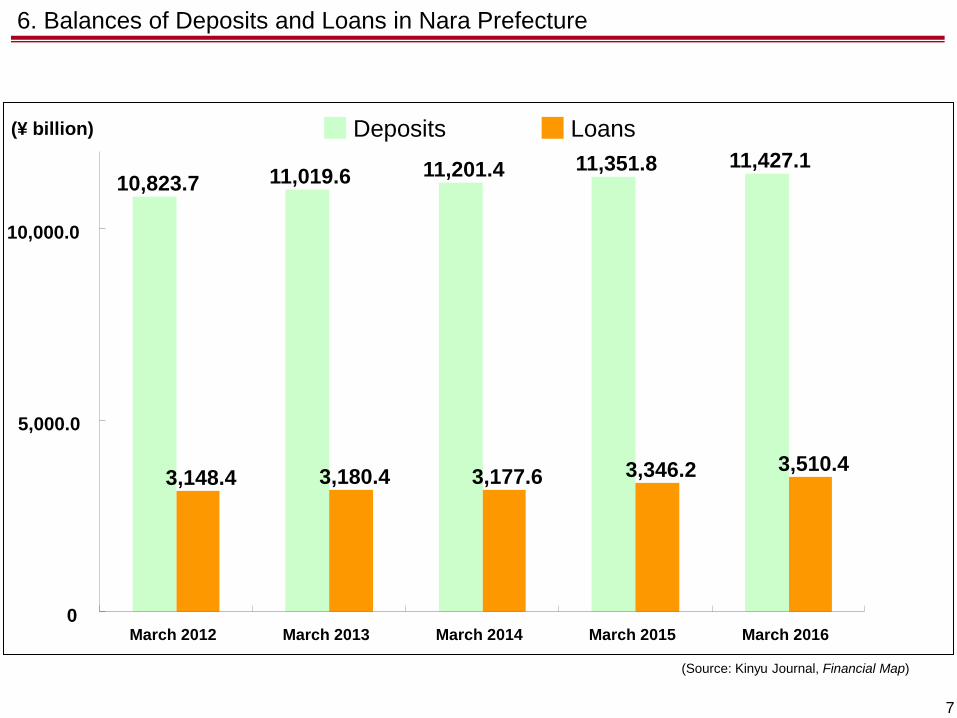
6. Balances of Deposits and Loans in Nara Prefecture
7
(Source: Kinyu Journal, Financial Map)
3,148.4 3,180.4 3,177.6 3,346.2 3,510.4
11,427.1 10,823.7
11,201.4 11,019.6 11,351.8
0
5,000.0
10,000.0
(¥ billion) Deposits Loans
March 2012 March 2013 March 2014 March 2015 March 2016

表紙Ⅰ
8
II. Numerical Data and Metrics
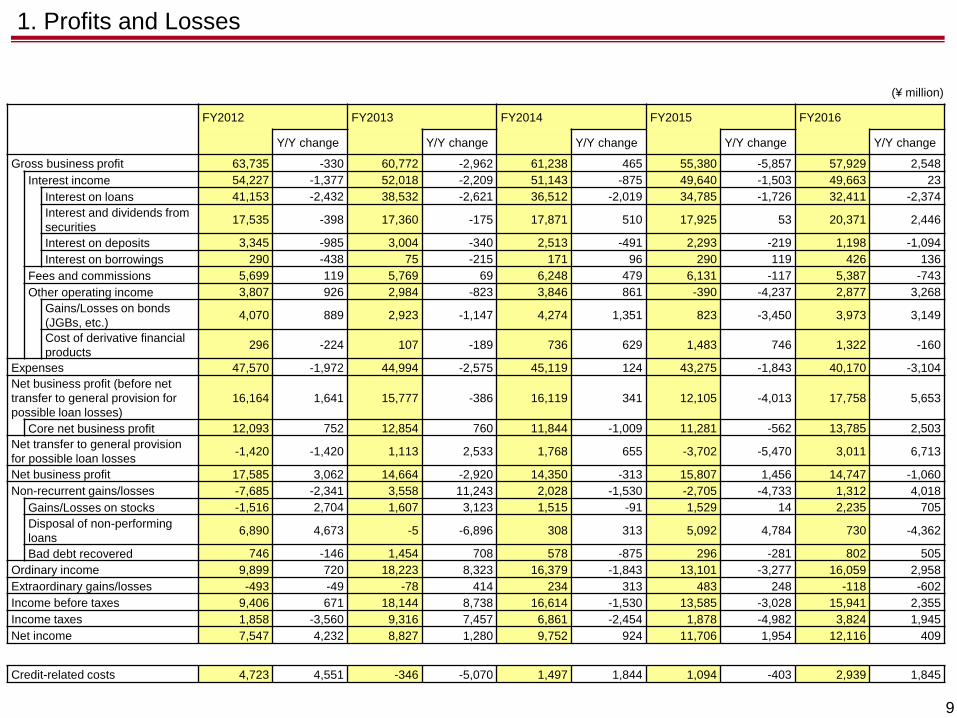
(¥ million)
FY2012 FY2013 FY2014 FY2015 FY2016
Y/Y change Y/Y change Y/Y change Y/Y change Y/Y change
Gross business profit 63,735 -330 60,772 -2,962 61,238 465 55,380 -5,857 57,929 2,548
Interest income 54,227 -1,377 52,018 -2,209 51,143 -875 49,640 -1,503 49,663 23
Interest on loans 41,153 -2,432 38,532 -2,621 36,512 -2,019 34,785 -1,726 32,411 -2,374
Interest and dividends from
securities 17,535 -398 17,360 -175 17,871 510 17,925 53 20,371 2,446
Interest on deposits 3,345 -985 3,004 -340 2,513 -491 2,293 -219 1,198 -1,094
Interest on borrowings 290 -438 75 -215 171 96 290 119 426 136
Fees and commissions 5,699 119 5,769 69 6,248 479 6,131 -117 5,387 -743
Other operating income 3,807 926 2,984 -823 3,846 861 -390 -4,237 2,877 3,268
Gains/Losses on bonds
(JGBs, etc.) 4,070 889 2,923 -1,147 4,274 1,351 823 -3,450 3,973 3,149
Cost of derivative financial
products 296 -224 107 -189 736 629 1,483 746 1,322 -160
Expenses 47,570 -1,972 44,994 -2,575 45,119 124 43,275 -1,843 40,170 -3,104
Net business profit (before net
transfer to general provision for
possible loan losses)
16,164 1,641 15,777 -386 16,119 341 12,105 -4,013 17,758 5,653
Core net business profit 12,093 752 12,854 760 11,844 -1,009 11,281 -562 13,785 2,503
Net transfer to general provision
for possible loan losses -1,420 -1,420 1,113 2,533 1,768 655 -3,702 -5,470 3,011 6,713
Net business profit 17,585 3,062 14,664 -2,920 14,350 -313 15,807 1,456 14,747 -1,060
Non-recurrent gains/losses -7,685 -2,341 3,558 11,243 2,028 -1,530 -2,705 -4,733 1,312 4,018
Gains/Losses on stocks -1,516 2,704 1,607 3,123 1,515 -91 1,529 14 2,235 705
Disposal of non-performing
loans 6,890 4,673 -5 -6,896 308 313 5,092 4,784 730 -4,362
Bad debt recovered 746 -146 1,454 708 578 -875 296 -281 802 505
Ordinary income 9,899 720 18,223 8,323 16,379 -1,843 13,101 -3,277 16,059 2,958
Extraordinary gains/losses -493 -49 -78 414 234 313 483 248 -118 -602
Income before taxes 9,406 671 18,144 8,738 16,614 -1,530 13,585 -3,028 15,941 2,355
Income taxes 1,858 -3,560 9,316 7,457 6,861 -2,454 1,878 -4,982 3,824 1,945
Net income 7,547 4,232 8,827 1,280 9,752 924 11,706 1,954 12,116 409
Credit-related costs 4,723 4,551 -346 -5,070 1,497 1,844 1,094 -403 2,939 1,845
1. Profits and Losses
9
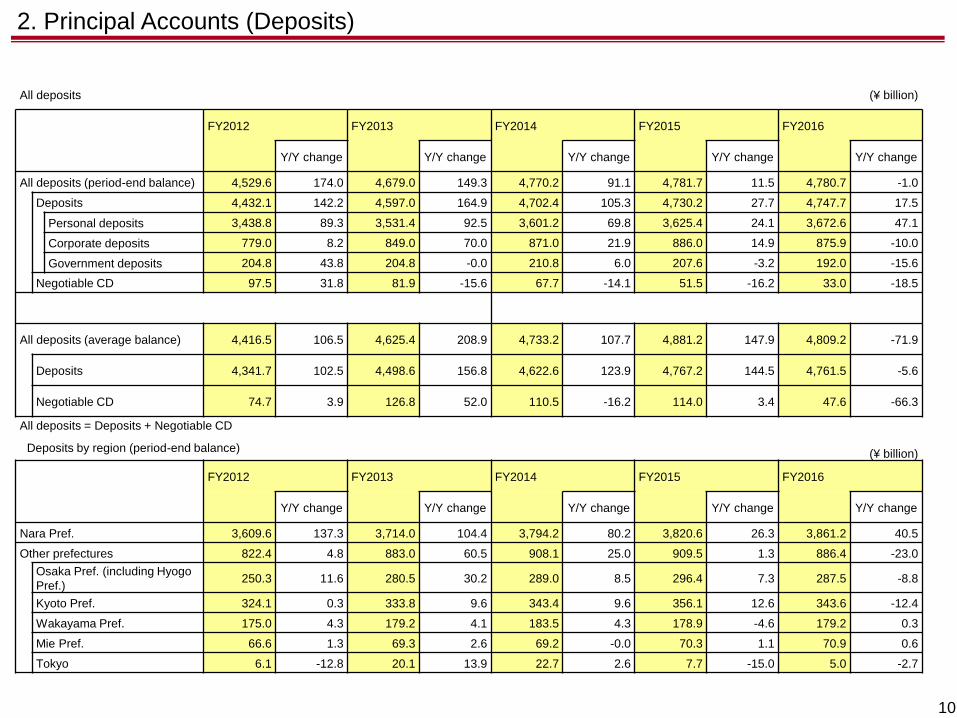
All deposits (¥ billion)
FY2012 FY2013 FY2014 FY2015 FY2016
Y/Y change Y/Y change Y/Y change Y/Y change Y/Y change
All deposits (period-end balance) 4,529.6 174.0 4,679.0 149.3 4,770.2 91.1 4,781.7 11.5 4,780.7 -1.0
Deposits 4,432.1 142.2 4,597.0 164.9 4,702.4 105.3 4,730.2 27.7 4,747.7 17.5
Personal deposits 3,438.8 89.3 3,531.4 92.5 3,601.2 69.8 3,625.4 24.1 3,672.6 47.1
Corporate deposits 779.0 8.2 849.0 70.0 871.0 21.9 886.0 14.9 875.9 -10.0
Government deposits 204.8 43.8 204.8 -0.0 210.8 6.0 207.6 -3.2 192.0 -15.6
Negotiable CD 97.5 31.8 81.9 -15.6 67.7 -14.1 51.5 -16.2 33.0 -18.5
All deposits (average balance) 4,416.5 106.5 4,625.4 208.9 4,733.2 107.7 4,881.2 147.9 4,809.2 -71.9
Deposits 4,341.7 102.5 4,498.6 156.8 4,622.6 123.9 4,767.2 144.5 4,761.5 -5.6
Negotiable CD 74.7 3.9 126.8 52.0 110.5 -16.2 114.0 3.4 47.6 -66.3
(¥ billion)
FY2012 FY2013 FY2014 FY2015 FY2016
Y/Y change Y/Y change Y/Y change Y/Y change Y/Y change
Nara Pref. 3,609.6 137.3 3,714.0 104.4 3,794.2 80.2 3,820.6 26.3 3,861.2 40.5
Other prefectures 822.4 4.8 883.0 60.5 908.1 25.0 909.5 1.3 886.4 -23.0
Osaka Pref. (including Hyogo
Pref.) 250.3 11.6 280.5 30.2 289.0 8.5 296.4 7.3 287.5 -8.8
Kyoto Pref. 324.1 0.3 333.8 9.6 343.4 9.6 356.1 12.6 343.6 -12.4
Wakayama Pref. 175.0 4.3 179.2 4.1 183.5 4.3 178.9 -4.6 179.2 0.3
Mie Pref. 66.6 1.3 69.3 2.6 69.2 -0.0 70.3 1.1 70.9 0.6
Tokyo 6.1 -12.8 20.1 13.9 22.7 2.6 7.7 -15.0 5.0 -2.7
2. Principal Accounts (Deposits)
10
All deposits = Deposits + Negotiable CD
Deposits by region (period-end balance)
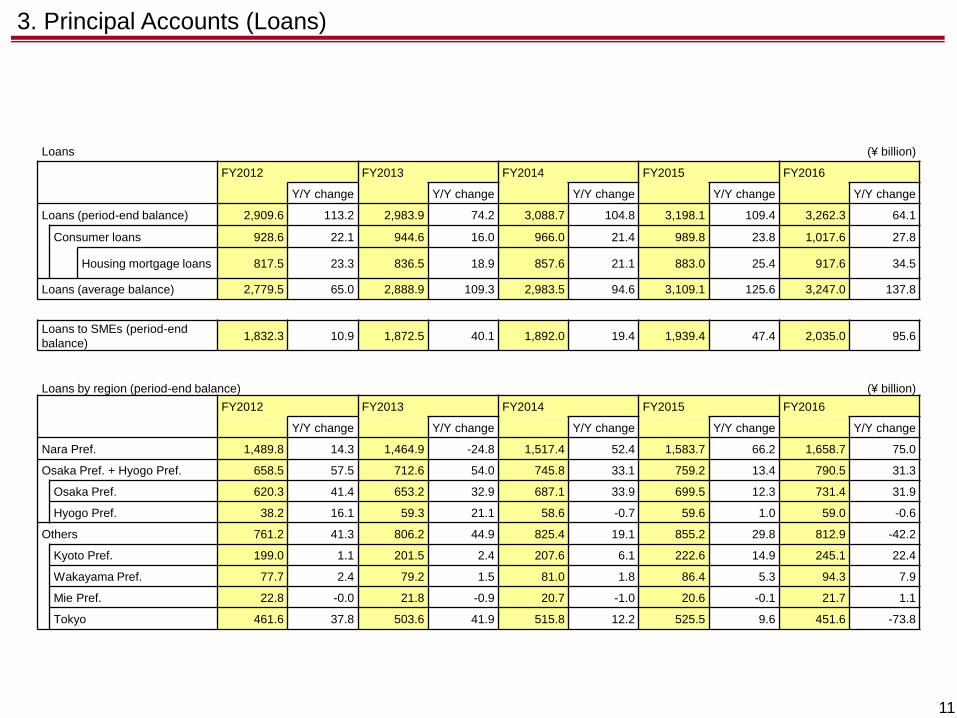
3. Principal Accounts (Loans)
11
Loans (¥ billion)
FY2012 FY2013 FY2014 FY2015 FY2016
Y/Y change Y/Y change Y/Y change Y/Y change Y/Y change
Loans (period-end balance) 2,909.6 113.2 2,983.9 74.2 3,088.7 104.8 3,198.1 109.4 3,262.3 64.1
Consumer loans 928.6 22.1 944.6 16.0 966.0 21.4 989.8 23.8 1,017.6 27.8
Housing mortgage loans 817.5 23.3 836.5 18.9 857.6 21.1 883.0 25.4 917.6 34.5
Loans (average balance) 2,779.5 65.0 2,888.9 109.3 2,983.5 94.6 3,109.1 125.6 3,247.0 137.8
Loans to SMEs (period-end
balance) 1,832.3 10.9 1,872.5 40.1 1,892.0 19.4 1,939.4 47.4 2,035.0 95.6
Loans by region (period-end balance) (¥ billion)
FY2012 FY2013 FY2014 FY2015 FY2016
Y/Y change Y/Y change Y/Y change Y/Y change Y/Y change
Nara Pref. 1,489.8 14.3 1,464.9 -24.8 1,517.4 52.4 1,583.7 66.2 1,658.7 75.0
Osaka Pref. + Hyogo Pref. 658.5 57.5 712.6 54.0 745.8 33.1 759.2 13.4 790.5 31.3
Osaka Pref. 620.3 41.4 653.2 32.9 687.1 33.9 699.5 12.3 731.4 31.9
Hyogo Pref. 38.2 16.1 59.3 21.1 58.6 -0.7 59.6 1.0 59.0 -0.6
Others 761.2 41.3 806.2 44.9 825.4 19.1 855.2 29.8 812.9 -42.2
Kyoto Pref. 199.0 1.1 201.5 2.4 207.6 6.1 222.6 14.9 245.1 22.4
Wakayama Pref. 77.7 2.4 79.2 1.5 81.0 1.8 86.4 5.3 94.3 7.9
Mie Pref. 22.8 -0.0 21.8 -0.9 20.7 -1.0 20.6 -0.1 21.7 1.1
Tokyo 461.6 37.8 503.6 41.9 515.8 12.2 525.5 9.6 451.6 -73.8
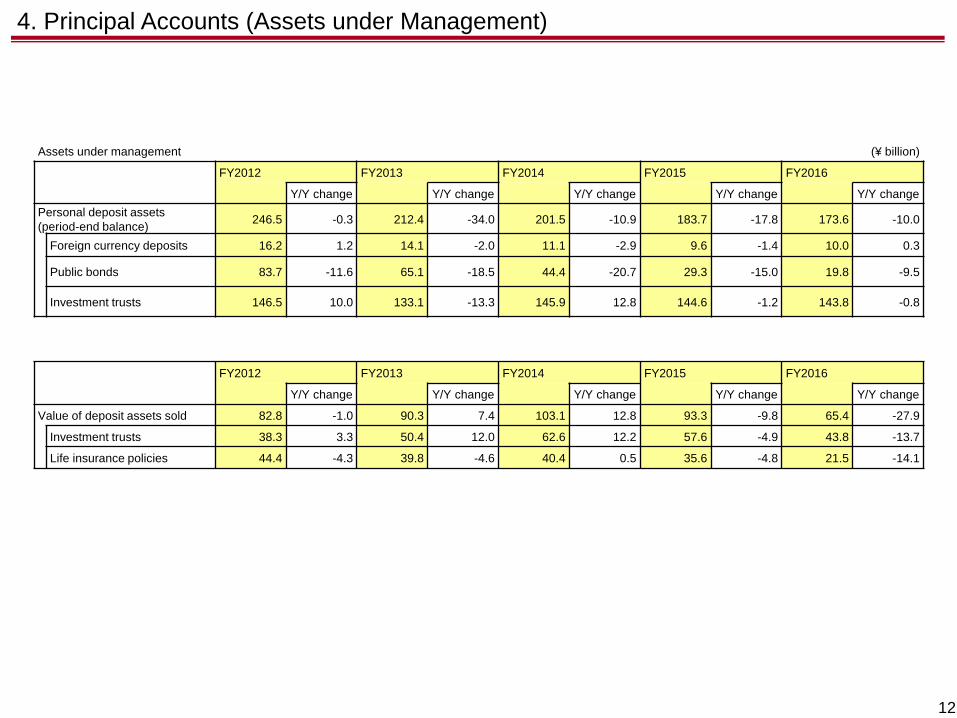
4. Principal Accounts (Assets under Management)
12
Assets under management (¥ billion)
FY2012 FY2013 FY2014 FY2015 FY2016
Y/Y change Y/Y change Y/Y change Y/Y change Y/Y change
Personal deposit assets
(period-end balance) 246.5 -0.3 212.4 -34.0 201.5 -10.9 183.7 -17.8 173.6 -10.0
Foreign currency deposits 16.2 1.2 14.1 -2.0 11.1 -2.9 9.6 -1.4 10.0 0.3
Public bonds 83.7 -11.6 65.1 -18.5 44.4 -20.7 29.3 -15.0 19.8 -9.5
Investment trusts 146.5 10.0 133.1 -13.3 145.9 12.8 144.6 -1.2 143.8 -0.8
FY2012 FY2013 FY2014 FY2015 FY2016
Y/Y change Y/Y change Y/Y change Y/Y change Y/Y change
Value of deposit assets sold 82.8 -1.0 90.3 7.4 103.1 12.8 93.3 -9.8 65.4 -27.9
Investment trusts 38.3 3.3 50.4 12.0 62.6 12.2 57.6 -4.9 43.8 -13.7
Life insurance policies 44.4 -4.3 39.8 -4.6 40.4 0.5 35.6 -4.8 21.5 -14.1
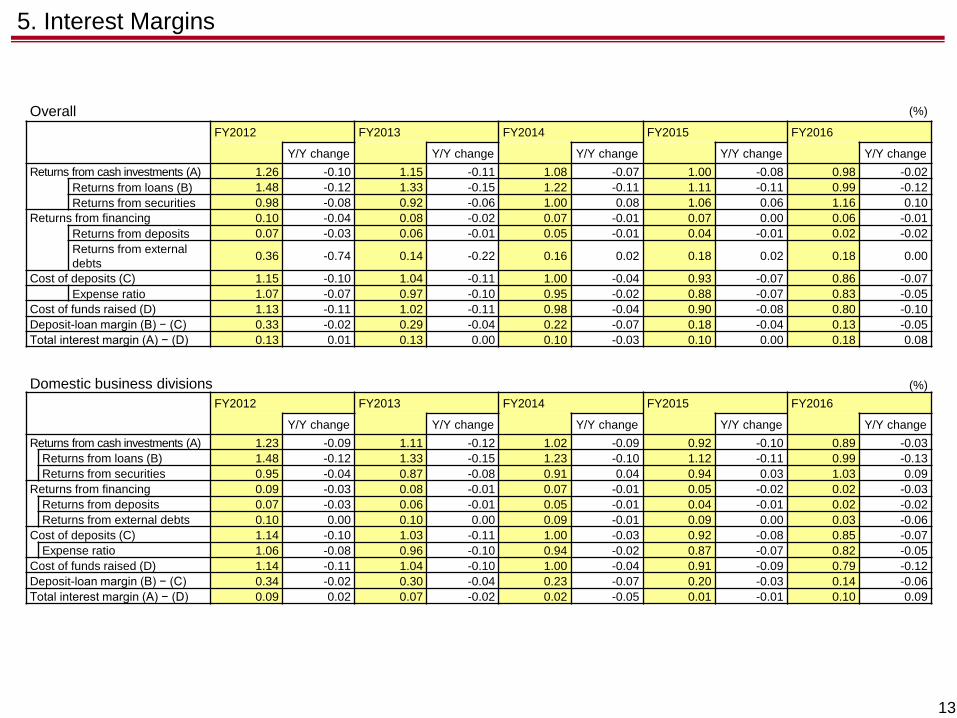
5. Interest Margins
13
Overall (%)
FY2012 FY2013 FY2014 FY2015 FY2016
Y/Y change Y/Y change Y/Y change Y/Y change Y/Y change
Returns from cash investments (A) 1.26 -0.10 1.15 -0.11 1.08 -0.07 1.00 -0.08 0.98 -0.02
Returns from loans (B) 1.48 -0.12 1.33 -0.15 1.22 -0.11 1.11 -0.11 0.99 -0.12
Returns from securities 0.98 -0.08 0.92 -0.06 1.00 0.08 1.06 0.06 1.16 0.10
Returns from financing 0.10 -0.04 0.08 -0.02 0.07 -0.01 0.07 0.00 0.06 -0.01
Returns from deposits 0.07 -0.03 0.06 -0.01 0.05 -0.01 0.04 -0.01 0.02 -0.02
Returns from external
debts 0.36 -0.74 0.14 -0.22 0.16 0.02 0.18 0.02 0.18 0.00
Cost of deposits (C) 1.15 -0.10 1.04 -0.11 1.00 -0.04 0.93 -0.07 0.86 -0.07
Expense ratio 1.07 -0.07 0.97 -0.10 0.95 -0.02 0.88 -0.07 0.83 -0.05
Cost of funds raised (D) 1.13 -0.11 1.02 -0.11 0.98 -0.04 0.90 -0.08 0.80 -0.10
Deposit-loan margin (B) − (C) 0.33 -0.02 0.29 -0.04 0.22 -0.07 0.18 -0.04 0.13 -0.05
Total interest margin (A) − (D) 0.13 0.01 0.13 0.00 0.10 -0.03 0.10 0.00 0.18 0.08
Domestic business divisions (%)
FY2012 FY2013 FY2014 FY2015 FY2016
Y/Y change Y/Y change Y/Y change Y/Y change Y/Y change
Returns from cash investments (A) 1.23 -0.09 1.11 -0.12 1.02 -0.09 0.92 -0.10 0.89 -0.03
Returns from loans (B) 1.48 -0.12 1.33 -0.15 1.23 -0.10 1.12 -0.11 0.99 -0.13
Returns from securities 0.95 -0.04 0.87 -0.08 0.91 0.04 0.94 0.03 1.03 0.09
Returns from financing 0.09 -0.03 0.08 -0.01 0.07 -0.01 0.05 -0.02 0.02 -0.03
Returns from deposits 0.07 -0.03 0.06 -0.01 0.05 -0.01 0.04 -0.01 0.02 -0.02
Returns from external debts 0.10 0.00 0.10 0.00 0.09 -0.01 0.09 0.00 0.03 -0.06
Cost of deposits (C) 1.14 -0.10 1.03 -0.11 1.00 -0.03 0.92 -0.08 0.85 -0.07
Expense ratio 1.06 -0.08 0.96 -0.10 0.94 -0.02 0.87 -0.07 0.82 -0.05
Cost of funds raised (D) 1.14 -0.11 1.04 -0.10 1.00 -0.04 0.91 -0.09 0.79 -0.12
Deposit-loan margin (B) − (C) 0.34 -0.02 0.30 -0.04 0.23 -0.07 0.20 -0.03 0.14 -0.06
Total interest margin (A) − (D) 0.09 0.02 0.07 -0.02 0.02 -0.05 0.01 -0.01 0.10 0.09
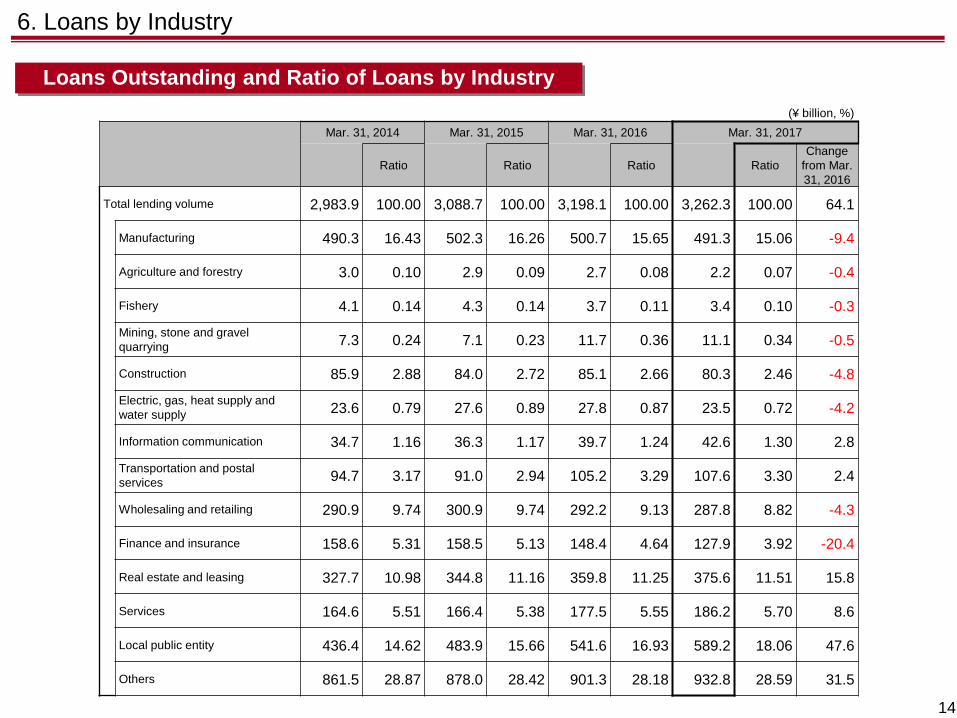
(¥ billion, %)
Mar. 31, 2014 Mar. 31, 2015 Mar. 31, 2016 Mar. 31, 2017
Ratio Ratio Ratio Ratio
Change
from Mar.
31, 2016
Total lending volume 2,983.9 100.00 3,088.7 100.00 3,198.1 100.00 3,262.3 100.00 64.1
Manufacturing 490.3 16.43 502.3 16.26 500.7 15.65 491.3 15.06 -9.4
Agriculture and forestry 3.0 0.10 2.9 0.09 2.7 0.08 2.2 0.07 -0.4
Fishery 4.1 0.14 4.3 0.14 3.7 0.11 3.4 0.10 -0.3
Mining, stone and gravel
quarrying 7.3 0.24 7.1 0.23 11.7 0.36 11.1 0.34 -0.5
Construction 85.9 2.88 84.0 2.72 85.1 2.66 80.3 2.46 -4.8
Electric, gas, heat supply and
water supply 23.6 0.79 27.6 0.89 27.8 0.87 23.5 0.72 -4.2
Information communication 34.7 1.16 36.3 1.17 39.7 1.24 42.6 1.30 2.8
Transportation and postal
services 94.7 3.17 91.0 2.94 105.2 3.29 107.6 3.30 2.4
Wholesaling and retailing 290.9 9.74 300.9 9.74 292.2 9.13 287.8 8.82 -4.3
Finance and insurance 158.6 5.31 158.5 5.13 148.4 4.64 127.9 3.92 -20.4
Real estate and leasing 327.7 10.98 344.8 11.16 359.8 11.25 375.6 11.51 15.8
Services 164.6 5.51 166.4 5.38 177.5 5.55 186.2 5.70 8.6
Local public entity 436.4 14.62 483.9 15.66 541.6 16.93 589.2 18.06 47.6
Others 861.5 28.87 878.0 28.42 901.3 28.18 932.8 28.59 31.5
6. Loans by Industry
Loans Outstanding and Ratio of Loans by Industry
14
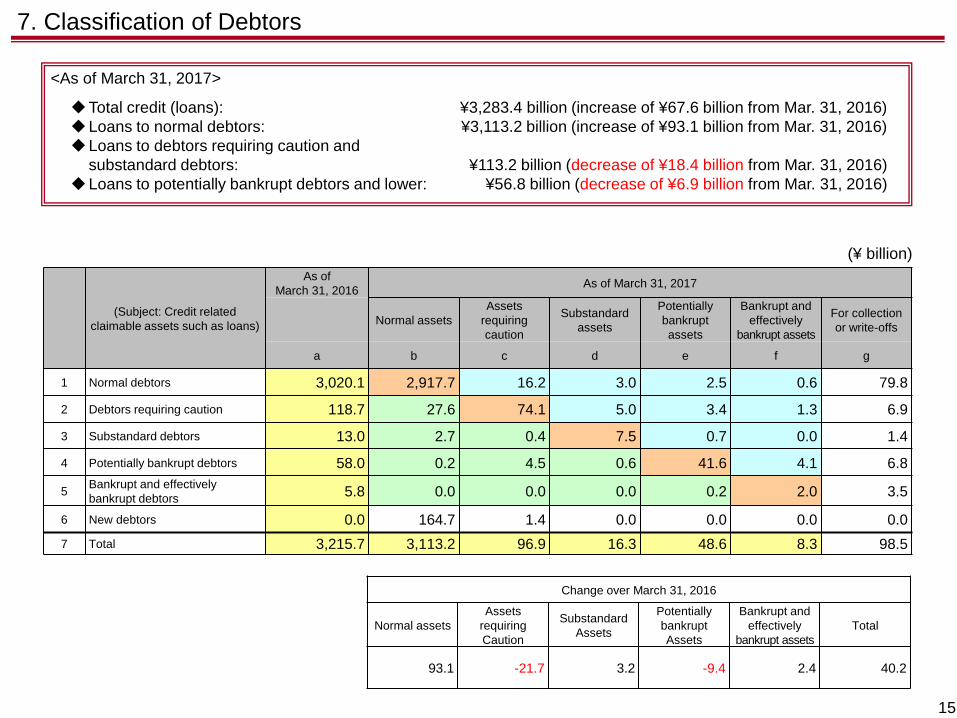
(Subject: Credit related
claimable assets such as loans)
As of
March 31, 2016 As of March 31, 2017
Normal assets
Assets
requiring
caution
Substandard
assets
Potentially
bankrupt
assets
Bankrupt and
effectively
bankrupt assets
For collection
or write-offs
a b c d e f g
1 Normal debtors 3,020.1 2,917.7 16.2 3.0 2.5 0.6 79.8
2 Debtors requiring caution 118.7 27.6 74.1 5.0 3.4 1.3 6.9
3 Substandard debtors 13.0 2.7 0.4 7.5 0.7 0.0 1.4
4 Potentially bankrupt debtors 58.0 0.2 4.5 0.6 41.6 4.1 6.8
5 Bankrupt and effectively
bankrupt debtors 5.8 0.0 0.0 0.0 0.2 2.0 3.5
6 New debtors 0.0 164.7 1.4 0.0 0.0 0.0 0.0
7 Total 3,215.7 3,113.2 96.9 16.3 48.6 8.3 98.5
(¥ billion)
7. Classification of Debtors
15
<As of March 31, 2017>
Total credit (loans): ¥3,283.4 billion (increase of ¥67.6 billion from Mar. 31, 2016)
Loans to normal debtors: ¥3,113.2 billion (increase of ¥93.1 billion from Mar. 31, 2016)
Loans to debtors requiring caution and
substandard debtors: ¥113.2 billion (decrease of ¥18.4 billion from Mar. 31, 2016)
Loans to potentially bankrupt debtors and lower: ¥56.8 billion (decrease of ¥6.9 billion from Mar. 31, 2016)
Change over March 31, 2016
Normal assets
Assets
requiring
Caution
Substandard
Assets
Potentially
bankrupt
Assets
Bankrupt and
effectively
bankrupt assets
Total
93.1 -21.7 3.2 -9.4 2.4 40.2
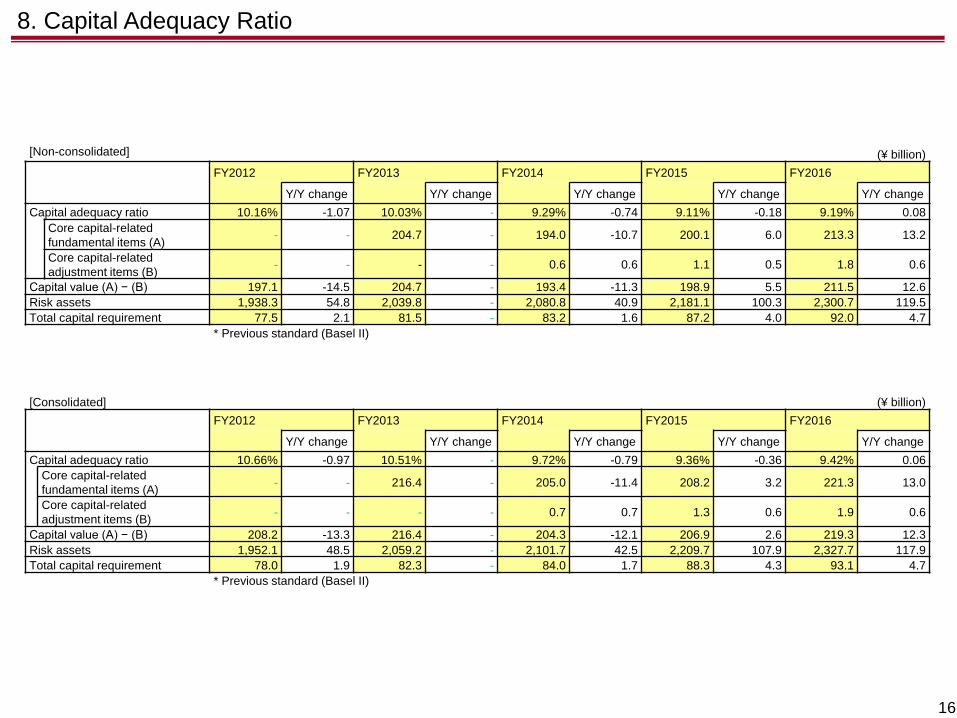
8. Capital Adequacy Ratio
16
[Non-consolidated] (¥ billion)
FY2012 FY2013 FY2014 FY2015 FY2016
Y/Y change Y/Y change Y/Y change Y/Y change Y/Y change
Capital adequacy ratio 10.16% -1.07 10.03% - 9.29% -0.74 9.11% -0.18 9.19% 0.08
Core capital-related
fundamental items (A) - - 204.7 - 194.0 -10.7 200.1 6.0 213.3 13.2
Core capital-related
adjustment items (B) - - - - 0.6 0.6 1.1 0.5 1.8 0.6
Capital value (A) − (B) 197.1 -14.5 204.7 - 193.4 -11.3 198.9 5.5 211.5 12.6
Risk assets 1,938.3 54.8 2,039.8 - 2,080.8 40.9 2,181.1 100.3 2,300.7 119.5
Total capital requirement 77.5 2.1 81.5 - 83.2 1.6 87.2 4.0 92.0 4.7
* Previous standard (Basel II)
[Consolidated] (¥ billion)
FY2012 FY2013 FY2014 FY2015 FY2016
Y/Y change Y/Y change Y/Y change Y/Y change Y/Y change
Capital adequacy ratio 10.66% -0.97 10.51% - 9.72% -0.79 9.36% -0.36 9.42% 0.06
Core capital-related
fundamental items (A) - - 216.4 - 205.0 -11.4 208.2 3.2 221.3 13.0
Core capital-related
adjustment items (B) - - - - 0.7 0.7 1.3 0.6 1.9 0.6
Capital value (A) − (B) 208.2 -13.3 216.4 - 204.3 -12.1 206.9 2.6 219.3 12.3
Risk assets 1,952.1 48.5 2,059.2 - 2,101.7 42.5 2,209.7 107.9 2,327.7 117.9
Total capital requirement 78.0 1.9 82.3 - 84.0 1.7 88.3 4.3 93.1 4.7
* Previous standard (Basel II)
255.0
91.9
31.2
47.5
18.1
28.2
24.5
8.5
7.7
0
250.0
(¥ billion)
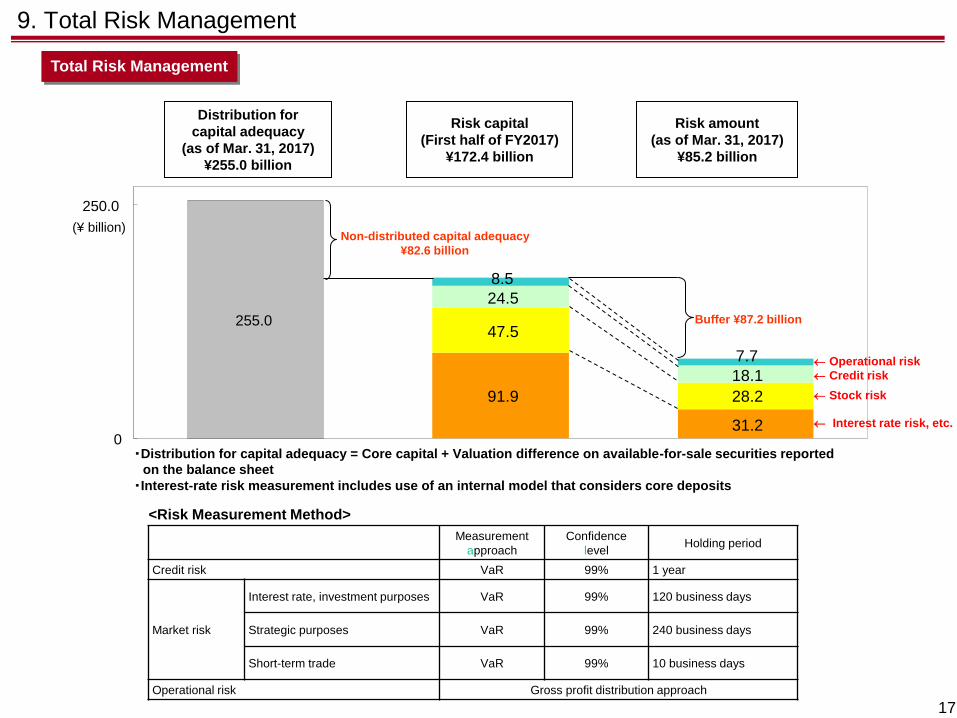
9. Total Risk Management
17
Total Risk Management
Distribution for
capital adequacy
(as of Mar. 31, 2017)
¥255.0 billion
Risk capital
(First half of FY2017)
¥172.4 billion
Risk amount
(as of Mar. 31, 2017)
¥85.2 billion
Buffer ¥87.2 billion
Non-distributed capital adequacy
¥82.6 billion
<Risk Measurement Method>
・Distribution for capital adequacy = Core capital + Valuation difference on available-for-sale securities reported
on the balance sheet
・Interest-rate risk measurement includes use of an internal model that considers core deposits
Measurement
approach
Confidence
level Holding period
Credit risk VaR 99% 1 year
Market risk
Interest rate, investment purposes VaR 99% 120 business days
Strategic purposes VaR 99% 240 business days
Short-term trade VaR 99% 10 business days
Operational risk Gross profit distribution approach
Operational risk
Credit risk
Stock risk
Interest rate risk, etc.
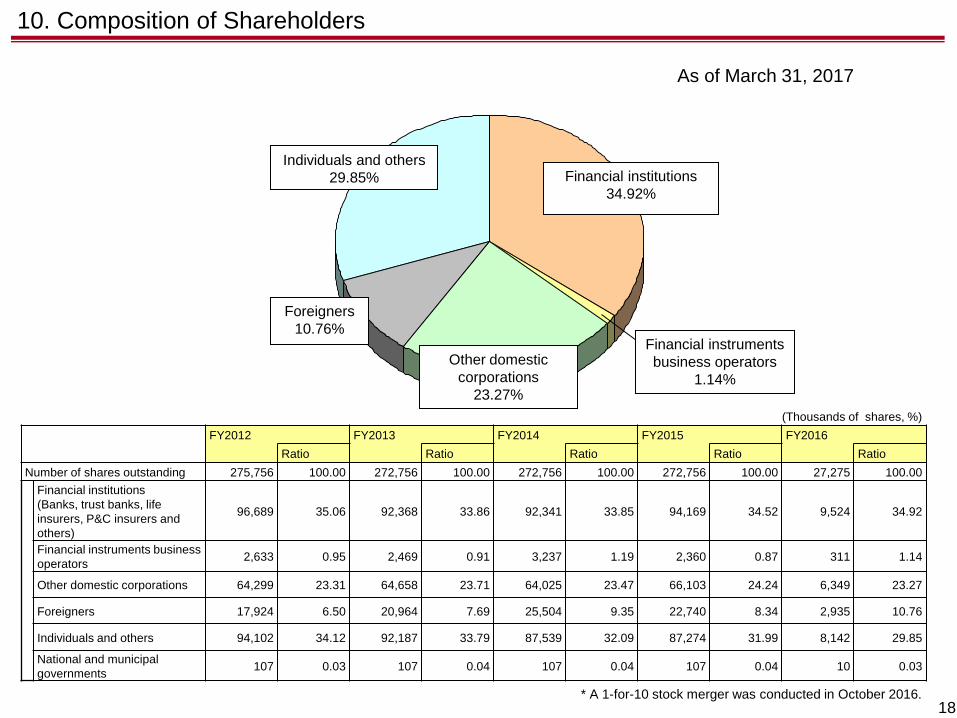
10. Composition of Shareholders
18
As of March 31, 2017
Financial institutions
34.92%
Foreigners
10.76%
Individuals and others
29.85%
Other domestic
corporations
23.27%
Financial instruments
business operators
1.14%
* A 1-for-10 stock merger was conducted in October 2016.
(Thousands of shares, %)
FY2012 FY2013 FY2014 FY2015 FY2016
Ratio Ratio Ratio Ratio Ratio
Number of shares outstanding 275,756 100.00 272,756 100.00 272,756 100.00 272,756 100.00 27,275 100.00
Financial institutions
(Banks, trust banks, life
insurers, P&C insurers and
others)
96,689 35.06 92,368 33.86 92,341 33.85 94,169 34.52 9,524 34.92
Financial instruments business
operators 2,633 0.95 2,469 0.91 3,237 1.19 2,360 0.87 311 1.14
Other domestic corporations 64,299 23.31 64,658 23.71 64,025 23.47 66,103 24.24 6,349 23.27
Foreigners 17,924 6.50 20,964 7.69 25,504 9.35 22,740 8.34 2,935 10.76
Individuals and others 94,102 34.12 92,187 33.79 87,539 32.09 87,274 31.99 8,142 29.85
National and municipal
governments 107 0.03 107 0.04 107 0.04 107 0.04 10 0.03
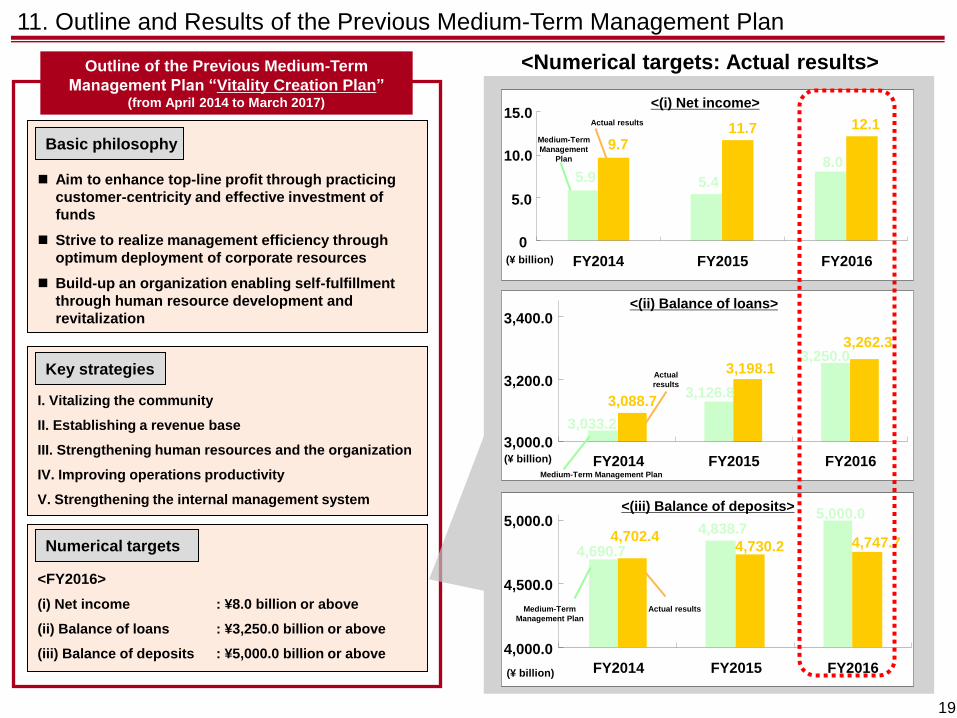
11. Outline and Results of the Previous Medium-Term Management Plan
Aim to enhance top-line profit through practicing
customer-centricity and effective investment of
funds
Strive to realize management efficiency through
optimum deployment of corporate resources
Build-up an organization enabling self-fulfillment
through human resource development and
revitalization
Basic philosophy
<FY2016>
(i) Net income : ¥8.0 billion or above
(ii) Balance of loans : ¥3,250.0 billion or above
(iii) Balance of deposits : ¥5,000.0 billion or above
I. Vitalizing the community
II. Establishing a revenue base
III. Strengthening human resources and the organization
IV. Improving operations productivity
V. Strengthening the internal management system
Key strategies
Numerical targets
Outline of the Previous Medium-Term
Management Plan “Vitality Creation Plan” (from April 2014 to March 2017)
5.9 5.4
8.0
12.1 11.7 9.7
0
5.0
10.0
15.0
FY2014 FY2015 FY2016
3,126.8
3,033.2
3,250.0
3,088.7
3,198.1
3,262.3
3,000.0
3,200.0
3,400.0
FY2014 FY2015 FY2016
5,000.0 4,838.7
4,690.7 4,702.4
4,730.2 4,747.7
4,000.0
4,500.0
5,000.0
FY2014 FY2015 FY2016
<Numerical targets: Actual results>
<(i) Net income>
<(ii) Balance of loans>
Medium-Term
Management
Plan
Actual results
Medium-Term Management Plan
Actual
results
<(iii) Balance of deposits>
Actual results Medium-Term
Management Plan
(¥ billion)
19
(¥ billion)
(¥ billion)
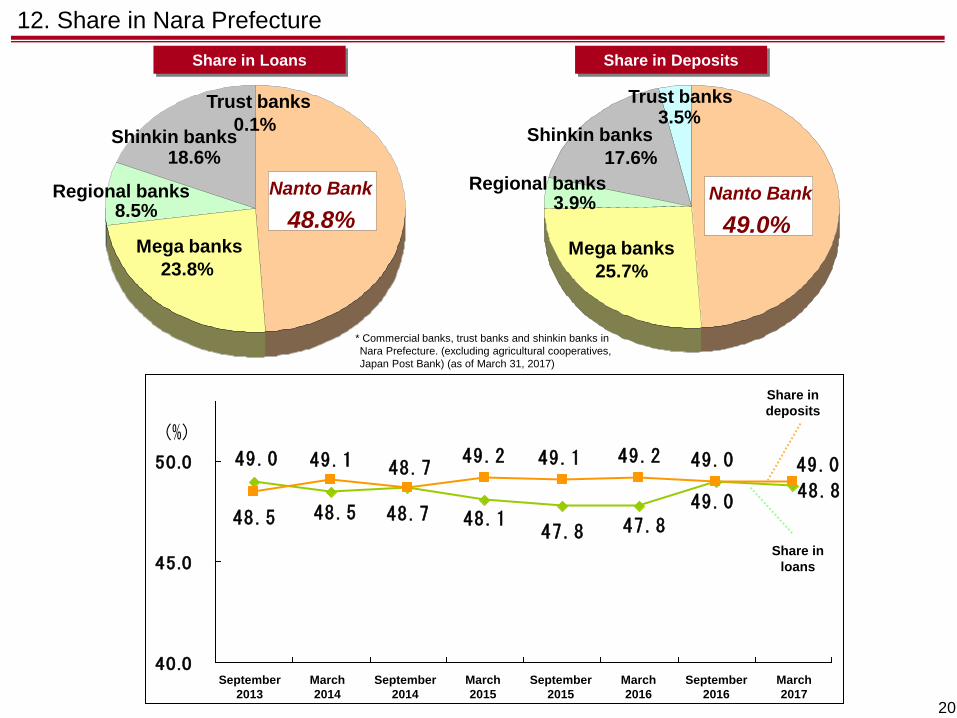
12. Share in Nara Prefecture
20
48.848.7
47.8 47.8
49.048.5
49.0
48.1
49.049.2
48.5
49.1 48.749.1 49.2 49.0
40.0
45.0
50.0
25/9 26/3 26/9 27/3 27/9 28/3 28/9 29/3
(%)
Share in Loans Share in Deposits
* Commercial banks, trust banks and shinkin banks in
Nara Prefecture. (excluding agricultural cooperatives,
Japan Post Bank) (as of March 31, 2017)
Share in
loans
Share in
deposits
September
2013
March
2014
September
2014
March
2015
September
2015
March
2016
September
2016
March
2017
Nanto Bank
49.0% Mega banks
25.7%
Shinkin banks
17.6%
Regional banks 3.9%
Trust banks 3.5%
Nanto Bank
48.8% Mega banks
23.8%
Shinkin banks 18.6%
Regional banks 8.5%
Trust banks
0.1%
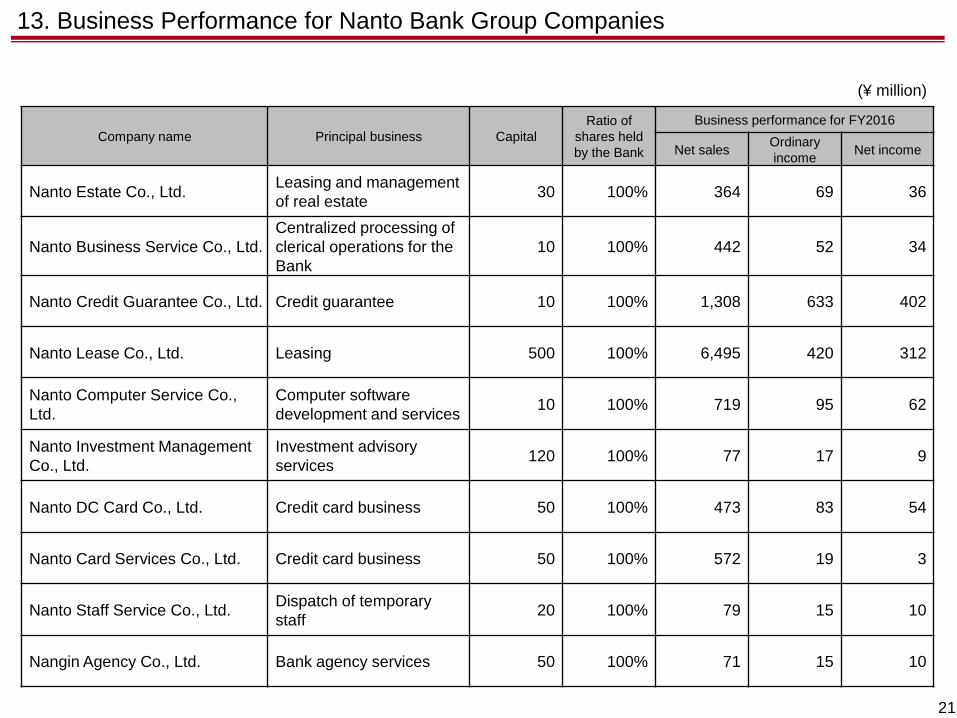
Company name Principal business Capital
Ratio of
shares held
by the Bank
Business performance for FY2016
Net sales Ordinary
income Net income
Nanto Estate Co., Ltd. Leasing and management
of real estate 30 100% 364 69 36
Nanto Business Service Co., Ltd.
Centralized processing of
clerical operations for the
Bank
10 100% 442 52 34
Nanto Credit Guarantee Co., Ltd. Credit guarantee 10 100% 1,308 633 402
Nanto Lease Co., Ltd. Leasing 500 100% 6,495 420 312
Nanto Computer Service Co.,
Ltd.
Computer software
development and services 10 100% 719 95 62
Nanto Investment Management
Co., Ltd.
Investment advisory
services 120 100% 77 17 9
Nanto DC Card Co., Ltd. Credit card business 50 100% 473 83 54
Nanto Card Services Co., Ltd. Credit card business 50 100% 572 19 3
Nanto Staff Service Co., Ltd. Dispatch of temporary
staff 20 100% 79 15 10
Nangin Agency Co., Ltd. Bank agency services 50 100% 71 15 10
13. Business Performance for Nanto Bank Group Companies
21
(¥ million)
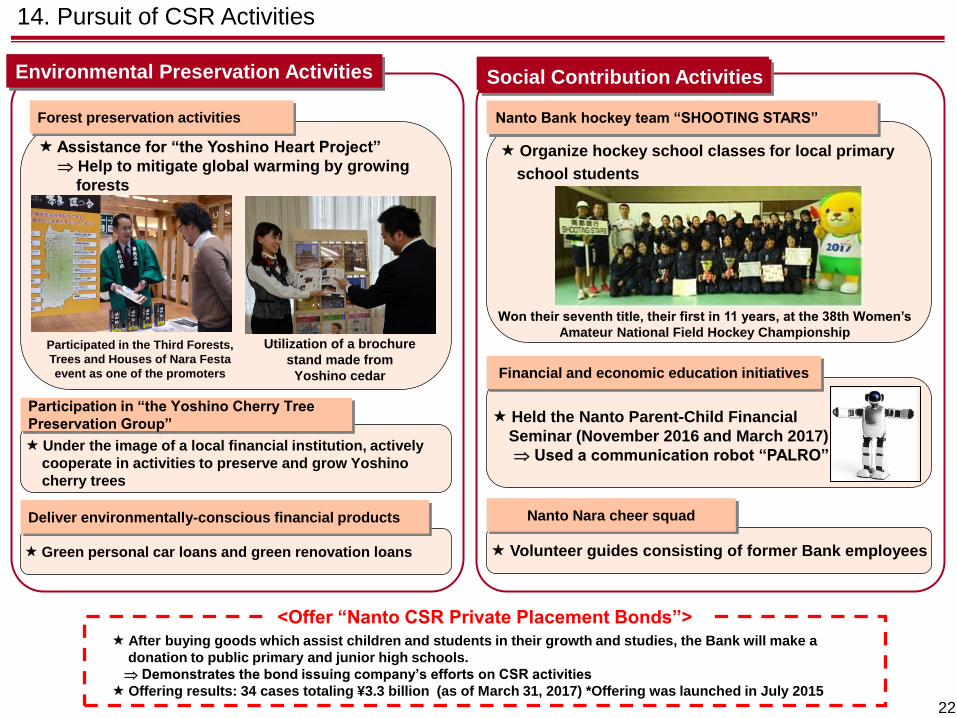
Volunteer guides consisting of former Bank employees Green personal car loans and green renovation loans
Assistance for “the Yoshino Heart Project”
Help to mitigate global warming by growing
forests
Forest preservation activities
Participated in the Third Forests,
Trees and Houses of Nara Festa
event as one of the promoters
Utilization of a brochure
stand made from
Yoshino cedar
Under the image of a local financial institution, actively
cooperate in activities to preserve and grow Yoshino
cherry trees
Held the Nanto Parent-Child Financial
Seminar (November 2016 and March 2017)
Used a communication robot “PALRO”
Organize hockey school classes for local primary
school students
Nanto Bank hockey team “SHOOTING STARS”
Financial and economic education initiatives
Won their seventh title, their first in 11 years, at the 38th Women’s
Amateur National Field Hockey Championship
Participation in “the Yoshino Cherry Tree
Preservation Group”
Deliver environmentally-conscious financial products
<Offer “Nanto CSR Private Placement Bonds”>
After buying goods which assist children and students in their growth and studies, the Bank will make a
donation to public primary and junior high schools.
Demonstrates the bond issuing company’s efforts on CSR activities
Offering results: 34 cases totaling ¥3.3 billion (as of March 31, 2017) *Offering was launched in July 2015
14. Pursuit of CSR Activities
Nanto Nara cheer squad
Environmental Preservation Activities Social Contribution Activities Social Contribution Activities
22
In this material, we refer to the future performance of the bank.
However, please be aware that these contents do not guarantee our future
performance and it may change due to the unexpected risks and uncertainties in
the operating environment.
[Contact, if any:]
The NANTO BANK, LTD. Corporate Planning Division
TEL: 0742-27-1552
FAX: 0742-20-3614
E-mail: [email protected]
URL: http://www.nantobank.co.jp/
Nanto Bank is a supporter of the Yoshino Heart Project and the Kizukai Drive.