Embed Size (px)
Citation preview

The MUSiC Performance Measurement Method
Miles Macleod, Rosemary Bowden and Nigel Bevan
National Physical Laboratory
Introduction and objectives
"Building usability into a system requires more than knowledge of whatis good. It requires more than an empirical method for discoveringproblems and solutions. It requires more than support from uppermanagement and an openness on the part of developers. It evenrequires more than money and time. Building usability into a productrequires an explicit engineering process. That engineering process isnot logically different than any other engineering process. It involvesempirical definition, specification of levels to be achieved, appropriatemethods, early delivery of a functional system, and the willingness tochange that system. Together these principles convert usability from a'last minute add on' to an integral part of product development. Onlywhen usability engineering is as much part of software development asscheduling can we expect to regularly produce products in whichusability is more than an advertising claim."
Dennis Wixon and John Whiteside (1985)
The list of ingredients for developing usable systems set out by Wixon andWhiteside in 1985 is as valid now as it was then. It complements therecommendations of Gould and Lewis (1983) for an early focus on users,interactive design, empirical user-based testing and iterative design. As Gouldand Lewis (1983) observed, "'Reviewing' or 'demonstrating' a prototype systemto typical users and getting their reactions to it can result in misleadingconclusions. What is required is a usability test, not a selling job. Users shouldbe given simple tasks to carry out, and their performance, thoughts and attituderecorded". Yet Gould and Lewis found a striking mismatch between theprinciples they advocated and the expressed views of designers about their ownpractices. What may be disconcerting for the human factors, usability and HCIcommunities (and for users of interactive systems) is that the findings of Gouldand Lewis about what designers think and the practice of commercial systemdevelopment are echoed in the more recent findings of Dillon et al. (1993). Notonly is insufficient being done about usability, but many developers appear stillto have a limited knowledge of what can be done. While there may be anincreased level of awareness of the need to develop systems with good usability,

Miles Macleod , NPL Draft 0..8 August 25, 1998 2
developers too often appear unaware of how to go about it, and – justifiably –may have doubts about the practicality of many of the methods developed byHCI academics (Bellotti, 1988).
One vital ingredient for making usability engineering practicable is not includedin Wixon and Whiteside's list: tools to enable methods to be used efficiently andcost-effectively. Without tools, many HCI methods are simply impractical in thetimescale of commercial system development. Tools are principally a means offacilitating the correct application of user-centred methods. They can also focusthe thoughts of developers and client organisations on user issues and usability.
However, it is essential to recognise that the ownership and use of tools is not allthat is required. Dieli, Dye, McClintock and Simpson (1994) warn of thedangers of the object – in Microsoft's case the usability lab – being seen as thething, rather than the usability process which it helps support. In our ownexperience this is a very real danger. High-tech usability laboratories and thetools they contain are frequently seen by managers as the necessary focus ofusability work, but there is a risk that they may be seen as sufficient inthemselves. The "Usability 'r' Us" phenomenon – where project managers buysuperficially impressive usability tools in the belief that mere possession of theobjects will improve the quality of use of the systems they develop or procure –is a trap we seek to avoid.
Design for usability first requires knowledge and awareness of users, their goalsand their work environments, and methods for harnessing that knowledge in theproduction of useful and usable artefacts. Tools such as usability laboratoriesand evaluation software (e.g. DRUM – the Diagnostic Recorder for UsabilityMeasurement – Macleod and Rengger, 1993) can provide invaluable support anddraw the attention of managers and clients to usability issues. However, weemphasise at all times that they are secondary to the methods for usabilityengineering which they support.
The MUSiC approach
The principal aim in developing and evolving the Performance MeasurementMethod has been to provide a practical means of achieving the quantitative andqualitative data required to support usability engineering. That is, thedevelopment or tailoring of interactive systems – in fixed timescales and at anagreed cost – which meet specified criteria for usability or quality of use. Weemphasise that the aim has not been to provide a method for research or for'experiments' conducted with the luxuries of relatively open-ended timescales, orwith the possibility of arriving at the conclusion that 'further research isrequired'. Readers may find it helpful to refer to the eloquent statement ofdifferences between engineering and research, provided by Whiteside et al.(1988) drawing on the work of Winograd and Flores (1986).
Miles Macleod , NPL Draft 0..8 August 25, 1998 3
So far in this chapter, we have considered performance and usability withoutexplicitly relating the two. It will be clear from other chapters in this book (e.g.on usability standards) that usability can be viewed as quality of use. It can bedefined operationally in terms of the effectiveness, efficiency and satisfactionwith which specified users can perform specified work tasks in givenenvironments (see, for example, ISO 9241-11, ISO 1994). Effectiveness andefficiency are measures of performance in the given context of use. This maynot be an intuitively obvious definition to those who view usability in terms ofthe apparent attributes or features of software. What is not in doubt is thatperformance of systems in context (i.e. in the hands of their users) is a primaryconcern for users, organisations and producers. While some features of softwarewill significantly influence its usability, our concern in this chapter is with thedetectable effects of those features on quality of use, and how that can bemeasured. Since software features are not equal in terms of their effects onquality of use, and interact with each other in complex ways, merely countingsoftware features is highly unlikely to deliver measures which are usefulindicators of usability. This of course is not to deny the value of moresophisticated analytic approaches to usability assessment.
Another question frequently raised concerns the relative merits of assessing howusers get on with a product (performance), or assessing what they think of it(satisfaction). There is convincing evidence from a number of evaluations thatperformance and user satisfaction are not necessarily correlated. A system canbe satisfying but not very efficient to use, or vice versa. Hence to gain a roundedpicture there is great advantage in evaluating both. The MUSiC PerformanceMeasurement Method tells you about the first of these fundamental componentsof usability, giving measures of indicators of operational usability, together withdiagnostic data.
In judging what constitutes the 'state of the art' in usability evaluation,practicality and suitability for purpose must be key criteria. The MUSiCPerformance Measurement Method has been evolved and refined to meet thedemands of commercial application. It follows the basic principles of usabilityengineering and testing, which are well established in theory but too often absentin practice. It is supported by a range of tools which can be chosen and usedaccording to specific development needs, budget and timescales. The methoddraws on Usability Context Analysis (described elsewhere in this book). Othersupporting tools include the Performance Measurement Handbook (Rengger et al1993), and DRUM software which facilitates management of evaluation data,task analysis, video protocol analysis and derivation of measures. The approachis backed by training and accreditation in the proper application of the methodand the tools to support it. Where appropriate, it is also backed by consultancyon how to integrate method and tools into system development and evaluation,and by help in establishing a quality system for usability engineering.
The basic outputs, derived in all versions of the method, are measures of:
• Effectiveness - how correctly and completely goals are achieved in context

Miles Macleod , NPL Draft 0..8 August 25, 1998 4
• Efficiency - effectiveness related to cost of performance (calculated aseffectiveness per unit of time)
Optional outputs of the full, video supported method include further measuresand diagnostic data:
• Relative User Efficiency - an indicator of learnability (relating the efficiencyof specific users to that of experts)
• Productive Period - the proportion of time spent not having problems• Snag, Search and Help times - time spent overcoming problems, searching
unproductively through a system, and seeking help. These problem-relatedmeasures are valuable sources of diagnostic data about specific areas wheredesigns fail to support adequate performance. In use, the method providespointers to causes of problems.
The quantitative data enable comparison of user-based performance – at aprototype stage, or in acceptance testing – against performance with earlierversions of a system, with alternative designs, with competing products, or withother ways of achieving the same work goals. The diagnostic information helpsin identifying just where improvements need to be made in further developing aprototype or future versions of a system. It also helps inform about the level andspecific content of training required for particular classes of user.
The basic outputs (measures of effectiveness and efficiency) can be arrived atwithout use of video by following the minimal version of the method, the BasicMUSiC Performance Measurement Method. This relies on accurate observationin real time, and employs manual timing of task performance, together withassessment of task outputs. It takes less effort than the full method, but givesreduced diagnostic data. The Basic method may be employed in quick, smallscale evaluations, or where the budget is very constrained. It has thedisadvantages of failing to capture an accurate, reviewable record of the specificincidents which reveal where users encounter problems.
The full, video supported version of the method can be tailored to individualevaluation needs, for example by choosing not to analyse productive period –thus reducing analysis time – or by adding specific measures such as counts oferrors. While ad hoc additional measures may meet the requirements ofindividual evaluations, they should be interpreted with circumspection unlesstheir validity and reliability have been assessed.
Other approaches to performance measurement
Analysing, refining and partially automating the performance of work tasks hasplayed a significant role in the development of industrial societies. It is a topicof legitimate concern to people in many professional and academic disciplines,and provides an area for continuing debate concerning its economic, political,social, ethical, organisational and individual implications. However, it is notwithin the scope of this chapter to provide a critique of Taylorism and neo-

Miles Macleod , NPL Draft 0..8 August 25, 1998 5
Taylorism. Suffice to say that there is an ethical dimension to the use ofperformance measurement in the field of human-computer interaction, and thisshould be acknowledged by usability professionals.
People developing or procuring information systems or interactive products aregenerally concerned about their effect on the efficiency of the work they support,especially where systems are designed specifically to support particularworkflows or transactions. Contracts for the development of bespoke systemsmay incorporate targets for efficiency (or productivity) of work supported by thenew system, expressed in terms of times to achieve specific workflows when thatsystem is rolled out. Management typically is seeking enhanced productivityand lower staffing levels for tasks which can be computer-supported. Mostprocuring organisations are also concerned with users' perceptions and staffsatisfaction, and some may incorporate targets for 'ease of use' or usersatisfaction. Of course, performance targets are only meaningful when they canbe expressed quantitatively. It must be possible to measure the efficiency orproductivity of existing and new work practices, and to measure usersatisfaction, if such factors are to be part of the system specification.
Many established methods for work measurement involve collecting detailedmeasures of times taken to perform elements of work: specific activities. Theseare typically gained by observing and timing the performance of work by largenumbers (hundreds or even thousands) of staff. Larger organisations may havetheir own work measurement teams who carry out long-term studies, with theintention of informing management decisions about anticipated futurerequirements for staffing levels. The individual activities which are timed maybe of only a few seconds duration. Measures relevant to office informationsystems often focus on clerical activities, and some methods (e.g. Clerical WorkMeasurement) draw on libraries of data about timings of common clerical tasks,collected from various organisations.
Such approaches may in some circumstances give very useful approximations ofperformance times, but they have immediately apparent disadvantages whenapplied to novel ways of performing work tasks. They are essentially 'bottom-up', yielding additive estimates of times for composite tasks simply from the sumof timings for their component activities. Typically they assume an idealisedway of carrying out the task. An analogous approach in the field of human-computer interaction is the Keystroke-Level Model (K-LM: Card et al., 1980).This is a method for estimating task performance times for interaction betweenindividuals and computer systems, which assumes error-free expert performance.The K-LM incorporates an explicit model of the user's cognitive processing time,represented by adding a time allowance for thinking at key points which theanalyst must identify in the interaction. Clerical work measurement methodstypically do not make explicit allowance for cognitive processes, although insome cases they may add a time element for error recovery. Alternatively, boththese factors may simply be reflected in the mean performance times for someactivities.

Miles Macleod , NPL Draft 0..8 August 25, 1998 6
A major disadvantage of traditional approaches to performance measurement isthat analysts must rely on historical performance data to draw inferences aboutfuture work performance with as-yet-unimplemented systems. However, thefuture performance will be affected by different contextual factors and highercognitive factors in the users, which such methods simply ignore. From a user'sviewpoint the quality of use of interactive systems and the productivity ofcomputer-supported work are affected by specific design decisions at everylevel. Where new systems are being developed these traditional methods dolittle to help developers shape many key design decisions which will affect workefficiency and user satisfaction.
Performance assessment methods are widely used in a second area relevant tothis chapter: training. The critical role of staff training in enhancing efficientwork performance is recognised by most organisations. Assessment of theeffectiveness of training may sometimes take the form merely of tests ofknowledge – people's ability to recall or recognise facts and procedures inwhich they have been trained. There is a growing recognition of the need toassess the effects of training on performance.
In evaluating usability, the amount and nature of the training which users havereceived at the time of the evaluation can have major effects both on themeasured efficiency and user satisfaction. Where the approach advocated here isapplied during system development, user training and support materials areiteratively developed and improved as part of the usability engineering process.
Applying the Performance Measurement Method
Any evaluation should have clearly stated aims. Since the outputs of the MUSiCPerformance Measurement Method span a range of optional measures anddiagnostic data, it is essential in applying the method to start with a set ofspecific evaluation objectives, and, if possible, performance targets. Datacollection for its own sake has little merit in commercial usability work, wheretight timescales and budgetary constraints demand tightly focused evaluationsgiving results which are specifically applicable in informing development,(re)design or selection of systems and alternative work practices.
Major considerations in applying the method are timing and resources, bothhuman and financial. If the aim is simply comparison of available systems, oracceptance testing of an implemented system, then the method can be applied touse of a fully developed system either in a laboratory setting which reflects theintended context of use, or in a pilot implementation. This can provide valuableinformation about relative performance with different systems, and aboutrequired levels of training and user support. However, applying the method inthis manner (when a design has been finalised) misses many of the benefits ofshaping a system more closely to meet user needs, skills, capabilities andexpectations.
Miles Macleod , NPL Draft 0..8 August 25, 1998 7
The principal use of the method is as an integral part of development processesbased around prototyping and iterative improvement. This means that theusability testing programme should run from early in development to finaldelivery. The diagnostic data inform the development, and the performancemeasures indicate the degree of progress towards meeting usability targets. Theinitial steps in the approach – and particularly the context analysis upon whichthe method draws – are best carried out before a prototype is produced. Theinvolvement of development staff and user communities in the testing processgives significant benefits in informing developers about the performance ofdifferent designs in users' hands, and in building positive attitudes towardsforthcoming systems in the minds of user communities.
One trade-off which exercises the minds of many usability professionalsconcerns timing and the degree of fidelity of prototypes. Evaluations early indevelopment necessarily involve lower fidelity prototypes. Early evaluationsoffer many benefits. The earlier the evaluation, the easier it is to make changesin the design, yet less reliance can be put on the findings since the system testedwill deviate more from a realistic context of use. This is not just a matter of theappearance of the prototype, but also the scope of its functionality, speed ofresponse, the influences of other networked devices and access to on-linedatabases, etc., all of which can significantly affect usability. In general, earlyprototypes can inform about broader design considerations, but the detailedfactors which affect final usability can only be assessed with high fidelityprototypes or pilot implementations. However, if testing commences with a highfidelity prototype, this may fix design ideas in the minds of the developmentteam which are subsequently more difficult to change. Ideally, the approachshould embrace both low and high fidelity prototypes, with a progression frombroad changes to fine tuning.
Miles Macleod , NPL Draft 0..8 August 25, 1998 8
Define the product to be tested
Define the Context of Use
Carry out the user tests
Analyse the test data to derive
and interpret the metrics
Produce a usability report
The DRUM Kit
DRUM: Recording Logger
Tools
supporting the Method
Step 1
Step 2
Step 3
Step 5
Step 6
Step 7
Steps
in the Performance Measurement Method
Usability Context Analysis Guide
DRUM: Evaluation Manager
DRUM: Evaluation Manager
Specify the evaluation targets
and Context of Evaluation
Prepare an evaluation thatmeets the specified Context
of Evaluation
Step 4
Usability Context Analysis Guide
Performance Measurement Handbook
DRUM: Scheme Manager
Usability Context Analysis Guide
DRUM: Metrics Processor
Performance Measurement Handbook
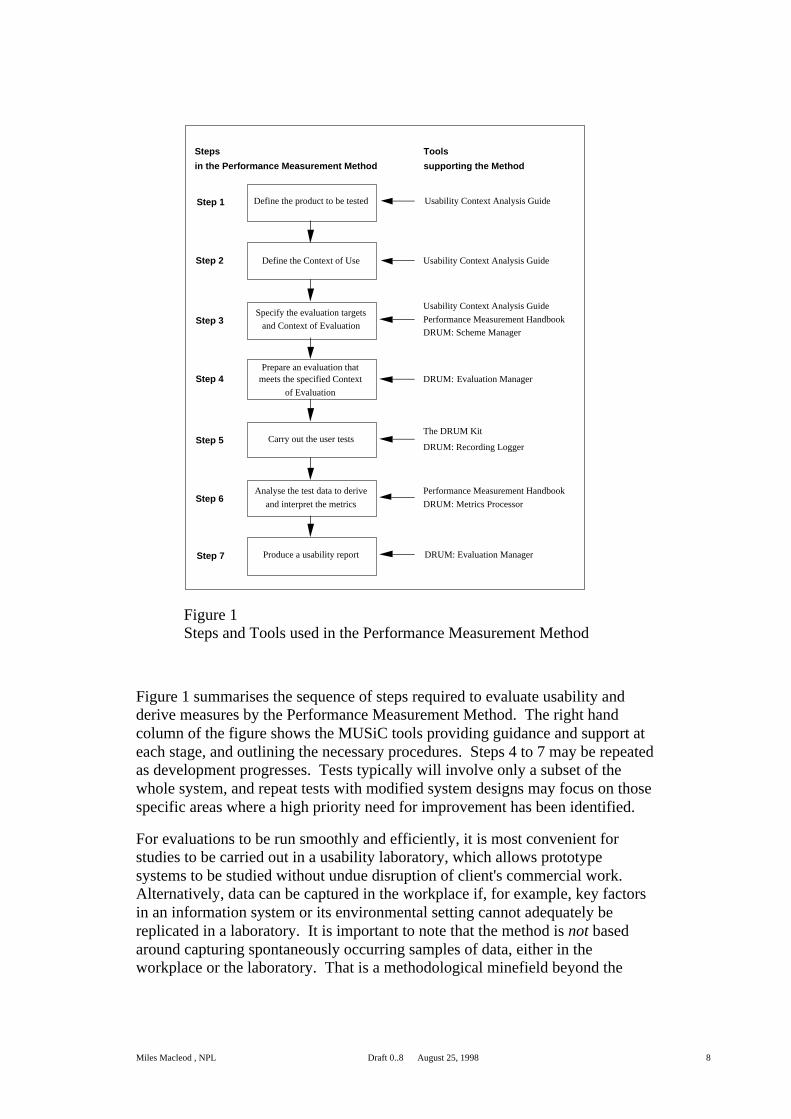
Figure 1Steps and Tools used in the Performance Measurement Method
Figure 1 summarises the sequence of steps required to evaluate usability andderive measures by the Performance Measurement Method. The right handcolumn of the figure shows the MUSiC tools providing guidance and support ateach stage, and outlining the necessary procedures. Steps 4 to 7 may be repeatedas development progresses. Tests typically will involve only a subset of thewhole system, and repeat tests with modified system designs may focus on thosespecific areas where a high priority need for improvement has been identified.
For evaluations to be run smoothly and efficiently, it is most convenient forstudies to be carried out in a usability laboratory, which allows prototypesystems to be studied without undue disruption of client's commercial work.Alternatively, data can be captured in the workplace if, for example, key factorsin an information system or its environmental setting cannot adequately bereplicated in a laboratory. It is important to note that the method is not basedaround capturing spontaneously occurring samples of data, either in theworkplace or the laboratory. That is a methodological minefield beyond the

Miles Macleod , NPL Draft 0..8 August 25, 1998 9
scope of this chapter. The MUSiC approach to performance measurement isbased on the analysis of pre-selected representative scenarios. Wherever the dataare recorded, it is essential first to identify appropriate evaluation tasks and userprofiles which meet the specific objectives of the evaluation. These are agreedas a result of a context study by the usability team, together with otherstakeholders, who also define assessment rules for task output, for determiningcorrectness and completeness of task goal achievement.
A major practical consideration in planning an evaluation is the availability ofusers matching the required profile. Finding representative users is of greatimportance in any user-based evaluation, and may require careful pre-planning.It may, for example, be necessary to provide training in the use of a new orrevised system, which matches the training users will have received on roll-outof the system. Typically, the usability team takes responsibility for userarrangements, and for preparing task instructions.
MUSiC Measures of Performance
As we have stated in the introductory sections of this chapter, the MUSiCPerformance Measurement Method can deliver a range of measures indicatingdifferent aspects of usability, together with diagnostic data. All versions of themethod deliver measures of effectiveness and efficiency; the other measures arederived only where appropriate.
Effectiveness and measures from analysis of task output
Evaluating effectiveness requires analysis of task output, typically hard copy orinformation displayed on screen during an evaluation. The analyst applies theagreed evaluation-specific assessment rules to the output, to arrive at measuresof Quantity and Quality (analogous to completeness and correctness) of goalachievement.
• Quantity: the proportion of the task goals represented in the output of a taskwhich have been attempted
• Quality: the degree to which the task goals represented in the output havebeen achieved
Measuring Quantity and Quality of task goal achievement can involve a degreeof subjective judgement. The judgmental criteria should be decided beforeanalysis commences, by more than one person familiar with the task and therequirements of the product. The criteria must be documented, and implementedas a scoring procedure to be followed by the analyst.
To evaluate performance tasks must be chosen which have an outcome that canbe assessed. For example:
• when evaluating an information retrieval system the user might retrievespecific items of information. This output is then analysed to measure how

Miles Macleod , NPL Draft 0..8 August 25, 1998 10
many of the specified items the user retrieved, and how well all the retrieveditems met the original requirements.
• when testing a drawing package, the user might reproduce a picturecomposed of different shapes. The output is then analysed to measure howmany of the shapes the user reproduced, and how well those shapes matchthose in the original picture.
• when evaluating an electronic process controller the user might set a fixednumber of control parameters to specified values. The output is the state ofthe controller at the end of the task. The analyst can see how many of theparameters have been altered from their default settings and how accuratelythey have been set to the specified values.
Effectiveness
The effectiveness with which users employ an IT product to carry out a task isdefined as a function of two components, the quantity of the task attempted bythe users, and the quality of the goals they achieve.
Effectiveness = ƒ(Quantity,Quality)
Task Effectiveness
A value for the Task Effectiveness (TES - effectiveness for a specific task)achieved by a user is obtained by measuring the Quantity and Qualitycomponents independently, and then applying the following formula:
TES =(Quantity × Quality)
100%
Efficiency and cost of task performance
In engineering, the term 'efficiency' is uncontentiously understood as the ratio ofuseful energy output to energy input. For example, Timoshenko and Young(1937) define the efficiency of a machine as the ratio of the useful workperformed to the total energy expended. Put simply,
Efficiency =
output
input
For a work system in which a human is interacting with a computer, theeffectiveness with which the user and the computer working togethersuccessfully complete a task is a measure of the useful work performed, or theoutput. However, the nature of the output is quite different from the input, andno meaningful equivalence formulae are apparent (unlike physics, where thereare repeatable equivalencies of energy in different forms). Hence it is notpossible to express efficiency of task performance as a ratio.
This does not mean that we cannot express efficiency of task performancenumerically, simply that efficiency measures will be expressed in units.

Miles Macleod , NPL Draft 0..8 August 25, 1998 11
However, those units will be initially unfamiliar, which can a disadvantage whenpresenting reports for a general audience. The nature (and hence units) of themeasures of input of effort required to carry out a task will depend upon thepurpose of the evaluation, or the viewpoint of the evaluator:
From a user's viewpoint, the amount of effort input may be quantified in termsthe time spent carrying out the task, or the mental/physical effort required tocomplete the task. These two types of input produce two different definitions ofefficiency which can be stated as:
UserEfficiency =Effectiveness
TaskTime
HumanEfficiency =Effectiveness
Effort
However, from the viewpoint of the organisation employing the user, the inputto the work system is the cost to the organisation of the user carrying out thetask, namely the:
• labour costs of the user’s time• cost of the resources and the equipment used• cost of any training required by the user
In this case, efficiency can be stated as:
CorporateEfficiency =Effectiveness
TotalCost
User Efficiency is defined below as a MUSiC performance-based usabilitymetric.
Human Efficiency is a metric in the MUSiC Cognitive Workload toolkit.
User Efficiency
The efficiency with which users make use of an IT product is defined in theMUSiC Performance Measurement Method as their Effectiveness in carrying outtheir task divided by the time it takes them to complete the task.
UE =Effectiveness
TaskTime
where Effectiveness is measured as described previously, and Task Time, thetime spent by a user completing a task, being measured by the techniquedescribed in the NPL Performance Measurement Handbook.
This metric provides a measure of User Efficiency in a particular context. It istask-specific. By itself, its value has little meaning unless there is anothermeasure of efficiency against which to compare it.

Miles Macleod , NPL Draft 0..8 August 25, 1998 12
For example, it can be used to compare the efficiency of two or more:
• similar products, or versions of a product, used in the same context, i.e. bythe same user groups for the same tasks in the same environments
• types of users using the same product for the same tasks in the sameenvironment
• ways of achieving given task goals when carried out by the same users on thesame product in the same environment.
Optional Measures
Productive and Unproductive Actions
The specific actions undertaken during the task depend on the nature of thesystem. It is useful to distinguish between task actions which are productive inthat they contribute to task output, and those which are unproductive in that theydo not contribute to task output.
In MUSiC, actions are considered productive if they:
• produce items that can be seen in the task output - for example, producing aline in a diagram
• are necessary to produce such items - for example, selecting the line drawingtool
• acquire information that helps produce task output - for example, checkingthe currently selected line width
Even if the user has not used the optimum sequence of actions to achieve aresult, the actions are counted as productive if they contribute to the task output.Less than optimum methods will lead to longer Task Times, and will thereforebe accounted for in the User Efficiency metric.
It is generally easier to identify the time spent in actions that make up theUnproductive Time rather than productive actions. Unproductive actions arecategorised into three types, to give more detailed information about the waytime is spent during the task. These are:
Help Actions
The user obtains information about the system, for example by:
• referring to the on-line help• reading an instruction manual• looking at a reference card• asking a supervisor or analyst for advice• talking to an appointed expert on the telephone

Miles Macleod , NPL Draft 0..8 August 25, 1998 13
Search Actions
The user explores the structure of the system – displaying parts that are notcurrently accessed – without activating any of the parts that are presented.Examples of search actions include:
• displaying one or more menus without activating an item• reeling through listings or icons of files without opening any of them• opening then cancelling a print dialogue box• moving through sections, modules, or screens of a software package without
activating any of the functionality.
Although help and search actions may indirectly help the user to carry out thetask by providing more knowledge about the system, they are still considered tobe unproductive actions. This is because help and search actions do not produceitems that can be seen in the task output; neither are they a necessary prerequisiteto producing such items.
Snag Actions
The user or system performs an action that does not contribute directly orindirectly to the task output, and that cannot be categorised as a help or searchaction. There are three types of snag action - negating actions, cancelled actions,and rejected actions. All three types indicate that the user or system has metsome hindrance in trying to produce the task output. The actions are knowncollectively as snag actions, because they provide an objectively identifiablemeasure of the problems that have arisen during the usability session.
• Negating ActionsUser actions that completely cancel or negate previous user or systemactions. They always cause cancelled actions.
• Cancelled ActionsUser or system actions that are completely negated by the user or the system.
• Rejected ActionsUser actions that are rejected or ‘ignored’ by the system, and thatconsequently have no effect.
Examples of snag actions are:
• Typing characters and then deleting them by backspacing• Performing an action and then selecting the function ‘undo’• The system crashing, followed by actions to recover lost data• Entering commands to which the system fails to respond
Productive Time
Productive Time is therefore defined as the Task Time remaining after Help,Search, and Snag periods have been removed. It is the time a user spends

Miles Macleod , NPL Draft 0..8 August 25, 1998 14
progressing towards the task goals, irrespective of whether the goals areeventually achieved.
Productive Period
The Productive Period is the Productive Time expressed as a percentage of theTask Time.
Examples of the method in use
The MUSiC Performance Measurement Method is applicable in a wide range ofinteractive system development and testing scenarios. NPL, workingcollaboratively with commercial organisations outside MUSiC since thebeginning of the MUSiC Project's second phase, has guided and contributed toits use in testing many kinds of system, including:
• shrink-wrap office software products• bespoke information systems• multimedia walk-up-and-use systems• medical information systems• interactive control devices
Organisations applying the method include:
• PC software developers• PC software procurers and reviewers• IT departments in public utilities• public sector administration• companies in the financial services sector• retail organisations• consultancy firms developing information systems for clients
All evaluations have involved staff in the client organisations (essential to gaincontextual validity and give maximum benefit through effective feedback intodevelopment). The degree of involvement depends upon the approach taken.The simplest approach has been to provide an evaluation service, involving theminimum number of client staff required to carry out an evaluation withadequate contextual validity (see the chapter on context analysis). Our preferredapproach where possible is to enable clients to exploit the advantages of greaterinvolvement in the usability evaluation and engineering process, by providingtraining for client staff in the skills required to carry out evaluations, andsubsequently give guidance in the conduct of evaluations to ensure acceptablequality. This requires commitment from decision makers typically at a levelabove IT department managers.
The following sections illustrate how the approach has been used in the financialservices sector, and is based on a number of evaluations conducted as part of

Miles Macleod , NPL Draft 0..8 August 25, 1998 15
bespoke information system development for European banking and financialinstitutions. The method is particularly suitable for bespoke systemdevelopment, where the user and environmental characteristics are more uniformthan is typically found with shrink-wrap products, and the work supported by thesystem can be clearly defined. The composite data presented below are realisticand representative, being a synthesis of various separate findings. They are notthe data of any one organisation.
Development objectives
Many financial service providers are modernising their branch computersystems. The systems being replaced typically have evolved and been added toover the past fifteen years, and are command line or screen menu based. Currentdevelopments focus on using client-server systems with graphical userinterfaces. The primary objectives in the development of these new systems areto improve the level of productivity and satisfaction in the work context (i.e.while counter staff are engaged in serving customers).
Specific objectives may be:
• staff productivity should increase – they should be able to process morebusiness transactions in a given time period and with the required accuracy
• the new system should be perceived to be easier to use than the old system• the new system should be easy to learn
Defining the Contexts of Use and Evaluation
The evaluation is based around the use of information systems supporting theprocessing of customer transactions, which represent a major element of thedaily branch business activity. As explained in the chapter on Usability ContextAnalysis, the foundation of the evaluation is an analysis of the characteristics of:
1. Users2. Job and Task3. Organisational Environment4. Technical Environment5. Physical Environment
Once the context of use has been characterised, with the participation of keystakeholders, the next steps are to identify which characteristics of users, tasksand environment may be relevant to usability, and then to select representativeusers, tasks and environment for the evaluation.
Users
Branch staff who reflect the characteristics of the group – and who are availableand willing to participate in the evaluation sessions – are selected frombranches. This can be a major logistical and politically sensitive aspect of anyevaluation. There is a tendency for managers to assign staff who are supervisors

Miles Macleod , NPL Draft 0..8 August 25, 1998 16
or unusually enthusiastic. The importance of getting a suitable, representativecross-section must be emphasised at all times.
Tasks
A set of frequent and critical tasks is defined and agreed with the client, drawingon the results of context analysis and client's evaluation requirements. Thechoice of tasks for an evaluation may be constrained by the limitations of thefunctionality of a prototype system. Preferably, the scope of the functionality ofa prototype should be guided by the evaluation requirements, and in practice wefind this is usually quite feasible. In financial services the tasks may involvecarrying out 15-30 transactions with 8-15 customers over a period of about 30minutes to 1 hour. For each transaction, rules are agreed for assessing thequantity and quality of task outputs.
Environment
This should simulate the essential characteristics of the workplace, in this case abranch environment. Key factors are the physical work space (the counter) andthe peripheral devices which are required to support transactions. These includeitems such as card-readers, printers, cash tills and support for any paper elementsof the work. An ideal solution is a 'model office' with a built-in observation areaand discreetly positioned cameras. Alternatively, a counter and the relevantequipment can be set up in a usability lab. Either solution enables the workcontext to be recreated with some realism; the transactions to be discreetlyobserved by stakeholders, and all the evaluations to be videotaped (with both realtime and retrospective analysis of performance). It is not usually possible torecord data about use of a prototype system in a working branch because ofdisruption to customer service.
Evaluation design
Baseline measures are obtained by first evaluating use of the old system.Typically, around 12 branch counter staff participate in an evaluation. In thiscomposite example, each is presented with frequent or critical transactions –some transactions being repeated with different parameters, to give a total of 20tasks – first with the old system and at a later date with the prototype newsystem. The tasks are presented in the same way they occur in the workplace,the branch staff responding to requests and enquiries from 'customers' acting outscripts.
The prototype new systems are backed by local databases tailored for theevaluation. Users are given training in using the prototype system to carry outtheir familiar work tasks, prior to the evaluation session. This training maytypically last from one to four hours, and is a first pass design of the trainingwhich will be given to all users of the new system.

Miles Macleod , NPL Draft 0..8 August 25, 1998 17
In formal terms this is a repeated measures design. Practical constraints andtimescale usually make it impossible for the evaluation design to overcome ordereffects. In practice, staff are usually highly skilled at using existing systems,because of their daily experience of working with them, and any order effect inthe evaluation is likely to be outweighed by this depth of experience. The keyissues are how well they can use the new system at roll out, and their perceptionof its usability. In addition to the measures, the participants are interviewed toelicit their opinions on the system as a whole and any specific aspects of interest.

Miles Macleod , NPL Draft 0..8 August 25, 1998 18
Measures
The evaluation measures are of both performance and satisfaction (perceivedusability). The following performance measures are analysed:
• Task Effectiveness - how completely and accurately a user achieves thegoals of each task (overall Effectiveness across tasks is also calculated)
• Task Times for each task (i.e. each different transaction)• User Efficiency for each task [Task Effectiveness / Task Time]• Snag, Search and Help Times - used for identifying unproductive periods,
and as a diagnostic aid• Relative User Efficiency [User Efficiency / Expert User Efficiency] -
indicating level of performance of staff after short training, relative to experts
For satisfaction measures the SUMI questionnaire is administered after usingeach system, the old and the new. SUMI gives measures of perceived usabilityacross all the tasks performed.
Performance results
For the purposes of this example, a subset of the measures taken will beconsidered here. Among the transactions considered were depositing andwithdrawing cash, and depositing and withdrawing cheques. Figure 2 shows themean task times. Figure 3 shows the Efficiency measures for those same tasks.
Old system
New system
Mean Times
Task Times (minutes)
0
0.5
1
1.5
2
2.5
DepositingCash
WithdrawingCash
DepositingCheques
WithdrawingCheques

Miles Macleod , NPL Draft 0..8 August 25, 1998 19
Figure 2. Mean Task Times, with 95% confidence intervals
Efficiency (%E/min)
0
20
40
60
80
DepositingCash
WithdrawingCash
DepositingCheques
WithdrawingCheques
100 Old system
New system
Mean Efficiency
Figure 3. Mean Efficiency by task (percentage effectiveness per minute)
It can be seen from the graphs that the new system shows improvements for cashtransactions. Statistical tests on the cash transaction performance results – TaskTimes and Efficiency – of the sample of users show a significant difference atthe 95% level. That is, there is at least a 95% probability that we would find adifference in performance between the two systems for these tasks if we were totest the whole user population, assuming contextual validity. The differencesbetween the new and old system for cheque transactions were considerably less,and are not significantly different at the 95% level. This means that the chequetransaction results must be interpreted more circumspectly: the means forperformance with the new system are slower and less efficient than with the old,after the given amount of training. It may be considered worthwhile to test thelevel of significance of these differences, even though they are less than 95%.
Much useful diagnostic data can be obtained from closer inspection of theresults, and the further measures: Snag, Search and Help Times and Productiveperiod, plus the data from individual users (not shown here). There is a larger

Miles Macleod , NPL Draft 0..8 August 25, 1998 20
variance in performance with the new system, indicating that while some userswere able to work relatively efficiently, others found it slower and less efficientat this point in their learning curve.
The Effectiveness results (not shown) indicate more minor errors in task outputwith the new system, which is not unusual where a new system has a radicallydifferent interface, with some workflows re-engineered. Any critical errors are acause for concern. Study of the evaluation video record and interview data helpsidentify specific causes. Study of the Snag, Search and Help data helps pinpointspecific areas of difficulty, which together with data from post test interviewsenables the evaluators to feed back suggestions for specific potentialimprovements into the design both of the system and the training.
One factor in poorer than hoped for performance may be technical difficultiesencountered with the prototypes, for example peripheral devices for readingcards and cheques. Assuming these are rectified, the performance level for suchtransactions can be expected to improve in the next prototype stage.
Presenting results - a word of caution
In reporting evaluation findings which give numerical data, it is essential toinclude guidance on interpretation, and caveats about the strength of inferenceswhich can safely be drawn. Audiences without a background in experimentaldesign and statistics may draw strong and unjustifiable inferences from numbers.Presenting means – even in an executive summary – without clearly statedcaveats therefore risks being positively misleading. Equally, development staffinvited to observe part of an evaluation, while gaining invaluable insights intohow users get on with their design, may come away with fixed ideas based on asample of only one or two users. It is essential to inform them of the widerpicture, for example by putting together a 'video highlights' tape showing abalanced picture of areas of difficulty and success. It should also always benoted that the type and quality of the information gained is dependent upon theaccuracy of the analysis of context of use, the accuracy of the context ofmeasurement, the scope of the chosen measures and the quality of the evaluation.
While measures are important – to quantify the progress of system developmentand training in terms of resulting efficiency, effectiveness and satisfaction – thediagnostic data gained from such evaluations are invaluable in the iterativeimprovement of prototypes. Evaluations such as this enable the developmentteam to become informed as to where difficulties lie, and how the system may beimproved.
Support for the method
Products and services supporting the use of the MUSiC PerformanceMeasurement Method are available from NPL, providing a flexible approach tosupporting the development and evaluation of interactive systems. NPL works

Miles Macleod , NPL Draft 0..8 August 25, 1998 21
with organisations to clarify usability requirements and subsequently supportevaluation of usability at appropriate points during design. NPL has helpedestablish and train usability teams in a number of large organisations, applyingthe method in the development and testing of systems, and helping integrate thespecification and evaluation of usability into quality management systems.
Training and accreditation
To ensure the correct application of the method by organisations and individualsnew to the approach, NPL provides training in usability evaluation andPerformance Measurement Method, with full support materials and follow-upguidance in its use. Training courses are flexible and are tailored to meet clients’needs. Typical courses last two days and introduce methods for setting up andconducting user-based evaluations. Guidance is then available in the conduct ofevaluations, tapering off as acceptable levels of individual competence for thevarious stages of the evaluation process are achieved. NPL can provideassistance in setting up a quality system to ensure correct application by staffaccredited in the relevant competencies. Alternatively, NPL can apply themethod on behalf of clients.
Products
The following products supporting the method are available from NPL:
• Usability Context Analysis Guide: used to specify usability requirementsand to select the tasks and contexts for which usability should be evaluated.
• Performance Measurement Handbook: provided with training, this referencesource details procedures to be followed to design and run evaluations toprovide reliable performance measures of usability.
• DRUM (see below): video analysis software available in conjunction withthe Performance Measurement Method.
DRUM, the Diagnostic Recorder for Usability Measurement
DRUM (Macleod and Rengger, 1993) is a software tool providing a broad rangeof support for video-assisted observational studies following the MUSiCPerformance Measurement Method for usability evaluation. Evaluation sessionsare recorded on video, and subsequently analysed with the help of DRUM; a firstpass analysis can be performed in real time during recording. DRUM greatlyspeeds up the analysis of video recordings. Where possible, activities areautomated entirely. DRUM helps the analyst build up a time-stamped log ofeach evaluation session, and calculates measures and metrics. DRUM deliversevaluation data in a format compatible with spreadsheets and statisticalpackages, for further analysis and graphical display. DRUM assists thegeneration and delivery of diagnostic feedback to a product’s designersconcerning usability defects.

Miles Macleod , NPL Draft 0..8 August 25, 1998 22
Iteratively developed over three years – in collaboration with a number ofcommercial organisations – to meet the needs of usability testing in developmentand procurement, DRUM is now in version 3.3. DRUM requires an AppleMacintosh computer (e.g. FX, Quadra, Performa, PowerPC) with a 14” or largermonitor (i.e. 640 x 480 pixel); an extended keyboard; System 7; andHyperCard 2.1 (allocated at least 2.4 MB RAM). DRUM drives the followingVCRs: Sony U-Matic VO 7000 and 9000 series, with BKU 701 computerinterface and FCG-700 frame code generator; Sony UVW 1400/1400P; and thePanasonic AG-7350 or AG-7355 SuperVHS with AG-IA232TC RS-232 boardand time code generator/reader.
DRUM supports for the MUSiC Performance Measurement Method in thefollowing ways:
Organising evaluations
The DRUM Evaluation Manager makes it easy to organise data from all stagesof usability evaluation. It gives you quick and simple access to evaluation dataabout:
• users - the people being observed in an evaluation• tasks - analytic schemes describing the tasks which users perform• video recordings of evaluation sessions• logs of user and system activities, created by DRUM• measures - derived from analysing logged task performance (times, problems,
etc.)• usability metrics - calculated values for individual users and groups• reports of evaluation findings
DRUM uses ASCII files for data storage, allowing flexible compatibility withword processors, spreadsheets and statistics packages.
Identifying significant events
You may wish to look out for many different kinds of event when studying avideo record of an evaluation session. DRUM gives you a basic set of eventtypes, significant to the use of a system. With the DRUM Scheme Manager, youcan add and edit your own event types, and even create complete descriptions ofthe tasks to be performed by users during evaluation sessions. Each activity isrepresented on screen as an event button, with associated editable definition andcomments. DRUM supports hierarchical task analysis at up to five levels ofdetail.
Analysing video records
The DRUM Recording Logger helps you, quickly and efficiently, to build up atime-stamped log marking all the significant events observed on a video. Youcan enter comments about individual events.

Miles Macleod , NPL Draft 0..8 August 25, 1998 23
Logging can be carried out in real time during recording, or retrospectively. Logscan be stored for subsequent analysis or further editing. DRUM gives fullcontrol of the video recorder, including a variable speed shuttle, and offersautomated location and playback of any logged event on the video: simply pointand click on the event in the log display.
Deriving measures and metrics
The DRUM Log Processor provides automated calculation from logs in theDRUM database of performance measures and performance-based usabilitymetrics, including:
• Task Time• Snag, Search and Help Times• Efficiency• Relative Efficiency• Productive Period
Measures and metrics are presented in tabular and graphical displays. Resultsfor individual users can be grouped, and exported to a spreadsheet or statisticspackage for further analysis.
It should be emphasised that the validity of the MUSiC usability measuresderived by DRUM in any evaluation depends upon the contextual validity of theevaluation, and on the evaluators applying the MUSiC PerformanceMeasurement Method for collecting and analysing the data. Because of the risksof analysis of contextually invalid data or misinterpretation of usability measuresin untutored hands, DRUM is usually licensed to organisations in conjunctionwith training in the MUSiC Performance Measurement Method.
Further information
For further information on the method and the supporting products and services,contact:
Rosemary Bowden or Nigel BevanNational Physical LaboratoryDITC HCI GroupTeddington, Middlesex, TW11 0LW, UK
Tel: +44 181-943 7019 or 6993 (from UK 0181-943 7019 or 6993)Fax: +44 181-977 7091 (from UK 0181-977 7091)Email: [email protected]

Miles Macleod , NPL Draft 0..8 August 25, 1998 24
Acknowledgements
Thanks are due to Ralph Rengger for material on performance measures, and toMary Corbett for her contribution to preparation of the case study material usedin this chapter. NPL's work in the development of Usability Context Analysisand the MUSiC Performance Measurement Method was jointly funded by theCommission of the European Communities and the UK Department of Trade andIndustry.

Miles Macleod , NPL Draft 0..8 August 25, 1998 25
References
Bellotti, V. (1988). Implications of current design practice for the use of HCItechniques; in Jones and Winder (Eds), People and Computers IV (Proc. ofthe 4th BCS HCI Conf, Manchester, 5-9th Sept 1988), Cambridge, CambridgeUniversity Press, pp 13-34.
Card, S., Moran, T.P., and Newell, A., (1980), The keystroke-level model for userperformance time with interactive systems, Communications of the ACM, 23,7(July) 396-410.
Dieli, M., Dye, K., McClintock, M. and Simpson, M. (1994). The MicrosoftCorporation Usability Group. In M. E. Wiklund (ed.) Usability in Practice,AP Professional, Boston, 327-358.
Dillon, A., Sweeney, M. and Maguire, M. (1993). A survey of usability engineeringwithin the European IT industry In: JL Alty et al. (eds.) People andComputers VIII (Proc. of HCI'93 Conf., Loughborough UK, September 1993).Cambridge: CUP,
Gould, J.D. and Lewis, C. (1983). Designing for usability – key principles andwhat designers think. In: A. Janda (Ed) Human Factors in ComputingSystems (Proc. of ACM CHI'83 Conf., Boston, December 1983). Cambridge:ACM Press, 50-53.
ISO (1994), International Standards Organisation DIS 9241-11, Ergonomicrequirements for office work with visual display terminals (VDTs), Part 11:Guidance on usability.
Macleod, M. and Rengger, R. (1993). The development of DRUM: a software toolfor video-assisted usability evaluation. In: JL Alty et al. (eds.) People andComputers VIII (Proc. of HCI'93 Conf., Loughborough UK, September 1993).Cambridge: CUP, 293-309.
Maissel, J., Macleod, M., Thomas, C., Rengger, R., Corcoran, R., Dillon, A.,Maguire, M. and Sweeney, M. (1993), Usability Context Analysis: a practicalguide, V3.0. National Physical Laboratory DITC, Teddington, UK.
Porteous, M., Kirakowski, J. and Corbett, M., (1993). SUMI User Handbook.Human Factors Research Group, University College Cork, Ireland.
Rengger, R., Macleod, M., Bowden, R., Drynan, A. and Blayney, M. (1993),MUSiC Performance Measurement Handbook, V2. NPL, Teddington, UK.
Timoshenko and Young (1937), Engineering Mechanics - Statics, McGraw-Hill.
Whiteside, J., Bennett, J. and Holtzblatt, K. (1988), Usability engineering: ourexperience and evolution. In: M. Helander (ed.) Handbook of Human-Computer Interaction, (Elsevier, Amsterdam), 791-817.
Winograd, T. and Flores, F. (1986). Understanding Computers and Cognition: ANew Foundation for Design; Wokingham, UK, Addison Wesley
Wixon, D. and Whiteside, J. (1985), Engineering for usability: lessons from theuser-derived interface. In: L. Borman and W. Curtis (eds) Human Factors in

Miles Macleod , NPL Draft 0..8 August 25, 1998 26
Computing Systems (Proc. of ACM CHI'85 Conf., San Francisco, April 1985).Cambridge: ACM Press, 144-147.