Embed Size (px)
Citation preview
The Multigraph for Loglinear Models
Harry KhamisStatistical Consulting Center
Wright State UniversityDayton, Ohio, USA
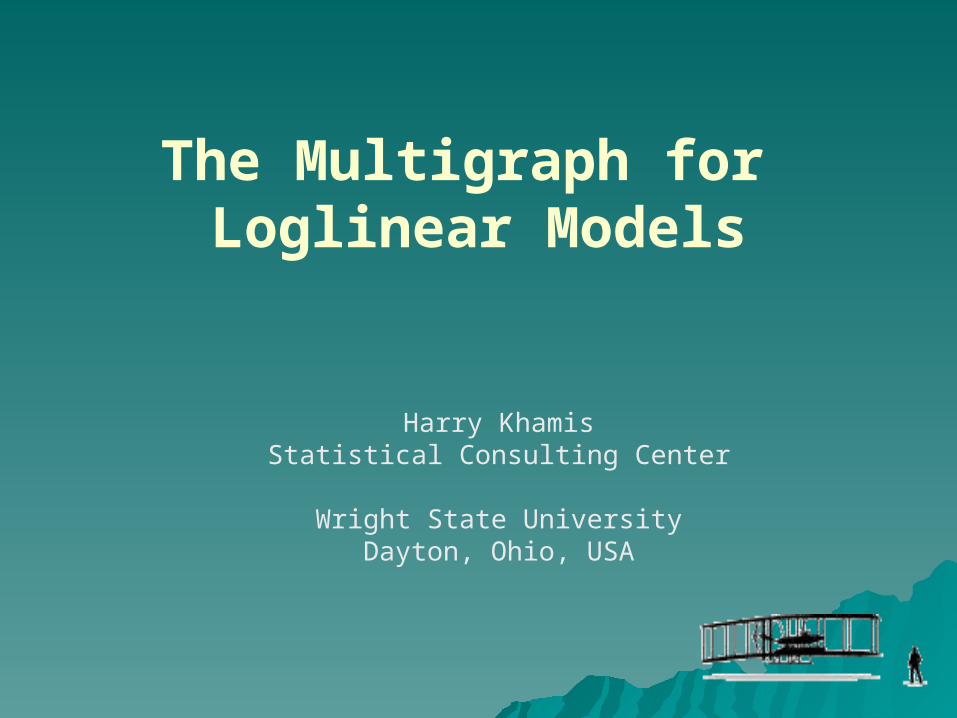
OUTLINE1. LOGLINEAR MODEL (LLM)
- two-way table- three-way table- examples
2. MULTIGRAPH- construction- maximum spanning tree- conditional independencies- collapsibility
3. EXAMPLES
22
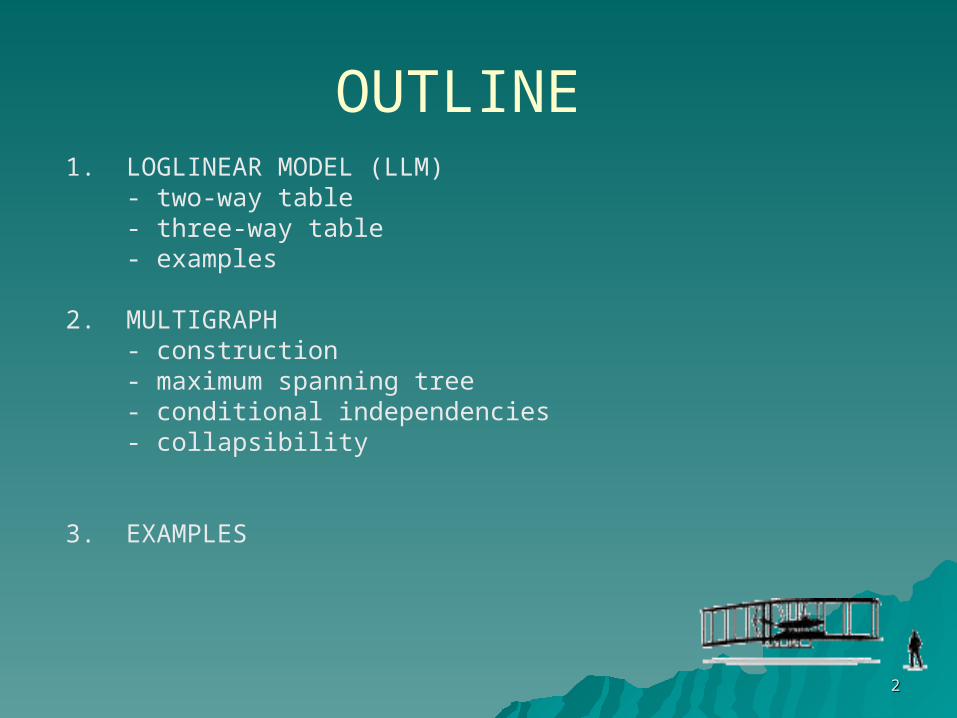
Loglinear ModelLoglinear Model
Goal
Identify the structure of associations among a set of categorical variables.
33
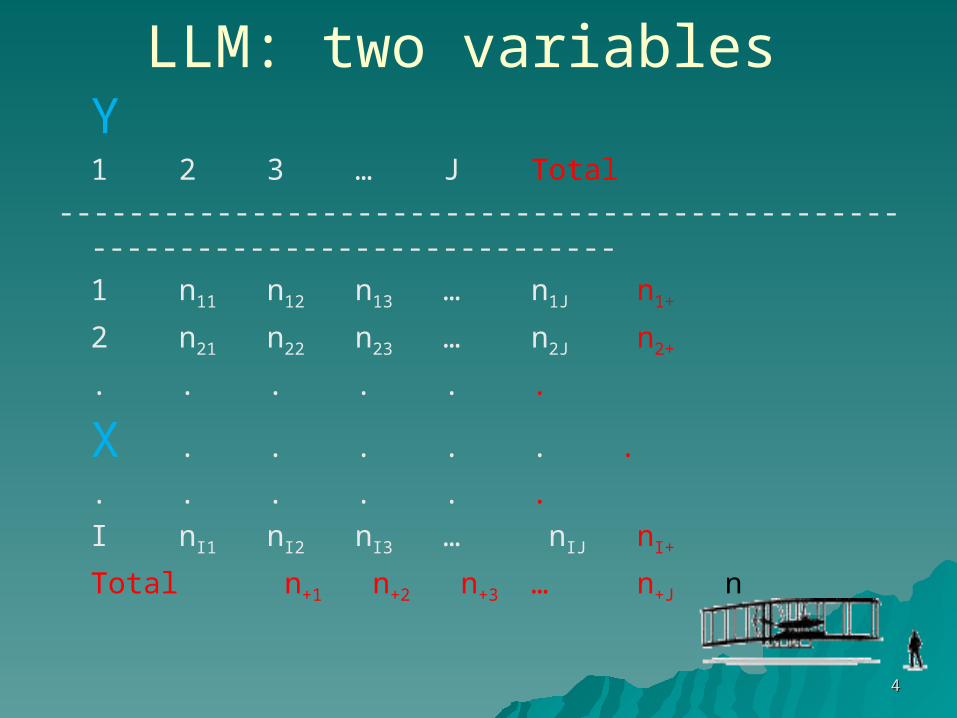
LLM: two variables Y
1 2 3 … J Total------------------------------------------------------------------------------
1 n11 n12 n13 … n1J n1+
2 n21 n22 n23 … n2J n2+
. . . . . .
X . . . . . .
. . . . . .I nI1 nI2 nI3 … nIJ nI+
Total n+1 n+2 n+3 … n+J n
44
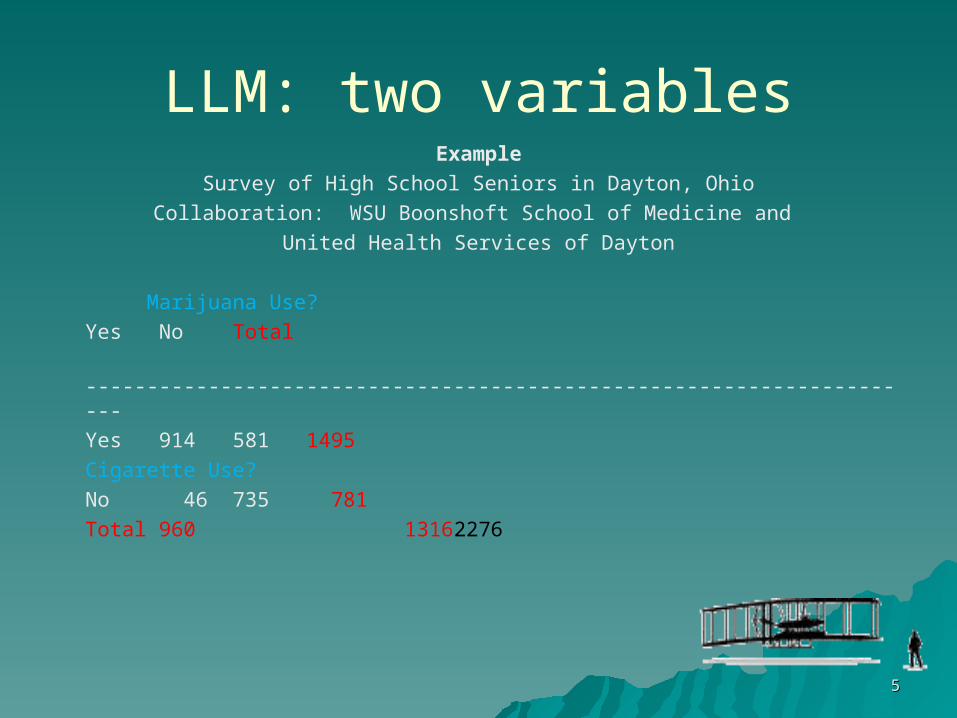
LLM: two variablesExample
Survey of High School Seniors in Dayton, OhioCollaboration: WSU Boonshoft School of Medicine and
United Health Services of Dayton
Marijuana Use?Yes No Total
---------------------------------------------------------------------Yes 914 581 1495
Cigarette Use?No 46 735 781Total 960 1316 2276
55
LLM: two variables
66
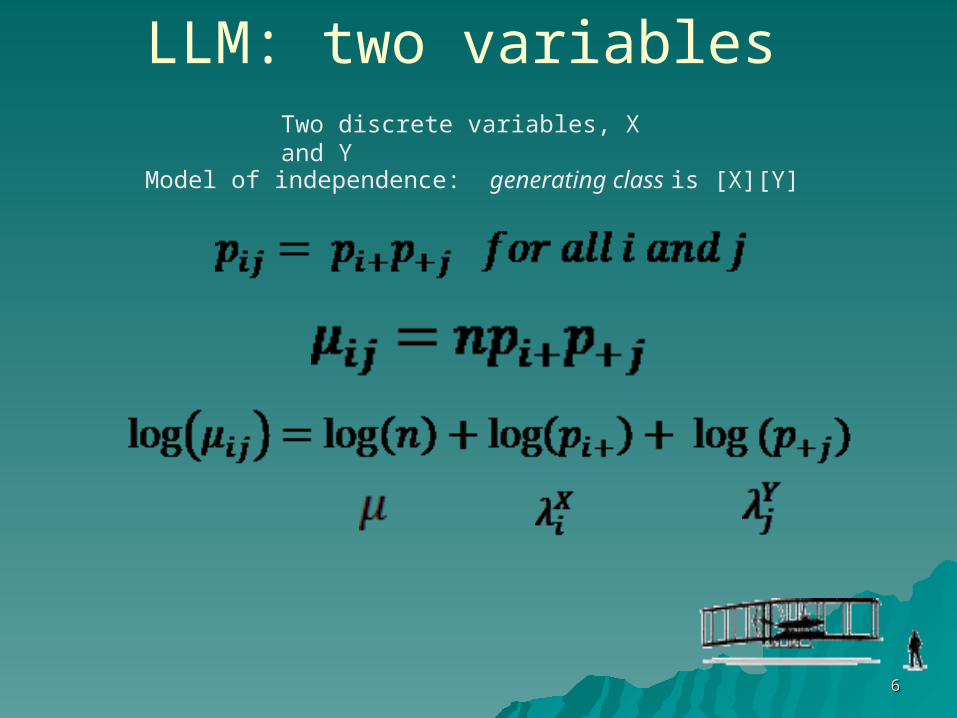
Two discrete variables, X and Y
Model of independence: generating class is [X][Y]
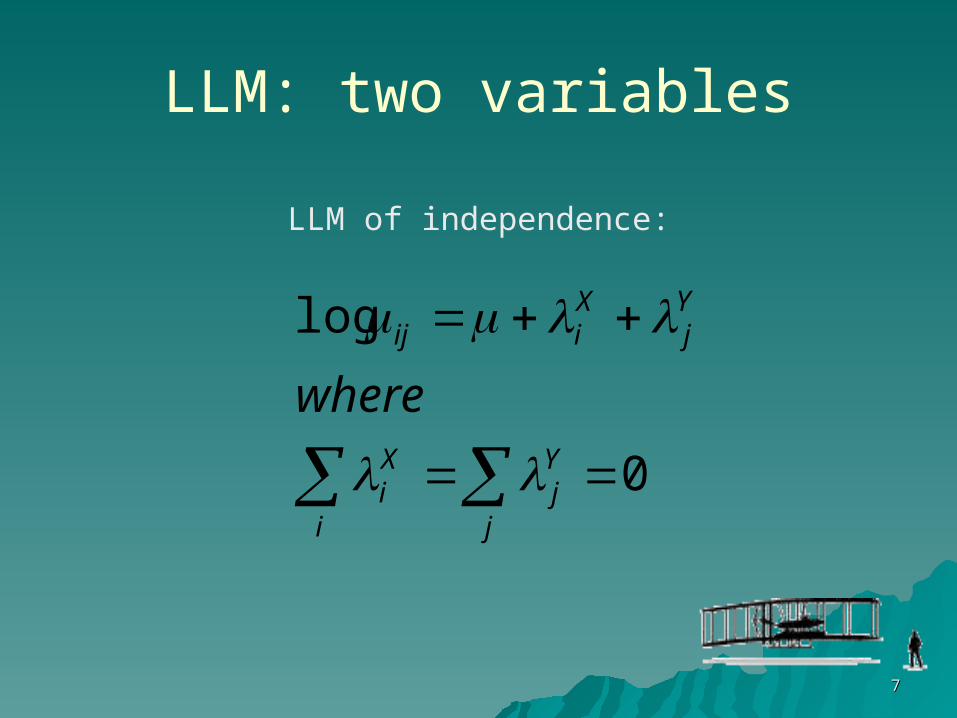
LLM: two variables
LLM of independence:
77
0
log
j
Yj
i
Xi
Yj
Xiij
where
LLM: two variables
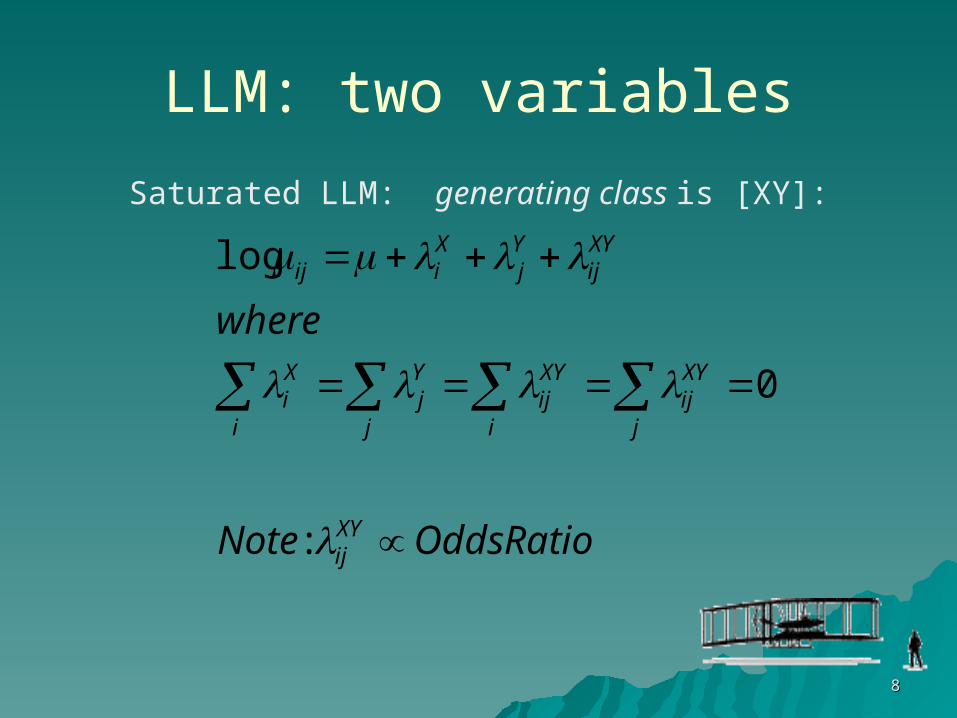
Saturated LLM: generating class is [XY]:
88
RatioOddsNote
where
XYij
j
XYij
i
XYij
j
Yj
i
Xi
XYij
Yj
Xiij
:
0
log
LLM: two variables
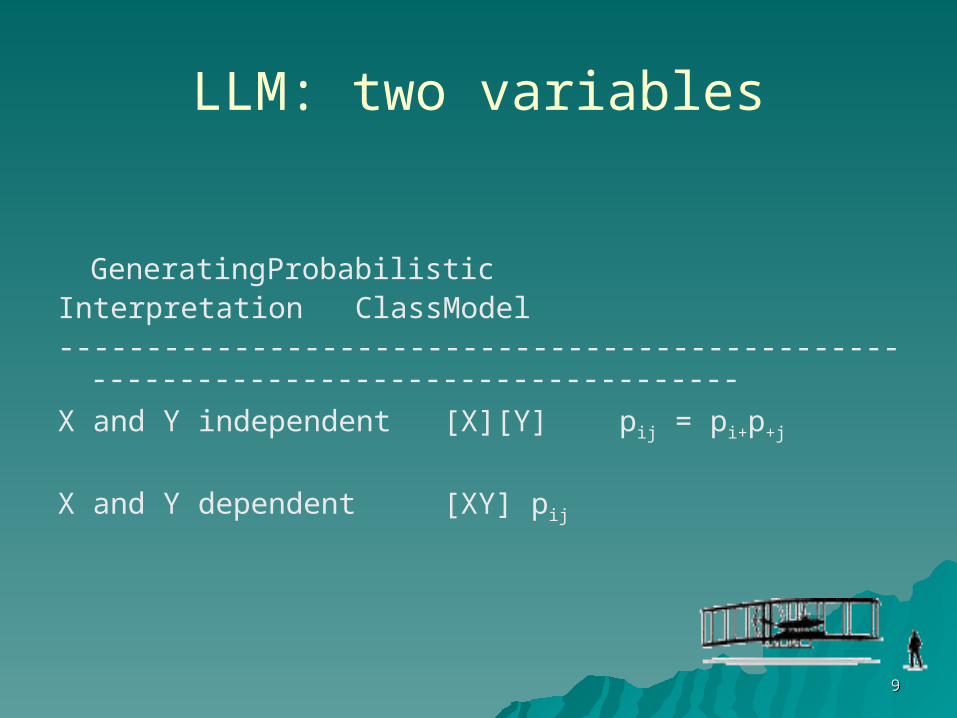
Generating ProbabilisticInterpretation Class Model-------------------------------------------------------------------------------------X and Y independent [X][Y] pij = pi+p+j
X and Y dependent [XY] pij
99
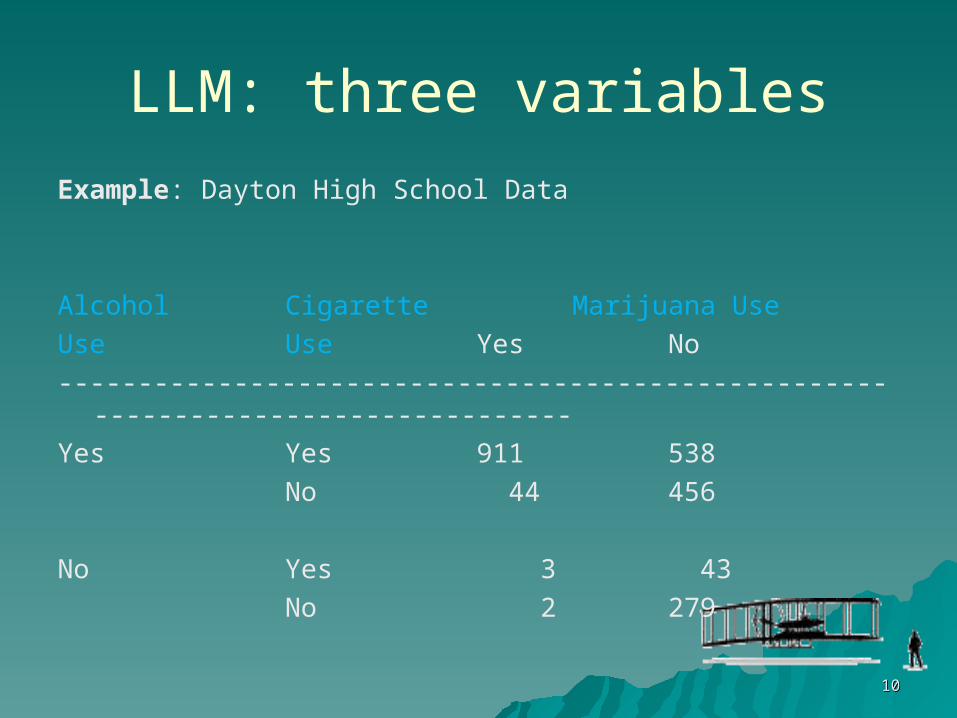
LLM: three variablesExample: Dayton High School Data
Alcohol Cigarette Marijuana UseUse Use Yes No----------------------------------------------------------------------------------Yes Yes 911 538
No 44 456
No Yes 3 43No 2 279
1010
11111111
LLM: three variables
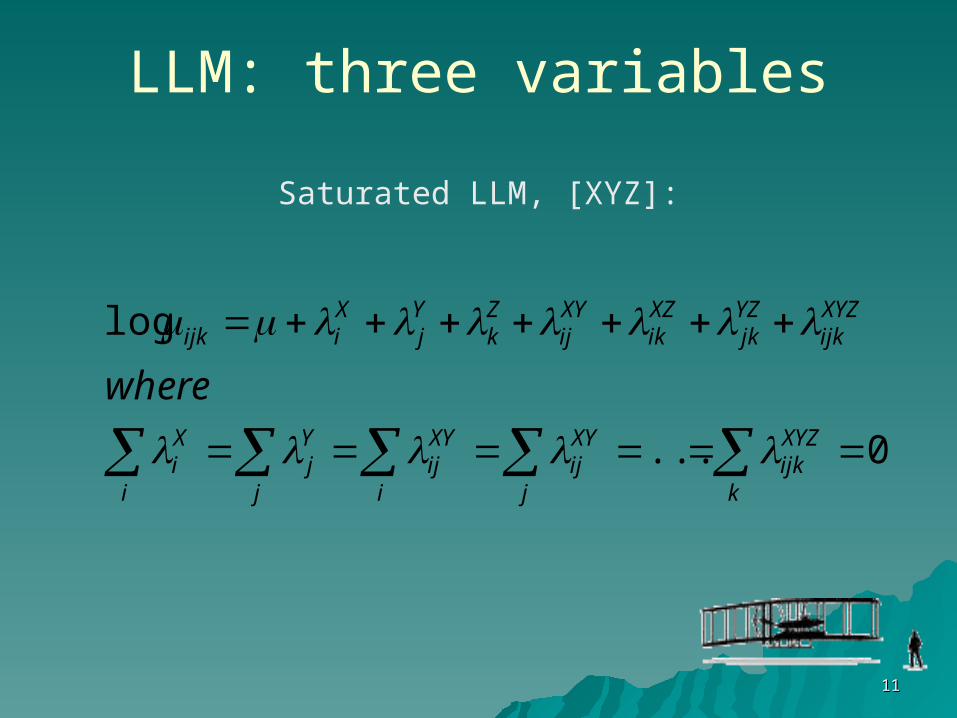
Saturated LLM, [XYZ]:
0...
log
k
XYZijk
j
XYij
i
XYij
j
Yj
i
Xi
XYZijk
YZjk
XZik
XYij
Zk
Yj
Xiijk
where
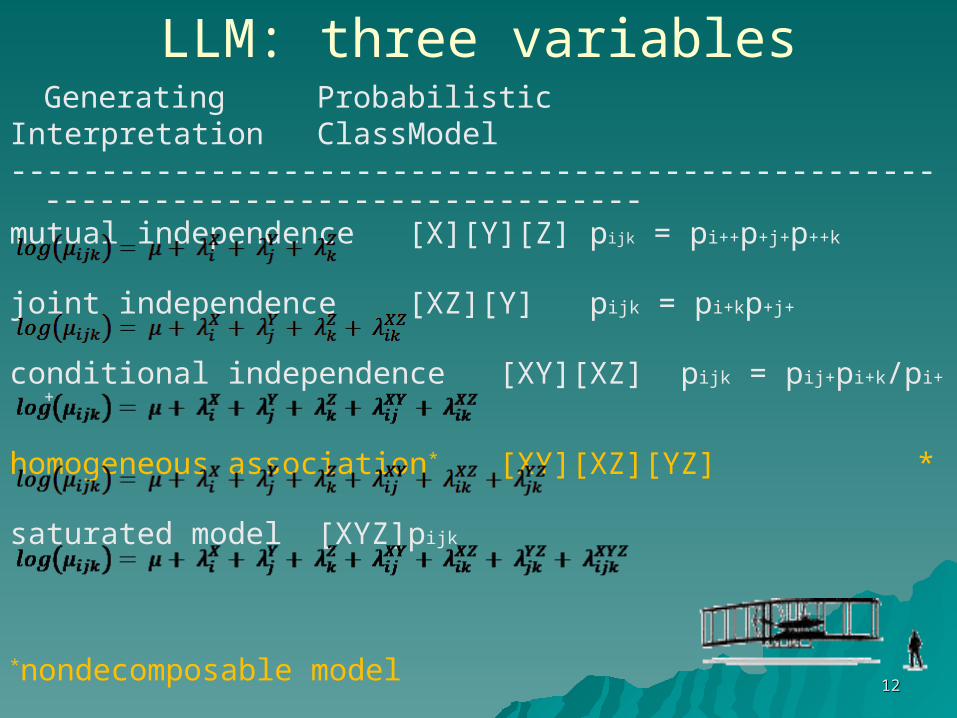
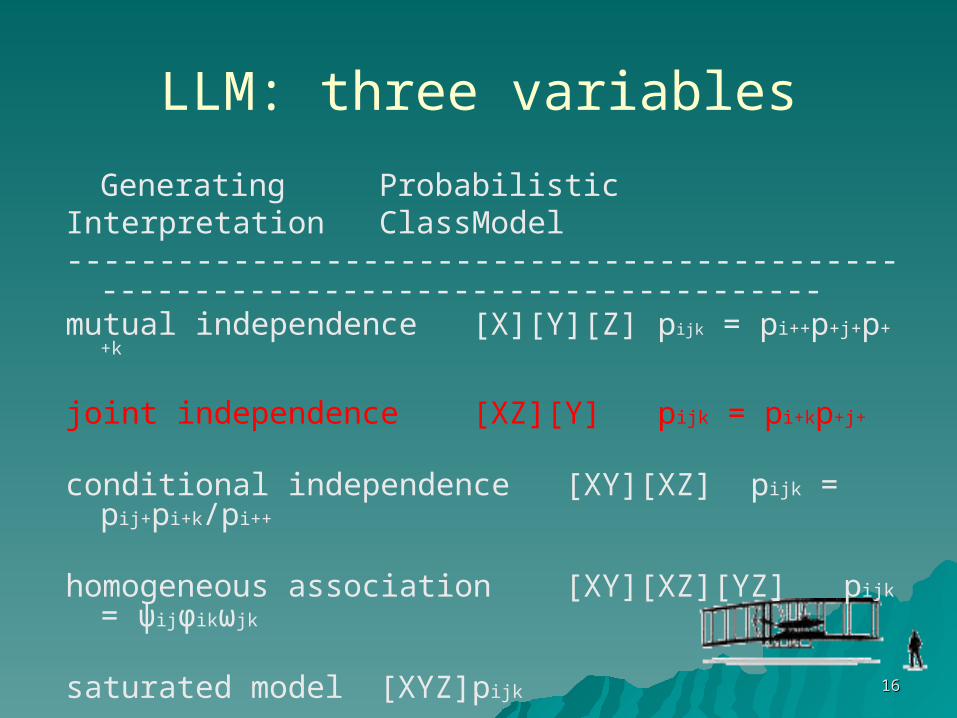
LLM: three variablesGenerating Probabilistic
Interpretation Class Model------------------------------------------------------------------------------------mutual independence [X][Y][Z] pijk = pi++p+j+p++k
joint independence [XZ][Y] pijk = pi+kp+j+
conditional independence [XY][XZ] pijk = pij+pi+k/pi++
homogeneous association* [XY][XZ][YZ] *
saturated model [XYZ] pijk
*nondecomposable model1212
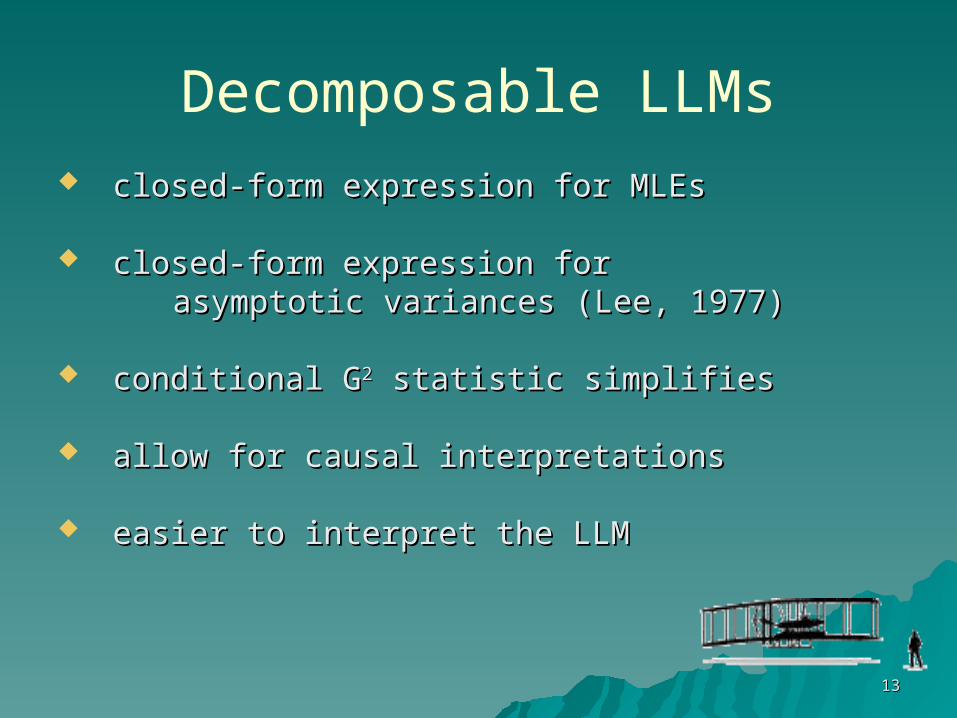
Decomposable LLMs closed-form expression for MLEsclosed-form expression for MLEs
closed-form expression for closed-form expression for asymptotic variances (Lee, 1977)asymptotic variances (Lee, 1977)
conditional Gconditional G22 statistic simplifies statistic simplifies
allow for causal interpretationsallow for causal interpretations
easier to interpret the LLM easier to interpret the LLM
1313
1414
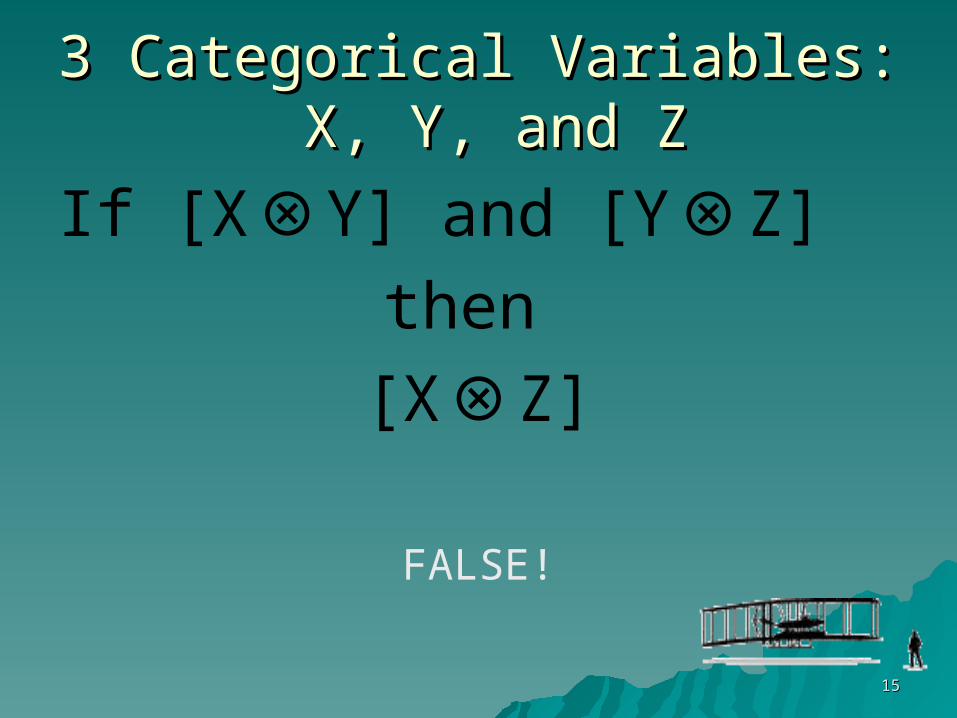
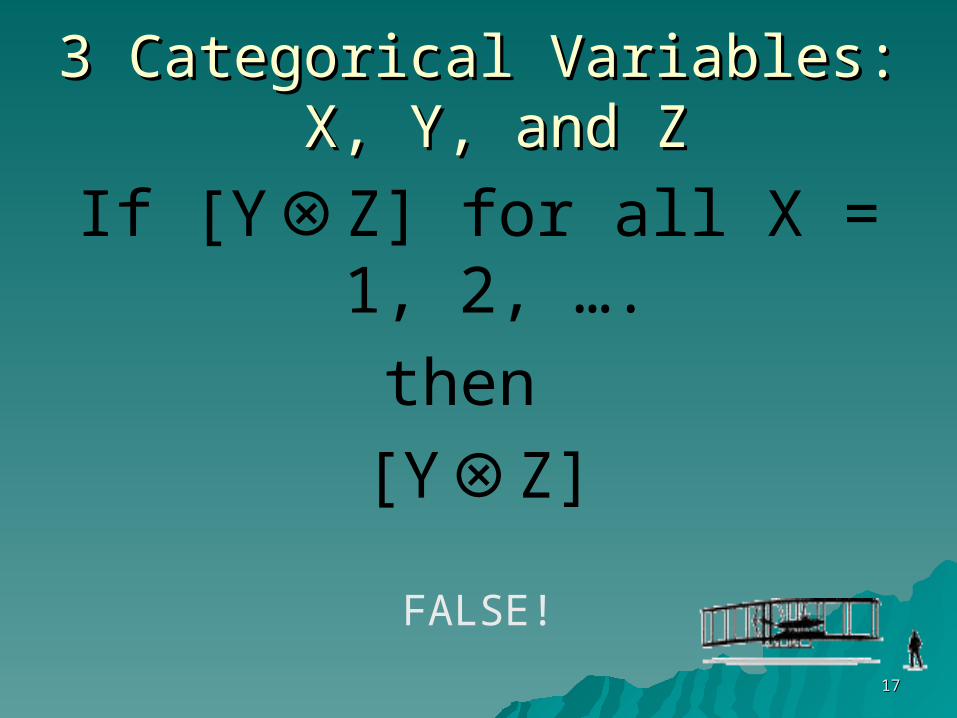
3 Categorical Variables: X, Y, and Z3 Categorical Variables: X, Y, and Z
If [X Y] and [Y Z] ⊗ ⊗then [X Z]⊗
FALSE!
1515
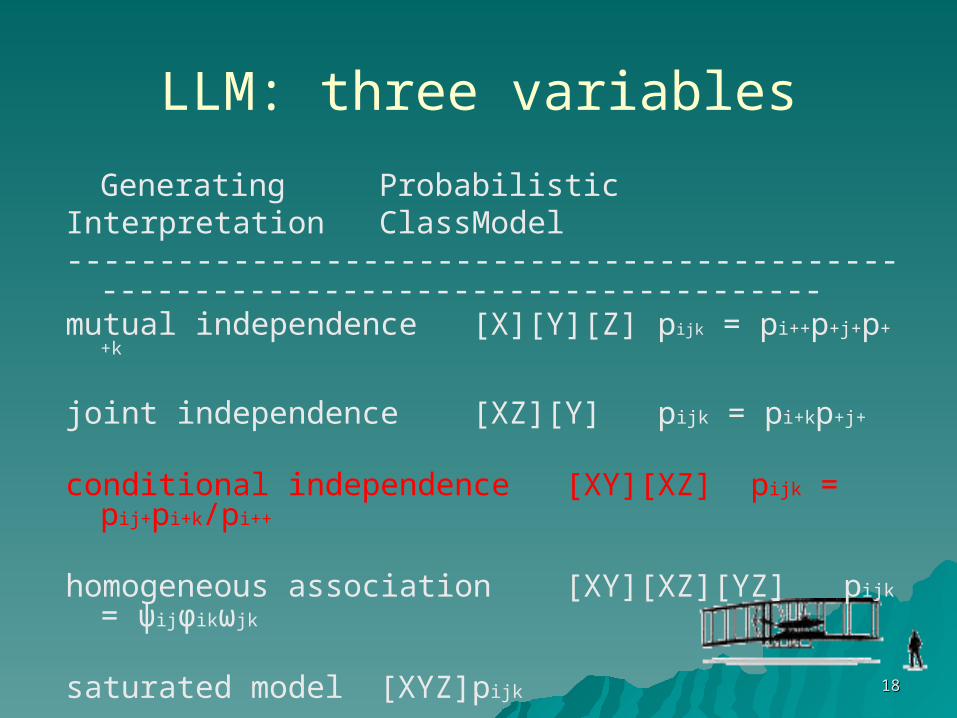
LLM: three variables
Generating ProbabilisticInterpretation Class Model------------------------------------------------------------------------------------mutual independence [X][Y][Z] pijk = pi++p+j+p++k
joint independence [XZ][Y] pijk = pi+kp+j+
conditional independence [XY][XZ] pijk = pij+pi+k/pi++
homogeneous association [XY][XZ][YZ] pijk = ψijφikωjk
saturated model [XYZ] pijk
1616
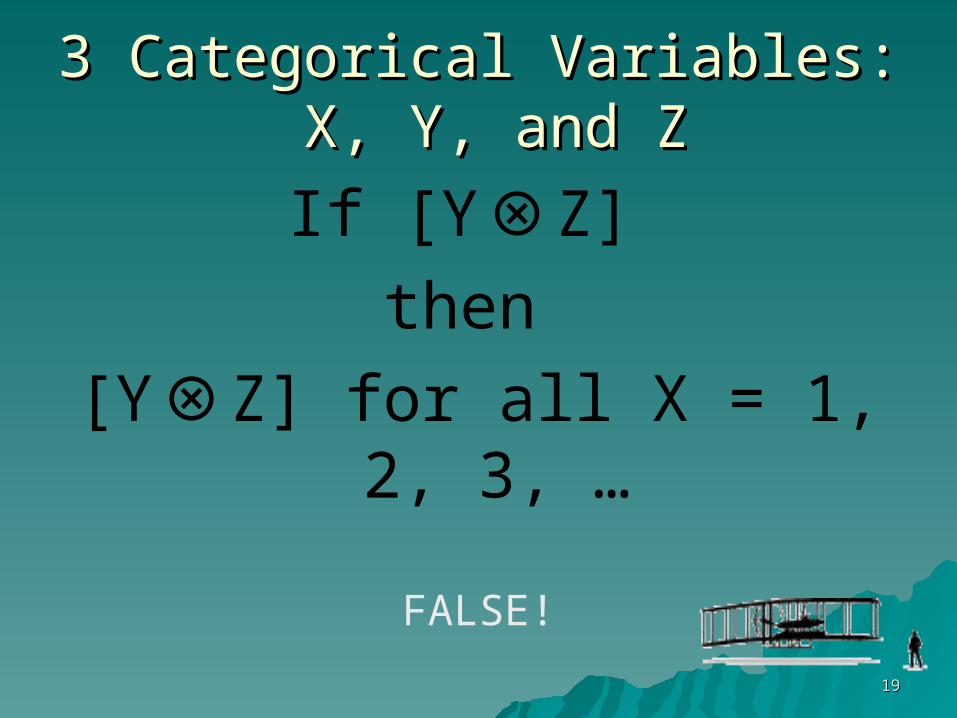
3 Categorical Variables: X, Y, and Z3 Categorical Variables: X, Y, and Z
If [Y Z] for all X = 1, 2, ….⊗then [Y Z]⊗
FALSE!
1717
LLM: three variables
Generating ProbabilisticInterpretation Class Model------------------------------------------------------------------------------------mutual independence [X][Y][Z] pijk = pi++p+j+p++k
joint independence [XZ][Y] pijk = pi+kp+j+
conditional independence [XY][XZ] pijk = pij+pi+k/pi++
homogeneous association [XY][XZ][YZ] pijk = ψijφikωjk
saturated model [XYZ] pijk
1818
3 Categorical Variables: X, Y, and Z3 Categorical Variables: X, Y, and Z
If [Y Z] ⊗then
[Y Z] for all X = 1, 2, 3, …⊗
FALSE!
1919

Which Treatment is Better?Which Treatment is Better? TRIAL 1 TRIAL 2 CURED? CURED?Yes No Total Yes No Total
---------------------------------------------- ----------------------------------------A 40 (.20) 160 200 85 (.85) 15 100
TREATMENTB 30 (.15) 170 200 300 (.75) 100 400
Combine TRIALS 1 and 2: CURED?Yes No Total
-----------------------------------------------A 125 (.42) 175 300
TREATMENTB 330 (.55) 270 600
“Ask Marilyn”, PARADE section, DDN, pages 6-7, April 28, 1996
2020
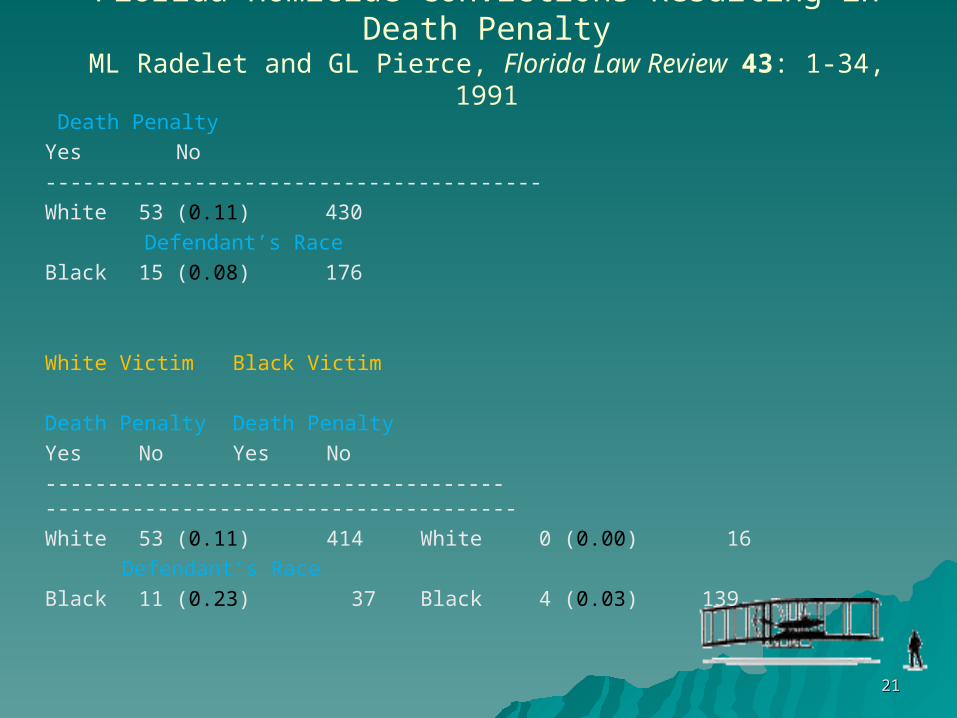
Florida Homicide Convictions Resulting in Death PenaltyML Radelet and GL Pierce, Florida Law Review 43: 1-34, 1991
Death PenaltyYes No
----------------------------------------White 53 (0.11) 430
Defendant’s RaceBlack 15 (0.08) 176
White Victim Black Victim
Death Penalty Death PenaltyYes No Yes No
------------------------------------- --------------------------------------White 53 (0.11) 414 White 0 (0.00) 16
Defendant’s RaceBlack 11 (0.23) 37 Black 4 (0.03) 139
2121
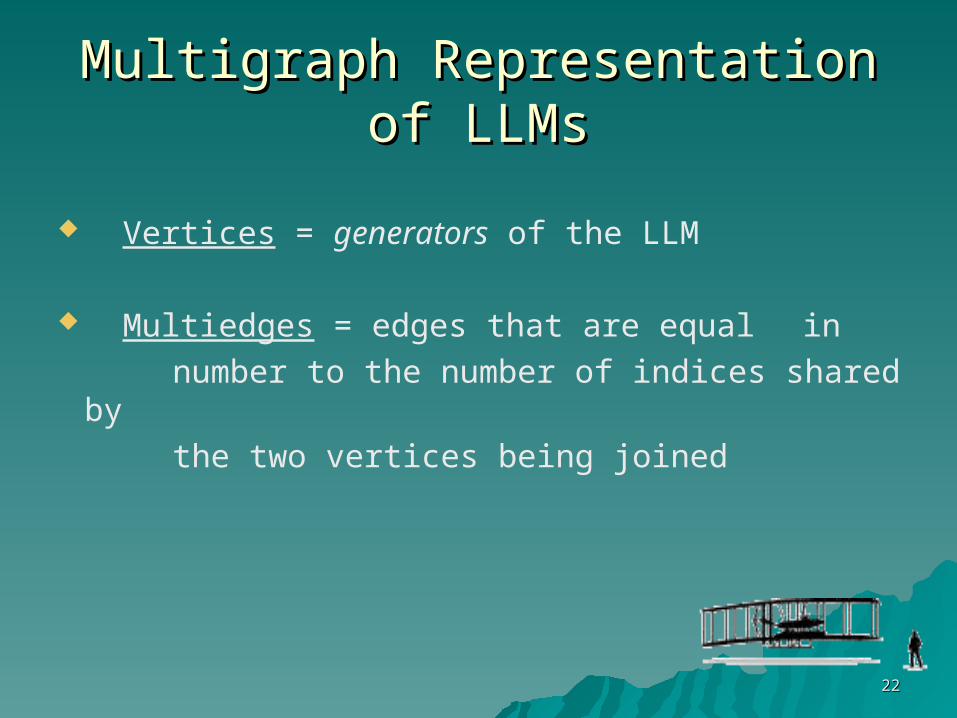
Multigraph Representation of LLMsMultigraph Representation of LLMs
Vertices = generators of the LLM
Multiedges = edges that are equal in number to the number of indices shared by the two vertices being joined
2222
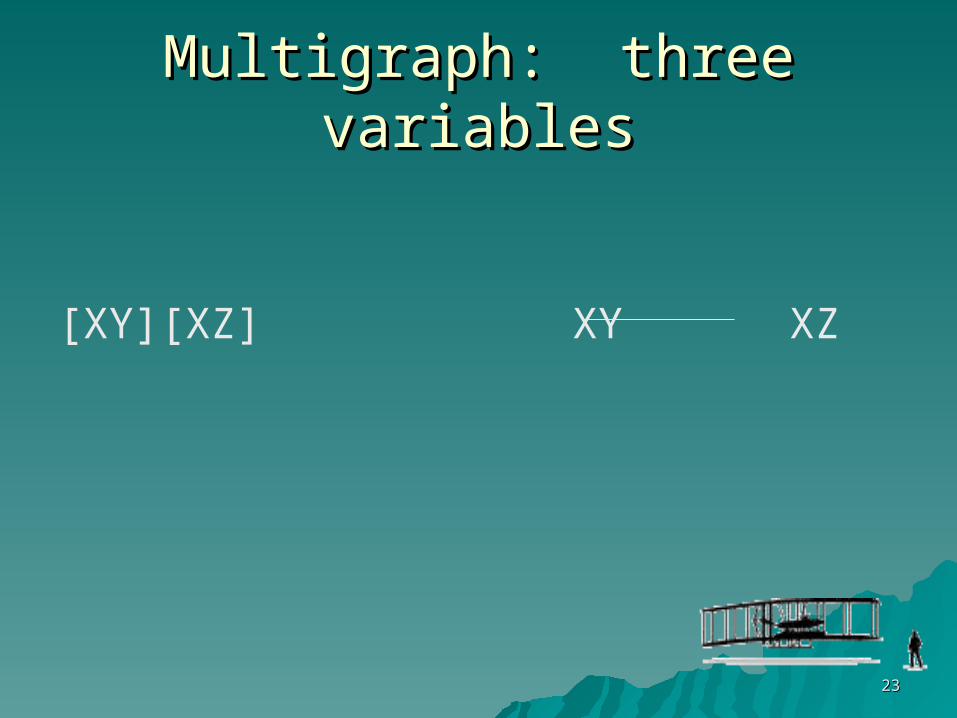
Multigraph: three variablesMultigraph: three variables
[XY][XZ] XY XZ
2323
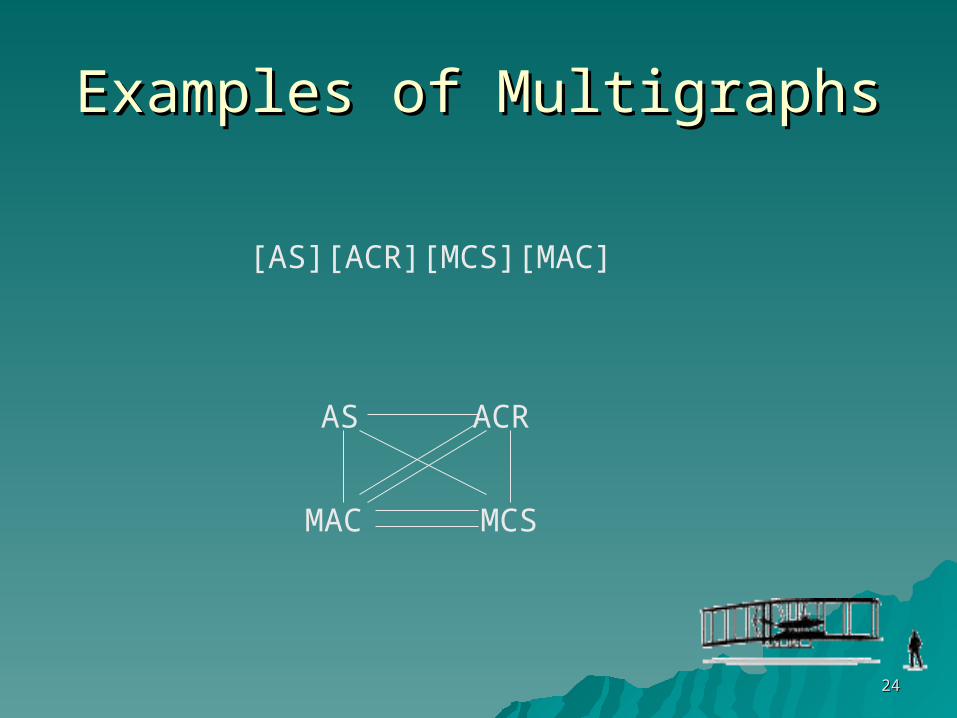
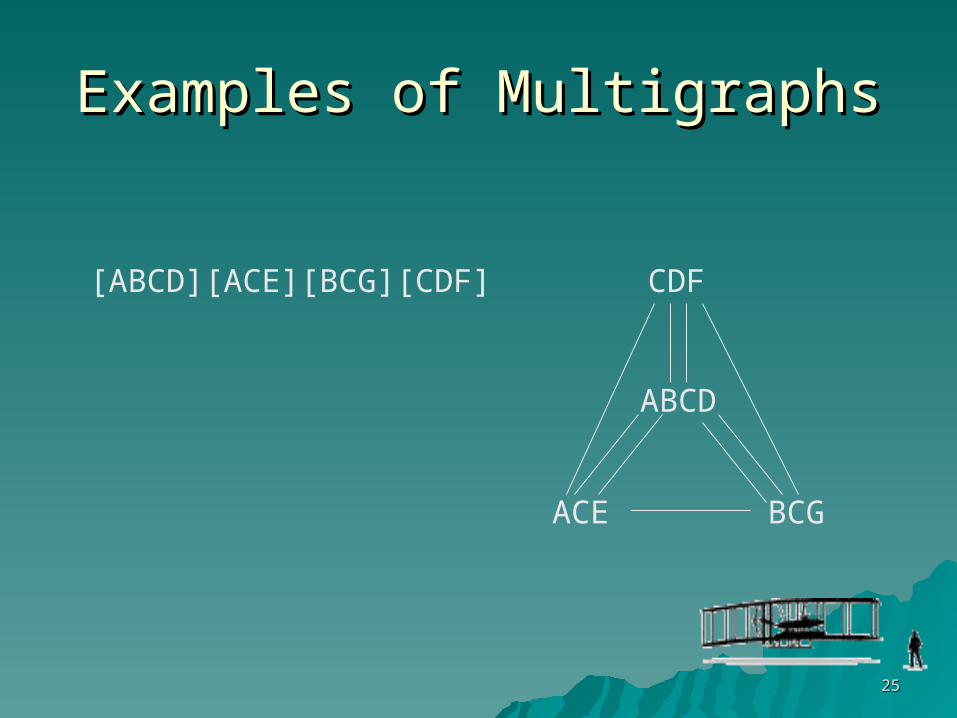
Examples of MultigraphsExamples of Multigraphs
2424
[AS][ACR][MCS][MAC]
AS ACR
MAC MCS
Examples of MultigraphsExamples of Multigraphs
2525
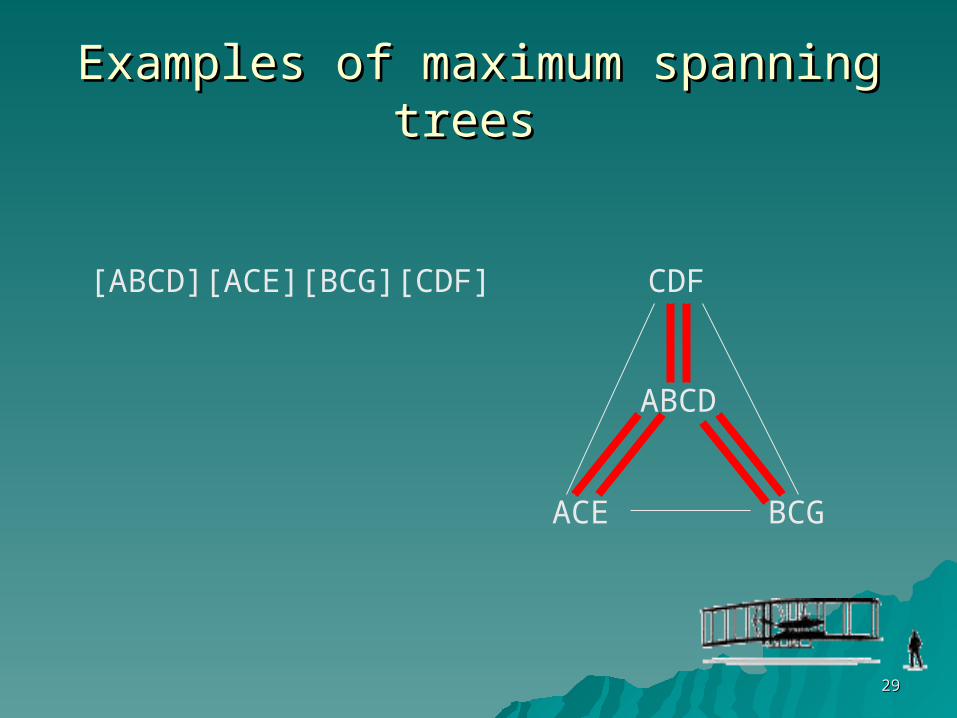
[ABCD][ACE][BCG][CDF]
ABCD
CDF
ACE BCG
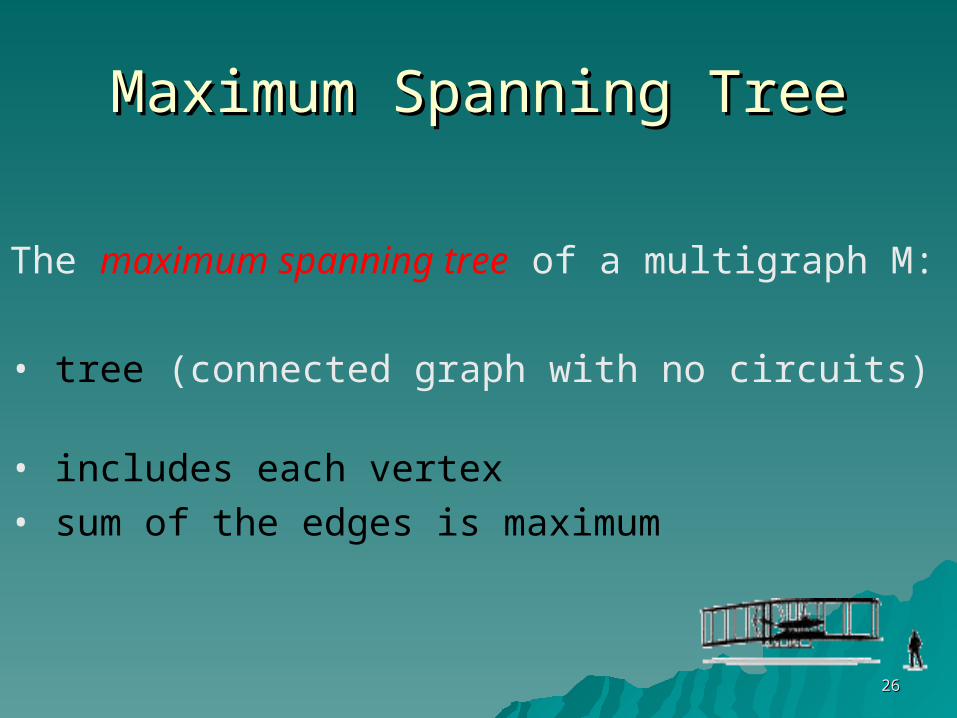
Maximum Spanning TreeMaximum Spanning Tree
The maximum spanning tree of a multigraph M: • tree (connected graph with no circuits) • includes each vertex • sum of the edges is maximum
2626
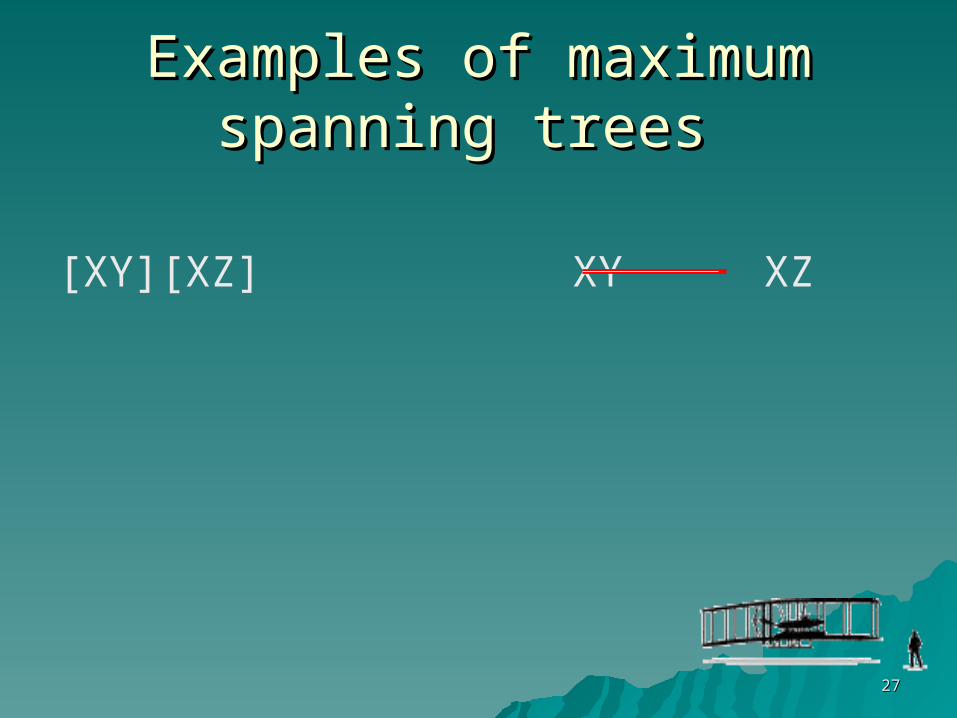
Examples of maximum spanning trees Examples of maximum spanning trees
2727
[XY][XZ] XY XZ
Examples of maximum spanning trees Examples of maximum spanning trees
2828
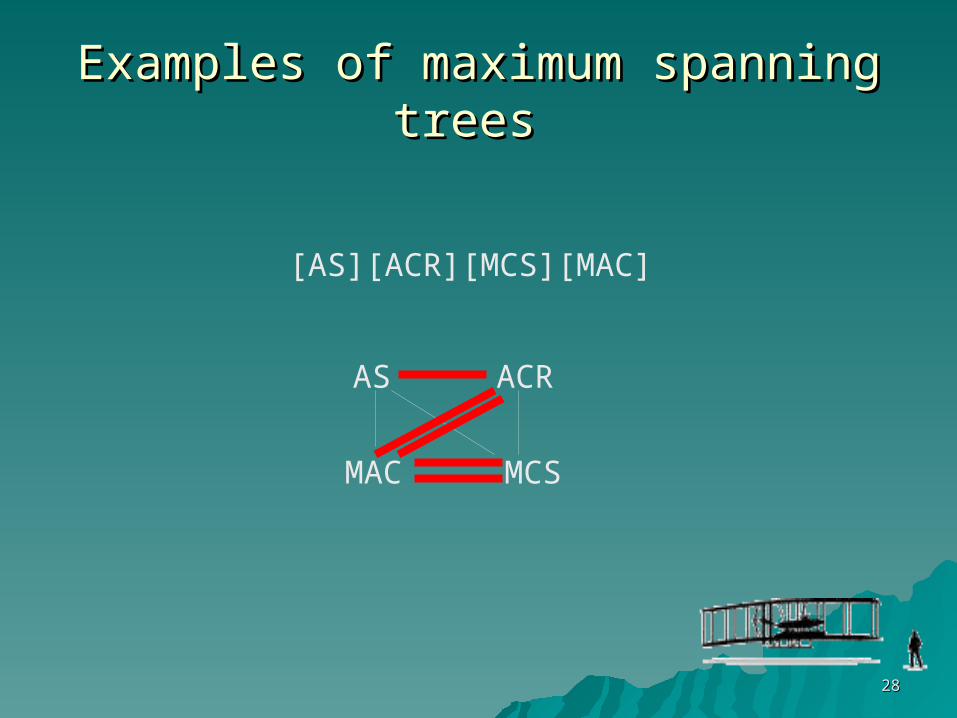
[AS][ACR][MCS][MAC]
AS ACR
MAC MCS
Examples of maximum spanning trees Examples of maximum spanning trees
2929
[ABCD][ACE][BCG][CDF]
ABCD
CDF
ACE BCG
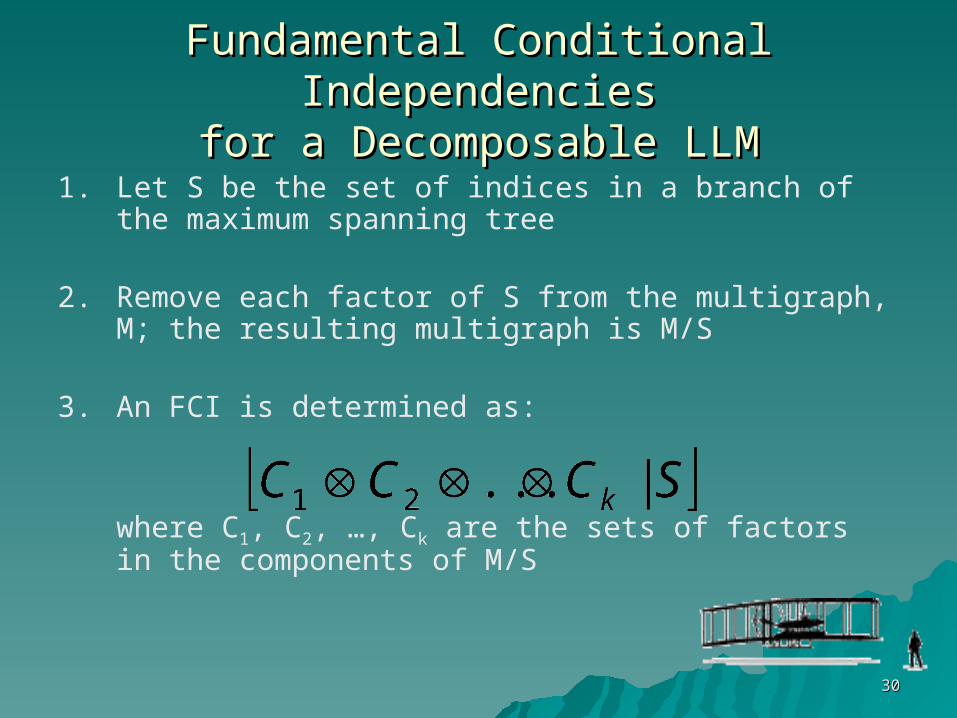
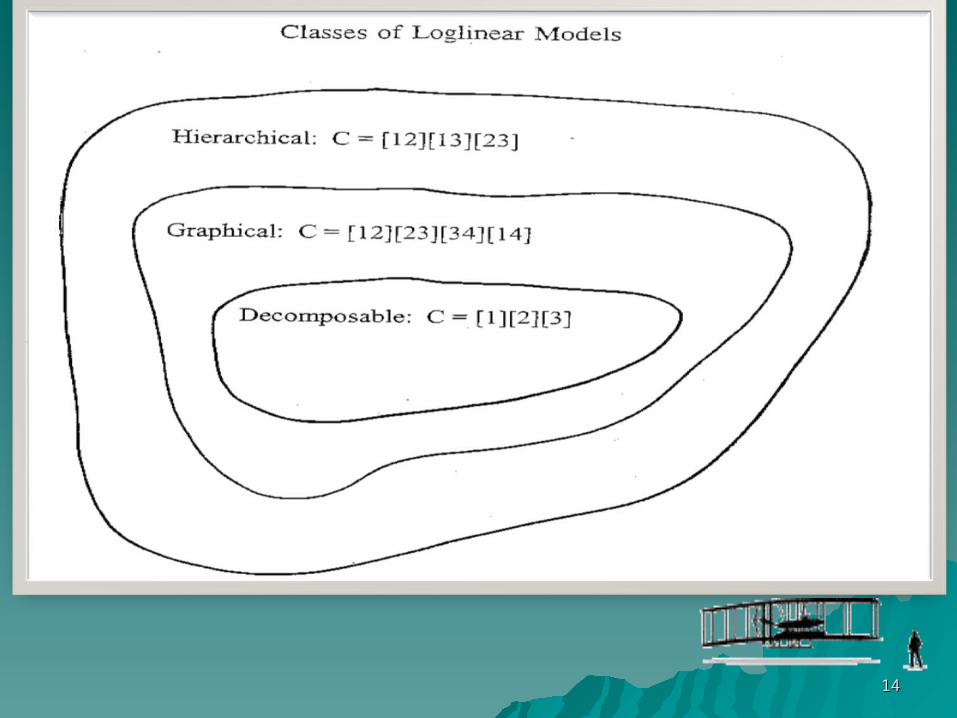
Fundamental Conditional IndependenciesFundamental Conditional Independenciesfor a Decomposable LLMfor a Decomposable LLM
1. Let S be the set of indices in a branch of the maximum spanning tree
2. Remove each factor of S from the multigraph, M; the resulting multigraph is M/S
3. An FCI is determined as:
where C1, C2, …, Ck are the sets of factors in the components of M/S
3030
3131
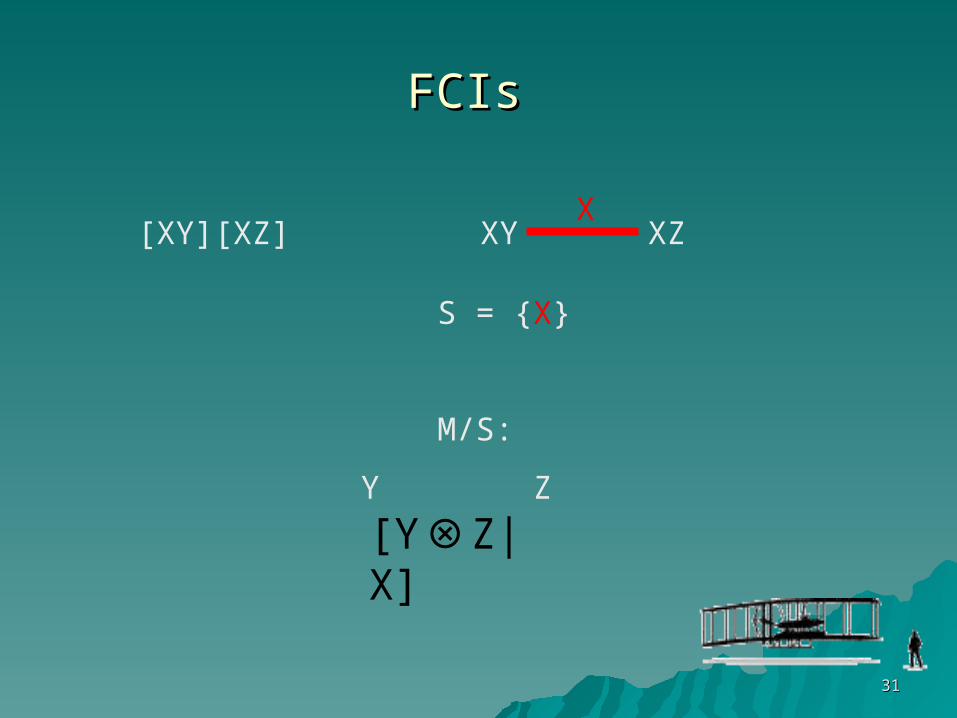
FCIs FCIs
[XY][XZ] XY XZX
S = {X}
M/S:
Y Z
[Y⊗Z|X]
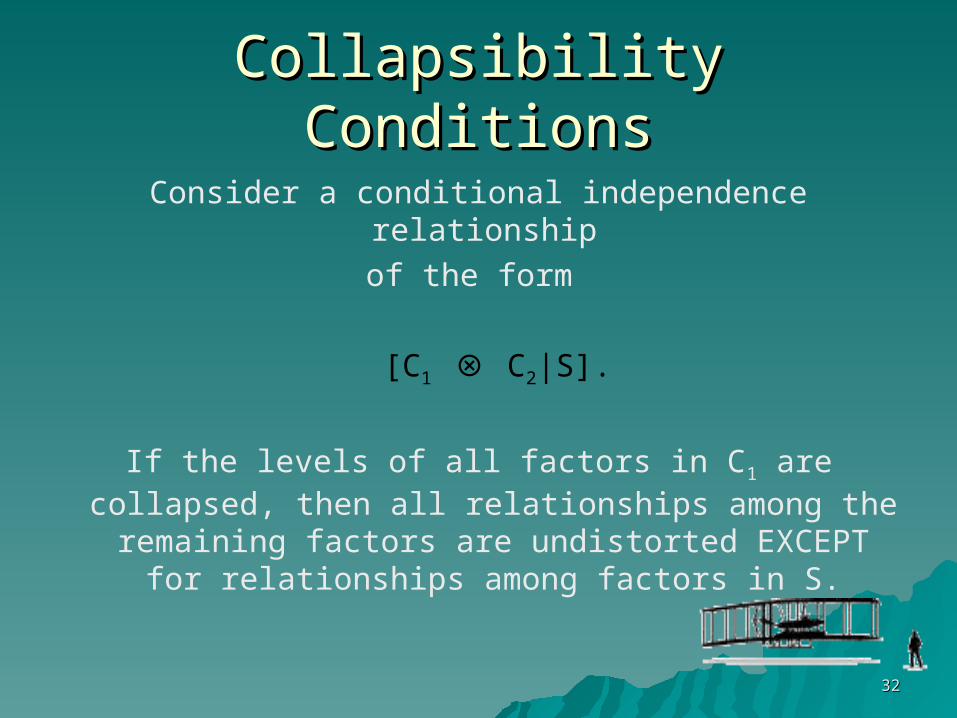
Collapsibility ConditionsCollapsibility Conditions
Consider a conditional independence relationship of the form
[C1 C⊗ 2|S].
If the levels of all factors in C1 are collapsed, then all relationships among the remaining factors are
undistorted EXCEPT for relationships among factors in S.
3232

3333
FCIs FCIs
[XY][XZ] XY XZX
S = {X}
M/S:
Y Z
[Y⊗Z|X]
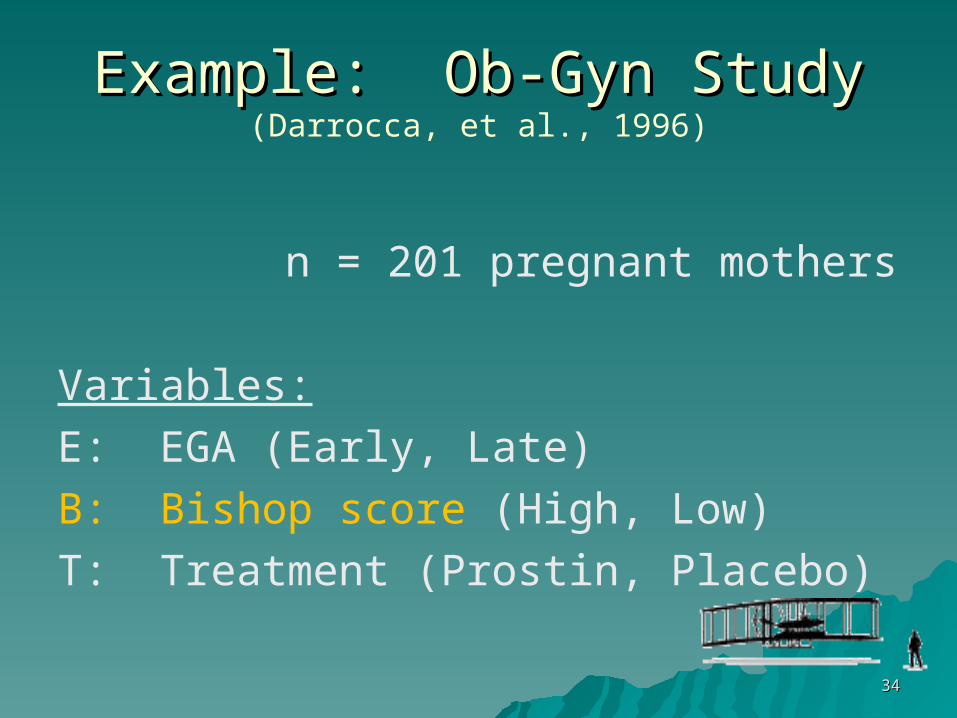
Example: Ob-Gyn StudyExample: Ob-Gyn Study(Darrocca, et al., 1996)
n = 201 pregnant mothers
Variables: E: EGA (Early, Late)B: Bishop score (High, Low)T: Treatment (Prostin, Placebo)
3434
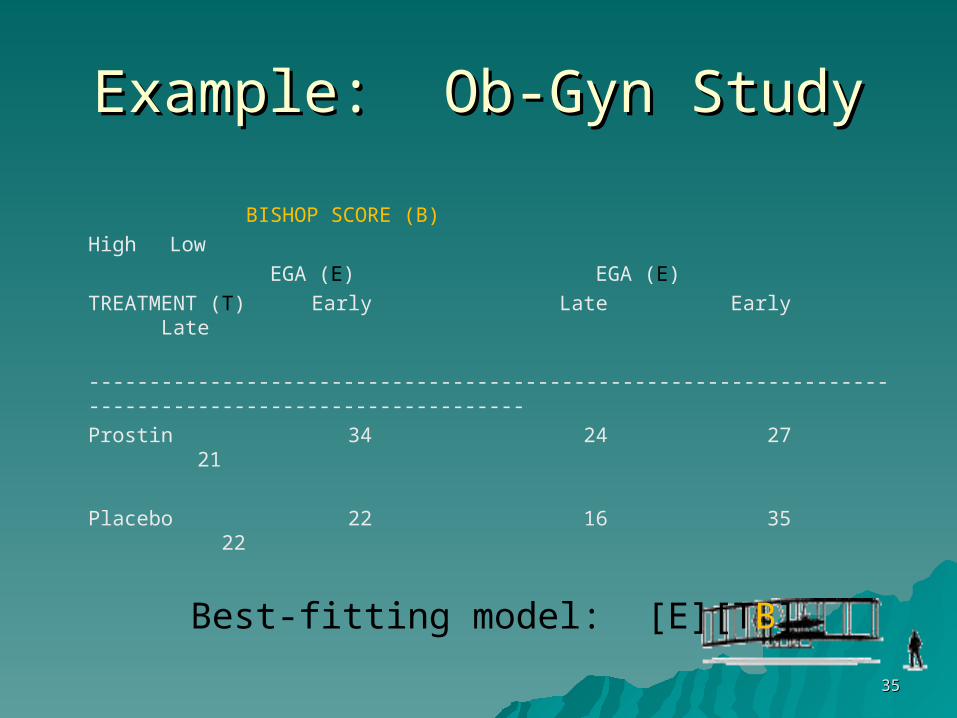
Example: Ob-Gyn StudyExample: Ob-Gyn Study
BISHOP SCORE (B)High Low
EGA (E) EGA (E)TREATMENT (T) Early Late Early Late
------------------------------------------------------------------------------------------------------Prostin 34 24 27 21
Placebo 22 16 35 22
Best-fitting model: [E][TB]
3535
Example: Ob-Gyn StudyExample: Ob-Gyn Study
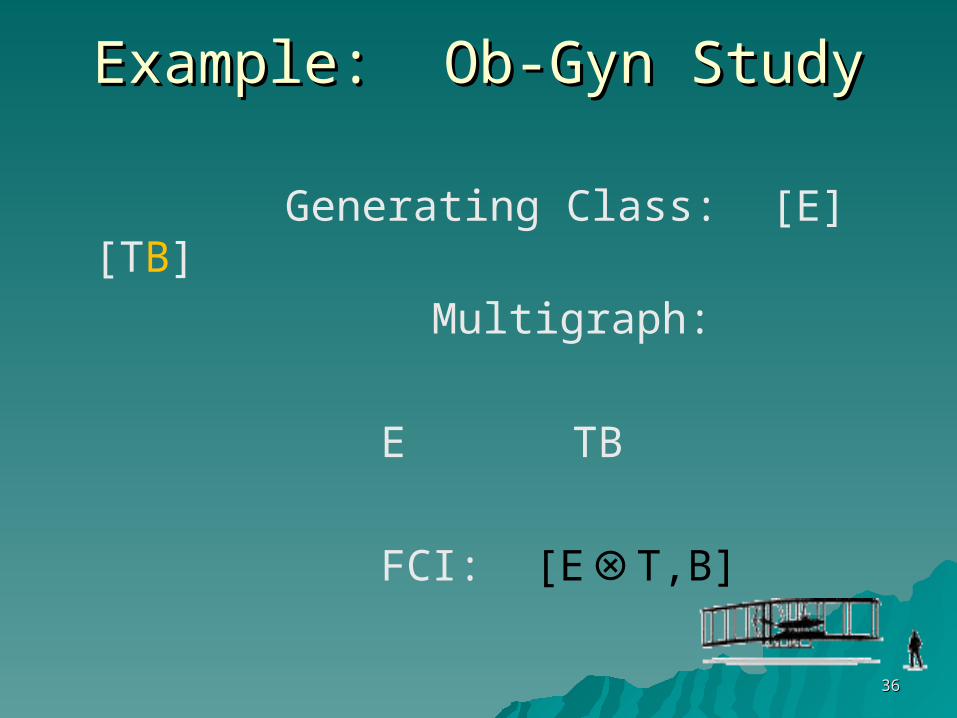
Generating Class: [E][TB]
Multigraph:
E TB
FCI: [E T,B]⊗
3636
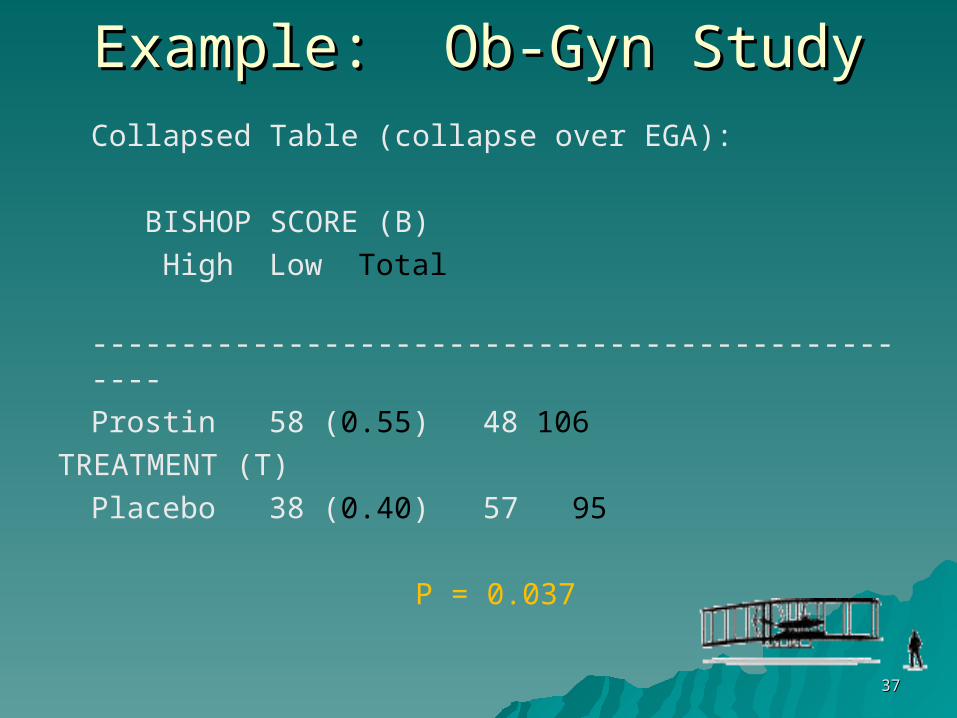
Example: Ob-Gyn StudyExample: Ob-Gyn StudyCollapsed Table (collapse over EGA):
BISHOP SCORE (B) High Low Total
-------------------------------------------------Prostin 58 (0.55) 48 106
TREATMENT (T)Placebo 38 (0.40) 57 95
P = 0.037
3737
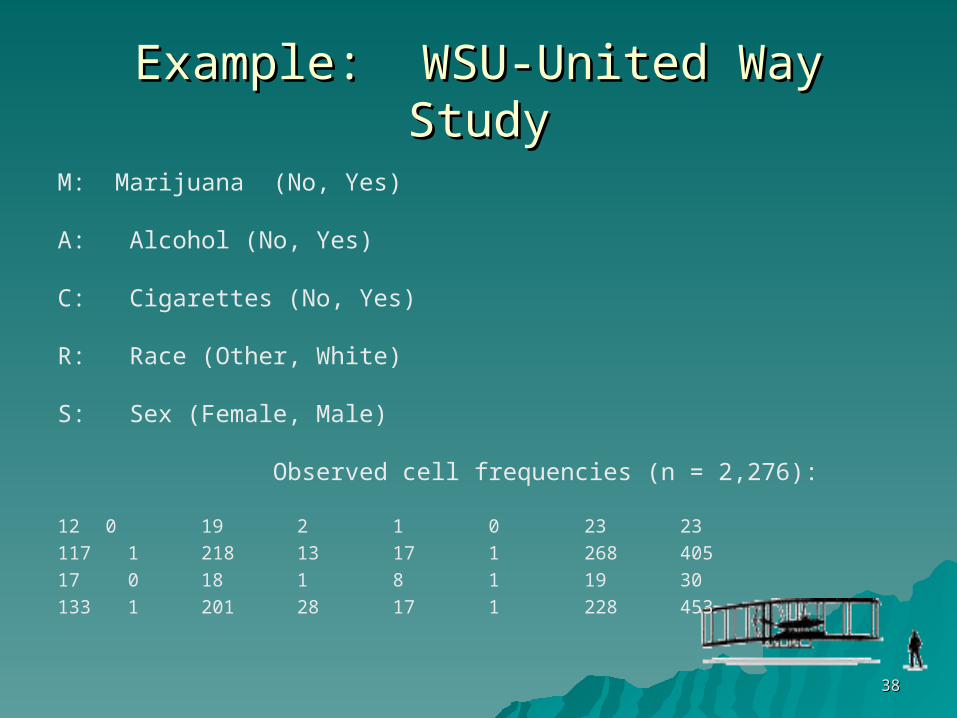
Example: WSU-United Way StudyExample: WSU-United Way Study
M: Marijuana (No, Yes)
A: Alcohol (No, Yes)
C: Cigarettes (No, Yes)
R: Race (Other, White)
S: Sex (Female, Male)
Observed cell frequencies (n = 2,276):
12 0 19 2 1 0 23 23117 1 218 13 17 1 268 40517 0 18 1 8 1 19 30133 1 201 28 17 1 228 453
3838

Example: WSU-United Way StudyExample: WSU-United Way Study
Generating class: [ACE][MAC][MCG]
Multigraph, M:
ACE
MCG MAC
3939

Example: WSU-United Way StudyExample: WSU-United Way StudyM: S = {A,C}
ACE M/S: E A C MG M
MCG MAC [E M,G|⊗ A,C]
A = Alcohol C = Cigarette E = EthnicG = Gender M = Marijuana
4040

Example: WSU PASS ProgramExample: WSU PASS Program
“Preparing for Academic Success”
GPA below 2.0 at the end of first quarter
4141
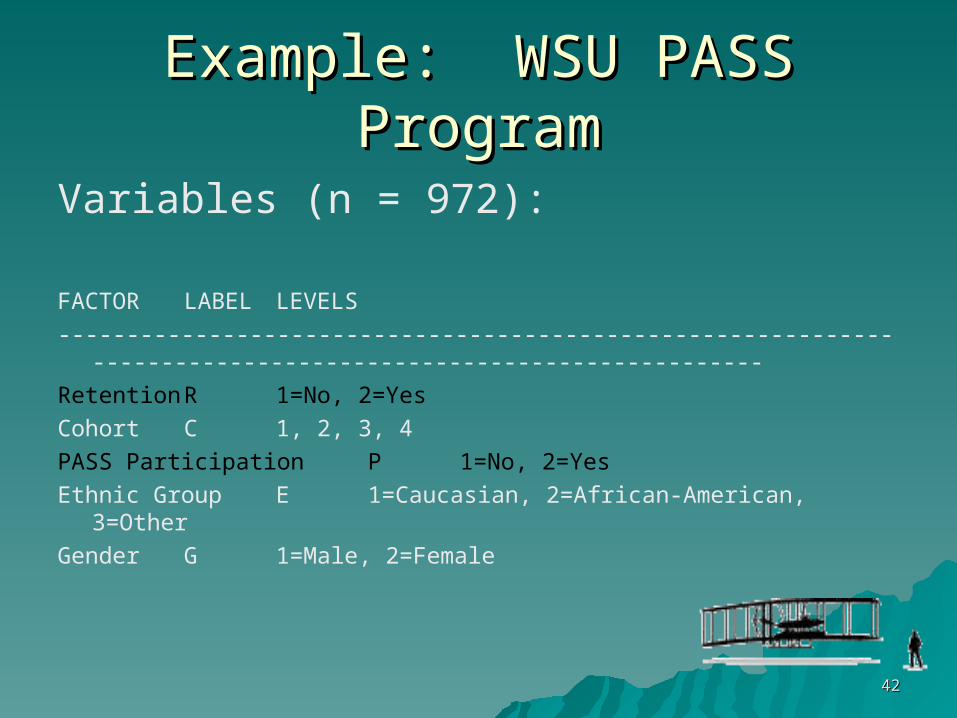
Example: WSU PASS ProgramExample: WSU PASS Program
Variables (n = 972):
FACTOR LABEL LEVELS--------------------------------------------------------------------------------------------------------------Retention R 1=No, 2=YesCohort C 1, 2, 3, 4PASS Participation P 1=No, 2=YesEthnic Group E 1=Caucasian, 2=African-American, 3=OtherGender G 1=Male, 2=Female
4242
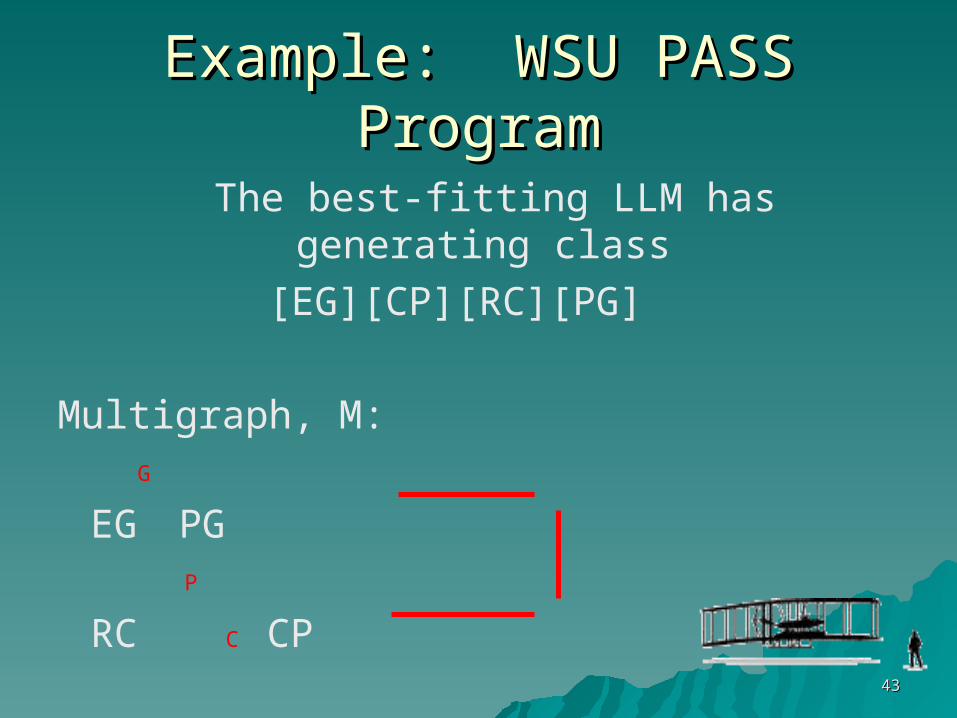
Example: WSU PASS ProgramExample: WSU PASS Program
The best-fitting LLM has generating class [EG][CP][RC][PG]
Multigraph, M: G
EG PG P
RC C CP 4343
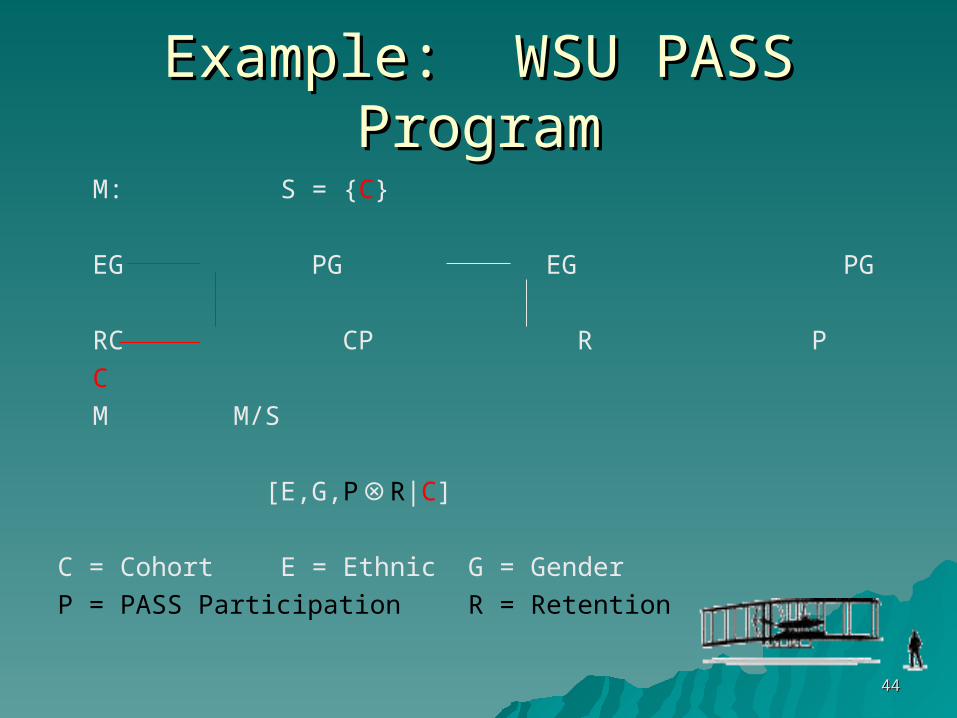
Example: WSU PASS ProgramExample: WSU PASS ProgramM: S = {C}
EG PG EG PG
RC CP R PC M M/S
[E,G,P⊗R|C]
C = Cohort E = Ethnic G = GenderP = PASS Participation R = Retention
4444
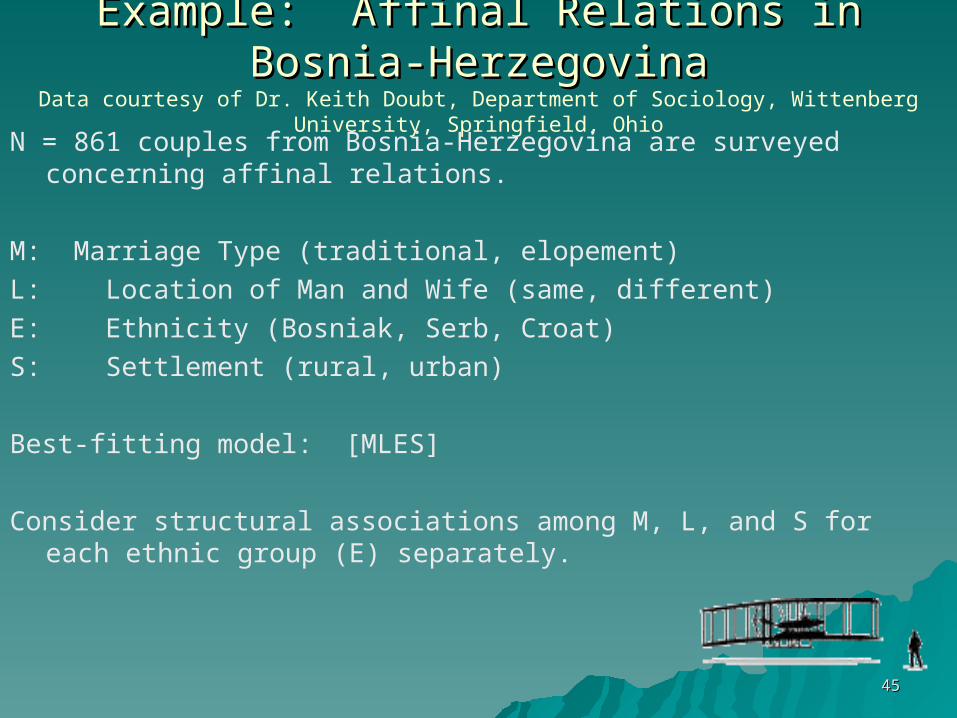
Example: Affinal Relations in Bosnia-HerzegovinaExample: Affinal Relations in Bosnia-HerzegovinaData courtesy of Dr. Keith Doubt, Department of Sociology, Wittenberg University, Springfield, Ohio
N = 861 couples from Bosnia-Herzegovina are surveyed concerning affinal relations.
M: Marriage Type (traditional, elopement)L: Location of Man and Wife (same, different)E: Ethnicity (Bosniak, Serb, Croat)S: Settlement (rural, urban)
Best-fitting model: [MLES]
Consider structural associations among M, L, and S for each ethnic group (E) separately.
4545
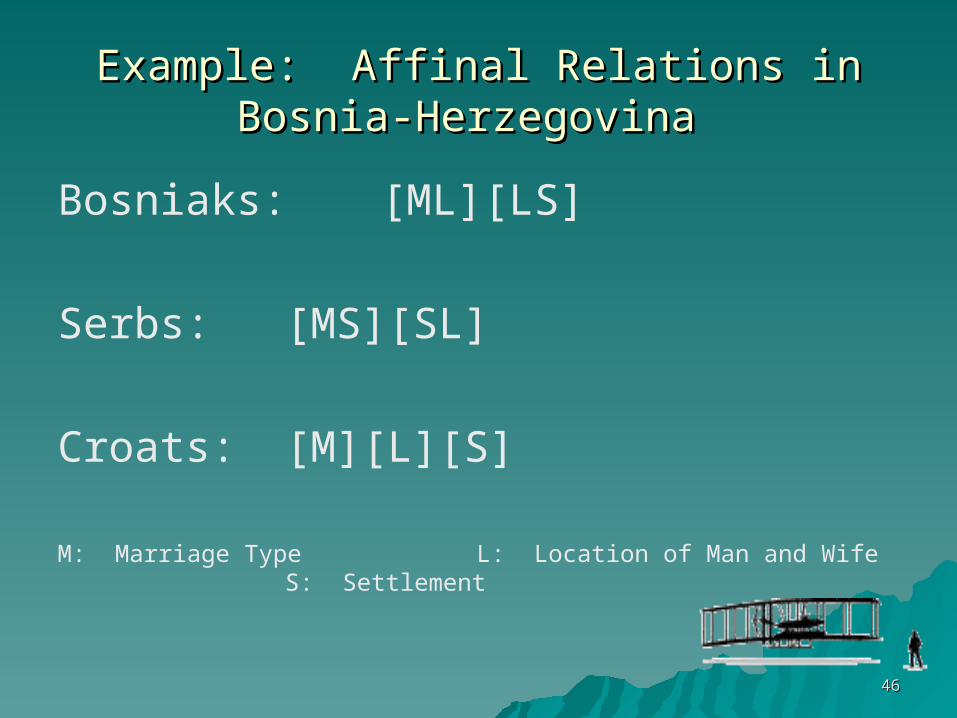
Example: Affinal Relations in Bosnia-Herzegovina Example: Affinal Relations in Bosnia-Herzegovina
Bosniaks: [ML][LS]
Serbs: [MS][SL]
Croats: [M][L][S]
M: Marriage Type L: Location of Man and Wife S: Settlement
4646
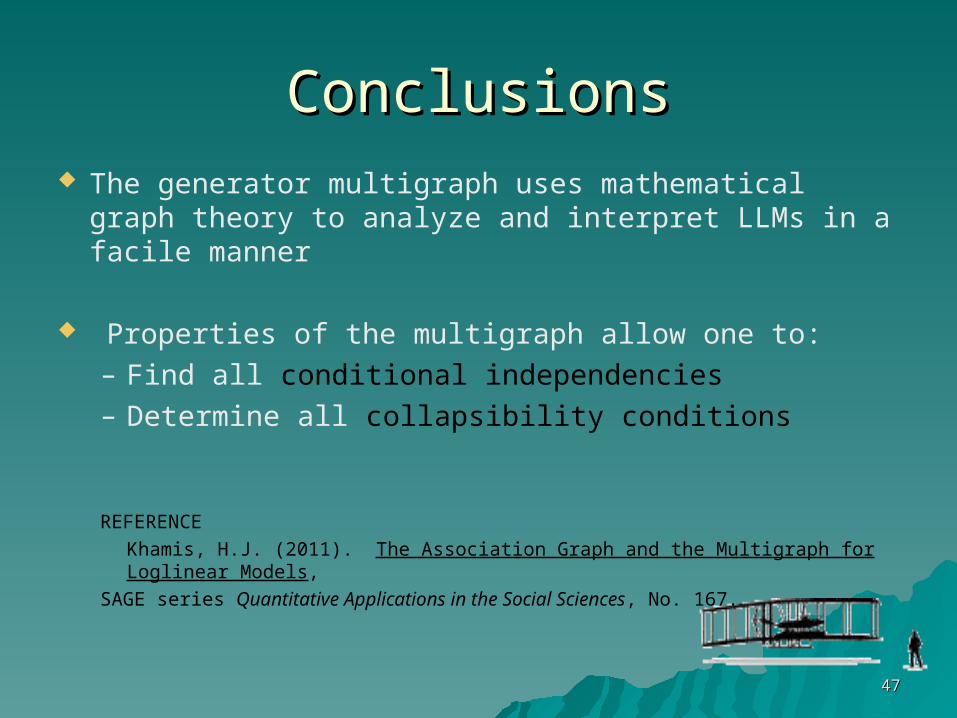
ConclusionsConclusions The generator multigraph uses mathematical graph theory to
analyze and interpret LLMs in a facile manner
Properties of the multigraph allow one to:– Find all conditional independencies – Determine all collapsibility conditions
REFERENCEKhamis, H.J. (2011). The Association Graph and the Multigraph for Loglinear Models,
SAGE series Quantitative Applications in the Social Sciences, No. 167.
4747

Without data, you’re just one more person with an
opinion
4848


![Loglinear and Logit Models for Contingency Tableseuclid.psych.yorku.ca/www/psy6136/ClassOnly/VCDR/chapter08.pdf · 348 [11-26-2014] 8 Loglinear and Logit Models for Contingency Tables](https://img.pdfslide.us/doc/110x75/5c9ecdc888c993502d8c2ceb/loglinear-and-logit-models-for-contingency-348-11-26-2014-8-loglinear-and.jpg)