Embed Size (px)
Citation preview
The Molecular Signature of Selection UnderlyingHuman Adaptations
Eugene E. Harris1,2* and Diogo Meyer2
1Department of Biological Sciences and Geology, Queensborough Community College,City University of New York, New York2Departamento de Genetica e Biologia Evolutiva, Universidade de Sao Paulo, Brasil
KEY WORDS positive selection; lactase persistence; bitter-taste; skin color; Duffy; naturalselection
ABSTRACT In the last decade, advances in humanpopulation genetics and comparative genomics have re-sulted in important contributions to our understanding ofhuman genetic diversity and genetic adaptation. For thefirst time, we are able to reliably detect the signature ofnatural selection from patterns of DNA polymorphism.Identifying the effects of natural selection in this way pro-vides a crucial piece of evidence needed to support hypoth-eses of human adaptation. This review provides a detaileddescription of the theory and analytical approaches usedto detect signatures of natural selection in the human ge-nome. We discuss these methods in relation to four classichuman traits—skin color, the Duffy blood group, bitter-taste sensation, and lactase persistence. By highlightingthese four traits we are able to discuss the ways in whichanalyses of DNA polymorphism can lead to inferencesregarding past histories of selection. Specifically, we caninfer the importance of specific regimes of selection (i.e.directional selection, balancing selection, and purifyingselection) in the evolution of a trait because these differ-ent types of selection leave different patterns of DNA poly-morphism. In addition, we demonstrate how these typesof data can be used to estimate the time frame in whichselection operated on a trait. As the field has advanced, a
general issue that has come to the forefront is how specificdemographic events in human history, such as populationexpansions, bottlenecks, and subdivision of populations,have also left a signature across the genome that caninterfere with our detection of the footprint of selection atparticular genes. Therefore, we discuss this general prob-lem with respect to the four traits reviewed here, anddescribe the ways in which the signature of selection canbe teased from a background signature of demographichistory. Finally, we move from a discussion of analyses ofselection motivated by a \candidate-gene" approach, inwhich a priori information led to the analysis of specificgene, to discussion of \genome-scanning" approaches thatare directed at discovering new genes that have beenunder positive selection. Such scans can be designed todetect those genes that have been positively selected inour divergence from chimpanzees, as well as those genesthat have been under selection as human populationshave migrated, differentiated, and adapted to specific geo-graphic environments. We predict that both approacheswill be applied in the future, enabling a greater insightinto human species-wide adaptations, as well as thespecific adaptations of human populations. Yrbk PhysAnthropol 49:89–130, 2006. VVC 2006 Wiley-Liss, Inc.
A major endeavor of biological anthropology is to iden-tify and understand how humans have adapted by naturalselection to their environment over evolutionary history.Human adaptation has occurred at two different temporallevels. At one level, human adaptation has occurred dur-ing the six to seven million years of time since humansdiverged from chimpanzees and prior to the differentia-tion of anatomically modern humans. Such adaptationsare what we call species-wide adaptations. In more recentevolutionary times, human populations have undergone aprocess of differentiation and have adapted to differentenvironments as they spread and occupied differentregions of the world. Such adaptations are what we callpopulation adaptations.While our focus in this paper is on human genetic adap-
tations, we do recognize the process of human adaptabil-ity. Adaptation of this sort refers to the physiological, bio-chemical, and behavioral adjustments (i.e. nongeneticadjustments) that human individuals are capable of mak-ing in response to changes in their environment (Baker,1988).In order to demonstrate genetic adaptation in humans,
or in any organism, it is necessary to acquire evidencesubstantiating that natural selection underlies the evolu-
tion of a particular trait (Harrison, 1988). Ascertainingthe operation of selection in the evolution of a trait is a rig-orous exercise that requires evidence of various types.Strong evidence for the adaptive status of a trait wouldrequire the following: evidence of differential fertility ormortality dependent on a particular genetic difference,evidence from in vitro or in vivo studies of functional dif-ferences between genotypes that affect reproductive suc-cess, and evidence of geographic concordance between thedistribution of a genetic trait and some environmental fac-tor that could be a selective force. As a consequence of
Grant sponsor: Fundacao de Amparo a Pesquisa do Estado de SaoPaulo (Brazil); Grant number: 03/01583-8. Grant sponsor: a PSC-CUNY Award from the City University of New York.
Authors contributed equally.
*Correspondence to: Eugene E. Harris, Department of BiologicalSciences and Geology, Queensborough Community College, Bayside,NY 11222, USA. E-mail: [email protected]
DOI 10.1002/ajpa.20518Published online in Wiley InterScience (www.interscience.wiley.com).
VVC 2006 WILEY-LISS, INC.
YEARBOOK OF PHYSICAL ANTHROPOLOGY 49:89–130 (2006)
these demands for evidence, G.A. Harrison (1988) pointedout that \evidence for polymorphisms being maintained[in humans] by selection is largely nonexistent." Heobserved that our strongest evidence of selection andgenetic adaptation involves the polymorphisms at G6PD,at b-globin, and at the Duffy blood group, most likelymaintained due to the selective pressures from falciparummalaria and vivaxmalaria.Over the last decade, advances in comparative genomics,
population genetics, and molecular evolutionary theoryhave begun to provide us with data and methodology thatcan be used to test hypotheses of natural selection and ad-aptation. The first advance is our ability to collect DNAsequence data on very large scales. This has allowed boththe characterization of entire genomes (e.g., the humanand chimpanzee genomes are two among an increasing listof species that are completely sequenced; see Lander et al.,2001; Chimpanzee Sequencing and Analysis Consortium,2005). It has also become possible to collect DNA sequencedata from many individuals within a species, providing in-formation on variation within and between populations.The abundance of new DNA sequence data has motivatedthe development of novel analytical methods, guidedtowards testing specific hypotheses concerning the role ofnatural selection in shaping human genetic variation(Nielsen, 2005). Such developments have made it possibleto test for the effects of selection at particular genes, andalso to scan the entire genome to discover those genes orgenetic regions that were likely targets of selection in ourevolutionary history.However, we have learned that the detection of natural
selection from genetic data is not simple. One difficultythat is now widely appreciated is teasing apart the signalof selection from the signal left by the demographic his-tory of our species. Helpful in this regard has been theincreasing availability of large genome-wide data sets ofhuman DNA polymorphism that have allowed us to makeinferences about our demographic history. It is expectedthat demographic phenomena such as population expan-sions, subdivision and bottleneck events will affect varia-tion at all genes. On the other hand, natural selection isexpected to have locus-specific effects. An improvedunderstanding of the common pattern of variation acrossmany genes will be necessary so that we can detect thosegenes having histories of selection.In this paper, we begin by providing background discus-
sion of the theory and analytical methods that are used todetect natural selection in studies that compare differen-ces in DNA sequences between species, as well as studiesthat analyze variation in DNA sequences within species.Next, we review and discuss recent genetic evidencefor four classically studied human polymorphic traitshypothesized to have been under natural selection. Thesepolymorphic traits include skin color, the Duffy bloodgroup, bitter-taste sensation, and lactase persistence. Wechose these specific traits, rather than any of a number ofother traits for which DNA evidence of selection is accru-ing (Bamshad and Wooding, 2003; Vallender and Lahn,2004; Sabeti et al., 2006), for several reasons. First, webelieve that most biological anthropologists are familiarwith hypotheses that have been proposed over the yearsto explain the evolution of these traits. Second, we believethat there is reasonably good evidence concerning whichparticular gene or genes contribute to the phenotypic di-versity of these traits. Third, we chose these traitsbecause they allow us to discuss how different regimes ofselection such as directional selection, balancing selection,
diversifying selection, and purifying selection can bedetected from patterns of DNA polymorphism. Finally,these examples allow us to discuss the wide array of ana-lytical methodologies that can be successfully applied inthe study of natural selection on human genes.After discussing the signature of selection at specific
genes investigated through a so-called \candidate-gene"approach, in which a gene is chosen for further studybased on its presumed involvement with a trait, wedescribe the recent studies directed at searching for posi-tively selected genes across the entire human genome.These studies, referred to as \genome-scanning" analyses,have focused on two different time frames in our evolu-tionary history. First, genome-scanning studies have beendirected at detecting which of our genes have experiencedpositive selection during the divergence of humans fromchimpanzees. Second, the approach has been directed atdiscerning which genes have been targets of positive selec-tion as human populations have adapted to different envi-ronments. Genome-scanning studies have the potential togenerate lists of putatively selected genes that can be fur-ther studied from a functional perspective. In addition,these genome-wide surveys help answer broad evolution-ary questions about our species, including the extent towhich selection has been an important process in shapingour genetic variation.
THEORY AND ANALYTICAL METHODS:THE DETECTION OF SELECTION FROM
DNA SEQUENCES
Selection and neutrality
One of the challenges faced by evolutionary geneticistsis to determine whether the genetic data available tothem was shaped by natural selection over its evolution-ary history. Rather than detecting selection by observingits ongoing dynamics, population genetic approaches aimto establish whether or not observed patterns of geneticvariation would be unlikely in the absence of selection.In this paper, the main types of data we will be focusing
on are DNA sequences (i.e. complete nucleotide sequen-ces). Nucleotide sites that differ among individuals withina species are said to be polymorphic, and nucleotide sitesthat differ among species represent divergence and are of-ten referred to as fixed differences. Sites that are polymor-phic within a species are known as single nucleotide poly-morphisms (SNPs). There are several advantages to usingSNP data to study the effects of natural selection onhuman genes. First, high-throughput genotyping method-ologies currently exist that allow large number of SNPs tobe surveyed rapidly; indeed, large data sets already exist(Altschuler et al., 2005; Hinds et al., 2005). Second, themolecular theory of evolutionary change at biallelic poly-morphisms (which is the case for the majority of SNPs) isrelatively mature and allows the implementation of robusttests of neutrality as well as inferences of population pa-rameters. Third, comparative analyses require the estab-lishment of homology between human and outgroupsequences (e.g. the chimpanzee sequence), and this is rela-tively easily done for DNA sequence data.The neutral model of molecular evolution postulates
that most evolutionary change at the molecular level is aconsequence of random genetic drift, and not adaptiveevolution. It should be noted, however, that the neutralmodel does not exclude the role of natural selection: natu-ral selection is assumed to remove deleterious mutations(i.e. purifying selection) and fix the rarely arising advan-
90 E.E. HARRIS AND D. MEYER
American Journal of Physical Anthropology—DOI 10.1002/ajpa
tageous mutation. Thus, under the neutral model, selec-tion can occur, but it contributes little to the observed var-iation within or the differences between species (Kimura,1983).Under the neutral model, specific theoretical predic-
tions can be made regarding the relationship between therate of mutation and evolutionary parameters. 1) Thepolymorphism within a species is a function of the muta-tion rate and population size, following the relationshipestablished by Crow and Kimura (1970): H ¼ 4Nl/(1 +4Nl), where H stands for expected heterozygosity, N is theeffective population size, and l is the per locus mutationrate; 2) The rate at which mutational differences accumu-late as two species diverge (i.e. the substitution rate) isthe same as the rate at which neutral mutations arise (l)(Kimura, 1969); 3) The expected frequency of alleles in asample is a function of the population and sample sizes(Ewens, 1972). Statistical tests designed to detect naturalselection take advantage of the relative ease with whichthese predictions made by the neutral theory can bematched against empirical data.Notice that the study of natural selection using genetic
data is based upon tests of the null hypothesis of neutral-ity, rather than tests of natural selection. Neutral evolu-tion is an analytically tractable model of evolution, whichmakes simple predictions about the frequencies of allelesand polymorphisms, the expected proportions of polymor-phism, and divergence for different genes or classes ofmutation (Kimura, 1983). Thus, the tests employed in thestudy of natural selection upon genetic variation are moreadequately defined as tests of the null hypothesis of neu-trality, or neutrality tests.A key aspect of many tests of neutrality is that they in
effect test a broader set of assumptions than whether ornot genetic drift explains evolutionary change. Among theassumptions are that the population is panmictic, that itis not subdivided into smaller subpopulations, and that ithas remained constant in size sufficiently long so that de-mographic events in the past no longer leave a signatureon the genetic data (Bamshad and Wooding, 2003; Sabetiet al., 2006). These conditions characterize a populationthat is in equilibrium. For many neutrality tests the viola-tion of equilibrium assumptions can result in the rejectionof the null hypothesis, even in the absence of naturalselection. Thus, neutrality tests in effect test the null hy-pothesis of neutrality-equilibrium.
Different types of selection
Different forms of selection shape genetic variationwithin and between species. Positive selection refers to thecases in which a novel DNA variant has a selectiveadvantage over others, and consequently rises in fre-quency. Negative or purifying selection refers to the casesin which novel DNA variants have a selective disadvant-age with respect to others, and tend to remain at low fre-quencies or be removed. Balancing selection refers toselective regimes that increase genetic variation within aspecies. Several different biological processes can increasegenetic variation. In one case, selection can be overdomi-nant, in which heterozygous individuals have a higher fit-ness compared to homozygotes. In a second case, selectioncan vary in space, with different environments inhabitedby the species displaying distinct selective regimes, thusfavoring different alleles. Finally, selection can vary overtime, with different alleles being favored at different timeintervals, as selective regimes change.
Natural selection is expected to directly affect thegenetic variants that alter an individual’s survival proba-bility. However, the effects of selection need not be re-stricted to the causal variant associated with the selectivedifferences among individuals. Consider, for example,those genetic variants present on the same chromosomeupon which a favorable mutation has arisen (known aslinked variants). As the favorable mutation rises to highfrequency within a population, so will the linked variants,even if they have no selective effect. Thus, the consequen-ces of natural selection extend beyond the immediateselected region of the genome, and tests of selectionexplore this effect in various ways, as will be seen below.
Tests of the neutral-equilibrium model
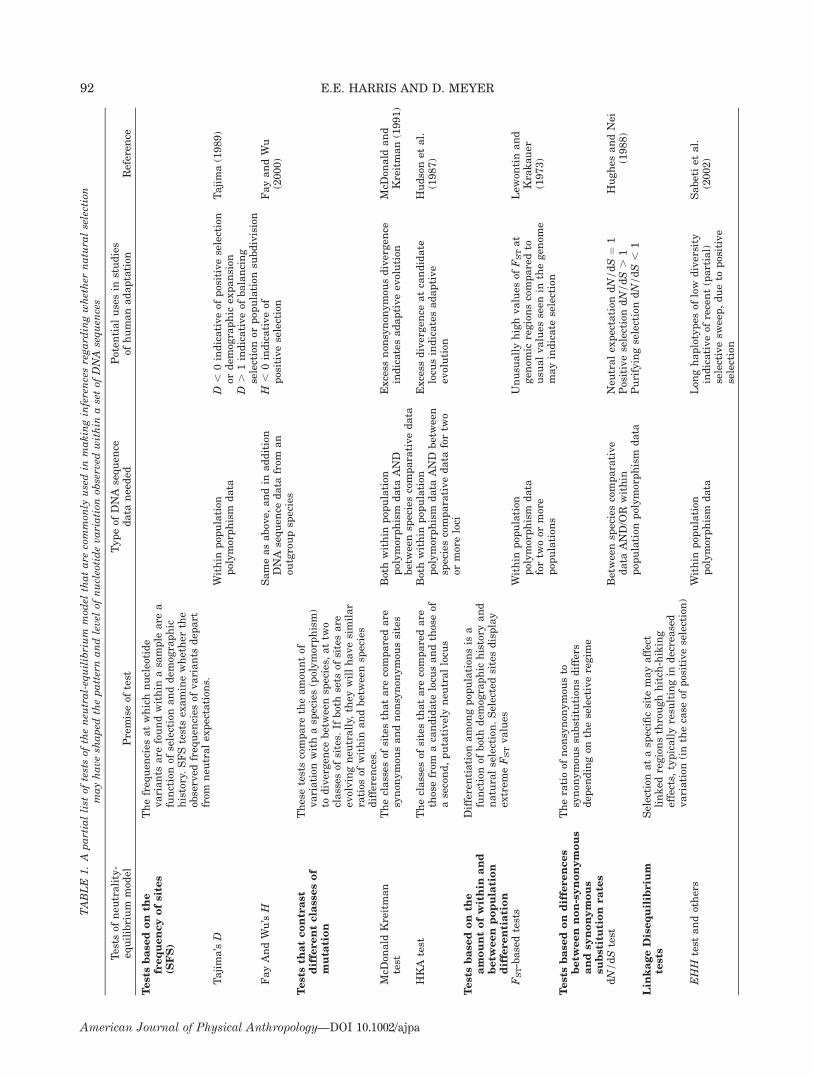
We have grouped tests developed to discern selectioninto five main categories (see Table 1 for summary),although other classifications are possible. 1) tests basedon analyses of the frequencies at which polymorphismsoccur in a series of DNA sequences collected from a popu-lation (e.g. Tajima’s D, Fu and Li’s F, Fay and Wu’s H); 2)tests based on contrasts between DNA variation withinand between species (the MacDonald-Kreitman test, andthe HKA test); 3) tests based on the amount of variationand differentiation within and between populations (e.g.based on differences in FST); 4) tests based on differencesbetween nonsynonymous and synonymous substitutionrates; 5) tests based on the amount of linkage disequili-brium (LD) within a specific genomic region.
Tests based on the frequency of polymorphisms.Under neutrality-equilibrium, genetic variation accumu-lates in a population as a function of the population sizeand mutation rate. Neutral theory allows us to make pre-dictions not only about the diversity expected in a sample(often measured by the heterozygosity), but also about thefrequency spectrum of polymorphisms, referred tothroughout this paper as the site frequency spectrum (SFS,Fig. 1). Different forms of selection will impact the fre-quency spectrum in distinct ways. If a mutation is favoredby natural selection (i.e. positive selection) it will rise tohigh frequency in a population. This will result in an over-all decrease in the genetic variation at the selected site, aswell as at sites linked to it (Smith and Haigh, 1974). Thisprocess is known as a selective sweep (see Fig. 7). Themutational process will introduce new mutations after theselective sweep. These novel DNA variants will initiallybe present at low frequencies. Thus, shortly after a selec-tive sweep, we expect to observe a large proportion of low-frequency variants in a sample. Purifying selection is alsoexpected to result in an increase in the proportion of low-frequency variants. This can be understood as a conse-quence of the fact that novelmutations that enter the popu-lation generally remain at low frequencies, because theirdeleterious effects make it unlikely that they will reachhigh frequencies. In contrast, balancing selection willincrease the proportion of variants at intermediate fre-quencies, since this selection regime favors the mainte-nance of variation of multiple alleles. Various quantitativeapproaches have been developed to interpret whether thefrequency spectrum of a population sample reveals theaction of one or another of these forms of selection.The most widely used test that explores the frequency
spectrum was proposed by Tajima (1989). This test isbased on the comparison of two measures of the neutralparameter u, which corresponds to 4Nl, the neutral popu-lation mutation rate. The parameter u can be estimated
91MOLECULAR SIGNATURE OF SELECTION IN HUMANS
American Journal of Physical Anthropology—DOI 10.1002/ajpa
TABLE
1.A
partiallist
oftestsof
theneu
tral-equilibrium
mod
elthatare
common
lyusedin
makinginferencesregard
ingwhether
natura
lselection
mayhavesh
aped
thepatternandlevel
ofnucleotidevariation
observed
within
asetof
DNA
sequen
ces
Tests
ofneu
trality-
equilibrium
mod
elPremiseof
test
Typeof
DNA
sequen
cedata
nee
ded
Poten
tialusesin
studies
ofhumanadaptation
Referen
ce
Testsbase
don
the
frequencyofsites
(SFS)
Thefreq
uen
cies
atwhichnucleotide
variants
are
foundwithin
asa
mple
are
afunctionof
selectionanddem
ographic
history.SFStestsex
aminewhether
the
observed
freq
uen
cies
ofvariants
dep
art
from
neu
tralex
pectation
s.Tajima’sD
Within
pop
ulation
polymorphism
data
D,
0indicativeof
positiveselection
ordem
ographic
expansion
Tajima(1989)
D.
1indicativeof
balancing
selectionor
pop
ulation
subdivision
FayAndWu’sH
Sameasabov
e,andin
addition
DNA
sequen
cedata
from
an
outgroupsp
ecies
H,
0indicativeof
positiveselection
FayandWu
(2000)
Teststh
atcontrast
differentclassesof
muta
tion
Thesetestscompare
theamou
ntof
variation
withasp
ecies(polymorphism)
todivergen
cebetweensp
ecies,
attw
oclasses
ofsites.
Ifbothsets
ofsitesare
evolvingneu
trally,
they
willhavesimilar
ratios
ofwithin
andbetweensp
ecies
differences.
McD
onald
Kreitman
test
Theclasses
ofsitesthatare
comparedare
synon
ymou
sandnon
synon
ymou
ssites
Bothwithin
pop
ulation
polymorphism
data
AND
betweensp
eciescomparativedata
Excess
non
synon
ymou
sdivergen
ceindicatesadaptiveev
olution
McD
onald
and
Kreitman(1991)
HKA
test
Theclasses
ofsitesthatare
comparedare
thosefrom
acandidate
locu
sandthoseof
asecond,putativelyneu
trallocu
s
Bothwithin
pop
ulation
polymorphism
data
AND
betwee
nsp
eciescomparativedata
fortw
oor
moreloci
Excess
divergen
ceatcandidate
locu
sindicatesadaptive
evolution
Hudsonet
al.
(1987)
Testsbase
don
the
amountofwithin
and
betw
een
population
differentiation
Differentiation
amon
gpop
ulation
sis
afunctionof
bothdem
ographic
history
and
naturalselection.Selectedsitesdisplay
extrem
eFSTvalues
FST-basedtests
Within
pop
ulation
polymorphism
data
fortw
oor
more
pop
ulation
s
Unusu
allyhighvalues
ofFSTat
gen
omic
regionscomparedto
usu
alvalues
seen
inthegen
ome
mayindicate
selection
Lew
ontinand
Krakauer
(1973)
Testsbase
don
differences
betw
een
non-synonymous
and
synonymous
substitution
rates
Theratioof
non
synon
ymou
sto
synon
ymou
ssu
bstitution
sdiffers
dep
endingon
theselectiveregim
e
dN/dStest
Betwee
nsp
eciescomparative
data
AND/O
Rwithin
pop
ulation
polymorphism
data
Neu
tralex
pectation
dN/dS¼
1Hughes
andNei
(1988)
PositiveselectiondN/dS
.1
PurifyingselectiondN/dS,
1Lin
kageDisequilib
riu
mtests
Selection
atasp
ecificsite
mayaffect
linked
regionsthroughhitch
-hiking
effects,
typicallyresu
ltingin
decreased
variation
(inthecase
ofpositiveselection)
EHH
test
andothers
Within
pop
ulation
polymorphism
data
Lon
ghaplotypes
oflow
diversity
indicativeof
recent(partial)
selectivesw
eep,dueto
positive
selection
Sabetiet
al.
(2002)
92 E.E. HARRIS AND D. MEYER
American Journal of Physical Anthropology—DOI 10.1002/ajpa
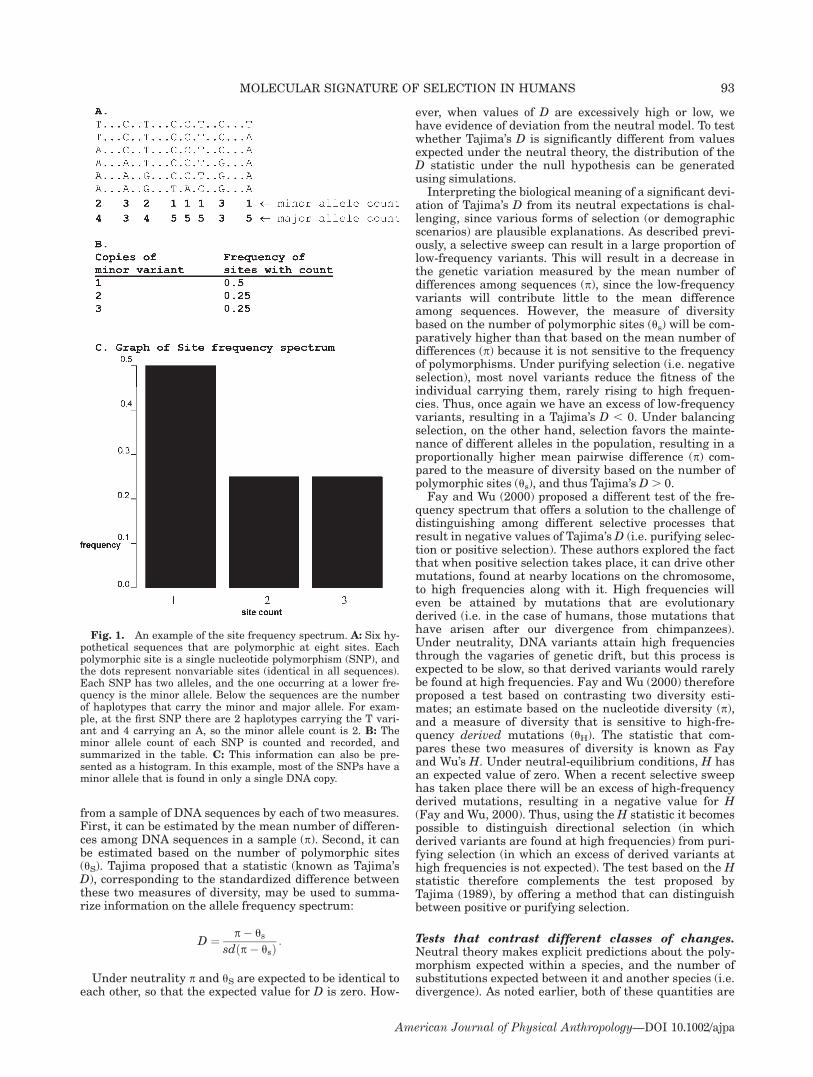
from a sample of DNA sequences by each of two measures.First, it can be estimated by the mean number of differen-ces among DNA sequences in a sample (p). Second, it canbe estimated based on the number of polymorphic sites(uS). Tajima proposed that a statistic (known as Tajima’sD), corresponding to the standardized difference betweenthese two measures of diversity, may be used to summa-rize information on the allele frequency spectrum:
D ¼ p� ussdðp� usÞ :
Under neutrality p and uS are expected to be identical toeach other, so that the expected value for D is zero. How-
ever, when values of D are excessively high or low, wehave evidence of deviation from the neutral model. To testwhether Tajima’s D is significantly different from valuesexpected under the neutral theory, the distribution of theD statistic under the null hypothesis can be generatedusing simulations.Interpreting the biological meaning of a significant devi-
ation of Tajima’s D from its neutral expectations is chal-lenging, since various forms of selection (or demographicscenarios) are plausible explanations. As described previ-ously, a selective sweep can result in a large proportion oflow-frequency variants. This will result in a decrease inthe genetic variation measured by the mean number ofdifferences among sequences (p), since the low-frequencyvariants will contribute little to the mean differenceamong sequences. However, the measure of diversitybased on the number of polymorphic sites (us) will be com-paratively higher than that based on the mean number ofdifferences (p) because it is not sensitive to the frequencyof polymorphisms. Under purifying selection (i.e. negativeselection), most novel variants reduce the fitness of theindividual carrying them, rarely rising to high frequen-cies. Thus, once again we have an excess of low-frequencyvariants, resulting in a Tajima’s D , 0. Under balancingselection, on the other hand, selection favors the mainte-nance of different alleles in the population, resulting in aproportionally higher mean pairwise difference (p) com-pared to the measure of diversity based on the number ofpolymorphic sites (us), and thus Tajima’s D. 0.Fay and Wu (2000) proposed a different test of the fre-
quency spectrum that offers a solution to the challenge ofdistinguishing among different selective processes thatresult in negative values of Tajima’s D (i.e. purifying selec-tion or positive selection). These authors explored the factthat when positive selection takes place, it can drive othermutations, found at nearby locations on the chromosome,to high frequencies along with it. High frequencies willeven be attained by mutations that are evolutionaryderived (i.e. in the case of humans, those mutations thathave arisen after our divergence from chimpanzees).Under neutrality, DNA variants attain high frequenciesthrough the vagaries of genetic drift, but this process isexpected to be slow, so that derived variants would rarelybe found at high frequencies. Fay and Wu (2000) thereforeproposed a test based on contrasting two diversity esti-mates; an estimate based on the nucleotide diversity (p),and a measure of diversity that is sensitive to high-fre-quency derived mutations (uH). The statistic that com-pares these two measures of diversity is known as Fayand Wu’s H. Under neutral-equilibrium conditions, H hasan expected value of zero. When a recent selective sweephas taken place there will be an excess of high-frequencyderived mutations, resulting in a negative value for H(Fay and Wu, 2000). Thus, using the H statistic it becomespossible to distinguish directional selection (in whichderived variants are found at high frequencies) from puri-fying selection (in which an excess of derived variants athigh frequencies is not expected). The test based on the Hstatistic therefore complements the test proposed byTajima (1989), by offering a method that can distinguishbetween positive or purifying selection.
Tests that contrast different classes of changes.Neutral theory makes explicit predictions about the poly-morphism expected within a species, and the number ofsubstitutions expected between it and another species (i.e.divergence). As noted earlier, both of these quantities are
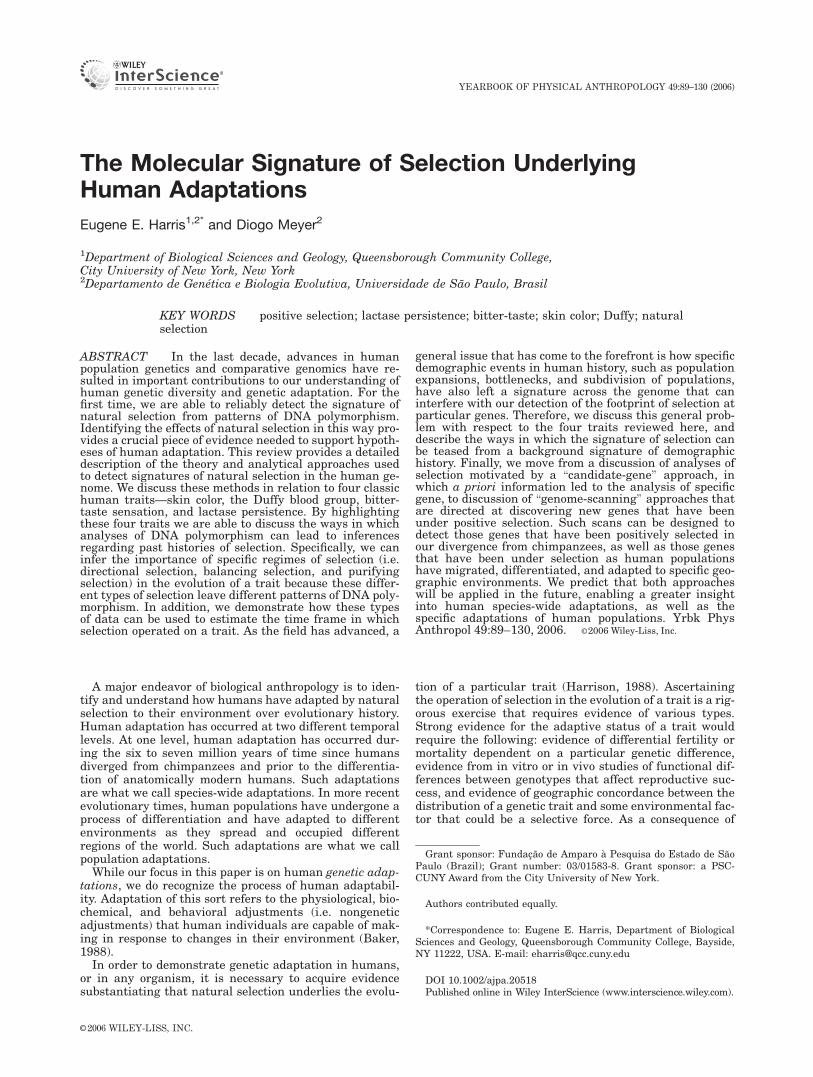
Fig. 1. An example of the site frequency spectrum. A: Six hy-pothetical sequences that are polymorphic at eight sites. Eachpolymorphic site is a single nucleotide polymorphism (SNP), andthe dots represent nonvariable sites (identical in all sequences).Each SNP has two alleles, and the one occurring at a lower fre-quency is the minor allele. Below the sequences are the numberof haplotypes that carry the minor and major allele. For exam-ple, at the first SNP there are 2 haplotypes carrying the T vari-ant and 4 carrying an A, so the minor allele count is 2. B: Theminor allele count of each SNP is counted and recorded, andsummarized in the table. C: This information can also be pre-sented as a histogram. In this example, most of the SNPs have aminor allele that is found in only a single DNA copy.
93MOLECULAR SIGNATURE OF SELECTION IN HUMANS
American Journal of Physical Anthropology—DOI 10.1002/ajpa
expected to be proportional to the mutation rate. Thesepredictions are applicable to all classes of mutations,regardless of whether they result in amino acid changes(nonsynonymous mutations) or do not (synonymous muta-tions).McDonald and Kreitman (1991) proposed a test of neu-
trality based on a comparison of the proportion of synony-mous to nonsynonymous change within and between spe-cies. Under neutrality, the proportion of these two types ofchange will be the same regardless of whether one exam-ines polymorphism or divergence. Now consider the possi-ble effects of selection. If positive selection is acting, weexpect the data to be enriched for nonsynonymous muta-tions because these result in functional changes. Thiseffect will be more pronounced for the divergence data,due to the fact that the time associated with the diver-gence between species is greater, and therefore selectionhas operated over a longer amount of time. Within species,on the other hand, mutations may persist transiently (dueto genetic drift) even if they are not favored by selection,and so there will be proportionately fewer nonsynonymouschanges, even when positive selection is ongoing. If nega-tive selection (purifying selection) is operating, nonsynon-ymous mutations will be removed. Again, this effect willbe more pronounced in the contrasts between species,since within species the deleterious mutations can transi-ently be present as polymorphisms, before being removedby selection. Thus, under purifying selection, there will becomparatively fewer nonsynonymous changes betweenthan within species.Whereas the McDonald–Kreitman test contrasts differ-
ent sets of sites within a specific gene, the Hudson–Kreit-man–Aguade (HKA) test has extended the theoretical ba-sis of this test to contrast polymorphism and divergenceamong multiple loci (Hudson et al., 1987). In the HKAtest, the assumption is made that under neutrality the ra-tio of polymorphism to divergence will be the same for twoor more genes that accumulate variation under neutrality.In a typical HKA test, a gene of interest is compared to aputatively neutral locus, and differences in the ratio ofpolymorphism to divergence between these is taken asevidence of selection in the gene of interest. For example,if a gene shows excess divergence with respect to a puta-tively neutral gene, a plausible interpretation is that posi-tive selection has fixed favorable mutations at this genealong the lineage leading to this species, resulting in a ra-tio in which DNA polymorphism is low relative to diver-gence.
Tests based on the amount of differentiation amongpopulations. Natural selection also alters the amount ofdifferentiation between or among populations within aspecies. For example, consider the case of a positivelyselected variant that rises to a high frequency within apopulation. This process is expected to augment differen-tiation between the population carrying the selected vari-ant and other populations (either because the variant didnot arise in these populations, or was not favored by selec-tion). Thus, if a locus shows greater differentiation amongpopulations than expected under neutrality, this may be aconsequence of positive selection.The most commonly used statistical measure of popula-
tion differentiation was devised by Wright (1951) and isknown as the fixation index, or FST. A test of selection,based on the comparison of observed FST values with thoseexpected under neutrality, was proposed by Lewontin andKrakauer (1973). The main difficulty of this approach is
determining the distribution of FST values under neutral-ity. Differentiation among populations is sensitive to a va-riety of demographic factors (including the rate of driftwithin populations and the extent of gene flow amongthem), making it difficult to rule out demographic scenar-ios that could account for the observed FST values.Because of this difficulty, tests of neutrality based on pop-ulation differentiation were largely abandoned. Recently,however, the abundance of genetic data available for vari-ous species, coupled with the development of novel analyt-ical methods, has resulted in the development of new ver-sions of the Lewontin–Krakauer test (Goldstein andChicki, 2002; Beaumont, 2005). One approach is to takeadvantage of the extremely large numbers of genetic locifor which we have information of population differentia-tion to create an empirical genome-wide distribution.Thus, rather than statistically testing specific loci, we canuse their position relative to this distribution to gaininsights about their possible selective histories (see dis-cussion of the Duffy locus later). Another approach is touse computer simulations under realistic demographicscenarios (inferred from multilocus studies) to obtain thedistribution of FST values under neutrality (Beaumont,2005).
Tests based on differences between nonsynonymousand synonymous substitution rates. While the preced-ing tests explore some properties of the expected variationwithin a species, or the contrast between variation withinand between species, another class of tests is aimed atcomparing sequence data from different species. Thesetests explore the fact that mutations can be nonsynony-mous or synonymous, and that nonsynonymous mutationsare much more likely to have an effect on fitness than aresynonymous changes. The rates at which these two typesof change occur can be expressed by the measures dN (thenumber of nonsynonymous substitutions per nonsynony-mous site; also symbolized as Ka) and dS (the number ofsynonymous substitutions per synonymous site; also sym-bolized as Ks).The ratio dN/dS is expected to have different values
under distinct selective regimes. In the case of genesevolving in a strictly neutral manner, where all mutationshave identical probabilities of persisting, we expect equalrates for both classes of substitution (i.e. dN/dS ¼ 1). Inthe case of purifying selection, in which nonsynonymousmutations are more frequently removed by selection, mostof the changes that persist are expected to be synonymous,resulting in dN/dS , 1. In the case of positive selection,nonsynonymous mutations are expected to have beenmaintained more frequently than those that are synony-mous, given their ability to alter protein structure andfunction, resulting in dN/dS .1. Therefore, a test of devi-ation from neutrality is the test of the null hypothesis ofdN/dS ¼ 1.Various statistical tests of the null hypothesis of neu-
trality (dN/dS ¼ 1) have been developed (Nei and Kumar,2000). Within a maximum likelihood framework, it is pos-sible to test whether two hypotheses are significantly dif-ferent by comparing their likelihoods (Yang and Nielsen,1998). Typically, a likelihood ratio test of dN/dS comparesthe log likelihood of the data under the null hypothesis(dN/dS ¼ 1) to an alternative hypothesis (e.g. dN/dS canassume any value). Because the null hypothesis is a spe-cial case of the alternative hypothesis, the models are saidto be nested, and twice the difference between the loga-rithms can be assumed to be chi-squared distributed, with
94 E.E. HARRIS AND D. MEYER
American Journal of Physical Anthropology—DOI 10.1002/ajpa

one degree of freedom. If the difference between the loglikelihoods for these two models is significant, we canreject the null hypothesis and infer selection. For testsdesigned to detect positive selection, the alternative hy-pothesis is dN/dS . 1. This test can be implemented byusing computer simulations: data are generated assumingdN/dS ¼ 1, and likelihood values for the data are ob-tained under the null and the alternative models. In thisway a null distribution of the test statistic is obtained,and the empirical value can be compared to it (Nielsenet al., 2005a).
Tests based on disequilibrium. Linkage disequilibrium(LD) coefficients measure the extent to which the variantspresent at different positions in a DNA sequence are cor-related. When a novel mutation arises, it does so in thecontext of a genetic background, and we say it is in com-plete LD with those variants. Over time, the effects ofrecombination will shuffle the mutation to different back-grounds breaking down the original association, thusleading to a decay of LD. When a mutation is under posi-tive selection, we assume it will rise in frequency quickly.If the rise in frequency of the favored mutation occurscomparatively faster than the rate of recombination, anextended region around the selected site (including allDNA variants that may be present within this region) willalso rise in frequency, creating an extended region of LD.Different tests have been proposed to asses the extent to
which genetic variation in the region surrounding a puta-tively selected site is indicative of selection (e.g. Slatkin,2001; Tishkoff et al., 2001). A simple approach is to quan-tify the extent of diversity in the haplotype bearing theputatively selected variant. Under the assumption thatpositive selection has taken place, we expect to find lowerlevels of diversity on the haplotypes carrying the puta-tively favored variant compared to other haplotypes thatdo not carry this variant. The nonselected haplotypes areexpected to have comparatively more diversity at neigh-boring sites since recombination and mutation would haveoperated over larger amounts of time and would have bro-ken down any original association (reducing LD on thishaplotype). Recently, this approach has been more for-mally developed (Sabeti et al., 2002). A test, called theLong Range Haplotype (LRH) test, was designed to detectselection on a haplotype characterized by a set of variants,called the \core haplotype." A set of additional SNPs aresurveyed at increasing distances from this core haplotype.The degree of LD between the core haplotype and theSNPs at various distances is measured using the EHH(extended haplotype homozygosity) statistic. EHH is theprobability that two randomly chosen chromosomes shar-ing the same core haplotype are identical over the regionextending from the core haplotype up until the SNP at adistance x (Sabeti et al., 2002). A haplotype that has beenpositively selected is expected to display high EHH valuesand high frequencies. Haplotypes that reach high frequen-cies due to genetic drift are likely to have taken longer toattain these frequencies, and so have experienced morerecombination as well as mutation. Thus, they will pres-ent lower values of EHH.
The effect of demographic historyon tests of neutrality
Various demographic scenarios can result in the rejec-tion of the null hypothesis of neutrality-equilibrium. Pop-ulation expansion, for example, can produce an increasein the proportion of low-frequency variants (mirroring the
effect of a selective sweep; Simonsen et al., 1995; Nielsen,2005). A population bottleneck, on the other hand, isexpected to cause the preferential loss of low-frequencyvariants, and thus produce an excess of intermediate-fre-quency variants (mirroring the pattern seen under bal-ancing selection; Simonsen et al., 1995; Nielsen, 2005).Thus, when tests based on the allele frequency spectrumare employed (e.g. Tajima’s D and related methods), sig-nificant deviations from neutrality-equilibrium can beattributed to either selection or changes in populationsize. However, failure to reject the null hypothesis canalso be the result of a particular demographic history. Forexample, a gene that is under balancing selection in a pop-ulation that has recently expanded may show values forTajima’s D that are not significantly different from thoseof a population in neutrality-equilibrium, because thesetwo processes tend to cancel each other out.How can the effect of demographic history be accounted
for in tests of neutrality? One approach is to carry out atest of neutrality that accounts for the demographic his-tory of the population. For example, the null distributionof Tajima’s D can be obtained under the assumption ofpopulation expansion, or under more specific (and morecomplex) demographic scenarios (such as bottlenecks fol-lowed by population expansion), rather than assumingthat the population is in equilibrium (e.g. Bamshad andWooding, 2003; Akey et al., 2004). The challenge withthese approaches is that some prior information about thedemographic scenarios is needed, in order to allow thesimulations to be performed.Another approach that can be used to distinguish
between the effects of selection and demographic historyis to perform contrasts among loci. For example, becausewe can assume that all loci in the genome share a commondemographic history, those loci with extreme values for atest statistic (such as Tajima’s D or FST), compared to a ge-nome-wide distribution, are likely to be under selection.However, even this interpretation is sensitive to assump-tions of demographic history. For example, Nielsen (2001)showed that for groups of populations with low levels ofgene flow between them, the variance of values expectedfor Tajima’s D under neutrality is far greater than thatexpected in a single random mating population. Thus,deciding whether the result for a locus represents an\extreme" value also requires making assumptions aboutthe population’s demographic history.Two classes of tests are robust to demographic factors,
implying that a significant result can be attributed tonatural selection: those based on dN/dS ratios and theMcDonald–Kreitman test (see earlier descriptions). Thesetests compare two classes of mutations (nonsynonymousand synonymous) within a single locus, and so the effectsof demography are expected to be identical for both classesof mutations (Nielsen, 2001). Notice that this differs fromthe case of tests comparing different loci (e.g. the FST-based tests, or the HKA test). In these, although all locishare a single demographic history, the genealogical his-tory of each locus is independent (due to segregation) and,therefore, there can be considerable variance among loci.
SIGNATURES OF SELECTION UNDERLYINGHUMAN TRAITS
These analytical methods allow us to test the hypothesisthat specific human traits have been under natural selec-tion. In what follows, we review and discuss genetic find-ings with respect to four traits: lactase persistence, skin
95MOLECULAR SIGNATURE OF SELECTION IN HUMANS
American Journal of Physical Anthropology—DOI 10.1002/ajpa

color, bitter-taste sensation, and the Duffy blood group.We emphasize the ways in which these methods havebeen applied to DNA variation in genes associated withthese traits, as well as the complexities in interpreting theresults of tests of selection. In so far as building strongadaptive cases for traits requires the synthesis of multiplelines of evidence (Harrison, 1988), we have broadened ourdiscussion to cover other critical components of the adapt-ive arguments. Thus, whenever possible, we include de-scriptions of the most current understanding of thegenetic underpinnings and inheritance of these traits, dis-cussions of functional studies aimed at revealing the linkbetween putative adaptive DNA variants and their pheno-typic expression, and in the case of the Duffy blood group,discussion of genetic evidence concerning the evolution ofPlasmodium vivax, the pathogen proposed to be the selec-tive agent on Duffy. While several of the cases we presenthave been well studied, it should become clear that manyimportant questions about the role of natural selectionupon these traits remain unanswered. We expect manyother human traits will be the focus of new studies in thenear future. It will be essential to conduct research at var-ious levels, and anthropologists, geneticists, physiologists,and other researchers will play essential roles. Readersmight usefully ponder: which pieces of the puzzle ofhuman adaptation will each of these groups best be ableto contribute?
LACTASE PERSISTENCE ANDMILK CONSUMPTION
The ability to digest the milk sugar lactose dependsupon the action of the enzyme lactase-phlorizin hydrolase(lactase). In most mammals, activity of lactase declines af-ter the weaning phase and consequently the capacity todigest lactose is reduced. Decline in lactase productionafter weaning is also characteristic of most humansthroughout the world who are described as being lactasenonpersistent (Swallow and Hollox, 2000), or sometimesas being lactose intolerant or malabsorbers (however,these terms are less accurate and are often misinterpretedas indicating pathology; see Wiley, 2004). In some individ-uals, however, lactase activity remains high after weaningallowing them to digest lactose into adulthood, a traitknown as lactase persistence (or lactose tolerance). Lac-tase-persistent individuals can consume large quantitiesof fresh milk without complication, but persons with lac-tase nonpersistence usually experience some degree ofadverse symptoms due to the increased action of intesti-nal-bacteria in breaking down lactose. These symptomsmay include intestinal gas, bloating, severe abdominalpain, and diarrhea (Jarvela, 2005).It has been known for some time that lactase persist-
ence varies considerably in frequency among human pop-ulations (Durham, 1991 and references therein). Lactasepersistence has a very high frequency among NorthernEuropeans and their descendents (.90% in some popula-tions) but declines in frequency as one moves south andwest. The trait is largely absent in East Asians, althoughit is found at intermediate frequencies in some MiddleEastern and North African populations. In most Africanpopulations, lactase persistence is at low frequencies.However, the trait is widely variable and shows a complexpattern of distribution. Pastoralists and other groups hav-ing milk-drinking cultures, such as the Fulbe (Cameroon),the Wolof (Senegal), the Tussi (Uganda, Congo, Rwanda),and Hima (East Africa) (see Table 5.1 in Durham, 1991 for
a more complete list), typically have relatively higher fre-quencies of lactase persistence than nonpastoralist groups(Simoons, 1978; Durham, 1991; Mulcare et al., 2004).The unusual geographic distribution of lactase persist-
ence, as well as its association with the cultural habit ofconsuming milk, has led to the proposal of several selec-tive hypotheses. The first hypothesis explains that milk-drinkers gained a nutritional benefit (Simoons, 1969,1970, 1978; McCracken, 1971; see Holden and Mace,1997). Thus, individuals that were lactase persistent hada selective advantage over those who were not becauselactase persistent individuals were able to hydrolyze andabsorb the carbohydrate lactose. Importantly, the advant-age was proposed to be greatest in situations or under con-ditions in which individuals were under nutritional stressand milk became a critical food (Simoons, 1969). A secondhypothesis proposed that the most important benefit ofdrinking milk was not nutritional but was due to thewater and electrolyte content in milk. This hypothesis islinked to Cook’s (1978) proposal that lactase persistenceoriginated in the Arabian Peninsula where the benefit isexplained in the cultural context of drinking camel milkon long desert journeys. A third hypothesis proposed thatlactase persistence was advantageous because it improvedcalcium absorption (Flatz and Rotthauwe, 1971). Thus,individuals who were lactase persistent were able to drinklarger quantities of milk thereby improving their calciumabsorption. The advantage is greater in persons living inregions where there is low incidence of ultraviolet light(e.g. northern latitudes), since synthesis of vitamin D(necessary for calcium absorption) is reduced in theseareas.It is outside the scope of this paper to evaluate the sup-
port for these various hypotheses (however see Durham,1991; Holden and Mace, 1997; Mace et al., 2003 for discus-sions). It is, however, relevant to point out that a recentstudy by Beja-Pereira et al. (2003) examined nonsynony-mous base changes in milk-protein genes of European cat-tle and found evidence of increased allelic diversity inbreeds found in North Central Europe. The increased di-versity appears to be specific to milk-protein genes sinceother genetic systems including mtDNA, microsatellitemarkers, and protein polymorphisms do not show in-creased diversity in North Central Europe. Although suchevidence does not allow us to distinguish between differ-ent hypotheses explaining the benefits of consuming milk,Beja-Pereira et al. (2003) do infer that early Neolithicdairy farmers in North Central Europe were selecting cat-tle for altered milk protein composition and increasedmilk yield. Furthermore, the evidence suggests gene-cul-ture coevolution, since the milk-protein diversity is high-est in cattle breeds from the same areas of NorthernEurope where the allele for lactase persistence is at great-est frequencies.
Genetic basis and inheritance pattern
The genetic basis of lactase persistence is today wellsupported by evidence (Swallow, 2003). However, until asrecently as the early 1970s, it was believed by someresearchers to be a substrate influenced trait—that a con-tinued presence of lactose in the gut after weaning couldstimulate the activity of lactase. Lactase persistence isnow known to have a genetic basis and to be inherited asan autosomal dominant trait. Activity levels of lactase inadults show a trimodal distribution pattern that suggests
96 E.E. HARRIS AND D. MEYER
American Journal of Physical Anthropology—DOI 10.1002/ajpa
three genotypes: homozygotes for the persistence allele(LCT*P/LCT*P) having lactase persistence, homozygoterecessives (LCT*R/LCT*R) having lactase nonpersistence,and heterozygotes (LCT*P/LCT*R) having lactase per-sistence but with intermediate levels of enzyme activity.The lactase enzyme is coded by a single gene *50 kb in
length that has 17 exons (Boll et al., 1991). The lactasegene encodes an mRNA transcript 6,274 bp in length anda preprotein of 1,927 amino acids (Swallow, 2003). In1993, the gene for the lactase enzyme was localized to thechromosomal position 2q21 (Harvey et al., 1993). Expres-sion of LCT is restricted to the absorptive cells of the smallintestine, and is maximally expressed in the middle partof the jejunum (Swallow, 2003).
The search for the causal mutationof lactase persistence
Within the LCT gene, a series of polymorphic nucleotidesites (DNA variants) have been identified by screening inEuropean and European-derived samples (Boll et al.,1991; Lloyd et al., 1992; and Harvey et al., 1995). Withinthese populations, only three common haplotypes wereidentified (A, B, and C). In order to study variation world-wide, DNA variants were surveyed in a 60 (kb) regionencompassing the gene across eleven Old World popula-tions (Hollox et al., 2001). Four common DNA haplotypeswere found, named haplotypes A, B, C, and U (Holloxet al., 2001). In northern Europe, the A haplotype wasfound at high frequencies (0.86), contrasting markedlywith its frequency in southern Europe (0.36) and India(*0.43) where lactase persistence is also less common. Inthese populations, haplotypes B and C are at much higherfrequencies than they are in northern Europe. In Asianand African populations, in which lactase persistence isalso rare, haplotype A is found at reduced frequencies(Malay, 0.49; Chinese, 0.47; Japanese 0.37), with particu-larly low values among Africans (Bantu, 0.10; San; 0.06).Evidence on several levels points to a strong association
between haplotype A and lactase persistence (Harveyet al., 1998). As outlined above, the first piece of evidenceis the geographical association between the haplotype andthe trait. A second piece of evidence is that individualsdetermined to be lactase persistent via laboratory assayare found to bear haplotype A, either as homozygotes orheterozygotes (Swallow, 2003). Third, highly expressedmRNA transcripts in the small intestine of lactase persis-
tent individuals were genotyped and found mainly to behaplotype A (Harvey et al., 1998).Using a combination of linkage disequilibrium studies
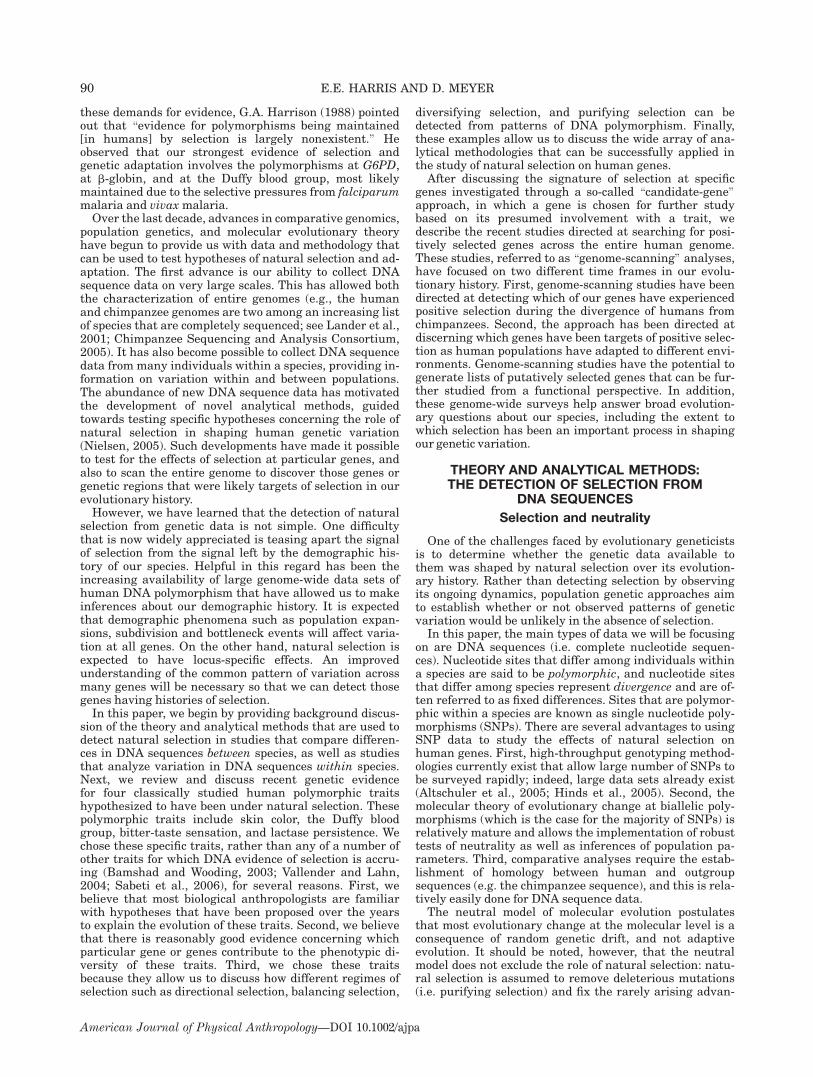
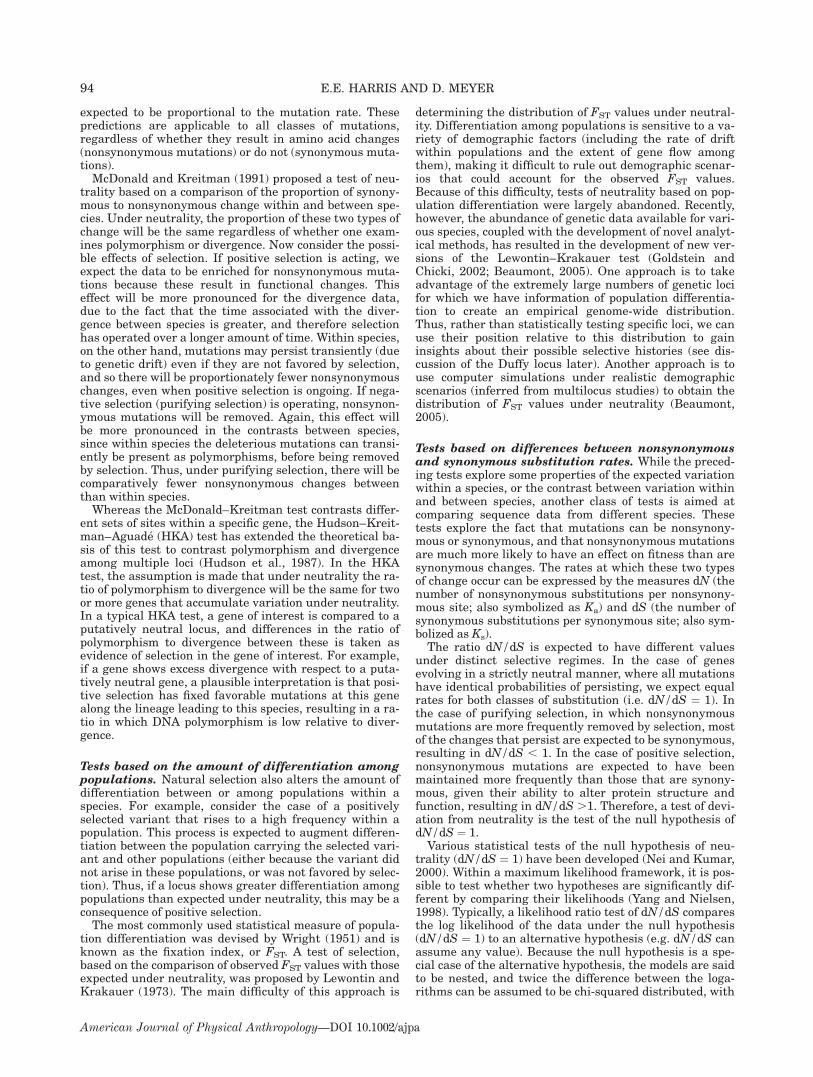
in families, and association studies (comparing the fre-quency of nucleotide variants between lactase persistentand nonpersistent individuals), it was proposed that a Tvariant at position �13910 (with respect to the LCT gene;see Fig. 2) might be the causal factor for lactase persist-ence (Enattah et al., 2002; Poulter et al., 2003). The vari-ant appears to have evolved from an ancestral C nucleo-tide on an A haplotype background. The A haplotype hasbeen shown to display extensive LD (up to 1 Mb in length)that extends beyond the LCT gene (Poulter et al., 2003).With respect to this finding, it is interesting to note thatthe putative causal variant is not located within the LCTgene itself but is located 13,910 nucleotides upstream ofthe LCT initiation codon within intron 13 of the MCM6gene (minichromosomemaintenance-6 gene; Enattah et al.,2002).While the �13910*T variant has been found to be in
complete association with lactase persistence in severalEuropean and European-derived US populations (Enattahet al., 2002), it is absent or extremely rare in most sub-Saharan African populations, including those possessingdairying cultures and with relatively high frequencies ofthe lactase persistence trait (e.g. Ibibio and Oron, Nigeria;Chewi and Ngoni, Malawi; Wolof, Senegal; Dinka andNuer, South Sudan; Neur and Anuak (Anywak), Ethiopia)(Mulcare et al., 2004). The only exception was the detec-tion of the �13910*T variant in several populations fromCameroon, West Africa, most notably the Fulbe andHausa. However, the presence of the variant here may bethe result of gene flow from populations outside Africa. In-dependent molecular markers (e.g. haplogroup IX of theY-chromosome), that have an origin in Asia, are also foundin Cameroon at considerable frequencies, and may indi-cate back-migrations from Asia to Africa over 4,000 yearsago (Cruciani et al., 2002; Mulcare et al., 2004).The finding that the �13910*T variant is rare or absent
in sub-Saharan populations that display high frequenciesof the lactase persistence trait has been interpreted in twoways. First, it is possible that the causal variant or var-iants of lactase persistence has not yet been found. Thatis, despite the fact that the �13910*T variant is in nearlycomplete association with lactase persistence in northernEuropeans, it is possible that it is not the causal mutationin Northern Europeans. The �13910*T mutation falls
Fig. 2. Schematic representation ofthe genomic region comprising the lac-tase gene (LCT), and the neighboringminichromosome maintenance type 6gene (MCM). The lactase gene in theclose view shows the 17 exons (smallexons are not to scale). The derived Tvariant at position �13,910 is the puta-tive causal variant of the lactase per-sistence trait. The derived A variant atposition �22,010 is more loosely associ-ated with lactase persistence. Figureadapted from Coelho et al. (2005) andHarvey et al. (1998).
97MOLECULAR SIGNATURE OF SELECTION IN HUMANS
American Journal of Physical Anthropology—DOI 10.1002/ajpa
within an extended region of LD (Poulter et al., 2003),making it possible that an undetected variant locatedwithin this region, and linked to the 13910*T variant,could be the cause of lactase persistence (Poulter et al.,2003; Bersaglieri et al., 2004). However, recent evidencehas favored the view that �13910*T is indeed the causalvariant in Northern Europeans. Studies in vitro demon-strate that the �13910*T variant functions as a cis-ele-ment that considerably upregulates the promoter regionof the LCT gene (with respect to the �13910*C variant)and consequently increases gene transcription (Olds andSibley, 2003; Troelsen et al., 2003; Lewinsky et al., 2005).Therefore, it is increasingly likely that lactase persistencein sub-Saharan pastoralist groups is caused by a differentyet unknown DNAvariant within or near the LCT gene. Ifthis is confirmed in future studies, then lactase persist-ence would appear to have evolved independently in Euro-pean and African populations. Since studies of variationat LCT in global population samples (including Africans)have screened for only variants originally discovered inEuropean samples, no new variants in these populationshave been detected. Thus, sequencing LCT in diverse Afri-can samples will be necessary in order to identify new var-iants, and to determine a possibly distinct causal muta-tion in Africans.
The pattern of DNA variation at LCT:evidence for natural selection
Two main studies have surveyed nucleotide variation inthe lactase gene (LCT) in diverse human populations(Hollox et al., 2001; Bersaglieri et al., 2004). The firststudy genotyped a set of SNPs in over 1,000 individualsderived from 13 different world populations (Hollox et al.,2001). The second study genotyped a larger set of SNPswithin a larger genomic region surrounding and encom-passing the LCT gene in 63 different world populations(Bersaglieri et al., 2004). The general pattern of nucleo-tide variability at LCT appears to have been influenced byboth historical demographical forces as well as naturalselection. For example, when heterozygosity (i.e. the pro-portional contribution of different haplotypes to a popula-tion) was measured at LCT, African populations showedconsiderably greater heterozygosity (0.91, San; 0.87,Bantu) compared to most non-African populations (0.26,northern Europe; 0.75 southern Europe; 0.65, northernIndia; 0.78, Japanese) (Hollox et al., 2001). This generalpattern, higher African diversity compared to non-Africandiversity, is consistent with the pattern of geographic di-versity observed in the majority of genes that have beenstudied to date (Tishkoff and Verelli, 2003; Tishkoff andKidd, 2004). The pattern is thought to have been producedby these population’s different demographic histories; thatis, the relatively older age and larger effective size of Afri-can populations compared with non-African populations,and the hypothesis that Eurasian populations experiencedbottlenecks as they migrated from Africa (Tishkoff andVerelli, 2003). Among non-African populations, however,Northern Europeans are unique in some respects. Theydisplay an exceptionally low level of heterozygosity (0.26),a value that is almost threefold less than values for othernon-African populations (Hollox et al., 2001). This markedreduction in heterozygosity in North Europeans is evi-dently due to the fact that a single haplotype (haplotypeA) dominates.In what follows, we discuss two main aspects of LCT
polymorphism data that indicate the locus has been
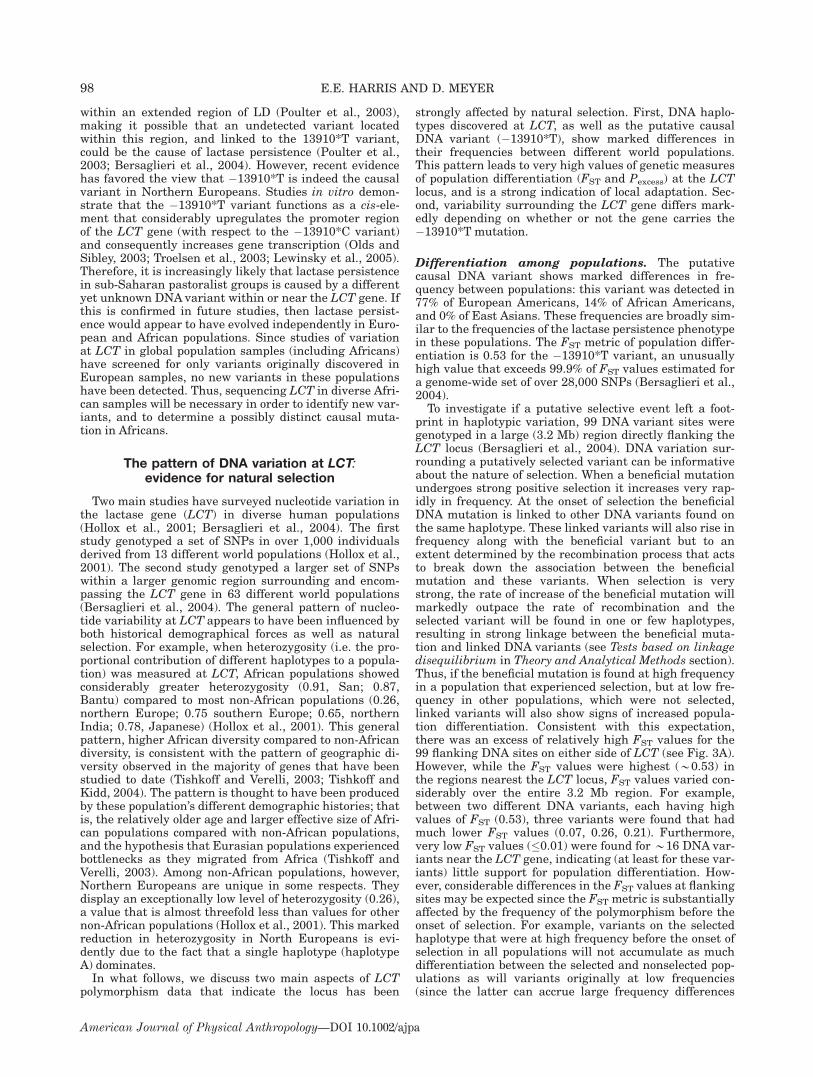
strongly affected by natural selection. First, DNA haplo-types discovered at LCT, as well as the putative causalDNA variant (�13910*T), show marked differences intheir frequencies between different world populations.This pattern leads to very high values of genetic measuresof population differentiation (FST and Pexcess) at the LCTlocus, and is a strong indication of local adaptation. Sec-ond, variability surrounding the LCT gene differs mark-edly depending on whether or not the gene carries the�13910*T mutation.
Differentiation among populations. The putativecausal DNA variant shows marked differences in fre-quency between populations: this variant was detected in77% of European Americans, 14% of African Americans,and 0% of East Asians. These frequencies are broadly sim-ilar to the frequencies of the lactase persistence phenotypein these populations. The FST metric of population differ-entiation is 0.53 for the �13910*T variant, an unusuallyhigh value that exceeds 99.9% of FST values estimated fora genome-wide set of over 28,000 SNPs (Bersaglieri et al.,2004).To investigate if a putative selective event left a foot-
print in haplotypic variation, 99 DNA variant sites weregenotyped in a large (3.2 Mb) region directly flanking theLCT locus (Bersaglieri et al., 2004). DNA variation sur-rounding a putatively selected variant can be informativeabout the nature of selection. When a beneficial mutationundergoes strong positive selection it increases very rap-idly in frequency. At the onset of selection the beneficialDNA mutation is linked to other DNA variants found onthe same haplotype. These linked variants will also rise infrequency along with the beneficial variant but to anextent determined by the recombination process that actsto break down the association between the beneficialmutation and these variants. When selection is verystrong, the rate of increase of the beneficial mutation willmarkedly outpace the rate of recombination and theselected variant will be found in one or few haplotypes,resulting in strong linkage between the beneficial muta-tion and linked DNA variants (see Tests based on linkagedisequilibrium in Theory and Analytical Methods section).Thus, if the beneficial mutation is found at high frequencyin a population that experienced selection, but at low fre-quency in other populations, which were not selected,linked variants will also show signs of increased popula-tion differentiation. Consistent with this expectation,there was an excess of relatively high FST values for the99 flanking DNA sites on either side of LCT (see Fig. 3A).However, while the FST values were highest (*0.53) inthe regions nearest the LCT locus, FST values varied con-siderably over the entire 3.2 Mb region. For example,between two different DNA variants, each having highvalues of FST (0.53), three variants were found that hadmuch lower FST values (0.07, 0.26, 0.21). Furthermore,very low FST values (�0.01) were found for *16 DNA var-iants near the LCT gene, indicating (at least for these var-iants) little support for population differentiation. How-ever, considerable differences in the FST values at flankingsites may be expected since the FST metric is substantiallyaffected by the frequency of the polymorphism before theonset of selection. For example, variants on the selectedhaplotype that were at high frequency before the onset ofselection in all populations will not accumulate as muchdifferentiation between the selected and nonselected pop-ulations as will variants originally at low frequencies(since the latter can accrue large frequency differences
98 E.E. HARRIS AND D. MEYER
American Journal of Physical Anthropology—DOI 10.1002/ajpa
between selected and nonselected populations) (Bersa-glieri et al., 2004). Therefore, measuring FST values atflanking sites has limited power in detecting selectionsince it is expected that only a subset of DNA variantswithin a selected haplotype (as seen at LCT) will havehigh FST values.To get around this problem, Bersaglieri et al. (2004)
quantified interpopulation differentiation using a differ-ent metric, known as Pexcess, which accounts for the origi-nal frequency of each variable site on the putativelyselected haplotype. The frequencies of variants prior toselection were assumed to be equivalent to their averagefrequency in all East Asian and African populationssampled (i.e. the populations that apparently did not expe-rience selection). In effect, Pexcess measures the rise in avariants frequency relative to its original value. When ahaplotype is strongly selected, Pexcess values of flankingDNA variants are expected to be relatively constant overlong distances and close to the frequency of the selectedhaplotype (i.e. haplotype A, 0.77). Determining Pexcess val-ues for flanking sites has the potential to provide morepowerful and reliable evidence of selection than FST val-ues at flanking sites. Results for LCT indicated that Pexcess
values were high and close to the frequency of the selectedsite (0.77) for a cluster of DNA variants within a regionspanning 500 kb around LCT (see Fig. 3B; Bersaglieri etal., 2004). Furthermore, Pexcess was consistently highacross all the 99 DNA variants and remained high forabout 1.5 Mb surrounding the LCT locus. In order to com-pare the Pexcess values at LCT with average values of thismetric genome-wide, Pexcess was determined for SNPswithin 952 different genomic regions. None of theseregions were found to have Pexcess values approachingthose for the LCT gene, and within each genomic region,Pexcess values between variants (even those separated byrelatively small distances of *100 kb) showed minimalcorrelation. This result indicates that the region aroundthe LCT gene is very unusual with respect to the rest ofthe genome, and strongly suggests that a selective sweepoccurred in Northern Europe. Under this scenario, thebeneficial mutation in the LCT gene is hypothesized tohave increased in frequency so rapidly that many linked
DNA variants in a broad swath around the variant werealso dragged up in frequency with it, a process known asgenetic hitch-hiking (Smith and Haigh, 1974).
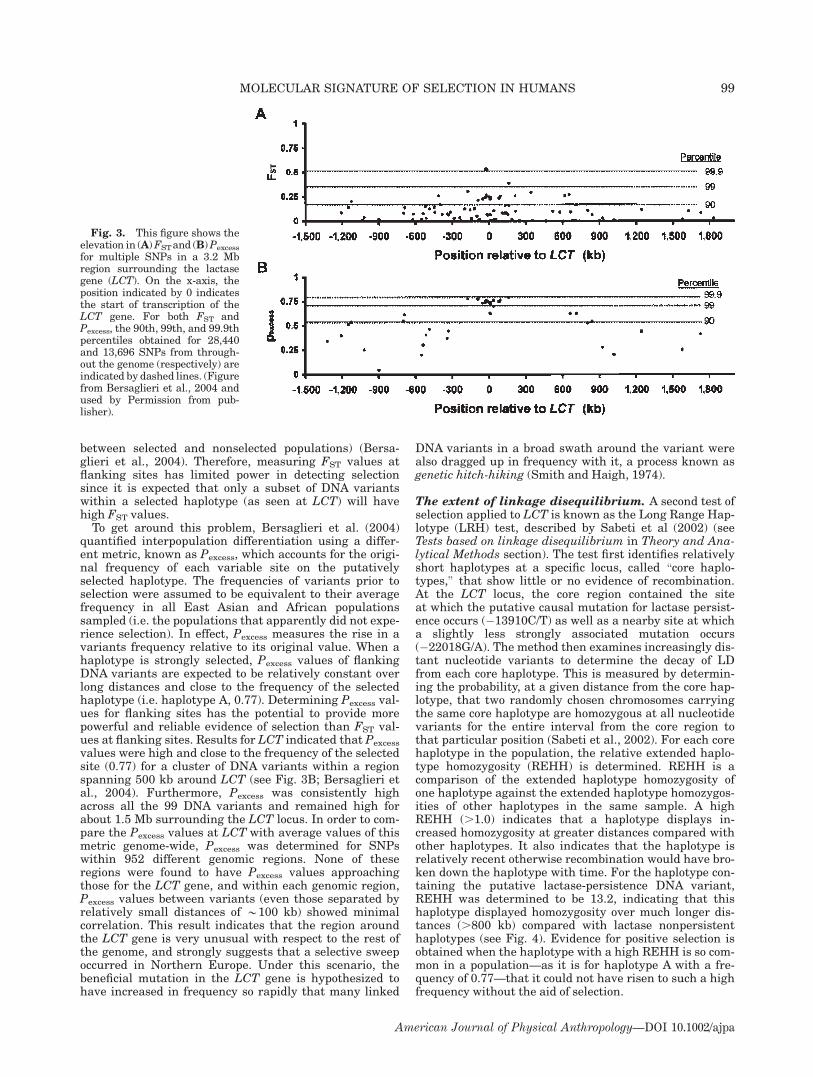
The extent of linkage disequilibrium. A second test ofselection applied to LCT is known as the Long Range Hap-lotype (LRH) test, described by Sabeti et al (2002) (seeTests based on linkage disequilibrium in Theory and Ana-lytical Methods section). The test first identifies relativelyshort haplotypes at a specific locus, called \core haplo-types," that show little or no evidence of recombination.At the LCT locus, the core region contained the siteat which the putative causal mutation for lactase persist-ence occurs (�13910C/T) as well as a nearby site at whicha slightly less strongly associated mutation occurs(�22018G/A). The method then examines increasingly dis-tant nucleotide variants to determine the decay of LDfrom each core haplotype. This is measured by determin-ing the probability, at a given distance from the core hap-lotype, that two randomly chosen chromosomes carryingthe same core haplotype are homozygous at all nucleotidevariants for the entire interval from the core region tothat particular position (Sabeti et al., 2002). For each corehaplotype in the population, the relative extended haplo-type homozygosity (REHH) is determined. REHH is acomparison of the extended haplotype homozygosity ofone haplotype against the extended haplotype homozygos-ities of other haplotypes in the same sample. A highREHH (.1.0) indicates that a haplotype displays in-creased homozygosity at greater distances compared withother haplotypes. It also indicates that the haplotype isrelatively recent otherwise recombination would have bro-ken down the haplotype with time. For the haplotype con-taining the putative lactase-persistence DNA variant,REHH was determined to be 13.2, indicating that thishaplotype displayed homozygosity over much longer dis-tances (.800 kb) compared with lactase nonpersistenthaplotypes (see Fig. 4). Evidence for positive selection isobtained when the haplotype with a high REHH is so com-mon in a population—as it is for haplotype A with a fre-quency of 0.77—that it could not have risen to such a highfrequency without the aid of selection.
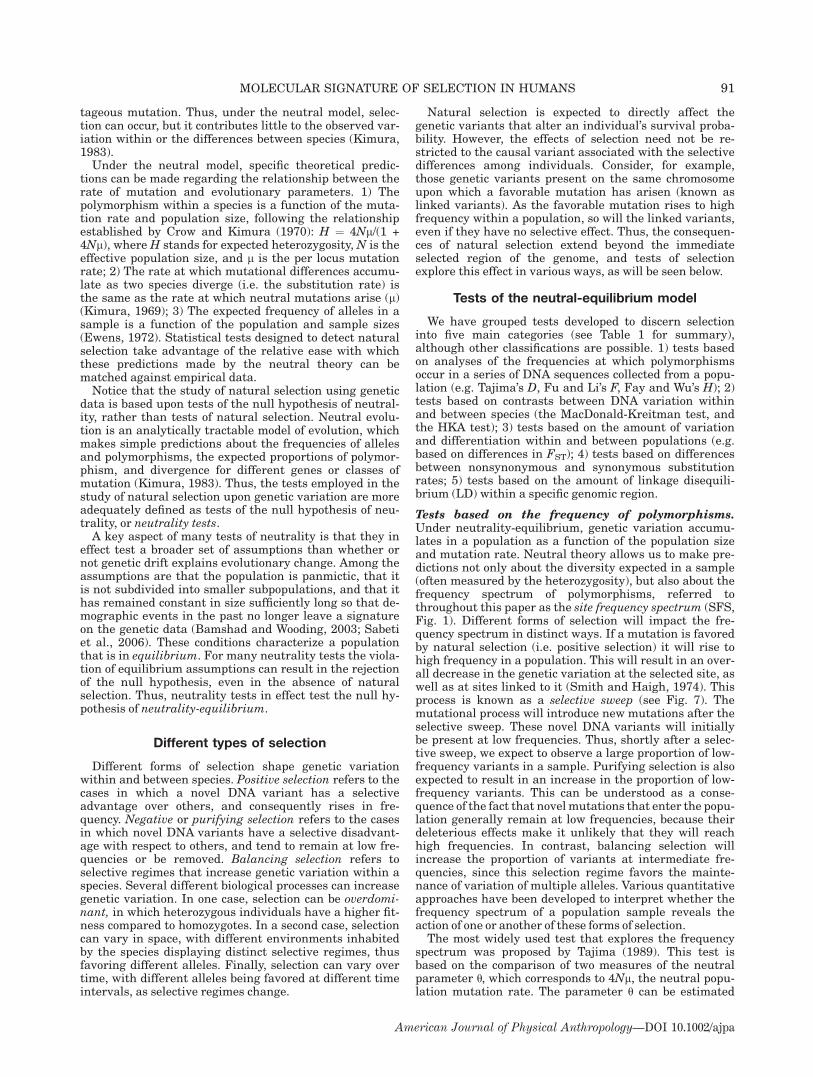
Fig. 3. This figure shows theelevation in (A)FSTand (B)Pexcess
for multiple SNPs in a 3.2 Mbregion surrounding the lactasegene (LCT). On the x-axis, theposition indicated by 0 indicatesthe start of transcription of theLCT gene. For both FST andPexcess, the 90th, 99th, and 99.9thpercentiles obtained for 28,440and 13,696 SNPs from through-out the genome (respectively) areindicated by dashed lines. (Figurefrom Bersaglieri et al., 2004 andused by Permission from pub-lisher).
99MOLECULAR SIGNATURE OF SELECTION IN HUMANS
American Journal of Physical Anthropology—DOI 10.1002/ajpa
The statistical significance of the REHH value for theLCT lactase persistence haplotype was determined in sev-eral ways. First, the value for the persistence haplotypewas compared with values of REHH obtained for data gen-erated by 10,000 coalescent simulations, and P-valueswere obtained for the excess of homozygosity observed onthe LCT persistence haplotype (for more details see Sabetiet al., 2002). Virtually none of the simulated data hadREHH values approximating that seen at LCT (P-value ,0.0004; see Bersaglieri et al., 2004). Second, the REHHvalue at LCT was compared to genotype data collectedfrom 12 regions in the genome spanning 500 kb each. TheREHH values found for these regions (similar to the val-ues found for the simulated data), also did not approxi-mate the value at LCT, again indicating that the extendedhomozygosity at LCT is very unusual. In another exami-nation of the effect of positive selection at LCT, the REHHvalue for the lactase persistent haplotype can be comparedto values obtained for other genes known to be underselection. Thus, the REHH value at LCT (13.2) is found tobe relatively much greater than the REHH value deter-mined for the G6PD haplotype (REHH ¼ 7.0; see Sabetiet al., 2002) hypothesized to provide resistance to malaria(Tishkoff and Verrelli, 2003).
The time frame of selection at LCT
Bersaglieri et al. (2004) suggested that the onset of posi-tive selection on lactase persistence occurred in Euro-peans subsequent to their differentiation from Asiansand Africans. This is inferred from two facts. The first isthat the frequency of the putative causal DNA variant(�13910*T) varies widely among different European pop-ulations, southern Europeans showing much reduced fre-quencies compared to northern Europeans and FrenchBasques. The second fact is that this variant is rare or
absent in almost all non-European populations (exceptAlgerians and Pakistanis). It should be noted, however,that while positive selection on LCT may have occurredrelatively recently, the DNA variant associated with lac-tase persistence may in fact be much older. In fact, thepresence of the �13910*T variant in several East Asianpopulations (e.g. the Daur, China, 0.05; Mongola, China,0.10; Yakut, Siberia, 0.06; see Bersaglieri et al., 2004),even though at low frequencies, seems to indicate that itpredates the differentiation of Europeans and Asians.The age of onset of selection of the lactase-persistence
haplotype was estimated based on the decay of LD in ei-ther direction from the LCT core region (Bersaglieri et al.,2004). The rationale behind this method lies in the factthat intragenic recombination occurs as a function of time(known as the recombination rate) and will operate tobreak down long haplotypes with time. Therefore, if weknow the recombination rate, as well as the degree towhich recombination has taken place, then it is possible toestimate the time that has elapsed since the long LCThaplotype was formed. This time is presumed to indicatethe age of the onset of selection. Analyses were performedon two different populations: a European-derived (US ped-igree) population, and a Scandinavian population. Analy-ses indicated that the persistence haplotype began to risein frequency between 2,188 and 20,650 years ago (in theEuropean-derived population) and, more recently, be-tween 1,625 and 3,188 years ago (in the Scandinavianpopulation) (Bersaglieri et al., 2004). A recent analysisused microsatellite diversity within the haplotypes to esti-mate the onset of selection (Coelho et al., 2005) and foundbroadly similar dates (i.e. between 7,000 and 12,000years). Thus, all estimated dates point to selection on lac-tase persistence in Northern Europe as being very recent.These dates are consistent with the estimated origin ofthe domestication of cattle (Bos taurus) around 9,000–11,000 years ago (Durham, 1991). Furthermore, recent ar-cheological studies analyzing residue on pottery indicatethat dairying was widespread in Britain in the Neolithicaround 8,000 years ago (Copley et al., 2003, 2005).The fact that the lactase persistence associated haplo-
type has achieved such high frequencies in NorthernEurope over such a short time indicates that the strengthof selection favoring lactase persistence must have beenconsiderable. Based on the estimated time since the initialrise of the haplotype, Bersaglieri et al. (2004) estimated acoefficient of selection (a metric of the selective advantageto the individual) between 0.014 and 0.15 for the Euro-pean-derived population, and between 0.09 and 0.19 forthe Scandinavian population. In other words, individualswho are lactase-persistent are estimated to have had a1.4–15.0% advantage over nonpersistent individuals inthe European-derived population, and a 9.0–19.0% ad-vantage in the Scandinavian population. Note that theselective advantage estimates in Scandinavians range tohigher values compared with those of the European-derived population indicating that selection may havebeen stronger in this population, consistent with the morerecent estimates of the onset of selection. Previous esti-mates of coefficients of selection for lactase persistence,based purely on theoretical considerations, were 1.5 and3.0% (Bodmer and Cavalli-Sforza, 1976) or 10% (Feldmanand Cavalli-Sforza, 1989). The recent estimates (Bersa-glieri et al., 2004) indicate that selection for lactase per-sistence may have been stronger than had previouslybeen thought. In fact, selection for lactase persistencemay have been as strong as (or even stronger than) selec-
Fig. 4. Long-range extended homozygosity for the core hap-lotype containing the persistence-associated alleles at LCT atvarious distances from LCT. The extent to which the commoncore haplotypes remains intact is shown for each chromosome incM. The core region containing the �13910C/T is shown as astippled black bar, and the LCT gene is oriented from left toright. Core haplotypes containing the persistence-associated al-lele (�13910T) are shown in black, and those containing thenonpersistence allele (�13910C) are shown in gray. Haplotypesare from European-derived US pedigrees. All chromosomes withcore haplotypes having a frequency greater than or equal to 5%in this population are depicted. (Adapted from Bersaglieri et al.,2004 and used by permission from publisher).
100 E.E. HARRIS AND D. MEYER
American Journal of Physical Anthropology—DOI 10.1002/ajpa
tion for the sickle-cell gene or for G6PD deficiency inmalaria-endemic regions where coefficients of selectionhave been estimated at 5.0–18.0% (sickle-cell) and 2.0–5.0% (G6PD) (Bersaglieri et al., 2004).
The origin of lactase persistence
Questions about the origin of lactase persistence mustconsider whether the distribution of the trait worldwide isdue to a single origin, or whether the trait has evolvedindependently in different populations. In most sub-Saharan populations screened by Mulcare et al. (2004),including populations that exhibit lactase persistence as aphenotypic polymorphism, the proposed causal variant oflactase persistence (i.e. �13910*T) is either absent or sorare that it cannot explain the observed frequency of thelactase persistence trait in these populations. (As notedabove, however, the Hausa and Fulbe of Cameroon repre-sent exceptions since the frequency of the �13910*T vari-ant is relatively high in these populations though isbelieved to be due to gene flow from outside Africa; seeMulcare et al., 2004.) Thus, the rare occurrence, or com-plete absence of the �13910*T DNA variant in sub-Saharan African populations with lactase persistenceseems to indicate that the origins and genetic basis of thetrait in sub-Saharan African pastoralist populations is dif-ferent from that in Europeans. It is possible that lactasepersistence evolved independently in these two geo-graphic regions, an explanation that Coelho et al. (2005)recently argued on theoretical grounds to be most plausi-ble. As noted above, a more comprehensive survey ofnucleotide diversity in the LCT gene of sub-Saharan pas-toralist groups will help to answer more definitively thequestion of possible independent evolution of lactase per-sistence. Such surveys will help determine the extent towhich the �13910*T variant is actually absent in Africanpastoralist populations. We know that this DNA variant isfound at considerable frequencies in the Fulbe and Hausaof Cameroon; could it also be present in other sub-Saharan populations? Furthermore, since most studieshave merely genotyped known variants in world pop-ulations, more intensive discovery of new variants inEuropeans and in sub-Saharan pastoralist populations(through full-sequencing efforts) will help to clarifywhether lactase persistence is indeed due to differentcausal DNAvariants in these two geographic populations.For some time it has been known that lactase persist-
ence is relatively high within certain populations in theMiddle East and in North Africa (Cook, 1978; Durham,1991; Holden and Mace, 1997; Swallow, 2003). Recent gen-otyping studies in these populations found the �13910*Tvariant to be at relatively high frequencies. Frequenciesin the Middle East are known for Pakistani populations(*0.30) and Bedouin from Israel (0.21) and in NorthAfrica for the Mzab, Algeria (0.22), Amizmiz (0.14) andTamazighy speakers from the Middle Atlas Mountans,Morocco (0.16) (Bersaglieri et al., 2004, Myles et al., 2005).As in Europeans, the frequency of �13910*T was found tostrongly predict the frequency of lactase persistence inthese populations (Myles et al., 2005). Based on theseresults, Myles et al. (2005) suggested that the practice ofdairying in North Africa, and the associated presence ofthe lactase persistence variant �13910*T, are due to pastmigrations from the Middle East (Myles et al., 2005). Evi-dence corroborating the hypothesis of a Middle Easternorigin of North African LCT derives from several inde-pendent sources: 1) recent Y chromosome data indicating
demic diffusion into North Africa from Middle Easternpastoralists (Arredi et al., 2004); 2) linguistic evidenceindicating that a proto-Berber language was carried toNorth Africa by migrating pastoralist from the Nile Valleyaround 7,000 BC (Blench, 2001); 3) archeological and fau-nal evidence indicating that early domestication in NorthAfrica centered on sheep and goats introduced from theMiddle East; and finally, 4) that the transition to pastoral-ism in coastal North Africa was sudden, and did not appearto undergo local development over time (Myles et al., 2005).The geographic origin of the �13910*T mutation is
unknown. However, as noted above, the mutation appearslikely to have originated in a non-African population afterits differentiation from Africans, and prior to the differen-tiation of European and Asian populations. Recently aspecific locale of origin for the mutation has been pro-posed, though this needs further investigation. Enattah(2005) hypothesized that its origin was in populations inthe Ural Mountains (Kaiser, 2004; Enattah, 2005). Thestudy surveyed haplotypic diversity of LCT and the distri-bution of the �13910*T variant in a larger array of popu-lations from the Ural Mountains, Caucasus and West Asiathan had been previously surveyed (Kaiser, 2004; Enat-tah, 2005). From a reconstruction of haplotype evolution,two key haplotypes were identified that were inferred totemporally bracket the origin of the �13910*T mutation.Since these two haplotypes were found at highest fre-quency in populations in the Ural Mountains, it was con-cluded that \this geographical region is the most likelyfocal origin of the most common lactase persistence allele"(Enattah, 2005; 77). It was proposed that demic diffusionlater brought the major lactase persistent haplotype west-wards towards Europe and southward towards WesternAsia and the Middle East.
HUMAN VARIATION IN SKIN COLOR
The geographic distribution of human skin color showsa clear geographic pattern: populations inhabiting areasclose to the equator in general have dark skin, whereaspopulations in higher latitudes have lighter skin (re-viewed in Jablonski and Chaplin, 2000). In addition, skincolor presents an amount of differentiation among worldregions that far exceeds that observed when other geneticvariation is surveyed; that is, although only 10% of thetotal genetic variation within humans lies between majorgeographic groups (sometimes referred to as \races"), 88%of the differences in skin color are found among worldregions (Relethford, 2002).Evolutionary interpretations of human skin color
attempt to explain the transition in skin color from nonhu-man primates, as well as the observed geographic diver-sity in human skin color, by placing them in the context ofknown physiological consequences associated with differ-ences in skin color. However, an understanding of thegenetic basis of skin color and the evolutionary processesthat account for change have been hampered by the rela-tive complexity of the phenotype and the multiplicity ofenvironmental factors that can explain variation. Never-theless, over the last decade there have been advances inour understanding of skin color in several importantareas. These include improved understanding of thegenetic basis of skin color as well as specific DNA varia-tion underlying phenotypic variation. These developmentshave enabled analyses aimed at evaluating models of theevolution of skin color variation, including models of natu-ral selection and adaptation.
101MOLECULAR SIGNATURE OF SELECTION IN HUMANS
American Journal of Physical Anthropology—DOI 10.1002/ajpa
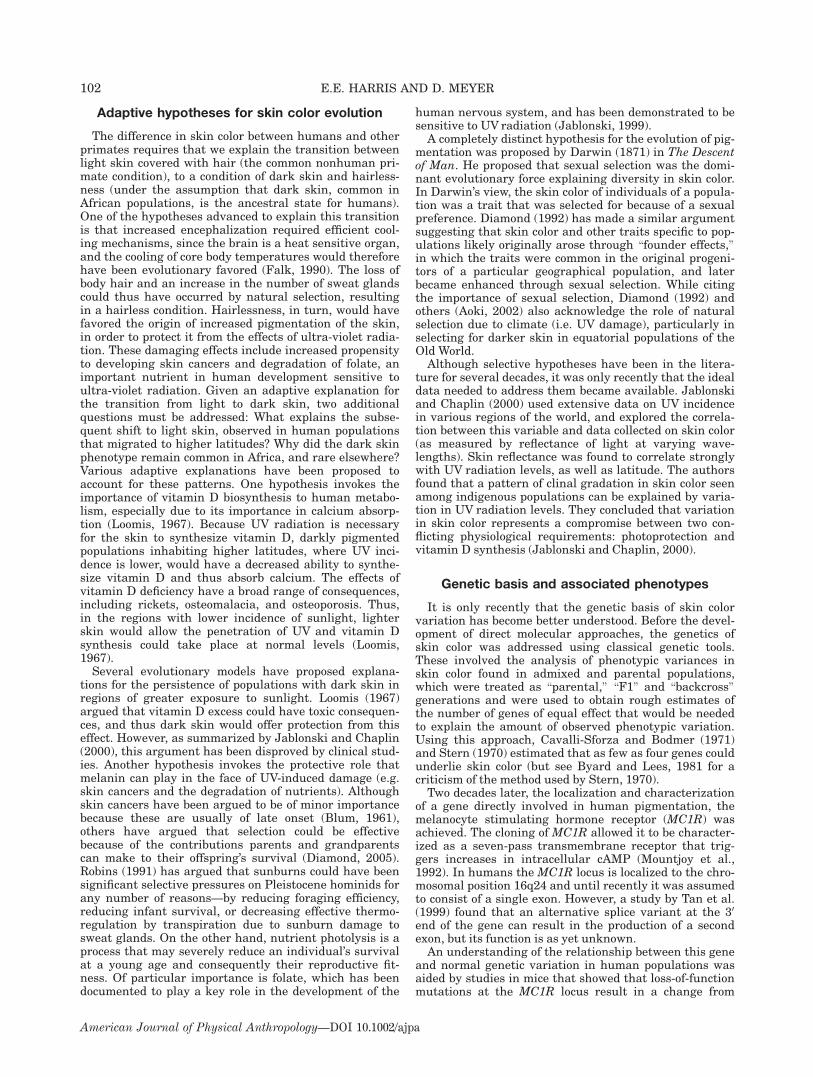
Adaptive hypotheses for skin color evolution
The difference in skin color between humans and otherprimates requires that we explain the transition betweenlight skin covered with hair (the common nonhuman pri-mate condition), to a condition of dark skin and hairless-ness (under the assumption that dark skin, common inAfrican populations, is the ancestral state for humans).One of the hypotheses advanced to explain this transitionis that increased encephalization required efficient cool-ing mechanisms, since the brain is a heat sensitive organ,and the cooling of core body temperatures would thereforehave been evolutionary favored (Falk, 1990). The loss ofbody hair and an increase in the number of sweat glandscould thus have occurred by natural selection, resultingin a hairless condition. Hairlessness, in turn, would havefavored the origin of increased pigmentation of the skin,in order to protect it from the effects of ultra-violet radia-tion. These damaging effects include increased propensityto developing skin cancers and degradation of folate, animportant nutrient in human development sensitive toultra-violet radiation. Given an adaptive explanation forthe transition from light to dark skin, two additionalquestions must be addressed: What explains the subse-quent shift to light skin, observed in human populationsthat migrated to higher latitudes? Why did the dark skinphenotype remain common in Africa, and rare elsewhere?Various adaptive explanations have been proposed toaccount for these patterns. One hypothesis invokes theimportance of vitamin D biosynthesis to human metabo-lism, especially due to its importance in calcium absorp-tion (Loomis, 1967). Because UV radiation is necessaryfor the skin to synthesize vitamin D, darkly pigmentedpopulations inhabiting higher latitudes, where UV inci-dence is lower, would have a decreased ability to synthe-size vitamin D and thus absorb calcium. The effects ofvitamin D deficiency have a broad range of consequences,including rickets, osteomalacia, and osteoporosis. Thus,in the regions with lower incidence of sunlight, lighterskin would allow the penetration of UV and vitamin Dsynthesis could take place at normal levels (Loomis,1967).Several evolutionary models have proposed explana-
tions for the persistence of populations with dark skin inregions of greater exposure to sunlight. Loomis (1967)argued that vitamin D excess could have toxic consequen-ces, and thus dark skin would offer protection from thiseffect. However, as summarized by Jablonski and Chaplin(2000), this argument has been disproved by clinical stud-ies. Another hypothesis invokes the protective role thatmelanin can play in the face of UV-induced damage (e.g.skin cancers and the degradation of nutrients). Althoughskin cancers have been argued to be of minor importancebecause these are usually of late onset (Blum, 1961),others have argued that selection could be effectivebecause of the contributions parents and grandparentscan make to their offspring’s survival (Diamond, 2005).Robins (1991) has argued that sunburns could have beensignificant selective pressures on Pleistocene hominids forany number of reasons—by reducing foraging efficiency,reducing infant survival, or decreasing effective thermo-regulation by transpiration due to sunburn damage tosweat glands. On the other hand, nutrient photolysis is aprocess that may severely reduce an individual’s survivalat a young age and consequently their reproductive fit-ness. Of particular importance is folate, which has beendocumented to play a key role in the development of the
human nervous system, and has been demonstrated to besensitive to UV radiation (Jablonski, 1999).A completely distinct hypothesis for the evolution of pig-
mentation was proposed by Darwin (1871) in The Descentof Man. He proposed that sexual selection was the domi-nant evolutionary force explaining diversity in skin color.In Darwin’s view, the skin color of individuals of a popula-tion was a trait that was selected for because of a sexualpreference. Diamond (1992) has made a similar argumentsuggesting that skin color and other traits specific to pop-ulations likely originally arose through \founder effects,"in which the traits were common in the original progeni-tors of a particular geographical population, and laterbecame enhanced through sexual selection. While citingthe importance of sexual selection, Diamond (1992) andothers (Aoki, 2002) also acknowledge the role of naturalselection due to climate (i.e. UV damage), particularly inselecting for darker skin in equatorial populations of theOld World.Although selective hypotheses have been in the litera-
ture for several decades, it was only recently that the idealdata needed to address them became available. Jablonskiand Chaplin (2000) used extensive data on UV incidencein various regions of the world, and explored the correla-tion between this variable and data collected on skin color(as measured by reflectance of light at varying wave-lengths). Skin reflectance was found to correlate stronglywith UV radiation levels, as well as latitude. The authorsfound that a pattern of clinal gradation in skin color seenamong indigenous populations can be explained by varia-tion in UV radiation levels. They concluded that variationin skin color represents a compromise between two con-flicting physiological requirements: photoprotection andvitamin D synthesis (Jablonski and Chaplin, 2000).
Genetic basis and associated phenotypes
It is only recently that the genetic basis of skin colorvariation has become better understood. Before the devel-opment of direct molecular approaches, the genetics ofskin color was addressed using classical genetic tools.These involved the analysis of phenotypic variances inskin color found in admixed and parental populations,which were treated as \parental," \F1" and \backcross"generations and were used to obtain rough estimates ofthe number of genes of equal effect that would be neededto explain the amount of observed phenotypic variation.Using this approach, Cavalli-Sforza and Bodmer (1971)and Stern (1970) estimated that as few as four genes couldunderlie skin color (but see Byard and Lees, 1981 for acriticism of the method used by Stern, 1970).Two decades later, the localization and characterization
of a gene directly involved in human pigmentation, themelanocyte stimulating hormone receptor (MC1R) wasachieved. The cloning of MC1R allowed it to be character-ized as a seven-pass transmembrane receptor that trig-gers increases in intracellular cAMP (Mountjoy et al.,1992). In humans the MC1R locus is localized to the chro-mosomal position 16q24 and until recently it was assumedto consist of a single exon. However, a study by Tan et al.(1999) found that an alternative splice variant at the 30end of the gene can result in the production of a secondexon, but its function is as yet unknown.An understanding of the relationship between this gene
and normal genetic variation in human populations wasaided by studies in mice that showed that loss-of-functionmutations at the MC1R locus result in a change from
102 E.E. HARRIS AND D. MEYER
American Journal of Physical Anthropology—DOI 10.1002/ajpa
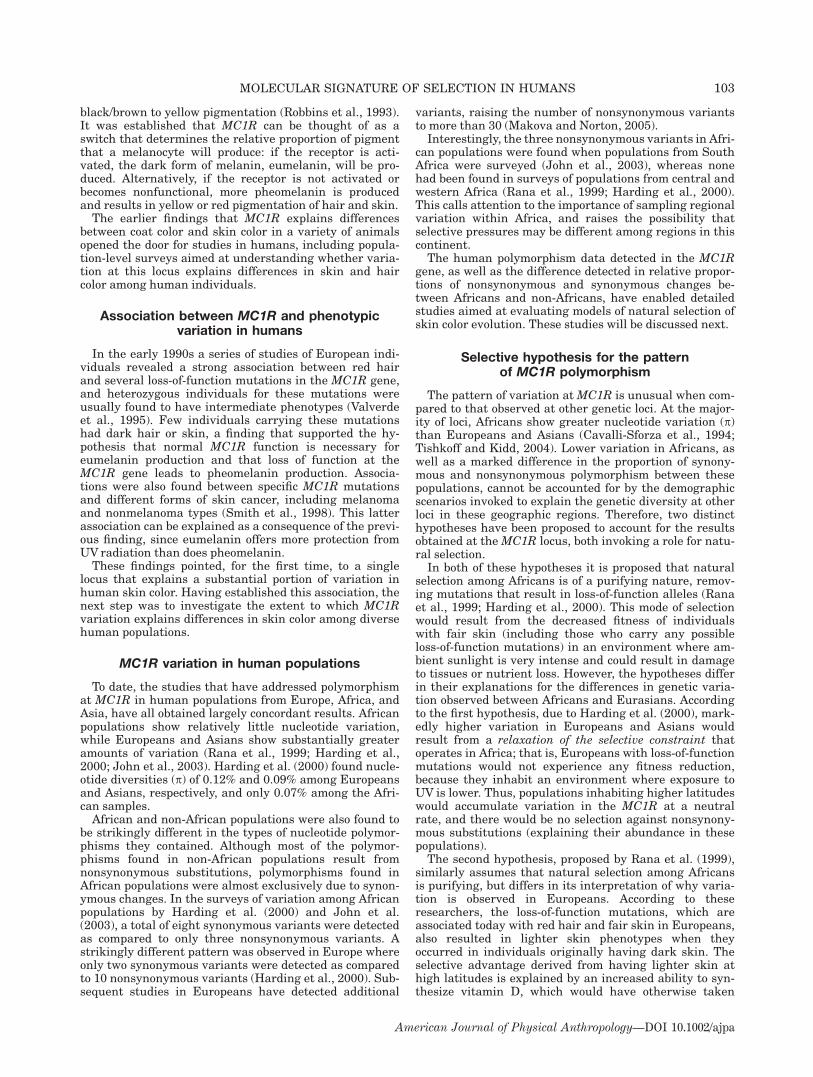
black/brown to yellow pigmentation (Robbins et al., 1993).It was established that MC1R can be thought of as aswitch that determines the relative proportion of pigmentthat a melanocyte will produce: if the receptor is acti-vated, the dark form of melanin, eumelanin, will be pro-duced. Alternatively, if the receptor is not activated orbecomes nonfunctional, more pheomelanin is producedand results in yellow or red pigmentation of hair and skin.The earlier findings that MC1R explains differences
between coat color and skin color in a variety of animalsopened the door for studies in humans, including popula-tion-level surveys aimed at understanding whether varia-tion at this locus explains differences in skin and haircolor among human individuals.
Association between MC1R and phenotypicvariation in humans
In the early 1990s a series of studies of European indi-viduals revealed a strong association between red hairand several loss-of-function mutations in the MC1R gene,and heterozygous individuals for these mutations wereusually found to have intermediate phenotypes (Valverdeet al., 1995). Few individuals carrying these mutationshad dark hair or skin, a finding that supported the hy-pothesis that normal MC1R function is necessary foreumelanin production and that loss of function at theMC1R gene leads to pheomelanin production. Associa-tions were also found between specific MC1R mutationsand different forms of skin cancer, including melanomaand nonmelanoma types (Smith et al., 1998). This latterassociation can be explained as a consequence of the previ-ous finding, since eumelanin offers more protection fromUV radiation than does pheomelanin.These findings pointed, for the first time, to a single
locus that explains a substantial portion of variation inhuman skin color. Having established this association, thenext step was to investigate the extent to which MC1Rvariation explains differences in skin color among diversehuman populations.
MC1R variation in human populations
To date, the studies that have addressed polymorphismat MC1R in human populations from Europe, Africa, andAsia, have all obtained largely concordant results. Africanpopulations show relatively little nucleotide variation,while Europeans and Asians show substantially greateramounts of variation (Rana et al., 1999; Harding et al.,2000; John et al., 2003). Harding et al. (2000) found nucle-otide diversities (p) of 0.12% and 0.09% among Europeansand Asians, respectively, and only 0.07% among the Afri-can samples.African and non-African populations were also found to
be strikingly different in the types of nucleotide polymor-phisms they contained. Although most of the polymor-phisms found in non-African populations result fromnonsynonymous substitutions, polymorphisms found inAfrican populations were almost exclusively due to synon-ymous changes. In the surveys of variation among Africanpopulations by Harding et al. (2000) and John et al.(2003), a total of eight synonymous variants were detectedas compared to only three nonsynonymous variants. Astrikingly different pattern was observed in Europe whereonly two synonymous variants were detected as comparedto 10 nonsynonymous variants (Harding et al., 2000). Sub-sequent studies in Europeans have detected additional
variants, raising the number of nonsynonymous variantsto more than 30 (Makova and Norton, 2005).Interestingly, the three nonsynonymous variants in Afri-
can populations were found when populations from SouthAfrica were surveyed (John et al., 2003), whereas nonehad been found in surveys of populations from central andwestern Africa (Rana et al., 1999; Harding et al., 2000).This calls attention to the importance of sampling regionalvariation within Africa, and raises the possibility thatselective pressures may be different among regions in thiscontinent.The human polymorphism data detected in the MC1R
gene, as well as the difference detected in relative propor-tions of nonsynonymous and synonymous changes be-tween Africans and non-Africans, have enabled detailedstudies aimed at evaluating models of natural selection ofskin color evolution. These studies will be discussed next.
Selective hypothesis for the patternof MC1R polymorphism
The pattern of variation at MC1R is unusual when com-pared to that observed at other genetic loci. At the major-ity of loci, Africans show greater nucleotide variation (p)than Europeans and Asians (Cavalli-Sforza et al., 1994;Tishkoff and Kidd, 2004). Lower variation in Africans, aswell as a marked difference in the proportion of synony-mous and nonsynonymous polymorphism between thesepopulations, cannot be accounted for by the demographicscenarios invoked to explain the genetic diversity at otherloci in these geographic regions. Therefore, two distincthypotheses have been proposed to account for the resultsobtained at the MC1R locus, both invoking a role for natu-ral selection.In both of these hypotheses it is proposed that natural
selection among Africans is of a purifying nature, remov-ing mutations that result in loss-of-function alleles (Ranaet al., 1999; Harding et al., 2000). This mode of selectionwould result from the decreased fitness of individualswith fair skin (including those who carry any possibleloss-of-function mutations) in an environment where am-bient sunlight is very intense and could result in damageto tissues or nutrient loss. However, the hypotheses differin their explanations for the differences in genetic varia-tion observed between Africans and Eurasians. Accordingto the first hypothesis, due to Harding et al. (2000), mark-edly higher variation in Europeans and Asians wouldresult from a relaxation of the selective constraint thatoperates in Africa; that is, Europeans with loss-of-functionmutations would not experience any fitness reduction,because they inhabit an environment where exposure toUV is lower. Thus, populations inhabiting higher latitudeswould accumulate variation in the MC1R at a neutralrate, and there would be no selection against nonsynony-mous substitutions (explaining their abundance in thesepopulations).The second hypothesis, proposed by Rana et al. (1999),
similarly assumes that natural selection among Africansis purifying, but differs in its interpretation of why varia-tion is observed in Europeans. According to theseresearchers, the loss-of-function mutations, which areassociated today with red hair and fair skin in Europeans,also resulted in lighter skin phenotypes when theyoccurred in individuals originally having dark skin. Theselective advantage derived from having lighter skin athigh latitudes is explained by an increased ability to syn-thesize vitamin D, which would have otherwise taken
103MOLECULAR SIGNATURE OF SELECTION IN HUMANS
American Journal of Physical Anthropology—DOI 10.1002/ajpa
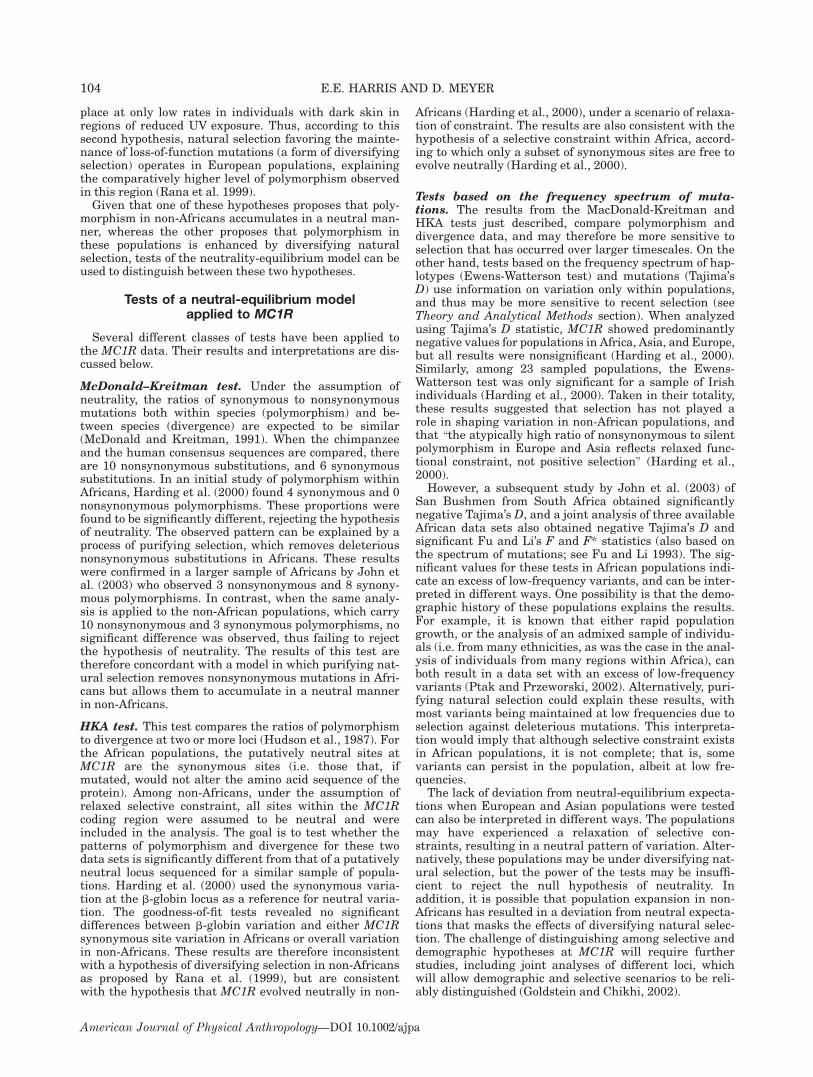
place at only low rates in individuals with dark skin inregions of reduced UV exposure. Thus, according to thissecond hypothesis, natural selection favoring the mainte-nance of loss-of-function mutations (a form of diversifyingselection) operates in European populations, explainingthe comparatively higher level of polymorphism observedin this region (Rana et al. 1999).Given that one of these hypotheses proposes that poly-
morphism in non-Africans accumulates in a neutral man-ner, whereas the other proposes that polymorphism inthese populations is enhanced by diversifying naturalselection, tests of the neutrality-equilibrium model can beused to distinguish between these two hypotheses.
Tests of a neutral-equilibrium modelapplied to MC1R
Several different classes of tests have been applied tothe MC1R data. Their results and interpretations are dis-cussed below.
McDonald–Kreitman test. Under the assumption ofneutrality, the ratios of synonymous to nonsynonymousmutations both within species (polymorphism) and be-tween species (divergence) are expected to be similar(McDonald and Kreitman, 1991). When the chimpanzeeand the human consensus sequences are compared, thereare 10 nonsynonymous substitutions, and 6 synonymoussubstitutions. In an initial study of polymorphism withinAfricans, Harding et al. (2000) found 4 synonymous and 0nonsynonymous polymorphisms. These proportions werefound to be significantly different, rejecting the hypothesisof neutrality. The observed pattern can be explained by aprocess of purifying selection, which removes deleteriousnonsynonymous substitutions in Africans. These resultswere confirmed in a larger sample of Africans by John etal. (2003) who observed 3 nonsynonymous and 8 synony-mous polymorphisms. In contrast, when the same analy-sis is applied to the non-African populations, which carry10 nonsynonymous and 3 synonymous polymorphisms, nosignificant difference was observed, thus failing to rejectthe hypothesis of neutrality. The results of this test aretherefore concordant with a model in which purifying nat-ural selection removes nonsynonymous mutations in Afri-cans but allows them to accumulate in a neutral mannerin non-Africans.
HKA test. This test compares the ratios of polymorphismto divergence at two or more loci (Hudson et al., 1987). Forthe African populations, the putatively neutral sites atMC1R are the synonymous sites (i.e. those that, ifmutated, would not alter the amino acid sequence of theprotein). Among non-Africans, under the assumption ofrelaxed selective constraint, all sites within the MC1Rcoding region were assumed to be neutral and wereincluded in the analysis. The goal is to test whether thepatterns of polymorphism and divergence for these twodata sets is significantly different from that of a putativelyneutral locus sequenced for a similar sample of popula-tions. Harding et al. (2000) used the synonymous varia-tion at the b-globin locus as a reference for neutral varia-tion. The goodness-of-fit tests revealed no significantdifferences between b-globin variation and either MC1Rsynonymous site variation in Africans or overall variationin non-Africans. These results are therefore inconsistentwith a hypothesis of diversifying selection in non-Africansas proposed by Rana et al. (1999), but are consistentwith the hypothesis that MC1R evolved neutrally in non-
Africans (Harding et al., 2000), under a scenario of relaxa-tion of constraint. The results are also consistent with thehypothesis of a selective constraint within Africa, accord-ing to which only a subset of synonymous sites are free toevolve neutrally (Harding et al., 2000).
Tests based on the frequency spectrum of muta-tions. The results from the MacDonald-Kreitman andHKA tests just described, compare polymorphism anddivergence data, and may therefore be more sensitive toselection that has occurred over larger timescales. On theother hand, tests based on the frequency spectrum of hap-lotypes (Ewens-Watterson test) and mutations (Tajima’sD) use information on variation only within populations,and thus may be more sensitive to recent selection (seeTheory and Analytical Methods section). When analyzedusing Tajima’s D statistic, MC1R showed predominantlynegative values for populations in Africa, Asia, and Europe,but all results were nonsignificant (Harding et al., 2000).Similarly, among 23 sampled populations, the Ewens-Watterson test was only significant for a sample of Irishindividuals (Harding et al., 2000). Taken in their totality,these results suggested that selection has not played arole in shaping variation in non-African populations, andthat \the atypically high ratio of nonsynonymous to silentpolymorphism in Europe and Asia reflects relaxed func-tional constraint, not positive selection" (Harding et al.,2000).However, a subsequent study by John et al. (2003) of
San Bushmen from South Africa obtained significantlynegative Tajima’s D, and a joint analysis of three availableAfrican data sets also obtained negative Tajima’s D andsignificant Fu and Li’s F and F* statistics (also based onthe spectrum of mutations; see Fu and Li 1993). The sig-nificant values for these tests in African populations indi-cate an excess of low-frequency variants, and can be inter-preted in different ways. One possibility is that the demo-graphic history of these populations explains the results.For example, it is known that either rapid populationgrowth, or the analysis of an admixed sample of individu-als (i.e. from many ethnicities, as was the case in the anal-ysis of individuals from many regions within Africa), canboth result in a data set with an excess of low-frequencyvariants (Ptak and Przeworski, 2002). Alternatively, puri-fying natural selection could explain these results, withmost variants being maintained at low frequencies due toselection against deleterious mutations. This interpreta-tion would imply that although selective constraint existsin African populations, it is not complete; that is, somevariants can persist in the population, albeit at low fre-quencies.The lack of deviation from neutral-equilibrium expecta-
tions when European and Asian populations were testedcan also be interpreted in different ways. The populationsmay have experienced a relaxation of selective con-straints, resulting in a neutral pattern of variation. Alter-natively, these populations may be under diversifying nat-ural selection, but the power of the tests may be insuffi-cient to reject the null hypothesis of neutrality. Inaddition, it is possible that population expansion in non-Africans has resulted in a deviation from neutral expecta-tions that masks the effects of diversifying natural selec-tion. The challenge of distinguishing among selective anddemographic hypotheses at MC1R will require furtherstudies, including joint analyses of different loci, whichwill allow demographic and selective scenarios to be reli-ably distinguished (Goldstein and Chikhi, 2002).
104 E.E. HARRIS AND D. MEYER
American Journal of Physical Anthropology—DOI 10.1002/ajpa

Alternative interpretations of testsof neutrality at MC1R
The strikingly low levels of variation in African popula-tions, coupled with the results of the McDonald–Kreitmantest described above, favor the scenario proposed by Har-ding et al. (2000), according to which this locus was underselective constraint in Africa, and these constraintsbecame relaxed in Europe and Asia. An alternative inter-pretation, however, was proposed by Rogers et al. (2004).They explained that the evolutionary transition from lightskin covered with hair (characteristic of nonhuman pri-mates) to dark skin in early humans may have involvedadaptive evolution at the MC1R locus. Evidence for thisargument comes from the fact that the ratio of nonsynony-mous to synonymous substitutions at MC1R betweenhumans and chimpanzees is unusually high (0.63) whencompared to the genomic background for primates (0.21;see Yang and Nielsen, 1998), indicating that change atthis locus was driven by selection in the divergencebetween these two species. The comparison of human andchimpanzee sequences does not allow us to distinguishwhether changes occurred specifically on the human line-age, on the chimpanzee lineage, or on both of these line-ages. However, under the assumption that changesoccurred on the human lineage, a biological explanationfor the selective advantage was proposed by Rogers et al.(2004). Increased pigmentation would provide protectionfrom sunlight in an environment where hominids wouldbe increasingly exposed to sunlight (as a consequence oftheir loss of hair, and living in a savanna environment).If evolution of MC1R was adaptive in the lineage lead-
ing to humans, then this changes the interpretation of theMacDonald-Kreitman test. The similarity between Eura-sian polymorphism and human-chimpanzee divergencefound in the MK test could reflect adaptive evolution atboth between species and within species levels (i.e.between humans and chimpanzees and within Eura-sians), rather than neutrality (Rogers et al., 2004). Thispossibility serves as a reminder that the results of theMacDonald-Kreitman test may allow alternative interpre-tations. That is, similar ratios of nonsynonymous to syn-onymous variation for both polymorphism data and diver-gence data could indicate neutral evolution at both theselevels or, alternatively, it could indicate selection occur-ring at both these levels. This indicates that it may bepremature to conclude that variation in Eurasians oc-curred neutrally, and we should not reject the possibilityof diversifying selection at MC1R among Europeans andAsians.
Conclusions on selection at MC1R
In conclusion, the population analyses of MC1R varia-tion allow us to minimally state the following. African andnon-African populations have strikingly different patternsof genetic variation. There is little doubt that African pop-ulations experience purifying selection, but the pattern ofvariation among non-Africans can be accounted for by ei-ther of two scenarios: relaxed selective constraint or diver-sifying selection. In order to evaluate the importance ofthese alternatives, future studies will need to collect datafrom more populations and will need to carry out jointanalyses of MC1R variation with that of additional loci,which can serve as controls for the demographic history ofpopulations and help separate the relative effects of popu-lation history and natural selection.
Other genes involved in skin color variation
This discussion has focused largely on the role of MC1Rin explaining the genetic basis of variation in human skincolor. This emphasis owes itself to the fact that, untilrecently, this was the only gene implicated in normal vari-ation in human and hair color (Rees, 2004). However, sev-eral observations indicate that skin color is a multi-genetic trait. These include the following: the finding thattwins that share identical MC1R genotypes differ consid-erably in skin color, the observation that among Eurasiansmany individuals of light skin color carry the same allelesas those of African individuals (Rana et al., 1999; Hardinget al., 2000), and the finding that human skin color varia-tion is most certainly a result not only of the relative pro-portion of pheomelanin and eumelanin but also of thetotal amount of pigment produced, and its distribution inthe skin (Barsh, 2003; Rees, 2004). Interestingly, skincolor shows more within-population diversity in sub-Saharan Africa than in other regions of the world (Rele-thford, 2000), a result apparently at odds with the reducedvariation of MC1R among Africans. This may be inter-preted as a consequence of our poor knowledge of the com-plete repertoire of genes influencing pigmentation.Knowledge of the biochemical pathways that play a role
in human pigmentation has allowed novel candidategenes to be investigated, and promising results have beenobtained. Graf et al. (2005) investigated the role of varia-tion in the Membrane Associated Transporter Protein(MATP) in human pigmentation. They found a significantassociation between specific nucleotide variants detectedin Caucasians and phenotypic variation in hair and skincolor within this population. Lamason et al. (2005) investi-gated the SLC24A5 gene, which was selected as a candi-date because it was found to play an important role indetermining the number, size, and density of melano-somes of the zebrafish (i.e. the melanin containing vesicleswithin melanocytes). Within human populations, anextremely high population differentiation was found at aspecific polymorphic site within this locus (that corre-sponds to amino acid 111 in the third exon of the gene). Aderived variant coding for threonine is virtually fixed inEuropeans, whereas among Africans, East-Asians, and In-digenous American populations the ancestral variant cod-ing for alanine is at high frequencies, yielding anextremely high difference in allele frequency between pop-ulations (Lamason et al., 2005). In addition, variationamong Europeans was extremely low, suggesting that thislocus may have experienced a selective sweep. Finally,Lamason et al. (2005) were able to show that in admixedEuropean African populations the variant at this siteexplains between 25 and 38% of the variation in pigmen-tation.The result obtained for the SLC24A5 gene is illustrative
of the fact that different genes underlying a single pheno-typic trait can be under different modes of selection.Diversifying selection (or alternatively, neutral evolutionafter relaxation from a functional constraint) character-izes MC1R evolution, while the SLC24A5 gene appears tobe evolving under positive selection in European popula-tions. Recent surveys of SNP polymorphism employingthe extended haplotype homozygosity approach have un-covered additional loci involved in pigmentation as candi-dates for selection, emphasizing the multigenic basis ofvariation in pigmentation. For example, a genome scan byVoight et al. (2006; see subsection Haplotypic diversity-based approaches in the section Scanning the genome for
105MOLECULAR SIGNATURE OF SELECTION IN HUMANS
American Journal of Physical Anthropology—DOI 10.1002/ajpa

genes shaped by natural selection) found clear evidence forpositive selection in Europeans not only at SLC24A5 butalso at four additional loci involved in pigmentation:OCA2, MYO5A, DTNBP1, and TYRP1. Another recentstudy (Izagirre et al., 2006), also employing the EHHapproach, found evidence for selection at the LYST,TP53BP1, and RAD50 loci, which are involved in variousaspects of photoprotection against UV damage. Interest-ingly, these three loci were found to be positively selectedspecifically in the African population samples (Izagirre etal., 2006), indicating that recent adaptive evolution in therepertoire of genes involved in pigmentation may indeedhave taken place in African populations. These recentfindings indicate that in the near future we can expect thestudy of natural selection on human skin color to growmore complex, and to incorporate analyses - both geneticand functional - of a wider array of genetic loci.
THE SENSATION OF BITTER-TASTE
Discrimination of taste has long been of interest togeneticists and anthropologists as it mediates our proxi-mate decisions about which foods we eat and, evolutionar-ily, it undoubtedly has been important in shaping thedietary and ecological specializations of different humangroups (Hladik and Simmen, 1996; Molnar, 2002). Humansare generally regarded as having five categories of tasteperception including sweet, sour, bitter, salty and unami(the ability to taste glutamate) (Drayna, 2005). Of these,the sense of bitter-taste has probably received the mostattention (at least by anthropologists), particularly withrespect to the trait for tasting phenylthiocarbamide(PTC). This trait was discovered serendipitously in theearly 1930s, when Fox found that some people find thesubstance intensely bitter while others do not (Fox, 1932).Studies by Harris and Kalmus (1949) and many otherssince then (see Guo and Reed, 2001) have extensivelydocumented the frequencies of taster and nontaster indi-viduals within populations.PTC is itself not a component of any known human
foods, but it shares a chemical moiety (��N¼¼C¼¼S) withmany plant foods that elicit the same taste response asdoes PTC (Molnar, 2002; Meyerhof et al., 2005). Thesecompounds are found in the Cruciferae family (includingturnips, cabbage, broccoli, mustard greens and others) aswell as in cassava. Based on observations of similar pro-portions of taster versus nontaster phenotypes in chim-panzees and other great apes, as in humans, the Britishgeneticist R.A. Fisher and colleagues (Fisher et al., 1939)were the first to hypothesize balancing selection in theevolution of PTC tasting:
Without the conditions of stable equilibrium it is scarcelyconceivable that the gene ratio should have remained the sameover the million or more generations that have elapsed since theseparation of the anthropoid and hominid stocks. The remarkableinference follows that over this period the heterozygotes for thisapparently valueless character have enjoyed a selective advant-age over both the homozygotes, and this, both in the lineage ofthe evolving chimpanzees and that in evolving man. Wherein theselective advantages lie, it would at present be useless to conjec-ture, but of the existence of a stably balanced and enduringdimorphism determined by this gene there can be no room fordoubt. (p. 750)
Although Fisher and coresearchers did not speculate onthe selective mechanism that maintained the two pheno-types in balance, a form of selection favoring heterozygote
individuals could offer an explanation. With respect tosuch an explanation, it is interesting to note that severalrecent studies have hypothesized that the allele for the so-called \non-taster" phenotype is in fact functional, andcodes for a receptor that binds a bitter compound not yetdiscovered (Wooding et al., 2004; Drayna, 2005; Kim andDrayna, 2005). One could thus argue that heterozygousindividuals might indeed have a phenotype capable oftasting a broader range of compounds, thus explaining themaintenance of the polymorphism.In general, an explanation of a selective advantage for
bitter-taste sensation is that it helps individuals avoidingesting toxic substances. Many bitter substances inplants are known to be toxic (Meyerhof et al., 2005), a pre-sumed adaptation by the plant to prevent its consumption.The interaction is therefore an example of plant–herbi-vore co-evolution. A more specific selective hypothesis hasbeen proposed for PTC discrimination and dates fromthe 1940s (Mackenzie and Mackenzie, 1943; Harris andKalmus, 1949). It was discovered that there is a correla-tion between thyroid disease and the PTC nontaster phe-notype. The causal explanation is that PTC interfereswith the normal uptake of iodine by the thyroid gland andin turn reduces thyroid function, resulting in lowered me-tabolism in children and lowered fertility in adults(Jackson, 1993). This particular explanation is common ingenetic and anthropological texts (Cavalli-Sforza and Bod-mer, 1971; Cavalli-Sforza et al., 1994; Molnar, 2002) andproposes that the taster for PTC gains a selective advant-age by being able to avoid the ingestion of plants that con-tain compounds that interfere with thyroid function.Although the ability to avoid bitter compounds is usu-
ally believed to be an advantageous trait, in certain envi-ronmental circumstances it is conceivable that ingestingbitter substances is advantageous. Jackson (1990, 1996),for example, proposed that individuals living in regionswhere malaria is prevalent might gain a selective advant-age by ingesting plants containing cyanide compoundsbecause these compounds, at subacute levels, wouldreduce the severity of Plasmodium falciparum infection(Nagel et al., 1980). To our knowledge this intriguing hy-pothesis has never been rigorously studied.Today, the genetics of bitter-taste sensation is much bet-
ter known. We now know that besides the specific geneassociated with PTC-tasting, there exists an entire reper-toire of bitter-taste genes that encode receptors on thetongue for detecting bitter substances (Drayna, 2005).Our improved understanding of the molecular genetics ofbitter-taste has permitted recent analyses that compareDNA sequences of these genes between and within spe-cies. In what follows, we discuss analyses surveying therepertoire of bitter-taste genes (Wang et al., 2004; Kimet al., 2005), as well as analyses that target two specific bit-ter taste genes, the PTC gene (also known as TAS2R38)and the TAS2R16 gene (Wooding et al., 2004; Soranzoet al., 2005).
Genetic localization and inheritance pattern
Humans possess 33 bitter taste genes (called TAS2Rs)of which 25 are presumed to be functional genes, and 8are presumably pseudogenes. The majority of bitter tastegenes are found on either of two chromosomes (12 or 7)with a single gene on chromosome 5 (Shi et al., 2003; Kimet al., 2004). The genes consist of short intronless sequen-ces (approximately 1,000 base pairs in length) coding forG protein-coupled receptors believed to be expressed on
106 E.E. HARRIS AND D. MEYER
American Journal of Physical Anthropology—DOI 10.1002/ajpa
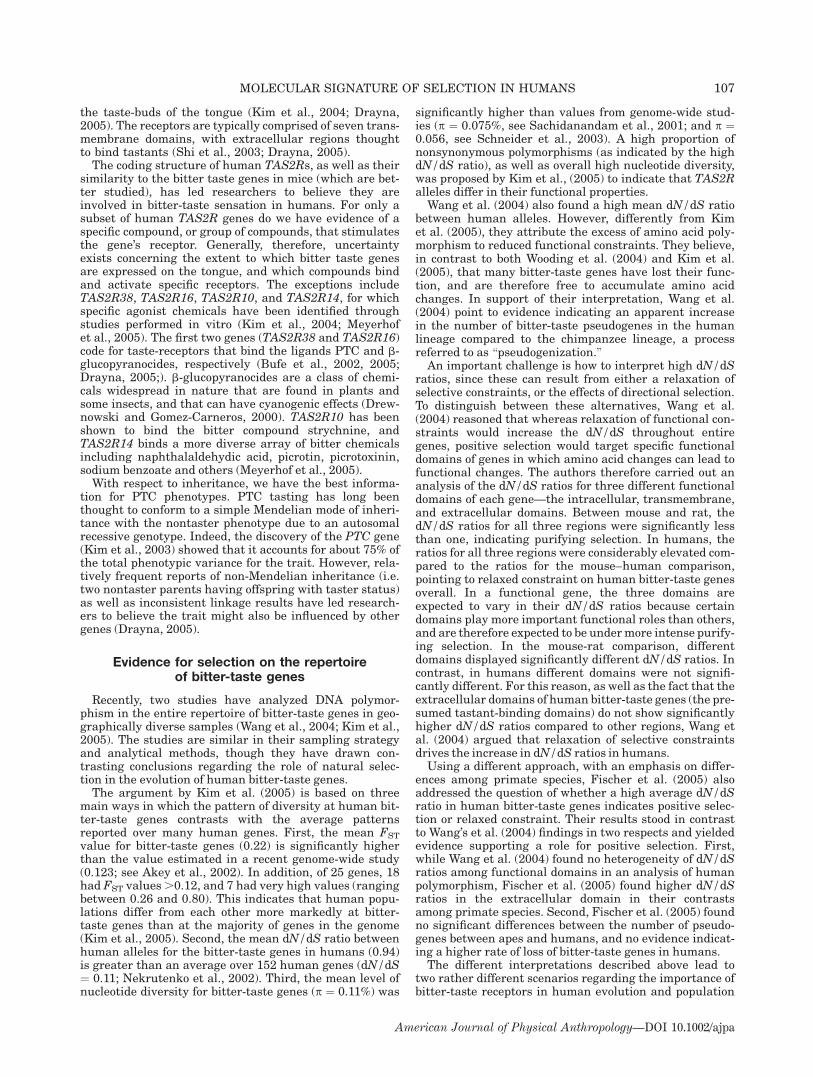
the taste-buds of the tongue (Kim et al., 2004; Drayna,2005). The receptors are typically comprised of seven trans-membrane domains, with extracellular regions thoughtto bind tastants (Shi et al., 2003; Drayna, 2005).The coding structure of human TAS2Rs, as well as their
similarity to the bitter taste genes in mice (which are bet-ter studied), has led researchers to believe they areinvolved in bitter-taste sensation in humans. For only asubset of human TAS2R genes do we have evidence of aspecific compound, or group of compounds, that stimulatesthe gene’s receptor. Generally, therefore, uncertaintyexists concerning the extent to which bitter taste genesare expressed on the tongue, and which compounds bindand activate specific receptors. The exceptions includeTAS2R38, TAS2R16, TAS2R10, and TAS2R14, for whichspecific agonist chemicals have been identified throughstudies performed in vitro (Kim et al., 2004; Meyerhofet al., 2005). The first two genes (TAS2R38 and TAS2R16)code for taste-receptors that bind the ligands PTC and b-glucopyranocides, respectively (Bufe et al., 2002, 2005;Drayna, 2005;). b-glucopyranocides are a class of chemi-cals widespread in nature that are found in plants andsome insects, and that can have cyanogenic effects (Drew-nowski and Gomez-Carneros, 2000). TAS2R10 has beenshown to bind the bitter compound strychnine, andTAS2R14 binds a more diverse array of bitter chemicalsincluding naphthalaldehydic acid, picrotin, picrotoxinin,sodium benzoate and others (Meyerhof et al., 2005).With respect to inheritance, we have the best informa-
tion for PTC phenotypes. PTC tasting has long beenthought to conform to a simple Mendelian mode of inheri-tance with the nontaster phenotype due to an autosomalrecessive genotype. Indeed, the discovery of the PTC gene(Kim et al., 2003) showed that it accounts for about 75% ofthe total phenotypic variance for the trait. However, rela-tively frequent reports of non-Mendelian inheritance (i.e.two nontaster parents having offspring with taster status)as well as inconsistent linkage results have led research-ers to believe the trait might also be influenced by othergenes (Drayna, 2005).
Evidence for selection on the repertoireof bitter-taste genes
Recently, two studies have analyzed DNA polymor-phism in the entire repertoire of bitter-taste genes in geo-graphically diverse samples (Wang et al., 2004; Kim et al.,2005). The studies are similar in their sampling strategyand analytical methods, though they have drawn con-trasting conclusions regarding the role of natural selec-tion in the evolution of human bitter-taste genes.The argument by Kim et al. (2005) is based on three
main ways in which the pattern of diversity at human bit-ter-taste genes contrasts with the average patternsreported over many human genes. First, the mean FST
value for bitter-taste genes (0.22) is significantly higherthan the value estimated in a recent genome-wide study(0.123; see Akey et al., 2002). In addition, of 25 genes, 18had FST values.0.12, and 7 had very high values (rangingbetween 0.26 and 0.80). This indicates that human popu-lations differ from each other more markedly at bitter-taste genes than at the majority of genes in the genome(Kim et al., 2005). Second, the mean dN/dS ratio betweenhuman alleles for the bitter-taste genes in humans (0.94)is greater than an average over 152 human genes (dN/dS¼ 0.11; Nekrutenko et al., 2002). Third, the mean level ofnucleotide diversity for bitter-taste genes (p ¼ 0.11%) was
significantly higher than values from genome-wide stud-ies (p ¼ 0.075%, see Sachidanandam et al., 2001; and p ¼0.056, see Schneider et al., 2003). A high proportion ofnonsynonymous polymorphisms (as indicated by the highdN/dS ratio), as well as overall high nucleotide diversity,was proposed by Kim et al., (2005) to indicate that TAS2Ralleles differ in their functional properties.Wang et al. (2004) also found a high mean dN/dS ratio
between human alleles. However, differently from Kimet al. (2005), they attribute the excess of amino acid poly-morphism to reduced functional constraints. They believe,in contrast to both Wooding et al. (2004) and Kim et al.(2005), that many bitter-taste genes have lost their func-tion, and are therefore free to accumulate amino acidchanges. In support of their interpretation, Wang et al.(2004) point to evidence indicating an apparent increasein the number of bitter-taste pseudogenes in the humanlineage compared to the chimpanzee lineage, a processreferred to as \pseudogenization."An important challenge is how to interpret high dN/dS
ratios, since these can result from either a relaxation ofselective constraints, or the effects of directional selection.To distinguish between these alternatives, Wang et al.(2004) reasoned that whereas relaxation of functional con-straints would increase the dN/dS throughout entiregenes, positive selection would target specific functionaldomains of genes in which amino acid changes can lead tofunctional changes. The authors therefore carried out ananalysis of the dN/dS ratios for three different functionaldomains of each gene—the intracellular, transmembrane,and extracellular domains. Between mouse and rat, thedN/dS ratios for all three regions were significantly lessthan one, indicating purifying selection. In humans, theratios for all three regions were considerably elevated com-pared to the ratios for the mouse–human comparison,pointing to relaxed constraint on human bitter-taste genesoverall. In a functional gene, the three domains areexpected to vary in their dN/dS ratios because certaindomains play more important functional roles than others,and are therefore expected to be undermore intense purify-ing selection. In the mouse-rat comparison, differentdomains displayed significantly different dN/dS ratios. Incontrast, in humans different domains were not signifi-cantly different. For this reason, as well as the fact that theextracellular domains of human bitter-taste genes (the pre-sumed tastant-binding domains) do not show significantlyhigher dN/dS ratios compared to other regions, Wang etal. (2004) argued that relaxation of selective constraintsdrives the increase in dN/dS ratios in humans.Using a different approach, with an emphasis on differ-
ences among primate species, Fischer et al. (2005) alsoaddressed the question of whether a high average dN/dSratio in human bitter-taste genes indicates positive selec-tion or relaxed constraint. Their results stood in contrastto Wang’s et al. (2004) findings in two respects and yieldedevidence supporting a role for positive selection. First,while Wang et al. (2004) found no heterogeneity of dN/dSratios among functional domains in an analysis of humanpolymorphism, Fischer et al. (2005) found higher dN/dSratios in the extracellular domain in their contrastsamong primate species. Second, Fischer et al. (2005) foundno significant differences between the number of pseudo-genes between apes and humans, and no evidence indicat-ing a higher rate of loss of bitter-taste genes in humans.The different interpretations described above lead to
two rather different scenarios regarding the importance ofbitter-taste receptors in human evolution and population
107MOLECULAR SIGNATURE OF SELECTION IN HUMANS
American Journal of Physical Anthropology—DOI 10.1002/ajpa
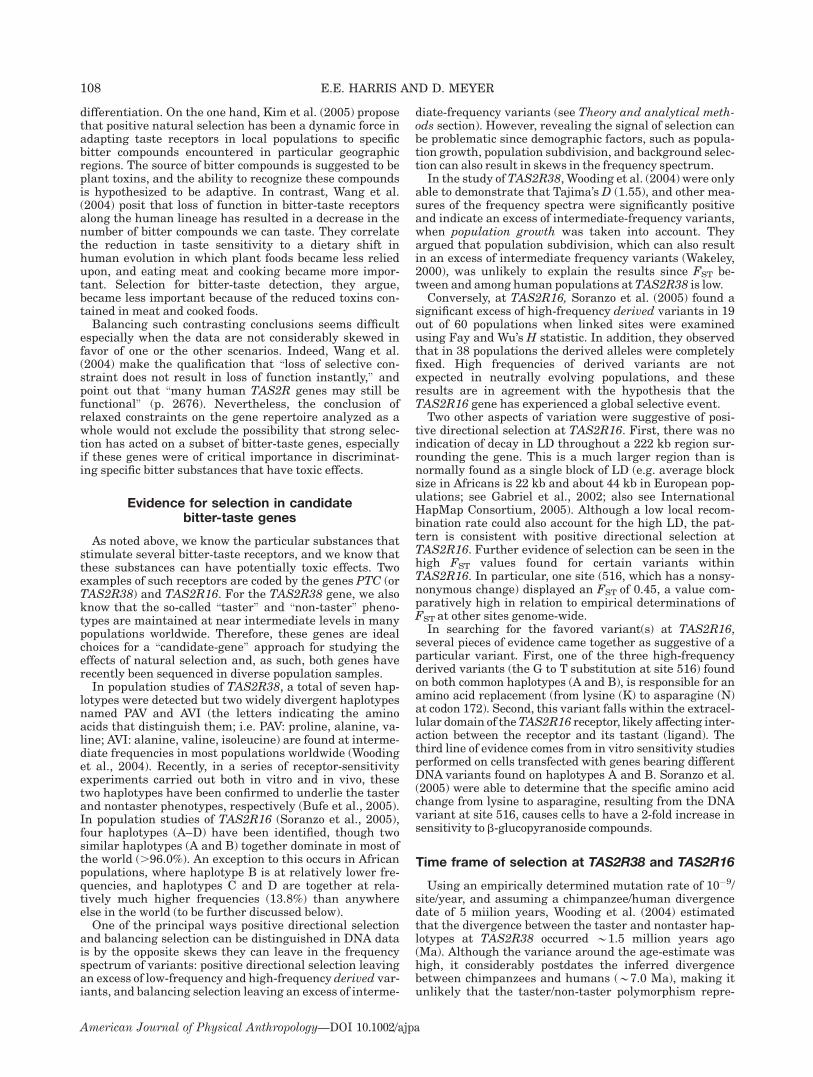
differentiation. On the one hand, Kim et al. (2005) proposethat positive natural selection has been a dynamic force inadapting taste receptors in local populations to specificbitter compounds encountered in particular geographicregions. The source of bitter compounds is suggested to beplant toxins, and the ability to recognize these compoundsis hypothesized to be adaptive. In contrast, Wang et al.(2004) posit that loss of function in bitter-taste receptorsalong the human lineage has resulted in a decrease in thenumber of bitter compounds we can taste. They correlatethe reduction in taste sensitivity to a dietary shift inhuman evolution in which plant foods became less reliedupon, and eating meat and cooking became more impor-tant. Selection for bitter-taste detection, they argue,became less important because of the reduced toxins con-tained in meat and cooked foods.Balancing such contrasting conclusions seems difficult
especially when the data are not considerably skewed infavor of one or the other scenarios. Indeed, Wang et al.(2004) make the qualification that \loss of selective con-straint does not result in loss of function instantly," andpoint out that \many human TAS2R genes may still befunctional" (p. 2676). Nevertheless, the conclusion ofrelaxed constraints on the gene repertoire analyzed as awhole would not exclude the possibility that strong selec-tion has acted on a subset of bitter-taste genes, especiallyif these genes were of critical importance in discriminat-ing specific bitter substances that have toxic effects.
Evidence for selection in candidatebitter-taste genes
As noted above, we know the particular substances thatstimulate several bitter-taste receptors, and we know thatthese substances can have potentially toxic effects. Twoexamples of such receptors are coded by the genes PTC (orTAS2R38) and TAS2R16. For the TAS2R38 gene, we alsoknow that the so-called \taster" and \non-taster" pheno-types are maintained at near intermediate levels in manypopulations worldwide. Therefore, these genes are idealchoices for a \candidate-gene" approach for studying theeffects of natural selection and, as such, both genes haverecently been sequenced in diverse population samples.In population studies of TAS2R38, a total of seven hap-
lotypes were detected but two widely divergent haplotypesnamed PAV and AVI (the letters indicating the aminoacids that distinguish them; i.e. PAV: proline, alanine, va-line; AVI: alanine, valine, isoleucine) are found at interme-diate frequencies in most populations worldwide (Woodinget al., 2004). Recently, in a series of receptor-sensitivityexperiments carried out both in vitro and in vivo, thesetwo haplotypes have been confirmed to underlie the tasterand nontaster phenotypes, respectively (Bufe et al., 2005).In population studies of TAS2R16 (Soranzo et al., 2005),four haplotypes (A–D) have been identified, though twosimilar haplotypes (A and B) together dominate in most ofthe world (.96.0%). An exception to this occurs in Africanpopulations, where haplotype B is at relatively lower fre-quencies, and haplotypes C and D are together at rela-tively much higher frequencies (13.8%) than anywhereelse in the world (to be further discussed below).One of the principal ways positive directional selection
and balancing selection can be distinguished in DNA datais by the opposite skews they can leave in the frequencyspectrum of variants: positive directional selection leavingan excess of low-frequency and high-frequency derived var-iants, and balancing selection leaving an excess of interme-
diate-frequency variants (see Theory and analytical meth-ods section). However, revealing the signal of selection canbe problematic since demographic factors, such as popula-tion growth, population subdivision, and background selec-tion can also result in skews in the frequency spectrum.In the study ofTAS2R38, Wooding et al. (2004) were only
able to demonstrate that Tajima’s D (1.55), and other mea-sures of the frequency spectra were significantly positiveand indicate an excess of intermediate-frequency variants,when population growth was taken into account. Theyargued that population subdivision, which can also resultin an excess of intermediate frequency variants (Wakeley,2000), was unlikely to explain the results since FST be-tween and among human populations atTAS2R38 is low.Conversely, at TAS2R16, Soranzo et al. (2005) found a
significant excess of high-frequency derived variants in 19out of 60 populations when linked sites were examinedusing Fay and Wu’s H statistic. In addition, they observedthat in 38 populations the derived alleles were completelyfixed. High frequencies of derived variants are notexpected in neutrally evolving populations, and theseresults are in agreement with the hypothesis that theTAS2R16 gene has experienced a global selective event.Two other aspects of variation were suggestive of posi-
tive directional selection at TAS2R16. First, there was noindication of decay in LD throughout a 222 kb region sur-rounding the gene. This is a much larger region than isnormally found as a single block of LD (e.g. average blocksize in Africans is 22 kb and about 44 kb in European pop-ulations; see Gabriel et al., 2002; also see InternationalHapMap Consortium, 2005). Although a low local recom-bination rate could also account for the high LD, the pat-tern is consistent with positive directional selection atTAS2R16. Further evidence of selection can be seen in thehigh FST values found for certain variants withinTAS2R16. In particular, one site (516, which has a nonsy-nonymous change) displayed an FST of 0.45, a value com-paratively high in relation to empirical determinations ofFST at other sites genome-wide.In searching for the favored variant(s) at TAS2R16,
several pieces of evidence came together as suggestive of aparticular variant. First, one of the three high-frequencyderived variants (the G to T substitution at site 516) foundon both common haplotypes (A and B), is responsible for anamino acid replacement (from lysine (K) to asparagine (N)at codon 172). Second, this variant falls within the extracel-lular domain of theTAS2R16 receptor, likely affecting inter-action between the receptor and its tastant (ligand). Thethird line of evidence comes from in vitro sensitivity studiesperformed on cells transfected with genes bearing differentDNA variants found on haplotypes A and B. Soranzo et al.(2005) were able to determine that the specific amino acidchange from lysine to asparagine, resulting from the DNAvariant at site 516, causes cells to have a 2-fold increase insensitivity to b-glucopyranoside compounds.
Time frame of selection at TAS2R38 and TAS2R16
Using an empirically determined mutation rate of 10�9/site/year, and assuming a chimpanzee/human divergencedate of 5 miilion years, Wooding et al. (2004) estimatedthat the divergence between the taster and nontaster hap-lotypes at TAS2R38 occurred *1.5 million years ago(Ma). Although the variance around the age-estimate washigh, it considerably postdates the inferred divergencebetween chimpanzees and humans (*7.0 Ma), making itunlikely that the taster/non-taster polymorphism repre-
108 E.E. HARRIS AND D. MEYER
American Journal of Physical Anthropology—DOI 10.1002/ajpa
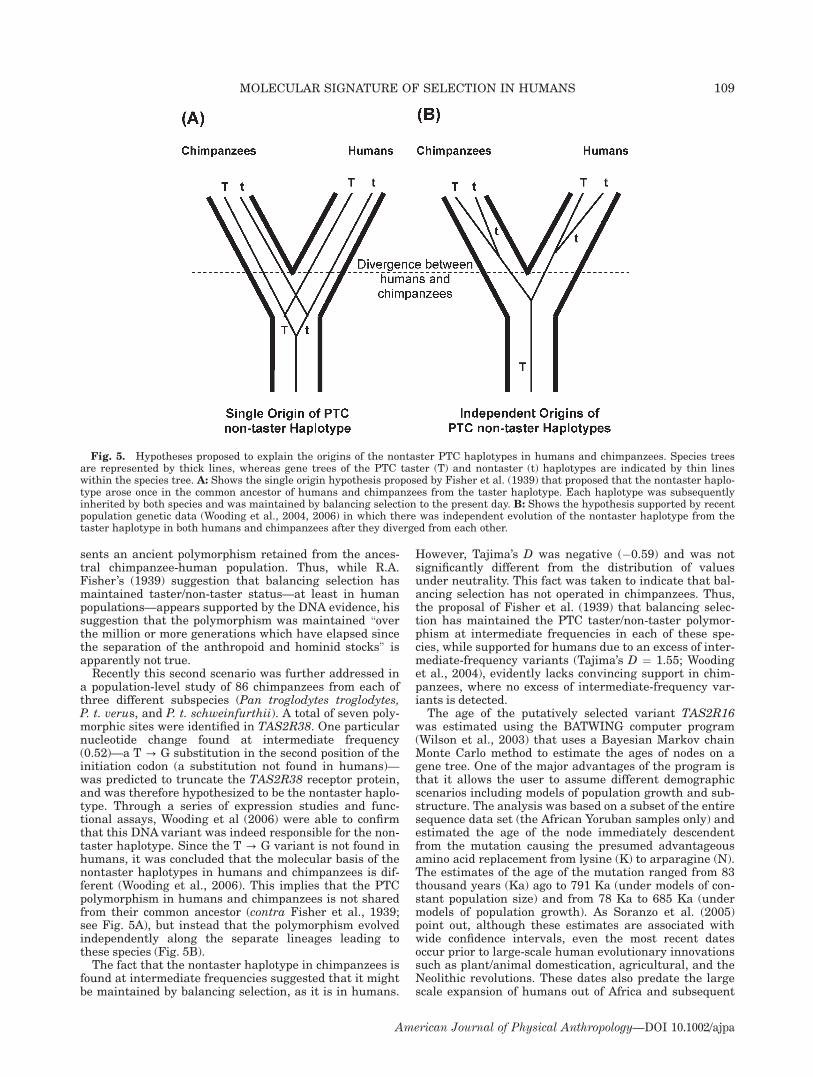
sents an ancient polymorphism retained from the ances-tral chimpanzee-human population. Thus, while R.A.Fisher’s (1939) suggestion that balancing selection hasmaintained taster/non-taster status—at least in humanpopulations—appears supported by the DNA evidence, hissuggestion that the polymorphism was maintained \overthe million or more generations which have elapsed sincethe separation of the anthropoid and hominid stocks" isapparently not true.Recently this second scenario was further addressed in
a population-level study of 86 chimpanzees from each ofthree different subspecies (Pan troglodytes troglodytes,P. t. verus, and P. t. schweinfurthii). A total of seven poly-morphic sites were identified in TAS2R38. One particularnucleotide change found at intermediate frequency(0.52)—a T ? G substitution in the second position of theinitiation codon (a substitution not found in humans)—was predicted to truncate the TAS2R38 receptor protein,and was therefore hypothesized to be the nontaster haplo-type. Through a series of expression studies and func-tional assays, Wooding et al (2006) were able to confirmthat this DNA variant was indeed responsible for the non-taster haplotype. Since the T ? G variant is not found inhumans, it was concluded that the molecular basis of thenontaster haplotypes in humans and chimpanzees is dif-ferent (Wooding et al., 2006). This implies that the PTCpolymorphism in humans and chimpanzees is not sharedfrom their common ancestor (contra Fisher et al., 1939;see Fig. 5A), but instead that the polymorphism evolvedindependently along the separate lineages leading tothese species (Fig. 5B).The fact that the nontaster haplotype in chimpanzees is
found at intermediate frequencies suggested that it mightbe maintained by balancing selection, as it is in humans.
However, Tajima’s D was negative (�0.59) and was notsignificantly different from the distribution of valuesunder neutrality. This fact was taken to indicate that bal-ancing selection has not operated in chimpanzees. Thus,the proposal of Fisher et al. (1939) that balancing selec-tion has maintained the PTC taster/non-taster polymor-phism at intermediate frequencies in each of these spe-cies, while supported for humans due to an excess of inter-mediate-frequency variants (Tajima’s D ¼ 1.55; Woodinget al., 2004), evidently lacks convincing support in chim-panzees, where no excess of intermediate-frequency var-iants is detected.The age of the putatively selected variant TAS2R16
was estimated using the BATWING computer program(Wilson et al., 2003) that uses a Bayesian Markov chainMonte Carlo method to estimate the ages of nodes on agene tree. One of the major advantages of the program isthat it allows the user to assume different demographicscenarios including models of population growth and sub-structure. The analysis was based on a subset of the entiresequence data set (the African Yoruban samples only) andestimated the age of the node immediately descendentfrom the mutation causing the presumed advantageousamino acid replacement from lysine (K) to arparagine (N).The estimates of the age of the mutation ranged from 83thousand years (Ka) ago to 791 Ka (under models of con-stant population size) and from 78 Ka to 685 Ka (undermodels of population growth). As Soranzo et al. (2005)point out, although these estimates are associated withwide confidence intervals, even the most recent datesoccur prior to large-scale human evolutionary innovationssuch as plant/animal domestication, agricultural, and theNeolithic revolutions. These dates also predate the largescale expansion of humans out of Africa and subsequent
Fig. 5. Hypotheses proposed to explain the origins of the nontaster PTC haplotypes in humans and chimpanzees. Species treesare represented by thick lines, whereas gene trees of the PTC taster (T) and nontaster (t) haplotypes are indicated by thin lineswithin the species tree. A: Shows the single origin hypothesis proposed by Fisher et al. (1939) that proposed that the nontaster haplo-type arose once in the common ancestor of humans and chimpanzees from the taster haplotype. Each haplotype was subsequentlyinherited by both species and was maintained by balancing selection to the present day. B: Shows the hypothesis supported by recentpopulation genetic data (Wooding et al., 2004, 2006) in which there was independent evolution of the nontaster haplotype from thetaster haplotype in both humans and chimpanzees after they diverged from each other.
109MOLECULAR SIGNATURE OF SELECTION IN HUMANS
American Journal of Physical Anthropology—DOI 10.1002/ajpa

differentiation among non-African populations (Lahr andFoley, 1998; Tishkoff and Verelli, 2003) and would appearto place the origin of the mutation at a period whenhumans were hunter-gatherers and plant foods made up alarge portion of the diet. Due to the presumed functionalsignificance of the mutation, as well as its high frequencyworldwide (as the variant is present on both haplotypes Aand B), it was suggested that selection probably acted onthe variant soon after it arose (Soranzo et al., 2005).
Scenarios of selection on the bitter-taste genes,TAS2R38 and TAS2R16
As R.A. Fisher pointed out, a hypothesis of balancingselection at TAS2R38 requires that the nontaster haplo-type (AVI) offer an advantage in the heterozygous statethat is greater than either homozygote. Although the AVIhaplotype might be inferred to be nonfunctional, severallines of evidence indicate that it is functional andexpressed. The haplotype shows no stop codons or dele-tions (Drayna, 2005) and a recent study indicated that thehaplotype is expressed at the mRNA level in humantongue cells at nearly equal levels to the taster haplotype(Bufe et al., 2005). Based on this evidence, severalresearchers have suggested that the nontaster haplotypecodes for a distinct receptor that binds some unknownligand (Kim et al., 2004; Wooding et al., 2004; Drayna,2005). A selective advantage has been proposed for thetaster haplotype: the sensitivity to PTC-like compounds(i.e. compounds having the ��N¼¼C¼¼S chemical moiety)helps one avoid plant chemicals potentially causing thy-roid malfunction, an advantage that may be greater inindividuals living in iodine-deficient regions (Boyce et al.,1976). However, the heterozygote would presumably gaina selective advantage by being sensitive not only to thesecompounds but also to other aversive compounds that theAVI haplotype would be capable of detecting (Wooding etal., 2004; Drayna, 2005). It should be noted that severaladditional haplotypes at TAS2R38 were also found torespond to PTC, but at intermediate response levels, sug-gesting that multiple haplotypes might determine a rangeof PTC sensitivities within populations (Bufe et al., 2005).Polymorphisms for a range of sensitivities might havebeen driven by evolutionary forces promoting variabilityat the receptor (Bufe et al., 2005). The enhanced detectionof bitter compounds by some individuals may have beenadvantageous for them to avoid harmful compounds, yetin other individuals a diminished bitter-sensitivity mightalso have been advantageous. Certain known benefits areknown (e.g. anticancer effects) from ingesting naturalPTC-like compounds in plants (Bufe et al., 2005). It hasalso been suggested that other haplotypes at TAS2R38might also be functional, and might enable the detectionof a wider array of bitter compounds (Wooding et al., 2004;Drayna, 2005).The bitter compounds that are detected by TAS2R16
(known as b-glucopyranosides) include compounds withknown cyanogenic toxic effects (Drewnowski and Gomez-Carneros, 2000). Physiological response in humans (Sor-anzo et al., 2005) is triggered by a variety of compoundsfound in plants: salicin (willow trees), arbutin (bear berry)and amygdalin (bitter almonds) linimarin (manioc), pru-nasin (almonds), osmoronin epoxide (Rosacea) and 4-glu-cosyoxymandelonitrile (Berberidaceae). Since the func-tional effects of the putative advantageous variant (N172)were equivalent for all bitter compounds tested, it was notpossible for researchers to determine whether one specific
compound caused the selective sweep. Therefore, Soranzoet al. (2005) concluded that it was a generalized responseto b-glucopyranosides in plants that brought the N172variant to high frequencies worldwide.An interesting observation was that the frequency of
the ancestral amino acid K172 at TAS2R16 (which resultsin a 2-fold less sensitive protein) was found at moderatefrequencies (13.8%) in central Africa compared to its verylow frequency or total absence in most other regions of theworld. Soranzo et al. (2005) observed that its distributionis very similar to the distribution of malaria-resistance al-leles in other genetic systems. This is a tantalizing findingsince there is some evidence indicating dietary-derived cy-anide compounds may help curtail Plasmodium falcipa-rum infection in humans (Nagel et al., 1980; Jackson,1996). An initial test of the association appeared to befairly strong—those African populations in which indicesof malaria risk were greatest tended to be the same popu-lations that had higher frequencies of the ancestral aminoacid K172 (Soranzo et al., 2005). It was hypothesized thatvariation in the TAS2R16 bitter-taste gene \results froma balance between protection against malaria and protec-tion against toxins in malaria-free zones." Testing of thishypothesis might entail further analysis of how plant-derived cyanide compounds interact with Plasmodium fal-ciparum, as well as analyses of the levels of blood-stageinfection in individuals bearing the ancestral K172 typecompared to those bearing the N172 type.If the hypothesis is true, we may infer that selection for
increased frequencies of the K172 allele in central Africanpopulations occurred around 6,000 years ago when Plas-modium falciparum became widespread in Africa due tothe spread of agriculture. Thus, selection on the K172type in Africa appears to have occurred much morerecently than positive selection on the N172 type.
DUFFY BLOOD GROUP POLYMORPHISM
The Duffy blood group was first discovered in 1950 byCutbush and Mollison (Cutbush and Mollison, 1950). TheDuffy gene encodes a receptor on the surface of erythro-cytes and is characterized by three alleles, FY*A, FY*B,and FY*O, with FY*O corresponding to the absence of theFy receptor. It is known that the FY*O allele confersalmost complete resistance to the malarial parasite, Plas-modium vivax (Miller et al., 1976). It is also known thatthe FY*O allele is nearly fixed in sub-Saharan Africans(East Africans, *.95; Pygmies, *1.0; West Africans, 1.0)where the P. vivax parasite is rare, which is a rather coun-terintuitive pattern (Livingstone, 1984). The FY*A andFY*B alleles are at approximately intermediate frequen-cies in Europe. However, in Eastern Asia and the Pacific,the FY*A allele is nearly fixed. When the degree of geneticdifferentiation among world regions is estimated for eachof the Duffy alleles, extremely high values are found: theFST value for the FY*O allele is 0.7831 (the highest knownFST for any human gene) and is 0.3325 for the FY*A allele,much higher than the average FST of *0.15 estimatedbased on the analyses of classical markers (Cavalli-Sforzaet al., 1994) as well as a more recent genome-wide esti-mate (FST ¼ 0.123) based on surveys of DNA sequence di-versity (Akey et al., 2002).Marked geographical differentiation at the Duffy locus,
as well as the known P. vivax resistance of the FY*O al-lele, pointed early to the hypothesis that natural selectionhas been a dominant force in shaping the distribution ofthe Duffy alleles among human populations. However, the
110 E.E. HARRIS AND D. MEYER
American Journal of Physical Anthropology—DOI 10.1002/ajpa
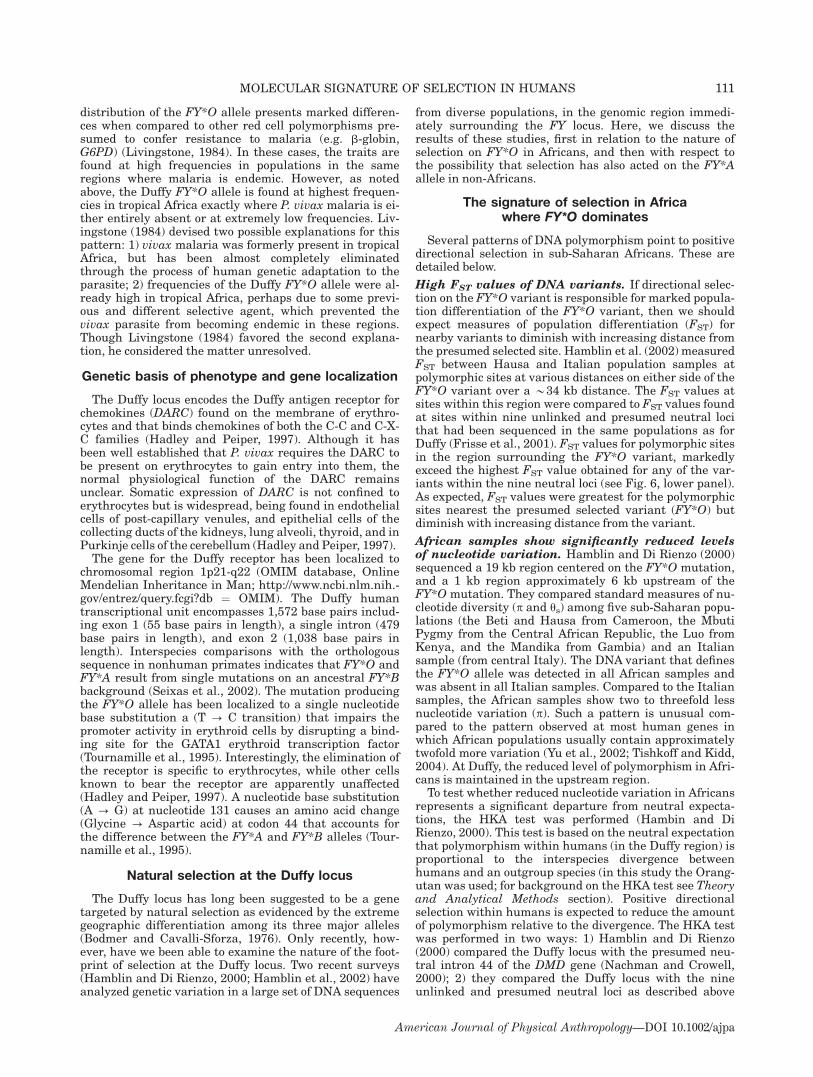
distribution of the FY*O allele presents marked differen-ces when compared to other red cell polymorphisms pre-sumed to confer resistance to malaria (e.g. b-globin,G6PD) (Livingstone, 1984). In these cases, the traits arefound at high frequencies in populations in the sameregions where malaria is endemic. However, as notedabove, the Duffy FY*O allele is found at highest frequen-cies in tropical Africa exactly where P. vivax malaria is ei-ther entirely absent or at extremely low frequencies. Liv-ingstone (1984) devised two possible explanations for thispattern: 1) vivax malaria was formerly present in tropicalAfrica, but has been almost completely eliminatedthrough the process of human genetic adaptation to theparasite; 2) frequencies of the Duffy FY*O allele were al-ready high in tropical Africa, perhaps due to some previ-ous and different selective agent, which prevented thevivax parasite from becoming endemic in these regions.Though Livingstone (1984) favored the second explana-tion, he considered the matter unresolved.
Genetic basis of phenotype and gene localization
The Duffy locus encodes the Duffy antigen receptor forchemokines (DARC) found on the membrane of erythro-cytes and that binds chemokines of both the C-C and C-X-C families (Hadley and Peiper, 1997). Although it hasbeen well established that P. vivax requires the DARC tobe present on erythrocytes to gain entry into them, thenormal physiological function of the DARC remainsunclear. Somatic expression of DARC is not confined toerythrocytes but is widespread, being found in endothelialcells of post-capillary venules, and epithelial cells of thecollecting ducts of the kidneys, lung alveoli, thyroid, and inPurkinje cells of the cerebellum (Hadley and Peiper, 1997).The gene for the Duffy receptor has been localized to
chromosomal region 1p21-q22 (OMIM database, OnlineMendelian Inheritance in Man; http://www.ncbi.nlm.nih.-gov/entrez/query.fcgi?db ¼ OMIM). The Duffy humantranscriptional unit encompasses 1,572 base pairs includ-ing exon 1 (55 base pairs in length), a single intron (479base pairs in length), and exon 2 (1,038 base pairs inlength). Interspecies comparisons with the orthologoussequence in nonhuman primates indicates that FY*O andFY*A result from single mutations on an ancestral FY*Bbackground (Seixas et al., 2002). The mutation producingthe FY*O allele has been localized to a single nucleotidebase substitution a (T ? C transition) that impairs thepromoter activity in erythroid cells by disrupting a bind-ing site for the GATA1 erythroid transcription factor(Tournamille et al., 1995). Interestingly, the elimination ofthe receptor is specific to erythrocytes, while other cellsknown to bear the receptor are apparently unaffected(Hadley and Peiper, 1997). A nucleotide base substitution(A ? G) at nucleotide 131 causes an amino acid change(Glycine ? Aspartic acid) at codon 44 that accounts forthe difference between the FY*A and FY*B alleles (Tour-namille et al., 1995).
Natural selection at the Duffy locus
The Duffy locus has long been suggested to be a genetargeted by natural selection as evidenced by the extremegeographic differentiation among its three major alleles(Bodmer and Cavalli-Sforza, 1976). Only recently, how-ever, have we been able to examine the nature of the foot-print of selection at the Duffy locus. Two recent surveys(Hamblin and Di Rienzo, 2000; Hamblin et al., 2002) haveanalyzed genetic variation in a large set of DNA sequences
from diverse populations, in the genomic region immedi-ately surrounding the FY locus. Here, we discuss theresults of these studies, first in relation to the nature ofselection on FY*O in Africans, and then with respect tothe possibility that selection has also acted on the FY*Aallele in non-Africans.
The signature of selection in Africawhere FY*O dominates
Several patterns of DNA polymorphism point to positivedirectional selection in sub-Saharan Africans. These aredetailed below.
High FST values of DNA variants. If directional selec-tion on the FY*O variant is responsible for marked popula-tion differentiation of the FY*O variant, then we shouldexpect measures of population differentiation (FST) fornearby variants to diminish with increasing distance fromthe presumed selected site. Hamblin et al. (2002) measuredFST between Hausa and Italian population samples atpolymorphic sites at various distances on either side of theFY*O variant over a *34 kb distance. The FST values atsites within this region were compared to FST values foundat sites within nine unlinked and presumed neutral locithat had been sequenced in the same populations as forDuffy (Frisse et al., 2001). FST values for polymorphic sitesin the region surrounding the FY*O variant, markedlyexceed the highest FST value obtained for any of the var-iants within the nine neutral loci (see Fig. 6, lower panel).As expected, FST values were greatest for the polymorphicsites nearest the presumed selected variant (FY*O) butdiminish with increasing distance from the variant.
African samples show significantly reduced levelsof nucleotide variation. Hamblin and Di Rienzo (2000)sequenced a 19 kb region centered on the FY*O mutation,and a 1 kb region approximately 6 kb upstream of theFY*O mutation. They compared standard measures of nu-cleotide diversity (p and us) among five sub-Saharan popu-lations (the Beti and Hausa from Cameroon, the MbutiPygmy from the Central African Republic, the Luo fromKenya, and the Mandika from Gambia) and an Italiansample (from central Italy). The DNA variant that definesthe FY*O allele was detected in all African samples andwas absent in all Italian samples. Compared to the Italiansamples, the African samples show two to threefold lessnucleotide variation (p). Such a pattern is unusual com-pared to the pattern observed at most human genes inwhich African populations usually contain approximatelytwofold more variation (Yu et al., 2002; Tishkoff and Kidd,2004). At Duffy, the reduced level of polymorphism in Afri-cans is maintained in the upstream region.To test whether reduced nucleotide variation in Africans
represents a significant departure from neutral expecta-tions, the HKA test was performed (Hambin and DiRienzo, 2000). This test is based on the neutral expectationthat polymorphism within humans (in the Duffy region) isproportional to the interspecies divergence betweenhumans and an outgroup species (in this study the Orang-utan was used; for background on the HKA test see Theoryand Analytical Methods section). Positive directionalselection within humans is expected to reduce the amountof polymorphism relative to the divergence. The HKA testwas performed in two ways: 1) Hamblin and Di Rienzo(2000) compared the Duffy locus with the presumed neu-tral intron 44 of the DMD gene (Nachman and Crowell,2000); 2) they compared the Duffy locus with the nineunlinked and presumed neutral loci as described above
111MOLECULAR SIGNATURE OF SELECTION IN HUMANS
American Journal of Physical Anthropology—DOI 10.1002/ajpa
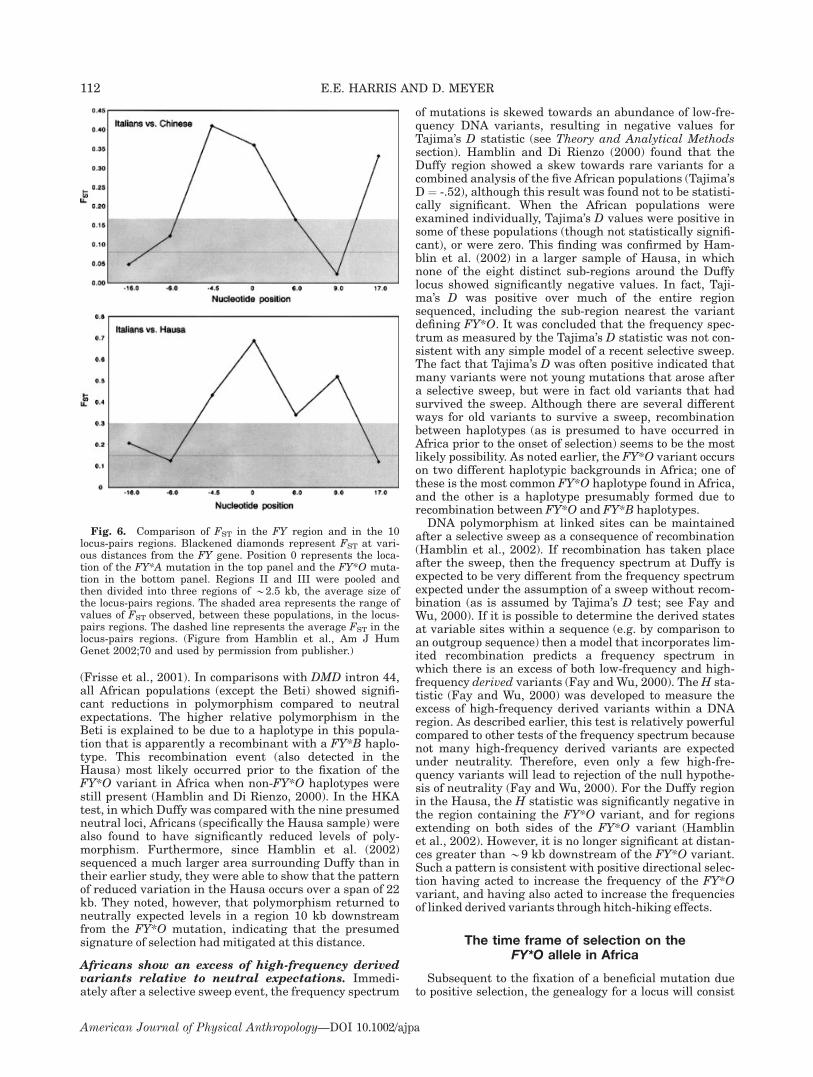
(Frisse et al., 2001). In comparisons with DMD intron 44,all African populations (except the Beti) showed signifi-cant reductions in polymorphism compared to neutralexpectations. The higher relative polymorphism in theBeti is explained to be due to a haplotype in this popula-tion that is apparently a recombinant with a FY*B haplo-type. This recombination event (also detected in theHausa) most likely occurred prior to the fixation of theFY*O variant in Africa when non-FY*O haplotypes werestill present (Hamblin and Di Rienzo, 2000). In the HKAtest, in which Duffy was compared with the nine presumedneutral loci, Africans (specifically the Hausa sample) werealso found to have significantly reduced levels of poly-morphism. Furthermore, since Hamblin et al. (2002)sequenced a much larger area surrounding Duffy than intheir earlier study, they were able to show that the patternof reduced variation in the Hausa occurs over a span of 22kb. They noted, however, that polymorphism returned toneutrally expected levels in a region 10 kb downstreamfrom the FY*O mutation, indicating that the presumedsignature of selection had mitigated at this distance.
Africans show an excess of high-frequency derivedvariants relative to neutral expectations. Immedi-ately after a selective sweep event, the frequency spectrum
of mutations is skewed towards an abundance of low-fre-quency DNA variants, resulting in negative values forTajima’s D statistic (see Theory and Analytical Methodssection). Hamblin and Di Rienzo (2000) found that theDuffy region showed a skew towards rare variants for acombined analysis of the five African populations (Tajima’sD ¼ -.52), although this result was found not to be statisti-cally significant. When the African populations wereexamined individually, Tajima’s D values were positive insome of these populations (though not statistically signifi-cant), or were zero. This finding was confirmed by Ham-blin et al. (2002) in a larger sample of Hausa, in whichnone of the eight distinct sub-regions around the Duffylocus showed significantly negative values. In fact, Taji-ma’s D was positive over much of the entire regionsequenced, including the sub-region nearest the variantdefining FY*O. It was concluded that the frequency spec-trum as measured by the Tajima’s D statistic was not con-sistent with any simple model of a recent selective sweep.The fact that Tajima’s D was often positive indicated thatmany variants were not young mutations that arose aftera selective sweep, but were in fact old variants that hadsurvived the sweep. Although there are several differentways for old variants to survive a sweep, recombinationbetween haplotypes (as is presumed to have occurred inAfrica prior to the onset of selection) seems to be the mostlikely possibility. As noted earlier, the FY*O variant occurson two different haplotypic backgrounds in Africa; one ofthese is the most common FY*O haplotype found in Africa,and the other is a haplotype presumably formed due torecombination between FY*O and FY*B haplotypes.DNA polymorphism at linked sites can be maintained
after a selective sweep as a consequence of recombination(Hamblin et al., 2002). If recombination has taken placeafter the sweep, then the frequency spectrum at Duffy isexpected to be very different from the frequency spectrumexpected under the assumption of a sweep without recom-bination (as is assumed by Tajima’s D test; see Fay andWu, 2000). If it is possible to determine the derived statesat variable sites within a sequence (e.g. by comparison toan outgroup sequence) then a model that incorporates lim-ited recombination predicts a frequency spectrum inwhich there is an excess of both low-frequency and high-frequency derived variants (Fay and Wu, 2000). TheH sta-tistic (Fay and Wu, 2000) was developed to measure theexcess of high-frequency derived variants within a DNAregion. As described earlier, this test is relatively powerfulcompared to other tests of the frequency spectrum becausenot many high-frequency derived variants are expectedunder neutrality. Therefore, even only a few high-fre-quency variants will lead to rejection of the null hypothe-sis of neutrality (Fay and Wu, 2000). For the Duffy regionin the Hausa, the H statistic was significantly negative inthe region containing the FY*O variant, and for regionsextending on both sides of the FY*O variant (Hamblinet al., 2002). However, it is no longer significant at distan-ces greater than *9 kb downstream of the FY*O variant.Such a pattern is consistent with positive directional selec-tion having acted to increase the frequency of the FY*Ovariant, and having also acted to increase the frequenciesof linked derived variants through hitch-hiking effects.
The time frame of selection on theFY*O allele in Africa
Subsequent to the fixation of a beneficial mutation dueto positive selection, the genealogy for a locus will consist
Fig. 6. Comparison of FST in the FY region and in the 10locus-pairs regions. Blackened diamonds represent FST at vari-ous distances from the FY gene. Position 0 represents the loca-tion of the FY*A mutation in the top panel and the FY*O muta-tion in the bottom panel. Regions II and III were pooled andthen divided into three regions of *2.5 kb, the average size ofthe locus-pairs regions. The shaded area represents the range ofvalues of FST observed, between these populations, in the locus-pairs regions. The dashed line represents the average FST in thelocus-pairs regions. (Figure from Hamblin et al., Am J HumGenet 2002;70 and used by permission from publisher.)
112 E.E. HARRIS AND D. MEYER
American Journal of Physical Anthropology—DOI 10.1002/ajpa

of many long and nonbifurcating lineages that trace backto the fixation event (this is commonly described as a\star-shaped" tree; see Fig. 7). Any mutations that ariseafter fixation will occur on these lineages, and will there-fore appear in the data as low-frequency variants (seeTheory and Analytical Methods section). Therefore, Ham-blin and Di Rienzo (2000) assumed that the time since fix-ation of the FY*O variant in Africa is most accuratelyreflected by the number of low-frequency polymorphismsin the data set. In the set of DNA sequences in the Africansample, there were very few (n ¼ 3) low-frequency var-iants (an expected finding if selection was recent). Basedon an estimated orangutan–human divergence date of14.0 MY, and the 54 nucleotide differences found betweenhumans and orangutans, the mutation rate at the Duffylocus was estimated to be 1.93 3 10�6. Since 47 humanchromosomes were sampled, the average mutation perbranch was 0.0638. Dividing 0.0638 by 1.93 3 10�6 yieldsan average branch length of 33,075. The 95% confidenceinterval around this date is 6,500–97,000 years.In the context of recent human evolution, these dates
occur at a time period subsequent to when humans arebelieved to have first migrated out of Africa (around100,000 years ago; see Jorde et al., 2001). Hamblin and DiRienzo (2000) reasoned that this makes sense in light ofthe observation that FY*O is present at very low frequen-cies in non-Africans. (In the Chinese, Italian, and Paki-stani samples sequenced by Hamblin et al. (2002), theFY*O variant only occurred in 4 of the 28 Pakistani sam-ples). If, alternatively, the FY*O variant had been fixed inAfrica prior to the major migration out of Africa then wewould expect to observe appreciable frequencies of FY*Oin non-Africans when in fact we do not. (It was considered
unlikely that strong negative selection in non-Africanscould have reduced the frequency of FY*O in these popu-lations since no known disadvantages are known to beassociated with the variant.)
The signature of selection outside Africa
As with the FY*O allele, the high FST value for theFY*A allele (0.3325; Cavalli-Sforza et al., 1994), as well asthe fact that it is at near fixation levels in Eastern Asiaand the Pacific, strongly suggests that positive selectionhas acted on it. However, in contrast to FY*O, the FY*Amutation has no known functional consequence. There-fore, it remains unclear where in the gene to search for asignature of selection. For example, while the target ofselection could be the FY*Amutation itself, it is also possi-ble that some other variant linked to the FY*A mutationwas the target of selection. Nevertheless, Hamblin et al.(2002) found that FST values are highest for variants near-est the FY*A mutation, but diminish with increasing dis-tance from it (see Fig. 6 upper panel), possible evidence ofhitchhiking effects. The FST values at these variants areonly about half as great as the FST values for variantslinked to FY*O (see Fig. 6 lower panel), but even so theyexceeded even the highest FST values found for variantsin any of the nine presumed neutral loci.A sample of 32 chromosomes from a Han Chinese popu-
lation was analyzed by Hamblin et al. (2002). The FY*Avariant is nearly fixed in this population. Throughout anapproximately 34 kb region surrounding the Duffy locus,nucleotide variation was found to be significantly reduced(as determined by the HKA test) in the region nearest tothe Duffy locus. Over the entire region, however, the pat-tern of variation is very complex and does not fit any sim-ple model of selection. For example, although reduced var-iation is observed in several regions of the gene, theseregions are interrupted by regions where variability ismuch higher. Thus, we do not observe a long stretch ofconsistently reduced variation flanking the Duffy locus asobserved for the African samples. Such a heterogeneouspattern is not expected under a simple model of positiveselection. Furthermore, certain regions flanking the FY*Amutation within the Chinese sample show significantlypositive Tajima’s D values indicating an excess of interme-diate-frequency mutations, which can arise due to balanc-ing selection. However, other regions of the gene show dis-tinctly contrasting frequency spectra (though not signifi-cant), indicating an increase in low-frequency mutations.This leads to an unusually large variance in the frequencyspectra from region to region within the gene region ana-lyzed. Overall the pattern that emerges from the Chinesesample is a complex one, in which heterogeneity isobserved in both patterns of polymorphism, and in the fre-quency spectrum of mutations.While levels of polymorphism in and near to the FY*A
mutation clearly violate the neutral model, the pattern ofDNA polymorphism within the 34 kb region analyzed doesnot fit any simple model of positive selection. Hamblin etal. (2002) have suggested two possible historical factorsthat might have given rise to such a heterogeneous pat-tern in the Chinese sample. First, it is possible that Asianpopulations have experienced nonequilibrium demo-graphic histories in which selection occurred in popula-tions that were geographically structured. Second, it ispossible that during the history of the Duffy gene in Asianpopulations, multiple advantageous mutations arosewithin the gene in Chinese populations (perhaps adapta-
Fig. 7. A geneaological tree of a genomic region that hasbeen affected by a selective sweep. Observe the differencebetween the shape of the tree before and after the sweep. Beforethe selective event, the genealogy shows a regular branchingpattern of lineages. For some time subsequent to the selectiveevent the genealogy resembles a \star-shaped" tree in whichthere are many long and unbranching lineages. The favorablemutation is inherited by all of these lineages, and new neutralmutations begin to accumulate on some of these lineages. Line-ages of the genealogy that have not been selected terminate ina short vertical line, and the mutations that occurred alongthese lineages in the past are lost (adapted from Hamblin andDi Rienzo (2000)).
113MOLECULAR SIGNATURE OF SELECTION IN HUMANS
American Journal of Physical Anthropology—DOI 10.1002/ajpa
tions against different pathogens), and that the heteroge-neity we see today represents footprints left by multipledifferent selective episodes. Once more, it is possible thatdifferent selective episodes left contrasting signatures ofselection (e.g. positive directional selection versus balanc-ing selection).Our understanding of the evolution of the FY*A allele
in Asia will probably necessitate several advances and/ordevelopments. First, if we learn that the FY*A variant, orsome other variant linked to FY*A, has a functional conse-quence then this will motivate our search for a signatureof selection to a specific region within the gene. Second, itwill be helpful to undertake sequencing in additional pop-ulations within Asia. Third, since the pattern within theChinese sample is complex and does not fit any currentmodel of demography or selection, better understanding ofthe evolution of FY*A allele will likely require the devel-opment of more sophisticated theoretical models and sta-tistical tests that can tease out signals of selection fromcomplex gene histories.
Discussion of Duffy polymorphism
How do these new findings of selection, particularly thefinding of directional selection on FY*O in Africa, influ-ence our interpretations of the hypotheses put forward byLivingstone (1984)? In discussions of the origins of humanmalaria, the advent of slash-and-burn agricultural prac-tices in Africa (,7.0 Ka; see Livingstone, 1958) is thoughtto be the crucial causal factor, not only in creating favor-able ecological conditions for the spread of the Anophelesmosquito vector, but also in leading to the increasedhuman densities necessary to maintain malarial trans-mission (Livingstone, 1958). The average time and confi-dence range (33,075 years; 6,500–97,200 years) estimatedby Hamblin and Di Rienzo (2000) since the fixation of theFY*O variant predates the advent of agriculture in Africa.This estimate implies that the rise in frequency of theFY*O variant is unlikely to be associated with the effectsof the transition to agriculture in Africa. However, itshould be noted that Seixas et al. (2002) analyzed microsa-tellite diversity on the FY*O haplotype and using two dif-ferent analytical methods, estimated somewhat morerecent dates; 14,700 years (range 5,100–31,800) under onestrategy and 9,300 years (range 4,350–15,750) underanother, placing the fixation date closer to the introduc-tion of agriculture in Africa. Such recent dates would besurprising, however, since there is a theoretical reason tosuspect that selection on FY*O took place over a muchlonger period of time. Livingstone (1984) first pointedout—and others have since (Carter, 2003—that selectionon the FY*O allele would have been initially relativelyweak, making the short time since the introduction ofagriculture insufficient to bring the variant to its currenthigh frequencies in Africa. This is explained as follows: af-ter a beneficial recessive mutation arises (such as FY*O),it is present at such low frequencies that only rarely will itoccur in the homozygous state, and therefore it will onlyrarely come under positive selection (Carter, 2003). Com-paratively speaking, the rate of selection for higher fre-quencies of the FY*O variant would have been muchslower compared with the rate of selection for the sicklecell trait (against P. falciparum) since in this case theadvantage favors the heterozygotes (Carter, 2003).Whereas selection for the sickle cell trait is thought tohave occurred on the order of 2,000 to 3,000 years ago, itprobably took many thousands, or tens of thousands of
years, for positive selection to drive FY*O to near fixationlevels in Africa (Carter, 2003). This is consistent with theconsiderably lower coefficient of selection (*0.2%) esti-mated for FY*O (Hamblin et al., 2002) compared with val-ues estimated for the sickle-cell trait (5.0–18.0%; see Li,1975) and for G6PD (2.0–5.0%; see Tishkoff et al., 2001).Finally, the assumption that the spread of P. vivax is
associated with agriculture and increased population den-sities needs reexamination (Hamblin and Di Rienzo,2000). The life-history of P. vivax is such that sporozitescan enjoy long incubation or dormant periods within theliver (up to 6 to 12 month), when they are known as hyp-nozoites (Sattabongkot et al., 2004). This contrasts withthe life cycle of P. falciparum in which incubation stagesare much shorter (9–14 days) (Sattabongkot et al., 2004).As a consequence, P. vivax, does not require the increasedhost-densities that other malarial parasites need (e.g.P. falciparum). This could indicate that malaria due toP. vivax infection represented a much older and persistentselective pressure in humans compared with P. falcipa-rum. In fact, Carter (2003) has proposed a scenario inwhich P. vivax (or its immediate ancestor) was presentwithin Africa during roughly the last 1.0 million years,and therefore was likely to be the selective agent thatdrove FY*O to near fixation levels. More specifically, Car-ter (2003) hypothesized that during Pleistocene Ice agesthe pathogen (which was widespread in the Old Worldduring warm periods) became periodically isolated in sub-Saharan African refuges during glacial periods. It wasduring a recent glaciation period, he proposes, that P.vivax became the selection pressure that drove the FY*Ovariant in African populations to increased frequencies.
Origins of Plasmodium vivax. The evolutionary inter-action between the Duffy receptor and the parasite P vivaxis an example of co-evolution between a pathogen and ahost. Therefore, we can ask: What do phylogenetic andpopulation genetic studies of the P. vivax parasite tell usabout its time and geographical place of origin? Leclerc etal. (2004) found markedly reduced levels of genetic varia-tion within 13 fast-evolving microsatellites, and eightshort tandem repeats in P. vivax. At 12 of the 13 microsa-tellites they tested, P. vivax was nearly completely mono-morphic. This was interpreted to favor a scenario in whichP. vivax arose from a small progenitor population (withgeographical location unknown) and only recently experi-enced worldwide expansion less than 10,000 years ago(Ayala et al., 1999; Leclerc et al., 2004).In a more recent analysis, however, Imwong et al.
(2006) found abundant variation at 11 di-nucleotide micro-satellites in P. vivax from Colombia, India, and Thailand.The discrepancy between the results of these studies(Leclerc et al., 2004 and Imwong et al., 2006) has beenexplained as due to a difference in repeat length in the dif-ferent sets of microsatellites analyzed (Imwong et al.,2006). For instance, one of the most important factorsaffecting mutation rate at microsatellites appears to bemicrosatellite length (Ellegren, 2004). Mutation rateincreases with increasing number of repeated units, prob-ably because more repeated units allows more opportuni-ties for replication slippage, the presumed mutational pro-cess at microsatellites. In the analysis by Leclerc et al.(2004), the microsatellites had very few repeats, with amedian of 5.5 repeats, and a range of 4–13, whereas inImwong et al. (2006) the microsatellites had a medianrepeat length of 16 and a range of 12–18. Therefore, basedon the considerably lower repeat length of the microsatel-
114 E.E. HARRIS AND D. MEYER
American Journal of Physical Anthropology—DOI 10.1002/ajpa
lites analyzed by Leclerc et al. (2004), high levels of varia-tion might not be expected (Imwong et al., 2006). Conse-quently, the abundant variation detected in P. vivax callsinto question Leclerc’s et al. (2004) hypothesis of a recentexpansion for P. vivax , 10,000 years ago, and may pointto the pathogen’s considerably older history.The presence of abundant variation in P. vivax has been
confirmed in more recent studies of diverse genetic sys-tems including entire mitochondrial genomes (Jongwu-tiwes et al., 2005; Mu et al., 2005), as well as nuclear andplastid genes (Escalante et al., 2005). Based on these datasets, the most recent common ancestor of P. vivax was esti-mated to fall between 45,680 and 81,605 years ago byEscalante et al. (2005), 53,000 years ago by Mu et al.(2005), and between 200,000–300,000 years ago by Jong-wutiwes et al. (2005). Furthermore, when Jongwutiweset al. (2005) reanalyzed Escalante’s et al. (2005) data, theyobtained dates ranging from 206,000–314,000 years,which more closely agreed with their own dates. Thus,P. vivax shows abundant variation, and this variationpoints to its old history.Phylogenetic analyses, comparing P. vivax with other
related pathogens, have been performed based on thesesame data sets. All analyses (Escalante et al., 2005; Mu etal., 2005; Jongwutiwes et al., 2005) have indicated thatthe human P. vivax parasite falls within a monophyleticclade of Plasmodium parasites of Asian primates, specifi-cally various species of Macaca. This finding supports an\Out of Asia" model for the origin of human P. vivax, a hy-pothesis originally proposed by Livingstone (1984).Although the date of P. vivax entry into Africa is not
definitively established, the plausibility of early dates hasimportant implications. For instance, the older history ofthe pathogen increases the possibility that it arrived inAfrica early enough to have been the selective agent thatdrove FY*O to near fixation in many sub-Saharan Afri-cans populations. If P. vivax made an early arrival intoAfrica, how did it get there? One problem is that anatomi-cally modern humans are believed to have been restrictedto Africa during the earliest part of their evolutionary his-tory therefore making it unlikely that they broughtP. vivax from Asia into Africa. Furthermore, the fixation ofthe FY*O variant in Africa would have required anextended period during which P. vivax and humanscoevolved (Carter, 2003). Therefore, Carter (2003) hashypothesized that the host-transfer of P. vivax (or its im-mediate ancestor) from Asian primates to Asian hominidsoccurred during a time (.1.0 Ma) when H. erectus isknown to have inhabited Asia (Anton, 2003). This wouldhave allowed the parasite to disperse back into popula-tions of Homo in Africa, presumably through contactbetween Asian and African hominid populations. The fea-sibility of this scenario needs further investigation.Based on mitochondrial DNA evidence, Jongwutiwes
et al. (2005) also conjecture a long association betweenP. vivax and hominids. The mismatch distribution be-tween pairs of P. vivax mitochondrial sequences revealeda pattern characteristic of populations that experiencedpopulation expansion after a bottleneck. Interestingly,they found a very similar level of variation and mismatchdistribution for P. falciparum (the pathogen responsiblefor human falciparum malaria) leading them to proposethat these pathogens had closely similar evolutionary his-tories. They noted that the timing of these demographicevents coincides with the genetic bottleneck and subse-quent population expansion that has been proposed forhumans (Harpending et al., 1998). Based on the coinci-
dence of evidence, they propose that both Plasmodia wereparasites of Homo long before the evolutionary transitionfrom early hominids to anatomically modern humans, andthat both parasites underwent a bottleneck and popula-tion expansion concomitantly with their human hosts(Jongwutiwes et al., 2005). This hypothesis seems quiteconceivable for P. falciparum since its sister species isP. reichenowi, a chimpanzee parasite (Escalante et al.,2005). The scenario does not as easily fit the evidence forP. vivax, since its sister species is believed to be a Plasmo-dia of Asian macaques, although Carter’s (2003) hypothe-sis of an early transfer of the pathogen from Asian mon-keys to Asian hominids could offer an explanation.While it remains a strong possibility that P. vivax was
the original selective agent that drove FY*O to fixation inAfricans, there are other possibilities. One question is, ifP. vivax was the selective agent that drove the FY*O alleleto fixation in Africa, then why hasn’t selection driven theFY*O allele to high frequencies outside Africa whereP. vivax is known historically? A common explanation isthat there has not been enough time for this to occur,because selection is slow to change allele frequencieswhen the advantageous phenotype is due to a homozygousrecessive genotype (Carter, 2003). However, it is interest-ing to note that Zimmerman et al. (1999) have recentlydetected possible selection on the FY*O mutation inPapua New Guinea. Here, a FY*A haplotype (known asFY*Anull) appears to have independently evolved theFY*O causal mutation, and there is evidence that thisFY*Anull haplotype reduces infection due to P. vivax. Thenew allele was only detected in heterozygotes (FY*A/FY*Anull), and is at low frequency (0.022). However, itappears to show a dosage effect in which heterozygotesshow a twofold reduced expression of the Duffy receptoron RBCs and also show less blood-stage infection with P.vivax than do FY*A/FY*A homozygotes. There may,therefore, have been a greater degree of selection on Duffyalleles outside Africa than is usually appreciated. Thecase appears to represent independent adaptation againstP. vivax via the same mutational mechanism (FY*O), andit indicates that P. vivax can in fact be directly involved inthe evolution of this RBC polymorphism.Independent evolution of the FY*O mutation in Papua
New Guinea raises the possibility that the mutation couldhave arisen more than once in Africans. As noted earlier,the FY*O variant in Africans occurs on two haplotypicbackgrounds, which Hamblin and Di Rienzo (2000) andHamblin et al. (2002) attributed as most likely due torecombination. Indeed, by subdividing African FY*O hap-lotypes using microsatellite markers, Seixas et al. (2002)found evidence supporting the hypothesis that the FY*Ovariant in Africans had arisen twice by independentmutational events.What can we say about Livingston’s (1984) second hy-
pothesis, that the spread of P. vivax in Africa was cur-tailed by the prior fixation of FY*O in that region? Sincecell-surface proteins are frequently used by pathogens toinfect cells, it is possible that some receptors were repeat-edly targeted by different pathogens. Thus, one possibilityis that some pathogen other than P. vivax may havedriven the FY*O allele to near fixation in Africans (Ham-blin and Di Rienzo, 2000; Hamblin et al., 2002; Escalanteet al., 2005; Mu et al., 2005). Escalante et al. (2005) notedthat this could be a possible example whereby currentutility does not necessarily indicate reason for origin(Gould and Vrba, 1982). A possible example of this is seenwith the 32 base pair deletion (CCR5-D32) in the CCR5
115MOLECULAR SIGNATURE OF SELECTION IN HUMANS
American Journal of Physical Anthropology—DOI 10.1002/ajpa
gene (a chemokine receptor on T cells). It has been pro-posed that a past selective agent drove this mutation tohigh frequencies in some European populations (275–1,875 years ago), and that this mutation fortuitously pro-vides natural resistance to HIV infection today (Stephenset al., 1998; but for an alternative view see Sabeti et al.,2005). If such a situation also occurred in the case of theDuffy gene in Africa, then it may be difficult to ascertainthe original selective pathogen. It should be noted, how-ever, that even if P. vivax was not the original selectiveagent, this would not preclude P. vivax from being an im-portant selective agent in the recent past or even today,particularly in peripheral regions where the FY*O alleleis not fixed and where P. vivax transmission is high.There are a number of areas for future research that
could help to resolve some of the questions raised above.First, increased genetic sampling of African populationscould lead to improved estimates of the time frame ofselection on FY*O, and would allow investigation of thepossibility that the mutation arose more than once inthese populations. Second, a broader and increased sam-pling of P. vivax is necessary (Escalante et al., 2005) torefine estimates of the time frame of the pathogen’s exis-tence, as well as to decipher the demographic and selec-tive forces that may have influenced its evolution. Third,increased understanding of the evolutionary history of thepathogen’s other host, the Anopheles mosquito, is neces-sary. Several future findings could shed more light on thequestion of the original selective agent of the FY*O allelein Africa. First, a newly discovered pathogen would besuspected if its distribution (or paleo-distribution) closelymatched the distribution of FY*O in sub-Saharan Africa.Second, there is the chance that ancient DNA analysescould reveal a pathogen that contains genes encoding aDuffy-specific binding protein and whose history matchesthe time frame of selection of FY*O in humans.
SCANNING THE GENOME FOR GENESAFFECTED BY NATURAL SELECTION
The examples of human genetic adaptation that wehave discussed are cases whereby genetic signatures ofselection have been identified on the basis of a \candidate-gene" approach. In such an approach there are a priorifunctional reasons, as well as marked population differen-ces in allele frequencies, that lead researchers to studyparticular genes. To date, the best examples of recentselection in humans have been discovered using the \can-didate-gene" approach.An alternative approach is to perform genome-wide sur-
veys that aim to identify genes or genomic regions show-ing evidence of positive selection. Such studies are facili-tated by the completion of several large sequencing initia-tives that have collected DNA data on two levels –population and between-species levels. At the populationlevel, several recent projects have collected DNA polymor-phism data (SNPs) within and among human populations(e.g. the HapMap project, Hinds et al., 2005). At abetween-species level, there are projects aimed at com-pleting the sequencing of entire primate genomes. Forexample, draft-sequences of the chimpanzee (Pan troglo-dytes; see Chimpanzee Sequence and Analysis Consor-tium, 2005) and Rhesus macaque (Macaca mulatta)genomes have recently been completed and the genomesof the Orangutan (Pongo pygmaeus) and White-tuftedmarmoset (Callithrix jacchus) are underway. As more pri-mate genomes become available it becomes possible to
search for those genes underlying adaptations in specificevolutionary lineages, including the lineage leading to ourspecies (Goodman et al., 2005).The methods employed in scans for selected genes are
similar to those used in \candidate-gene" studies. In thescanning approach, however, the methods are appliedover a much greater set of DNA sequences or polymorphicsites, spanning various regions of the genome. Two differ-ent yet complementary genome-scanning approaches havebeen used to date: between-species comparisons (usuallycontrasting humans and chimpanzees) and within-speciescomparisons of polymorphism data (analyzing human pop-ulations of different geographic origins). The between-spe-cies contrasts yield information concerning the nature ofadaptive change along lineages since two species diverged.A within-species approach, on the other hand, focuses onadaptive changes at more recent time-scales as humanpopulations differentiated.
Genome-wide scans for positive selectionby contrasting genes between humans
and chimpanzees
Recently, the genome sequences of chimpanzees andhumans have been used to perform scans for selectionthat took place since these two species diverged from acommon ancestor. A recent study by Nielsen et al. (2005a)scanned large numbers of genes for evidence of positiveselection by comparing orthologous genes betweenhumans and chimpanzees. A previous analysis by Clarket al. (2003) had scanned a somewhat smaller set of genesin humans, chimpanzees and the mouse. By including themouse as an outgroup species, Clark et al. (2003) wereable to specify which changes had taken place along thelineage leading to humans and which had taken placealong the lineage leading to chimpanzees. The analyticalmethods employed to detect positive selection involve com-paring nonsynonymous and synonymous substitutionrates for the divergence between humans and chimpan-zees. Positive selection is inferred if the ratio of nonsynon-ymous to synonymous substitutions is statistically greaterthan 1 (dN/dS . 1) (see Theory and Analytical Methodssection). The study by Nielsen et al. (2005a) restricted anal-ysis to comparisons between chimpanzees and humansonly, and therefore was unable to specify along which line-age positive selection had occurredInitially, Nielsen et al. (2005a) analyzed 20,361 genes,
but after eliminating many of these because they containtoo few mutations, or because the gene-sequence was tooshort (i.e. , 50 base pairs), 8,079 genes remained for anal-ysis. Of these genes, 733 evolved with dN/dS . 1(although not all values were significantly greater thanone). For each gene, a likelihood ratio test of the null hy-pothesis of neutrality, against the alternative of positiveselection, was performed, yielding a P-value. Low P-values are indicative of positive selection. To test whetherspecific classes of genes showed overall greater evidencefor positive selection, genes were assigned to groupsaccording to the PANTHER classification database (http://www.pantherdb.org). A test was performed to determine ifany category was significantly enriched (i.e. showed anover-representation of putatively selected genes as indi-cated by their low P-values). The same strategy was alsoapplied to a classification of genes based on the NovartisGene Expression Atlas database (http://expression.gnf.org).Genes with maximal expression in a particular tissue (e.g.the brain) were evaluated for evidence of selection. The
116 E.E. HARRIS AND D. MEYER
American Journal of Physical Anthropology—DOI 10.1002/ajpa
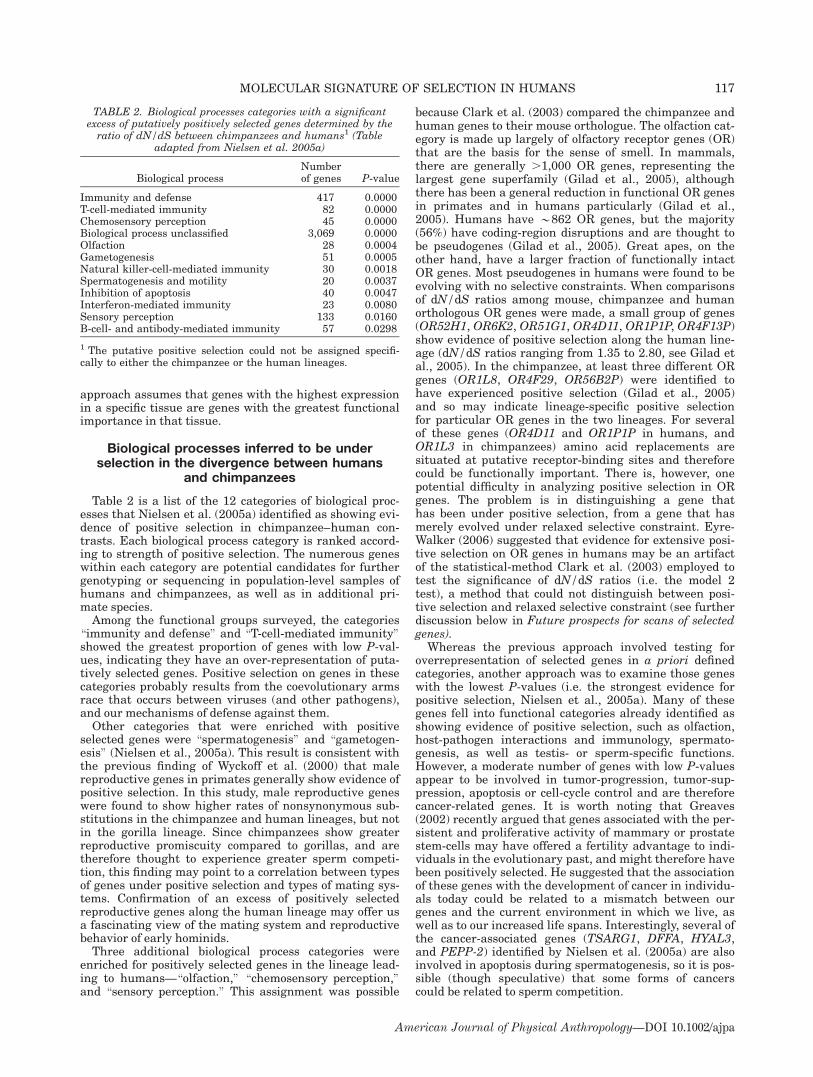
approach assumes that genes with the highest expressionin a specific tissue are genes with the greatest functionalimportance in that tissue.
Biological processes inferred to be underselection in the divergence between humans
and chimpanzees
Table 2 is a list of the 12 categories of biological proc-esses that Nielsen et al. (2005a) identified as showing evi-dence of positive selection in chimpanzee–human con-trasts. Each biological process category is ranked accord-ing to strength of positive selection. The numerous geneswithin each category are potential candidates for furthergenotyping or sequencing in population-level samples ofhumans and chimpanzees, as well as in additional pri-mate species.Among the functional groups surveyed, the categories
\immunity and defense" and \T-cell-mediated immunity"showed the greatest proportion of genes with low P-val-ues, indicating they have an over-representation of puta-tively selected genes. Positive selection on genes in thesecategories probably results from the coevolutionary armsrace that occurs between viruses (and other pathogens),and our mechanisms of defense against them.Other categories that were enriched with positive
selected genes were \spermatogenesis" and \gametogen-esis" (Nielsen et al., 2005a). This result is consistent withthe previous finding of Wyckoff et al. (2000) that malereproductive genes in primates generally show evidence ofpositive selection. In this study, male reproductive geneswere found to show higher rates of nonsynonymous sub-stitutions in the chimpanzee and human lineages, but notin the gorilla lineage. Since chimpanzees show greaterreproductive promiscuity compared to gorillas, and aretherefore thought to experience greater sperm competi-tion, this finding may point to a correlation between typesof genes under positive selection and types of mating sys-tems. Confirmation of an excess of positively selectedreproductive genes along the human lineage may offer usa fascinating view of the mating system and reproductivebehavior of early hominids.Three additional biological process categories were
enriched for positively selected genes in the lineage lead-ing to humans—\olfaction," \chemosensory perception,"and \sensory perception." This assignment was possible
because Clark et al. (2003) compared the chimpanzee andhuman genes to their mouse orthologue. The olfaction cat-egory is made up largely of olfactory receptor genes (OR)that are the basis for the sense of smell. In mammals,there are generally .1,000 OR genes, representing thelargest gene superfamily (Gilad et al., 2005), althoughthere has been a general reduction in functional OR genesin primates and in humans particularly (Gilad et al.,2005). Humans have *862 OR genes, but the majority(56%) have coding-region disruptions and are thought tobe pseudogenes (Gilad et al., 2005). Great apes, on theother hand, have a larger fraction of functionally intactOR genes. Most pseudogenes in humans were found to beevolving with no selective constraints. When comparisonsof dN/dS ratios among mouse, chimpanzee and humanorthologous OR genes were made, a small group of genes(OR52H1, OR6K2, OR51G1, OR4D11, OR1P1P, OR4F13P)show evidence of positive selection along the human line-age (dN/dS ratios ranging from 1.35 to 2.80, see Gilad etal., 2005). In the chimpanzee, at least three different ORgenes (OR1L8, OR4F29, OR56B2P) were identified tohave experienced positive selection (Gilad et al., 2005)and so may indicate lineage-specific positive selectionfor particular OR genes in the two lineages. For severalof these genes (OR4D11 and OR1P1P in humans, andOR1L3 in chimpanzees) amino acid replacements aresituated at putative receptor-binding sites and thereforecould be functionally important. There is, however, onepotential difficulty in analyzing positive selection in ORgenes. The problem is in distinguishing a gene thathas been under positive selection, from a gene that hasmerely evolved under relaxed selective constraint. Eyre-Walker (2006) suggested that evidence for extensive posi-tive selection on OR genes in humans may be an artifactof the statistical-method Clark et al. (2003) employed totest the significance of dN/dS ratios (i.e. the model 2test), a method that could not distinguish between posi-tive selection and relaxed selective constraint (see furtherdiscussion below in Future prospects for scans of selectedgenes).Whereas the previous approach involved testing for
overrepresentation of selected genes in a priori definedcategories, another approach was to examine those geneswith the lowest P-values (i.e. the strongest evidence forpositive selection, Nielsen et al., 2005a). Many of thesegenes fell into functional categories already identified asshowing evidence of positive selection, such as olfaction,host-pathogen interactions and immunology, spermato-genesis, as well as testis- or sperm-specific functions.However, a moderate number of genes with low P-valuesappear to be involved in tumor-progression, tumor-sup-pression, apoptosis or cell-cycle control and are thereforecancer-related genes. It is worth noting that Greaves(2002) recently argued that genes associated with the per-sistent and proliferative activity of mammary or prostatestem-cells may have offered a fertility advantage to indi-viduals in the evolutionary past, and might therefore havebeen positively selected. He suggested that the associationof these genes with the development of cancer in individu-als today could be related to a mismatch between ourgenes and the current environment in which we live, aswell as to our increased life spans. Interestingly, several ofthe cancer-associated genes (TSARG1, DFFA, HYAL3,and PEPP-2) identified by Nielsen et al. (2005a) are alsoinvolved in apoptosis during spermatogenesis, so it is pos-sible (though speculative) that some forms of cancerscould be related to sperm competition.
TABLE 2. Biological processes categories with a significantexcess of putatively positively selected genes determined by theratio of dN/dS between chimpanzees and humans1 (Table
adapted from Nielsen et al. 2005a)
Biological processNumberof genes P-value
Immunity and defense 417 0.0000T-cell-mediated immunity 82 0.0000Chemosensory perception 45 0.0000Biological process unclassified 3,069 0.0000Olfaction 28 0.0004Gametogenesis 51 0.0005Natural killer-cell-mediated immunity 30 0.0018Spermatogenesis and motility 20 0.0037Inhibition of apoptosis 40 0.0047Interferon-mediated immunity 23 0.0080Sensory perception 133 0.0160B-cell- and antibody-mediated immunity 57 0.0298
1 The putative positive selection could not be assigned specifi-cally to either the chimpanzee or the human lineages.
117MOLECULAR SIGNATURE OF SELECTION IN HUMANS
American Journal of Physical Anthropology—DOI 10.1002/ajpa
Genome-scanning efforts, like the study by Nielsenet al. (2005a), provide lists of genes that can be further an-alyzed to better characterize the pattern and timing ofpositive selection. One example is the follow-up analysisby Wildman et al. (in prep) of the progesterone receptorgene (PGR), which Nielsen et al. (2005a) identified asshowing evidence of positive selection. Wildman et al.(2006) sequenced all coding regions for PGR orthologuesin a representative species from all major primate line-ages. Evidence of positive selection (as ascertained fromincreased dN/dS ratios) was found on several different pri-mate lineages, and in the human-chimpanzee clade.
Gene expression patterns and positive selection
Nielsen et al. (2005a) investigated whether genes show-ing high expression in specific tissues (e.g. testis, wholebrain, heart, cortex, cerebellum, kidney) also showed evi-dence of positive selection. The only category for whichthere was significant enrichment of genes with high dN/dS ratios was that for genes with maximal expression inthe testis, consistent with findings of positive selectiondominating in spermatogenesis and gametogenesis. Anunexpected finding was that genes with maximal expres-sion in the brain (e.g. in the whole brain, fetal brain, cor-tex, cerebellum, corpus callosum, caudate nucleus, pitui-tary gland, amygdala, thalamus, and cerebellum) did notshow evidence of positive selection, as might be expectedgiven the brain expansion and increase in cognitive abil-ities that occurred in human evolution. In fact, genes withhighest expression in the brain were among those havingthe least evidence of positive selection as indicated by alack of nonsynonymous substitutions. Such a pattern indi-cates functional constraint among genes expressed in thebrain. It was hypothesized that adaptive changes in thebrain along the human lineage may have involvedchanges not so much in protein-coding portions of genes,but changes instead in gene organization, gene expres-sion, or in brain-development and regulation genes. Thisfinding is consistent with results of gene expression stud-ies, which indicate that up-regulation of gene-expressionin the brain (and more specifically within the cortex) isone of the most important ways in which human brainsdiffer from chimpanzee brains (Fisher and Marcus, 2006).Indeed, a scanning study of 214 nervous system genes byDorus et al. (2004) found that genes playing roles in thedevelopment of the nervous system in humans showed thegreatest degree of positive selection.Despite the finding of overall conservation of genes maxi-
mally expressed in the brain (Nielsen et al., 2005a), several\candidate-gene" studies have revealed intriguing exam-ples of genes associated with brain development that dis-play footprints of selection in their coding sequences. Onegene is ASPM, in which mutations are known to result insevere reduction in cerebral cortex size. The ASPM gene(abnormal spindle-likemicrocephaly associated; also knownasMCPF5) may function to regulate neural stem cell prolif-eration and differentiation during development (Mekel-Bobrov et al., 2005). In chimpanzee-human contrasts, thedN/dS ratio (1.44) indicates an excess of nonsynonymousover synonymous substitutions along the human lineage(Evans et al., 2004a). The McDonald-Kreitman test alsoshowed that the number of nonsynonymous differencesalong the human lineage was significantly greater thanexpected under neutrality (Evans et al., 2004a). Neither thechimpanzee or orangutan branches (gorillas were notincluded in analysis) show an excess of nonsynonymous
change (Zhang, 2003). Therefore, ASPMwas proposed to bean example of a gene underlying cerebral cortex expansionin human evolution. Another brain-development gene thatshows evidence of positive selection is MCPF1 (microce-phalin). Mutations in MCPF1 cause severe reduction inbrain size but with overall brain structure left intact. Thegene is thought to control the proliferation and differentia-tion of neuroblasts during neurogenesis (Evans et al., 2005).In comparisons of MCPF1 orthologues among primate spe-cies, the gene showed signatures of strong positive selectionin the lineage leading to humans (Evans et al., 2004b).Motivated by these findings based on between-species
comparisons, each of these genes (ASPM and MCPF1) hasrecently been analyzed in diverse population samples ofmore than 1,100 individuals (Evans et al., 2005; Mekel-Bobrov et al., 2005). One set of haplotypes found atMCPF1 (termed D haplotypes, with D indicating derived),was found to be the most common set of haplotypes world-wide, except in sub-Saharan Africa where ancestral (non-D haplotypes) dominate. The D haplotypes are distin-guished by a G ? C mutation in exon 8 causing an aspar-tate to change to histidine. Three aspects of MCPF1 poly-morphism point to positive selection on the D haplotypes:1) measures of diversity (p) are twelve times lower for Dhaplotypes as compared to non-D haplotypes; 2) Tajima’sD (�2.3) is significantly negative for D haplotypes,whereas it is not significantly different from zero for non-D haplotypes; 3) LD extends over a much larger distanceat the MCPF1 gene in D haplotypes (29 kb) comparedwith non-D haplotypes. At the ASPM gene, the derivedhaplotypes (again known as D haplotypes) were found atmoderately high frequencies (44%) in Europeans and Mid-dle Easterners, but are typically at low frequencies inmost populations in sub-Saharan Africa and the Americas(0.0 – *10%). At this locus, D haplotypes are distin-guished from non-D haplotypes by an A ? G nonsynony-mous polymorphism at position 44,871. There are severalindications that D haplotypes experienced recent positiveselection in Eurasia relative to non-D haplotypes: 1) LDextends over the entire length of ASPM’s coding region(62.1 kb) for the D haplotypes, but there is no evidence forincreased LD at non-D haplotypes; 2) FST is high (indi-cating substantial population differentiation) between Eu-ropean (and Middle Easterners) compared with all otherworld populations (0.29), and is high between Europeans(and Middle Easterners) compared with sub-SaharanAfricans (0.31). Positive selection on the derived haplo-types at both MCPF1 and ASPM is estimated to haveoccurred recently. At MCPF1, the estimated time of coa-lescence of the presumed positively selected D haplotypesis 37,000 years (compared to *1.7 million years for the co-alescence of all chromosomes at this locus). At ASPM, theestimated coalescence of the positively selected D haplo-types is 5,800 years (compared to *800 thousand yearsfor all chromosomes at this locus). These times consider-ably postdate the time of transition from archaic hominidsto anatomically modern humans (*130,000 years; seeLahr and Foley, 1998), and so the signal of positive selec-tion we see today at these genes was probably not left byselection associated with this transition. Instead, the sig-natures of selection may be associated with more recentevents in human prehistory. With respect to MCPF1, posi-tive selection may have occurred during the initial migra-tion of modern humans into Europe around 40,000 years,and positive selection at ASPM may have occurred con-comitantly with the cultural innovations of agriculture,animal domestication, or with the advent of cities, states
118 E.E. HARRIS AND D. MEYER
American Journal of Physical Anthropology—DOI 10.1002/ajpa
and written language (Evans et al., 2005; Mekel-Bobrovet al., 2005).
Genome-wide scans for positive selectionwithin human populations
Genome scans for selected genes based on comparisonsbetween humans and chimpanzees are efficient at recov-ering selective episodes that took place in the deeper pastof our species’ history (i.e. over millions of years). How-ever, it is undoubtedly true that selection has acted atmore recent time-scales, for which tests based upon dN/dS ratios have limited power to detect. To detect such epi-sodes of selection, three main approaches have beenemployed. First, searches have been made for regions ofthe genome that show extremely high or low values of dif-ferentiation among populations (as measured by statisticssuch as FST). Regions with unusually high or low amountsof differentiation are candidates for positive selection andbalancing selection, respectively. Second, searches havebeen made using methods that summarize the site fre-quency spectrum (SFS), such as Tajima’s D and Fay andWu’s H. Regions of the genome exhibiting extreme valuesare candidates for selection. Third, searches have beenmade of regions of the genome exhibiting unusually highvalues of LD and low levels of variation. Such regionsmay contain genes that are candidates for recent positiveselection.
FST-based scans for selected genes. Early scans forselection in the human genome utilized the expected effectof selection upon inter-population differentiation to detectputatively selected genes or regions of the genome. Insuch studies, the difficulty lies in establishing an expecteddistribution of FST values based upon a neutral model.Such a distribution would obviously be sensitive to theassumptions made concerning the demographic history ofthese populations. For this reason, studies typicallyemploy a strictly empirical approach, in which those locior regions of the genome demonstrating the most extremevalues of FST with respect to the genome average are con-sidered to be associated with regions under selection (e.g.Kayser et al., 2003).A higher resolution scan for regions of extreme FST was
carried out by Akey et al. (2002), based on a set of 26,530SNPs from three samples: 42 African Americans, 42 EastAsians, and 42 European American individuals. Overall,174 genes were detected as showing signs of selection. Thelargest fraction of positively selected genes were enzymes(hydrolases, kinases, transferases), whereas signal trans-ducers (both ligands and receptors) represented the func-tional class with the greatest number of genes with lowFST values (Akey et al., 2002).Perhaps the greatest limitation of this, and other early
FST-based studies (e.g. Kayser et al., 2003) concerns thelow density of the SNPs, which would result in failure todetect selection at genes that did not have SNPs nearby.One example of this limitation (acknowledged by Akey etal., 2004) was the study’s failure to identify the Duffy (Fy)gene as a candidate for selection, even though Duffy isknown to display an extremely high FST between Africansand non-Africans (see Duffy section this paper). The fail-ure is explained by the fact that the closest SNP to thelocus was located*80 kb away.
Approaches based on the site frequency spectrum.With the increased availability of sequence data for popu-lation samples, it has become possible to compute sum-
mary statistics such as Tajima’s D for large numbers ofgenes. Two recent studies surveyed large numbers ofgenes from a data set consisting of 24 African Americans(AA) and 23 European Americans (EA). Stajich and Hahn(2005) surveyed data for 151 genes made publicly avail-able by Seattle SNPs, and found marked differences in themean and variance of Tajima’s D between African Ameri-cans and European Americans, with AA showing highervalues, and EA showing lower values and a greater var-iance. Differences between populations in the overall dis-tribution of Tajima’s D for a large set of genes are expectedto result from differences in their demographic histories.Thus, before making any attempts to interpret whetherspecific genes exhibited values of Tajima’s D that deviatedfrom neutrality, it was necessary to examine which demo-graphic processes could account for these features of thedata. Two simple demographic scenarios were exploredusing simulations and were shown to fit the dataextremely well: a bottleneck scenario for the EuropeanAmericans, and an admixture scenario (involving an*25% genetic contribution of European Americans) forthe African Americans. Importantly, although these demo-graphic scenarios accounted for the main features of thedata, there were two loci that displayed extreme Tajima’sD values that remained significant even after demographywas accounted for, and therefore represented robust infer-ences of selection. These two loci were the genes for theABO blood group (which showed a significantly positiveTajima’s D, indicative of balancing selection), and TRPV6(a gene expressed in the kidney, placenta and intestinesand thought to serve in the rate-limiting step of calciumabsorption), which showed highly negative values in EA,indicative of positive selection. A more recent analysis ofTRPV6 polymorphism (Akey et al., 2006) confirmed a sig-nal of positive selection (though found it to be more wide-spread in non-Africans), and also found possible evidencefor balancing selection in some African populations (Akeyet al., 2006). Although Akey et al. (2004) hypothesizedthat positive selection on TRPV6 may be associated withdietary changes during the agricultural revolution andspecifically with the use of milk, the precise functionaleffects of particular TRPV6 variants (presumed to havebeen selected) need to be analyzed in functional studies.Although Stajich and Hahn’s (2005) study only revealed
two genes to be candidates for selection, these researchersfound evidence for selection in another feature of the data.There was an overall positive correlation between Taji-ma’s D for the 151 genes in the EA and the known recom-bination rates for genomic regions containing these genes.This finding was interpreted to result from multiple selec-tive sweeps that occurred as human populations migratedout of Africa. Africans showed comparatively less evidenceof selection, which the researchers explained to be due tothe fact that Africans remained in regions where ancestralhuman populations had lived (an explanation that subse-quent studies have re-examined).Akey et al. (2004) carried out a similar study in which
they surveyed 132 genes in the same set of AA and EAindividuals. These loci were chosen due to their involve-ment with aspects of the inflammatory process in humans.In addition to Tajima’s D, the authors employed othermethods (Fu and Li’s D and D*, and Fay and Wu’s H). Ini-tially, the sequence data was tested against the null hy-pothesis of neutrality-equilibrium, and the authors found22 genes that deviated significantly from the null hypoth-esis for at least one of the tests. Once again, the effects ofselection and demography are confounded in such analy-
119MOLECULAR SIGNATURE OF SELECTION IN HUMANS
American Journal of Physical Anthropology—DOI 10.1002/ajpa
ses, making it difficult to attribute the deviations to onefactor or another. To address this issue, the authorsemployed computer simulations under a broad range ofdemographic scenarios to find the parameters that bestaccounted for the observed data (these scenarios includedexponential population expansion, population bottlenecks,population structure with gene flow, and population diver-gence without subsequent gene flow). Conservatively, theauthors considered as robust inferences of selection thosecases in which a test statistic was significant when com-pared to the null distribution derived from all distinct de-mographic models (Akey et al., 2004). Of the original setof genes with significant deviations, eight remained signif-icant in EA and none in AA, a finding highlighting thefact that demographic history alone can account for alarge proportion of the deviations observed when neutraltests are applied under the assumption of an equilibriummodel of population history. The finding that there wasgreater evidence of selection amongst EA compared to AAwas again interpreted to indicate that the European-derived population was exposed to novel and recent evolu-tionary pressures, and that the African-derived popula-tion experienced comparatively fewer episodes of recentpositive selection.In summary, the studies of both Stajich and Hahn (2005)
and Akey et al. (2004) convey similar ideas: the analysisof sequence data from large numbers of genes revealsstrong signatures of the populations’ demographic histor-ies, yet signatures of selection at specific genes can bedetected. In addition, both studies claimed that recentnatural selection has left a stronger mark upon Euro-pean-derived than African-derived populations, possiblydue to the novel environmental challenges that humanpopulations faced as they migrated from Africa and inhab-ited new geographic regions. One of the main limitationsof these studies, however, concerns the relatively lownumber of genes surveyed, which consisted of less than1% of the human genome. Thus, although these studieshave been useful in demonstrating the potential of ge-nome-scanning approaches, and in providing valuable in-formation about the relative effects of demography andselection in shaping polymorphism, their potential touncover novel putatively selected genes on a genome-widescale has been limited.A more comprehensive scan for selection would require
sequencing of large numbers of genes from many individu-als. Although such data is currently not available, new ge-nome-wide data sets are becoming available that consistof genotype surveys of known SNPs (e.g. Hinds et al.,2005; International HapMap Consortium, 2005). The cru-cial difference between SNP data and sequence data is theway that SNPs are selected for subsequent analyses. Typi-cally, preliminary sequencing surveys on smaller subsetsof individuals detect sites that are polymorphic, and inwhich the minor nucleotide variant (the one which occursat lowest frequency) is observed above some pre-estab-lished threshold. These \ascertained SNPs" are then usedfor subsequent analyses. When ascertained SNPs are gen-otyped in a larger population sample, they will be morepolymorphic (i.e. have higher levels of variability) than arandomly chosen polymorphic site. Because of this fea-ture, known as ascertainment bias, a survey of naturalselection based on a statistic such as Tajima’s D, which issensitive to the frequency at which variants occur withina sequence, does not seem to be theoretically sound.A recent study by Carlson et al. (2005) attempted to
address this issue by directly investigating the effect of
ascertainment bias upon Tajima’s D. They assembled twodata sets for a set of 170 genes that contained differenttypes of information. For each individual, data was avail-able both in the form of dense genotype data (i.e. ascer-tained SNPs) and resequenced data (i.e. complete sequen-ces of the genes for each individual). Tajima’s D values forthe two data sets were compared. As expected, Tajima’s Dfor the ascertained data was found to be greater than Taji-ma’s D for the sequence-based data, because SNP ascer-tainment generates data sets with an excess of intermedi-ate-frequency variants. However, despite this bias, valuesof Tajima’s D for the two data sets were found to bestrongly correlated. This implied that low values of Taji-ma’s D, revealed by a survey of SNPs, corresponded toregions of low Tajima’s D, as inferred by completesequencing. Thus, Tajima’s D could be used to scan the ge-nome for regions of unusually low D values, even if thedata analyzed consisted of ascertained SNPs.Similarly to the previously described scans, Carlson
et al. (2005) opted for an empirical approach that searchesfor outlier loci or genomic regions, rather than testing anull hypothesis. Their analyses relied on the Perlegendata set (Perlegen Sciences, http://genome.perlegen.com;see Hinds et al., 2005), which consists of more than a mil-lion SNPs typed in African Americans (AA), EuropeanAmericans (EA) and Chinese Americans (CA). Values ofTajima’s D were obtained for polymorphisms containedwithin windows of 100 kb, with windows being shiftedover the genome in 10 kb steps. A region likely to harborpositively selected genes was defined as one in which 20consecutive windows presented Tajima’s D values thatwere among the bottom 1% of the overall empirical distri-bution for the genome. Using this approach, seven regionsof unusually low Tajima’s D were found among Africans,23 regions in the Europeans, and 29 regions in the Chi-nese. All but four of these regions were detected in a singlepopulation group, indicating that most selection was spe-cific to populations rather than shared between them. Toverify the reliability of these inferences, eight genes thatfell within these putatively selected regions were chosenfor full sequence analysis. The authors found a strongtrend towards negative Tajima’s D in all the genes, aswell as unusually low levels of nucleotide diversity (p),as expected if these genes had experienced recent selec-tive sweeps. Taken together, these results demonstratedthe potential of surveys of SNPs within large windowsof the genome to detect genes under recent positiveselection.Carlson et al. (2005) did not consider it likely that Afri-
can populations had been subject to less selective pres-sures than non-Africans, as was proposed in earlier stud-ies (e.g. Akey et al., 2004; Stajich and Hahn, 2005).Instead, they suggested that the different demographicfeatures of these populations might lead to differentialcapacities to detect recent selection in each population.For example, because non-Africans probably experienceda recent bottleneck, Tajima’s D is shifted towards morepositive values. This will enhance the power of detectionof positively selected genes, which show a negative Taji-ma’s D that contrasts with the background variation. Onthe other hand, the larger effective population size of Afri-can populations may lead to lower amounts of selectionbeing detected in this population. One explanation for thisrests on the fact that in a population of large effective size(e.g. Africans) there is more opportunity for recombinationcompared to a population of smaller effective size (e.g.Europeans). Higher population recombination rates result
120 E.E. HARRIS AND D. MEYER
American Journal of Physical Anthropology—DOI 10.1002/ajpa

in shorter blocks of LD surrounding selected genes, mak-ing it harder to detect selected regions in the African data.Thus, it appears that denser sets of SNPs will be requiredin order to detect the shorter haplotypes in Africans thatbear signatures of selection (Carlson et al., 2005).
Haplotypic diversity-based approaches. Using popu-lation genetics theory it is possible to make predictionsabout how positive selection will affect polymorphismalong a chromosome. As selection drives an advantageousvariant to fixation, it is expected to reduce variation atneighboring sites. This creates a long haplotype of low di-versity, surrounding the selectively favored variant. Thus,a variant that has reached a high frequency due to natu-ral selection will be surrounded by a region of low varia-tion and will be embedded in a region of extended haplo-type homozygosity (Sabeti et al., 2002). On the otherhand, a variant that has attained a high frequencythrough the vagaries of genetic drift, would have risen infrequency over longer spans of time allowing severalrecombination events to have taken place. As a conse-quence, we do not expect to find reduced haplotype diver-sity or extended regions of haplotype homozygosity sur-rounding haplotypes that have reached high frequenciesdue to genetic drift. Sabeti et al. (2002) illustrated the fea-sibility of using these predictions to detect selected genesby analyzing the extent to which diversity had beenreduced on haplotypes carrying known selectively favor-able mutations. They applied the Extended HaplotypeHomozygosity method (EHH; described in the Theory andAnalytical Methods section) to two different loci with priorevidence of positive selection (i.e. G6PD and the CD40ligand). The method successfully revealed a signature ofpositive selection at these genes.The use of the EHH method in \genome-wide" scans
requires a data set of densely typed SNPs, so thatsearches can then be conducted in an exploratory manner,identifying regions that appear to have recently experi-enced (or are currently undergoing) a selective sweep. Thecompletion of phase I of the HapMap project providedsuch a data set (International HapMap Consortium, 2005).Voight et al. (2006) analyzed approximately 800,000 SNPsin each of three population groups: Asian (ASN), Yoruban(YRI), and Central European (CEU). Based on these data,haplotypes for each individual were inferred, and thesewere used to scan the genome for regions exhibiting sig-nificant evidence of positive selection. In brief, the statisti-cal method employed in this genome-scan (termed iHS,for integrated EHH) focused on SNPs and examined thelength of haplotypes of low-diversity on which they arefound. A ratio is computed between the sizes of the haplo-types carrying the ancestral variant, and the sizes of thehaplotypes carrying the derived variant at the focal SNP.When ancestral and derived variants sit on haplotypes ofapproximately equal length, this ratio is one. However,the ratio is skewed when one of the haplotypes of low di-versity is longer than the other. Positive selection can gen-erate such a skew because the haplotypes close to aselected variant will display longer stretches of extendedhomozygosity (i.e. regions of low variation) due to theirrapid rise in frequency. Extreme values for iHS are indica-tive of recent selective episodes. As in previous genome-wide scanning analyses, the goal of the study by Voight etal. (2006) was not to formally test the data against a nullhypothesis, but rather to detect regions of the genomethat behaved as outliers, exhibiting unusually high levelsof iHS.
When this approach was applied to the SNP data, sev-eral regions of the genome displayed clusters of SNPswith high iHS values, indicating long haplotypes ofreduced diversity. Would such clustering be expected inthe absence of positive selection? To answer this question,the authors examined several additional aspects of thedata. Using simulations, they were able to show that theempirical iHS scores are more extreme and more clus-tered than those obtained using a variety of nonequili-brium models of population history (including bottleneckand population growth models). Additional evidence thatthe clustering of SNPs with high iHS was a consequenceof selection came from application of Fay and Wu’s H sta-tistic, which showed that the regions of high iHS usuallyalso had strongly negative values of H, indicative of direc-tional selection. Furthermore, regions where SNPs withhigh iHS were clustered often contained genes known tobe selected based on previous studies (e.g., the lactasegene in Europeans). Together, these results demonstratedthat observed iHS values cannot be explained by demo-graphic factors alone, and that genes containing manySNPs with extreme iHS values could be considered candi-date-genes of positive selection.The genomic regions identified by Voight et al. (2006)
were further analyzed in order to identify particular genesshowing signatures of selection, and to ascertain the geo-graphic location and time frame of selection. The inferredage for the putative sweeps showed that selection eventswere mostly recent, for all populations. Importantly, posi-tive selection tended to postdate the time at which thesepopulations diverged, indicating that they are population-specific selection events. The size of swept regions wasfound to be larger in non-Africans than in Africans. Inconcordance with this, the ages of selective sweeps wereestimated to be more recent in non-Africans comparedwith Africans. Further insights into the nature of selec-tion were obtained by analyzing the types and functions ofgenes that were putatively under selection. Among thecategories of genes showing significant enrichment ofselected genes were several categories previously identi-fied in scanning studies of genes selected along the lineageleading to humans (Clark et al., 2003; Nielsen et al.,2005a,b). These include genes involved in chemosensoryperception, olfaction, gametogenesis, spermatogenesisand fertilization. Additionally, five distinct genes (OCA2,MYO5A, TYRP1, DTNBP1, and SLC24A5) involved inskin pigmentation were identified to have experiencedsweeps in Europeans, consistent with the hypothesis thatselection favored a phenotypic change towards lighterskin as populations migrated to higher latitudes. A num-ber of genes involved in carbohydrate metabolism werealso inferred to have been selected, as would be expected ifthe exploitation of food resources changed as populationsmoved into new geographic regions and as cultural inno-vations (e.g. agriculture and animal domestication) gener-ated novel selective pressures. Several categories of genesnot singled out in previous studies also showed up in thisanalysis such as electron transport and phosphate metab-olism genes.
Future prospects for scanning-studiesof positively selected genes
The survey of variation in the human genome with thegoal of detecting selected genes is in its infancy, but earlyresults are promising and the field is attracting muchattention. Thus far, it has been demonstrated that the var-
121MOLECULAR SIGNATURE OF SELECTION IN HUMANS
American Journal of Physical Anthropology—DOI 10.1002/ajpa
iation within and between populations is shaped largelyby the demographic history of populations, yet genes thathave experienced recent selection show patterns of varia-tion that cannot be accounted for by demography alone.Tests based on the presence of long haplotypes of low di-versity (Sabeti et al., 2002; Voight et al., 2006), on pat-terns of interpopulation differentiation (Akey et al., 2002),and on site frequency spectra (SFS) have all been shownto have the potential to detect putatively selected genes(e.g. Stajich and Hahn, 2005, Carlson et al., 2005), andrecent studies have shown the potential of applying testsbased on SFS to data collected from large-scale genotypingefforts (Kelley et al., 2006). As the number of studiesincreases, it becomes possible to compare their results.The concordance in the lists of putatively selected genesbetween the studies of Kelley et al. (2006), a very recentscanning analysis, and Carlson et al. (2005) was ex-tremely high, which is expected since both used extremevalues of Tajima’s D to delimit selected genes or genomicregions (the former searched for outlier genes, and the lat-ter searched for large genomic regions with low Tajima’sD).In addition, approximately one-third of the genes detectedas candidates for selection in Kelley et al. (2006) werewithin 100 kb of regions with high iHS values (the statis-tic used to detect selected regions based on extendedregions of haplotype homozygosity; see Voight et al.,2006). Similarly, a scanning study by Wang et al. (2006)using a novel LD-based test showed even greater overlapwith the results of Kelley et al. (2006). The extent of over-lap is a promising indication that different methods candetect the same genes and genomic regions. The lack ofoverlap, on the other hand, can have several causes. First,some methods have relative high false-discovery rates(e.g. Kelley et al., 2006). Second, methods based on testingthe null hypothesis of neutrality have low statisticalpower (i.e. they often fail to detect selected loci). Third,tests vary as to the type and time frame of selection theyhave greater ability to detect.The wide diversity of analytical methods to detect selec-
tion is an asset to investigators, since methods for detect-ing selection are known to differ both in their capacity toidentify selection that occurred at different time-depths,as well as different selective regimes. For example, testsbased on dN/dS ratios are sensitive to adaptive evolutionover longer spans of time, typically corresponding to thedivergence between species, but lack power to detectrecent selective episodes, which have resulted in few nu-cleotide substitutions. Tests based on deviations from thesite frequency spectrum, on the other hand, are particu-larly powerful to detect recent episodes of selection withinhuman populations (Sabeti et al., 2006). Among these,Fay and Wu’s H test (Fay and Wu, 2000) is capable of dis-tinguishing between purifying and positive directionalselection, thus complementing the results obtained byTajima’s D. Tests based on patterns of linkage disequili-brium are sensitive to even more recent selective episodes(e.g. on the order of 20,000 years, see Sabeti et al. 2006),but are inadequate to detect selective events that haveresulted in complete selective sweeps (such as took placeat the Duffy locus in Africa). This occurs because completesweeps erase haplotypic diversity at the selected site, fix-ing the favorable variant. This makes it impossible to com-pare the extent of haplotypic diversity between putativelyselected and nonselected haplotypes.Limitations of the methods must also be kept in mind,
so as to avoid simplistic interpretations of the results. Animportant point concerns the tests applied to detect selec-
tion since the divergence between humans and chimpan-zees, which have relied on dN/dS ratios. These tests areonly applicable to coding sequences and thus cannot pro-vide information on selection upon noncoding regulatoryelements. Given the likely importance of regulatory changesin human evolution (King and Wilson, 1975; Carroll,2005; Khaitovich et al., 2006), the development of methodsto test for selection in such regulatory elements (e.g.Keightley et al., 2005) will be of key importance in thefuture.Features of the data sets assembled to test for selection
are also likely to have an important influence on theresults. With the exception of the study of selective sweepsbased on haplotypic variation (Voight et al., 2006), allother analyses have detected significantly less evidencefor selection among Africans than non-Africans. Althoughthis has been interpreted by some (e.g. Stajich and Hahn,2005) to be a consequence of differences in the amount ofselection and nature of selective regimes between Africansand non-Africans, it seems more likely that this is an out-come of the size of the genomic regions that carry the sig-nature of selection (which may be smaller in Africansthan in non-Africans; see Carlson et al., 2005). Indeed,Voight et al. (2006) found similar numbers of genomicregions with signals of selection in all populations. Thus,it remains to be seen whether analyses based on popula-tion differentiation, and those based on the site frequencyspectrum, will be able to detect selection among Africanswhen denser SNP data are available. In fact, the mostrecent study based on identifying outliers in the site fre-quency spectrum detected approximately equal numbersof putatively selected genes in the three major populationgroups studied (African Americans, Chinese, and Euro-pean Americans; Kelley et al., 2006), suggesting thatdenser SNP data is indeed necessary to detect selectedregions in populations with lower LD (as is the case forAfricans).Important developments have also taken place in the
analyses of scans for selection on the lineage leading tohumans. A caveat of earlier studies was the inability oftests based on dN/dS ratios to distinguish between relax-ation of selective constraint and positive selection (Zhang,2004; Zhang et al., 2005; Arbiza et al., 2006; Eyre-Walker,2006). This led Zhang et al. (2005) to propose a methodthat directly tests for positive selection on specific line-ages. In essence, this is accomplished by performing alikelihood ratio test that compares a model of evolution inwhich specific lineages are under positive selection (dN/dS . 1) to a null model in which these same lineages areconstrained to having dN/dS ¼ 1 (as expected for lineagesevolving under relaxed selective constraints). The applica-tion of this new test in one recent genome-scanning study(Arbiza et al., 2006) showed that some lists of putativelyselected genes resulting from previous genome-wide stud-ies might include a considerable number of false positives(i.e. genes that actually have not been positively selected).For instance, Arbiza et al. (2006) found that many geneswithin the olfaction category, one of the categories identi-fied by Clark et al. (2003) as being enriched for genesunder positive selection, have instead undergone relaxa-tion of selective constraint, not only along the human line-age but also along the chimpanzee lineage (Arbiza et al.,2006). An advantage of these new statistical methods isthat they will allow not only the detection of actual posi-tive adaptive changes that differentiate humans fromchimpanzees, but also will allow the detection of genesthat have become nonfunctional or otherwise minimized
122 E.E. HARRIS AND D. MEYER
American Journal of Physical Anthropology—DOI 10.1002/ajpa

in functional importance in particular lineages (as evi-denced by the relaxation of selective constraints). Thechallenge of distinguishing between positive selection andrelaxation of selective constraint will not be without com-plications, however, since distinguishing these phenom-ena will be difficult for genes having weak signals of posi-tive selection (Arbiza et al., 2006).These genetic studies will doubtless fuel investigation
at the anthropological, physiological and molecular levelsby providing lists of candidate genes for selection, thatcan be further investigated from a functional perspective.At another level, the study of selection on the human ge-nome is also revisiting important questions that occupiedevolutionary biologists for the last decades. One suchquestion concerns the rate at which genomes experienceadaptive change (Kimura, 1969). The data generated bygenome sequencing allows estimates of the amount ofadaptive change that our species has experienced by ana-lyzing the amount of nonsynonymous change over theentire genome. Initial studies suggest that the human lin-eage is experiencing adaptive change at a substantiallylower rate than Drosophila and microorganisms (Eyre-Walker, 2006). However, although the rate of adaptiveevolution in our species appears to be lower than that ofDrosophila, genomic scans such as that of Voight et al.(2006) indicate that a substantial number of regions in thegenome have experienced partial selective sweeps. Thisfinding has important implications in light of a model pro-posed by Gillespie (2000) that concerns the effect of selec-tion upon closely linked sites. According to Gillespie,selected loci can cause fluctuations in the frequency ofclosely linked sites. A corollary of Gillespie’s model is thatchanges in frequency over many regions of the genomewould not be the result of genetic drift, but rather an out-come of the effects of selection at closely linked genes. Ifthere were in fact many genes in our genomes that experi-enced positive selection, this would imply that humangenetic variation might be shaped to a large extent byselective processes, and that standing levels of humanvariation will need to be interpreted in the light of bothselection and genetic drift.
DISCUSSION AND CONCLUSIONS
We have reviewed evidence for natural selection con-tained in patterns of DNA polymorphism at genes under-lying four classically studied human traits (see Table 3 forsummary of selection). For several of these genes, specifi-cally those underlying the perception of bitter-taste, lac-tase persistence, and the Duffy blood group, we havestrong evidence indicating that natural selection has beena dominant force in their evolution. The evolution ofMC1R, which is one of the loci underlying variation inhuman pigmentation, represents a more complex case,since polymorphism has been interpreted both as a conse-quence of selection or neutral evolution.Much of our understanding of the nature, geographic
distribution, level of polymorphism, and evolution of thesetraits rests on a body of data collected in the middle of the20th century. These data include phenotype distributions,results of simple physiological assays, and surveys of al-lele frequencies (e.g. through studies of protein polymor-phism). Such information has served as the basis on whichanthropologists and human biologists have proposed vari-ous hypotheses to explain the evolution of these traits. Wehave reviewed many of these hypotheses, and evaluatedthe nature of the signature of selection with regard to our
current knowledge of DNAvariation. It is therefore appro-priate to ask: In what ways have the DNA data allowed usnew insights into human adaptation? Below, we highlightspecific contributions made by genetic studies that revealtheir potential to test traditional hypotheses, and also toraise new questions.The study of lactase persistence provides a good exam-
ple of how a trait originally studied in the absence ofgenetic information benefited from the new DNA data. ADNA variant that is likely to have a causal effect on thephenotype was detected (�13910*T) (Enattah et al.,2002), and patterns of polymorphism at the LCT genewere shown to statistically support a scenario of positivedirectional selection favoring this variant in northern Eu-ropean populations (Bersaglieri et al., 2004). Further-more, using population genetics theory an estimate wasprovided for the age of the selective event that drove theallele for lactase persistence to high frequency, placing itsrise in frequency at a recent time, consistent with the esti-mated origin of dairy farming in northern Europe, *9,000years ago. This inferred date led to the realization thatthe strength of selection on lactase persistence (as meas-ured by the coefficient of selection) was as great or per-haps even greater than selection on other loci such asG6PD and b-globin. The genetic data also revealed that asimilar phenotype of lactase persistence, present in someAfrican populations, has a different genetic basis, andthus is likely to represent a trait that arose independently(Mulcare et al., 2004). While selection on lactase persist-ence appears to have been very recent, the origin of theputative causal mutation appears to be much older andprobably predates the differentiation of non-African popu-lations (Bersaglieri et al., 2004). An early origin for themutation is inferred since it is present in many non-African populations from Asia and Europe, even if only atrelatively low frequencies. Thus, several tens of thousandsof years are likely to have elapsed between the origin ofthe mutation and the onset of selection. This underscoresthe pivotal role that cultural innovations (in this case thedevelopment of dairying cultures) have played in humanevolutionary history by creating new selective environ-ments.Our understanding of the evolution of diversity in skin
color has improved considerably due to recent geneticfindings. First, it was only recently that a gene (MC1R)was shown to have an effect on pigmentation in normalhuman populations (Rees, 2004). The genetic analysis ofthis gene provided support for a model of selection favor-ing dark skin in Africa (Harding et al., 2000). The findingthat this gene is highly polymorphic in Eurasia served toraise two alternative hypotheses regarding selection inthis region: the original selective constraint may havebeen relaxed, so that the gene is evolving neutrally, or itmay be under diversifying selection. More recently, newgenes have been discovered that appear to be associatedwith variation in pigmentation, and for many of thesethere is evidence of positive selection (Izagirre et al., 2006;Voight et al., 2006). These results underscore the multi-genic and adaptive nature of human skin color, and sug-gest that selection upon pigmentation must be studied inthe context of the effects of multiple genes.The study of the Duffy blood group polymorphism and
its relation to resistance to the malarial parasite Plasmo-dium vivax, provides an additional example of how a per-spective based on DNA variation offers new insights intohuman adaptive evolution. Key to the understanding ofhow this polymorphism evolved is the estimation of the
123MOLECULAR SIGNATURE OF SELECTION IN HUMANS
American Journal of Physical Anthropology—DOI 10.1002/ajpa
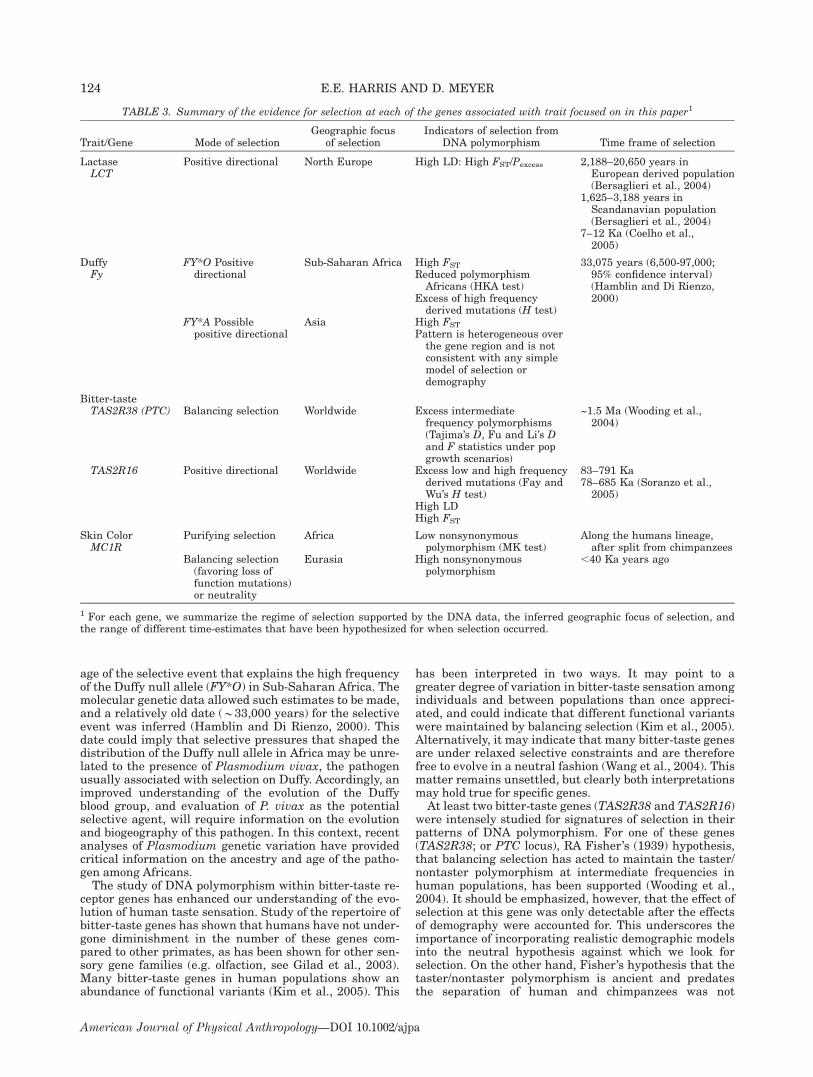
age of the selective event that explains the high frequencyof the Duffy null allele (FY*O) in Sub-Saharan Africa. Themolecular genetic data allowed such estimates to be made,and a relatively old date (*33,000 years) for the selectiveevent was inferred (Hamblin and Di Rienzo, 2000). Thisdate could imply that selective pressures that shaped thedistribution of the Duffy null allele in Africa may be unre-lated to the presence of Plasmodium vivax, the pathogenusually associated with selection on Duffy. Accordingly, animproved understanding of the evolution of the Duffyblood group, and evaluation of P. vivax as the potentialselective agent, will require information on the evolutionand biogeography of this pathogen. In this context, recentanalyses of Plasmodium genetic variation have providedcritical information on the ancestry and age of the patho-gen among Africans.The study of DNA polymorphism within bitter-taste re-
ceptor genes has enhanced our understanding of the evo-lution of human taste sensation. Study of the repertoire ofbitter-taste genes has shown that humans have not under-gone diminishment in the number of these genes com-pared to other primates, as has been shown for other sen-sory gene families (e.g. olfaction, see Gilad et al., 2003).Many bitter-taste genes in human populations show anabundance of functional variants (Kim et al., 2005). This
has been interpreted in two ways. It may point to agreater degree of variation in bitter-taste sensation amongindividuals and between populations than once appreci-ated, and could indicate that different functional variantswere maintained by balancing selection (Kim et al., 2005).Alternatively, it may indicate that many bitter-taste genesare under relaxed selective constraints and are thereforefree to evolve in a neutral fashion (Wang et al., 2004). Thismatter remains unsettled, but clearly both interpretationsmay hold true for specific genes.At least two bitter-taste genes (TAS2R38 and TAS2R16)
were intensely studied for signatures of selection in theirpatterns of DNA polymorphism. For one of these genes(TAS2R38; or PTC locus), RA Fisher’s (1939) hypothesis,that balancing selection has acted to maintain the taster/nontaster polymorphism at intermediate frequencies inhuman populations, has been supported (Wooding et al.,2004). It should be emphasized, however, that the effect ofselection at this gene was only detectable after the effectsof demography were accounted for. This underscores theimportance of incorporating realistic demographic modelsinto the neutral hypothesis against which we look forselection. On the other hand, Fisher’s hypothesis that thetaster/nontaster polymorphism is ancient and predatesthe separation of human and chimpanzees was not
TABLE 3. Summary of the evidence for selection at each of the genes associated with trait focused on in this paper1
Trait/Gene Mode of selectionGeographic focus
of selectionIndicators of selection from
DNA polymorphism Time frame of selection
LactaseLCT
Positive directional North Europe High LD: High FST/Pexcess 2,188–20,650 years inEuropean derived population(Bersaglieri et al., 2004)
1,625–3,188 years inScandanavian population(Bersaglieri et al., 2004)
7–12 Ka (Coelho et al.,2005)
DuffyFy
FY*O Positivedirectional
Sub-Saharan Africa High FST 33,075 years (6,500-97,000;95% confidence interval)(Hamblin and Di Rienzo,2000)
Reduced polymorphismAfricans (HKA test)
Excess of high frequencyderived mutations (H test)
FY*A Possiblepositive directional
Asia High FST
Pattern is heterogeneous overthe gene region and is notconsistent with any simplemodel of selection ordemography
Bitter-tasteTAS2R38 (PTC) Balancing selection Worldwide Excess intermediate
frequency polymorphisms(Tajima’s D, Fu and Li’s Dand F statistics under popgrowth scenarios)
~1.5 Ma (Wooding et al.,2004)
TAS2R16 Positive directional Worldwide Excess low and high frequencyderived mutations (Fay andWu’s H test)
83–791 Ka78–685 Ka (Soranzo et al.,2005)
High LDHigh FST
Skin ColorMC1R
Purifying selection Africa Low nonsynonymouspolymorphism (MK test)
Along the humans lineage,after split from chimpanzees
Balancing selection(favoring loss offunction mutations)or neutrality
Eurasia High nonsynonymouspolymorphism
,40 Ka years ago
1 For each gene, we summarize the regime of selection supported by the DNA data, the inferred geographic focus of selection, andthe range of different time-estimates that have been hypothesized for when selection occurred.
124 E.E. HARRIS AND D. MEYER
American Journal of Physical Anthropology—DOI 10.1002/ajpa
supported by the DNA data, which instead indicates thatthe human taster and nontaster haplotypes divergedapproximately 1.5 Ma (Wooding et al., 2004; 2006). Stud-ies of TAS2R38 in chimpanzees have indicated that theirnontaster haplotype has a different molecular basis fromthat in humans, and have indicated that this haplotypearose independently along the chimpanzee lineage(Wooding et al., 2006). Another bitter-taste gene(TAS2R16) was also found to carry a clear signature ofselection. For this gene, positive selection appears to haveacted to bring two similar haplotypes (A and B) to near fix-ation frequencies in many populations worldwide (Sor-anzo et al., 2005).The studies of the TAS2R16 and TAS2R38 bitter-taste
genes illustrate another way in which DNA polymorphismdata have aided the study of selection. The discovery offunctional DNA variants in these genes through popula-tion analyses made it possible to experimentally identify(through in vitro and in vivo studies) precisely which DNAvariants are responsible for differences in receptor-sensi-tivity to toxins (Bufe et al., 2002; 2005; Soranzo et al.,2005; Wooding et al., 2006).These success stories clearly demonstrate the utility of
investigating human adaptations from a genetic perspec-tive. However, they also serve as a reminder that geneticanalyses would be of limited utility in constructing adapt-ive arguments in the absence of additional sources of in-formation. For all four case studies presented in thisreview, an understanding of the patterns of genetic varia-tion required careful analysis of data from various biologi-cal fields. For example, the analyses of selection on skincolor used information regarding nutrient degradationdue to UV radiation, skin cancer susceptibility as a func-tion of pigmentation, vitamin D synthesis dependence onUVradiation, archaeological information on recent humanmigrations, as well as the biochemical consequences ofspecific mutations on the MC1R gene (Barsh, 2003). Simi-larly multidisciplinary approaches were employed in thediscussion of selection upon the Duffy null alleles, the lac-tase persistence allele, and the evolution of bitter-tastereceptors.The most common approach in the study of adaptation
involves studying a phenotypic trait and then trying tounderstand its underlying genetic basis. Indeed, thisapproach forms the basis of what we have called the \can-didate-gene" approach, in which a priori informationabout the function of the gene and its association with avariable trait led to its being analyzed for DNA polymor-phism. We believe such approaches will continue tobe useful in searching for the signature of selection forclassically identified adaptations for the human speciesas a whole, as well for population specific adaptations.Although the candidate gene approach has been tradition-ally employed in genetics, the results obtained by genomescans for selected genes are likely to have a large impacton the field and may result in a reverse flow of informa-tion. That is, candidate genes are detected, and their phe-notypic expression must subsequently be understood.Advances in gene-expression methods in which the linkbetween genotype and phenotype can further be under-stood will complement this approach. Although genomescans for selected regions are providing us with lists ofcandidate genes for natural selection, they clearly cannotexhaust our understanding of human adaptation. Candi-date genes that emerge from scanning studies are on theirown simply points of departure for research of humanadaptive evolution, and must be placed within a multi-
disciplinary context so that adaptive hypotheses can beformulated and tested.Within the field of genetics, several developments will
further enable the study of adaptive evolution. Withrespect to genome scans, data sets consisting of moredensely typed SNPs will provide greater power to detectselected regions of the genome. Future studies will alsobenefit from increased geographic sampling of populations.Current studies rely on broadly-defined and, in some cases,admixed populations (e.g. Akey et al., 2004; Carlson et al.,2005; Nielsen et al., 2005b; Stajich and Hahn, 2005; Voightet al., 2006; Zhang et al., 2006). Samples from populationswith less admixture may provide increased power to detectselection, since population specific signatures will not bediluted by the presence of genes from other populations.On the other hand, studying admixed populations may insome cases be a valuable approach for establishing correla-tions between specific genetic variants and phenotypes(e.g. Lamason et al., 2005). Nonetheless, assembling popu-lation samples at a finer resolution will allow for the detec-tion of episodes of positive selection that are restricted geo-graphically. For instance, uncovering selection at genesunderlying adaptations to life at high-altitude in Tibetans(Beall, 2000 and Gelfi et al., 2004) will benefit by intensivescreening in particular populations.
ACKNOWLEDGMENTS
We thank two anonymous reviewers, as well as SaraStinson, for offering us their comments that helped us tosubstantially improve the manuscript. A PSC-CUNYAward to E.E.H helped facilitate this research. Drs.Terry Harrison, Susan Anton, and the Department ofAnthropology at New York University, are thanked forresearch support to E.E.H. We thank Dr. Pam Crabtreefor discussing with us the archeological evidence fordairying in Europe.
LITERATURE CITED
Akey JM, Eberle MA, Rieder MJ, Carlson CS, Shriver MD,Nickerson DA, Kruglyak L. 2004. Population history and nat-ural selection shape patterns of genetic variation in 132genes. PLoS Biol 2:e286.
Akey JM, Swanson WJ, Madeoy J, Eberle M, Shriver MD. 2006.TRPV6 exhibits unusual patterns of polymorphism and diver-gence in worldwide populations. Hum Mol Genet 15:2106–2113.
Akey JM, Zhang G, Zhang K, Jin L, Shriver MD. 2002. Inter-rogating a high-density SNP map for signatures of naturalselection. Genome Res 12:1805–1814.
Altshuler D, Brooks LD, Chakravarti A, Collins FS, Daly MJ,Donnelly P. 2005. A haplotype map of the human genome. Na-ture 437:1299–1320.
Anton SC. 2003. Natural history of Homo erectus. Am J PhysAnthropol Suppl 37:126–170.
Aoki K. 2002. Sexual selection as a cause of human skin colourvariation: Darwin’s hypothesis revisited. Ann Hum Biol 29:589–608.
Arbiza L, Dopazo J, Dopazo H. 2006. Positive selection, relaxa-tion of constraint and acceleration in the evolution of thehuman and chimp genome. PLoS Comput Biol 2:e38.
Arredi B, Poloni ES, Paracchini S, Zerjal T, Fathallah DM,Makrelouf M, Pascali VL, Novelletto A, Tyler-Smith C. 2004. Apredominantly neolithic origin for Y-chromosomal DNAvariationinNorth Africa. AmJHumGenet 75:338–345.
Ayala FJ, Escalante AA, Rich SM. 1999. Evolution of Plasmo-dium and the recent origin of the world populations of Plas-modium falciparum. Parassitologia 41:55–68.
125MOLECULAR SIGNATURE OF SELECTION IN HUMANS
American Journal of Physical Anthropology—DOI 10.1002/ajpa
Baker PT. 1988. Human adaptability. In: Harrison GA, Tanner JM,Pilbeam DR, Baker PT, editors. Human biology: An introductionto human evolution, variation, growth, and adaptability. Oxford:OxfordUniversity Press. p 437–447.
Bamshad M, Wooding SP. 2003. Signatures of natural selectionin the human genome. Nat Rev Genet 4:99–111.
Barsh GS. 2003. What controls variation in human skin color?PLoS Biol 1:e27.
Beall CM. 2000. Tibetan and Andean patterns of adaptation tohigh-altitude hypoxia. Hum Biol 72:201–228.
Beaumont MA. 2005. Adaptation and speciation: What can FST
tell us? Trends Ecol Evol 20:435–440.Beja-Pereira A, Luikart G, England PR, Bradley DG, Jann OC,
Bertorelle G, Chamberlain AT, Nunes TP, Metodiev S, Fer-rand N, Erhardt G. 2003. Gene-culture coevolution betweencattle milk protein genes and human lactase genes. NatGenet 35:311–313.
Bersaglieri T, Sabeti PC, PattersonN, Vanderploeg T, Schaffner SF,Drake JA, Rhodes M, Reich DE, Hirschhorn JN. 2004. Geneticsignatures of strong recent positive selection at the lactase gene.AmJHumGenet 74:1111–1120.
Blench R. 2001. Types of language spread and their archaeologi-cal correlates: The example of the Berber. Origini 23:169–189.
Blum HF. 1961. Does the melanin pigment of human skin haveadaptive value? Q Rev Biol 36:50–63.
Bodmer WF, Cavalli-Sforza LL. 1976. Genetics, evolution, andman. San Francisco: W.H. Freeman.
Boll W, Wagner P, Mantei N. 1991. Structure of the chromo-somal gene and cDNAs coding for lactase-phlorizin hydrolasein humans with adult-type hypolactasia or persistence of lac-tase. Am J Hum Genet 48:889–902.
Boyce AJ, Harrison GA, Platt CM, Hornabrook RW. 1976. Asso-ciation between PTC taster status and goitre in a PapauaNew Guinea population. Hum Biol 48:769–773.
Bufe B, Breslin PA, Kuhn C, Reed DR, Tharp CD, Slack JP,Kim UK, Drayna D, Meyerhof W. 2005. The molecular basisof individual differences in phenylthiocarbamide and pro-pylthiouracil bitterness perception. Curr Biol 15:322–327.
Bufe B, Hofmann T, Krautwurst D, Raguse JD, Meyerhof W. 2002.The human TAS2R16 receptor mediates bitter taste in responseto b-glucopyranosides. Nat Genet 32:397–401.
Byard PJ, Lees FC. 1981. Estimating the number of loci deter-mining skin colour in a hybrid population. Ann of Hum Biol8:49–58.
Carlson CS, Thomas DJ, Eberle MA, Swanson JE, Livingston RJ,Rieder MJ, Nickerson DA. 2005. Genomic regions exhibitingpositive selection identified from dense genotype data. GenomeRes 15:1553–1565.
Carroll SB. 2005. Evolution at two levels: On genes and form.PLoS Biol 3:e245.
Carter R. 2003. Speculations on the origins of Plasmodiumvivax malaria. Trends Parasitol 19:214–219.
Cavalli-Sforza LL, Bodmer WF. 1971. The genetics of humanpopulations. San Francisco: W.H. Freeman.
Cavalli-Sforza LL, Menozzi P, Piazza A. 1994. The history and ge-ography of human genes. Princeton: Princeton University Press.
Chimpanzee Sequencing and Analysis Consortium. 2005. Initialsequence of the chimpanzee genome and comparison with thehuman genome. Nature 437:69–87.
Clark AG, Glanowski S, Nielsen R, Thomas PD, Kejariwal A,ToddMA, TanenbaumDM, Civello D, Lu F, Murphy B, Ferriera S,Wang G, Zheng X, White TJ, Sninsky JJ, Adams MD, CargillM. 2003. Inferring nonneutral evolution from human-chimp-mouse orthologous gene trios. Science 302:1960–1963.
Coelho M, Luiselli D, Bertorelle G, Lopes AI, Seixas S, Destro-Bisol G, Rocha J. 2005. Microsatellite variation and evolutionof human lactase persistence. Hum Genet 117:329–339.
Cook G. 1978. Did persistence of intestinal lactase into adultlife originate on the Arabian peninsula? Man (New Ser) 13:418–427.
Copley MS, Berstan R, Dudd SN, Docherty G, Mukherjee AJ,Straker V, Payne S, Evershed RP. 2003. Direct chemical evi-dence for widespread dairying in prehistoric Britain. ProcNatl Acad Sci USA 100:1524–1529.
Copley MS, Berstan R, Mukherjee S, Dudd S, Straker V, PayneS, Evershed R. 2005. Dairying in antiquity. III. Evidence fromabsorbed lipid residues dating to the British Neolithic.J Archaeol Sci 32:523–546.
Crow J, Kimura M. 1970. An introduction to population geneticstheory. New York: Harper and Row.
Cruciani F, Santolamazza P, Shen P, Macaulay V, Moral P,Olckers A, Modiano D, Holmes S, Destro-Bisol G, Coia V,Wallace DC, Oefner PJ, Torroni A, Cavalli-Sforza LL, ScozzariR, Underhill PA. 2002. A back migration from Asia to sub-Saharan Africa is supported by high-resolution analysis ofhuman Y-chromosome haplotypes. Am J Hum Genet 70:1197–1214.
Cutbush M, Mollison PL. 1950. The Duffy blood group system.Heredity 4:383–389.
Darwin C. 1871. The descent of man. London: John Murray.Diamond J. 1992. The third chimpanzee. New York: HarperCol-
lins.Diamond J. 2005. Evolutionary biology: Geography and skin
colour. Nature 435:283–284.Dorus S, Vallender EJ, Evans PD, Anderson JR, Gilbert SL,
Mahowald M, Wyckoff GJ, Malcom CM, Lahn BT. 2004. Accel-erated evolution of nervous system genes in the origin ofHomo sapiens. Cell 119:1027–1040.
Drayna D. 2005. Human taste genetics. Annu Rev GenomicsHum Genet 6:217–235.
Drewnowski A, Gomez-Carneros C. 2000. Bitter taste, phytonu-trients, and the consumer: A review. Am J Clin Nutr 72:1424–1435.
Durham W. 1991. Coevolution: Genes, culture, and human di-versity. Stanford: Stanford University Press.
Ellegren H. 2004. Microsatellites: Simple sequences with com-plex evolution. Nat Rev Genet 5:435–445.
Enattah NS. 2005. Molecular genetics of lactase persistence.PhD dissertation, University of Helsinki.
Enattah NS, Sahi T, Savilahti E, Terwilliger JD, Peltonen L,Jarvela I. 2002. Identification of a variant associated withadult-type hypolactasia. Nat Genet 30:233–237.
Escalante AA, Cornejo OE, Freeland DE, Poe AC, Durrego E,Collins WE, Lal AA. 2005. A monkey’s tale: The origin ofPlasmodium vivax as a human malaria parasite. Proc NatlAcad Sci USA 102:1980–1985.
Evans PD, Anderson JR, Vallender EJ, Choi SS, Lahn BT.2004b. Reconstructing the evolutionary history of microcepha-lin, a gene controlling human brain size. Hum Mol Genet13:1139–1145.
Evans PD, Anderson JR, Vallender EJ, Gilbert SL, Malcom CM,Dorus S, Lahn BT. 2004a. Adaptive evolution of ASPM, amajor determinant of cerebral cortical size in humans. HumMol Genet 13:489–494.
Evans PD, Gilbert SL, Mekel-Bobrov N, Vallender EJ, Anderson JR,Vaez-Azizi LM, Tishkoff SA, Hudson RR, Lahn BT. 2005.Microcephalin, a gene regulating brain size, continues toevolve adaptively in humans. Science 309:1717–1720.
Ewens WJ. 1972. The sampling theory of selectively neutral al-leles. Theor Popul Biol 3:87–112.
Eyre-Walker A. 2006. The genomic rate of adaptive evolution.Trends Ecol Evol 21:1350–1360.
Falk D. 1990. Brain evolution in Homo: The \radiator" theory.Behav Brain Sci 13:333–344.
Fay JC, Wu CI. 2000. Hitchhiking under positive Darwinianselection. Genetics 155:1405–1413.
Feldman MW, Cavalli-Sforza LL. 1989. On the theory of evolu-tion under genetic and cultural transmission with the applica-tion for the lactose absorption problem. In: Feldman MW, edi-tor. Mathematical evolutionary theory. Princeton: PrincetonUniversity Press. p 145–173.
Fischer A, Gilad Y, Man O, Paabo S. 2005. Evolution of bittertaste receptors in humans and apes. Mol Biol Evol 22:432–436.
Fisher RA, Ford EB, Huxley J. 1939. Taste-testing the anthro-poid apes. Nature 144:750.
Fisher SE, Marcus GF. 2006. The eloquent ape: Genes, brainsand the evolution of language. Nat Rev Genet 7:9–20.
126 E.E. HARRIS AND D. MEYER
American Journal of Physical Anthropology—DOI 10.1002/ajpa

Flatz G, Rotthauwe HW. 1971. Evidence against nutritional ad-aptation of tolerance to lactose. Humangenetik 13:118–125.
Fox AL. 1932. The relationship between chemical constitutionand taste. Proc Natl Acad Sci USA 18:115–120.
Frisse L, Hudson RR, Bartoszewicz A, Wall JD, Donfack J,Di Rienzo A. 2001. Gene conversion and different populationhistories may explain the contrast between polymorphismand linkage disequilibrium levels. Am J Hum Genet 69:831–843.
Fu YX, Li WH. 1993. Statistical tests of neutrality of mutations.Genetic 133:693–709.
Gabriel SB, Schaffner SF, Nguyen H, Moore JM, Roy J,Blumenstiel B, Higgins J, DeFelice M, Lochner A, Faggart M,Liu-Cordero SN, Rotimi C, Adeyemo A, Cooper R, Ward R,Lander ES, Daly MJ, Altshuler D. 2002. The structure of hap-lotype blocks in the human genome. Science 296:2225–2229.
Gelfi C, De Palma S, Ripamonti M, Eberini I, Wait R, Bajra-charya A, Marconi C, Schneider A, Hoppeler H, Cerretelli P.2004. New aspects of altitude adaptation in Tibetans: A proteo-mic approach. FASEB J 18:612–614.
Gilad Y, Bustamante CD, Lancet D, Paabo S. 2003. Naturalselection on the olfactory receptor gene family in humans andchimpanzees. Am J Hum Genet 73:489–501.
Gilad Y, Man O, Glusman G. 2005. A comparison of the humanand chimpanzee olfactory receptor gene repertoires. GenomeRes 15:224–230.
Gillespie JH. 2000. Genetic drift in an infinite population: Thepseudo-hitchhiking model. Genetics 155:909–919.
Goldstein DB, Chikhi L. 2002. Human migrations and popula-tion structure: What we know and why it matters. Annu RevGenomics Hum Genet 3:129–152.
Goodman M, Grossman LI, Wildman DE. 2005. Moving primategenomics beyond the chimpanzee genome. Trends Genet21:511–517.
Gould SJ, Vrba ES. 1982. Exaptation—A missing term in thescience of form. Paleobiology 8:4–15.
Graf J, Hodgson R, van Daal A. 2005. Single nucleotide poly-morphisms in the MATP gene are associated with normalhuman pigmentation variation. Hum Mutat 25:278–284.
Greaves M. 2002. Cancer causation: The Darwinian downside ofpast success. Lancet Oncol 3:244–251.
Guo SW, Reed DR. 2001. The genetics of phenylthiocarbamideperception. Ann Hum Biol 28:111–142.
Hadley TJ, Peiper SC. 1997. From malaria to chemokine recep-tor: The emerging physiologic role of the Duffy blood groupantigen. Blood 89:3077–3091.
Hamblin MT, Di Rienzo A. 2000. Detection of the signature ofnatural selection in humans: Evidence from the Duffy bloodgroup locus. Am J Hum Genet 66:1669–1679.
Hamblin MT, Thompson EE, Di Rienzo A. 2002. Complex signa-tures of natural selection at the Duffy blood group locus. AmJ Hum Genet 70:369–383.
Harding RM, Healy E, Ray AJ, Ellis NS, Flanagan N, Todd C,Dixon C, Sajantila A, Jackson IJ, Birch-Machin MA, Rees JL.2000. Evidence for variable selective pressures at MC1R. AmJ Hum Genet 66:1351–1361.
Harpending HC, Batzer MA, Gurven M, Jorde LB, Rogers AR,Sherry ST. 1998. Genetic traces of ancient demography. ProcNatl Acad Sci USA 95:1961–1967.
Harris H, Kalmus H. 1949. The measurement of taste sensitiv-ity to phenylthiourea (PTC). Ann Eugen 15:24–31.
Harrison GA. 1988. Human adaptions. InHarrisonGA, Tanner JM,Pilbeam DR, Baker PT, editors. Human biology: An introduc-tion to human evolution, variation, growth, and adaptability.Oxford: Oxford University Press. p 145–336.
Harvey CB, Fox MF, Jeggo PA, Mantei N, Povey S, Swallow DM.1993. Regional localization of the lactase-phlorizin hydrolasegene, LCT, to chromosome 2q21. Ann Hum Genet 57 (Part 3):179–185.
Harvey CB, Hollox EJ, Poulter M, Wang Y, Rossi M, Auricchio S,Iqbal TH, Cooper BT, Barton R, Sarner M, Korpela R, Swal-low DM. 1998. Lactase haplotype frequencies in Caucasians:Association with the lactase persistence/non-persistence poly-morphism. Ann Hum Genet 62 (Part 3):215–223.
Harvey CB, Pratt WS, Islam I, Whitehouse DB, Swallow DM.1995. DNA polymorphisms in the lactase gene. Linkage dise-quilibrium across the 70-kb region. Eur JHumGenet 3:27–41.
Hinds DA, Stuve LL, Nilsen GB, Halperin E, Eskin E, Ballinger DG,Frazer KA, Cox DR. 2005. Whole-genome patterns of commonDNA variation in three human populations. Science307:1072–1079.
Hladik CM, Simmen B. 1996. Taste perception and feedingbehavior in nonhuman primates and human populations. EvolAnthropol 5:58–71.
Holden C, Mace R. 1997. Phylogenetic analysis of the evolutionof lactose digestion in adults. Hum Biol 69:605–628.
Hollox EJ, Poulter M, Zvarik M, Ferak V, Krause A, Jenkins T,Saha N, Kozlov AI, Swallow DM. 2001. Lactase haplotype di-versity in the Old World. Am J Hum Genet 68:160–172.
Hudson RR, Kreitman M, Aguade M. 1987. A test of neutralmolecular evolution based on nucleotide data. Genetics116:153–159.
Hughes AL, Nei M. 1988. Pattern of nucleotide substitution atMHC class I loci reveals overdominant selection. Nature335:167–170.
ImwongM, SudimackD, Pukrittayakamee S,Osorio L, Carlton JM,Day NP, White NJ, Anderson TJ. 2006. Microsatellite varia-tion, repeat array length and population history of Plasmo-dium vivax. Mol Biol Evol 23:1016–1018.
International HapMap Consortium. 2005. A haplotype map ofthe human genome. Nature 437:1299–1320.
Izagirre N, Garcıa I, Junquera C, de la Rua C, Alonso A. 2006. Ascan for signatures of positive selection in candidate loci for skinpigmentation in humans. Mol Biol Evol 23:1697–1706.
Jablonski NG. 1999. A possible link between neural tube defectsand ultraviolet light exposure. Med Hypotheses 52:581,582.
Jablonski NG, Chaplin G. 2000. The evolution of human skincoloration. J Hum Evol 39:57–106.
Jackson F. 1990. Two evolutionary models for the interactions ofdietary cyanogens, hemoglobin S, and falciparum malaria.Am J Hum Biol 2:521–532.
Jackson FLC. 1993. The influence of dietary cyanogenic glyco-sides from cassavaon human metabolic biology and microevo-lution. In: Hladik CM, Hladik A, Linares OF, Pagezy H, Sem-ple A, Hadley M, editors. Tropical forests, people, and food:Biocultural interactions and applications to development.Paris: UNESCO-Parthenon. p 321–338.
Jackson FLC. 1996. The coevolutionary relationship of humansand domesticated plants. Yrbk Phys Anthropol 39:161–176.
Jarvela IE. 2005. Molecular genetics of adult-type hypolactasia.Ann Med 37:179–185.
John PR, Makova K, Li WH, Jenkins T, Ramsay M. 2003. DNApolymorphism and selection at the melanocortin-1 receptorgene in normally pigmented southern African individuals.Ann N Y Acad Sci 994:299–306.
Jongwutiwes S, Putaporntip C, Iwasaki T, Ferreira MU, Kan-bara H, Hughes AL. 2005. Mitochondrial genome sequencessupport ancient population expansion in Plasmodium vivax.Mol Biol Evol 22:1733–1739.
Jorde LB,WatkinsWS, BamshadMJ. 2001. Population genomics: Abridge from evolutionary history to genetic medicine. Hum MolGenet 10:2199–2207.
Kaiser J. 2004. Ural farmers got milk gene first? Science 306:1284–1285.
Kayser M, Brauer S, Stoneking M. 2003. A genome scan todetect candidate regions influenced by local natural selectionin human populations. Mol Biol Evol 20:893–900.
Keightley PD, Lercher MJ, Eyre-Walker A. 2005. Evidence forwidespread degradation of gene control regions in hominidgenomes. PLoS Biol 3:e42.
Kelley JL, Madeoy J, Calhoun JC, Swanson W, Akey JM. 2006.Genomic signaturas of positive selection in humans and thelimits of outlier approaches. Genome Res 16:980–989.
Khaitovich P, Enard W, Lachmann M, Paabo S. 2006. Evolutionof primate gene expression. Nat Rev Genet 7:693–702.
Kim U, Wooding S, Ricci D, Jorde LB, Drayna D. 2005. World-wide haplotype diversity and coding sequence variation athuman bitter taste receptor loci. Hum Mutat 26:199–204.
127MOLECULAR SIGNATURE OF SELECTION IN HUMANS
American Journal of Physical Anthropology—DOI 10.1002/ajpa
Kim UK, Breslin PA, Reed D, Drayna D. 2004. Genetics ofhuman taste perception. J Dent Res 83:448–453.
Kim UK, Drayna D. 2005. Genetics of individual differences inbitter taste perception: Lessons from the PTC gene. ClinGenet 67:275–280.
Kim UK, Jorgenson E, Coon H, Leppert M, Risch N, Drayna D.2003. Positional cloning of the human quantitative trait locusunderlying taste sensitivity to phenylthiocarbamide. Science299:1221–1225.
Kimura M. 1969. The rate of molecular evolution consideredfrom the standpoint of population genetics. Proc Natl AcadSci USA 63:1181–1188.
Kimura M. 1983. The neutral theory of molecular evolution.Cambridge: Cambridge University Press.
King MC, Wilson AC. 1975. Evolution at two levels in humansand chimpanzees. Science 188:107–116.
Lahr MM, Foley RA. 1998. Towards a theory of modern humanorigins: Geography, demography, and diversity in recent humanevolution. Am J Phys Anthropol Suppl 27:137–176.
Lamason RL, Mohideen MA, Mest JR, Wong AC, Norton HL,Aros MC, Jurynec MJ, Mao X, Humphreville VR, HumbertJE, Sinha S, Moore JL, Jagadeeswaran P, Zhao W, Ning G,Makalowska I, McKeigue PM, O’Donnell D, Kittles R, ParraEJ, Mangini NJ, Grunwald DJ, Shriver MD, Canfield VA,Cheng KC. 2005. SLC24A5, a putative cation exchanger,affects pigmentation in zebrafish and humans. Science 310:1782–1786.
Lander ES, Linton LM, et al. (256 coauthors). 2001. Initial se-quencing and analysis of the human genome. Nature409:860–921.
Leclerc MC, Durand P, Gauthier C, Patot S, Billotte N, Mene-gon M, Severini C, Ayala FJ, Renaud F. 2004. Meager geneticvariability of the human malaria agent Plasmodium vivax.Proc Natl Acad Sci USA 101:14455–14460.
Lewinsky RH, Jensen TG, Moller J, Stensballe A, Olsen J,Troelsen JT. 2005. T-13910 DNA variant associated with lac-tase persistence interacts with Oct-1 and stimulates lactasepromoter activity in vitro. Hum Mol Genet 14:3945–3953.
Lewontin RC, Krakauer J. 1973. Distribution of gene frequencyas a test of the theory of the selective neutrality of polymor-phisms. Genetics 74:175–195.
Li W. 1975. The first arrival time and mean age of a deleteriousmutant gene in a finite population. Am J Hum Genet 27:276–286.
Livingstone FB. 1958. The distribution of the sickle cell gene inLiberia. Am J Hum Genet 10:33–41.
Livingstone FB. 1984. The Duffy blood groups, vivax malaria,and malaria selection in human populations: A review. HumBiol 56:413–425.
Lloyd M, Mevissen G, Fischer M, Olsen W, Goodspeed D,Genini M, Boll W, Semenza G, Mantei N. 1992. Regulation ofintestinal lactase in adult hypolactasia. J Clin Invest 89:524–529.
Loomis WF. 1967. Skin-pigment regulation of vitamin-D biosyn-thesis in man. Science 157:501–506.
Mace R, Jordan F, Holden C. 2003. Testing evolutionary hypoth-eses about human biological adaptation using cross-culturalcomparison. Comp Biochem Physiol A Mol Integr Physiol136:85–94.
Mackenzie C, Mackenzie J. 1943. Effect of sulfonamides and thi-oureas on the thyroid gland and basal metabolism. Endocri-nology 32:185–209.
Makova K, Norton H. 2005. Worldwide polymorphism at theMC1R locus and normal pigmentation variation in humans.Peptides 26:1901–1908.
McCracken RD. 1971. Origins and implications of the distribu-tion of adult lactase deficiency in human populations. J TropPediatr Environ Child Health 17:7–10.
McDonald JH, Kreitman M. 1991. Adaptive protein evolution atthe Adh locus in Drosophila. Nature 351:652–654.
Mekel-Bobrov N, Gilbert SL, Evans PD, Vallender EJ, AndersonJR, Hudson RR, Tishkoff SA, Lahn BT. 2005. Ongoing adapt-ive evolution of ASPM, a brain size determinant in Homosapiens. Science 309:1720–1722.
Meyerhof W, Behrens M, Brockhoff A, Bufe B, Kuhn C. 2005.Human bitter taste perception. Chem Senses 30 (Suppl 1):i14–i15.
Miller LH, Mason SJ, Clyde DF, McGinniss MH. 1976. The re-sistance factor to Plasmodium vivax in blacks. The Duffy-blood-group genotype, FyFy. N Engl J Med 295:302–304.
Molnar S. 2002. Human variation: Races, types and ethnicgroups. Upper Saddle River: Prentice Hall.
Mountjoy KG, Robbins LS, Mortrud MT, Cone RD. 1992. Thecloning of a family of genes that encode the melanocortinreceptors. Science 257:1248–1251.
Mu J, Joy DA, Duan J, Huang Y, Carlton J, Walker J, Barnwell J,Beerli P, Charleston MA, Pybus OG, Su XZ. 2005. Host switchleads to emergence of Plasmodium vivax malaria in humans.Mol Biol Evol 22:1686–1693.
Mulcare CA, Weale ME, Jones AL, Connell B, Zeitlyn D, Tare-kegn A, Swallow DM, Bradman N, Thomas MG. 2004. The Tallele of a single-nucleotide polymorphism 13.9 kb upstreamof the lactase gene (LCT) (C-13.9kbT) does not predict orcause the lactase-persistence phenotype in Africans. Am JHum Genet 74:1102–1110.
Myles S, Bouzekri N, Haverfield E, Cherkaoui M, Dugoujon JM,Ward R. 2005. Genetic evidence in support of a shared Eura-sian-North African dairying origin. Hum Genet 117:34–42.
Nachman MW, Crowell SL. 2000. Contrasting evolutionary his-tories of two introns of the Duchenne muscular dystrophygene, Dmd, in humans. Genetics 155:1855–1864.
Nagel RL, Raventos C, Tanowitz HB, Wittner M. 1980. Effect ofsodium cyanate on Plasmodium falciparum in vitro. J Parasi-tol 66:483–487.
Nei M, Kumar S. 2000. Molecular evolution and phylogenetics.Oxford, NY: Oxford University Press.
Nekrutenko A, Makova KD, Li WH. 2002. The K(A)/K(S) ratiotest for assessing the protein-coding potential of genomicregions: An empirical and simulation study. Genome Res12:198–202.
Nielsen R. 2001. Statistical tests of selective neutrality in theage of genomics. Heredity 86:641–647.
Nielsen R. 2005. Molecular signatures of natural selection. AnnRev Genet 39:197–218.
Nielsen R, Bustamante C, Clark AG, Glanowski S, Sackton TB,Hubisz MJ, Fledel-Alon A, TanenbaumDM, Civello D,White TJ,Sninsky JJ, Adams MD, Cargill M. 2005a. A scan for positivelyselected genes in the genomes of humans and chimpanzees. PLoSBiol 3:e170.
Nielsen R, Williamson S, Kim Y, Hubisz MJ, Clark AG, Busta-mante C. 2005b. Genomic scans for selective sweeps using SNPdata. GenomeRes 15:1566–1575.
Olds LC, Sibley E. 2003. Lactase persistence DNA variantenhances lactase promoter activity in vitro: Functional role asa cis regulatory element. Hum Mol Genet 12:2333–2340.
Poulter M, Hollox E, Harvey CB, Mulcare C, Peuhkuri K,Kajander K, Sarner M, Korpela R, Swallow DM. 2003. Thecausal element for the lactase persistence/non-persistencepolymorphism is located in a 1 Mb region of linkage disequili-brium in Europeans. Ann Hum Genet 67:298–311.
Ptak SE, Przeworski M. 2002. Evidence for population growthin humans is confounded by fine-scale population structure.Trends Genet 18:559–563.
Rana B, Hewett-Emmett D, Jin L, Chang B, Sambuughin N,Lin M, Watkins S, Bamshad M, Jorde L, Ramsay M, JenkinsT, Li W. 1999. High polymorphism at the human melanocortin1 receptor locus. Genetics 151:1547–1557.
Rees JL. 2004. The genetics of sun sensitivity in humans. Am JHum Genet 75:739–751.
Relethford JH. 2000. Human skin color diversity is highest insub-Saharan African populations. Hum Biol 72:773–780.
Relethford JH. 2002. Apportionment of global human genetic di-versity based on craniometrics and skin color. Am J PhysAnthropol 118:393–398.
Robbins LS, Nadeau JH, Johnson KR, Kelly MA, Roselli-RehfussL, Baack E, Mountjoy KG, Cone RD. 1993. Pigmentation pheno-types of variant extension locus alleles result from point muta-tions that alterMSH receptor function. Cell 72:827–834.
128 E.E. HARRIS AND D. MEYER
American Journal of Physical Anthropology—DOI 10.1002/ajpa
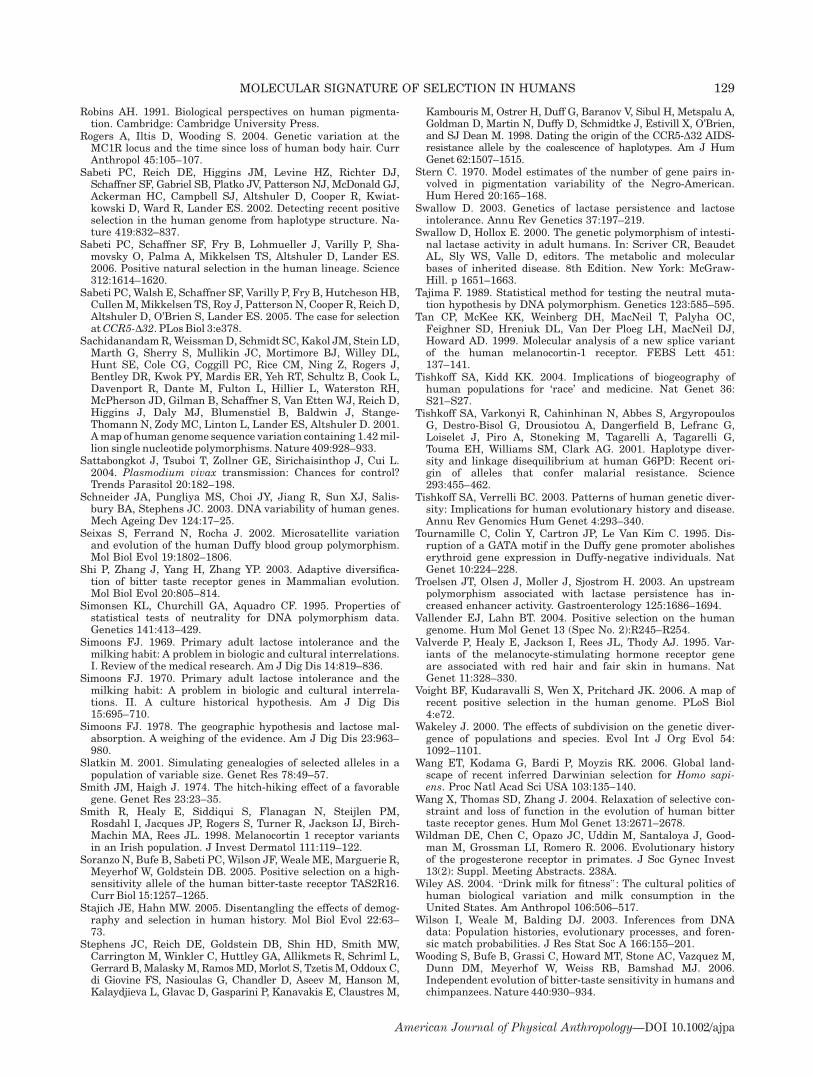
Robins AH. 1991. Biological perspectives on human pigmenta-tion. Cambridge: Cambridge University Press.
Rogers A, Iltis D, Wooding S. 2004. Genetic variation at theMC1R locus and the time since loss of human body hair. CurrAnthropol 45:105–107.
Sabeti PC, Reich DE, Higgins JM, Levine HZ, Richter DJ,Schaffner SF, Gabriel SB, Platko JV, Patterson NJ, McDonald GJ,Ackerman HC, Campbell SJ, Altshuler D, Cooper R, Kwiat-kowski D, Ward R, Lander ES. 2002. Detecting recent positiveselection in the human genome from haplotype structure. Na-ture 419:832–837.
Sabeti PC, Schaffner SF, Fry B, Lohmueller J, Varilly P, Sha-movsky O, Palma A, Mikkelsen TS, Altshuler D, Lander ES.2006. Positive natural selection in the human lineage. Science312:1614–1620.
Sabeti PC,Walsh E, Schaffner SF, Varilly P, Fry B, Hutcheson HB,CullenM,Mikkelsen TS, Roy J, Patterson N, Cooper R, Reich D,Altshuler D, O’Brien S, Lander ES. 2005. The case for selectionatCCR5-D32. PLos Biol 3:e378.
SachidanandamR,WeissmanD, Schmidt SC, Kakol JM, Stein LD,Marth G, Sherry S, Mullikin JC, Mortimore BJ, Willey DL,Hunt SE, Cole CG, Coggill PC, Rice CM, Ning Z, Rogers J,Bentley DR, Kwok PY, Mardis ER, Yeh RT, Schultz B, Cook L,Davenport R, Dante M, Fulton L, Hillier L, Waterston RH,McPherson JD, Gilman B, Schaffner S, Van Etten WJ, Reich D,Higgins J, Daly MJ, Blumenstiel B, Baldwin J, Stange-Thomann N, Zody MC, Linton L, Lander ES, Altshuler D. 2001.Amap of human genome sequence variation containing 1.42mil-lion single nucleotide polymorphisms. Nature 409:928–933.
Sattabongkot J, Tsuboi T, Zollner GE, Sirichaisinthop J, Cui L.2004. Plasmodium vivax transmission: Chances for control?Trends Parasitol 20:182–198.
Schneider JA, Pungliya MS, Choi JY, Jiang R, Sun XJ, Salis-bury BA, Stephens JC. 2003. DNA variability of human genes.Mech Ageing Dev 124:17–25.
Seixas S, Ferrand N, Rocha J. 2002. Microsatellite variationand evolution of the human Duffy blood group polymorphism.Mol Biol Evol 19:1802–1806.
Shi P, Zhang J, Yang H, Zhang YP. 2003. Adaptive diversifica-tion of bitter taste receptor genes in Mammalian evolution.Mol Biol Evol 20:805–814.
Simonsen KL, Churchill GA, Aquadro CF. 1995. Properties ofstatistical tests of neutrality for DNA polymorphism data.Genetics 141:413–429.
Simoons FJ. 1969. Primary adult lactose intolerance and themilking habit: A problem in biologic and cultural interrelations.I. Review of the medical research. Am J Dig Dis 14:819–836.
Simoons FJ. 1970. Primary adult lactose intolerance and themilking habit: A problem in biologic and cultural interrela-tions. II. A culture historical hypothesis. Am J Dig Dis15:695–710.
Simoons FJ. 1978. The geographic hypothesis and lactose mal-absorption. A weighing of the evidence. Am J Dig Dis 23:963–980.
Slatkin M. 2001. Simulating genealogies of selected alleles in apopulation of variable size. Genet Res 78:49–57.
Smith JM, Haigh J. 1974. The hitch-hiking effect of a favorablegene. Genet Res 23:23–35.
Smith R, Healy E, Siddiqui S, Flanagan N, Steijlen PM,Rosdahl I, Jacques JP, Rogers S, Turner R, Jackson IJ, Birch-Machin MA, Rees JL. 1998. Melanocortin 1 receptor variantsin an Irish population. J Invest Dermatol 111:119–122.
Soranzo N, Bufe B, Sabeti PC, Wilson JF, Weale ME, Marguerie R,Meyerhof W, Goldstein DB. 2005. Positive selection on a high-sensitivity allele of the human bitter-taste receptor TAS2R16.Curr Biol 15:1257–1265.
Stajich JE, Hahn MW. 2005. Disentangling the effects of demog-raphy and selection in human history. Mol Biol Evol 22:63–73.
Stephens JC, Reich DE, Goldstein DB, Shin HD, Smith MW,Carrington M, Winkler C, Huttley GA, Allikmets R, Schriml L,Gerrard B,MalaskyM, RamosMD,Morlot S, TzetisM, Oddoux C,di Giovine FS, Nasioulas G, Chandler D, Aseev M, Hanson M,Kalaydjieva L, Glavac D, Gasparini P, Kanavakis E, Claustres M,
Kambouris M, Ostrer H, Duff G, Baranov V, Sibul H, Metspalu A,Goldman D, Martin N, Duffy D, Schmidtke J, Estivill X, O’Brien,and SJ Dean M. 1998. Dating the origin of the CCR5-D32 AIDS-resistance allele by the coalescence of haplotypes. Am J HumGenet 62:1507–1515.
Stern C. 1970. Model estimates of the number of gene pairs in-volved in pigmentation variability of the Negro-American.Hum Hered 20:165–168.
Swallow D. 2003. Genetics of lactase persistence and lactoseintolerance. Annu Rev Genetics 37:197–219.
Swallow D, Hollox E. 2000. The genetic polymorphism of intesti-nal lactase activity in adult humans. In: Scriver CR, BeaudetAL, Sly WS, Valle D, editors. The metabolic and molecularbases of inherited disease. 8th Edition. New York: McGraw-Hill. p 1651–1663.
Tajima F. 1989. Statistical method for testing the neutral muta-tion hypothesis by DNA polymorphism. Genetics 123:585–595.
Tan CP, McKee KK, Weinberg DH, MacNeil T, Palyha OC,Feighner SD, Hreniuk DL, Van Der Ploeg LH, MacNeil DJ,Howard AD. 1999. Molecular analysis of a new splice variantof the human melanocortin-1 receptor. FEBS Lett 451:137–141.
Tishkoff SA, Kidd KK. 2004. Implications of biogeography ofhuman populations for ‘race’ and medicine. Nat Genet 36:S21–S27.
Tishkoff SA, Varkonyi R, Cahinhinan N, Abbes S, ArgyropoulosG, Destro-Bisol G, Drousiotou A, Dangerfield B, Lefranc G,Loiselet J, Piro A, Stoneking M, Tagarelli A, Tagarelli G,Touma EH, Williams SM, Clark AG. 2001. Haplotype diver-sity and linkage disequilibrium at human G6PD: Recent ori-gin of alleles that confer malarial resistance. Science293:455–462.
Tishkoff SA, Verrelli BC. 2003. Patterns of human genetic diver-sity: Implications for human evolutionary history and disease.Annu Rev Genomics Hum Genet 4:293–340.
Tournamille C, Colin Y, Cartron JP, Le Van Kim C. 1995. Dis-ruption of a GATA motif in the Duffy gene promoter abolisheserythroid gene expression in Duffy-negative individuals. NatGenet 10:224–228.
Troelsen JT, Olsen J, Moller J, Sjostrom H. 2003. An upstreampolymorphism associated with lactase persistence has in-creased enhancer activity. Gastroenterology 125:1686–1694.
Vallender EJ, Lahn BT. 2004. Positive selection on the humangenome. Hum Mol Genet 13 (Spec No. 2):R245–R254.
Valverde P, Healy E, Jackson I, Rees JL, Thody AJ. 1995. Var-iants of the melanocyte-stimulating hormone receptor geneare associated with red hair and fair skin in humans. NatGenet 11:328–330.
Voight BF, Kudaravalli S, Wen X, Pritchard JK. 2006. A map ofrecent positive selection in the human genome. PLoS Biol4:e72.
Wakeley J. 2000. The effects of subdivision on the genetic diver-gence of populations and species. Evol Int J Org Evol 54:1092–1101.
Wang ET, Kodama G, Bardi P, Moyzis RK. 2006. Global land-scape of recent inferred Darwinian selection for Homo sapi-ens. Proc Natl Acad Sci USA 103:135–140.
Wang X, Thomas SD, Zhang J. 2004. Relaxation of selective con-straint and loss of function in the evolution of human bittertaste receptor genes. Hum Mol Genet 13:2671–2678.
Wildman DE, Chen C, Opazo JC, Uddin M, Santaloya J, Good-man M, Grossman LI, Romero R. 2006. Evolutionary historyof the progesterone receptor in primates. J Soc Gynec Invest13(2): Suppl. Meeting Abstracts. 238A.
Wiley AS. 2004. \Drink milk for fitness": The cultural politics ofhuman biological variation and milk consumption in theUnited States. Am Anthropol 106:506–517.
Wilson I, Weale M, Balding DJ. 2003. Inferences from DNAdata: Population histories, evolutionary processes, and foren-sic match probabilities. J Res Stat Soc A 166:155–201.
Wooding S, Bufe B, Grassi C, Howard MT, Stone AC, Vazquez M,Dunn DM, Meyerhof W, Weiss RB, Bamshad MJ. 2006.Independent evolution of bitter-taste sensitivity in humans andchimpanzees. Nature 440:930–934.
129MOLECULAR SIGNATURE OF SELECTION IN HUMANS
American Journal of Physical Anthropology—DOI 10.1002/ajpa
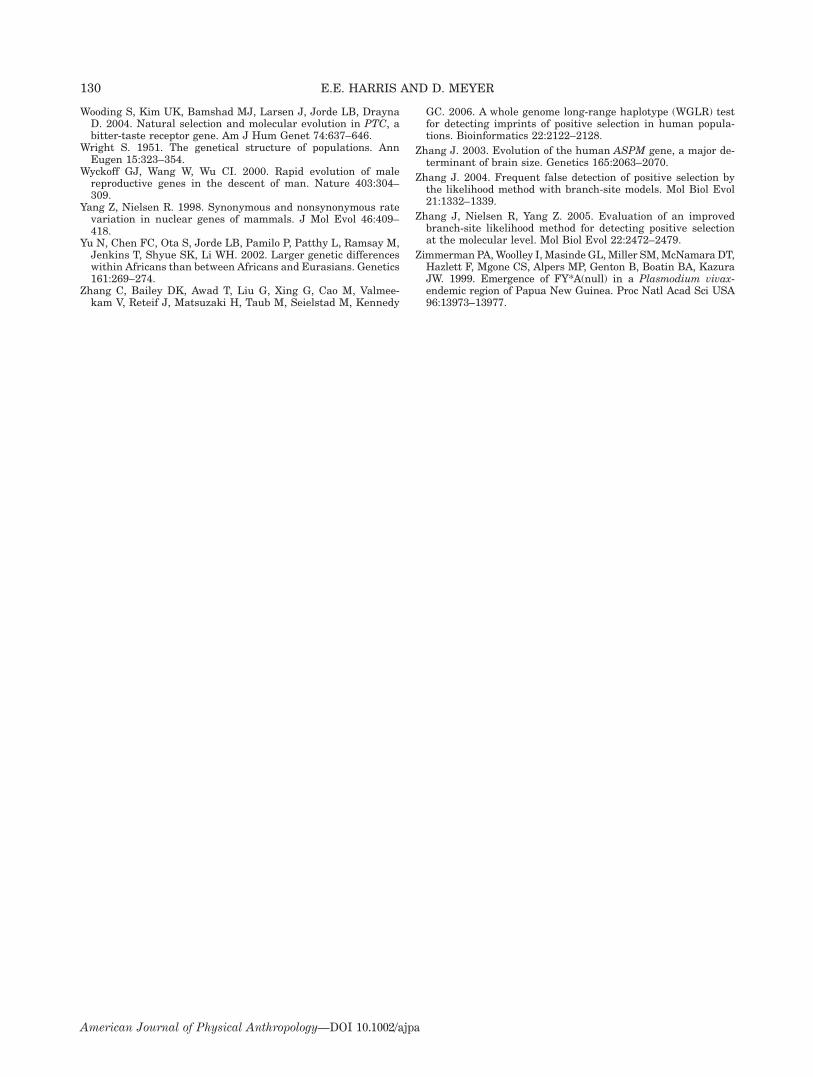
Wooding S, Kim UK, Bamshad MJ, Larsen J, Jorde LB, DraynaD. 2004. Natural selection and molecular evolution in PTC, abitter-taste receptor gene. Am J Hum Genet 74:637–646.
Wright S. 1951. The genetical structure of populations. AnnEugen 15:323–354.
Wyckoff GJ, Wang W, Wu CI. 2000. Rapid evolution of malereproductive genes in the descent of man. Nature 403:304–309.
Yang Z, Nielsen R. 1998. Synonymous and nonsynonymous ratevariation in nuclear genes of mammals. J Mol Evol 46:409–418.
Yu N, Chen FC, Ota S, Jorde LB, Pamilo P, Patthy L, Ramsay M,Jenkins T, Shyue SK, Li WH. 2002. Larger genetic differenceswithin Africans than between Africans and Eurasians. Genetics161:269–274.
Zhang C, Bailey DK, Awad T, Liu G, Xing G, Cao M, Valmee-kam V, Reteif J, Matsuzaki H, Taub M, Seielstad M, Kennedy
GC. 2006. A whole genome long-range haplotype (WGLR) testfor detecting imprints of positive selection in human popula-tions. Bioinformatics 22:2122–2128.
Zhang J. 2003. Evolution of the human ASPM gene, a major de-terminant of brain size. Genetics 165:2063–2070.
Zhang J. 2004. Frequent false detection of positive selection bythe likelihood method with branch-site models. Mol Biol Evol21:1332–1339.
Zhang J, Nielsen R, Yang Z. 2005. Evaluation of an improvedbranch-site likelihood method for detecting positive selectionat the molecular level. Mol Biol Evol 22:2472–2479.
ZimmermanPA,Woolley I,MasindeGL,Miller SM,McNamara DT,Hazlett F, Mgone CS, Alpers MP, Genton B, Boatin BA, KazuraJW. 1999. Emergence of FY*A(null) in a Plasmodium vivax-endemic region of Papua New Guinea. Proc Natl Acad Sci USA96:13973–13977.
130 E.E. HARRIS AND D. MEYER
American Journal of Physical Anthropology—DOI 10.1002/ajpa