Embed Size (px)
Citation preview
Swedish University of Agricultural Sciences Faculty of Veterinary Medicine and Animal Science
The Molecular Background of Equine Sarcoids Katarina Hörnaeus Examensarbete / Swedish University of Agricultural Sciences Department of Animal Breeding and Genetics
399
Uppsala 2013
Master Thesis, 30 hp
Biotechnology Programme

Swedish University of Agricultural Sciences Faculty of Veterinary Medicine and Animal Science Department of Animal Breeding and Genetics
The Molecular Background of Equine Sarcoids BPV- och MHC-typning för genetisk predisposition av sarcoider hos häst Katarina Hörnaeus
Supervisors: Sofia Mikko, SLU, Department of Animal Breeding and Genetics Tomas Bergström, SLU, Department of Animal Breeding and Genetics
Examiner: Stefan Marklund, SLU, Department of Clinical Sciences Credits: 30 hp Course title: Degree project in Biology Course code: EX0578 Programme: Biotechnology Programme Level: Advanced, A2E Place of publication: Uppsala Year of publication: 2013 Name of series: Examensarbete / Swedish University of Agricultural Sciences,
Department of Animal Breeding and Genetics, 399 On-line publicering: http://epsilon.slu.se Key words: Equine sarcoids, Major histocompatibility complex (MHC), genetic background,
Bovine papillomavirus (BPV), microsatellites

Abstract Equine sarcoids (ES) are the most common skin tumors in equids all over the world. No universal treatment is yet available and the aetiology of the disease is not yet fully understood. Though, it is believed to be a multifactorial disease in which both genetic and infectious factors have been implicated. Association between ES and certain serotypes in the Major Histocompatibility Complex (MHC) region has previously been demonstrated and DNA from Bovine Papillomavirus (BPV) type 1 and 2 in and around equine sarcoid tumours has also been detected. The aim of this study is to further characterize the molecular genetic background of the susceptibility of ES with the main focus on the MHC-region. The high resolution and accuracy of microsatellite analyses may complement earlier serological studies. A total number of 78 horses were included in the study. 26 of these were classified as ES-affected by histological analysis. 32 of the horses were Swedish Warmbloods and 16 of these were ES-affected. 12 microsatellites in the MHC-region, including all three classes of MHC, as well as two microsatellites on chromosome 23 were tested for differences in heterozygosity and allele frequencies, occurrence of haplotypes as well as length of consecutive homozygous regions between cases and controls. The majority of the markers with significant results are located in MHC class II. Significant results were also observed for one marker located on chromosome 23. Longer consecutive regions of homozygous markers were observed in cases than in controls indicating a disadvantageous effect. The genetic profiles of horses affected with Equine Sarcoids are different from that of non-affected horses. In addition, the results implicate breed differences in the genotypes of the horses included in the study. Interestingly, this study also indicates protective effects of certain alleles and haplotyps towards the development of ES. Key words: Equine sarcoids, genetic background, Major Histocompatibility Complex (MHC), Bovine papillomavirus, microsatellites

2
3
Table of contents Introduction ............................................................................................................................................. 5
Equine Sarcoids ................................................................................................................................... 6 Aetiology ............................................................................................................................................. 7 Genetic background ............................................................................................................................. 7 Bovine Papillomavirus (BPV) ............................................................................................................. 7 BPV and Equine Sarcoids ................................................................................................................... 8 Treatment ............................................................................................................................................ 8 Major Histocompatibility Complex (MHC) ...................................................................................... 10 Microsatellites ................................................................................................................................... 11
Materials and Methods .......................................................................................................................... 12 Population and samples description .................................................................................................. 12 DNA isolation.................................................................................................................................... 12 Microsatellite analysis ....................................................................................................................... 12 PCR-amplification ............................................................................................................................. 13 Statistical analyses ............................................................................................................................. 14
Results ................................................................................................................................................... 15 Hardy Weinberg Equilibrium ............................................................................................................ 15 Fisher Exact ....................................................................................................................................... 15 Heterozygosity................................................................................................................................... 16 Allele frequencies .............................................................................................................................. 18 Homozygosity of significant differences in allele frequency between cases and controls ................ 19 Homozygous stretches ....................................................................................................................... 19 Haplotypes ......................................................................................................................................... 20
All horses included ........................................................................................................................ 20 Swedish Warmbloods .................................................................................................................... 21
Discussion ............................................................................................................................................. 22 Conclusions and future perspectives ................................................................................................. 26
References ............................................................................................................................................. 28 Appendix I ............................................................................................................................................. 32

4
5
Introduction Equine sarcoids (ES) are the most common skin tumours in equids all over the world. They are benign and non-metastatic tumours that may exist on any part of the body. Several forms of sarcoids have been recognized. The physical appearance and number of tumours can differ considerably between horses. Also, several types of tumours may exist in the same individual. Even though ES are not lethal they may considerably affect the use, welfare and value of the horse. The aetiology of ES is not yet entirely understood. Though, it is believed to be a multifactorial disease where both genetic and infectious factors have been implicated. Earlier serological studies have shown an association between ES and certain serotypes in the Major Histocompatibility Complex (MHC) region. The MHC encodes components involved in the immune system and is in the horse called equine leukocyte antigens (ELA). Several studies have also detected DNA from Bovine Papillomavirus (BPV) type 1 and 2 in and around equine sarcoid tumours. The virus has furthermore been demonstrated to be able to transform equine fibroblasts. It is thus proposed that BPV is the infectious agent involved in triggering of ES and that the genetic background of an individual may influence the risk for the development of ES. This study aims to further characterize the molecular genetic background of the susceptibility of ES with the main focus on the MHC-region. The high resolution and accuracy of microsatellite analyses may complement earlier serological studies. Treatment of ES is still a challenge and increased knowledge about potential genetic factors involved could therefore benefit both the development of new treatments strategies and potential selective breeding programmes.
6
Equine Sarcoids Equine ES (ES) are the most common skin tumours in equids. The condition has been recorded for several thousand of years but was not pathologically described until 1936 by Jackson (Marais et al 2007, Bogaert et al 2008a, Foy et al 2002). Presence of ES has been observed all over the world and can develop in all equid species at any age. Although they most commonly affect horses younger than six years of age (Foy et al 2002). Moreover, they seem to be independent of breed, sex and coat colour (Bogaert et al 2008a, Broström 1988).
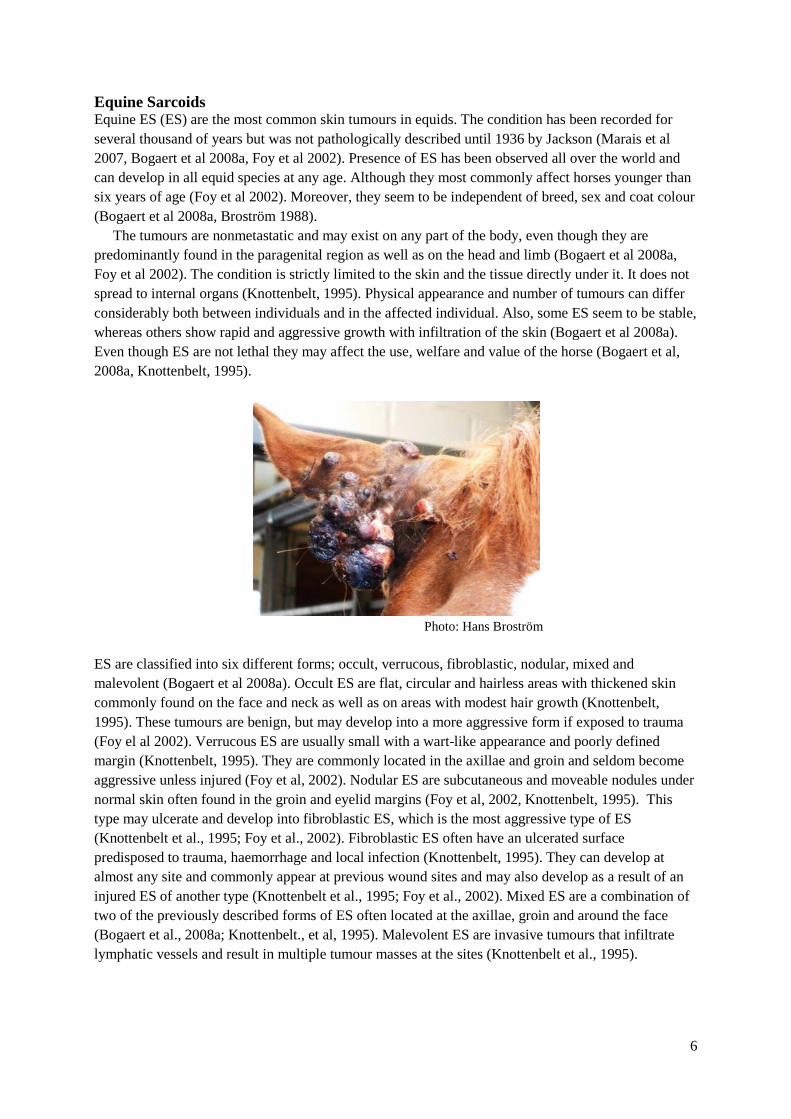
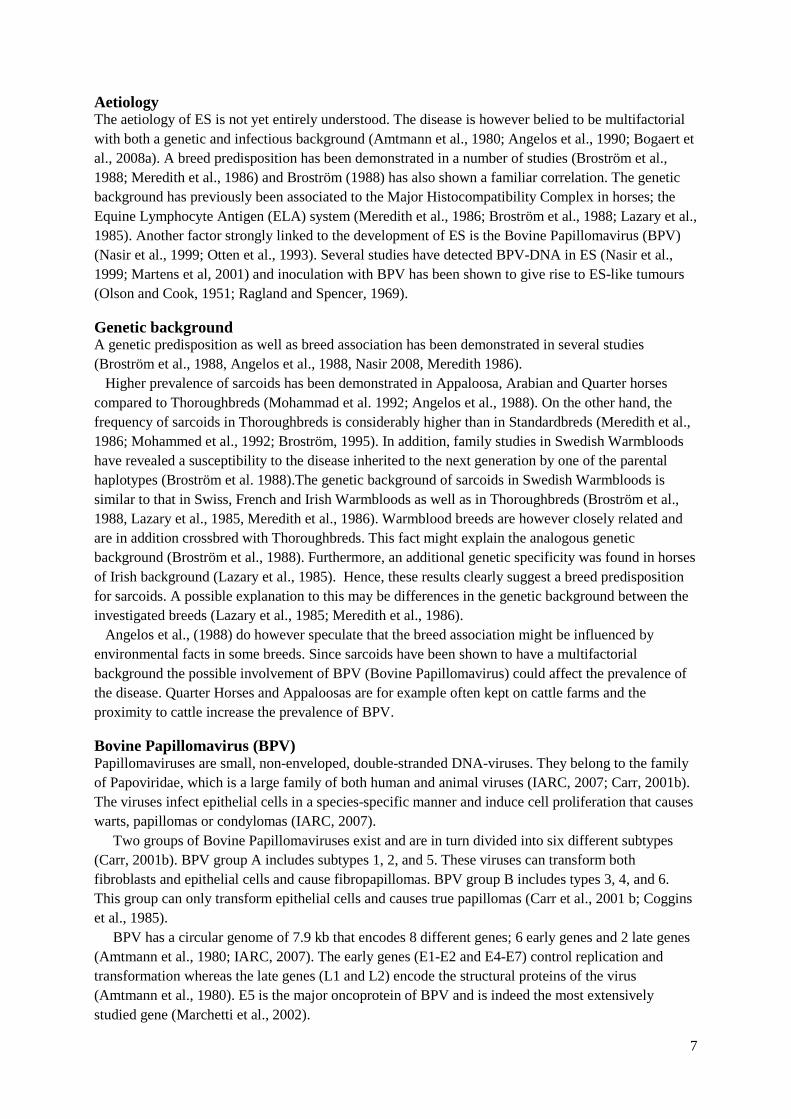
The tumours are nonmetastatic and may exist on any part of the body, even though they are predominantly found in the paragenital region as well as on the head and limb (Bogaert et al 2008a, Foy et al 2002). The condition is strictly limited to the skin and the tissue directly under it. It does not spread to internal organs (Knottenbelt, 1995). Physical appearance and number of tumours can differ considerably both between individuals and in the affected individual. Also, some ES seem to be stable, whereas others show rapid and aggressive growth with infiltration of the skin (Bogaert et al 2008a). Even though ES are not lethal they may affect the use, welfare and value of the horse (Bogaert et al, 2008a, Knottenbelt, 1995).
Photo: Hans Broström
ES are classified into six different forms; occult, verrucous, fibroblastic, nodular, mixed and malevolent (Bogaert et al 2008a). Occult ES are flat, circular and hairless areas with thickened skin commonly found on the face and neck as well as on areas with modest hair growth (Knottenbelt, 1995). These tumours are benign, but may develop into a more aggressive form if exposed to trauma (Foy el al 2002). Verrucous ES are usually small with a wart-like appearance and poorly defined margin (Knottenbelt, 1995). They are commonly located in the axillae and groin and seldom become aggressive unless injured (Foy et al, 2002). Nodular ES are subcutaneous and moveable nodules under normal skin often found in the groin and eyelid margins (Foy et al, 2002, Knottenbelt, 1995). This type may ulcerate and develop into fibroblastic ES, which is the most aggressive type of ES (Knottenbelt et al., 1995; Foy et al., 2002). Fibroblastic ES often have an ulcerated surface predisposed to trauma, haemorrhage and local infection (Knottenbelt, 1995). They can develop at almost any site and commonly appear at previous wound sites and may also develop as a result of an injured ES of another type (Knottenbelt et al., 1995; Foy et al., 2002). Mixed ES are a combination of two of the previously described forms of ES often located at the axillae, groin and around the face (Bogaert et al., 2008a; Knottenbelt., et al, 1995). Malevolent ES are invasive tumours that infiltrate lymphatic vessels and result in multiple tumour masses at the sites (Knottenbelt et al., 1995).
7
Aetiology The aetiology of ES is not yet entirely understood. The disease is however belied to be multifactorial with both a genetic and infectious background (Amtmann et al., 1980; Angelos et al., 1990; Bogaert et al., 2008a). A breed predisposition has been demonstrated in a number of studies (Broström et al., 1988; Meredith et al., 1986) and Broström (1988) has also shown a familiar correlation. The genetic background has previously been associated to the Major Histocompatibility Complex in horses; the Equine Lymphocyte Antigen (ELA) system (Meredith et al., 1986; Broström et al., 1988; Lazary et al., 1985). Another factor strongly linked to the development of ES is the Bovine Papillomavirus (BPV) (Nasir et al., 1999; Otten et al., 1993). Several studies have detected BPV-DNA in ES (Nasir et al., 1999; Martens et al, 2001) and inoculation with BPV has been shown to give rise to ES-like tumours (Olson and Cook, 1951; Ragland and Spencer, 1969).
Genetic background A genetic predisposition as well as breed association has been demonstrated in several studies (Broström et al., 1988, Angelos et al., 1988, Nasir 2008, Meredith 1986). Higher prevalence of sarcoids has been demonstrated in Appaloosa, Arabian and Quarter horses compared to Thoroughbreds (Mohammad et al. 1992; Angelos et al., 1988). On the other hand, the frequency of sarcoids in Thoroughbreds is considerably higher than in Standardbreds (Meredith et al., 1986; Mohammed et al., 1992; Broström, 1995). In addition, family studies in Swedish Warmbloods have revealed a susceptibility to the disease inherited to the next generation by one of the parental haplotypes (Broström et al. 1988).The genetic background of sarcoids in Swedish Warmbloods is similar to that in Swiss, French and Irish Warmbloods as well as in Thoroughbreds (Broström et al., 1988, Lazary et al., 1985, Meredith et al., 1986). Warmblood breeds are however closely related and are in addition crossbred with Thoroughbreds. This fact might explain the analogous genetic background (Broström et al., 1988). Furthermore, an additional genetic specificity was found in horses of Irish background (Lazary et al., 1985). Hence, these results clearly suggest a breed predisposition for sarcoids. A possible explanation to this may be differences in the genetic background between the investigated breeds (Lazary et al., 1985; Meredith et al., 1986). Angelos et al., (1988) do however speculate that the breed association might be influenced by environmental facts in some breeds. Since sarcoids have been shown to have a multifactorial background the possible involvement of BPV (Bovine Papillomavirus) could affect the prevalence of the disease. Quarter Horses and Appaloosas are for example often kept on cattle farms and the proximity to cattle increase the prevalence of BPV.
Bovine Papillomavirus (BPV) Papillomaviruses are small, non-enveloped, double-stranded DNA-viruses. They belong to the family of Papoviridae, which is a large family of both human and animal viruses (IARC, 2007; Carr, 2001b). The viruses infect epithelial cells in a species-specific manner and induce cell proliferation that causes warts, papillomas or condylomas (IARC, 2007).
Two groups of Bovine Papillomaviruses exist and are in turn divided into six different subtypes (Carr, 2001b). BPV group A includes subtypes 1, 2, and 5. These viruses can transform both fibroblasts and epithelial cells and cause fibropapillomas. BPV group B includes types 3, 4, and 6. This group can only transform epithelial cells and causes true papillomas (Carr et al., 2001 b; Coggins et al., 1985).
BPV has a circular genome of 7.9 kb that encodes 8 different genes; 6 early genes and 2 late genes (Amtmann et al., 1980; IARC, 2007). The early genes (E1-E2 and E4-E7) control replication and transformation whereas the late genes (L1 and L2) encode the structural proteins of the virus (Amtmann et al., 1980). E5 is the major oncoprotein of BPV and is indeed the most extensively studied gene (Marchetti et al., 2002).
8
Commencement of the viral life cycle is believed to be initiated by infection of the basal epithelial cells, most probably at sites of injury (IARC, 2007). The replication of the viral DNA occurs in cells of the spinous and granular layers and is strictly linked to the differentiation status of the infected cell (Amtmann et al., 1980; Campo, 1997a).
BPV and Equine Sarcoids The involvement of BPV in ES is contradictory. It is however commonly accepted that a viral component is in some way involved in the development of the tumours. A number of studies have demonstrated presence of BPV DNA in several types of ES, including fibroblastic, nodular, occult and verrucous (Bogaert et al., 2007, Carr et al., 2001a; Martens et al. 2001a; Amtmann et al., 1980; Angelos et al., 1991; Hartl et al., 2011). The presence of BPV DNA has been evaluated in several countries with a high level of incidence as result. Angelos et al. (1991) found viral DNA in 95% of samples from New York and in 85% of samples from Switzerland. 100% detection has been demonstrated in Switzerland, where both BPV 1 and BPV 2 were detected. One of the examined horses had two ES of which one contained DNA from BPV 1 and the other from BPV 2. In addition, the BPV 1 DNA from the equine ES showed similar restriction pattern as cattle kept in the area (Otten et al., 1993). Both types of BPV have also been demonstrated in Belgian horses (Martens et al., 2001a) as well as American horses (Carr et al., 2001a). Several studies have demonstrated expression of several viral oncogenes (E2, E5, E6, E7, L1 and L2) in equine ES, which thereby indicate involvement of BPV in the development of ES (Nasir and Reid, 1999; Carr et al., 2001a; Haralambus et al., 2010).
Though, up to date no vegetative virus has been discovered in ES and no horse with naturally occurring sarcoids has yet developed detectable antibodies directed against BPV in the blood (Knottenbelt 2003). However, experimental inoculation with the virus has been shown to produce lesions with similar characteristics to naturally developed ES (Carr et al., 2001b; Knottenbelt, 1995). These lesions do, in contrast to ES, heal spontaneously. Also, these horses do contrary to naturally affected horses produce detectable antibodies against the virus (Knottenbelt, 1995; Broström 1995).
Treatment There are a large number of different therapeutic methods for the treatment of ES available world-wide. Not one method is universally effective and the results vary due to features such as the size and type of ES (Knottenbelt et al., 1995).
One of the oldest and most widely used treatment of equine ES is topical application of cytotoxic chemicals, e.g. copper sulphate, nitric acid and silver nitrate (Knottenbelt, 1995; Stewart et al., 2006). The chemical drugs are applied directly onto the ES and generates specific necrosis by inhibition of nucleic acid synthesis and thereby elimination of the ES tissue (Knottenbelt et al., 1995; Stewart et al., 2006). This method is however not applicable on all parts of the horse, for example eyelids and lips (Knottenbelt et al., 1995; Stewart et al., 2006; Carstanjen et al., 1997).
An attractive treatment option is the use of immune-mediated therapy. Autogenous vaccines have not shown any promising results, but the use of immunomodulators has in many cases shown a satisfactory effect (Klein et al., 1986; Mattil-Fritzl et al., 2008; Klein et al., 1990). One of the most studied immunomodulators is Bacillus Calmette-Gu6rin (BCG). The agent is injected into the tumour and believed to stimulate a natural immune response against tumours (Klein et al., 1986). Another immune-mediated therapy is the use of virus-like particles with the intention to function as a potential antigen towards the BPV protein E7 (Mattil-Fritz et al., 2008).
There are in addition a number of topical treatments with immune modulation effects available on the market. Aldara TM, containing the active substance imiquimod, has shown promising results (Bogaert et al., 2008b; IARC, 2007.). Imiquimod is a Toll-like 7 agonist believed to bind to membrane receptors on immune cells (Petterson et al., FASS.se, 2010a) and thereby activate production of
9
mRNA encoding cytokines, including interferon-α, at the treatment site (Pettersson et al., Topical tr.). Successful results have besides in horses also been demonstrated in both humans and other animals (FASS.se, 2010; Bogaert et al, 2008b). Another antiviral topical treatment is Asiclovir cream, originally designed to inhibit human herpesvirus replication (Stadler et al., 2011; FASS.se, 2012). Asiclovir is an acyclic nucleoside that becomes activated inside the infected cell when phosphorylated by a virus specific tymidinkinase (Stadler et al., 2011; FASS.se, 2012.). Further phosphorylation is thereafter induced and Asiclovir is transformed into Asiclovir-3-phosphate, which competes as a substrate for viral DNA-polymerase. This results in inhibition of viral replication (FASS.se, 2012). An additional topical regimen is the herbal cream XXterraTM ( Vetline, USA, N-vet, Sweden). XXterraTM (Pettersson et al.) consists of zinc-chloride solution and extracts from the plant bloodroot, which contains alkaloids such as sanguinarine, chelarathrine and protopine (Pettersson et al., Topical tr.). The zinc chloride provokes inflammation of the ES surface and the bloodroot alkaloids are thereafter proposed to modify ES cells to become antigenic. This process stimulates the host's immune system and results in an immune rejection of the tumor (Pettersson et al.).
The efficiency of these immune modulating agents are, in concordance to other methods, depending on the type of ES and relies upon the volume of the injected volume of antigens as well as an effective immune capacity of the host (Knottenbelt and Kelly, 2000).
Available on the market is also Iscador® P, composed of Mistletoe extracts (Viscum album austriacus), which for a long time has been used for treatment of human skin tumours (Diss- Clottu; Christen-Clottu et al., 2010). The main components in Iscador ®P, lectins and viscotoxins (Christen-Clottu et al., 2010), have shown both cytotoxic and growth-inhibiting effects on a number of human tumor cell lines in vitro as well as in mouse models (Christen-Clottu et al., 2010). Mistletoe extract has also been shown to have immuno modulation effects, inhibit angiogenesis, and have antimutagenic effects as well as DNA stabilizing properties (Christen-Clottu et al., 2010). VAE is administered subcutaneously and therefore has a systemic effect. One disadvantage of the method is the slow response towards treatment. However, complete or partial regression has been demonstrated to be sustainable over a long time (Christen-Clottu et al., 2010).
Surgical excision has been used for several years with varying results. The method has a rather high tendency for regrowth of large tumours with less defined margins. The recurring tumours may develop into a more aggressive form and the method is not applicable on all parts of the horse due to cosmetic reasons (Carstanjen et al., 1997). Surgical removing of nodular ES has however shown satisfactory results (Knottenbelt, 2003). Surgery with CO2 laser is a precise method and the wound healing is generally without complications, but there is a risk of leukotrichia and/or cutaneous scar tissue after treatment (Carstanjen et al., 1997).Cryosurgery, repeated freezing and thawing of ES, has also been demonstrated as a possible option for treatment (Klein et al., 1986). This method has been evaluated as treatment option for skin tumours in dogs and cats with good results. Particularly for dogs and cats with skin and subcutaneous tumors that are difficult to treat by other methods because of size, nature, and location of the lesions (Fernandez de Quieros, 2008).
Implantation of iridium-192 directly in the tumour has also been reported to give a high level of tumour regression for both periocular and non-ocular ES (Cook et al., 2006; IARC, 2007). The method is however strongly recommended for non-ocular ES (Cook et al., 2006; IARC, 2007). Compared to other treatment options this method has shown minimal damage of surrounding tissues as well as low rates of complications (Cook et al., 2006; IARC, 2007). The limiting factor is that each radiation source only can treat a restricted volume of tumours (IARC, 2007).
In 2011 Tamzali et al., demonstrated a safe and effective treatment of ES by the use of electrochemotherapy. All types of ES at all anatomic locations can be treated with low cosmetic damages (Tamzali et al., 2011). This treatment option does however require repeated treatments and therefore also repetitive anaesthesia (Tamzali et al., 2011).
10
In conclusion, the treatment of ES is still a challenge. A precise diagnosis of the type of ES and a correct choice of treatment method does however make it possible to achieve 100% recovery (Knottenbelt, 2003).
Major Histocompatibility Complex (MHC) The immune system functions as protection of the body against foreign invaders such as bacteria and viruses capable of causing infections (NIAID, 2011a). In order to eliminate the invaders the immune system uses several different pathways (Dzik, 2010; NIAID, 2011b). Two central functions in the response to the invasion are detection of the invader by sensors and eliciting response effectors to attack it (Bowers, 2006; Dzik, 2010). The sensors of the adaptive immune system, receptors on T-cells and antibodies, are able to recognize a vast number of molecular structures. T-cells are active intracellularly where they induce apoptosis of infected cells. Antibodies comprise the primary defense against extracellular invaders. They operate by binding to the foreign substances and thereby block the ability of the invader to associate with their targets (Bowers, 2006; Dzik, 2010). A key component for this system to function is the Major Histocompatibility Complex (MHC) (Choi et al., 2011; Meyer et al., 2001). MHC molecules present peptides, mainly antigens, to the T-cell receptors, which is a crucial step for the initiation of an immune response (Dzik, 2010; Choi et al., 2011; Meyer et. al 2001). The effect of the T-cell signaling is regulated by the affinity and duration of the binding of the T-cell receptors with MHC-peptide complexes (Jiang et al., 2004). There are three classes of MHC: class I, II and III (Bogaert et. al, 2008a). The pathways involved in antigen presentation differ between the classes (Lewis et al., 2010). Class I is primarily associated with intracellular pathogens (Lewis et al., 2010). The genes in the region code for glycoproteins involved in recognition and destruction of infected cells (Bogaert et. al, 2008a). Genes in MHC class II is mainly associated with extracellular pathogens (Bogaert et al., 2008a; Dzik., 2010). Class II encoded proteins are conveyed on the surface of cells presenting antigens to T-cells (Bogaert et. al, 2008a; Darrilyn et al, 1997). Class III includes genes involved in the complement immune system as well as in inflammatory processes (Bogaert et. al, 2008a; Xie et al., 2003). This region is localized between MHC classes I and II and is the most gene dense region in humans. About half of the genes in the region are still not characterized (Xie et al., 2003). The equine MHC has a similar structure to that of humans and other mammalian species (Darrilyn et al., 1997). MHC in horse is called the equine leukocyte antigen (ELA) system and has been localized to equine chromosome 20. The genes in the equine MHC are called ELA (equine leukocyte antigens) (Bogaert et. al, 2008a; Ansari et al., 1988). The ELA system has, in concordance to other mammals, maintained a high level of conservation of nucleotide sequences (Ansari et al., 1988). MHC is one of the most polymorphic and gene dense region regions in the genome of vertebrates (Gaudieri et. al, 2000; Vandiedonck and Knight, 2009). The majority of MHC-loci hold a vast number of alleles. Large differences in the number alleles have been demonstrated between human populations as well as between two populations of Przewalski’s horses (Hedrick et al, 1999; Meyer et. al, 2001). Alleles in the MHC-region are generally older than alleles from genes with neutral evolution (Meyer et al., 2001). The genes in the MHC region are proposed to be under natural selection where increased variation is favorable. The polymorphic regions in MHC are localized to the regions involved in presentation of peptides (Meyer et. al, 2001).It is hypothesized that individuals with a high level of heterozygosity in the MHC-region have ability to deal with a larger number of pathogen peptides than homozygous individuals. The relative fitness is therefore likely to be higher among heterozygous individuals, which results in accumulation and persistence of different alleles in MHC (Lewis et al., 2010). Resistance or susceptibility of both non-viral and viral infections has previously been associated to alleles in the MHC-region. This has been demonstrated in several human populations and recently also in equine populations (Meyer et. al 2001; Andersson et. al, 2012). Andersson et. al
11
(2012) have indeed showed that individuals homozygous in MHC class II influenced susceptibility to delveopment of Insect Bite Hypersensibility in Icelandic Horses and Exmoor Ponies. Large differences in the number alleles have been demonstrated between human populations as well as between two populations of Przewalski’s horses (Hedrick et al, 1999; Meyer et. al, 2001). In addition, association of ES has previously been associated to equine chromosome 23 (Jandova et al., 2012. Chromosome 23 encodes genes involved in immunity towards tumors and viruses (Himmler et al., 1986; Jandova et. al, 2012). The associated genes do for example include interferons, programmed death ligands and janus kinases (Jandova et. al, 2012). Associated candidate regions for Insect Bite Hypersensibility in Icelandic horses and Shetland Ponies have also been localized to chromosome 23 (Schurink et. al, 2012).
Microsatellites Microsatellites are short tandem repeats of DNA sequence. The repeats are comprised of motives of one to six base-pairs and commonly have a length of 20 to 100 base pairs in total (Armour et. al., 1999). The number of repeats of the sequences can differ among individuals (Sclötterer 2000). Over one million microsatellite loci are present in the human genome (Ellegren, 2004). The microsatellites are most commonly found in non-coding regions of the DNA, either in the introns or intergenic sequences (Metzgar et al., 2000; Zane et al, 2002). This type of microsatellites is commonly used as genetic markers as they are highly polymorphic and scattered uniformly throughout the genome (Hancock, 1999; Naido and Chetty, 1998). Non-coding regions have a mutation rate which is considerably higher than in coding regions and that increases with increasing length of the microsatellite region (Lai and Sun, 2003; Zane et al., 2002). Mutant alleles differ from the original parent allele with one single repeat (Naido and Chetty, 1989). The mutations are predominantly caused by a mechanism called ‘DNA replication slippage’ (Eisen, 1999; Schlötterer, 2000). This mechanism generates an increase or decrease in number of repeats due to a mismatch in the alignment of the template and replicated strand (Eisen, 1999). Mutations in microsatellite regions have been implicated in susceptibility and protection against a number of disease states (Andersson et al., 2012; Naido and Chetty, 1989). The ELA region has previously been well characterized by serological typing, where antigens expressed on the surface of lymphocytes are identified by the use of monoclonal antibodies (Adib et al., 2004; Ansari et al., 1988). This method is however dependent on viability of the cells and limited by the availability of antiserum (Tseng et al., 2010). Another drawback of the serotypes is the low level of polymorphism and heterozygosity (Adib et al., 2004). Tseng et al. (2010) showed that multiple microsatellite haplotypes can be associated with one single serotype. Several studies have demonstrated a higher resolution, sensitivity and accuracy of DNA genotyping in comparison to serological genotyping (Adib et al, 2004; Tseng et al., 2010).
12
Materials and Methods
Population and samples description A total number of 78 individuals were included in the study (Table 1). 26 of these were classified as ES-affected by histological analysis. The majority of the horses were Swedish Warmbloods and 16 of these were ES-affected. Blood or hair from horses affected with sarcoids was collected from horses treated at the University Animal Hospital at the Swedish University of Agricultural Sciences (SLU), as well as from affected horses in the area of Uppsala, Sweden. Samples from control horses were taken from previously genotyped horses at the Animal Genetics Laboratory at SLU. Table 1.Number of horses and breeds as well as controls and cases included in the study.
Breed Controls Cases Swedish Warmblooded Trotter 8 1 Swedish Warmblood 32 16 Polish Warmblood 1 0 Lipizzaner 4 1 Shire 0 1 New Forest Pony 1 0 Welsh Pony 1 0 Connemara Pony 1 1 Norwegian Fjord Horse 1 0 Riding Pony 0 2 Cross Breed 2 0 Unknown 1 1 Arabian Horse 0 1 Thoroughbred 0 2 Tot. 52 26
DNA isolation DNA from hair roots was isolated by addition of 100µl Chelex 100 Resin (Bio-Rad Laboratories, Hercules, California, USA) and 7µl of proteinase K (Merck KGaA, Damstadt, Germany). This mix was thereafter incubated at 56 ºC for 1 h and subsequently for 10 min at 95 ºC to inactivate the proteinase K. DNA from blood was isolated with a QIAsymphony DNA preparation robot (Qiagen, Hilden, Germany) according to the standard protocol for blood extraction with the Miniprep-kit.
Microsatellite analysis The microsatellites used in this study included markers within the MHC region and chromosome 23 as well as markers located at various positions in the horse genome. The latter are regularly used as additional markers in parentage testing (17-plex) at the Animal Genetics Laboratory, SLU (Glowatski-Mullis et al., 2005). Eleven markers were located within the MHC region (Table 2). The
13
microsatellites located on various positions were included to test for population stratification. These markers are located on various chromosomes whereas the MHC-markers are restricted to chromosomes 20 (Table 2). Primer sequences for markers in the MHC-region and chromosome 23 are given in Appendix I. Table 2. The microsatellites included in the study, the chromosome they are located on and the source of the microsatellites.
Marker Chr. Source
Control markers TKY297 1 Glowatski-Mullis (2005)
TKY374 1 Glowatski-Mullis (2005)
HTG7 4 Glowatski-Mullis (2005)
TKY337 4 Glowatski-Mullis (2005)
HMS5 5 Glowatski-Mullis (2005)
ASB2 15 Glowatski-Mullis (2005)
HMS1 15 Glowatski-Mullis (2005)
HTG6 15 Glowatski-Mullis (2005)
HTG3 16 Glowatski-Mullis (2005)
TKY321 20 Glowatski-Mullis (2005)
TKY394 15 Glowatski-Mullis (2005)
TKY294 27 Glowatski-Mullis (2005)
TKY333 28 Glowatski-Mullis (2005)
TKY301 23 Glowatski-Mullis (2005) Markers in the 20STS01 20 Wade et. al (2009) MHC region UMN-J34-2 20 Tseng et. al (2010)
UMNe056 20 Roberts et. al (2000)
TKY694 20 Tozaki et. al (2003)
UMNe214 20 Wade et. al (2009)
DRAi1 20 Unpublished
DQB 20 Unpublished
COR112 20 Tseng et. al (2010)
COR113 20 Tseng et. al (2010)
UM11 20 Glowatski-Mullis (2005)
COR114 20 Tseng et. al (2010)
UMNe151 20 Swinburne et. al (2003)
COR084 23 Tallmadge R.L. et al (1999)
UM022 23 Meyer A.H. et. al (1997) Total no. of markers
28
PCR-amplification PCR-amplification of the random markers, as well as the MHC marker UM11, was performed in two separate reactions in a total volume of 14 µl. Each reaction was set up as follows: 1.6 µl 10x PCR-buffer (Applied Biosystems, Californa, USA), 0.16 µl 20mM dNTPs, 0.25 µl primer mix, 1.8 µl Taq Gold (5U/µl) (Applied Biosystems, Californa, USA), 10.20 µl H2O and 1 µl DNA. Cycling conditions for the random markers were as follows: 95 ºC for 5 min, 34 cycles of 95 ºC for 1 min, 58 ºC for 1 min 30 s, 72 ºC for 1min and a final extension at 72 ºC for 20 min. PCR-amplification of the microsatellites in the MHC region (except for UM11) was performed in separate reactions in a total volume of 10 µl consisting of 1 µl GeneAmp10x PCR Buffer II (Applied Biosystems, Californa, USA), 2 µl MgCl2 25 mM, 0.1 µl dNTPs 25 mM, 0.1 µl forward primer 10 µM with M13(-21) tail, 0.5 µl reverse primer 10 µM, 0.5 µl fluorescent- labeled M13 linker 10 µl, 0.1 µl AmpliTaq Gold DNA polymerase (Applied Biosystems, Californa, USA) and 4.7 µl H2O. Cycling conditions for 20STS, COR113, COR114, DQB, DRA and TKY694 were as follows: 95 ºC for 5 min, 33 cycles of 95 ºC for 1 min, 58 ºC for 1 min, 72 ºC for 30 s and a final extension at 72 ºC for 20 min. Cycling conditions for COR084, COR112, UM022, UMNe056, UMNe151, UMNe214 and UMN-J34-
14
2 were as follows: 95 ºC for 5 min, 20 cycles of 95 ºC for 1 min, 60 ºC – 0.5 ºC/cycle for 1 min, 72 ºC for 30 s followed by 20 cycles of 95 ºC for 1 min, 55 ºC – 0.5 ºC/cycle for 1 min, 72 ºC for 30 s and a final extension of 72 ºC for 7 min.
Statistical analyses P-values ≤ 0.05 were considered significant and Bonferroni correction for multiple testing was used when applicable. All calculations were carried out for cases and controls in two groups of horses; one group including all horses and one group including only Swedish Warmbloods. All microsatellites included were tested for Hardy Weinberg Equilibrium and heterozygosity using the software GenePop on the Web (Raymond and Rousset, 1995; Rousset, 2008) in order to determine whether the individuals in the study are a representative of the population. Heterozygosity was also calculated by a Fisher Exact Test using SISA software (Uitenbroek, 1997). Allele frequencies were calculated for markers in the MHC-region using GenePop on the Web software (Raymond and Rousset, 1995; Rousset, 2008). Fisher Exact test on SISA (Uitenbroek, 1997) was thereafter used to test for significant differences in allele frequencies between cases and controls. Alleles with significant differences between cases and controls were subsequently tested for significant differences in the level of individuals homozygous and heterozygous for the allele. This test was performed using Fisher Exact test on SISA (Uitenbroek, 1997). Fisher Exact test on SISA (Uitenbroek, 1997) was also used for analysis of homozygous stretches in the MHC-region. Observed haplotypes were examined for significant differences between cases and controls using the same method.
15
Results
Hardy Weinberg Equilibrium All markers, the ones located at various positions in the horse genome as well as the ones located within the MHC-region, were tested for Hardy Weinberg Equilibrium (HWE). The p-value was adjusted to 0.002 after Bonferroni correction. For the control group, including all breeds, the markers ASB2, HTG7 and COR112 were not in HWE. The corresponding case group was not in HWE for the marker COR113. For the control group of Swedish Warmbloods the only marker not in HWE was COR112 whereas all markers for the corresponding case group were in HWE.
Fisher Exact The Fisher Exact test was used for testing of significant differences in homozygosity/heterozygosity between cases and controls. After Bonferroni-correction (P = 0.002) none of the markers in either the group including all horses or the group including only Swedish Warmbloods showed significant results (Table 3). However, looking at raw p-values several markers within the MHC-region are close to significance.
16
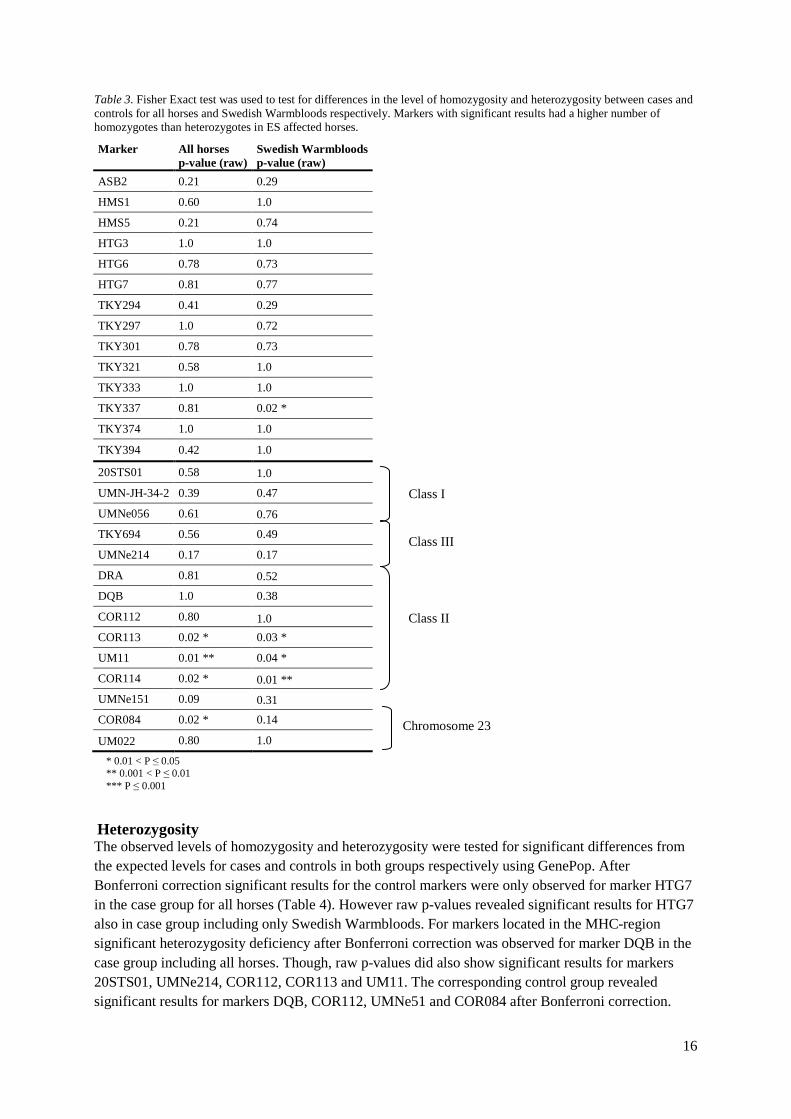
Table 3. Fisher Exact test was used to test for differences in the level of homozygosity and heterozygosity between cases and controls for all horses and Swedish Warmbloods respectively. Markers with significant results had a higher number of homozygotes than heterozygotes in ES affected horses.
Marker All horses p-value (raw)
Swedish Warmbloods p-value (raw)
ASB2 0.21 0.29
HMS1 0.60 1.0
HMS5 0.21 0.74
HTG3 1.0 1.0
HTG6 0.78 0.73
HTG7 0.81 0.77
TKY294 0.41 0.29
TKY297 1.0 0.72
TKY301 0.78 0.73
TKY321 0.58 1.0
TKY333 1.0 1.0
TKY337 0.81 0.02 *
TKY374 1.0 1.0
TKY394 0.42 1.0
20STS01 0.58 1.0
UMN-JH-34-2 0.39 0.47
UMNe056 0.61 0.76
TKY694 0.56 0.49
UMNe214 0.17 0.17
DRA 0.81 0.52 DQB 1.0 0.38
COR112 0.80 1.0 COR113 0.02 * 0.03 *
UM11 0.01 ** 0.04 *
COR114 0.02 * 0.01 ** UMNe151 0.09 0.31 COR084 0.02 * 0.14
UM022 0.80 1.0
Heterozygosity The observed levels of homozygosity and heterozygosity were tested for significant differences from the expected levels for cases and controls in both groups respectively using GenePop. After Bonferroni correction significant results for the control markers were only observed for marker HTG7 in the case group for all horses (Table 4). However raw p-values revealed significant results for HTG7 also in case group including only Swedish Warmbloods. For markers located in the MHC-region significant heterozygosity deficiency after Bonferroni correction was observed for marker DQB in the case group including all horses. Though, raw p-values did also show significant results for markers 20STS01, UMNe214, COR112, COR113 and UM11. The corresponding control group revealed significant results for markers DQB, COR112, UMNe51 and COR084 after Bonferroni correction.
Class I
Class III
Class II
Chromosome 23
* 0.01 < P ≤ 0.05 ** 0.001 < P ≤ 0.01 *** P ≤ 0.001
17
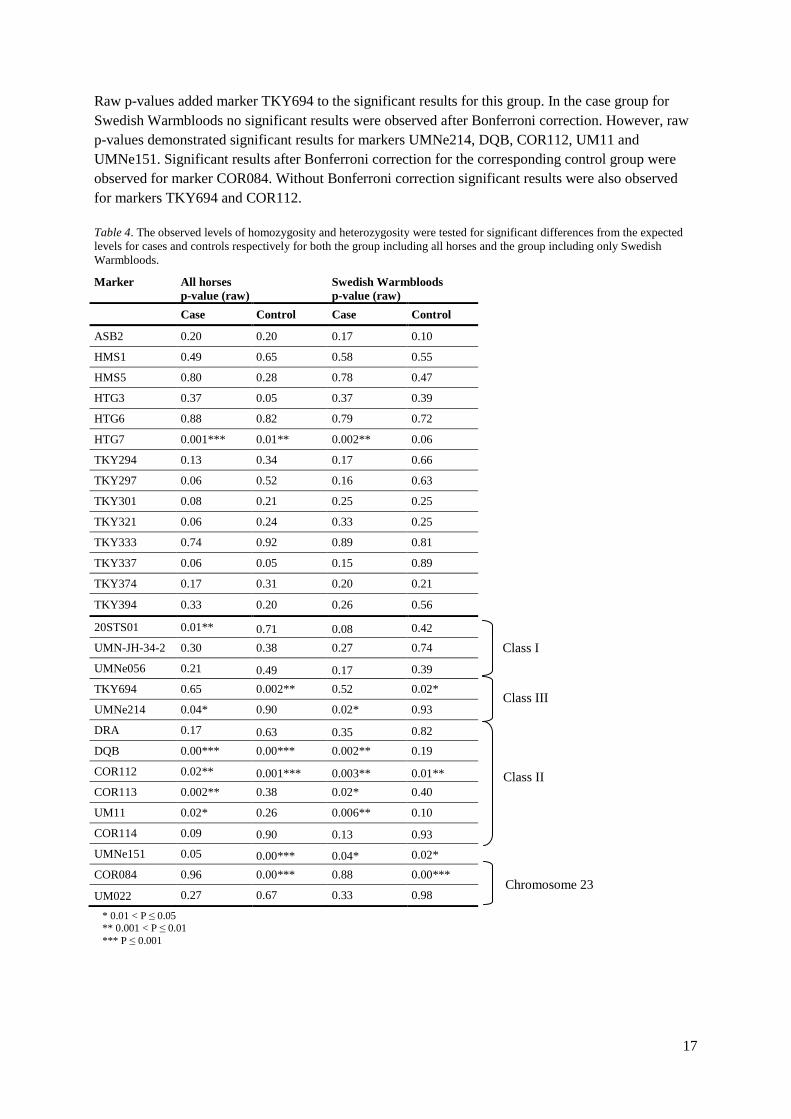
Raw p-values added marker TKY694 to the significant results for this group. In the case group for Swedish Warmbloods no significant results were observed after Bonferroni correction. However, raw p-values demonstrated significant results for markers UMNe214, DQB, COR112, UM11 and UMNe151. Significant results after Bonferroni correction for the corresponding control group were observed for marker COR084. Without Bonferroni correction significant results were also observed for markers TKY694 and COR112. Table 4. The observed levels of homozygosity and heterozygosity were tested for significant differences from the expected levels for cases and controls respectively for both the group including all horses and the group including only Swedish Warmbloods.
Marker All horses p-value (raw)
Swedish Warmbloods p-value (raw)
Case Control Case Control
ASB2 0.20 0.20 0.17 0.10
HMS1 0.49 0.65 0.58 0.55
HMS5 0.80 0.28 0.78 0.47
HTG3 0.37 0.05 0.37 0.39
HTG6 0.88 0.82 0.79 0.72
HTG7 0.001*** 0.01** 0.002** 0.06
TKY294 0.13 0.34 0.17 0.66
TKY297 0.06 0.52 0.16 0.63
TKY301 0.08 0.21 0.25 0.25
TKY321 0.06 0.24 0.33 0.25
TKY333 0.74 0.92 0.89 0.81
TKY337 0.06 0.05 0.15 0.89
TKY374 0.17 0.31 0.20 0.21
TKY394 0.33 0.20 0.26 0.56
20STS01 0.01** 0.71 0.08 0.42
UMN-JH-34-2 0.30 0.38 0.27 0.74
UMNe056 0.21 0.49 0.17 0.39 TKY694 0.65 0.002** 0.52 0.02*
UMNe214 0.04* 0.90 0.02* 0.93
DRA 0.17 0.63 0.35 0.82
DQB 0.00*** 0.00*** 0.002** 0.19
COR112 0.02** 0.001*** 0.003** 0.01** COR113 0.002** 0.38 0.02* 0.40
UM11 0.02* 0.26 0.006** 0.10
COR114 0.09 0.90 0.13 0.93 UMNe151 0.05 0.00*** 0.04* 0.02*
COR084 0.96 0.00*** 0.88 0.00***
UM022 0.27 0.67 0.33 0.98
Class II
Chromosome 23
* 0.01 < P ≤ 0.05 ** 0.001 < P ≤ 0.01 *** P ≤ 0.001
Class I
Class III
18
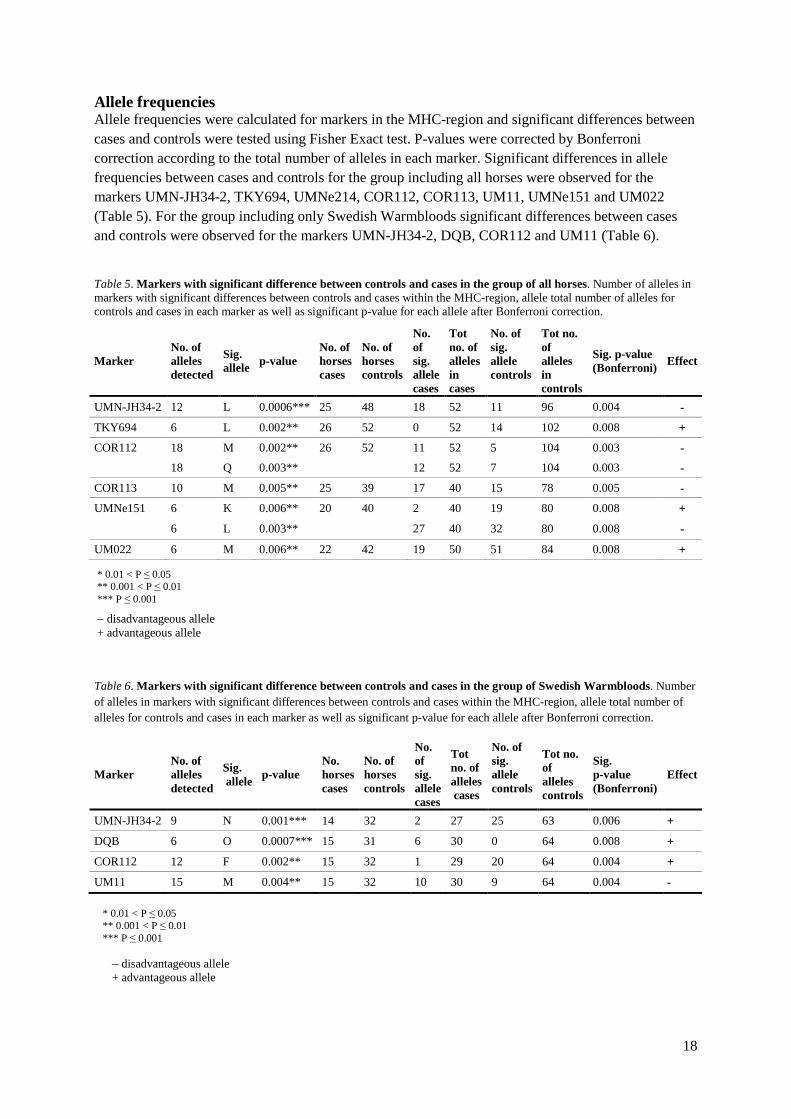
Allele frequencies Allele frequencies were calculated for markers in the MHC-region and significant differences between cases and controls were tested using Fisher Exact test. P-values were corrected by Bonferroni correction according to the total number of alleles in each marker. Significant differences in allele frequencies between cases and controls for the group including all horses were observed for the markers UMN-JH34-2, TKY694, UMNe214, COR112, COR113, UM11, UMNe151 and UM022 (Table 5). For the group including only Swedish Warmbloods significant differences between cases and controls were observed for the markers UMN-JH34-2, DQB, COR112 and UM11 (Table 6). Table 5. Markers with significant difference between controls and cases in the group of all horses. Number of alleles in markers with significant differences between controls and cases within the MHC-region, allele total number of alleles for controls and cases in each marker as well as significant p-value for each allele after Bonferroni correction.
Marker No. of alleles detected
Sig. allele p-value
No. of horses cases
No. of horses controls
No. of sig. allele cases
Tot no. of alleles in cases
No. of sig. allele controls
Tot no. of alleles in controls
Sig. p-value (Bonferroni) Effect
UMN-JH34-2 12 L 0.0006*** 25 48 18 52 11 96 0.004 -
TKY694 6 L 0.002** 26 52 0 52 14 102 0.008 +
COR112 18 M 0.002** 26 52 11 52 5 104 0.003 -
18 Q 0.003** 12 52 7 104 0.003 -
COR113 10 M 0.005** 25 39 17 40 15 78 0.005 -
UMNe151 6 K 0.006** 20 40 2 40 19 80 0.008 +
6 L 0.003** 27 40 32 80 0.008 -
UM022 6 M 0.006** 22 42 19 50 51 84 0.008 +
Table 6. Markers with significant difference between controls and cases in the group of Swedish Warmbloods. Number of alleles in markers with significant differences between controls and cases within the MHC-region, allele total number of alleles for controls and cases in each marker as well as significant p-value for each allele after Bonferroni correction.
Marker No. of alleles detected
Sig. allele p-value
No. horses cases
No. of horses controls
No. of sig. allele cases
Tot no. of alleles cases
No. of sig. allele controls
Tot no. of alleles controls
Sig. p-value (Bonferroni)
Effect
UMN-JH34-2 9 N 0.001*** 14 32 2 27 25 63 0.006 +
DQB 6 O 0.0007*** 15 31 6 30 0 64 0.008 +
COR112 12 F 0.002** 15 32 1 29 20 64 0.004 +
UM11 15 M 0.004** 15 32 10 30 9 64 0.004 -
* 0.01 < P ≤ 0.05 ** 0.001 < P ≤ 0.01 *** P ≤ 0.001
* 0.01 < P ≤ 0.05 ** 0.001 < P ≤ 0.01 *** P ≤ 0.001
− disadvantageous allele + advantageous allele
− disadvantageous allele + advantageous allele
19
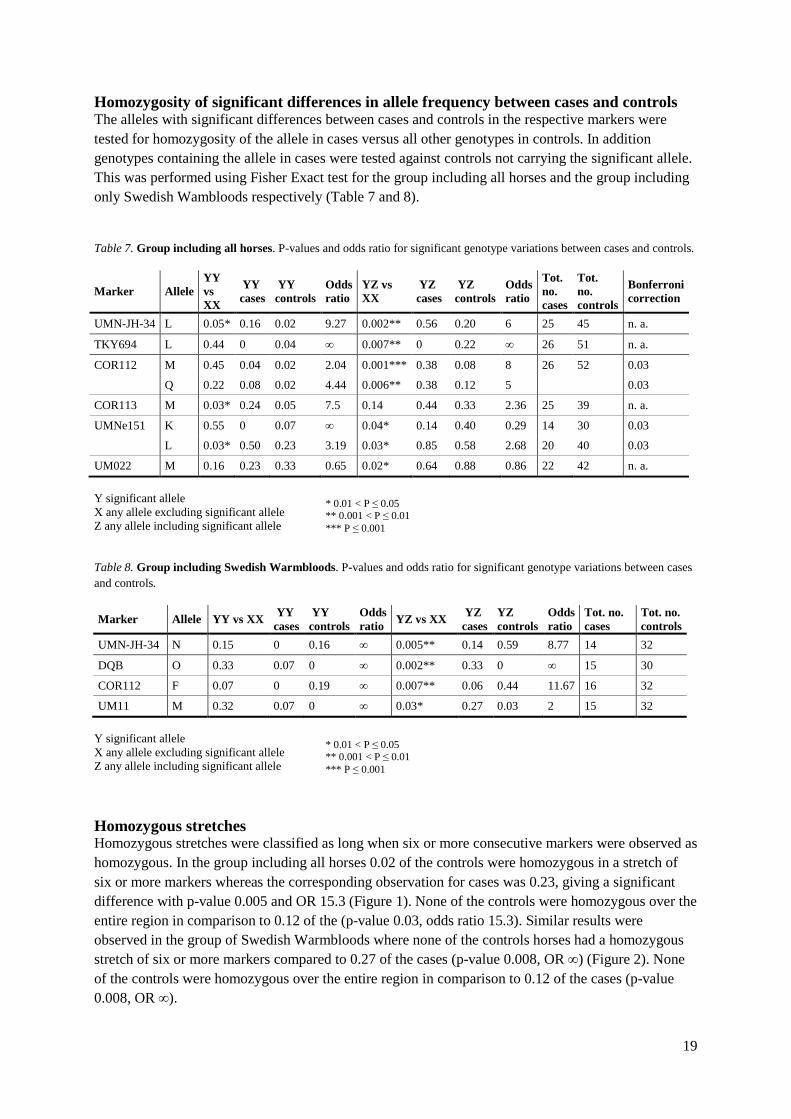
Homozygosity of significant differences in allele frequency between cases and controls The alleles with significant differences between cases and controls in the respective markers were tested for homozygosity of the allele in cases versus all other genotypes in controls. In addition genotypes containing the allele in cases were tested against controls not carrying the significant allele. This was performed using Fisher Exact test for the group including all horses and the group including only Swedish Wambloods respectively (Table 7 and 8). Table 7. Group including all horses. P-values and odds ratio for significant genotype variations between cases and controls.
Marker Allele YY vs XX
YY cases
YY controls
Odds ratio
YZ vs XX
YZ cases
YZ controls
Odds ratio
Tot. no. cases
Tot. no. controls
Bonferroni correction
UMN-JH-34 L 0.05* 0.16 0.02 9.27 0.002** 0.56 0.20 6 25 45 n. a.
TKY694 L 0.44 0 0.04 ∞ 0.007** 0 0.22 ∞ 26 51 n. a.
COR112 M 0.45 0.04 0.02 2.04 0.001*** 0.38 0.08 8 26 52 0.03
Q 0.22 0.08 0.02 4.44 0.006** 0.38 0.12 5 0.03
COR113 M 0.03* 0.24 0.05 7.5 0.14 0.44 0.33 2.36 25 39 n. a.
UMNe151 K 0.55 0 0.07 ∞ 0.04* 0.14 0.40 0.29 14 30 0.03
L 0.03* 0.50 0.23 3.19 0.03* 0.85 0.58 2.68 20 40 0.03
UM022 M 0.16 0.23 0.33 0.65 0.02* 0.64 0.88 0.86 22 42 n. a. Y significant allele X any allele excluding significant allele Z any allele including significant allele Table 8. Group including Swedish Warmbloods. P-values and odds ratio for significant genotype variations between cases and controls.
Marker Allele YY vs XX YY cases
YY controls
Odds ratio YZ vs XX YZ
cases YZ controls
Odds ratio
Tot. no. cases
Tot. no. controls
UMN-JH-34 N 0.15 0 0.16 ∞ 0.005** 0.14 0.59 8.77 14 32
DQB O 0.33 0.07 0 ∞ 0.002** 0.33 0 ∞ 15 30
COR112 F 0.07 0 0.19 ∞ 0.007** 0.06 0.44 11.67 16 32
UM11 M 0.32 0.07 0 ∞ 0.03* 0.27 0.03 2 15 32 Y significant allele X any allele excluding significant allele Z any allele including significant allele
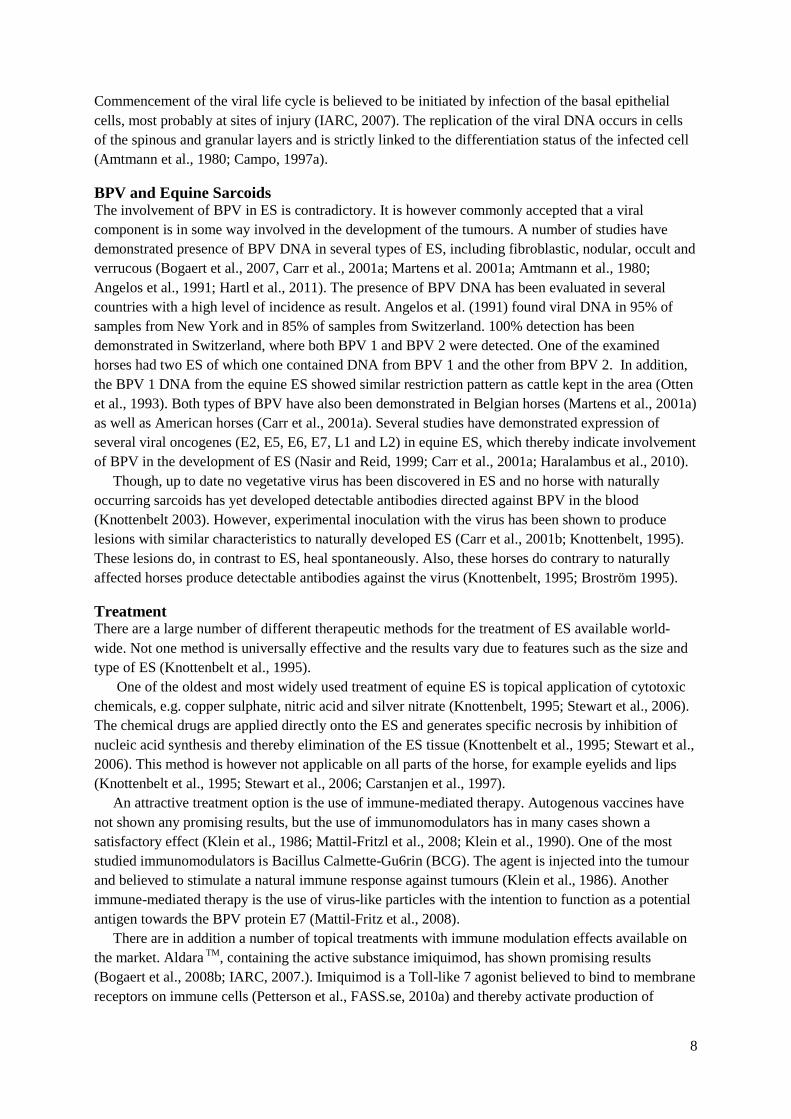
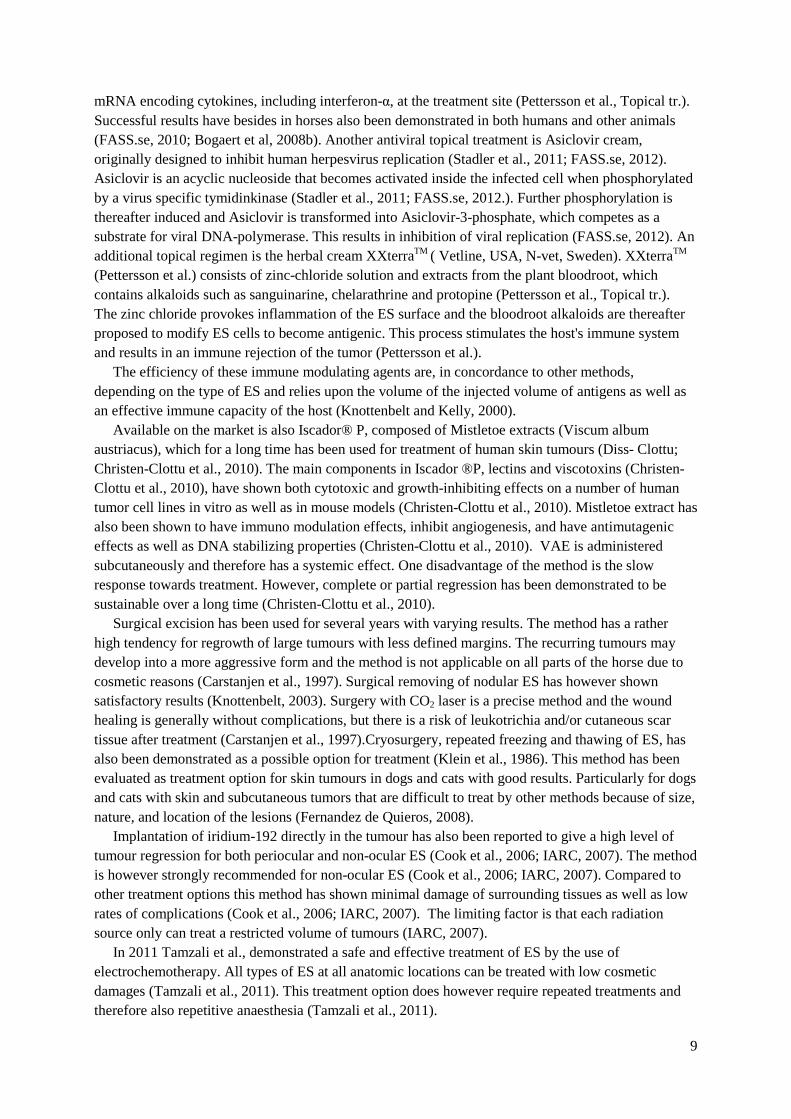
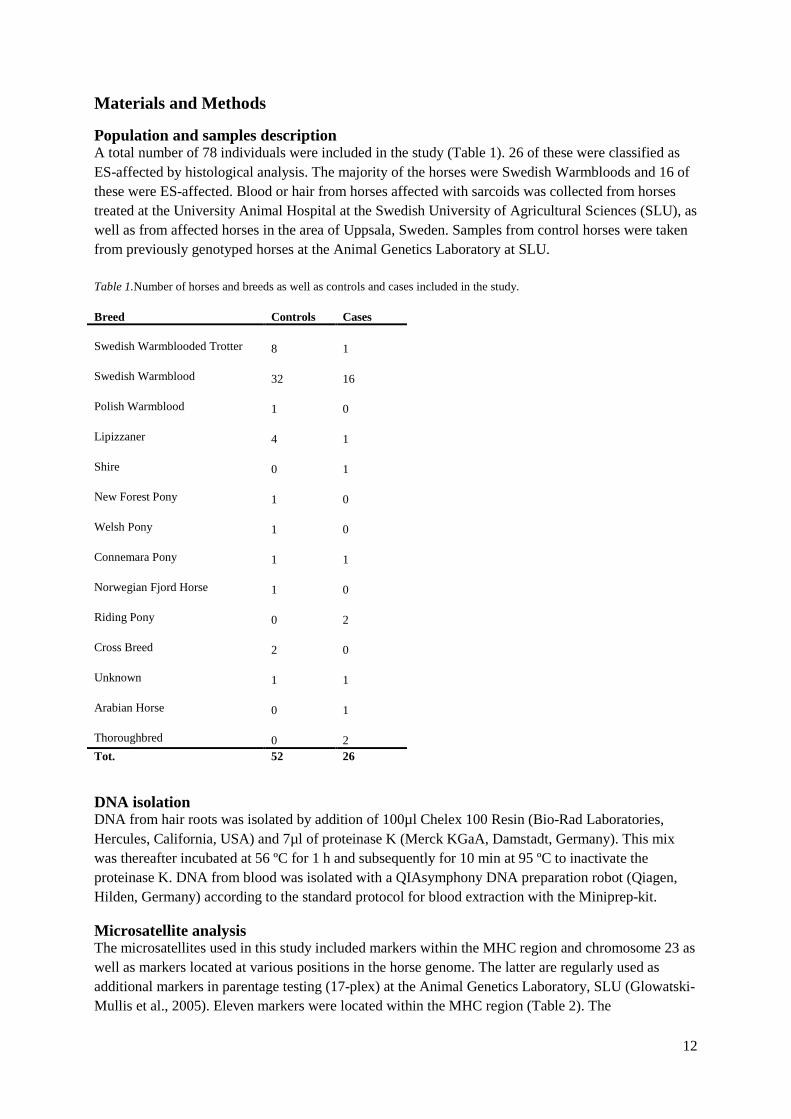
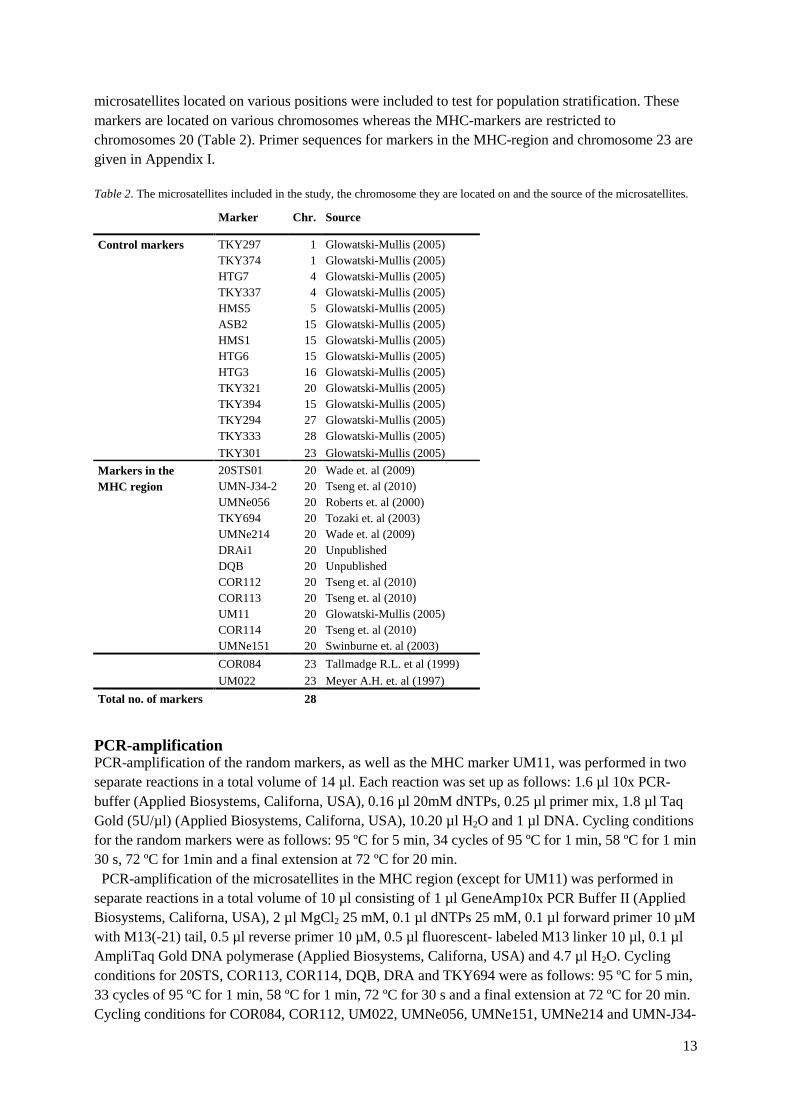
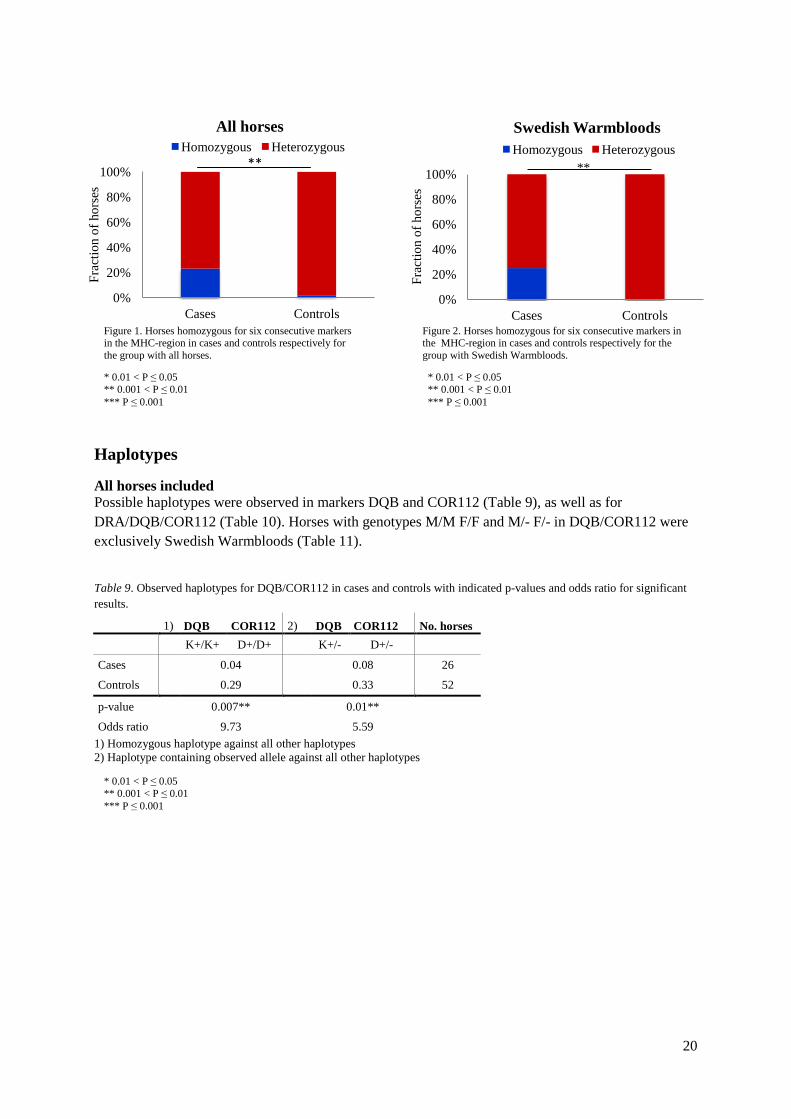
Homozygous stretches Homozygous stretches were classified as long when six or more consecutive markers were observed as homozygous. In the group including all horses 0.02 of the controls were homozygous in a stretch of six or more markers whereas the corresponding observation for cases was 0.23, giving a significant difference with p-value 0.005 and OR 15.3 (Figure 1). None of the controls were homozygous over the entire region in comparison to 0.12 of the (p-value 0.03, odds ratio 15.3). Similar results were observed in the group of Swedish Warmbloods where none of the controls horses had a homozygous stretch of six or more markers compared to 0.27 of the cases (p-value 0.008, OR ∞) (Figure 2). None of the controls were homozygous over the entire region in comparison to 0.12 of the cases (p-value 0.008, OR ∞).
* 0.01 < P ≤ 0.05 ** 0.001 < P ≤ 0.01 *** P ≤ 0.001
* 0.01 < P ≤ 0.05 ** 0.001 < P ≤ 0.01 *** P ≤ 0.001
20
0%
20%
40%
60%
80%
100%
Cases Controls
Frac
tion
of h
orse
s
Swedish Warmbloods Homozygous Heterozygous
0%
20%
40%
60%
80%
100%
Cases Controls
Frac
tion
of h
orse
s
All horses Homozygous Heterozygous
**
Haplotypes
All horses included Possible haplotypes were observed in markers DQB and COR112 (Table 9), as well as for DRA/DQB/COR112 (Table 10). Horses with genotypes M/M F/F and M/- F/- in DQB/COR112 were exclusively Swedish Warmbloods (Table 11).
Table 9. Observed haplotypes for DQB/COR112 in cases and controls with indicated p-values and odds ratio for significant results.
1) DQB COR112 2) DQB COR112 No. horses
K+/K+ D+/D+ K+/- D+/-
Cases 0.04 0.08 26
Controls 0.29 0.33 52
p-value 0.007** 0.01**
Odds ratio 9.73 5.59 1) Homozygous haplotype against all other haplotypes 2) Haplotype containing observed allele against all other haplotypes
Figure 1. Horses homozygous for six consecutive markers in the MHC-region in cases and controls respectively for the group with all horses.
Figure 2. Horses homozygous for six consecutive markers in the MHC-region in cases and controls respectively for the group with Swedish Warmbloods.
* 0.01 < P ≤ 0.05 ** 0.001 < P ≤ 0.01 *** P ≤ 0.001
* 0.01 < P ≤ 0.05 ** 0.001 < P ≤ 0.01 *** P ≤ 0.001
**
* 0.01 < P ≤ 0.05 ** 0.001 < P ≤ 0.01 *** P ≤ 0.001
21
Table 10. Observed haplotypes for DRA/DQB/COR112 in cases and controls with indicated p-value and odds ratio for significant results.
1) DRA DQB COR112 2) DRA DQB COR112 No. horses
N/N K+/K+ D+/D+ N/- K+/- D+/-
Cases 0 0.04 52
Controls 0.19 0.62 26
p-value 0.02*
Odds ratio ∞ 5.11
1) Homozygous haplotype against all other haplotypes 2) Haplotype containing observed allele against all other haplotypes
Swedish Warmbloods For Swedish Warmbloods potential haplotypes were observed for DQB/COR112 (Table 11) as well as COR113/UM11/COR114 (Table 12). Table 11. Observed haplotypes for DQB/COR112 in cases and controls with indicated p-values and odds ratiofor significant results.
1) DQB COR112 2) DQB COR112 No. horses
M/M F/F M/- F/-
Cases 0 0.07 15
Controls 0.19 0.41 32
p-value
0.02*
Odds ratio
∞ 8
1) Homozygous haplotype against all other haplotypes 2) Haplotype containing observed allele against all other haplotypes Table 12. Observed haplotypes for DRA/DQB/COR112 in cases and controls with indicated p-value and odds ratio for significant results.
1) COR113 UM11 COR114 2) COR113 UM11 COR114 No. horses
M/M M/M P/P
M/- M/- P/-
Cases 0.20 0.43 14
Controls 0 0.28 25
p-value 0.04*
Odds ratio ∞
1) Homozygous haplotype against all other haplotypes 2) Haplotype containing observed allele against all other haplotypes
* 0.01 < P ≤ 0.05 ** 0.001 < P ≤ 0.01 *** P ≤ 0.001
* 0.01 < P ≤ 0.05 ** 0.001 < P ≤ 0.01 *** P ≤ 0.001
* 0.01 < P ≤ 0.05 ** 0.001 < P ≤ 0.01 *** P ≤ 0.001

22
Discussion The results from this study show that the genetic profiles of horses affected with Equine Sarcoids (ES) are different from that of non-affected horses. In addition, the results implicate breed differences in the genotypes of the horses included in the study. After Bonferroni correction the majority of the control markers included in the study were in Hardy Weinberg Equilibrium (HWE) indicating that the selected group of horses is an adequate representative of the total population. All control markers (markers located at various positions in the genome) showed good amplification in the PCR. Marker HTG7 was the only marker that deviated from HWE. The same result was achieved when looking at the level of observed heterozygotes in cases and controls respectively. This marker does however have a low level of polymorphism which may increase the number of homozygous individuals in the locus (Lúis et al. 2007; Khansour et al. 2012). PIC-values for HTG7 have previously been shown to range from 0.357 to 0.662 (Juras, et al. 2004; Mihók et al. 2009). These values can be compared to, for example, ASB2 with PIC-values ranging from 0.669 to 0.868 (Lúis et al. 2004; Mihók et al. 2009). PIC values for HTG7 in this study varied from 0.637 to 0.697 in comparison to 0.800 - 0.845 for ASB2 (data not shown). Thus, the higher number of homozygotes observed in HTG7 in this study does not deviate from levels normally observed for this marker. The other markers with significant results in the Fisher Exact test had an excess of homozygotes in ES affected horses and are located in the MHC-region. There are several possible explanations for this. For some horses a few markers in this region did not show as good amplification as the randomly located markers. These horses were included in the control group where DNA was extracted from hair, which gives lower quality than DNA extracted from blood. The deviation from HWE could thereby be due to allele drop outs. In addition, this region is complicated and poorly defined molecularly in horse (Brinkmeyer et al. 2012; Hedrick et al. 1999). The MHC is a multigene family which makes it difficult to know at which gene copy the marker amplifies (Hedrick, et al. 1998; personal communication). Variation in class II DRB MHC sequences has indeed been demonstrated in Przewalski’s horses. It was concluded that these sequences derived from two genes and that one of them included a nonfunctional allele (Hedrick et al. 1998). Also, pseudogenes have been demonstrated in the horse MHC (Tallmadge et al. 2005). Deviation from HWE, with homozygote excess, has in addition been demonstrated in marker DQB in Alaskan caribou herds (Kennedy et al. 2010). Significant results for the MHC-region were also observed for both groups when looking at the observed level of heterozygosity in comparison to the expected level in cases and controls respectively. Several markers in both groups showed a significant excess of homozygotes. The number of significant markers was similar for both cases and controls in both of the groups. However, several of the significant markers were not the same in cases as in controls. As the MHC-region is a highly polymorphic region of the DNA (Gaudieri et. al, 2000; Vandiedonck and Knight, 2009) it was expected that controls would have a high level of heterozygosity than the cases. Also, it has previously been demonstrated that horses affected by Insect bite hypersensibility (IBH) were more homozygous in the MHC region than non-affected horses (Andesson et al. 2012), indicating that similar results would have been expected in this study. Though, again the DNA in this group of horses may have had lower quality and/or varying DNA-concentrations wherefore allele drop outs are plausible. Also, looking at longer consecutive homozygous stretches along the MHC region the frequency in cases was significantly higher in than in controls for both groups of horses. When looking at the group including all horses there was also a significant difference between horses homozygous over the entire region of markers in MHC class II. These results are consistent with results obtained by Andersson et al (2012) who showed that homozygosity over the entire MHC class II region is associated to IBH. As the DNA quality for the cases was higher than for the controls the probability of allele drop outs is unlikely,
23
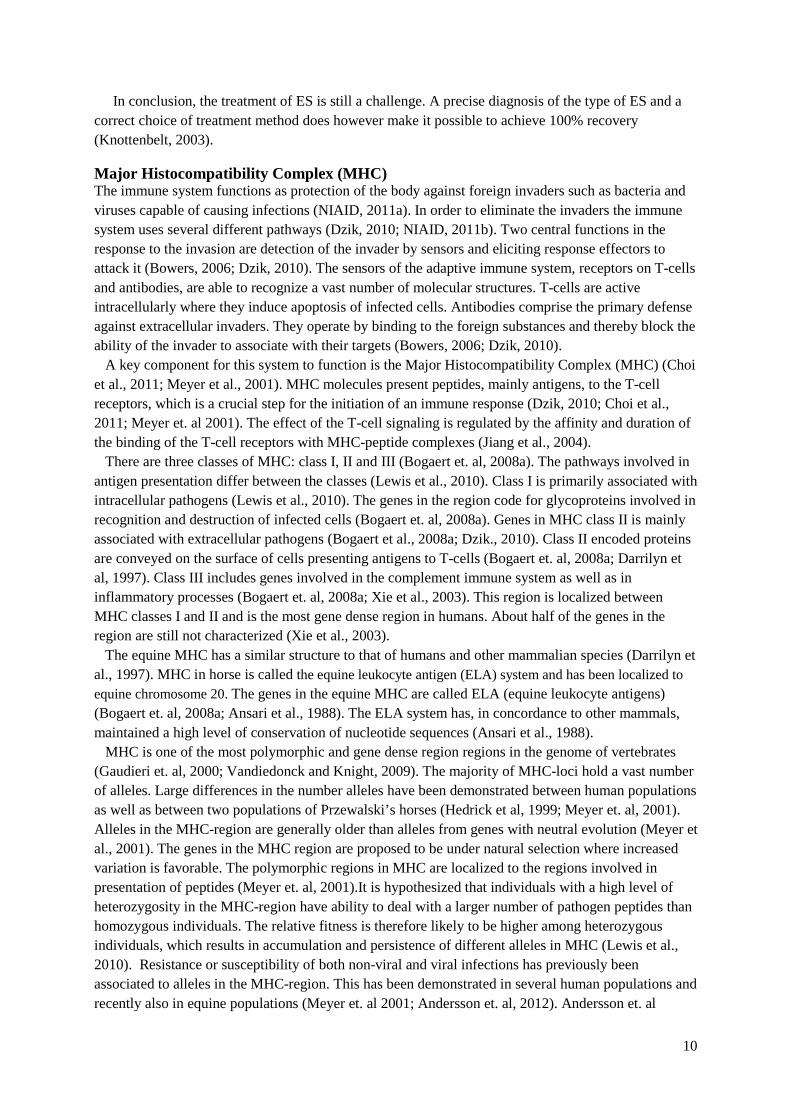
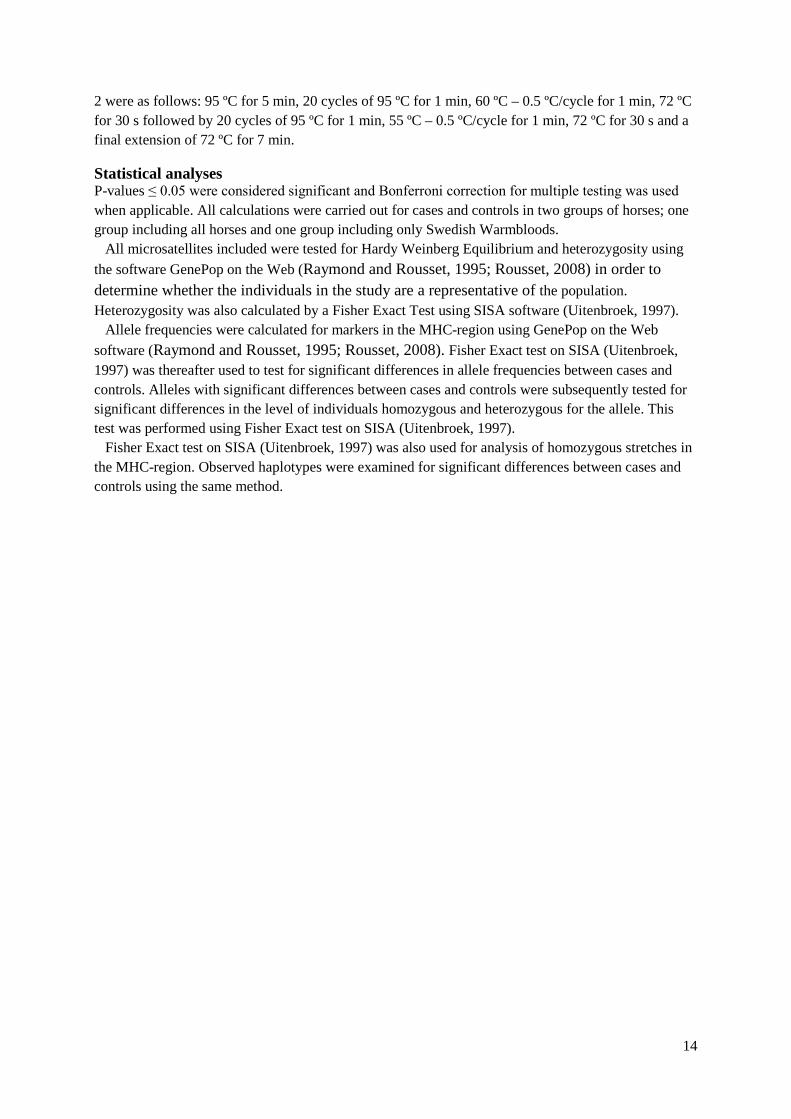
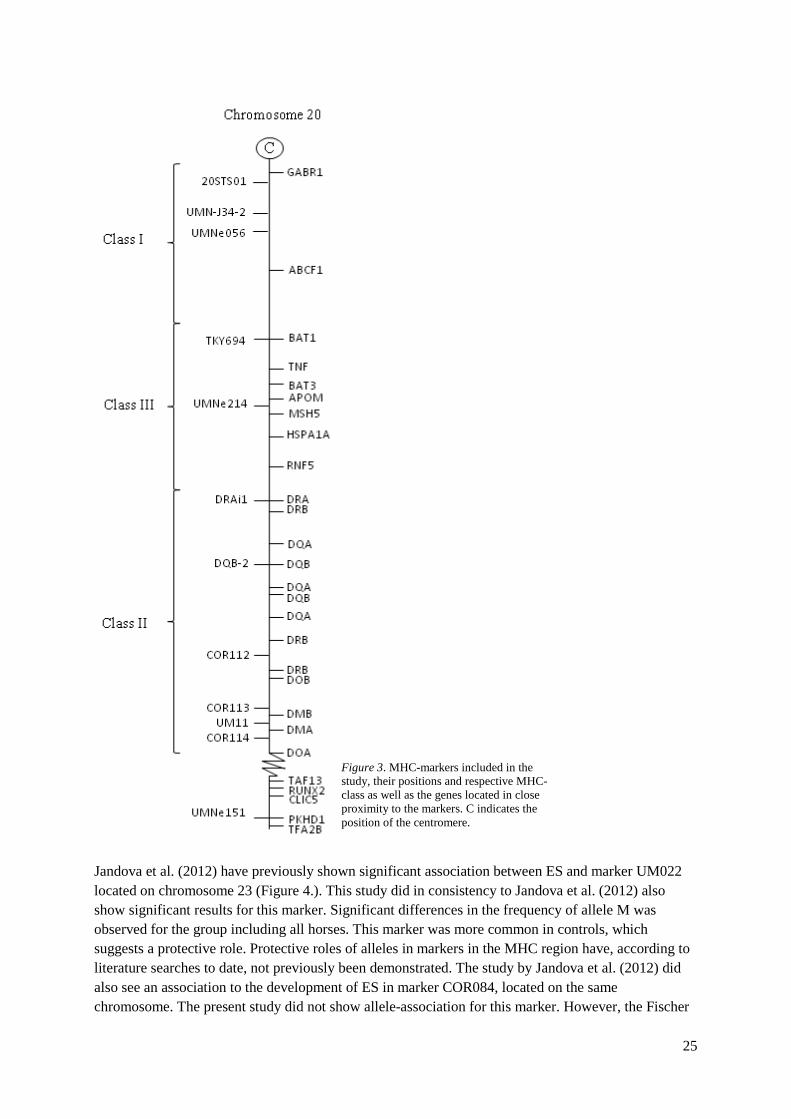
which further supports the results from this study. A larger sample size would however increase the impact of the results Interesting results were obtained when looking at allele frequencies in markers within the MHC-region. Significant differences in frequencies of various alleles were observed when comparing cases and controls for both groups of horses. A higher number of significant alleles were observed for the group including all horses, which could be due to the mix of breeds. There may be breed specific differences in the genotypes of horses included in the study. The majority of the significant alleles had a higher frequency in cases than in controls indicating a disadvantageous effect of the respective alleles. One marker, UMNe151, included two alleles with significant results. One allele, K, was more common in controls whereas the other (L) was more common in cases. This could be a result from a mutation that in turn adds to an increased susceptibility to the development of ES. Alleles in COR112 were significantly more common in cases than in controls in the group including all horses. This is consistent with the results obtained by Andersson et. al (2012) who showed association to IBH for one allele in COR112 in two different populations. Opposite results were however seen in the group including only Swedish Warmbloods. For this group the allele with significant difference in frequency between cases and controls was more common in controls than in cases. It was in addition a different allele, F, than the alleles with significant results in the group including all horses. The fact that the allele is more common in controls than in cases could indicate a protective role. Moreover this allele, in concert with allele M, was exclusively present in Swedish Warmbloods designating differing risk/protecting alleles in breeds. Also, haplotypes containing these alleles were only present in Swedish Warmbloods which further supports breed differences in the genetic profile. Differences between the groups were also observed in the localization of MHC-class of the significant markers. MHC classes I and II were involved in both groups whereas the group including all horses also showed significance in class III and on chromosome 23. The hypothesis of a diverse genetic background to ES between different breeds has indeed been suggested in studies by for example Lazary et al. (1985) and Meredith et al. (1986). The results obtained when looking at homozygosity/heterozygosity of the significant alleles among the horses indicate that carrying only one copy of the allele is sufficient to achieve the effect of the allele. An effect of being homozygous for the respective allele was only seen for markers in the group including all horses. The low number of individuals in the group of Swedish Warmbloods could be an explanation to why the same results were not observed in this group. Furthermore, plausible haplotypes associated to predisposition for or protection against ES was observed in MHC class II for both groups of horses. Association between development of ES and certain haplotypes in MHC has previously been suggested by serological studies (Meredith et al. 1986, Broström et al. 1988). The results from this study did in consistence with these studies show association of haplotypes in MHC class II with development of ES. However, this study also reveals association between certain haplotypes and protection against ES. This haplotype included the same two markers (DQB and COR112) for both groups of horses, though with different allele composition. No haplotype association with risk of development of ES was observed in the group including all horses, which again could be due to the mix of breeds in the group. Different breeds may have haplotypes that are common in the specific breed. In contrast, a disadvantageous effect of being homozygous for alleles M-M-P in the haplotype constructed by markers COR113-UM11-COR114 respectively was demonstrated for the group including only Swedish Warmbloods. In addition, allele M in marker UM11 was significantly more common in cases. These markers are located close to each other in the end region of MHC class II that encodes the DM-genes (Fig. 3). DM is a cofactor crucial for making antigens available for T-cell recognition (Jensen et al. 1999). For Swedish Warmbloods it could therefore be speculated that specific alleles in genes in the region for the DM-genes modifies the genes in a disadvantageous way. The DQB-COR112 haplotype is positioned on the opposite part of
24
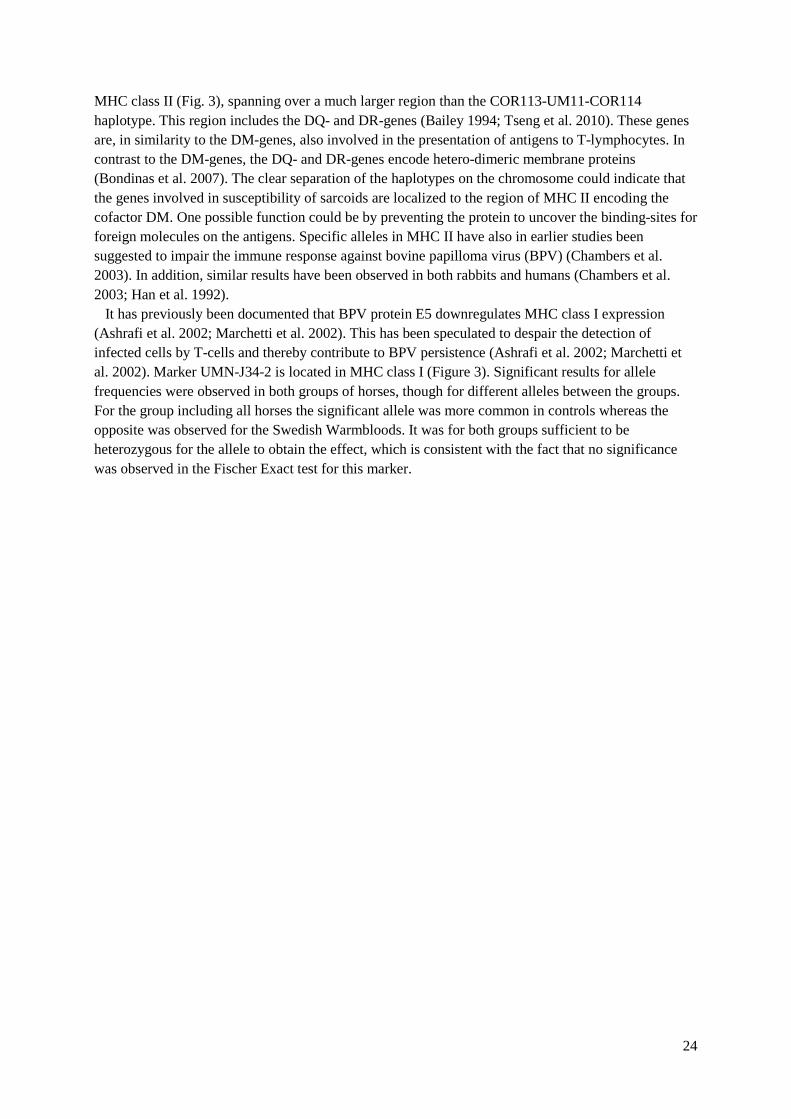
MHC class II (Fig. 3), spanning over a much larger region than the COR113-UM11-COR114 haplotype. This region includes the DQ- and DR-genes (Bailey 1994; Tseng et al. 2010). These genes are, in similarity to the DM-genes, also involved in the presentation of antigens to T-lymphocytes. In contrast to the DM-genes, the DQ- and DR-genes encode hetero-dimeric membrane proteins (Bondinas et al. 2007). The clear separation of the haplotypes on the chromosome could indicate that the genes involved in susceptibility of sarcoids are localized to the region of MHC II encoding the cofactor DM. One possible function could be by preventing the protein to uncover the binding-sites for foreign molecules on the antigens. Specific alleles in MHC II have also in earlier studies been suggested to impair the immune response against bovine papilloma virus (BPV) (Chambers et al. 2003). In addition, similar results have been observed in both rabbits and humans (Chambers et al. 2003; Han et al. 1992). It has previously been documented that BPV protein E5 downregulates MHC class I expression (Ashrafi et al. 2002; Marchetti et al. 2002). This has been speculated to despair the detection of infected cells by T-cells and thereby contribute to BPV persistence (Ashrafi et al. 2002; Marchetti et al. 2002). Marker UMN-J34-2 is located in MHC class I (Figure 3). Significant results for allele frequencies were observed in both groups of horses, though for different alleles between the groups. For the group including all horses the significant allele was more common in controls whereas the opposite was observed for the Swedish Warmbloods. It was for both groups sufficient to be heterozygous for the allele to obtain the effect, which is consistent with the fact that no significance was observed in the Fischer Exact test for this marker.
25
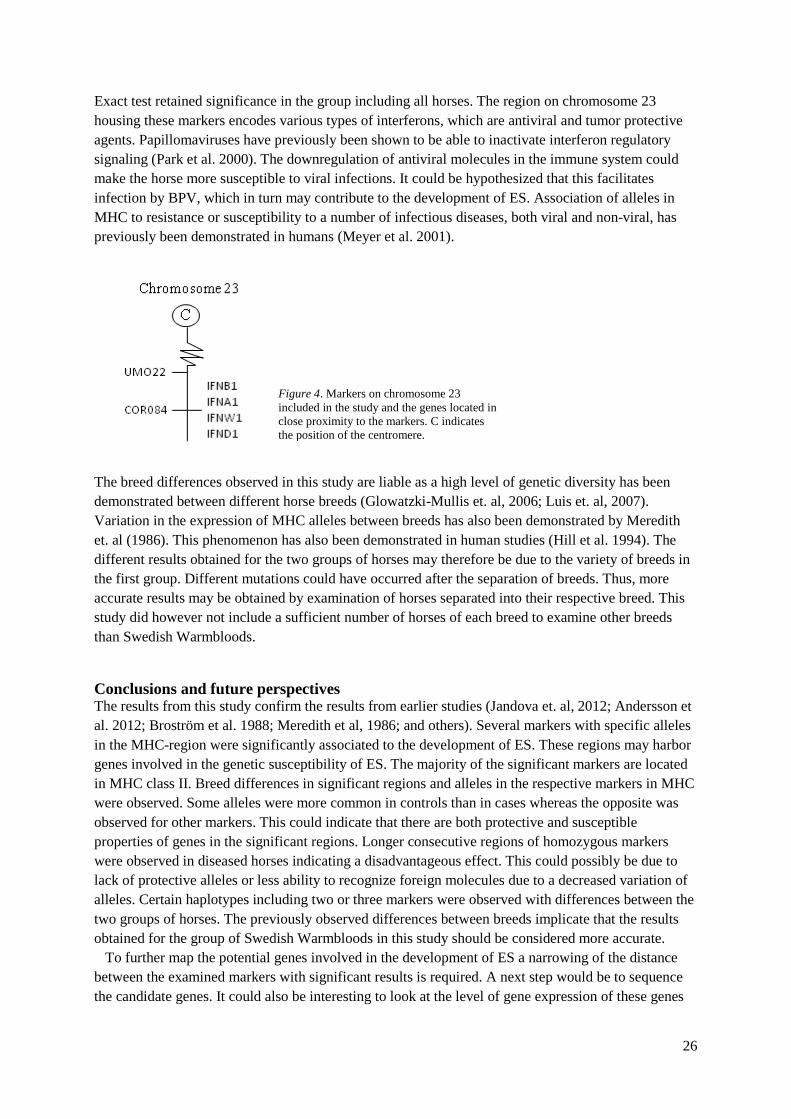
Jandova et al. (2012) have previously shown significant association between ES and marker UM022 located on chromosome 23 (Figure 4.). This study did in consistency to Jandova et al. (2012) also show significant results for this marker. Significant differences in the frequency of allele M was observed for the group including all horses. This marker was more common in controls, which suggests a protective role. Protective roles of alleles in markers in the MHC region have, according to literature searches to date, not previously been demonstrated. The study by Jandova et al. (2012) did also see an association to the development of ES in marker COR084, located on the same chromosome. The present study did not show allele-association for this marker. However, the Fischer
Figure 3. MHC-markers included in the study, their positions and respective MHC-class as well as the genes located in close proximity to the markers. C indicates the position of the centromere.
26
Exact test retained significance in the group including all horses. The region on chromosome 23 housing these markers encodes various types of interferons, which are antiviral and tumor protective agents. Papillomaviruses have previously been shown to be able to inactivate interferon regulatory signaling (Park et al. 2000). The downregulation of antiviral molecules in the immune system could make the horse more susceptible to viral infections. It could be hypothesized that this facilitates infection by BPV, which in turn may contribute to the development of ES. Association of alleles in MHC to resistance or susceptibility to a number of infectious diseases, both viral and non-viral, has previously been demonstrated in humans (Meyer et al. 2001).
The breed differences observed in this study are liable as a high level of genetic diversity has been demonstrated between different horse breeds (Glowatzki-Mullis et. al, 2006; Luis et. al, 2007). Variation in the expression of MHC alleles between breeds has also been demonstrated by Meredith et. al (1986). This phenomenon has also been demonstrated in human studies (Hill et al. 1994). The different results obtained for the two groups of horses may therefore be due to the variety of breeds in the first group. Different mutations could have occurred after the separation of breeds. Thus, more accurate results may be obtained by examination of horses separated into their respective breed. This study did however not include a sufficient number of horses of each breed to examine other breeds than Swedish Warmbloods.
Conclusions and future perspectives The results from this study confirm the results from earlier studies (Jandova et. al, 2012; Andersson et al. 2012; Broström et al. 1988; Meredith et al, 1986; and others). Several markers with specific alleles in the MHC-region were significantly associated to the development of ES. These regions may harbor genes involved in the genetic susceptibility of ES. The majority of the significant markers are located in MHC class II. Breed differences in significant regions and alleles in the respective markers in MHC were observed. Some alleles were more common in controls than in cases whereas the opposite was observed for other markers. This could indicate that there are both protective and susceptible properties of genes in the significant regions. Longer consecutive regions of homozygous markers were observed in diseased horses indicating a disadvantageous effect. This could possibly be due to lack of protective alleles or less ability to recognize foreign molecules due to a decreased variation of alleles. Certain haplotypes including two or three markers were observed with differences between the two groups of horses. The previously observed differences between breeds implicate that the results obtained for the group of Swedish Warmbloods in this study should be considered more accurate. To further map the potential genes involved in the development of ES a narrowing of the distance between the examined markers with significant results is required. A next step would be to sequence the candidate genes. It could also be interesting to look at the level of gene expression of these genes
Figure 4. Markers on chromosome 23 included in the study and the genes located in close proximity to the markers. C indicates the position of the centromere.

27
to elucidate possible down regulation either due to BPV infection or mutations. As breed differences in the genotypes of affected horses has been proven the studies should be performed in separate breeds. Also, looking at individuals from the same sire lines would make it possible to more accurately map haplotypes with plausible involvement in the susceptibility to ES.
28
References Adib, M., Yaran, M., Rezaie, a., Solgi G. (2004) HLA-DR Typing by Polymerase Chain Reaction with
Sequence- Specific Primers Compared to Serological typing. Journal of Research in Medical Sciences (6), pp. 255-259.
Amtmann E., Müller H., Sauer G. (1980) Equine connective tissue tumors contain unintegrated bovine papilloma virus DNA. Journal of Virology, 35, pp. 962-964.
Andersson, L. S., Swinburne, J. E., Meadows, J. R. S., Broström, H., Eriksson, S., Fikse, W. F., Frey, R., Sundquist, M., Tseng, C. T., Mikko, S., Lindgren, G. (2012) Immunogenetics (64), pp. 201-208.
Angelos J.A., Marti E., Lazary S., Carmichael L.E. (1991) Characterisation of BPV-like DNA in equine sarcoids. Archives of Virology, (119), pp. 95-109.
Ansari, H. A., Hediger, R., Fries, R., Stranzinger, G. (1988) Chromosomal localization of the major histocompatibility comples of the horse (ELA) by in situ hybridization. Immunogenetics. (28), pp. 362-364.
Armour, J.A.L., Alegre, S.A., Miles, S., Williams, L.J., Badge R.M. Minisatellites and mutation processes in tandemly repetitive DNA. In: Goldstein D.B., Schlötter C. (1999) Microsatellites evolution and applications. Oxford University press, New York.
Ashrafi, G. H., Tsirimonaki, E. T., Marchetti, B., O’Brien, P. M., Sibbet, G. J., Andrew, L., Campo, M. S. (2002) Down-regulation of MHC class I by bovine papillomavirus E5 oncoproteins. Oncogene (21), pp. 248-259.
Bailey E. (1994) Variation within the antigen binding site of the major histocompatibility complex DRA gene of domestic horses. Equine Infectious Disease (7), pp.123–126
Barbis, D. P., Bainbride, D., Crump, A. L., Zhang, C. H., Antcak, D. F. (1994) Variation in expression of MHC class II antigens on horse lymphocytes determined by MHC haplotype. Veterinary Immunologyand Immunopathology (42), pp. 103-114.
Bogaert L., Martens A., Depoorter P., Gasthuys F. (2008a) Equine sarcoids part 1 – clinical presentation and epidemiology. Vlaams Diergeneeskundig tijdschrift (77), pp. 2-9
Bogaert L., Martens A., Depoorter P., Gasthuys F. (2008b) Equine sarcoids part 3 – association with bovine papillomavirus. Vlaams Diergeneeskundig tijdschrift (78), pp. 131-137.
Bogaert, L., Van Poucke, M., Baere, C., Dewulf, J., Peelman, L., Ducatelle, R., Gasthuys, F., Martens, A. (2007) Bovine papillomavirs load and mRNA expression, cell proliferation and p53 expression in four clinical types of equine sarcoid. Journal of General Virology (88), pp. 2155-2161.
Bondinas, G.P., Moustakas, A.K., Papadopoulus, G.K. (2007) The spectrum of HLA-DQ and HLA-DR alleles, 2006: a listing correlating sequence and structure with function. Immunogenetics (59), pp. 539-553
Bowers, W. (2006) ‘Immunology — Chapter nine: Cells involved in immune responses’ [online] Microbiology and Immunology On-Line Textbook. USC School of Medicine. Available at: http://pathmicro.med.sc.edu/bowers/immune%20cells.htm [Accessed: 7 December 2012]
Brinkmeyer-Langford, CL, Cai, JJ., Gill, CA., Skow, LC. (2012) Microsatellite variation in the equine MHC. Animal Genetics [published ahead of printing] doi: 10.1111/age.12003
Brostöm H. (1995) Equine sarcoids. A clinical and epidemiological study in relation to equine leucocyte antigens. Acta Veterinaria Scandinavica (36), pp. 223-236.
Brostöm H., Fahlbrink E., Dubath M.-L., Lazary S. (1988) Association between Equine leucocyte antigens (ELA) and equine sarcoid tumors in the population of swedish halfbreds and some of their families. Veterinary Immunology and Immunopathology (19), pp. 215-223.
Byam-Cook, K. L., Henson, F. M. D., Slater, J. D. (2006) Treatment of periocular and non-ocular sarcoids in 18 horses by interstitial brachytherapy with iridium-192. Veterinary Record (159), pp. 337-341.
Campo M.S. (1997) Bovine papillomavirus and cancer. The veterinary journal (154) pp. 175-188. Carr E.A., Théon A.P., Madewell B.R., Griffey S.M., Hitchcock M.E. (2001a) Bovine papillomavirus DNA in
neoplastic and nonneoplastic tissues obtained from horses with and without sarcoids in the western United States. American Journal of Veterinary Research (62), pp. 741-744.
Carr E.A., Théon A.P., Madewell B.R., Hitchcock M.E., Schlegel R., Schiller J.T. (2001b) Expression of a transforming gene (E5) of bovine papillomavirus in sarcoids obtained from horses. American Journal of Veterinary Research (62), pp. 1212-1217.
Carstanjen B., Jordan, P., Lepage, O. M. (1997) Carbon dioxide laser as a surgical instrument for sarcoid therapy – A retrospective study on 60 cases. The Canadian Veterinary Journal (38), pp. 773 – 776.
Choi, N. M., Majumder, P., Boss, M. (2011) Regulation of major histocompatibility complex class II genes. Current Opinions in Immunology (23), pp. 81-87.
Christen-Clottu, O., Klocke, P., BurgerD., Straub, R., Gerber, V. (2010) Treatment of clinically diagnosed equine sarcoid with Mistletoe extract (Viscum album austriacus). Journal of Veterinary Internal Medicine. (24), pp. 1483–1489
29
Coggins, L.W., Ma, J.Q., Slater, A.A., Campo, M.S. (1985) Sequence homologies between bovine papillomavirus genomes mapped by a novel low-stringency heteroduplex method, Virology (143), pp. 603-611
De Queiroz, F. G. N., Matera, J. M., Dagli, M. L. Z. (2008). Clinical study of cryosurgery efficacy in the treatment of skin and subcutaneous tumors in dogs and cats. Veterinary Surgery. (37), pp. 438-443
Dzik, J. The ancestry and cumulative evolution of immune reactions (2010) Acta ABP Biochimica Polonica. (57), pp. 443–466
Eisen, J.A. Mechanic basis for microsatellite instability. In: Goldstein D.B., Schlötter C. (1999) Microsatellites evolution and applications. Oxford University press, New York.
Ellegren, H. (2004) Sequences with complex evolution. Nature Reviews: Genetics (5), pp. 435-445. Estoup, A., Cornuet, J.-M. Microsatellite evolution: inferences from population data. In: Goldstein D.B.,
Schlötter C. (1999) Microsatellites evolution and applications. Oxford University press, New York. FASS för allmänheten (2010a) Aldara, [online] Available at <
http://www.fass.se/LIF/produktfakta/artikel_produkt.jsp?NplID=19980918000010&DocTypeDo=7&UserTypeID=2#upp> [Accessed 26 February 2012].
FASS för förskrivare (2012) Asiclovir Sandoz. [online] Available at http://www.fass.se/LIF/produktfakta/artikel_produkt.jsp?NplID=20040607002339&DocTypeID=6 [Accessed 26 February 2012].
Foy J.M., Rashmir-Raven A.M., Brashier M.K. (2002) Common equine skin tumors. Equine Compendium (24), pp. 242-254.
Fraser, D. G. and Bailey, E. (1998) Polymorphism and multiple loci for the horse DQA gene. Immunogenetics (47), pp. 487-490.
Gaudieri, S., Dawkins, R. L., Habara, K., Kulski, J. K., Gojobori, T. (2000) SNP profile within the human major histocompatibility complex reveals an extreme and interrupted level of nucleotide diversity. Genome Research, (10), pp. 1579-1586
Glowatzki-Mullis, M. L., Muntwyler, J., Pfister, W., Marti, E., Rieder, S., Poncet, P. A., Gaillard, C. (2006) Genetic diversity among horse populations with a special focus on the Franches-Montagnes breed. Animal Genetics (37), pp. 33-39
Han, R., Breitburd, F., Marche, P. N., Orth, G. (1992) Linkage of regression and malignant conversion of rabbit viral papillomas to MHC class II genes. Nature (356), pp. 66-68.
Hancock, J.M. Microsatellites and other simple sequences: genomic context and mutational mechanisms. In: Goldstein D.B., Schlötter C. (1999) Microsatellites evolution and applications. Oxford University press, New York.
Haralambus, R., Burgstaller, J., Klukowska-Rötzler, J., Steinborn, R., Buchinger, S., Gerber, V., Brandt, S. (2010) Intralesional bovine papillomavirus DNA loads reflect severity of equine sarcoid disease. Equine Veterinary Journal (42), pp. 327-331.
Hartl, B., Hainisch, E. K., Shafti-Keramat, S., Kimbauer, R., Corteggio, A., Borzacchiello, G., Tober, R., Kainzbauer, C., Pratscher, B., Brandt, S. (2011) Inoculation of young horses with bovine papillomavirus type 1 virions leads to early infection of PBMCs prior to pseudo-sarcoid formation. Journal of General Virology (92), pp. 2437-2445.
Hedrick, P. W., Parker, K. M., Miller, E. L., Miller, P. S. (1998) Major histocompatibility complex vatiation in the endangered Prezwalski’s horse. Genetics (152), pp. 1701-1710.
Hill, A. V., Yates, S. N. R., Allsopp, C. E. M., Gupta, S., Gilbert, S. C., Lalvani, A., Aidoo, M., Davenport, M., Plebanski, M. (1994). Human leukocyte antigens and natural selection by malaria. Phil. Trans. R. Soc. London (346), pp. 379-385. In Meyer et al., 2001)
Himmler, A., Hauptmann, R., Adolf, GR., Swetly., P. (1986) Molecular cloning and expression inf Escherichia coli of equine type I interferons. DNA (5), pp. 345-356.
IARC (World Health Organization International Agency for Research on Cancer), (2007), Human Papillomaviruses. Vol. 90, Lyon; France.
Jandova, V., Klukowska-Rötzler, J., Dolf, G., Janda, J., Roosje, P., Marti, E., Koch, C., Gerber, V., Swineburne, J., (2012) Whole genome scan identifies several chromosomal regions linked to equine sarcoids. Schweizer Archiv für Tierheilkunde (254), pp. 19-25.
Jiang, H. and Chess, L. (2004) An integrated view of suppressor T cell subsets in immunoregulation. The journal of Clinical Investigation. (114), pp. 1199-1208.
Jensen, P. E., Weber, D. A., Thayer, W. P., Chen, X., Dao, C. T (1999) HLA-DM and the MHC Class II Antigen Presentation Pathway. Immunologic Research (20), pp. 195-205
Juras, R. and Cothran, E. G. (2004) Microsatellites in Lithuanian native horse breeds: usefulness for parentage testing. Biologija (4), pp. 6-9.
30
Kennedy, L.J., Modrell, A., Groves, P., Weit, Z., Single, R.M., Happ, G.M. (2010) Genetic diversity of the major histocompatibility complex class II in Alaskan caribou herds. International Journal of Immunogenetics (00), pp. 1-11.
Khansour, A. M., Conant, E. K., Juras, R., Cothran, E. G. (2012) Microsatellite analysis for parentage testing of the Arabian horse breed from Syria. Turkish Journal of Veterinary and Animal Sciences. DOI: 10.3906/vet-1104-8
Klein W.R. (1990). Immunotherapy in squamous-cell carcinomas in the bovine eye and equine sarcoids. Tijdschrift Voor Diergeneeskunde (115), pp. 1149-1155.
Klein, W. R., Bras, G. E., Misdorp, W., Steerenberg, P. A., de Jong, W. H., Tiesjema, R. H., Kersjes, A. W., Ruitenberg, E. J. (1986) Equine sarcoid: BCG immunotherapy compared to cryosurgery in a prospective randomised clinical trial. Cancer Immunological Immunotherapy (21), pp. 133-140.
Knottenbelt D., Edwards S., Daniel E. (1995) Diagnosis and treatment of the equine sarcoid. In Practice (17), pp. 123-129.
Knottenbelt, D. C. (2003) Basic principles of diagnosis and management of neoplasia in horses. Proceedings of the Annual Meeting of the Italian Association of Equine Veterinarians, Pisa, Italy 2003
Knottenbelt, D. C. and Kelly, D. F (2000) The diagnosis and treatment of periorbital sarcoid in the horse: 445 cases from 1974 to 1999. Veterinary Ophtamology (3), pp. 169-191.
Lai, Y. and Sun, F. (2003) The relationship between microsatellite slippage mutation rate and the number of repeat units. Molecular Biology Evolution (12), pp 2123-31.
Lazary, S Gerber, H., Glatt, P. A., Straub, R. (1985) Equine leukocyte antigens in sarcoid-affected horses. Equine Veterinary Journal (17), pp. 283-286.
Lúis, C., Juras, R., Oom, M. M., Cothran, E. G. (2007) Genetic diversity and relationships of Portuguese and other horse breeds based on protein and microsatellite loci variation. Animal Genetics, (38), pp. 20–27
Marais, H J., Nel, P., Bertschinger, H J., Schoerman, J P and Zimmerman, D. (2007) Prevalence and body distribution of sarcoids in South African Cappe mountain zebra (Equus zebra zebra). Journal of South African Veterinary Association (78), pp. 145-148.
Marchetti B., Ashrafi G.H., Tsirimonaki E., O'Brien P.M., Campo M.S. (2002) The bovine papillomavirus E5 retains MHC class I molecules in the Golgi apparatus and prevents their transport to the cell surface. Oncogene (21), pp.7808-7816.
Martens A., De Moor A., Ducatelle R. (2001a) PCR detection of bovine papilloma virus DNA in superficial swabs and scrapings from equine sarcoids. The Veterinary Journal (161), pp. 280-286.
Mattil-Fritz, S., Scharner, D., Piuko, K., Thones, N., Gissmann, L., Müller, H., Müller, M. (2008) Immunotherapy of equine sarcoid: dose-escalation trial for the use of chimeric papillomavirus-like particles. Journal of General Virology (89), pp. 138–147.
Meredith D., Elser A.H., Wolf B., Soma L.R., Donawick W.J., Lazary S. (1986) Equine leukocyte antigens: relationships with sarcoid tumors and laminitis in two pure breeds. Immunogenetics (23), pp. 221-225.
Metzgar, D., Bytof, J., Wills, C. (2000) Selection against frameshift mutations limits microsatellite expansions in coding DNA. Genome Research (10), pp. 72-80.
Meyer, D and Thomsom, G. (2001) How selection shapes variation of the human major histocompatibility complex: a review. Annual Human Genetics, No. 65.
Mihók, S., Posta, J., Kusza, Sz., Priskik, K. (2009) Genetic variability of Huzul horse breed families. 60th Annual Meeting of the EAAP. Session H19-30. 24-28 August in Barcelona. Spain.
Mohammed H.O., Rebhun W.C., Antczak D.F. (1992) Factors associated with the risk of developing sarcoid tumours in horses. Equine Veterinary Journal (24), pp. 165-168.
Morris, P., Shaman, J., Attaya, M., Amaya, M., Goodman, S., Bergman, C., Monaco, J. J., Mellins, E. (1994) An essential role for HLA-DM in antigen presentation by class II major histocompatibility molecules. Nature (368), pp. 551-554.
Naido, R. and Chetty, R. (1998) The application of microsatellites in molecular pathology. Pathology Oncology Research. (4), pp. 310-315.
Nasir L., Reid S.W.J. (1999) Bovine papillomaviral gene expression in equine sarcoids tumours. Virus Research (61), pp. 171-175.
National Institute of Allergy and Infectious Diseases (NIAID) (2011a) “Immune System – What is the immune system?” [online] Available at: <http://www.niaid.nih.gov/topics/immuneSystem/Pages/whatIsImmuneSystem.aspx> [Accessed 6 December, 2012]
National Institute of Allergy and Infectious Diseases (NIAID) (2011b) “Immune System – Mounting an immune response” [online] Availale at < http://www.niaid.nih.gov/topics/immuneSystem/Pages/response.aspx> [Accessed 6 December, 2012]
31
National Institute of Allergy and Infectious Diseases (NIAID) (2008) “Immune System –Complement system” [online] Availale at < http://www.niaid.nih.gov/topics/immuneSystem/Pages/response.aspx> [Accessed 6 December, 2012]
Olson C., Cook R.H. (1951). Cutaneous sarcoma-like lesions of the horse caused by the agent of bovine papilloma. Proceedings of the Society for Experimental Biology and Medicine (77), pp. 281-284.
Otten N., von Tscharner C., Lazary S., Antczak D.F., Gerber H. (1993) DNA of bovine papillomavirus type 1 and 2 in equine sarcoids: PCR detection and direct sequencing. Archives of Virology (132), pp. 121-131.
Park, J-S., Kim, E-J., Kwon, H-J., Hwang, E-S., Namkoong, S-E., Um, S-J. (2000) Inactivation of interferon regulatory Facor-1 Tumor Suppressor Protein by HPV E7 Oncoprotein. Journal of Biological Chemistry (275), pp. 6764-6769.
Pettersson, C., Broström, H., Bergvall, K. Topical Treatment of Equine Sarcoids. A clinical pilot study comparing AldarraTM and XxterraTM.
Ragland W.L., Spencer G.R. (1969). Attempts to relate bovine papilloma virus to the cause of equine sarcoids: equidae inoculated intradermally with bovine papilloma virus. American Journal of Veterinary Research (30), pp. 743- 752.
Raymond M. & Rousset F, 1995. GENEPOP (version 1.2): population genetics software for exact tests and ecumenicism. Journal of Heredity (86), pp. 248-249
Rousset, F., 2008. Genepop 2007: a complete reimplementation of the Genepop software for Windows and Linux. Molecular Ecology Resources (8) pp. 103-106.
Schlötterer, C. (2000) Evolutionary dynamics of microsatellite DNA. Chromosoma (109), pp. 365-371. Schurink, A., Wolc, A., Ducro, B. J., Frankena, K., Garrick, D. J., Dekkers., J. CM., Arendonk, J AM. (2012)
Genome-wide association study of insect bite hypersensitivity in two horse populations in the Netherlands. Genetics Selection Evolution (44), pp. 1-12.
Spurger, L. G. and Richardson, D. S. (2010) How pathogens drive genetic diversity: MHC, mechanisms and misunderstandings. Proceedings of the Royal Society (277), pp. 979-988.
Stadler, S., Kainzbauer, C., Haralambus, R., Brehm, W., Hainisch, E., Brandt, S. (2011) Successful treatment of equine sarcoids by topical aciclovir application. Veterinary Record (168), pp. 187.
Stewart, A. A., Rush, B., Davis, E. (2006) The efficacy of intratumoural 5-fluorouracil for the treatment of equine sarcoids. Australian Veterinary Journal (84), pp. 101-106.
Tallmadge, R., Lear, T. L., Antczak, D. F. (2005) Genomic characterization of MHC class I genes of the horse. Immunogenetics (57), pp. 763-774.
Tamzali, Y., Borde, L., Rols, M. P., Golzio, M., Lyazrhi, F., Teissie, J. (2012) Successful treatment of equine sarcoids with cisplatin electrochemotherapy: A retrospective study of 48 cases. Equine Veterinary Journal (44), pp. 214-220.
Tseng C.T., Miller D., Cassano J., Bailey E., Antczak D.F. (2010) Identification of equine major histocompatibility complex haplotypes using polymorphic microsatellites. Animal Genetics (41), pp. 150-153.
Uitenbroek, D. G. (1997) "SISA-Binomial" [online], Available at: <http://www.quantitativeskills.com/sisa/distributions/binomial.htm> [Accessed: 2012, October]
Xie, T., Rowen, L., Aguado, B., Ahearn, M. E., Madan, A., Qin, S., Campbell, D., Hood, L. (2003) Analysis of the gene-dense histocompatibility complex class III region and its comparison to mouse. Genome Research pp. 2621-2636.
Vandiedonck, C and Knight, J. C. (2009) The human major histocompatibility complex as a paradigm in genomics research. Brief Functional Genomic Proteomic. (8), pp. 379-394.
Zane, L., Bargelloni, L., Patarnello, T. (2002) Strategies for microsatellite isolation: a review. Molecular Ecology (11), pp. 1-16.
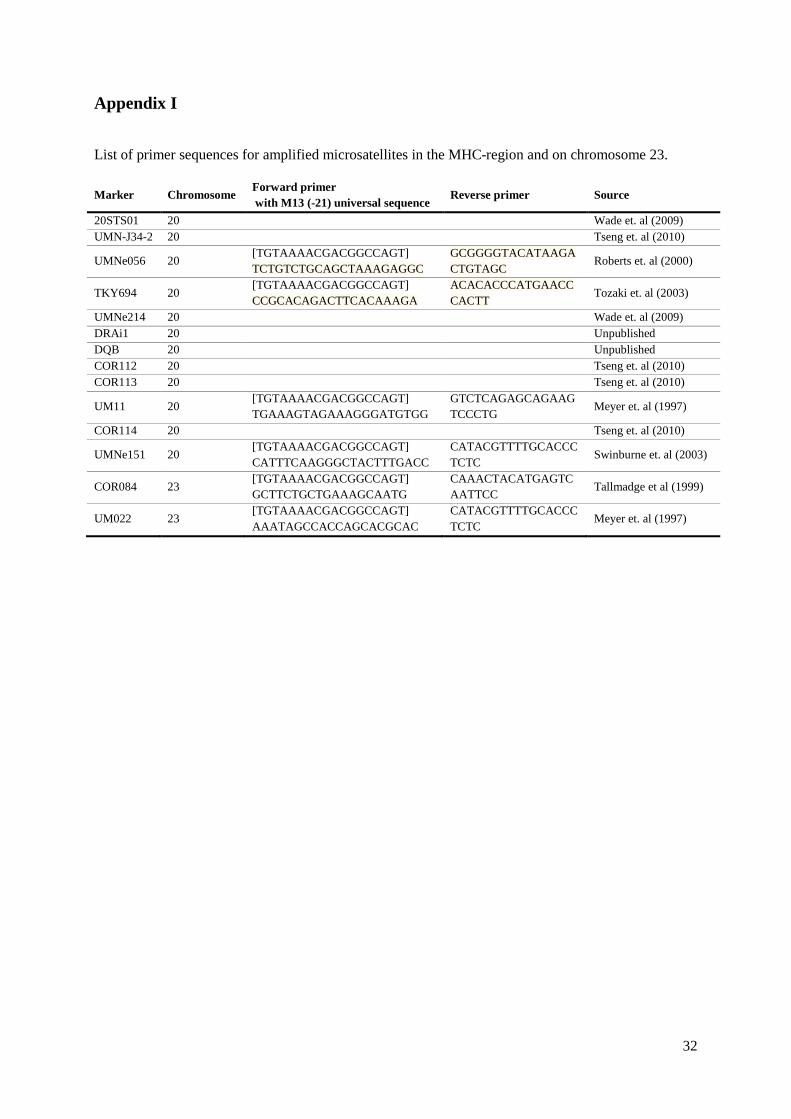
32
Appendix I List of primer sequences for amplified microsatellites in the MHC-region and on chromosome 23. Marker Chromosome Forward primer
with M13 (-21) universal sequence Reverse primer Source
20STS01 20 Wade et. al (2009) UMN-J34-2 20
Tseng et. al (2010)
UMNe056 20 [TGTAAAACGACGGCCAGT] TCTGTCTGCAGCTAAAGAGGC
GCGGGGTACATAAGACTGTAGC
Roberts et. al (2000)
TKY694 20 [TGTAAAACGACGGCCAGT] CCGCACAGACTTCACAAAGA
ACACACCCATGAACCCACTT Tozaki et. al (2003)
UMNe214 20
Wade et. al (2009) DRAi1 20
Unpublished
DQB 20
Unpublished COR112 20
Tseng et. al (2010)
COR113 20
Tseng et. al (2010)
UM11 20 [TGTAAAACGACGGCCAGT] TGAAAGTAGAAAGGGATGTGG
GTCTCAGAGCAGAAGTCCCTG Meyer et. al (1997)
COR114 20 Tseng et. al (2010)
UMNe151 20 [TGTAAAACGACGGCCAGT] CATTTCAAGGGCTACTTTGACC
CATACGTTTTGCACCCTCTC
Swinburne et. al (2003)
COR084 23 [TGTAAAACGACGGCCAGT] GCTTCTGCTGAAAGCAATG
CAAACTACATGAGTCAATTCC Tallmadge et al (1999)
UM022 23 [TGTAAAACGACGGCCAGT] AAATAGCCACCAGCACGCAC
CATACGTTTTGCACCCTCTC
Meyer et. al (1997)