Embed Size (px)
Citation preview
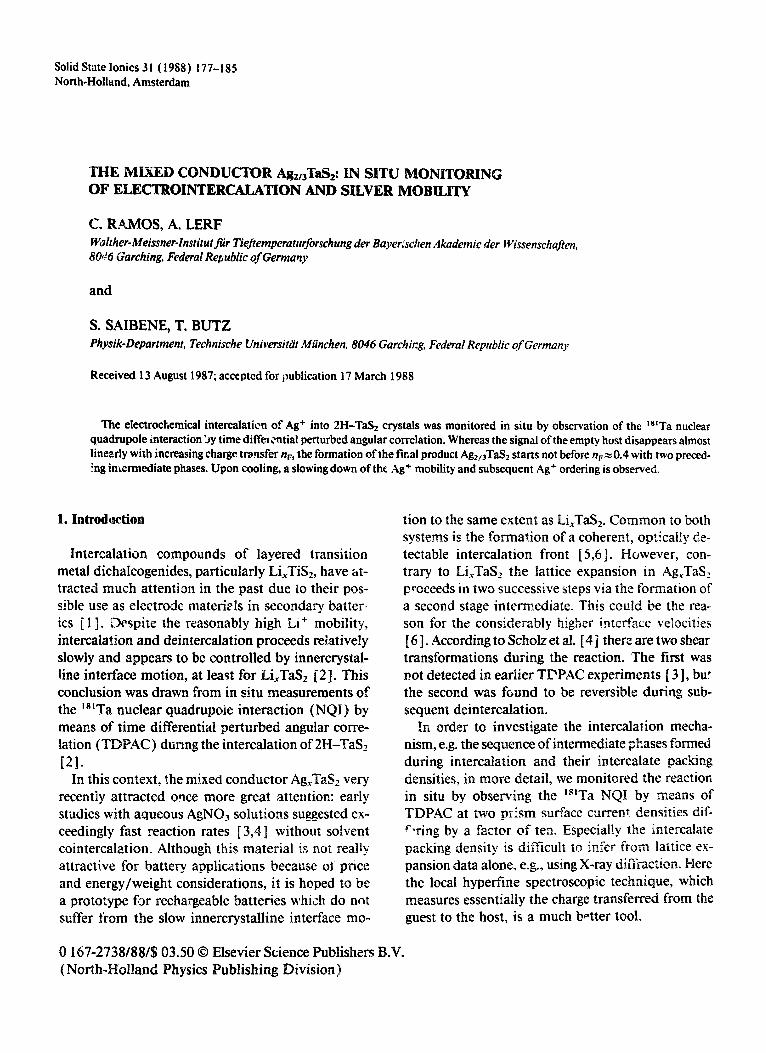
Solid State Ionics 3 1 ( 1988) 177-l 85 North-Holland, Amsterdam
THE MIXED CONDUCTOR Ag2,JaS2: IN SITU MONITORIN OF ELECTROINTERCALATION AND SILVER MOBILITY
C. RAMOS, A. LERF Wulther-Meissner-Institut filr Tieftemperaturforschung der Bayerxhen Akademie der Wissenschqfien, 80(!6 Garching, Federal Republic of Germany
and
S. SAIBENE, T. BUT2 Physik-Department, Technische Universitdit Miinchen, 8046 Garchirzg, Federal Republic of Germany
Received 13 August 1987; accepted for publication 17 March 1988
The electrochemical intercalaticn of Ag+ into 2H-TaSz crystals was monitored in situ by observation of the ‘*ITa nuclear quadrupole Interaction 5y time differ ;ntial perturbed angular correlation. Whereas the signal of the empty host disappears almost linearly with increasing charge trarlsfer nF, the formation of the fkal product Agz13TaS2 starts not before nF= 0.4 with two preced- ing imermediate phases. Upon cooling, a slowing down of the Xg+ mobility and subsequent Ag+ ordering is observed.
1. Introduction
Intercalation compounds of layered transition metal dichalcogenides, particularly Li,Ti$, have at- tracted much attention in the past due to their pos- sible use as c1ectrorjl.e materizls in secondary batter- its [ 11. Despite the reasonably high I.9 mobility, intercalation and deintercalation proceeds relatively slowly and appears to be controlled by innercrystal- line intesface motion, at least for Li,Ta& [2 1. This conclusion was drawn from in situ measurements of the 18’Ta nuclear quadrupole interaction (NQI) by means of time differential perturbed angular corre- lation (TDFAC) dunng the intercalation of 2I-I-TaS2
LQ In this context, the mixed conductor Ag,TaS, very
recently attracted once more great attention: early studies with aqueous AgN& solutions su_sested ex- ceedingly fast reaction rates [3,4] without solvent cointercalation. Although this material is not really attractive for battery applications because ot price and energy/weight considerations, it is hoped to be a prototype fk rechargeable batteries which do not suffer from the slow innercrystalline interface mo-
tion to the same extent as Li,VTaSz. Common to both systems is the forma?ion of a coherent, optically de- tectable intercalation front [ 5,6 1. owever, con- trary to Li,Ta& the lattice expansion in Ag,TaS,! proceeds in two successive steps via the formation of a second stage inte ediate. This could be the rea- son for thr: considerably higher ir??ctiace velocities [ 6 1. According to Scholz et al. [ 4 j therz are two shear transformations during the reaction. The first was not detected in earlier TPPAC experiments [ 3 3, but the second was found to be reversible during sub- sequent deintercalation.
In order to investigate the intercalation mecha- nism, e.g. the sequence of intermediate phases formed during intercalation and their intercalate packing densities, in more detail, we monitored t in situ by observing the 18’Ta NQI by means of TDPAC at two plis surface current densities ciif-
Especial intercalate It to infe lattice ex-
pansion data alone, e.g., using X-ray JiKiXP,iCXL
the local hypefine measures essentially guest to the host, is a much better tool.
0 16 (No
178 C Ramos et al. 1 The mixed conductor .Ag2,3Ta.3
First experiments at temperatures between 10 and 300 K were performed in order to determine the “melting point’” of the 2-dimensional Ag+-layer via the breakdown of the motional averaged “‘Ta NQI signal and in order to search for Ag+-superlattice formation, as reported by Scholz et al. [ 71 and We- gers et al. 183.
2. TDPAC and NQI
TDFAC uses a nucleus in an excited state which decays via the successive emission of two yqrlanta. Due to the conservation of angular momentum, there is a correlation between the magnitude and orien- tation of the nuclear spin in the highest excited state ( = start level), the multipolarity and emission di- rection of the emitted y-quantum ( =yI ), and the magnitude and orientation cf the nuclear spin in the intermediate excited state.
The same holds true for the intermediate state, y2, and the lowest state ( = stop level). Consequently, there is an angular correlation between the emission direction of yI and y2, even in the case of vando+ oriented spins, where the individual emissic.1 prob- abilities average out to an isotropic pattern. This an- gular correlatibn ca!n be written (for random powder samples) [9 1:
W(8)- I +AzPz(cos 0)+... . C!)
Here, 0 is the angle between yi and y2 ( =angle be- tween both detectors), P2 (cos 0) is a Legendre po- lynomial, and A2 denotes the anisotropy. The latter quantity depends on nuclear decay properties only.
er order terms, e.g. A4P4( cos @) can usually be cted. If the nucleus remains in the intermediate
state for a certain lifetime rN we obtain a time-de- pendent coincidence count rate:
(@J)- exp(-t/~~)[1+A2~~(cos6)3. 9)
Whik b&g in the iniermediaie excited state this
elation can be perturbed by extranuclear e interaction of the nuclear magnetic di-
Pore moment with magnetic fields (vector) or via the nuclear quadrupole moment eQ with electric field
ents eq (tensor). The perturbation “modu- the angular correlation and is accounted for in
rbaticln ~~~cti~~ G2 (t ):
W(8, t) - exp( -t/TN) [ 1 +A2G2(t)f’&m O)] l
(3)
~a the case of a static axially symmetric electric field gradient we have for I= 5/2 (this is the case for the 133-482 keV cascade in lglTa):
3
G2(t)= c an cos no&, n-0
where ao=0.2, aI =0.371, a2=0.286, a3=0.143 and oo= 3e2qQ/20. Our setup consists of four detectors with XP202OQ photomultipliers and BaF2 scintil- lators (or RCA8850 with Na.J (Tl)) arranged in a plane at 90” intervals.
Further details of the spectrometer are described in. ref. [ lo]. With each detector accepting both yI (start) and y2 (stop), we record simultaneously eight spectra out of the possible twelve detector com- binations. By forming the ratio
+2(w14w41w23w32)"41-' 9 (5)
where wii denotes the background corrected coinci- dence count rate between detector i (y, ) and detec- tor j (y2), we obtain directly the quantity A2G2(f).
In the present experiment we used a stack of single crystals of 2%TaS2 with the c axis ( =quantization axis) aligned perpendicular to the detector plans (the a, 8, axes were randomly oriented). In this geometry the perturbation function of eq. (4) reduces to a sin- gle cosine of the fundamental frequency o. (includ- ing a time-independent contribution ).
Hence, the Fourier transformed perturbation function shows (apart from a peak at o = 0 ) a single peak as long as all Ta atoms are subjected to the same electric field gradient. Thrs is expected to be ;he case for the empty host material (by symmetry) and for a rapidly dirTusing intercaiate ion like e.g. Ag+. Mere, the inequivalent Ta sites, observable only for a fro- zen-in configuration at low temperature, are mo- lionally averaged. rice, a single peak corresponds to a single phase, reas e.g. two peaks indicate a two-phase region. For complete motic * ;l averaging we observe the instrumental linewidth ( h, 70 Mrad/ S ), while incomplete motional averaging or
C. Ramos et al. / The mixed conductor Ag2,3Ta::, 179
intercalate concentration gradients lead to line broadening.
3. Experimental
3.1. Preparation of 2H-TaSz
2H-TaS2 samples were prepared by an iodine va- p’3ur transport reaction from 99.95% pure Ta foils of 15 pm thickness and 99.999% pure sulfur. The sealed quartz ampoule was first heated up to 900°C with a temperature gradient over the ampoule ol about 1OOOC. The ampoule was subsequently annealed at 800°C, 600°C and 500°C. The samples were doped with 200 ppm neutron irradiated hafnium metal (in order to produce ‘*‘Hf ) during crystal growth. ‘*‘Hf
CC,2 = 42 d) feeds the 133-482 keV y-y-cascade in ‘*ITa via B-decay. This cascade was utilized for the TDPAC measurements.
The quality of our 2H-TaS2 crystals was checked by X-ray diffraction, resistivity measurements, and by the TDPAC suectra themselves. A discrete fre- quency of ~=8?0 Mrad/s without any frequency distribution is considered a stringent criterion for high quality 2H-TaS2; any admixture of other po- lytypes leads to ti low frequency shoulder superim- posed onto the s> mmetric 2H-TaSz line [ 1 I, 12 1.
3.2. Electro~herm’cul intercalation
We used 0.1 M AgN03 in dry acetonitrile ( N 10 ppm H2Q) as elecrrolyte because the intercalation of silver from aqueous AgN03 solutions leads to mas- sive self-intercalation, even for an open circuit [ 3 3,
with a maximum stoichiometry of XN l/3. Crystals of 2H-TaSz were used as cathode, Pt as
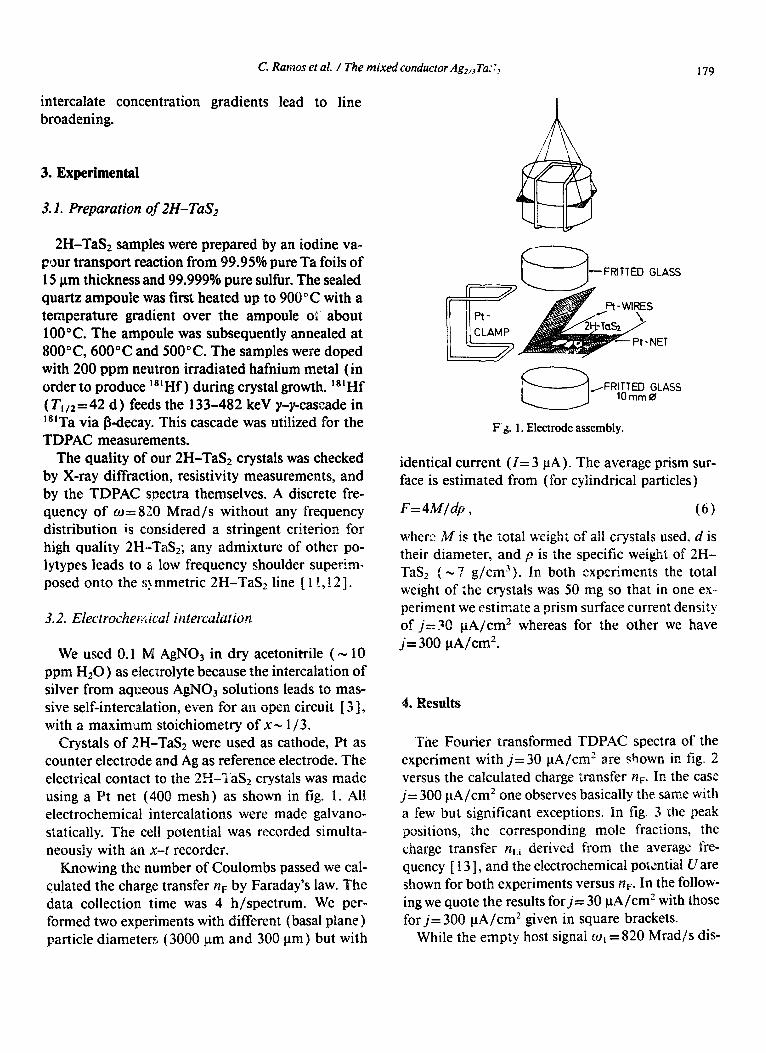
counter electrode and Ag as reference electrode. The electrical contact to the 25’Las2 crystals was made using a Pt net (400 mesh) as shown in fig. I. All electrochemical intercalations were made galvano- statically. The cell potential was recorded simulta- neously with an x-l recorder.
Knowing the number of Coulombs passed we cal- culated the charge transfer nF by Faraday’s law. The data collection time was 4 h/spectrum. We per- formed two experiments with different (basal plane) particle diameters (3000 .urn and 300 pm) but with
- FRITTED GLASS
F’g. 1. Electrode assembly.
identical current (I= 3 PA). The average prism sur- face is estimated from (for cylindrical particles)
where M is the total weight of all ciiystals used, d is their diameter, and c is the specific weight of 2I-G TaS2 (-3 n both experiments the total weight of the crystals was 50 mg so that in one ex- periment we estimate a prism surface current density of j=GO PA/cm2 whereas for the other we have j= 300 pA/cm2.
4. Results
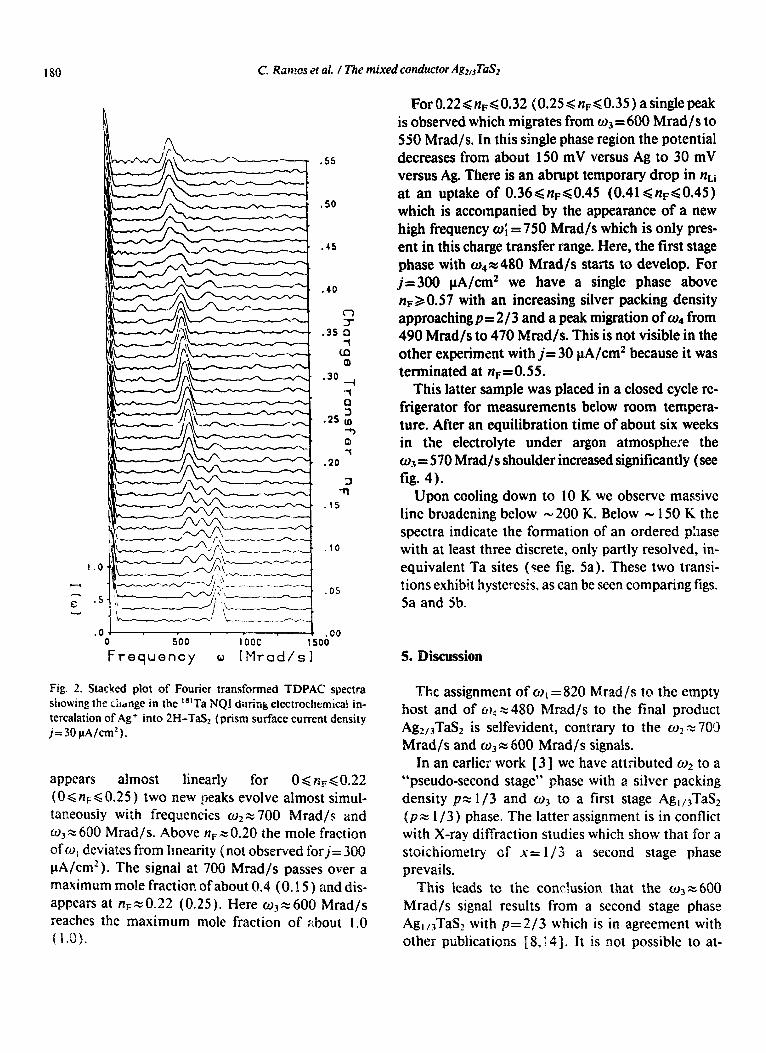
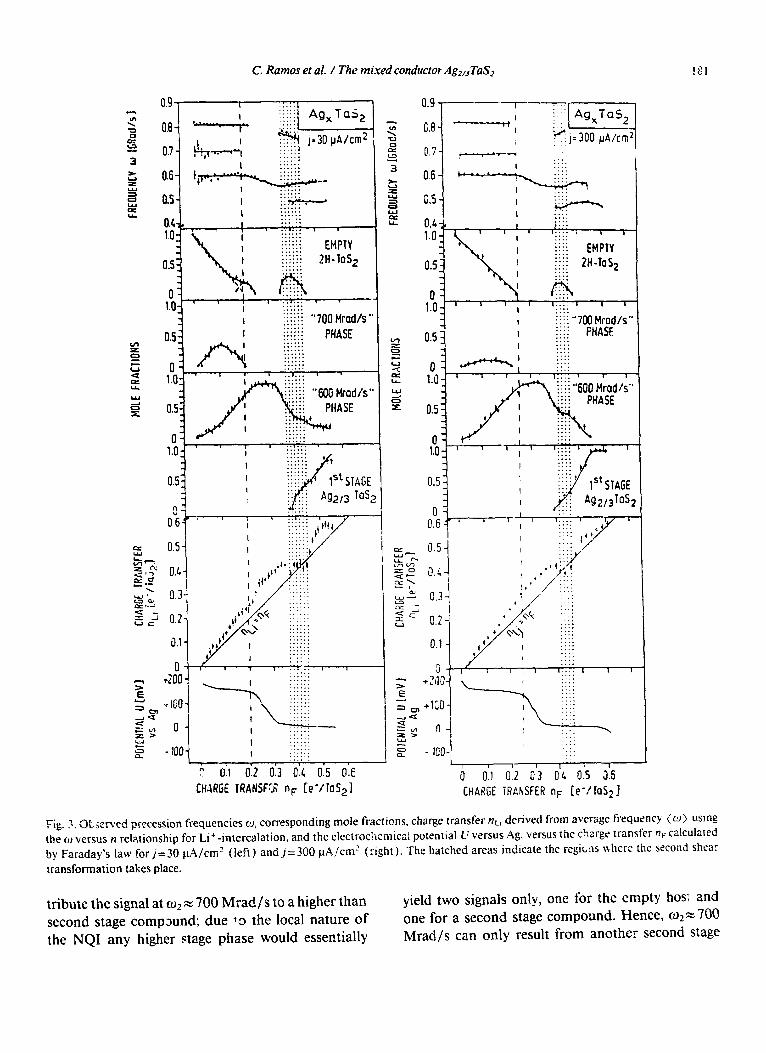
The Fourier transformed TDPAC spectra of the experiment with j=30 CIA/cm2 are shown in fig. 2 versus the calculated charge transfer &. In the case j= 300 pA/cm’ one observes basically the same with a few but significant excepti0r.s. In fig. 3 zhe peak positions, the corresponding mole fractions, the charge transfer nLi derived from the average fre- quency [ 13 1, and the electrochemical poltntial U are shown for both experiments versus &. In the follow- ing we quote the results for j= 30 PA/cm2 with those for j= 300 PA/cm2 given in square brackets.
While the empty host signal ml = 820 Mrad/s dis-
180 C. Rm~s et ai. / The mixed conductor Ag2,3TaS2
.55
-50
.45
.05
01 c .oo 0 500 1 ooc 1500
Frequency o [Mradhl
Fig. 2. Stacked plot of Fourier transformed TDPAC spectra showing the change in the “ITa NQI dutink electrochcmicak in- tercalation of Ag+ into 2H-TaS2 (prism surface current density j= 30 PA/cm’).
appears almost linearly for 06&60.22 (0 d nF< 0.25 ) two new ljeaks evolve almost simul- raneousiy with frequencies m2 x 300
rad/s. Above n+O.20 the mole fraction ofc~, deviates from linearity f not observed forj= 300 PA/cm2 ). The signa.! at 700 Wad/s passes over a maximum mole fraction of about 0.4 (0.15 ) and dis- appears at n +0.22 (0.25). Here cl)+ 600 Wad/s reaches the maximum mole fraction of about I.0 (1.0).
ForO.22<+<0.32 (0.25<n,<O.35) asinglepeak is observed which migrates from o3 = 600 Mrad/s to 550 Mrad/s. Tn. this single phase region the potential decreases from about 150 mV versus Ag to 30 mV versus Ag. There is an abrupt temporary drop in nt,i at an uptake of 0.36~1~~~0.45 (0.41~n~d0.45) which is accompanied by the appearance of a new high frequency o; = 750 Mrad/s which is only pres- ent in this charge transfer range. Here, the first stage phase with 04- - 480 Mrad/s starts to develop. For jz300 PA/cm2 we have a single phase above n+ 0.57 with an increasing silver packing density approaching p= 2/3 and a peak migration of o4 from 490 Mrad/s to 470 Mrad/s. This is not visible in the other experiment with j= 30 PA/cm2 because it was terminated at nF= 0.5 5.
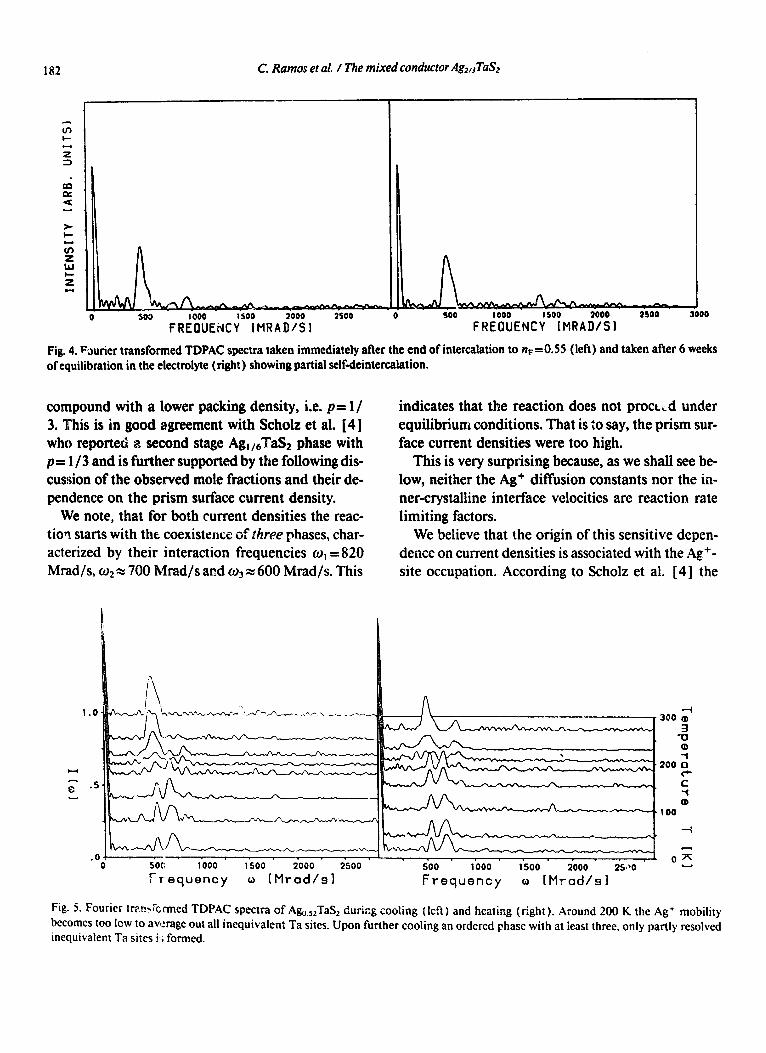
This latter sample was placed in a closed cycle re- frigerator for measurements below room tempera- ture. After an equilibration time of about six weeks in the electrolyte under argon atmosphere the o+ = 570 Mrad/s shoulder increased significantly (see fig. 4).
Upon cooling down to 10 K we observe massive line broadening below - 200 K. Below - 150 K the spectra indicate the formation of an ordered phase with at least three discrete, only partly resolved, in- equivalent Ta sites (tee fig. 5a). These two transi- tions exhibit hysteresis, as can be seen comparing figs. 5a and Sb.
The assignment of o I =820 Mrad/s to the empty host and of cr) 4 2 480 h&ad/s to the final product Ag2,,TaS2 is selfevident, contrary to the ~0~ ~70’3 Mrad/s and ct) 3x 600 Mrad/s signals.
In an earlier work [ 3 ] we have attributed ~0~ to a “pseudo-second stage” phase with a silver packing density pz l/3 and ~0~ to a first stage Ag,,,TaS, (pz l/3) phase. The latter assignment is in conflict with X-ray diffraction studies which show that for a stoichiometry of x’= I /3 a second stage phase prevails.
This leads to the conr!usion that the a3= 600 rad/s signal results from a second stage phase
Ag, ,3TaS2 with p=2/3 which is in agreement with other publications [S, 143. It is not possible to at-
C. Ramos et al. I The mixed conductor Ag,,3TaS2
0.7 - . . . . . . . . . . . . ..a...
0.6- . . . . . . $6 . . . . . . . . . . . . * _-
I . . .
.*....
OS- . . . . . .
I . . . . . . . . . . . .
\ . . . . . . I .a.... ..* . . .*.... 1 . * . . . . ‘ 1 . . . . . . . . . . . . . . . . . . . . . . . . .,.... EMPTY . . . . . .
i.iiii 2H4OS~ . . . . . . . . . . . . *. . . . . . . . . .
A . . . . . . . . . . . . . . . . . . . .
..I... I 1 . . . . . . ..a...
1 ii+’ . . . . . . . . . . . . . . . . . I
.
4f . . . . .
+i’l Qq
. . . . . .
. . . .
/
oi c-;
:., .:
. . . . . .
/
;:;;;I
. . . . . . . . . . . .
I
0) I
. . . . . . . . . . . . . . . . . . . . . . . . . .* .
? o:r 0.2 0.3 0.1. 0.5 0.E
CHARGE TRANSfYR I+ le’/ToS21
i
I . . . .
0.6 . . . . . . . . . + --- a~ . . . .
I 1. . ..* 0.5 . . . .
I I
. -.. . . . .
.h..
. . . .
. . .
’ ’ . . . . ’ ’ ’ . . . . . . . . ii;; EMPTY ii;; 2H-TOS, . . . . . . . . . . . . . .
fi . . . . . . . . . . . ’ ’ ’ ’ ’ ’ ’ . . .
I . . . . . . . . I !:I. “700 Nod/s”
0.5 . . . .
I . . . . . . . . . , I . .
0.1, .‘1. t J . . _. . . . . . . .: . , *
. . . . . . . . . . . . . . . . . . . . . . . . . . . . . . . . . .
. . . .
h-l-l I I:::: I 1
0 0.1 0.2 L13 0 G 0.5 3.6
CHARGE TRANSFER no [e’/VaS2 1
Fig. 3.OtjeB\‘ed precession frequencies u, corresponding mole fractions, charge transfer nL, derived from average frequency (w) usmg the cc) versus n relationship for Li+- intercalation, and the electrochemical potential L’ versus Ag. versus the charge transfer + calculated by Faraday’s law for j=30 pA/cm’ (left) andj=300 @I/cm’ (right). The hatched areas indicate the regicns where the second shear
transformation takes place.
tribute the signal at CL)~ x 700 Mrad/s to a higher than second stage compxnd; due 30 the local nature of the NQI any higher stage phase would essentially
yield two signals only, one for the empty hosi an one for a second stage compound. Hence, 02”- 700 Mrad/s can only result from another second stage
182 C. Ramos et al. / The mixed conductor Ag2,jTaS2
0 303 lQO0 is00 2000 2300 0 300 1000 1300 2000 2300 3000
FREOUEidCY [MRADISI FREOUENCY [MRADISI
Fig. 4. Fourier transformed TDPAC spectra taken immediately after the end of intercalation to nF- -0.55 (left) and taken after 6 weeks
of equilibration in the electrolyte (right) showing partial selfdeintercalation.
compound with a lower packing density, i.e. p= I/ 3. This is in good agreement with Scholz et al. [4] who reported a second stage Ag,,,‘Fa& phase with p= l/3 and is further supported by the following dis- cussion of the observed mole fractions and their de- pendence on the prism surface current density.
We note, that for both current densities the reac- tioq starts with the coexistence of three phases, char- acterized by their interaction frequencies CI)~ = 820 Mrad/s, ~0~ z 700 Mrad/s and o3 x 600 Mrad/s. This
I.0 L.Y’-‘_J-...-d . ,-_-. , _ ._ __ -.___
w
g- .s Y
SOC! 1000 1500 2000 2500
Frequency o [Mradhl
indicates that the reaction does not proct,d under equilibrium conditions. That is to say, the prism sur- face current densities were too high.
This is very surprising because, as we shall see be- low, neither the Ag+ diffusion constants nor the in- ner-crystalline interface velocities are reaction rate limiting factors.
We believe that the origin of this sensitive depen- dence on current densities is associated with the A@- site occupation. According to Scholz et al. [4] the
uvu+ 0;
500 1000 1500 2000 25~~0
Frequency o [Msad/sl
Fig. 5. Rwier transknned TDPAC spectra of Ag,,,Ta!$ during cooling (left) and heating (right). Around 200 K the Ag+ mobility becomes too low to average out all inequivalent Ta sites. Upon further cooling an ordered phase with at least three, only partly resolved inequivalent Ta sites i*; formed.
C. Ramos et al. / The mixed conductor Ag2,3T&2 183
Ag+ ions reside on octrahedral sites at low uptakes, while they switch over to tetrahedral sites for higher uptakes. Thus we tentatively associate the CL)~ x 700 Mrad/s phase with low packing density (p= I /3) with Ag4 on the octahedral sites and the o+ 600 Mrad/s phase with higher packing density ip= l/2) with Ag+ on tetrahedral sites. I
Both phases must be energ&&ly almost equiv- alent. On the one hand the Coulomb repulsion is smaller for low packing densities, on the other hand Ag+ usually prefers the tetrahedral coordination. It is this near degeneracy of site occupation associated with different packing densities which requires ex- tremely low current densities in order to avoid the formation of three coexisting phases.
Both experiments show a linear decrease (the de- viation from linearity at about fiFz 0.2 for& 30 PA/ cm2 will be discussed later) of the empty host signal.
Assuming a concentric cylinder model this implies r/R= (1 -t/T)=, where r is the unreacted cylinder radius, R is the crystal radius, and T is the time re- quired to reach the crystal center. Consequently, the reaction front velocity increases with time according to v=(Lt/T)- ‘%?/2T. It is interesting to quote the initial velocities: v( t=O) w 0.5 rim/s (5 nm/s). Both values are several orders of magnitude smaller than the maximum values quoted by Scholz et al. [ 61 for short-circuited cells. Hence, the interface velocity practically never reaches this maximum and the for- mal divergence as t approaches T is of no importance.
It should be mentioned, however, that Scholz et al. did not observe the empty/second stage p= l/3 in- terface but rather the empty/second stage p= 2/3 and the second stage p=2/3/first stage p=Z!S inter- faces. Thus it is not clear at present whether a co- herent reaction front empty/second stage p= l/3 ex- ists at all. Nevertheless, the reaction time T did not increase with increasing current densityj, but rather decreased slightly. The second stage phase with high packing density ( CC)~) grows consecutively on top of thPcPpn-\nJ stpop nhocotxdth ?nrrrnarrlArrnAnn~~+~~ Ix-* \ -1.1 ""IV.._ CU&Vy.luok .,l~ll~".. &JUuu‘1~U'C.1131LJ \w2/.
This is obvious from the fact that the maximum mole fraction of the W? phacre depends strongly on the cur- rent density used: the higher the current density, the faster the growth of the ~2)~ phase and the lower the maximum mole fraction of the o2 phase.
There is a single phase range from nF=0.22 to
rt,=0.32 for j= 30 PA/cm’ and from nF=0.25 to
&=0.35 for j=300 @/cm2 with a characteristic peak migration from ~=600 MradJs to CC)= 550 Mrad/s. This indicates the monotoncus increase the packilig density in this second stage phase wit
a maximum of p = 2/3 at the end of this range for
&=0*32 and nF= 0.35, ~SpCCtiVely. This single phase region was not detectable in the measurements of the open circuit voltages of Scholz et al. 141. The
existence of this single phase region is directly iit- ferred from the observation of one frequency only with its associated peak migratiou. This is much more reliable than the electrochemical potential, espe- cially if one tries to discriminate between a “rounded off step” and a “linear decrease”. It appears that the build-up of ?hc first stage is postponed as much as possible until the second stage phase has reached a maximum packing density. This is in sharp contrast to all our previous observations on other intercala- tion compounds, e.g. Li,TaS2 or M,( H20),,TaS2 [ 2,13,15-l 7 1. The onset of the first stage phase for- mation is accompanied with an abrupt, temporary drop of nLi, which is correlated to the earance of a new high frequency (0; = 750 Mra ). This ef-
red to be due to a shear transformation TaS2 to the 2H-MO& structure which
was inferred by Scholz et al. [J ]i from X-ray dif- fraction studi 3s to occur at uptakes of & -0.5.
This shear transformation has a considerable width and is founcl to be much smaller for j= 300 PA/cm’ (0.41 <?2,<0.46) than for j:=30
< nF< 0.45 ), opposite to a naive expectation. How- ever, it is in agreement with the observation, that the upward peak migration of o3 and CL)~ after comple- tion of the shear transformaticn is visible for j= 300 PA/cm’ only, indicating a partial relief of the system via the lowering of the packing density.
Scholz et al. [4] reported another shear transfor- mation at about 0.26 <x< 0.36 which is possibly vis- ible in the experiment with j= 30 PA/cm’ in the fom of a small step in nL, and a deviation from linea
.
in fig. 3 by dashed lines. It appears that the transformation from the 2H-TaS? to the 2H-Mo!$ structure proceeds in two steps. At present we do not understand the de- tails observed during these shear transformations. E.g. why does the second shear transformation lead
184 C. Ramos et al. / The mixed conductor Agz,3TaS2
to much more pronounced features in the spectra than the first?
Due to the non-equilibrium conditions of our measuremen\, we expect small differences in the shear transformation intervals compared to the open circuit equilibrium data of [ 41, as is indeed the case.
There is an overall discrepancy of about 20% be- tween OLi and the calculated charge transfer nF which can be attributed to different occupied lattice sites of silver and lithium, respectively. The agreement be- tween nLi and flF was much better in a preViOuS ex- periment [ 31, which, however, used a different elec- trode assembly with large gold pistons. Therefore this agreement was possibly fortuitous.
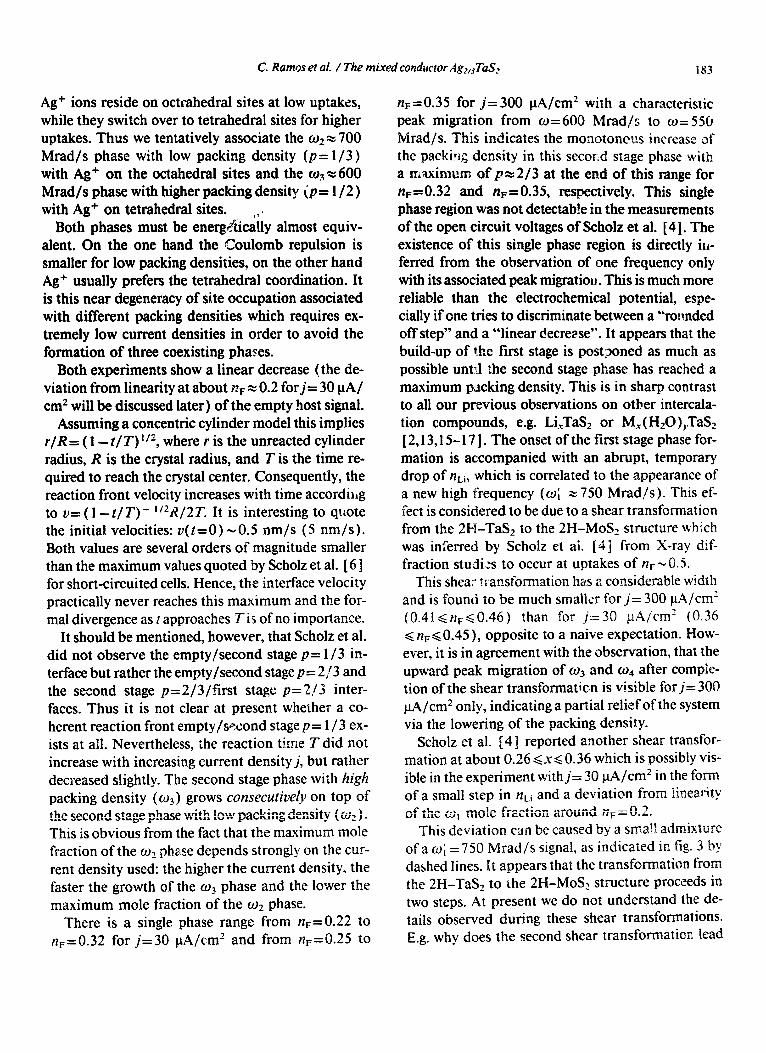
Fig. 6 summarizes the intercalation process sche- matically. Wiegers et al. [ 81 reported diffusion con- stants for second stage AgI,JTaS2 of D= lo-’ cm2/ s, whereas D= 1O-5 cm2/s for first stage Ag2,,TaS2. On the contrary, we observe instrumental linewidths throughout the reaction until the onset of the first stage formation. This indicates high silver mobility in the second stage phase, leading to motional av- eraging of inequivalent Ta sites, whereas the in- creased linewidth for the first stage phase calls for a lower mobility. We believe that diffusion constants extracted from electrochemical/equilibration stud- ies in two-phase samples are not very reliable. Re- cently, we observed the “‘Ta Mijssbauer effect in A&I,sTaSz at 300 K with the same linewidth as the empty host material [ 18 ]. This is an even more stringent proof for the high silver mobility. It is not clear at present how this result and the observation of superlattice reflexions at 300 K [ 71 can be rec- onciled. Since the silver deposition becomes a com- petitive reaction to intercalation as soon as the Ag,TaS, potential versus Ag reaches zero we ob- tained a maximum uptake of nF-0.62 only.
To prevent the silver deposition we stopped the experiment with j=30 PA/cm2 at flFzO.55. The ob- servation of a shoulder at u3=570 Mrad/s after six
weeks of equilibratiolr can be attributed to self-dein- terca!ation (see fig. 4). Thus Ag_,TaS2 with maxi- mum uptake has a limited stability.
At present, we hesitate to give a more detailed dis- cussion of the data obtained at lower temperatures. We observed dramatic differences between samples with x=0.53 and x=0.62 belo,w m 150 K, which is completely unexpected. Here, further work with a
crystalcenter pr I f-6”: surf ace
Q-~-ooo~o- 0 0 0
1 o-mmdoooo - u--v --
I emp~y-k- -2nd stage p:‘13-&2%~age ,‘/,-I
I
0 < nF< ‘/L
I I
0000000000000000000000Q
000000000000000000000~
0000000000000c2~00000000
~OOOQ.O_QOOOOOOOOOOOOoOo 000000m3000000000000000 I I I zrd stage I
‘l2C pc 213 I I ‘4 < “F( ‘13 I I I
I r-fistage P=~/:,
I
I -----&P stage ~=~l~------l
I I
‘13 < nF( 2i3 I
I I
Fig. 6. Schematic cross-section through a crystal during interca- lation of Ag+: (top) cocxistemce ofempty host, second stage with low packing density, and second stage with high packing density characteristic for the beginning of the reaction; (middle) contin- uous increase of packing density in the single phase range; (bot- tom ) coexistence of second and first stage with high packing den- sities towards the end of the reaction.
wider range of concentrations is necessary. However, common to both sets of data is the breakdown of the motional averaging around 200 K. Here, we estimate the mean residence time for a Ag+ to be of the order of 5 ns. The relatively abrupt onset of line broad- ening indicates a high activation enthalpy for the sil- ver jumps. Unfortunately, our present data do not allow to extract a reliable value for this enthalpy. in any case, at 300 K the silver ions must have an ex- ceedingly high mobility. This is in agreement with our observation, that the chemical self-intercalation +f 2H-TaS? single crystals in an aqueous electrolyte
C. Ramos et al. / The mixed conductor Ag2NTaS2 IS5
proceeds extremely rapidly. The fact that below m 150 K new, discrete peaks show up, agrees with the ex- pectation for silver-ordering, as discussed by Scholz et al. [7].
6.Summ~
T’le mixed conductor Ag,Ta& is a very interesting intercalation system for various reasons:
(a) It starts with the formation of a second stage phase with low packing density and avoids the for- mation of a first stage phase as long as possible;
(b) The Ag+ ions are highly mobile and neither diffusion constants nor inner-crystalline interface velocities are reaction-rate limiting factors. This is no longer true for exceedingly high current densities, where the empty 2H-TaSz coexists with the second stage and first stage phases, as described by Frindt P91;
(c) Due to the possibility to occupy both the oc- tahedral and tetrahedral sites there are two second stage phases aifferin;, in packing density, a phenom- enon not observed in other intercalation compounds;
(d) There are possibly two shear transformations during the course of intercalation. It is not clear at present what drives these transformations.
While items (a)-(c) are in favour for considering Ag,TaS, a prototype for rechargeable batteries which can stand high charge/discharge current densities. item (d) is likely to be a rather cumbersome feature as far as frequent cycling is concerned.
Acknowledgement
We are grateful to Professors . b-d-es and G-M. Kalvius for their conlinuous interest and support. This work was funded by the Ger,man Federal Min-
istry of Research and Technology ( BMFT ) u--\der the
contract number 03-KAlTUh/f-4 and by the Deutsche Forschungsgemeinschaft.
References
[ 1 J M.S. Whittingham, Prog. Solid State Chem. 12 ( 1978 1 I : J.B. Boyce, L.C. De Jonghe and R.A. Huggins, eds., Sohd state ionics-85 (North-Holland, Amsterdam. 1985 ); C.A.C. Sequeira and A. Hooper, eds., Solid state batteries (Nijhoff, Dordrecht, The Netherlands, 1985 ).
[2] T. Butz, A. Lerf and J.O. Besenhard, Rev. Chim. Min. 21 (1984) 556.
[ 31 T. Butz, A. Let-f, H. Hiibler, H. Gierisch, S. Saibene and J.O. Besenhard, Hyperfine Interact. 1 5/ 16 ( 1983 ) 925.
[4 1 G.A Scholz and R.F. Frindt, J. Electrochem. Sot. 13 1 ( 1984 ) 1763.
[ 51 R.R. Chianelli, J.C. Scanlon and B.M.L. Rao, J. Solid State Chem. 29 ( 1979) 323.
{ 6 ] G.A. Scholz, P. Joensen, J.M. Reyes and R.F. Frindt, Physics BIOS (1981) 214.
[i] G.A. Scholz, R.F. Frindt and A.E. Curzon, Phys Status Solidia 71 (1982) 531.
[ 8 ] G.A. Wiegers, H.J.M. BoLwmeester and A.G. Gerards, Solid State Ionics 16 ( 1985 ) 155.
[9] H. Frauenfelder and X.M. Steffen, in: Alpha-, beta- and gamma-ray spectro>rob’ . Vol. 2. ed. K. Siegbahn (North- Holland, Amsterdar .I, I k 65 ).
[ IO ] A. Lerfand T. Butz. 4ng YV. them Int. Ed. Engl. 26 ( 1067 1 I IO.
[ I1 ] T. Butz, A. Hubler. A. t_ x-f and IV. Biberacher. Mat. Res. Bull. 16 (1981) 541
i 12 ] T. Butz and .4. Lerf. Ph,> Let;crs A 97 ( 1983 ) 2 17. [ 13 ] T. Butz and A. Let-f. Rev Chum. Min. 19 ( 1982 14%. [ 141 G..4. Schoiz and R.F. F mdt, Mat. Res. Bull. 15 ( 1 YSU )
1703. [ 15 ] T. Butz, A. Hiibler, J.O. Besenhard, A. Let-f and W.
Biberacher, Nuovo Cimento D2 ( 1983 ) 197 1. [ 161 A. Lerfand T. Butz, in: Reactivity of solids, eds. P. Barret
and L.-C. Dufour (Elsevier, .4msterdam, 1935) p.473. [ 171 T. Butz and A. Let-f, Bet-. Bunsenges. Physik. Chem. 90
{ 1986) 638. [ 18 ] D. Salomon, A. La-f, W. Biberacher, T. Butz and S. Saibenc.
to be published. [ 19) RF. Frindt, in: Chemical physics of intercalation. eds. A.
Legrand and S. Flandrois ( Plenum Press. New York. 1’357 1.