Embed Size (px)
Citation preview
Anim. Behav., 1996, 51, 553–565
The mixed blessing of echolocation: differences in sonar use by fish-eating andmammal-eating killer whales
LANCE G. BARRETT-LENNARD*, JOHN K. B. FORD*† & KATHY A. HEISE**Department of Zoology, University of British Columbia
†Marine Mammal Research, Vancouver Aquarium, British Columbia
(Received 31 August 1994; initial acceptance 21 December 1994;final acceptance 6 July 1995; MS. number: 7082)
Abstract. Despite well-documented experimental evidence of echolocation in toothed whales, virtuallynothing is known about the use and functional significance of cetacean sonar in the wild. Here, thepatterns of echolocation sounds produced by killer whales, Orcinus orca, off British Columbia andAlaska are described. Two sympatric populations with divergent food habits differed markedly in sonarsound production. Individuals belonging to the fish-eating ‘resident’ population produced trains ofcharacteristic sonar clicks, on average, 4% of the time, 27 times more often than marine mammal-eating‘transient’ killer whales. The click trains of residents averaged 7 s, more than twice as long as the trainsof transients. Click repetition rates within resident’s trains were constant or changed gradually; withintransient’s trains they often fluctuated abruptly. Transients produced isolated single or paired clicks atan average rate of 12/h, four times as often as residents. In general, the isolated clicks and infrequent,short and irregular trains of transients were less conspicuous against background noise than the sonarof residents. This difference in acoustic crypticity may reflect a flexible response to the probability ofalerting prey, because marine mammals have more acute hearing than fish in the frequency range ofsonar clicks. In both populations, echolocation use per individual decreased with increasing group size,suggesting the sharing of information between group members. No relationships were found betweenecholocation activity and water clarity for whales of either population. Transient whales often travelledor foraged without discernibly echolocating, suggesting that passive listening provides cues for preydetection and orientation. ? 1996 The Association for the Study of Animal Behaviour
Since the discovery of dolphin echolocation in thelate 1950s (McBride 1956; Kellogg 1958), sonarhas been experimentally investigated in manyspecies of odontocetes. This research has aimed atdetermining the acoustic characteristics of echo-location signals, the patterns of signals used fordifferent tasks, and the power of sonar to resolveobjects under various conditions (see Au 1993).Using trained and blindfolded subjects and statictarget objects, experimenters have answered manyfundamental ‘what’ and ‘how’ questions of sonarcapability. ‘When’ and ‘why’ questions of sonarutility in the wild, however, have not been directly
addressed. Similarly, the possible role of passivelistening as an alternative to sonar and vision (e.g.Norris 1967; Wood & Evans 1980; Evans &Awbrey 1988) has not been investigated.Three sets of observations indicate that wild
odontocetes may use echolocation less often or fordifferent functions than was previously suspected.(1) Equipping fishing nets with acoustically re-flective targets has generally been unsuccessfulin reducing accidental entanglements (Evans &Awbrey 1988; Dawson 1991). (2) Recently cap-tured or untrained dolphins are often unable touse echolocation effectively for simple tasks suchas obstacle avoidance (Wood & Evans 1980). (3)In a well-controlled study, a blindfolded bottle-nose dolphin pursued live fish without emittingecholocation sounds (Wood & Evans 1980),apparently orienting on swimming sounds alone.Because the advantages of echolocation to indi-viduals living in dark or turbid environments seem
Correspondence: L. G. Barrett-Lennard, Departmentof Zoology, University of British Columbia, 6270University Blvd, Vancouver, British Columbia V6T 1Z4,Canada (email: [email protected]). J. K. B. Ford isat Marine Mammal Research, Vancouver Aquarium,P.O. Box 3232, Vancouver, British Columbia V6B 3X8,Canada.
0003–3472/96/030553+13 $18.00/0 ? 1996 The Association for the Study of Animal Behaviour
553
apparent, these observations imply that liabilitiesalso apply. These liabilities may include the costsof echolocation described for bats; that is, thestimulation of evasive responses in prey and theattraction of eavesdropping predators or competi-tors (Fenton 1980; Barclay 1982).Here we report findings from a systematic study
of the echolocation sounds of wild killer whalesoff Alaska and British Columbia. Two sympatric,non-associating populations that hunt distinctlydifferent prey inhabit this region. These two popu-lations provided a unique opportunity to comparethe sonar sounds of whales engaged in differentactivities, to assess the flexibility of echolocationand its utility under varying conditions. Wedescribe general differences in the patterns ofecholocation use by each population, and howecholocation was affected by group size, activityand water clarity.
METHODS
Killer Whale Populations
Killer whales in Prince William Sound, Alaska,and along the coast of British Columbia have beenthe subjects of ongoing studies for 13 and 23years, respectively. Almost all individuals havebeen identified and catalogued on the basis ofnatural markings and fin shape (Bigg et al. 1987;Heise et al. 1992; Ford et al. 1994), and theirseasonal movements, diet, social structure andlife-history parameters have been described(Stevens et al. 1989; Bigg et al. 1990; Nichol 1990;Olesiuk et al. 1990). Two sympatric non-associating forms, known as ‘residents’ and‘transients’, inhabit these areas. Residents live instable matrilineal groups (pods) of five to 40individuals and forage principally or entirely onfish (Bigg et al. 1987). Transients form less stableassociations than residents, but are typically seenin groups of two to 10 animals that feed princi-pally or entirely on marine mammals (Bigg et al.1987; Morton 1990). A third, rarely encounteredassemblage of killer whales known as the ‘off-shore’ group has a range overlapping those ofresidents and transients in British Columbia (Fordet al. 1994), but was not included in this study.Ford (1989) described three distinct types of
vocalizations used by killer whales: whistles, callsand clicks. Whistles are highly variable pure-tonesignals associated with social activity within
groups, and calls are pulsed signals that probablyserve as long-term indicators of affiliation (Ford1989). Clicks are short-duration, broadbandsignals that are used for echolocation by killerwhales and other odontocetes (reviewed in Norris1969; Watkins & Wartzok 1985; Au 1993; descrip-tions of click use by killer whales in Schevill &Watkins 1966; Diercks et al. 1971).
Study Sites
We recorded killer whales in the followingareas: (1) Prince William Sound, Alaska (60)05*N,147)30*W) during May–August 1990, July–September 1991 and July–September 1992, (2) thecentral mainland coast of British Columbia(52)0*N, 127)50*W) during June 1991 and May1992, and (3) Moresby Island, British Columbia(52)30*N, 131)0*W) during June–July 1992. Allareas had relatively little vessel activity. Waterclarity varied widely at the first and second siteswith fluctuating run-off from rivers and glaciers.
Data Collection
All acoustic recordings and behavioural obser-vations were made at sea from small (<12 m)vessels. We searched areas where killer whalesightings were common by scanning with 7#50binoculars while travelling at approximately15 km/h. If conditions permitted, we periodicallyput an observer on shore to scan from a highvantage point with binoculars or with a 20#spotting scope. At approximately 1-h intervals welistened for vocalizing killer whales with a Sparton60CX123 hydrophone lowered to a depth of 20 m.If vocalizations were heard, we attempted tofind the whales using a directional hydrophone.Mariners and aviators often reported killer whalesightings to us via marine radio, enabling us tofocus searches.When we located killer whales (an ‘encounter’),
we slowly approached them to about 25 m andparalleled their course. We took identificationphotographs of each whale present, then moved500 m ahead and shut off the vessel engine. Welowered a Bruel and Kjaer 8101 hydrophone to adepth of 25 m, and made recordings using acustom-built calibrated pre-amplifier and NagraIV-SJ recorder running at 38 cm/s (system fre-quency response 25 Hz to 35 kHz&1 dB). Werecorded 5-min sessions at hourly intervals, and
Animal Behaviour, 51, 3554

simultaneously made voice recordings of ourobservations on a separate track of the same tape.Immediately after each recording session, we
measured water clarity using a 20-cm Secchi diskwith black and white quadrants. We lowered thedisk on the shaded side of the vessel until itdisappeared, raised it until it re-appeared, andrecorded the average of the two depths. To assesswhether water clarity varied with depth, we madean ambient light profile once per encounter usingan Archer 276-116A photocell attached by a 30-mcable to a resistance meter. The photocell wasweighted so that its light-sensitive surface wasdirected upwards. We took readings every metreas the cable was lowered. In water that wasunstratified, the resistance readings increasedevenly with depth; rapid changes in resistanceindicated the presence of turbid layers.
Activity Categories
While recording, we noted the activities of thewhales at the surface. We classified the mostcommon activity observed during each sessionaccording to the behavioural categories listedbelow (modified from Ford 1989).
Foraging
Foraging by residents was indicated by erratichigh-speed swimming, lunging, rapid circling andchasing fish at the surface. Foraging transientseither swam along shorelines, entering bays andcircling kelp patches and islets, or swam in dis-persed formation across open areas. Fish scales,tissue, blood or blubber fragments were frequentlyseen at the surface when killer whales capturedprey while foraging.
Travelling
Travelling killer whales swam in one or severalgroups on a consistent course at speeds exceeding6 km/h. Individuals swam within a few bodylengths of their neighbours in each group.
Slow-travelling
Slow-travelling whales swam in one or severalgroups on a consistent course at 3-6 km/h, andintermittently engaged in activities such as flipperor fluke slapping (striking flippers or tail flukes
on the water surface). The distances betweenindividuals within a group often exceeded severalbody lengths.
Resting
Resting whales swam in one or several groups,moved at speeds less than 4 km/h, and surfaced insynchrony. Intervals between breaths were shortand regular, and group members usually stayedwithin a single body length of their neighbours.
Socializing
Socializing whales made little directionalprogress and engaged in physical interactionssuch as chasing, rolling and thrashing. Surfaceactivities were common, including breaching(leaping clear or partly clear of the water surface),spyhopping (vertical surfacing with the head liftedclear of the water) and flipper and fluke slapping.
Milling
Milling whales made little directional progress,and breathed at long, irregular intervals. Surfac-ings were not coordinated between group mem-bers. Surface activities such as those describedabove were rare.
Acoustic and Statistical Analysis
We analysed recordings using a Kay ElemetricsDSP-5500 real time sound analyser. The tapeswere played back at reduced speed (18 to
12 original
speed, depending on the complexity of thesounds). During the analysis we simultaneouslylistened to the recordings and viewed a videodisplay showing both a colour-enhanced, 512-point spectrograph with a 64-kHz bandwidth(compensated for tape speed) and a waveformtrace, both in 4-s windows. We used the spec-trograph to compare the frequency characteristicsof clicks, and the waveform to help detect quietclicks. Although the signal strength of the record-ings declined above 35 kHz, usable informationextended to 50 kHz and adequately covered thefrequencies of killer whale clicks reported byDiercks et al. (1971) and Evans & Awbrey (1988).Sonar pulses usually occurred in regular series
of three or more clicks separated by intervals ofless than 2 s, referred to as click trains. We used a
Barrett-Lennard et al.: Echolocation in killer whales 555

digital stopwatch during the analysis to record thebeginning and end time of each click train. Theindividual pulses in any given click train weretypically consistent in frequency structure, butdiffered from clicks in other trains, as reported fornarwhals, Monodon monoceros (Ford & Fisher1978). This frequency signature made it possibleto distinguish the overlapping trains of differentindividuals. If the whales were widely dispersed ortravelling rapidly during a recording session, itwas sometimes difficult to determine whether cer-tain trains had ended or faded into backgroundnoise. If this ambiguity occurred, we discardedthe data from the session. Similarly, we did notanalyse some sessions because ambient noise wasloud enough to potentially mask quiet clicks.Early in the study, two distinct types of click
trains were apparent. The first had a click repeti-tion rate that remained constant for the durationof the train, or that changed in a smoothly gradedfashion; the second had a click rate that changedabruptly. To describe this dichotomy quantita-tively, we defined ‘regular’ trains as ones in whichthe duration of all adjacent inter-click intervalsdiffered by less than 10%; in ‘irregular’ trains atleast one pair of adjacent intervals differed by 10%or more. Almost all trains fell clearly into onecategory or the other; in cases of uncertainty wepaused the playback recorder and analyser andmeasured click intervals on the spectrographicdisplay.We counted the percentage of trains that were
irregular for each session. These data were nor-malized by arcsine square root transformation,and mean percentages for transient and residentkiller whales were compared using t-tests. Wesummed the durations of all click trains, calcu-lated the mean durations for each session, andused t-tests to compare the grand means forresident and transients.We devised a simple echolocation use index (EI)
to quantify the use of click trains. This was theaverage percentage of time that an individualwhale present during a recording session emittedclick trains, calculated as follows:
EI = 100d
sn
where d is the sum of the durations of all the clicktrains, s is the recording session duration, andn is the number of whales present (referred to
hereafter as group size). We arcsine-square-root-transformed EI values for statistical testing andused the log of group size. Mean EI values werecompared by t-test. We examined the effect ofbehavioural activity and group size on EI using anANCOVA, and used a planned contrast analysis(Wilkinson 1990) to test whether echolocation wasmore strongly associated with foraging than withother behavioural activities.In addition to clicks occurring within trains, we
sometimes detected single clicks or closely spacedpairs of clicks that were not part of any series.These clicks were acoustically similar to thoseoccurring within trains, and are referred to as‘isolated clicks’. We used t-tests to compare themean number of isolated clicks produced per h perwhale by residents and by transients.To measure the click repetition rates of echolo-
cation trains, we selected a subsample of sessionsand trains using random number tables. Thespectrograph of each train was then paused on themonitor while we measured its duration andnumber of clicks. The repetition rate of a trainwas calculated as the number of clicks it containedminus one, divided by the duration of the train.In many instances we analysed more than one
recording session from the same encounter. Toensure that recordings were statistically indepen-dent, we selected sessions for analysis that wereseparated by a distinct change in behaviour. Thus,if an encounter consisted of 3 h of foraging fol-lowed by 2 h of resting and then 3 h of foraging,we analysed at most one session from each of thethree activity periods. On occasion we analysedconcurrent transient foraging sessions that wereseparated by a kill and feeding session or by atransition between foraging modes (e.g. a changefrom nearshore to offshore foraging). Allstatistical tests are two-tailed.
RESULTS
Killer Whale Encounters
We encountered killer whales 111 times, andspent an average of 5 h observing and recordingper encounter. By comparing the photographstaken during the encounters with catalogues ofidentified killer whales (Bigg et al. 1987; Ellis1987; Heise et al. 1992), we determined thatresidents from 11 pods were present 85 times,transients from six groups were present 23 times,
Animal Behaviour, 51, 3556
and uncategorized killer whales were present threetimes. Residents and transients were never seentogether. Fewer transient than resident killerwhales were present per encounter (on average, 4.6and 18.0, respectively), and transients were gener-ally dispersed over smaller areas than residents.
Detectability of Echolocation Sounds
We were able to detect echolocation clicks fromapproaching killer whales up to or beyond 3 km;under most conditions we could distinguish com-plete trains when the animals were within 1 km.When a group passed the boat, clicks quicklydropped in volume, and detection became unreli-able within 500 m. This directional effect was mostevident in the high frequency part of the soundspectrum, as previously reported for killer whalesand other odontocetes (Schevill & Watkins 1966;Diercks et al. 1973; Au 1993). It was our consist-ent qualitative impression that residents’ clickswere more intense than transients’, despite the factthat the larger size of resident groups meant thatthe average hydrophone-to-whale distance wasusually greater for residents than transients.Nevertheless, resident groups were at times suf-ficiently dispersed that echolocation trains weredifficult to distinguish from background noise,and we discarded data from more resident thantransient sessions during analysis. We successfullyanalysed 88 sessions of transient and 74 ofresident killer whales.
Characteristics of Clicks and Trains
Isolated clicks and those occurring within trainswere broadband pulses with peak energy rangingfrom 4 to 18 kHz. Measurable energy usually
extended to 35 kHz and occasionally to 50 kHz,the upper limit of the recording system. Thesepeaks and ranges are somewhat lower than thosereported by Awbrey et al. (1982) for Antarctickiller whales. The difference, however, may beartefactual, because recorded frequency character-istics depend on the distance and orientation ofwhales relative to the hydrophone. Because thehearing of killer whales extends beyond 100 kHz(D. E. Bain, unpublished data, cited in Bain &Dahlheim 1994), we paid careful attention to theupper frequency portion of the spectrographicdisplay for evidence of the lowest componentsof very high frequency clicks. We found noindication of such clicks in the 162 sessionsanalysed.Isolated clicks were initially very difficult to
distinguish against background noise. Indeed,early in the analysis we missed these soundsentirely. With experience, however, we recognizedisolated pulses closely resembling those found inclick trains. No similar sounds were detectedin control recordings made in the study areaswhen whales were absent. Most isolated clickswere single pulses; however, we recorded somedouble pulses with inter-click intervals of 100 msor less.The characteristics of resident and transient
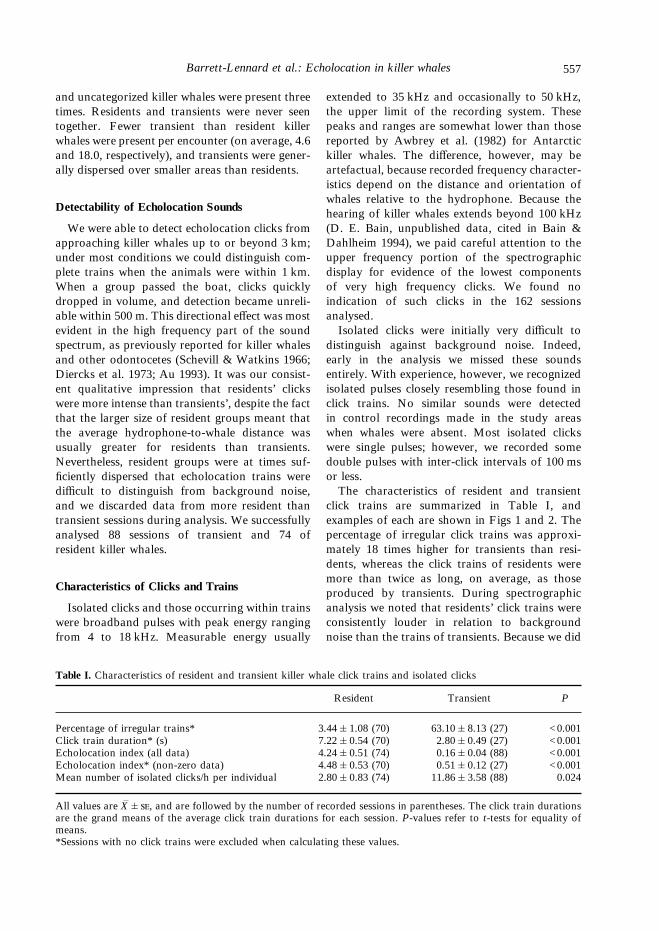
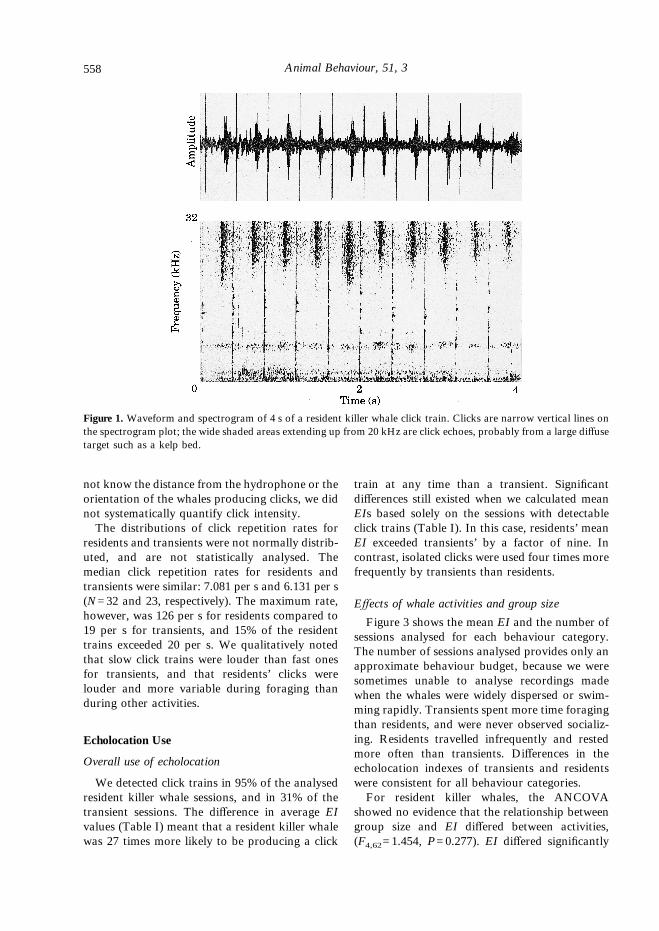
click trains are summarized in Table I, andexamples of each are shown in Figs 1 and 2. Thepercentage of irregular click trains was approxi-mately 18 times higher for transients than resi-dents, whereas the click trains of residents weremore than twice as long, on average, as thoseproduced by transients. During spectrographicanalysis we noted that residents’ click trains wereconsistently louder in relation to backgroundnoise than the trains of transients. Because we did
Table I. Characteristics of resident and transient killer whale click trains and isolated clicks
Resident Transient P
Percentage of irregular trains* 3.44&1.08 (70) 63.10&8.13 (27) <0.001Click train duration* (s) 7.22&0.54 (70) 2.80&0.49 (27) <0.001Echolocation index (all data) 4.24&0.51 (74) 0.16&0.04 (88) <0.001Echolocation index* (non-zero data) 4.48&0.53 (70) 0.51&0.12 (27) <0.001Mean number of isolated clicks/h per individual 2.80&0.83 (74) 11.86&3.58 (88) 0.024
All values are X&, and are followed by the number of recorded sessions in parentheses. The click train durationsare the grand means of the average click train durations for each session. P-values refer to t-tests for equality ofmeans.*Sessions with no click trains were excluded when calculating these values.
Barrett-Lennard et al.: Echolocation in killer whales 557
not know the distance from the hydrophone or theorientation of the whales producing clicks, we didnot systematically quantify click intensity.The distributions of click repetition rates for
residents and transients were not normally distrib-uted, and are not statistically analysed. Themedian click repetition rates for residents andtransients were similar: 7.081 per s and 6.131 per s(N=32 and 23, respectively). The maximum rate,however, was 126 per s for residents compared to19 per s for transients, and 15% of the residenttrains exceeded 20 per s. We qualitatively notedthat slow click trains were louder than fast onesfor transients, and that residents’ clicks werelouder and more variable during foraging thanduring other activities.
Echolocation Use
Overall use of echolocation
We detected click trains in 95% of the analysedresident killer whale sessions, and in 31% of thetransient sessions. The difference in average EIvalues (Table I) meant that a resident killer whalewas 27 times more likely to be producing a click
train at any time than a transient. Significantdifferences still existed when we calculated meanEIs based solely on the sessions with detectableclick trains (Table I). In this case, residents’ meanEI exceeded transients’ by a factor of nine. Incontrast, isolated clicks were used four times morefrequently by transients than residents.
Effects of whale activities and group size
Figure 3 shows the mean EI and the number ofsessions analysed for each behaviour category.The number of sessions analysed provides only anapproximate behaviour budget, because we weresometimes unable to analyse recordings madewhen the whales were widely dispersed or swim-ming rapidly. Transients spent more time foragingthan residents, and were never observed socializ-ing. Residents travelled infrequently and restedmore often than transients. Differences in theecholocation indexes of transients and residentswere consistent for all behaviour categories.For resident killer whales, the ANCOVA
showed no evidence that the relationship betweengroup size and EI differed between activities,(F4,62=1.454, P=0.277). EI differed significantly
Figure 1. Waveform and spectrogram of 4 s of a resident killer whale click train. Clicks are narrow vertical lines onthe spectrogram plot; the wide shaded areas extending up from 20 kHz are click echoes, probably from a large diffusetarget such as a kelp bed.
Animal Behaviour, 51, 3558

between activities when adjusted for group size(F5,67=2.898, P=0.020), and there was a signifi-cant negative correlation between group size andEI (Fig. 4; F1,67=4.060, P=0.048). The adjustedmean EI was significantly higher for foragingwhales than for resting, socializing, milling andslow-travelling whales combined (F1,67=9.171,P=0.003). To ensure that the relationship betweengroup size and EI did not result from our failingto detect sonar from distant individuals in largegroups, we did an ANOVA in which we excludedall recordings of groups spread over more thanapproximately 1 km2. The result supported ourprevious finding (F1,56=4.35, P=0.042).For transient killer whales, an ANCOVA based
on the entire data set yielded no evidence thatEI is related to either activity or group size(F3,82=0.388, P=0.762; F1,82=1.690, P=0.197,respectively). Similarly, separate ANOVAs failedto relate either factor to EI (F4,83=0.370,P=0.829; F1,86=1.928, P=0.169, respectively).When we excluded the observations with EI=0from the analysis, ANCOVA probabilities and anANOVA relating EI and activity were also not
significant at P=0.05, but an ANOVA supporteda negative relationship between group size and EI(F1,25=7.405, P=0.012).
Effect of foraging areas
We noted differences in foraging behaviourbetween transient killer whales patrolling coast-lines and those seeking prey in open water, similarto the differences reported by Saulitis (1993).Transients near shore typically swam in tightgroups, rounding headlands or entering baysrapidly without surfacing. We saw 15 confirmedand nine probable kills of harbour seals near reefs,shoals or rocky shores during this study. Offshore,transients travelled 200–300 m apart and preyedon Dall’s porpoises, Phocoenoides dalli, and onharbour porpoises, Phocoena phocoena. Weconfirmed that kills took place in three out of sixpursuits of groups of one to four Dall’s porpoises;two pursuits of single harbour porpoises endedwith probable kills (Barrett-Lennard 1992). Bothmean EI and isolated click production weregreater for transient killer whales foraging along
Figure 2. Waveform and spectrogram of 4 s of a transient killer whale echolocation click train. Note the unevenspacing between clicks.
Barrett-Lennard et al.: Echolocation in killer whales 559

shorelines than for those in open water (Table II).No similar area-specific behaviour patterns wereapparent with resident killer whales.
Water clarity
Ambient light levels declined evenly with depthat all three locations. Because there was noevidence of stratification, the Secchi disk trans-parencies (range 1.4–12.0 m, median=7.8 m) weretaken as reliable indicators of relative waterclarity. Echolocation index levels were indepen-dent of Secchi disk transparency for both resi-dents (F1,66<0.001, P=1.00) and transients(F1,76=0.54, P=0.46) when recordings from allbehavioural activities were combined. Similarly,there was no relationship between EI and waterclarity when behaviour patterns were analysedseparately.
DISCUSSION
The Cost of Echolocation
Transient and resident killer whales differmarkedly in travel patterns, dive intervals andgroup sizes. Transients travel along shorelinesmore frequently, have longer average dive timesand live in smaller groups than residents (Morton1990). Because whales travelling near shore riskstranding or collision with the bottom, transientsrequire more precise and more frequently updatedpositional information than do residents. Thelong average dive time of transients restrictstheir opportunities to acquire this information byvisual reference to above-surface features, relativeto residents. Because group members are likelyto share information (Norris & Dohl 1980), thesmall group sizes of transients may requireeach transient individual to obtain more informa-tion directly from the environment than doeseach resident. These arguments suggest that tran-sients should use echolocation more frequentlythan residents. The opposite finding that wereport here suggests that the cost of echolocationmay be substantially higher for transients thanresidents.Differences in the cost of echolocation for the
two forms of killer whale may result from dif-ferences in the abilities of their prey to detectand respond to sonar sounds. Most fish specieshave very low auditory sensitivity above 3 kHz(Hawkins & Johnstone 1978; Hawkins 1986) andthus are unlikely to detect much energy from killerwhale clicks. Marten et al. (1988) tested the reac-tions of 13 species of bony fish to high-intensity
0
fBehaviour category
Ech
oloc
atio
n in
dex
t
5
8
7
6
4
3
2
1
ml s str
(27)
(6)
(23) (1) (24) (13)
(18)
(4)
(39)
(2)
(5)
Figure 3. Mean echolocation index values for residentand transient killer whales, by behavioural activity. Starsand circles refer to residents and transients, respectively.Bars are standard errors and the number of sessionsanalysed in each category are in parentheses. Abbrevia-tions: f=foraging, ml=milling, r=resting, s=socializing,st=slow travelling, t=travelling.
100
25
0Group size
Ech
oloc
atio
n in
dex
50
20
15
10
5
Figure 4. Echolocation index as a function of group sizefor resident killer whales. A logarithmic regression line isfitted to the data.
Animal Behaviour, 51, 3560

sonar from bottlenose dolphins and detected nobehavioural reactions. Astrup & Møhl (1993)reported responses of cod, Gadus morhua, to arti-ficial high frequency clicks only at very high soundpressure levels. Thus, the cost of echolocationfor fish-eating residents, in terms of the risk ofalerting their fish prey, is probably low.In contrast to fish, the pinniped and cetacean
prey of transient killer whales have acute hearingto frequencies beyond 30 kHz (Møhl 1968;Andersen 1970; Terhune 1988), well within therange of killer whale sonar clicks. Seals that arealerted to the presence of transient killer whalesmay leave the water, move into shallow areas, ortake refuge in kelp patches or on the bottom; sealions may leave the water, aggregate into tightdefensive clusters, or swim away at high speed(personal observations). Porpoises may also swimaway from transients at high speed on erraticcourses (personal observations), and dolphins andgrey whales have been reported to move intoshallow water when killer whales were nearby(Baldridge 1972; Würsig 1989). The acute hearingand anti-predatory behaviour of cetaceans andpinnipeds would appear to make echolocationcostly for mammal-eating transients.Our finding that transients echolocated more
when near shore than when offshore may reflect abalance between the risks of stranding or collisionand the costs of echolocation described above.Lower hearing sensitivity or vigilance of sealsrelative to porpoises and camouflaging noisefrom waves striking the shore may also makeecholocation less costly inshore than offshore.
Sonar Characteristics
Relative to residents, transients used short andirregular echolocation trains composed of clicksthat appeared structurally variable and low in
intensity. Sequences of short duration sounds thatare irregular in timing and frequency structuremore closely resemble random noise than doregular sequences. Thus, marine mammals wouldbe less likely to detect transient than residentecholocation trains against background noise.Transients near shore may echolocate mainlyfor orientation as argued above, rather than forprey detection. Fenton (1984) described similarbehaviour by bats that use echolocation to avoidobstacles but use other cues to detect prey. Whennear shore, quiet clicks are likely to providegood positional information, because topographicfeatures are large and produce strong echoes.Compared to click trains, isolated clicks could
only provide crude information (Norris 1967). Wesuggest that they provide spatial ‘snapshots’ withlittle risk of alerting potential prey. Our difficultyin recognizing isolated clicks while listening toslowed recordings may be indicative of the prob-lems faced by acoustically vigilant porpoises orpinnipeds. Killer whales foraging for elephantseals in the Indian Ocean, like the transients in ourstudy, produced isolated clicks but very few clicktrains or calls (Guinet 1992).Maximum distances between echolocating killer
whales and their acoustic targets may be inferredfrom their click repetition rates. In experimen-tal studies, echolocating bottlenose dolphins,Tursiops truncatus, and false killer whales,Pseudorca crassidens, allowed sufficient time aftereach click for an echo to return, plus a short lag,before emitting the next click (Morozov et al.1972; Roitblat et al. 1990; Thomas & Turl 1990).If killer whales do the same, the repetition ratesreported here indicate maximum target distancesranging from 6 to 480 m for residents and 40 to800 m for transients. Close-range echolocation byresidents may be used to assess and select fishand to track individual fish during pursuit. The
Table II. Echolocation indexes and isolated click production of transient killer whales in nearshore and offshorewaters
Nearshore(N=57)
Offshore(N=26) P
Mean echolocation index (EI ) 0.23&0.07 0.02&0.01 0.016Mean number of isolated clicks/h per individual 12.76&2.56 1.30&0.52 0.004
Means are shown&. P-values are for t-tests for equality of means. Five recorded sessions during which the whaleswere intermediate distances from shore were not included in this analysis.
Barrett-Lennard et al.: Echolocation in killer whales 561
repetition rates of transients suggest that theyrarely use sonar trains to assess, detect or tracknearby prey, but rather to locate distant obstaclesor prey. Our qualitative observation that tran-sients decreased click intensities at higher clickrepetition rates suggests that they match soundlevels to target distances, which would reducetheir risk of warning prey.
Behavioural Contexts of Sonar Use
Results presented here and in Ford (1989)suggest that echolocation is used by resident killerwhales for orientation and for locating and/orcatching prey, and that the function of othervocalizations is primarily social. In this study,residents used echolocation most frequently dur-ing foraging. In contrast, Ford (1989) reported thehighest call and whistle rates during socializing,and described residents foraging for periodslonger than 1 h without using calls. Ford alsonoted that the first call in a series seemed to triggerresponses from scattered group members; in thisstudy, click trains did not appear to elicitresponses. Travelling residents also had relativelyhigh average echolocation index levels in thisstudy, suggesting a possible function of echo-location in orientation and navigation. Our obser-vation that click repetition rates seemed morevariable during foraging than during travellingsuggests that residents track targets throughdifferent ranges when foraging, and scan withecholocation when travelling.Social factors appeared to constrain echo-
location use under certain circumstances. Forexample, on two occasions residents that wereapproached by transients abruptly stoppedcalling, grouped up tightly and travelled awaywithout echolocating.We suggest two reasons why transients use little
echolocation even when not foraging. First, tran-sients may be alert for opportunistic encounterswith prey even when not actively searching. Dur-ing two encounters, transient groups that did notappear to be actively searching began rapid pur-suits of dolphins that surfaced nearby. Second, thevigilance responses of potential prey may be per-sistent, and thus may reduce the hunting successof transients in the future. During this study weobserved seals leaving the water and remainingashore for more than 9 h after non-hunting killerwhales passed nearby.
Group Size and Sonar Use
The negative correlation between sonar use andgroup size for resident killer whales suggests thatsonar information is shared, which could occur inat least three ways. First, information obtainedby echolocation may be communicated directly.Second, by monitoring the echolocation of groupmembers, individuals may be able to infer thelocation of foraging hotspots, as reported in batcolonies (Wilkinson 1992). Third, killer whalesmay be able to interpret the echoes of clicksproduced by other group members. Scronce &Johnson (1976) showed that a blindfolded captivebottlenose dolphin could detect a target usingartificially produced clicks from a sound projector.Transients frequently suppressed the use of
click trains altogether. The negative correlationbetween echolocation and group size based on thesessions containing at least one click train, how-ever, suggests that information is transferredbetween members of transient groups. The inter-mittent and low-intensity nature of transientsonar makes it unlikely that echo sharing is acommon mode of information exchange. Rather,we suggest that information is probably trans-ferred by some type of direct signalling. Indeed,isolated clicks may function partly as signalsbetween group members.
Vision, Echolocation and Passive Listening
The lack of significant associations betweenecholocation index and water clarity for eitherresidents or transients advises caution in extrapo-lating the results of echolocation experiments incaptivity. Echolocation does not appear to takeover where vision leaves off. In a study designed toexamine echolocation use by a blindfolded dol-phin during the capture of live fish, the dolphinrepeatedly located and approached fish withoutproducing any detectable echolocation sounds(Wood & Evans 1980). The experiment demon-strated that delphinids can detect, track and catchfish using non-visual external cues such as swim-ming sounds. This type of experiment has not beenrepeated on other odontocetes, but sound produc-tion by many fish species is well documented(Myrberg 1981; Hawkins 1986), and many speciesof cetaceans may make use of this source of infor-mation. In particular, sounds may be the principalcues used by non-echolocating mysticete whalesto locate schools of small fish in turbid water.
Animal Behaviour, 51, 3562

Norris et al. (1961) also found evidence thatecholocation and vision are not directly sub-stituted. In their study, a bottlenose dolphinretrieved dead fish both when blindfolded and inclear water without a blindfold. Evans & Awbrey(1988) observed wild bottlenose dolphins usingintense echolocation while feeding on dead fish inclear water. In the present study, foraging resi-dents also used echolocation even in relativelyclear water.Transient killer whale attacks on Dall’s por-
poises were not preceded by echolocation in thisstudy. Because the whales detected the porpoiseswell beyond underwater visual range, and werenot observed scanning visually above the surface,passive listening appears to be the most likelydetection mechanism. Dall’s porpoise echo-location is centred on frequencies of 135–149 kHz(Au & Jones 1991) and thus may not be detectableby killer whales, which have little sensitivity above105 kHz (Bain & Dahlheim 1994). With ourrecording equipment we detected the underwatersounds generated by porpoises surfacing andbreathing up to 25 m away under quiet ambientconditions, and transients may make use of suchsounds at much greater distances.Transients foraging in open water show a
tendency at times to avoid proximity to engine-powered vessels (personal observations; E. L.Saulitis, personal communication), which may bea response to the masking effect of engine noise.On three occasions we observed transients initiat-ing pursuit of Dall’s porpoises immediately afterthe study vessel’s engine was shut off, and G. M.Ellis (personal communication) has reported simi-lar observations. It appeared in each instance thatengine noise impaired the whales’ ability to detecttheir prey.
Implications for Echolocation in otherOdontocetes
The patterns of sonar use by resident andtransient killer whales indicate that echolocationis (1) both flexible and facultative, (2) constrainedby inter- and intraspecific factors and (3) notobligately linked to conditions affecting vision. Inother odontocetes, high echolocation costs mayarise from the risk of attracting predators(especially killer whales), and not from the risk ofalerting fish or cephalopod prey. Predator attrac-tion costs are likely to be lower for schooling than
for solitary odontocetes, owing to protectiveproperties of schools (Norris & Schilt 1988). Wepredict, therefore, that limited, cryptic andcontext-dependent echolocation is used by solitaryodontocete species, and by individuals of gregari-ous species that are separated from their schools.As with transient killer whales, passive listeningis probably important for orientation and preydetection to all odontocetes that are constrainedin their use of echolocation. Finally, because mostodontocete individuals probably do not scanconstantly with echolocation, we predict thatentanglements of cetaceans in fishing nets willbe more effectively reduced by fitting nets withactive sound-generating devices than with sonarreflectors.
ACKNOWLEDGMENTS
The late Michael Bigg helped us plan this project,and blessed it with his insight and enthusiasm.Jamie Smith was our principal advisor through-out. C. Matkin, O. von Ziegesar and E. Saulitismade possible the work in Prince William Sound.G. Ellis conducted the photo-identifications. Wethank G. Barrett-Lennard, J. Kimmel, A. Reid,L. Saville and J. Smith for assistance in thefield. Discussions with D. Bain, R. Baird, G. Ellis,C. Guinet, C. Matkin, A. Morton, E. Saulitis,T. Simila and J. Watson helped to shape ourideas and sharpen our focus. We thank C. Clark,A. Lotem, D. Westcott and two anonymousreferees for helpful comments on drafts of thepaper. Others who assisted were D. Burles, M.Dahlheim, P. Domenici, D. Ludwig, P. Matthews,S. Heard, W. Hochachka and D. Ward. Theresearch was supported by the Canadian NaturalSciences and Engineering Research Council, theNorth Gulf Oceanic Society, and the VancouverAquarium. L. Barrett-Lennard received personalsupport from the British Columbia ScienceCouncil. Finally, we thank Parks Canada and theU.S. National Marine Mammal Laboratory forfacilitating our research in the Queen CharlotteIslands and Prince William Sound, respectively.
REFERENCES
Andersen, S. 1970. Auditory sensitivity of the harbourporpoise, Phocoena phocoena. In: Investigations onCetacea, Vol. II (Ed. by G. Pilleri), pp. 255–259.Berne, Switzerland: Benteli AG.
Barrett-Lennard et al.: Echolocation in killer whales 563

Astrup, J. & Møhl, B. 1993. Detection of intenseultrasound by the cod Gadus morhua. J. exp. Biol.,182, 71–81.
Au, W. W. L. 1993. The Sonar of Dolphins. New York:Springer-Verlag.
Au, W. W. L. & Jones, L. 1991. Acoustic reflectivityof nets: implications concerning incidental take ofdolphins. Mar. Mammal Sci., 7, 258–273.
Awbrey, F. T., Thomas, J. A., Evans, W. E., &Leatherwood, S. 1982. Ross Sea killer whale vocaliz-ations: preliminary description and comparison withthose of some northern hemisphere killer whales. Rep.int. Whal. Commn, 32, 667–670.
Bain, D. E. & Dahlheim, M. E. 1994. Effects of maskingnoise on detection thresholds of killer whales. In:Marine Mammals and the Exxon Valdez (Ed. by T. R.Loughlin), pp. 243–256. San Diego: Academic Press.
Baldridge, A. 1972. Killer whales attack and eat a graywhale. J. Mammal., 53, 898–900.
Barclay, R. M. R. 1982. Interindividual use of echo-location calls: eavesdropping by bats. Behav. Ecol.Sociobiol., 10, 271–275.
Barrett-Lennard, L. G. 1992. Echolocation in wild killerwhales (Orcinus orca). M.Sc. thesis, University ofBritish Columbia.
Bigg, M. A., Ellis, G. M., Ford, J. K. B. & Balcomb,K. C., III. 1987. Killer Whales: A Study of theirIdentification, Genealogy and Natural History inBritish Columbia and Washington State. Nanaimo,British Columbia: Phantom Press.
Bigg, M. A., Olesiuk, P. F., Ellis, G. M., Ford, J. K. B.& Balcomb, K. C., III. 1990. Social organization andgenealogy of resident killer whales (Orcinus orca)in the coastal waters of British Columbia andWashington State. Rep. int. Whal. Commn (specialissue 12), 383–405.
Dawson, S. M. 1991. Modifying gillnets to reduceentanglement of cetaceans. Mar. Mammal Sci., 7,274–282.
Diercks, K. J., Trochta, R. T. & Evans, W. E. 1973.Delphinid sonar: measurement and analysis. J. acoust.Soc. Am., 54, 200–204.
Diercks, K. J., Trochta, R. T., Greenlaw, C. F. & Evans,W. E. 1971. Recording and analysis of dolphinecholocation signals. J. acoust. Soc. Am., 49, 1729–1732.
Ellis, G. 1987. Killer whales of Prince William Soundand southeast Alaska. A catalogue of individualsphotoidentified, 1976–1986. Hubbs Marine ResearchCenter Technical Report No. 87–200.
Evans, W. E. & Awbrey, F. T. 1988. Natural historyaspects of marine mammal echolocation: feedingstrategies and habitat. In: Animal Sonar: Processesand Performance. (Ed. by P. E. Nachtigall & P. W. B.Moore), pp. 521–534. New York: Plenum Press.
Fenton, M. B. 1980. Adaptiveness and ecology of echo-location in terrestrial (aerial) systems. In: AnimalSonar Systems (Ed. by R.-G. Busnel & J. F. Fish),pp. 427–446. New York: Plenum Press.
Fenton, M. B. 1984. Echolocation: implications forecology and evolution of bats. Q. Rev. Biol., 59,33–53.
Ford, J. K. B. 1989. Acoustic behaviour of resident killerwhales (Orcinus orca) off Vancouver Island, BritishColumbia. Can. J. Zool., 67, 727–745.
Ford, J. K. B., Ellis, G. M., & Balcombe, K. C. 1994.Killer Whales: The Natural History and Genealogy ofOrcinus orca in British Columbia and WashingtonState. Vancouver: University of British ColumbiaPress.
Ford, J. K. B. & Fisher, H. D. 1978. Underwateracoustic signals of the narwhal (Monodon monoceros).Can. J. Zool., 56, 552–560.
Guinet, C. 1992. Comportement de chasse des orques(Orcinus orca) autour des iles Crozet. Can. J. Zool.,70, 1656–1667.
Hawkins, A. D. 1986. Underwater sound and fishbehaviour. In: The Behaviour of Teleost Fishes(Ed. by T. J. Pitcher), pp. 114–151. London:Croom Helm.
Hawkins, A. D. & Johnstone, A. D. F. 1978. Thehearing of the Atlantic salmon, Salmo salar. J. FishBiol., 13, 655–673.
Heise, K., Ellis, G. & Matkin, C. 1992. A Catalogue ofPrince William Sound Killer Whales. Homer, Alaska:North Gulf Oceanic Society.
Kellogg, W. N. 1958. Echo ranging in the porpoise.Science, 128, 982–988.
McBride, A. F. 1956. Evidence for echolocation incetaceans. Deep Sea Res., 3, 153–154.
Marten, K., Norris, K. S., Moore, P. W. B. & Englund,K. A. 1988. Loud impulse sounds in odontocetepredation and social behavior. In: Animal Sonar:Processes and Performance (Ed. by P. E. Nachtigall &P. W. B. Moore), pp. 567–579. New York: PlenumPress.
Møhl, B. 1968. Auditory sensitivity of the common sealin air and water. J. Aud. Res., 8, 27–38.
Morozov, V. P., Akopian, A. I., Burdin, V. I., Zaytseva,K. A. & Sokovykh, Y. A. 1972. Repetition rate ofranging signals of dolphins as a function of distance totarget. Biofizika, 17, 139–144.
Morton, A. B. 1990. A quantitative comparison of thebehaviour of resident and transient forms of killerwhales off the central British Columbia coast. Rep.int. Whal. Commn (special issue 12), 245–248.
Myrberg, A. A. 1981. Sound communication andinterception in fishes. In: Hearing and Sound Com-munication in Fishes (Ed. by W. Tavolga, A. N.Popper & R. R. Fay), pp. 395–426. New York:Springer-Verlag.
Nichol, L. M. 1990. Seasonal movements and foragingbehaviour of resident killer whales (Orcinus orca)in relation to the inshore distribution of salmon(Oncorhynchus sp.) in British Columbia. M.Sc. thesis,University of British Columbia.
Norris, K. S. 1967. Some observations on the migrationand orientation of marine mammals. In: Evolution andEnvironment (Ed. by E. Drake), pp. 101–125. NewHaven: Yale University Press.
Norris, K. S. 1969. The echolocation of marine mam-mals. In: The Biology of Marine Mammals. (Ed. byH. T. Andersen), pp. 391–423. New York: AcademicPress.
Animal Behaviour, 51, 3564

Norris, K. S. & Dohl, T. P. 1980. The structure andfunctions of cetacean schools. In: Cetacean Behavior:Mechanisms and Functions (Ed. by L. M. Herman),pp. 211–261. New York: Wiley.
Norris, K. S., Prescott, J. H., Asa-Dorian, P. V. &Perkins, P. 1961. An experimental demonstration ofecholocation behavior in the porpoise, Tursiopstruncatus (Montagu). Biol. Bull., 120, 163–176.
Norris, K. S. & Schilt, C. R. 1988. Cooperative societiesin three-dimensional space: on the origins of aggre-gations, flocks, and schools, with special reference todolphins and fish. Ethol. Sociobiol., 9: 149–179.
Olesiuk, P. F., Bigg, M. A. & Ellis, G. M. 1990. Lifehistory and population dynamics of resident killerwhales (Orcinus orca) in the coastal waters of BritishColumbia and Washington State. Rep. int. Whal.Commn (special issue 12), 209–243.
Roitblat, H. L., Penner, R. H. & Nachtigall, P. E. 1990.Matching-to-sample by an echolocating dolphin(Tursiops truncatus). J. exp. Psychol. Anim. Behav.Proc., 16, 85–95.
Saulitis, E. L. 1993. The behavior and vocalizationsof the ‘AT’ group of killer whales (Orcinus orca)in Prince William Sound, Alaska. M.Sc. thesis,University of Alaska.
Schevill, W. E. & Watkins, W. A. 1966. Sound structureand directionality in Orcinus (killer whale). Zoologica,51, 71–79.
Scronce, B. L. & Johnson, C. S. 1976. Bistatic targetdetection by a bottle-nosed porpoise. J. acoust. Soc.Am., 59, 1001–1002.
Stevens, T. A., Duffield, D. A., Asper, E. D., Hewlett,K. G., Bolz, A., Gage, L. J. & Bossart, G. D. 1989.Preliminary findings of restriction fragment differ-ences in mitochondrial DNA among killer whales(Orcinus orca). Can. J. Zool., 67, 2592–2595.
Terhune, J. M. 1988. Detection thresholds of a harbourseal to repeated underwater high-frequency, short-duration sinusoidal pulses. Can. J. Zool., 66, 1578–1582.
Thomas, J. A. & Turl, C. W. 1990. Echolocation char-acteristics and range detection threshold of a falsekiller whale. In: Sensory Abilities of Cetaceans (Ed. byJ. Thomas & R. Kastelein), pp. 321–334. New York:Plenum Press.
Watkins, W. A. &Wartzok, D. 1985. Sensory biophysicsof marine mammals. Mar. Mamm. Sci., 1, 219–260.
Wilkinson, G. S. 1992. Information transfer at eveningbat colonies. Anim. Behav., 44, 501–518.
Wilkinson, L. 1990. SYSTAT: The System for Statistics.Evanston, Illinois: Systat.
Wood, F. G. & Evans, W. E. 1980. Adaptiveness andecology of echolocation in toothed whales. In: AnimalSonar Systems (Ed. by R.-G. Busnel & J. F. Fish),pp. 381–425. New York: Plenum Press.
Würsig, B. 1989. Cetaceans. Science, 244, 1550–1557.
Barrett-Lennard et al.: Echolocation in killer whales 565


![Autonomous Vehicle Ultrasonic Sensor Vulnerability and Impact … · 2018-02-13 · Ultrasonic sensor (also known as sonar) is a sensor that uses echolocation (see Figure 1) [3] to](https://img.pdfslide.us/doc/110x75/5e7a6ad3d4a07a01c71e3c47/autonomous-vehicle-ultrasonic-sensor-vulnerability-and-impact-2018-02-13-ultrasonic.jpg)


![2 arXiv:1604.04138v1 [cs.NE] 14 Apr 2016 · Bat algorithm is a population metaheuristic proposed in 2010 which is based on the echolocation or bio-sonar characteristics of microbats](https://img.pdfslide.us/doc/110x75/5e07b73c128ceb27c33db034/2-arxiv160404138v1-csne-14-apr-2016-bat-algorithm-is-a-population-metaheuristic.jpg)


![RESEARCH ARTICLE Ranging in Human Sonar: Effects of ... · to represent their surrounding environment even in complete darkness, which is referred to as echolocation [1,2]. There](https://img.pdfslide.us/doc/110x75/5f5b7f731603a146224476ba/research-article-ranging-in-human-sonar-effects-of-to-represent-their-surrounding.jpg)