Embed Size (px)
Citation preview
SONAR JAMMING IN THE BAT-MOTH ARMS RACE
BY
AARON J. CORCORAN
A Dissertation Submitted to the Graduate Faculty of
WAKE FOREST UNIVERSITY GRADUATE SCHOOL OF ARTS AND SCIENCES
in Partial Fulfillment of the Requirements
for the Degree of
DOCTOR OF PHILOSOPHY
Biology
May, 2013
Winston-Salem, North Carolina
Approved By:
William E. Conner, Ph.D., Advisor
Nickolay Hristov, Ph.D., Chair
Miriam Ashley-Ross, Ph.D.
Robert Browne, Ph.D.
Susan Fahrbach, Ph.D.

ii
DEDICATION
To the late James Fullard, the primary proponent of the jamming hypothesis. You meant
so much to me, despite our brief acquaintance.
iii
ACKNOWLEDGEMENTS
To say thank you is not nearly enough for the numerous people who have inspired me, taught me, challenged my thinking repeatedly in the kindest of ways, and worked by my side night after night until the sun rose. But here I attempt to do just that.
First, I thank Dr. William (“Bill”) Conner, my academic advisor and mentor over the last five years. You taught me what it means to be a scientist in the most complete sense of the word. Somehow you always knew when to give me a push and when to let me find my own way (usually the latter). I know few people with your breadth of knowledge from genes to neurons to behaviors to ecosystems and more. And you have an uncanny ability to relate that knowledge to your students whether in the classroom or one-on-one. You taught me how to simplify a problem into its constituent parts and dissect it experimentally with the skill of a surgeon. Your door was always wide open, literally and figuratively and you treated me as a friend and colleague from day one.
I thank my academic committee – Drs. Miram Ashley-Ross, Robert Browne, Susan Fahrbach, and Nickolay Hristov – for pushing my boundaries as a scientist. I must also thank my master’s advisor, Dr. Joe Szewczak, for sharing his love of bats with me; my brothers Dan and Tim Corcoran and Tom Brown Jr. for inspiring in me a love of all things wild; and my mom and dad for teaching me to always follow my heart and for unending faith that I would find my path in life. I thank my wife, Lauren, for keeping me grounded and humble through this journey.
Many others contributed directly to my research. Dr. Jesse Barber and Dr. Nickolay Hristov, my academic elder brothers, set the stage for this work with their ground-breaking studies on bats and moths. They also selflessly helped me at every turn, be that training me how to care for and raise baby bats, how to use high-speed cameras or develop 3-D models, or whatever the moment demanded. I had five extraordinary Wake Forest undergraduate researchers – Megan Cullen, Wesley Johnson, Ryan Wagner, Zachary Walker, and Kaitlyn Roman – work with me over the summers at Wake and in southern Arizona. I could not have asked for a harder working or more insightful and intelligent group to work with than you. I am especially thankful to Ryan Wagner, whose exceptional devotion to the project led to chapter five of this dissertation. My good friends Jean-Paul Kennedy and Nick Dowdy also worked with me in the field in Arizona and your companionship and dedication made all the difference, especially on those nights when everything seemed to go wrong and all there was left to do was crack open a beer and watch the sun rise.
I am also especially grateful to the staff, interns and fellow researchers at the Southwestern Research Station where I spent four summers studying bats and moths. There are too many of you to name here, but your help and comradery brought me joy as
iv
much as did the charismatic bats and moths I got to know so well. Several people also helped with the many technological challenges of this work. Most notably, Jeff Muday was always at hand to fix a computer glitch, or even build a new computer. Mark Jenson built a custom microphone to specification for chapter five; Manfred Berger provided assistance with his Maxtraq software and Brad Chadwell graciously provided computer code and gave me lessons on 3D Geometry. Finally, I must thank Mindy Conner, who graciously edited many of the pages of this work. Of course any errors left here are mine alone.
Chapter-specific acknowledgements
Chapter II -- I thank F. Insana and the staff of the Southwestern Research Station for assistance collecting B. trigona; M. Cullen for providing bat care and training; N. Hristov and J. Muday for technical assistance; and B. Chadwell for software. M. Conner, J.-N. Jasmin, T. Eisner, and the Wake Forest University ecology group provided editorial comments. Funding for research was provided by National Science Foundation Grant IOB-0615164 to W.E.C. and a W.F.U. Dean’s Fellowship to A.J.C.
CHAPTER III – I am most grateful to Frank Insana, Jeff Paull, and the staff of the Southwestern Research Station for assistance collecting B. trigona; Megan Cullen for bat care; Jeff Muday for technical support; and Brad Chadwell for software development. Two anonymous reviewers provided several insightful and constructive comments. Funding was provided by grant #IOB-0615164 to W. E. C. by the National Science Foundation.
CHAPTER IV -- I thank Wesley Johnson, Ryan Wagner, Zachary Walker, Jean-Paul Kennedy, Nick Dowdy and several Southwestern Research Station interns for assistance in the field. Brad Chadwell provided software for 3-D calculations. Nickolay Hristov helped develop our field recording setup. Jeff Muday provided technical assistance, and the staff of the Southwestern Research Station provided valuable logistical support. Melinda Conner edited the manuscript, and two anonymous reviewers provided numerous valuable comments.
CHAPTER V -- I thank the staff and interns of the Southwestern Research Station of the American Museum of Natural History for logistical support. Dr. Bradley Chadwell provided software for 3-D analysis. Jeffrey Muday provided technical computing support. Funding was provided by National Science Foundation grant number IOS-0615164 and IOS-0951160 to W. E. C.

v
TABLE OF CONTENTS
Page
DEDICATION .................................................................................................................... ii
ACKNOWLEDGEMENTS ............................................................................................... iii
LIST OF FIGURES ......................................................................................................... viii
LIST OF TABLES ............................................................................................................. xi
ABSTRACT ...................................................................................................................... xii
CHAPTER I
Bats and tiger moths: an introduction ......................................................................1
CHAPTER II
Tiger moth jams bat sonar
Published in Science (2009)
ABSTRACT ...............................................................................................17
INTRODUCTION .....................................................................................18
METHODS ................................................................................................20
RESULTS/DISCUSSION..........................................................................21
REFERENCES AND NOTES ...................................................................24
SUPPORTING MATERIAL .....................................................................29
CHAPTER III
How do tiger moths jam bat sonar?
Published in Journal of Experimental Biology (2011)
ABSTRACT ...............................................................................................42
INTRODUCTION .....................................................................................43
vi
MATERIALS AND METHODS ...............................................................46
RESULTS ..................................................................................................53
DISCUSSION ............................................................................................58
CONCLUSION ..........................................................................................64
REFERENCES ..........................................................................................66
CHAPTER IV
Sonar jamming in the field: Effectiveness and behavior of a unique prey defense
Published in Journal of Experimental Biology (2012)
ABSTRACT ...............................................................................................83
INTRODUCTION .....................................................................................84
MATERIALS AND METHODS ...............................................................87
RESULTS ..................................................................................................93
DISCUSSION ............................................................................................96
CONCLUSION ........................................................................................105
REFERENCES ........................................................................................108
CHAPTER V
Optimal predator risk assessment by the sonar-jamming moth Bertholdia trigona
ABSTRACT .............................................................................................125
INTRODUCTION ...................................................................................126
MATERIALS AND METHODS .............................................................131
RESULTS ................................................................................................139
DISCUSSION ..........................................................................................143
REFERENCES ........................................................................................149

vii
CONCLUSIONS AND FUTURE DIRECTIONS...........................................................165
CURRICULUM VITAE ..................................................................................................169
viii
LIST OF FIGURES
CHAPTER I
Figure 1.1 Spectrogram of an echolocation attack sequence of a Myotis bat .............15
CHAPTER II
Figure 2.1 Jamming acoustic complex ........................................................................26
Figure 2.2 Predicted and observed success rates for Eptesicus fuscus attacking moths using various defensive strategies. ............................................................27
Figure 2.3 Example echolocation attack sequence of a bat being jammed by Bertholdia trigona .....................................................................................28
Figure 2.S1 Attack persistence of Eptesicus fuscus on clicking moths through successive foraging nights .........................................................................36
Figure 2.S2 Oscillogram of a Bertholdia trigona click modulation cycle. ...................37
CHAPTER III
Figure 3.1 Diagram illustrating bat flight parameters. ................................................72
Figure 3.2 Example pulse interval graph of a big brown bat unsuccessfully attacking a sonar-jamming moth. ..............................................................................73
Figure 3.3 Oscillograms, spectrograms and power spectra of an approach phase echolocation call of a big brown bat (Eptesicus fuscus) and two overlapping click modulation cycles of Bertholdia trigona. .....................74
Figure 3.4 Three categories of bat behavioral responses to moth clicks, as illustrated by bat flight and echolocation behavior. ....................................................75
Figure 3.5 The distribution of bat responses to moth jamming changed after the first two nights of the experiment......................................................................76
ix
Figure 3.6 Spectrograms of three attacks on silent control or clicking experimental moths. .........................................................................................................77
Figure 3.7 Simulations of competing hypotheses of sonar-jamming mechanisms .....79
CHAPTER IV
Figure 4.1 Diagram of field recording setup .............................................................115
Figure 4.2 Ethogram showing results of bats attacking clicking and silenced Bertholdia trigona. ...................................................................................116
Figure 4.3 Three-dimensional flight trajectories of bats attacking clicking, and silenced Bertholdia trigona exhibiting defensive maneuvers. .................117
Figure 4.4 Percentage of bat attacks in which Bertholdia trigona exhibited defensive behaviors, and bat capture rates on moths exhibiting different combinations of behaviors .......................................................................118
Figure 4.5 Percentage of moths diving, and captured by bats relative to moth distance from a light source. ..................................................................................119
Figure 4.6 Box plots of bat-moth distances and bat echolocation pulse intervals at the initiation of Bertholdia trigona defenses and bat approaching behavior .120
Figure 4.7 Directionality of Bertholdia trigona diving behavior in response to bat attack ........................................................................................................121
Figure 4.8 Cross-species comparison of the effectiveness of insect defenses at preventing capture by bats. ......................................................................122
CHAPTER V
Figure 5.1 Hypothesized predator risk level as it relates to predation stage .............156
Figure 5.2 Three-dimensional simulation of the sonar beam of a bat attacking a moth, and a spectrogram of the bat echolocation sequence with two-dimensional plots of the bat’s echolocation beam shape and direction relative to the target ........................................................................................................157
x
Figure 5.3 Three-dimensional schematic of field setup for recording bat attacks on tethered and free-flying moths .................................................................158
Figure 5.4 Acoustic and kinematic characterization of “real” and “false” threats ....159
Figure 5.5 Predicted and actual clicking thresholds for different bat echolocation pulse-intervals in Bertholdia trigona .......................................................161
Figure 5.6 Discrimination of bat passes that did or did not elicit clicking by tethered Bertholdia trigona in the field. ................................................................162
Figure 5.7 Cost-benefit models of escape behavior with varying prey knowledge of predator attack stage ................................................................................164
xi
LIST OF TABLES
CHAPTER II
Table 2.S1 Contact rates for repeated big brown bat attacks on individual Bertholdia trigona ........................................................................................................38
Table 2.S2 Click parameters for the tiger moth Bertholdia trigona. ...........................39
CHAPTER III
Table 3.1 Multiple linear regressions of bat flight and echolocation responses to moth jamming. ...........................................................................................80
Table 3.2 Bat echolocation responses to moth jamming ...........................................81
CHAPTER IV
Table 4.1 Capture rates of Bertholdia trigona by bat species ..................................123
xii
ABSTRACT
Aaron J. Corcoran
SONAR-JAMMING IN THE BAT-MOTH ARMS RACE
Dissertation under the direction of William E. Conner, Ph.D. Professor of Biology
Bats and moths are an example of a diffuse evolutionary arms race – a situation
where groups of prey and predator species evolve increasingly sophisticated means to
out-compete the other. Chapter one provides an overview of this arms race. Bats capture
night-flying insects using highly sophisticated echolocation and flight. Most
macrolepidoptera are eared and bat echolocation calls stimulate evasive flight reactions.
Some tiger moths (Lepidoptera: Erebidae, subfamily Arctiinae) also respond to bats with
trains of ultrasonic clicks which 1) truthfully or deceitfully warn bats of a distasteful prey,
2) startle bats, or 3) interfere with or jam bat sonar. Evidence is strong for the warning
and startle hypotheses, although the startle effect is ephemeral. The jamming hypothesis
has not been confirmed to occur in nature.
In chapter two I tested the sonar jamming hypothesis using a moth (Bertholdia
trigona) that clicks at over 1000% of the rate of other tiger moths that have been studied
behaviorally. I pitted tethered B. trigona and silent control moths against naïve, lab-
reared big brown bats (Eptesicus fuscus) in a flight room over seven nights, followed by
two nights against B. trigona with ablated tymbal organs. The bats captured control
moths 400% more often than clicking B. trigona. Bats ate 78% of silenced B. trigona,
refuting the acoustic aposematism hypothesis. Bats failed to habituate to the clicking
moths, rendering startle highly unlikely. The pattern of bat capture success matched the
predictions of the jamming hypothesis. Additionally, the bat echolocation’s pattern
xiii
during attack was disrupted by moth clicking. We conclude that moths that click at a high
rate jam bat sonar, a first in the natural world.
In chapter three I analyzed 3-D flight trajectories and echolocation behavior of
bats attacking jamming moths to determine how moth clicks interfere with bat sonar. I
simulated attacks based on three hypotheses from the literature. Predictions based on the
ranging interference hypothesis were largely met. This hypothesis holds that moth clicks
disrupt the bat’s ability to determine the time of arrival of returning echoes, and therefore
the distance of the prey. It was previously shown that moth clicks degrade bat ranging
ability from 5 mm to 20 cm; I found that bats missed prey by 15.7 ± 7.9 cm, a margin
very close to what was previously predicted. Moth clicks occurred in the narrow 1-ms
window required for ranging interference 78% of the time.
Chapter four reports the results of the first field study on bats and insects to
capture interactions in 3-D. Sonar jamming is highly effective in nature, as B. trigona
with ablated tymbals were caught ten times more often than clicking B. trigona. Jamming
is about three times as effective as evasive flight alone. B. trigona exhibited evasive flight
including directional fly-aways and dives. Diving and jamming was particularly effective
as all moths exhibiting both behaviors escaped bats.
In chapter five I address why moths click when they do using the perspective of
optimal escape theory. Employing a combination of field and laboratory studies, I
demonstrate that moth clicking thresholds closely match predicted optimal thresholds for
discriminating legitimate attacks and “false attacks” where bats attack nearby moths.
Moths clicked as soon they could reliably determine they were under attack.
1
CHAPTER I
BATS AND TIGER MOTHS: AN INTRODUCTION
Arms races – situations where competing organisms evolve reciprocally
repeatedly over time – have fascinated biologists because of the intricate and
sophisticated adaptations that often result from them (Dawkins and Krebs, 1979). Prey
and predator are one system where arms races sometimes occur. Selection is thought to
act more strongly on prey because their consequences for failure (death) are greater than
that for predator (a lost meal). This is called the life-dinner principle (Dawkins and Krebs,
1979). Indisputable examples of reciprocal evolution between individual prey and
predator species (coevolution) are rare at least in part because prey often have many
predators and predators usually have many prey (Brodie and Brodie, 1999). Groups of
predators and prey evolving reciprocally is termed diffuse coevolution (Janzen, 1980),
however concrete examples of this phenomenon are also rare (Goerlitz, 2010; Vermeij,
1994). Bats and insects provide one of the best-studied examples of a diffuse
coevolutionary arms race, with over 800 bat species predating uncountable species of
insects (Jones and Rydell, 2003). This diversity has allowed for the evolution of many
novel defensive strategies and predator counter-tactics (Conner and Corcoran, 2012).
This dissertation is an exploration of one defensive strategy that has not previously been
confirmed to occur in the natural world – sonar jamming. In this introduction I discuss
some strategies used by bats and insects in this coevolutionary battle, the evidence for
and against sonar jamming and a brief overview of the chapters that follow.
2
A. Insectivorous bats
There are over 1200 extant bat species that evolved from a common ancestor at least
52.5 mya (Jepsen, 1966; Schipper et al. 2008; Simmons et al., 2008; Simmons and
Conway, 2003). Bats evolved flight first, followed by laryngeal echolocation (Simmons
et al., 2008). These features allow bats to be the dominant predator of night skies, with
about 70% of species eating insects in almost all inhabitable locations worldwide (Jones
and Rydell, 2003). Bats capture insects in the air (hawking), off the ground or vegetation
(gleaning), and from the surface of water (trawling) primarily using echolocation
(Schnitzler and Kalko, 2001; Fenton, 1990).
Bats sense insect prey and other objects in their environment by comparing the timing
and time-frequency characteristics of emitted signals with those of returning echoes; this
is termed echolocation, biosonar, or sonar (Griffin et al., 1960; Moss and Surlykke, 2001).
While capturing insects out of the air, bats modify their echolocation in a stereotyped
pattern where pulse repetition rates increase and durations, call intensities and
frequencies decrease (Figure 1.1; Surlykke and Moss, 2000). These changes help
maximize temporal resolution of prey location while avoiding overlap between outgoing
and returning sounds (Wilson and Moss, 2004). In the final phase of echolocation before
insect capture – the terminal buzz – bats emit sounds at over 160 pulses per second using
the fastest known mammalian muscle (Elemens et al., 2011).
B. Insect flight and hearing
Insects evolved flight at least 350 mya, some 90 million years before the first
winged vertebrates (Grimaldi and Engel, 2005). Flying nocturnal insects were likely an
3
underexploited food resource until the evolution of bats (Jones and Rydell, 2003). Insects
from 7 orders have evolved bat-detecting ears at least 18 times in locations all over the
body (Hoy, 1998; Yack and Dawson, 2008). These ears alert ground-dwelling insects like
katydids to be still and flying insects like moths to begin evasive flight when an
echolocating bat is near (Belwood and Morris, 1987; Roeder, 1967). Insect hearing
usually matches the range of frequencies used by conspecific bat communities (Fullard,
1998). In many cases bat-detection is the only known function for insect ears; however
this defensive ability appears to have preadapted some insects for acoustic courtship
displays (Conner, 1999; Nakano et al. 2009).
C. Anti-bat insect defenses
Insect defensive responses to bats – and particularly those of moths – have been the
subject of numerous studies over the last five decades (reviewed by Miller and Surlykke,
2001; Yager et al. 2012; Conner and Corcoran, 2012). Kenneth Roeder is credited with
many discoveries that made moth defensive responses to bats a textbook example of a
behavior whose neurological basis is known (Roeder, 1967). This discovery was aided by
the simple two-neuron auditory nerve of most Noctuid moths (Roeder, 1964; Roeder,
1966). These two neurons are the more sensitive A1 cell and the less sensitive A2 cell.
When the A1 cell fires in response to the faint calls of distant bats, moths fly away from
the sound source to avoid being detected (Roeder, 1962; Roeder, 1974). When the A2
cell fires (or possibly when the A1 and A2 cells fire above a set rate), this indicates a
nearby bat in pursuit, and the moths initiate powered or passive dives, loops, or spirals to
avoid capture (Roeder, 1974; Fullard et al. 2003; Ratcliffe et al. 2009). Many tiger moths
(Lepidoptera: Erebidae, Subfamily Arctiinae), also produce trains of ultrasonic clicks in
4
response attack echolocation of bats (Fullard and Fenton, 1977; Barber and Conner, 2006;
Corcoran et al. 2010). The function of these clicks has been the matter of some debate.
Fifty years of research has produced three hypotheses on why moths click to bats.
First, the warning, or aposematism hypothesis states that clicks serve as an acoustic
message to bats of an unpalatable prey. Many tiger moth caterpillars sequester toxins
from host plants and carry them into adulthood (Nishida, 2002); some adult tiger moths
also seek toxins from plants that make them distasteful to bats (Conner and Weller, 2004;
Hristov and Conner, 2005a). Mounting evidence shows that warning of this toxicity is the
primary function for tiger moth clicking in most species (Dunning, 1968; Hristov and
Conner, 2005b; Ratcliffe and Fullard, 2005). Bats must learn the association between
clicking and toxic prey; it is not innate. However, this can happen very quickly over a
small number of trials (Bates and Fenton, 1990; Hristov and Conner, 2005b). This
observation was used to tease apart the relative contributions of clicking and toxins in
deterring bats using a novel learning approach where naïve, lab-reared bats were pitted
against prey that varied in their abilities to click and in the presence or absence of toxins
(Hristov and Conner, 2005b). Bats only failed to capture clicking prey when they were
chemically defended – a clear demonstration of the aposematic function of the clicks.
This learning approach was also used to demonstrate Batesian and Mullerian mimicry
in tiger moths (Barber and Conner, 2007). After bats learn the aposematic message of
moth clicks, they will generalize that message to other species, regardless of whether the
novel species is chemically defended. Interestingly, some bats correctly uncovered the
deceitful mimics. This demonstrates the tight selective pressure that forces mimics to
acoustically resemble their models (Barber and Conner, 2007; Barber et al. 2009).
5
The second hypothesized function for moth clicks is that they startle bats at a critical
moment of the attack, affording the moth a moment to escape. Startle has been
demonstrated in several studies (Miller, 1991; Stoneman and Fenton, 1988; Bates and
Fenton, 1990), however the effect is ephemeral. Bats usually habituate to moth clicks
within a few trials. Therefore, a startle defense can only be relied upon when clicking
moths are rare. Startle has similarities with the third hypothesis – sonar jamming – in that
both rely upon disorienting the predator. Sonar jamming is different from startle in that
the moth clicks must interfere with the bat’s echolocation. This hypothesis is the subject
of this dissertation and the evidence for and against it will now be reviewed.
D. The sonar jamming debate
The term “sonar jamming” was first used in the literature in 1979 by James Fullard
and colleagues (Fullard et al. 1979). However, some have interpreted earlier work by
Dunning and Roeder (1965) to be suggestive of the jamming hypothesis. Dunning and
Roeder played moth clicks to bats through a loudspeaker as the bats pursued mealworms
that were catapulted through the air. The moth clicks deterred the bats; however the
control of broadcasted echolocation calls had no effect. They suggested that since the bats
did not learn to ignore the clicks over time and capture the palatable mealworms that the
clicks themselves deterred the bats. However, it was later acknowledged that the results
of the experiment were invalid, as the moth clicks were broadcast at an unnaturally high
intensity (Dunning, 1968). Dunning later conducted experiments demonstrating the
aposematic function of moth clicks (Dunning, 1968), and Roeder also favored this
explanation (Roeder, 1967).
6
Fullard and colleagues have been the strongest proponents of the jamming
hypothesis. It was originally argued that moth clicks bear strong acoustic similarities to
bat calls, and bats would not be able to differentiate the two (Fullard et al. 1979). Bats
would then mistake moth clicks as echoes from objects that don’t exist (“phantom
objects”) and bats would either try to avoid flying into phantom objects or try to capture
phantom targets. Since this hypothesis was proposed much has been learned about bats’
abilities for discriminating sounds. This work suggests that bats would have little
difficulty differentiating moth clicks from echoes (Masters and Raver, 1996; Yovel et al.
2009; Corcoran et al. 2010).
Fullard also suggested that the timing of moth clicking is suggestive of a jamming
function (Fullard, 1994). Using playbacks of bat attack sequences to moths in a sound
chamber, Fullard found that the moths click most during the terminal phase. He argued
that this would be too late for the clicks to serve an aposematic function, and that clicking
late is suggestive of jamming. However, this prediction was not held, as clicks presented
late in the attack are effective aposematic messages (Hristov and Conner, 2005b;
Ratcliffe and Fullard, 2005; Barber and Conner, 2007).
The most compelling evidence for sonar jamming prior to this dissertation began
with the work of Lee Miller (Miller, 1991). Miller used a psychophysical experiment to
test the effect of moth clicks on a bat’s ability to determine the distance of a target (this is
called ranging). In his experiment a bat was placed on a Y-shaped platform in an
“echolocation simulator”. When the bat echolocated, its calls were recorded by a nearby
microphone and then time-delayed and broadcast back to the bat to simulate targets at
different distances. If a target was presented at a pre-determined reference distance, the
7
bat was rewarded for moving to one side of the Y-shaped platform; if the target was
presented at a different distance the bat was rewarded for moving to the other side of the
platform. This was repeated with and without moth clicks being broadcast with the
echoes and the timing of the moth clicks relative to the returning echoes was carefully
controlled and adjusted in fine increments. Miller found that without moth clicks, bats
could determine target distance to within 5 mm, but when moth clicks were presented
within a narrow 1-ms window before the echoes, ranging errors increased by up to
4000%. The moth clicks appeared to interfere with the bats ability to accurately
determine the timing of the returning echo, and therefore the distance to the target.
This hypothesis – termed the ranging interference hypothesis – was given further
support by a neurophysiological study where bat short pure tones and moth clicks were
broadcast to bats while electrophysiological recordings were made of neurons in the bat
inferior colliculus (IC; Tougaard et al. 1998). The IC has been implicated as a region
where bats encode information about target distance (Covey and Casseday, 1991).
Tougaard and colleagues demonstrated that when moth clicks occurred in the 1-ms
window prior to a tone (representing an echo), they caused errors in the timing of IC
neuron firing in response to the tone. If these errors propagated through the bat auditory
system they could explain the ranging interference observed by Miller (1991). Because
moths have no way of knowing when a bat will be calling, they cannot predict when to
click to match the critical 1-ms window. The only remaining strategy is to click at a very
high rate to ensure some clicks will fall in this window by chance (Miller 1991; Tougaard
et al. 1998). In a study documenting the diversity of sounds made by tiger moths (Barber
and Conner, 2006), several species were identified that produce clicks at an unusually
8
high rate. These moths make over ten times the number of clicks of any of the tiger moth
species whose clicking function has been studied in detail.
I hypothesized that the high clicking rate of some tiger moth species allows them
to jam bat sonar. In Chapter II, I report the results of an experiment pitting a moth with
extraordinary clicking ability (Bertholdia trigona) against naïve, lab-reared bats using a
previously established behavioral learning paradigm (Hristov and Conner, 2005b; Barber
and Conner, 2007). In Chapter III, I analyze the results of this experiment using 3-D
analysis of bat flight trajectories and detailed bioacoustic analysis of bat echolocation
patterns to address the question of how tiger moths jam bat sonar. In Chapter IV I report
the results of the first study to capture bat-insect interactions in 3-D in the natural
environment. This study was conducted using the same focal moth species – Bertholdia
trigona—and I examine the relative contributions of clicking and evasive flight to bat
deterrence. Finally, in Chapter V I report the results of an experiment aimed at answering
the question of why moths click when they do. I use the perspective of optimal escape
theory to demonstrate that moth clicking thresholds closely match predicted optimal
thresholds for discriminated predator risk levels.
9
LITERATURE CITED
Barber, J. R. and Conner, W. E. (2006). Tiger moth responses to a simulated bat attack:
timing and duty cycle. Journal of Experimental Biology 209, 2637-2650.
Barber, J. R. and Conner, W. E. (2007). Acoustic mimicry in a predator–prey
interaction. Proceedings of the National Academy of Sciences USA 104, 9331.
Barber, J. R., Chadwell, B. A., Garrett, N., Schmidt-French, B. and Conner, W. E.
(2009). Naïve bats discriminate arctiid moth warning sounds but generalize their
aposematic meaning. Journal of Experimental Biology 212, 2141-2148.
Bates, D. L. and Fenton, M. B. (1990). Aposematism or startle? Predators learn their
responses to the defenses of prey. Canadian Journal of Zoology 68, 49-52.
Belwood, J. J. and Morris, G. K. (1987). Bat predation and its influence on calling
behavior in neotropical katydids. Science. 238, 64-66.
Brodie III, E. D. and Brodie Jr, E. D. (1999). Predator-prey arms races. Bioscience 49,
557-568.
Conner, W. E. (1999). ‘Un chant d'appel amoureux’: acoustic communication in moths.
Journal of Experimental Biology 202, 1711-1723.
Conner, W. E. and Corcoran, A. J. (2012). Sound Strategies: The 65 Million-Year-Old
Battle Between Bats and Insects. Annual Review of Entomology 57, 21-39.
Conner, W. E. and Weller, S. (2004). A quest for alkaloids: the curious relationship
between tiger moths and plants containing pyrrolizidine alkaloids. In Advances in
Insect Chemical Ecology (ed. R.T. Carde, J. G. Millar).pp. 248-282 Cambridge
UK: Cambridge University Press.
Corcoran, A. J., Conner, W. E. and Barber, J. R. (2010). Anti-bat tiger moth sounds:
10
Form and function. Current Zoology 56, 358-369.
Covey, E. and Casseday, J. H. (1999). Timing in the auditory system of the bat. Annual
Review of Physiology 61, 457-476.
Dawkins, R., and Krebs, J. R.(1979). Arms races between and within species.
Proceedings of the Royal Society of London. Series B 205, 489-511.
Dunning, D. C. (1968). Warning sounds of moths. Zeitschrift für Tierpsychologie 25,
129-138.
Dunning, D. C. and Roeder, K. D. (1965). Moth sounds and the insect-catching
behavior of bats. Science 147, 173-174.
Elemans, C. P. H., Mead, A. F., Jakobsen, L. and Ratcliffe, J. M. (2011). Superfast
muscles set maximum call rate in echolocating bats. Science 333, 1885-1888.
Fenton, M. B. (1990). The foraging behaviour and ecology of animal-eating bats.
Canadian Journal of Zoology 68, 411-422.
Fullard, J. H. (1998). The sensory coevolution of moths and bats. In Comparative
Hearing: Insects, (eds. R. R. Hoy, A. N. Popper and R. R. Fay), pp. 279-326.
New York: Springer-Verlag.
Fullard, J. H. and Fenton, M. B. (1977). Acoustic and behavioural analyses of the
sounds produced by some species of Nearctic Arctiidae (Lepidoptera). Canadian
Journal of Zoology 55, 1213-1224.
Fullard, J. H., Fenton, M. B. and Simmons, J. A. (1979). Jamming bat echolocation:
the clicks of arctiid moths. Canadian Journal of Zoology 57, 647-649.
Fullard, J. H., Simmons, J. A. and Saillant, P. A. (1994). Jamming bat echolocation:
the dogbane tiger moth Cycnia tenera times its clicks to the terminal attack calls
11
of the big brown bat Eptesicus fuscus. Journal of Experimental Biology 194, 285-
298.
Goerlitz, H. R., ter Hofstede, H. M., Zeale, M. R. K., Jones, G. and Holderied, M. W.
(2010). An aerial-hawking bat uses stealth echolocation to counter moth hearing.
Current Biology 20, 1568-1572.
Griffin, D. R., Webster, F. A. and Michael, C. R. (1960). The echolocation of flying
insects by bats. Animal Behaviour 8, 141-154.
Grimaldi, D. and Engel, M. S. (2005). Evolution of the Insects. Cambridge: Cambridge
University Press.
Hoy, R. R. (1998). Acute as a bug’s ear: an informal discussion of hearing in insects. In
Comparative hearing: insects, (eds. R. R. Hoy, A. N. Popper and R. R. Fay), pp.
1-17 New York: Springer-Verlag.
Hristov, N. I. and Conner, W. E. (2005a). Effectiveness of tiger moth (Lepidoptera,
Arctiidae) chemical defenses against an insectivorous bat (Eptesicus fuscus).
Chemoecology 15, 105-113.
Hristov, N. I. and Conner, W. E. (2005b). Sound strategy: acoustic aposematism in the
bat–tiger moth arms race. Naturwissenschaften 92, 164-169.
Janzen, D. H. (1980). When is it coevolution. Evolution 34, 611-612.
Jepsen, G. L. (1966). Early Eocene bat from Wyoming. Science 154, 1333-1339.
Jones, G. and Rydell, J. (2003). Attack and defense: interactions between echolocating
bats and their insect prey. In Bat Ecology, (eds. T. H. Kunz and M. B. Fenton), pp.
301-345. Chicago: The University of Chicago Press.
Masters, W. and Raver, K. (1996). The degradation of distance discrimination in big
12
brown bats (Eptesicus fuscus) caused by different interference signals. Journal of
Comparative Physiology A: Neuroethology, Sensory, Neural, and Behavioral
Physiology 179, 703-713.
Miller, L. A. (1991). Arctiid moth clicks can degrade the accuracy of range difference
discrimination in echolocating big brown bats, Eptesicus fuscus. Journal of
Comparative Physiology A 168, 571-579.
Miller, L. A. and Surlykke, A. (2001). How some insects detect and avoid being eaten
by bats: tactics and countertactics of prey and predator. Bioscience 51, 570-581.
Moss, C. F. and Surlykke, A. (2001). Auditory scene analysis by echolocation in bats.
The Journal of the Acoustical Society of America 110, 2207.
Nakano, R., Takanashi, T., Fujii, T., Skals, N., Surlykke, A. and Ishikawa, Y. (2009).
Moths are not silent, but whisper ultrasonic courtship songs. Journal of
Experimental Biology 212, 4072-4078.
Nishida, R. (2002). Sequestration of defensive substances from plants by Lepidoptera.
Annual Review of Entomology 47, 57-92.
Ratcliffe, J. M. and Fullard, J. H. (2005). The adaptive function of tiger moth clicks
against echolocating bats: an experimental and synthetic approach. Journal of
Experimental Biology 208, 4689-4698.
Ratcliffe, J. M., Fullard, J. H., Arthur, B. J. and Hoy, R. R. (2009). Tiger moths and
the threat of bats: decision-making based on the activity of a single sensory
neuron. Biology Letters 5, 368-371.
Roeder, K. D. (1962). The behaviour of free flying moths in the presence of artificial
ultrasonic pulses. Animal Behaviour 10, 300-304.
13
Roeder, K. D. (1964). Aspects of the noctuid tympanic nerve response having
significance in the avoidance of bats. Journal of Insect Physiology 10, 529-532.
Roeder, K. D. (1966). Acoustic sensitivity of the noctuid tympanic organ and its range
for the cries of bats. Journal of Insect Physiology 12, 843-859.
Roeder, K. D. (1967). Nerve Cells and Insect Behavior. Cambridge, MA: Harvard
University Press.
Roeder, K. D. (1974). Acoustic sensory responses and possible bat-evasion tactics of
certain moths, In Proceedings of the Canadian Society of Zoologists’ Annual
Meeting (Ed. M.D. B. Burt). pp. 71-78. Fredericton, Canada: University of New
Brunswick Press
Schipper, J., Chanson, J. S., Chiozza, F., Cox, N. A., Hoffmann, M., Katariya, V.,
Lamoreux, J., Rodrigues, A. S. L., Stuart, S. N. and Temple, H. J. (2008). The
status of the world's land and marine mammals: diversity, threat, and knowledge.
Science 322, 225-230.
Schnitzler, H. U. and Kalko, E. K. V. (2001). Echolocation by insect-eating bats.
Bioscience 51, 557-569.
Simmons, N. and Conway, T. (2003). Evolution of ecological diversity in bats. In Bat
Ecology, (eds. T. H. Kunz and M. B. Fenton), pp. 493-535. Chicago: The
University of Chicago Press.
Simmons, N. B., Seymour, K. L., Habersetzer, J. and Gunnell, G. F. (2008). Primitive
Early Eocene bat from Wyoming and the evolution of flight and echolocation.
Nature 451, 818-821.
Stoneman, M. and Fenton, M. (1988). Disrupting foraging bats: the clicks of arctiid
14
moths. In Animal Sonar: Processes and Performance. (ed. P. E. Nachtigall and P.
W. B. Moore) pp. 635-638. NATO ASI Series, Series A: Life Sciences vol. 156
New York: Plenum Press
Surlykke, A. and Moss, C. F. (2000). Echolocation behavior of big brown bats,
Eptesicus fuscus, in the field and the laboratory. The Journal of the Acoustical
Society of America 108, 2419.
Tougaard, J., Casseday, J. and Covey, E. (1998). Arctiid moths and bat echolocation:
broad-band clicks interfere with neural responses to auditory stimuli in the nuclei
of the lateral lemniscus of the big brown bat. Journal of Comparative Physiology
A 182, 203-215.
Vermeij, G. J. (1994). The evolutionary interaction among species: selection, escalation,
and coevolution. Annual Review of Ecology and Systematics, 25, 219-236.
Wilson, W. W. and Moss, C. F. (2004). Sensory-motor behavior of free-flying FM bats
during target capture. In Echolocation in Bats and Dolphins, (eds. J. A. Thomas C.
F. Moss and M. Vater), pp. 22-27. Chicago: University of Chicago Press.
Yack, J. and Dawson, J. (2008). Insect ears. In The Senses: a Comprehensive Reference,
vol. 3 (eds. R. Hoy, G. Shepherd, A. Basbaum, A. Kaneko and G. Westheimer),
pp. 35-54. Waltham, MA: Elsevier.
Yager, D. D. (2012). Predator detection and evasion by flying insects. Current Opinion
in Neurobiology. 22, 201-207.
Yovel, Y., Melcon, M. L., Franz, M. O., Denzinger, A. and Schnitzler, H. U. (2009).
The voice of bats: how greater mouse-eared bats recognize individuals based on
their echolocation calls. PLoS Computational Biology 5, e1000400.
15
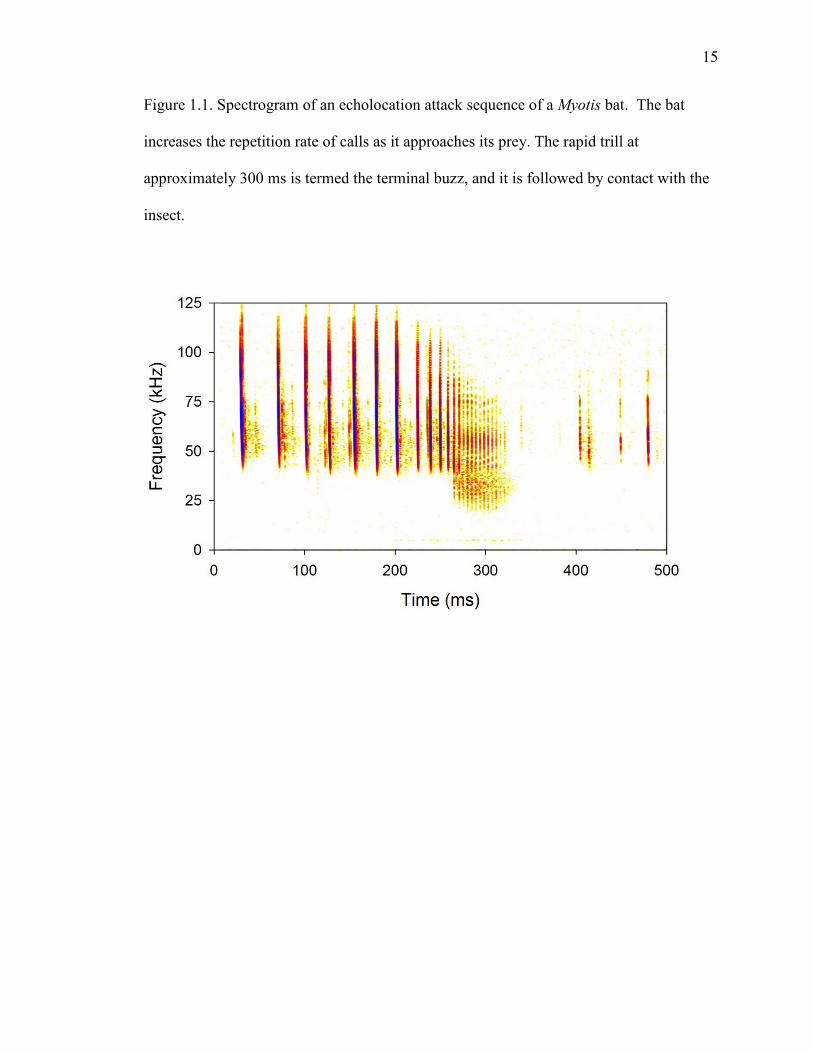
Figure 1.1. Spectrogram of an echolocation attack sequence of a Myotis bat. The bat
increases the repetition rate of calls as it approaches its prey. The rapid trill at
approximately 300 ms is termed the terminal buzz, and it is followed by contact with the
insect.
16
CHAPTER II
Tiger Moth Jams Bat Sonar
Aaron J. Corcoran, Jesse R. Barber, and William E. Conner
The following manuscript was published in Science (vol. 325, pgs. 325-327, 2009) and is
reprinted with permission. Stylistic variations are due to requirements of the journal.
A.J.C. contributed to experiment design, executed the experiments, conducted data
analysis, and wrote the manuscript. J.R.B. collected moths in the field and assisted with
experimental design. W.E.C. designed the experiments, assisted with animal care and
provided oversight and editorial assistance on the project.
17
ABSTRACT
In response to sonar-guided attacking bats, some tiger moths make ultrasonic clicks of
their own. The lepidopteran sounds have previously been shown to alert bats of some
moths’ toxic chemistry and also to startle bats unaccustomed to sonic prey. The moth
sounds could also interfere with, or “jam,” bat sonar, but evidence for such jamming has
been inconclusive. Using ultrasonic recording and high-speed infrared videography of
bat-moth interactions, we show that the palatable tiger moth Bertholdia trigona defends
against attacking big brown bats (Eptesicus fuscus) using ultrasonic clicks that jam bat
sonar. Sonar jamming extends the defensive repertoire available to prey in the long-
standing evolutionary arms race between bats and insects.
18
INTRODUCTION
The ability to pinpoint airborne insects in darkness, by echolocation (1), allowed bats to
master nocturnal insectivory (2) and set the stage for the evolution of defensive
countermeasures by insect prey (3). Some insects gained ears (4) and evasive
maneuvering (5). Tiger moths (Lepidoptera: Erebidae, subfamily Arctiinae) developed
the ability to click ultrasonically in response to attacking bats (6, 7). Decades of research
on moth click defenses have led to three non-mutually exclusive hypotheses regarding
their function: startle (8), acoustic aposematism (“warning”) (8-14), and sonar
interference (“jamming”) (15-17). When ultrasonic clicks are paired with unpalatable
prey, bats learn to perceive clicks as a warning of unprofitability (8, 10-14). Moth clicks
also startle inexperienced bats or bats that have not heard clicks for multiple days (8).
Because bats habituate to startle quickly, its effectiveness as a defense requires clicking
moths to be rare. This situation does not appear typical in nature (12).
Finally, moth clicks may disrupt the sonar of an attacking bat (15-17). Clicks might
diminish a bat’s acuity in determining target distance (17-19), or feign echoes from
objects that do not exist (15). However, evidence that moth clicks can disrupt bat attacks
by jamming sonar is lacking. One recent study found that moth clicks had no discernible
effect on attacking bats unless clicks were paired with defensive chemistry (13). All
previous studies, however, have tested moths with relatively low duty cycles, or sound
production per unit time (20). High-duty-cycle moth clicks, such as those of Bertholdia
trigona (Fig. 2.1; Table 2.S2), are more likely to jam bats (17, 18), including the big
brown bat (Eptesicus fuscus), which co-occurs with B. trigona in much of Central
America and northward to Colorado, USA.
19
To determine whether the clicks of B. trigona startle, warn, or jam bats, we pitted E.
fuscus against B. trigona in a flight room equipped with high-speed infrared video
cameras and an ultrasonic microphone (21). The pattern of a naive bat’s success in
catching clicking moths, when measured over several days, should differ for each of the
three proposed moth click functions (Fig. 2.2A) (13). For a warning sound, bats initially
capture and drop distasteful moths, then learn to abort attacks on hearing clicks (8, 13,
22). Alternatively, a bat could be initially startled by the clicks but would quickly
habituate to the sounds (8, 23). A jamming defense, however, would immediately deter
attacking bats and the effect of the defense would persist with time (Fig.2. 2A).
20
METHODS
We trained three naive juvenile E. fuscus (“J1”, “J2”, and “J3”) and one adult E. fuscus
(“A1”) to capture tethered moths in a sound-attenuated flight room. Naive bats allow us
to control prior experience, while an adult bat’s prior experience catching insects may
allow it to better overcome moth defense. On each of nine consecutive nights, 16 tethered
moths – four B. trigona; four silent, palatable, size-matched noctuid novelty controls; and
eight silent, palatable wax moths (female Galleria mellonella; used in pre-experiment bat
training) – were presented to each bat individually in a random order. Bats were allowed
up to one minute or five approaches for each moth. We presented unaltered B. trigona to
the bats on nights one through seven, and B. trigona lacking the ability to click (from
tymbal ablation) on nights eight and nine. Seventy-eight percent of the B. trigona (87 of
112) responded acoustically to bat sonar. The few intact B. trigona that did not produce
sound in response to bat attack were excluded from the analysis. We used contact with
the moths as our measure of attack success. Palatability of B. trigona to each bat was
taken as the proportion of captured moths eaten rather than dropped. We conducted
feeding trials with silenced moths and four additional stationary bats to further assess the
palatability of B. trigona. Finally, we analyzed echolocation recordings to measure bat
behavioral response to moth clicks (21).
21
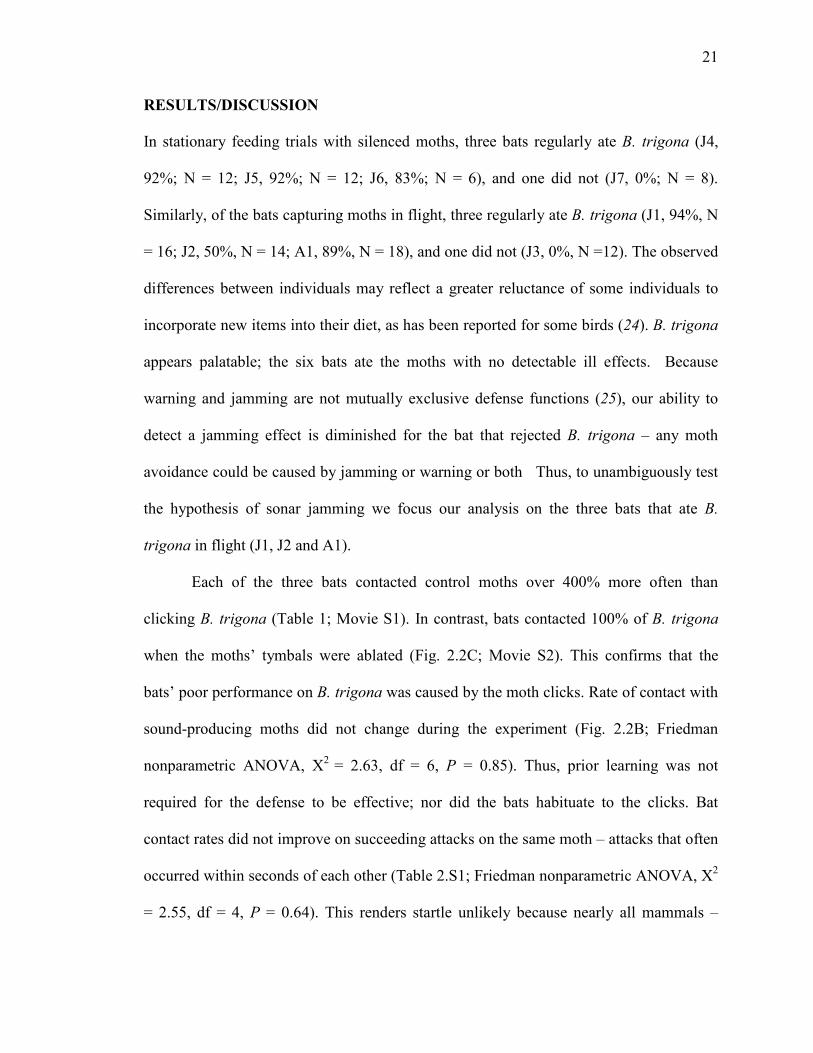
RESULTS/DISCUSSION
In stationary feeding trials with silenced moths, three bats regularly ate B. trigona (J4,
92%; N = 12; J5, 92%; N = 12; J6, 83%; N = 6), and one did not (J7, 0%; N = 8).
Similarly, of the bats capturing moths in flight, three regularly ate B. trigona (J1, 94%, N
= 16; J2, 50%, N = 14; A1, 89%, N = 18), and one did not (J3, 0%, N =12). The observed
differences between individuals may reflect a greater reluctance of some individuals to
incorporate new items into their diet, as has been reported for some birds (24). B. trigona
appears palatable; the six bats ate the moths with no detectable ill effects. Because
warning and jamming are not mutually exclusive defense functions (25), our ability to
detect a jamming effect is diminished for the bat that rejected B. trigona – any moth
avoidance could be caused by jamming or warning or both Thus, to unambiguously test
the hypothesis of sonar jamming we focus our analysis on the three bats that ate B.
trigona in flight (J1, J2 and A1).
Each of the three bats contacted control moths over 400% more often than
clicking B. trigona (Table 1; Movie S1). In contrast, bats contacted 100% of B. trigona
when the moths’ tymbals were ablated (Fig. 2.2C; Movie S2). This confirms that the
bats’ poor performance on B. trigona was caused by the moth clicks. Rate of contact with
sound-producing moths did not change during the experiment (Fig. 2.2B; Friedman
nonparametric ANOVA, X2 = 2.63, df = 6, P = 0.85). Thus, prior learning was not
required for the defense to be effective; nor did the bats habituate to the clicks. Bat
contact rates did not improve on succeeding attacks on the same moth – attacks that often
occurred within seconds of each other (Table 2.S1; Friedman nonparametric ANOVA, X2
= 2.55, df = 4, P = 0.64). This renders startle unlikely because nearly all mammals –
22
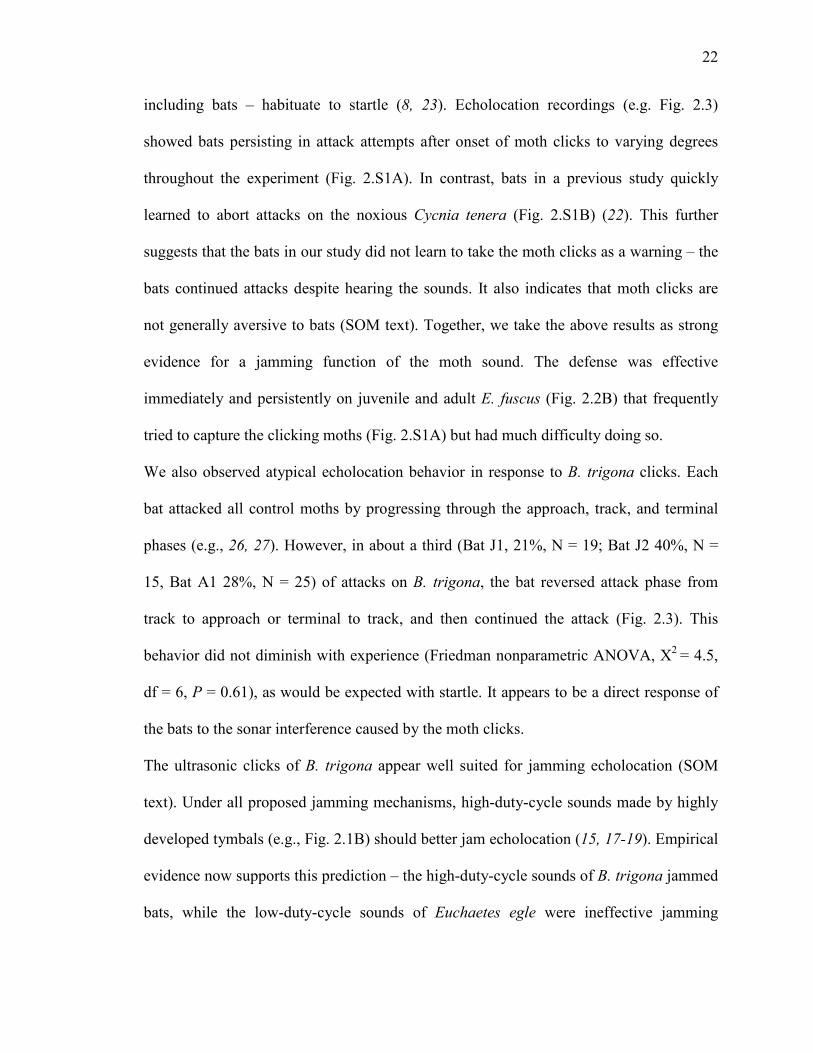
including bats – habituate to startle (8, 23). Echolocation recordings (e.g. Fig. 2.3)
showed bats persisting in attack attempts after onset of moth clicks to varying degrees
throughout the experiment (Fig. 2.S1A). In contrast, bats in a previous study quickly
learned to abort attacks on the noxious Cycnia tenera (Fig. 2.S1B) (22). This further
suggests that the bats in our study did not learn to take the moth clicks as a warning – the
bats continued attacks despite hearing the sounds. It also indicates that moth clicks are
not generally aversive to bats (SOM text). Together, we take the above results as strong
evidence for a jamming function of the moth sound. The defense was effective
immediately and persistently on juvenile and adult E. fuscus (Fig. 2.2B) that frequently
tried to capture the clicking moths (Fig. 2.S1A) but had much difficulty doing so.
We also observed atypical echolocation behavior in response to B. trigona clicks. Each
bat attacked all control moths by progressing through the approach, track, and terminal
phases (e.g., 26, 27). However, in about a third (Bat J1, 21%, N = 19; Bat J2 40%, N =
15, Bat A1 28%, N = 25) of attacks on B. trigona, the bat reversed attack phase from
track to approach or terminal to track, and then continued the attack (Fig. 2.3). This
behavior did not diminish with experience (Friedman nonparametric ANOVA, X2 = 4.5,
df = 6, P = 0.61), as would be expected with startle. It appears to be a direct response of
the bats to the sonar interference caused by the moth clicks.
The ultrasonic clicks of B. trigona appear well suited for jamming echolocation (SOM
text). Under all proposed jamming mechanisms, high-duty-cycle sounds made by highly
developed tymbals (e.g., Fig. 2.1B) should better jam echolocation (15, 17-19). Empirical
evidence now supports this prediction – the high-duty-cycle sounds of B. trigona jammed
bats, while the low-duty-cycle sounds of Euchaetes egle were ineffective jamming

23
signals under nearly identical conditions (13). The use of tiger moth sound for aposematic
signaling requires only simple tymbal structure and appears widespread in the Arctiidae
(7, 10-13). Thus, acoustic aposematism may have been a stepping-stone in the
evolutionary development of a jamming signal, a unique acoustic countermeasure in the
long-standing arms race between bats and their insect prey.
24
REFERENCES AND NOTES
1. D. R. Griffin, Anim. Behav. 8, 141-154 (1960).
2. H. U. Schnitzler, E. K. V. Kalko, Bioscience 51, 557-569 (2001).
3. L. A. Miller, A. Surlykke, BioScience 51, 570-581 (2001).
4. K. D. Roeder, J. Insect Physiol. 10, 529-546 (1964).
5. K. D. Roeder, Anim. Behav. 10, 300-304 (1962).
6. A. D. Blest, Zoologica 49, 161-181 (1964).
7. S. J. Weller, N. L. Jacobsen, W. E. Conner, Biol. J. Linn. Soc. 68, 557-578 (1999).
8. D. L. Bates, M. B. Fenton, Can. J. Zool. 68, 49-52 (1990).
9. D. C. Dunning, K. D. Roeder, Science 147, 173-174 (1965).
10. D. C. Dunning, Z. Tierpsychol. 25, 129-138 (1968).
11. L. Acharya, M. B. Fenton, Can. J. Zool. 70, 1292-1298 (1992).
12. D. C. Dunning, L. Acharya, C. B. Merriman, L. Dal Ferro, Can. J. Zool. 70, 2218-
2223 (1992).
13. N. I. Hristov, W. E. Conner, Naturwissenschaften 92, 164-169 (2005).
14. A. Surlykke, L. A. Miller, J. Comp. Physiol. A 156, 831-843 (1985).
15. J. H. Fullard, M. B. Fenton, J. A. Simmons, Can. J. Zool. 57, 647-649 (1979).
16. J. H. Fullard, J. A. Simmons, P. A. Saillant, J. Exp. Biol. 194, 285-298 (1994).
17. L. A. Miller, J. Comp. Physiol. A 168, 571-579 (1991).
18. J. Tougaard, J. H. Casseday, E. Covey, J. Comp. Physiol. A 182, 203-215 (1998).
19. J. Tougaard, L. A. Miller, J. A. Simmons, in Echolocation in Bats and Dolphins, J.
A. Thomas, C. F. Moss, M. Vater, eds. (Univ. of Chicago Press, Chicago, 2004)
pp. 365-380.
25
20. J. R. Barber, W. E. Conner, J. Exp. Biol. 209, 2637-2650 (2006).
21. Materials and methods are available as supporting material on Science Online.
22. J. R. Barber, W. E. Conner, Proc. Natl. Acad. Sci. U.S.A. 104, 9331-9334 (2007).
23. M. Davis, in Neural Mechanisms of Startle Behavior, R. C. Eaton, Ed. (Plenum Press,
New York, 1984), pp. 287-351.
24. N. M. Marples, T. J. Roper, D. G. Harper, Oikos 83, 161-165 (1998).
25. J. M. Ratcliffe, J. H. Fullard, J. Exp. Biol. 208, 4689-4698 (2005).
26. S. A. Kick, J. A. Simmons, Neuroscience 4, 2725-2737 (1984).
27. W. W. Wilson, C. F. Moss, in Echolocation in Bats and Dolphins, J. A. Thomas, C.
F. Moss, M. Vater, eds. (Univ. of Chicago Press, Chicago, 2004) pp. 365-380.
26
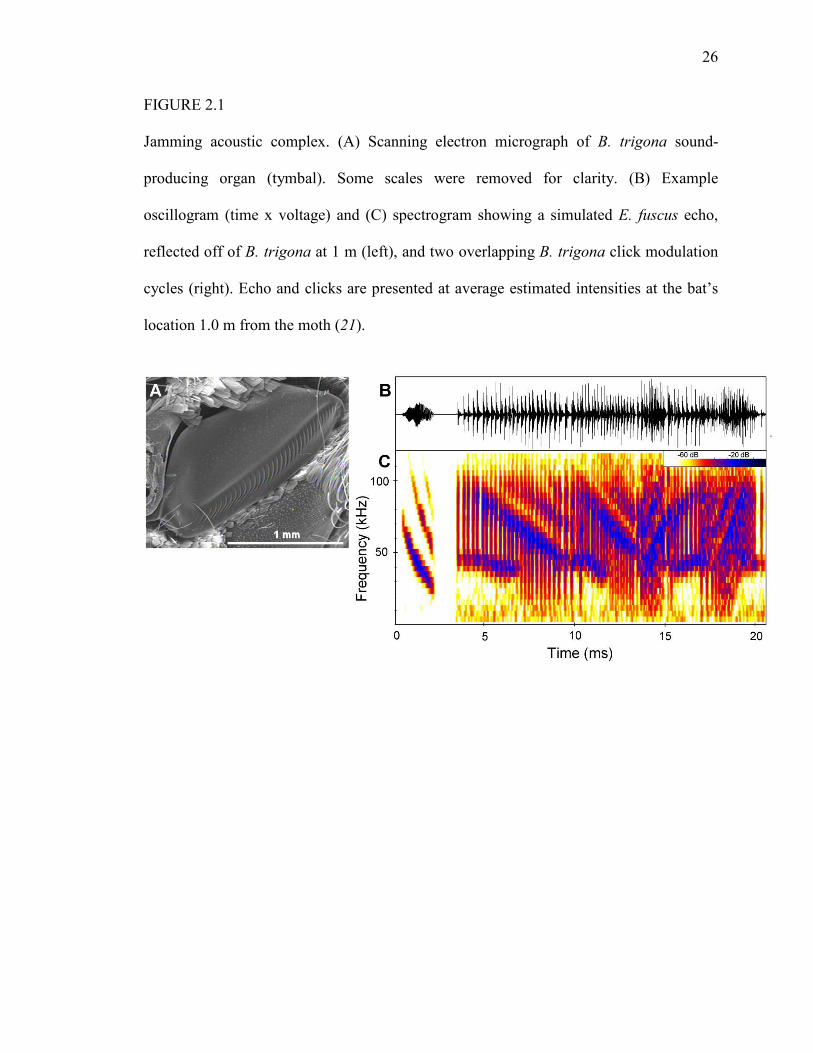
FIGURE 2.1
Jamming acoustic complex. (A) Scanning electron micrograph of B. trigona sound-
producing organ (tymbal). Some scales were removed for clarity. (B) Example
oscillogram (time x voltage) and (C) spectrogram showing a simulated E. fuscus echo,
reflected off of B. trigona at 1 m (left), and two overlapping B. trigona click modulation
cycles (right). Echo and clicks are presented at average estimated intensities at the bat’s
location 1.0 m from the moth (21).
27
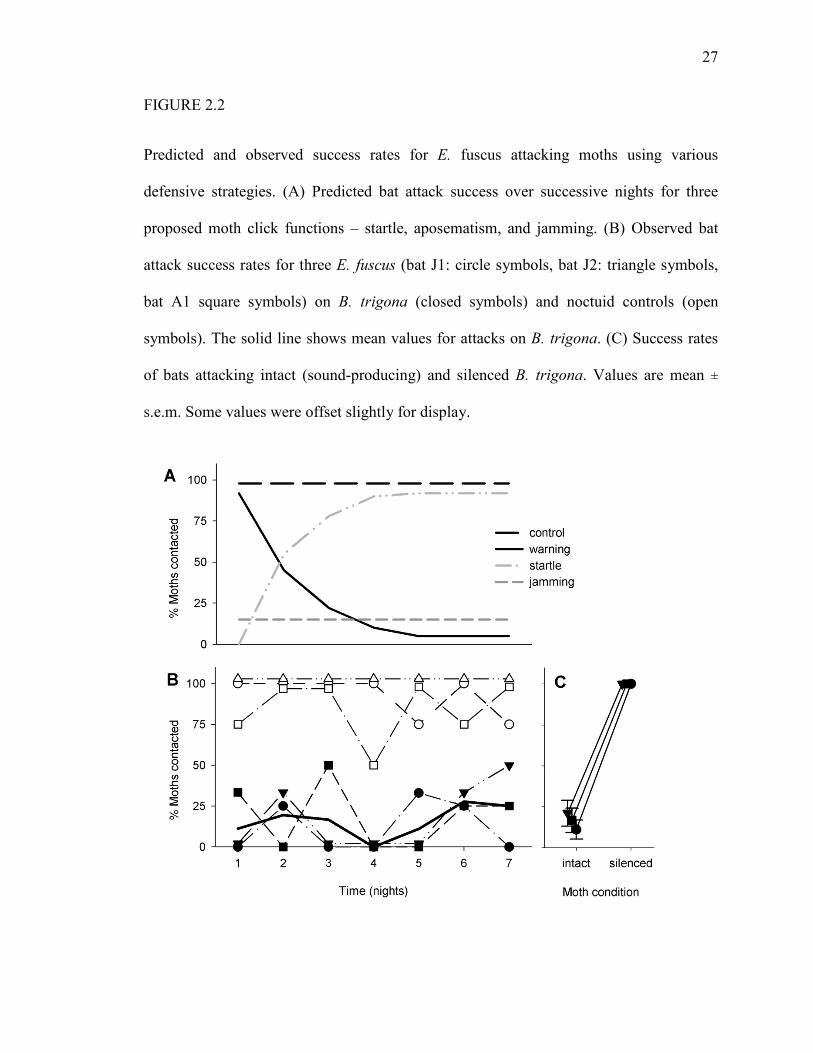
FIGURE 2.2
Predicted and observed success rates for E. fuscus attacking moths using various
defensive strategies. (A) Predicted bat attack success over successive nights for three
proposed moth click functions – startle, aposematism, and jamming. (B) Observed bat
attack success rates for three E. fuscus (bat J1: circle symbols, bat J2: triangle symbols,
bat A1 square symbols) on B. trigona (closed symbols) and noctuid controls (open
symbols). The solid line shows mean values for attacks on B. trigona. (C) Success rates
of bats attacking intact (sound-producing) and silenced B. trigona. Values are mean ±
s.e.m. Some values were offset slightly for display.
28
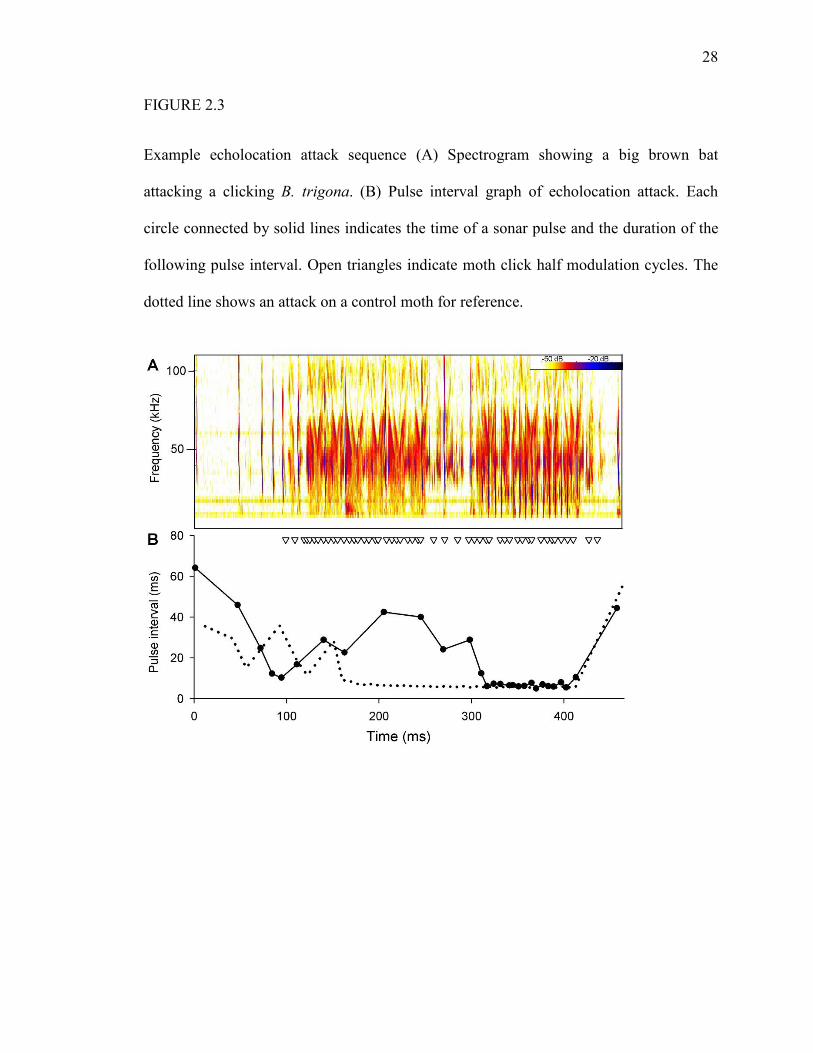
FIGURE 2.3
Example echolocation attack sequence (A) Spectrogram showing a big brown bat
attacking a clicking B. trigona. (B) Pulse interval graph of echolocation attack. Each
circle connected by solid lines indicates the time of a sonar pulse and the duration of the
following pulse interval. Open triangles indicate moth click half modulation cycles. The
dotted line shows an attack on a control moth for reference.
29
SUPPORTING MATERIAL
MATERIALS and METHODS
Animals. All vertebrate care was conducted in accordance with Wake Forest University’s
Animal Care and Use Committee guidelines (ACUC # A04-188). One adult female and
several pre-volant juvenile big brown bats were taken from a roost in Winston-Salem,
NC, and brought into the lab at Wake Forest University. Bat care and training methods
replicated that of ref. S1 for E. fuscus. Noctuid and geometrid moths used for training and
in experiments were captured at outdoor lights on the Wake Forest University campus in
Winston-Salem, NC. B. trigona were captured at UV lights at the Southwestern Research
Station near Portal, Arizona, and shipped overnight to our facility at Wake Forest
University.
Equipment. Experiments were conducted in an anechoic indoor flight room (5.8 x 4.0 x
3.0 m). Bat-moth interactions were recorded at 250 frames per second by two digital
high-speed video cameras (Photron FastCam PCI© 500, Tokyo, Japan) using Photron
FastCam Viewer v.2.4© installed on a desktop computer. Nine Wildlife Engineering©
(Tucson, AZ, USA) LED arrays provided infrared illumination and a low-intensity deep
red light allowed for behavioral observation by the experimenter. We recorded
ultrasound, synced to the video, using a Petterson Elektronik© D940 bat detector
connected via a National Instruments® (Austin, TX, USA) 6062 PCMCIA A/D to a
laptop computer running Bat Sound Pro© v.3.3.We used a 250 kHz sampling rate. The
microphone was directed downward from the ceiling 1.2 m from each of two walls.
Moths were tethered directly below the microphone on a thin, 60 cm monofilament line.
30
Video recordings were used to confirm the results of each bat-moth interaction and to
reconstruct the positions of animals and the microphone (see below).
3D Reconstruction. The locations of the bat, moth, and microphone and the flight
direction of the bat were calculated using a 3D reconstruction. The interaction space was
calibrated using 192 points from four calibration frames over a volume of 140 x 150 x
210 cm. Each point was digitized from each camera view in a custom Matlab® (Natick,
Massachusetts, USA) program (S2) that fit a set of Direct Linear Transformation (DLT)
coefficients to the data. Video files were subsequently calibrated using the DLT
coefficients in a second Matlab® program (S2). The “center-of-object” for the bat and
moth and the tip of the microphone were digitized from video files. Another custom
Matlab® program (BATracker.m; coded by B. Chadwell) fit a quintic smoothing spline
(Matlab® spaps routine) to the 3D coordinates. Distances between bat, moth, and
microphone were measured using the smoothed data from each video frame. The time
derivative of the bat’s spline function provided the animal’s flight direction.
Bioacoustic Analysis. Locations of echolocation calls within recordings were extracted
using a custom version of SonoBAT® v. 2.8 (DnDesign, Arcata, CA). For each recording
we measured the sequence of echolocation phases (approach, track, terminal buzz)
employed by the bat. We required two or more successive pulse intervals of the same
phase to mark a transition, as single aberrant pulse intervals normally occur in E. fuscus
attack sequences (S3). We determined echolocation phase for E. fuscus based on the
following pulse interval ranges: approach, >30 ms; track, 12-30 ms; terminal 5-12 ms
(S4). To ensure that the bat had time to react to the moth clicks, we used the presence of

31
five or more track phase or terminal phase calls made after the onset of moth clicks to
indicate a continuing attack. Moth click definitions and measurement methods match
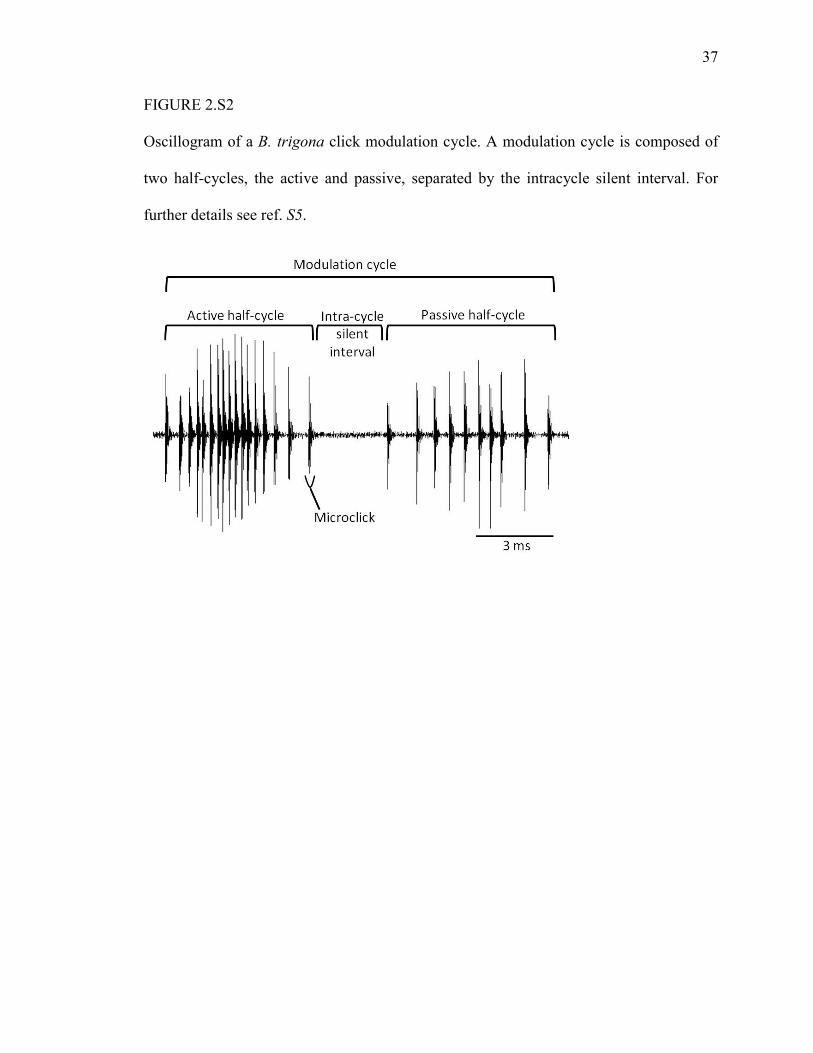
those of ref. S5. The inward and outward buckling of a moth tymbal (Fig. 2.1A) generates
a train of microclicks called a modulation cycle (Fig. 2.S2). This cycle is divided into the
active half-cycle (the inward buckling), the passive half-cycle (the outward buckling),
and the intra-cycle silent interval. Each half-cycle comprises a series of microclicks
produced by the buckling of microtymbals (the fine ridges in Fig. 2.1A). Duty cycle is
sound production per unit time. Maximum duty cycle was estimated by counting the
number of microclicks within a 100 ms interval where click production peaked. This
number was then multiplied by the average microclick duration and divided by 100 ms.
Temporal parameters of clicks were measured from oscillograms using BatSound© Pro v.
3.3. Spectral features were measured from a power spectrum of a modulation cycle.
Measurements were taken from one modulation cycle per bat-moth recording unless
otherwise indicated. Microclick duration was averaged over five microclicks per
modulation cycle.
We used a standardized distance of 1 m for comparing intensities of echoes and moth
clicks at the bat’s location (Fig. 2.1B). This ratio should be relatively constant at the bat’s
location as it flies within 1 m of the moth. For each halving of distance, moth click
intensity increases by 6 dB. Echoes would normally increase by 12 dB per halving of
distance, but bats decrease the intensity of their emissions by about 6 dB per halving of
distance within 1-2 m of a target (S6, S7). Therefore, the increases in moth click and echo
intensities would be roughly equivalent as the bat closes within 1-2 m of the moth. At 1
m, the bat directs its relatively wide sonar beam (-3 dB beamwidth of 70º) in the direction
32
of the target (S8), which was nearly directly below the microphone (7.6º ± 6.7 s.d.
angular deviation from the bat’s position). Using the 3D reconstruction for each
interaction, we found the time when the bat closed within 1 m of the moth and selected
the echolocation call produced nearest to this time. We then calculated the RMS
intensities of this echolocation call and the first moth click modulation cycle
uninterrupted by a bat call. Several adjustment factors were necessary to estimate the
call:click ratio at the bat’s location. At 1 m from the moth, bats were 59º (± 10º s.d.) off-
axis from the microphone. Our microphone showed an 18 dB decrease in sensitivity for
sound sources recorded from this position relative to an on-axis sound source. The
difference in vertical angle between the vectors from bat to moth and bat to microphone
was 23º (±6.7 s.d.). The shape of the vertical component of the bat’s sonar beam in flight
is not fully known (S9), but the observed angle approximates the edge of the -6 dB
beamwidth measured from an electrically stimulated, anesthetized E. fuscus (S10). We
assumed an attenuation of 45 dB between the emitted bat call and returning echo from a
moth the size of B. trigona (34 mm wingspan, 12 mm body length) at 1 m (S11). The
horizontal and vertical position of the moth was assumed to change randomly as it
fluttered on the tether. We therefore assumed equal moth click intensity directed toward
the microphone and bat. Finally, we adjusted for attenuation of sound due to spherical
spreading, accounting for the distances between bat, moth, and microphone.
Statistical Analysis. Much of our data were heteroscedastic and taken repeatedly on
individual bats across nights and on successive attacks on individual moths. We therefore
used paired, nonparametric statistics. For investigating learning behavior between nights
or between successive attacks on the same moth we used a Friedman’s ANOVA. For

33
comparing contact rates between successive attacks we used only those bat-moth sessions
with five approaches; for all other comparisons we used only the first encounter between
each bat and moth. Analysis was conducted in SPSS® v. 16.0 (SPSS, Chicago, IL), and
all alpha levels were set to 0.05.
34
SUPPORTING TEXT
While it is beyond the scope of this study to determine the mechanism of jamming
employed by B. trigona, the moth’s clicks appear well suited for that task. (Fig. 2.1,
Table 2.S2). The moths can produce up to 456 microclicks in 0.1 s and can approach a
duty cycle of 100% (Table 2.S2), virtually guaranteeing that clicks occur within the
crucial time window necessary for diminishing the bat’s target-ranging acuity (Table
2.S2, refs. S12, S13) or masking echoes (S14). The frequency modulation of B. trigona
clicks (Fig. 2.1B) may reproduce the sonic signature of the bat’s own call sufficiently for
the bat to mistake clicks as echoes from objects that do not exist (S15). And finally, the
high duty cycle and spectral complexity of B. trigona clicks could overload the bat’s
acoustic processing networks, causing further degradation in echo processing ability
(S16).
A reviewer suggested that these same qualities could make an alternative hypothesis to
jamming more likely – the clicks may be unpleasantly loud but not interfere with bat
sonar. However, neither the intensity of moth clicks nor bat behavior support this
hypothesis. We estimated that within 1 m of the moth, click intensity was about 5 dB
greater than echo intensity, or about as loud as an echo from a large moth; this level is
unlikely to be aversive to bats. Previous studies using stationary E. fuscus in a target
simulator found that extraneous echoes, noise, and moth clicks played at up to 21 dB
greater than echoes, but temporally isolated from echoes, had no effect on bat
echolocation ability (S14, S17). On the contrary, bats were often attracted to the
extraneous sounds as they learned to associate them with a food reward (S17). When
35
similar sounds were played within about 1 ms of the start of an echo, the bat’s ability to
discriminate distances of targets was degraded up to 400% (S12, S13). In our study the
bats also had the opportunity to associate extraneous sound with a food reward – each of
the bats ate B. trigona in the few cases when capture occurred. The bats frequently flew
close to sonic prey rather than aborting attacks and turning away (Movie S1). It therefore
appears unlikely that the clicks were unpleasantly loud for the bats, which would quickly
learn to avoid an acoustically noxious moth just as they would a chemically noxious one
(Fig. 2.S2). A more likely explanation is that the high-duty-cycle moth clicks, which
frequently preceded and co-occurred with echoes, caused ranging errors and, or masking
sufficient to prevent the bat from accurately tracking and capturing its prey.
36
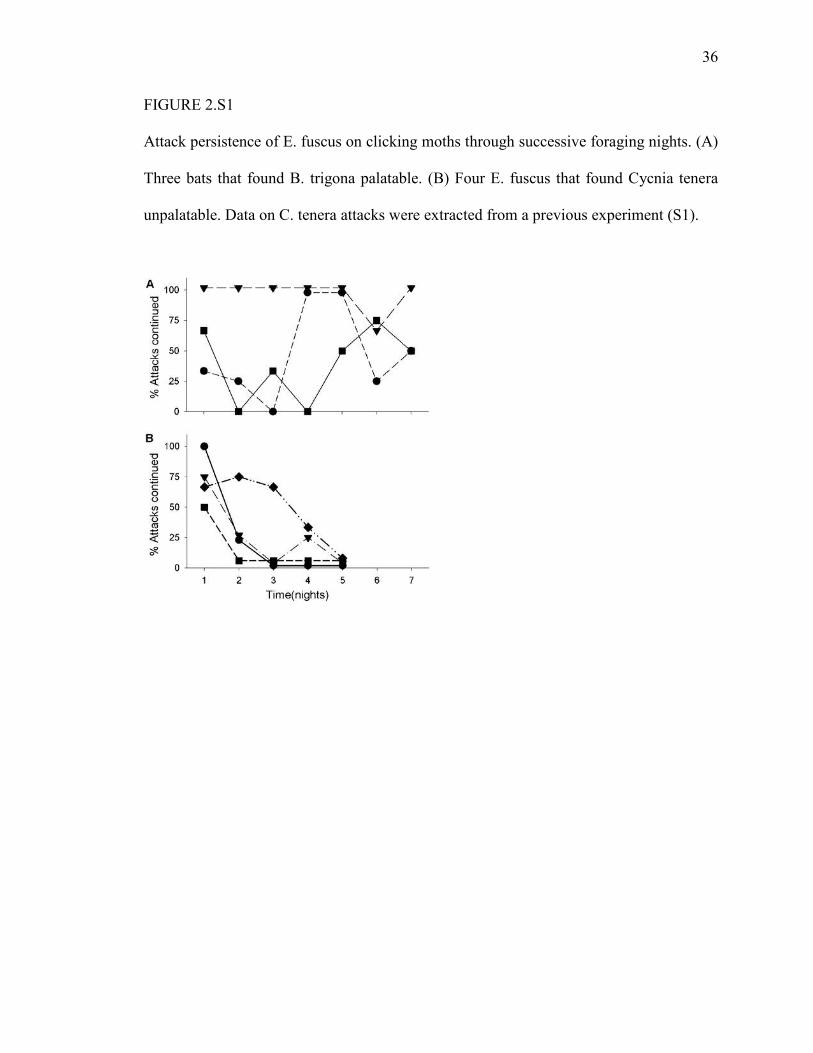
FIGURE 2.S1
Attack persistence of E. fuscus on clicking moths through successive foraging nights. (A)
Three bats that found B. trigona palatable. (B) Four E. fuscus that found Cycnia tenera
unpalatable. Data on C. tenera attacks were extracted from a previous experiment (S1).
37
FIGURE 2.S2
Oscillogram of a B. trigona click modulation cycle. A modulation cycle is composed of
two half-cycles, the active and passive, separated by the intracycle silent interval. For
further details see ref. S5.
38
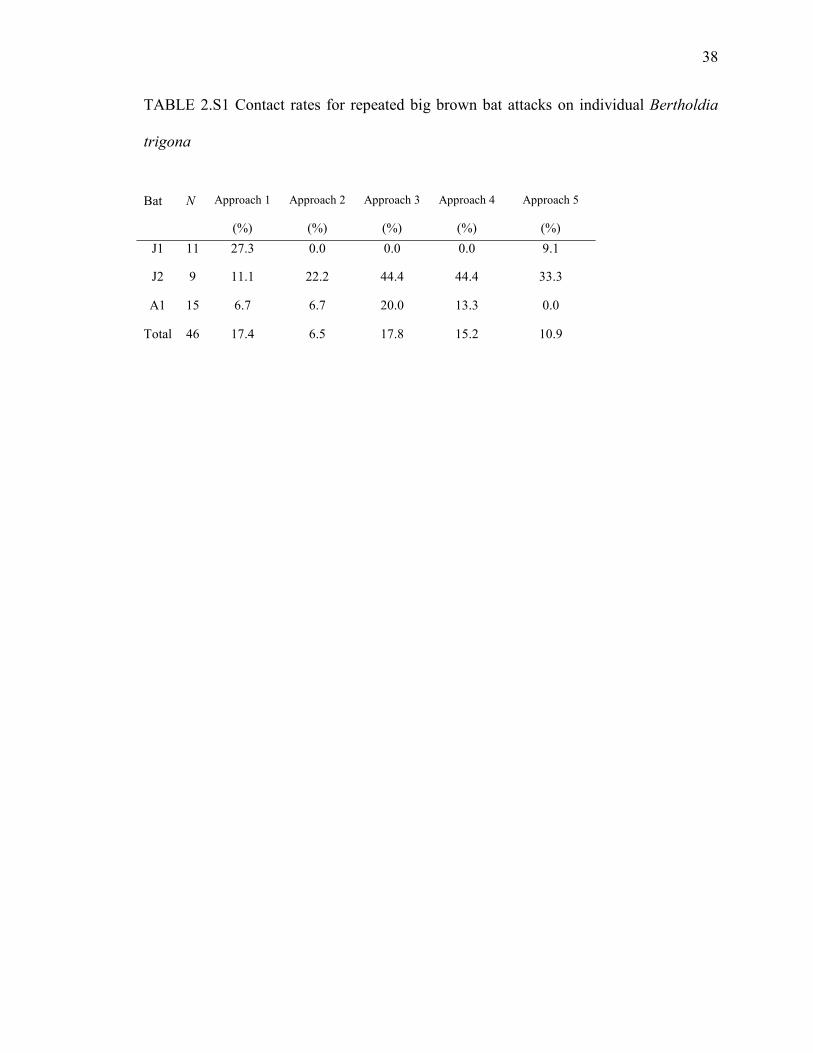
TABLE 2.S1 Contact rates for repeated big brown bat attacks on individual Bertholdia
trigona
Bat N Approach 1
(%)
Approach 2
(%)
Approach 3
(%)
Approach 4
(%)
Approach 5
(%)J1 11 27.3 0.0 0.0 0.0 9.1
J2 9 11.1 22.2 44.4 44.4 33.3
A1 15 6.7 6.7 20.0 13.3 0.0
Total 46 17.4 6.5 17.8 15.2 10.9
39
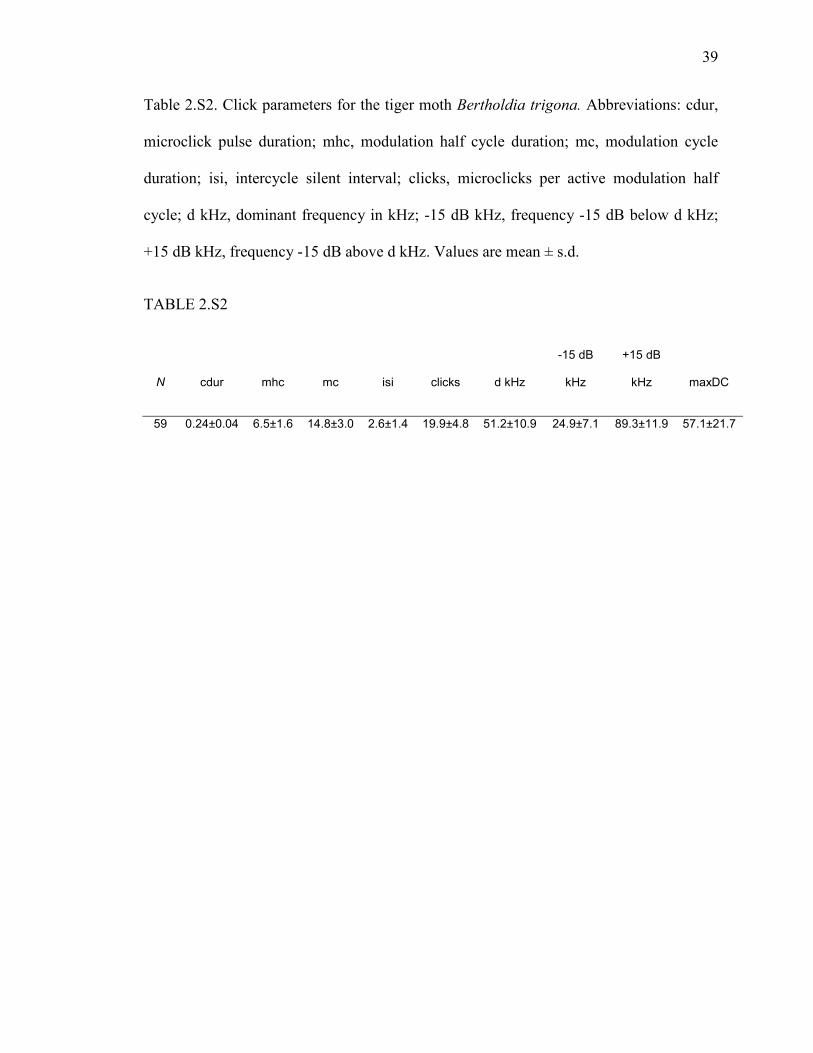
Table 2.S2. Click parameters for the tiger moth Bertholdia trigona. Abbreviations: cdur,
microclick pulse duration; mhc, modulation half cycle duration; mc, modulation cycle
duration; isi, intercycle silent interval; clicks, microclicks per active modulation half
cycle; d kHz, dominant frequency in kHz; -15 dB kHz, frequency -15 dB below d kHz;
+15 dB kHz, frequency -15 dB above d kHz. Values are mean ± s.d.
TABLE 2.S2
N cdur mhc mc isi clicks d kHz
-15 dB
kHz
+15 dB
kHz maxDC
59 0.24±0.04 6.5±1.6 14.8±3.0 2.6±1.4 19.9±4.8 51.2±10.9 24.9±7.1 89.3±11.9 57.1±21.7
40
SUPPORTING REFERENCES
S1. J. R. Barber, W. E. Conner, Proc. Natl. Acad. Sci. U.S.A. 104, 9331-9334 (2007).
S2. T. L. Hedrick, Bioinsp. Biomim. 3, 034001 (2008).
S3. W. W. Wilson, C. F. Moss, in Echolocation in Bats and Dolphins, J. A. Thomas,
C. F. Moss, M. Vater, eds. (Univ. of Chicago Press, Chicago, 2004) pp. 365-380.
S4. S. A. Kick, J. A. Simmons, Neuroscience 4, 2725-2737 (1984).
S5. J. R. Barber, W. E. Conner, J. Exp. Biol. 209, 2637-2650 (2006).
S6. D. J. Hartley, J. Acoust. Soc. Am.91, 1133-1149 (1992).
S7. S. Hiryu, T. Hagino, H. Riquimaroux, Y. Watanabe, J. Acoust. Soc. Am. 121, 1749-
1757 (2007).
S8. K. Ghose, C. F. Moss J. Acoust. Soc. Am.114, 1120-1131 (2003).
S9. K. Ghose, C. F. Moss, J. Acoust. Soc. Am.122, 3717-3724 (2007).
S10. D. J. Hartley, R. A. Suthers, J. Acoust. Soc. Am.85, 1348-1351 (1989).
S11. D. A. Waters, J. Rydell, G. Jones, Behav. Ecol. Sociobiol. 37, 321-328 (1995).
S12. L. A. Miller, J. Comp. Physiol. A 168, 571-579 (1991).
S13. W. M. Masters, K. A. S. Raver, J. Comp. Physiol. A 179, 703-713 (1996).
S14. B. Mohl, A. Surlykke, J. Comp. Physiol. A 165, 119-124 (1989).
S15. J. H. Fullard, M. B. Fenton, J. A. Simmons, Can. J. Zool. 57, 647-649 (1979).
S16. J. R. Barber, K. A. Razak, M. Fuzessery, J. Comp. Physiol. A 189, 843-855.
S17. A. Surlykke, L. A. Miller, J. Comp. Physiol. A 156, 831-843 (1985).
41
CHAPTER III
How Do Tiger Moths Jam Bat Sonar?
Aaron J. Corcoran, Jesse R. Barber, Nickolay I. Hristov, and William E. Conner
The following manuscript was published in Journal of Experimental Biology (vol. 214,
pgs. 2416-2425, 20011) and is reprinted with permission. Stylistic variations are due to
requirements of the journal. A.J.C. designed and executed the experiments, conducted
data analysis, and wrote the manuscript. J.R.B. assisted with field research. N.I.H.
developed the three-dimensional video simulations. W.E.C. provided oversight and
editorial assistance on the project.
42
ABSTRACT
The tiger moth Bertholdia trigona is the only animal in nature known to defend itself by
jamming the sonar of its predators -- bats. In this study we analyzed the 3-D flight paths
and echolocation behavior of big brown bats (Eptesicus fuscus) attacking B. trigona in a
flight room over seven consecutive nights to determine the acoustic mechanism of the
sonar-jamming defense. Three mechanisms have been proposed: (1) the phantom echo
hypothesis, which states that bats misinterpret moth clicks as echoes; (2) the ranging
interference hypothesis, which states that moth clicks degrade the bats’ precision in
determining target distance; and (3) the masking hypothesis, which states that moth clicks
mask the moth echoes entirely, making the moth temporarily invisible. On nights one and
two of the experiment the bats appeared startled by the clicks; however on nights three
through seven, the bats frequently missed their prey by a distance predicted by the
ranging interference hypothesis (approx. 15-20 cm). 3-D simulations show that bats did
not avoid phantom targets, and the bats’ ability to track clicking prey contradicts the
predictions of the masking hypothesis. The moth clicks also forced the bats to reverse
their stereotyped pattern of echolocation emissions during attack, even while bats
continued pursuit of the moths. This likely further hinders the bats’ ability to track prey.
These results have implications for the evolution of sonar-jamming in tiger moths, and
we suggest evolutionary pathways by which sonar-jamming may have evolved from
other tiger moth defenses.
43
INTRODUCTION
Bats and moths are intertwined in a predator-prey relationship that has spanned at least 50
million years (Miller and Surlykke, 2001). In response to the heavy predation pressure of
echolocating bats, many moths have evolved simple ears that alert them to the danger of
attack and initiate unpredictable evasive maneuvers (Roeder, 1967 ) Tiger moths
(superfamily Noctuoidea, subfamily: Arctiinae) also produce ultrasonic clicks whose
defensive functions vary depending on the acoustic and chemical properties of the moth
species. Most species produce short bursts of clicks that maximally occupy 1-12 % of
time with sound (Corcoran et al., 2010). These low-duty cycle clicks are well suited for
advertising the toxic chemistry many tiger moths acquire as caterpillars (Hristov and
Conner, 2005a; Hristov and Conner, 2005b; Nishida, 2002; Ratcliffe and Fullard, 2005).
After bats learn this aposematic association, they can be misled by palatable tiger moths
that mimic their chemically defended relatives (Barber and Conner, 2007; Barber et al.,
2009). Moth clicks can also startle bats unaccustomed to sonic prey; however, bats
typically habituate to moth clicks after only a few exposures (Bates and Fenton, 1990;
Miller, 1991). A minority of tiger moth species produce copious bursts of clicks capable
of filling 25-52% of time with broadband noise (Corcoran et al., 2010). We recently
demonstrated that one such species – Bertholdia trigona Grote—defends itself by
jamming the sonar of bats (Corcoran et al., 2009). This is the only known example of
such a defense in nature. It was demonstrated using a behavioral learning paradigm
(Barber and Conner, 2007; Hristov and Conner, 2005a), whereby naïve bats (i.e. never
having experienced moth clicks) were pitted against clicking moths over several
consecutive nights. Against aposematic moths, bats first catch the distasteful moths
44
before learning to avoid them (Barber and Conner, 2007; Hristov and Conner, 2005a).
The reverse pattern can be observed for a startle defense – the bats are startled at first, but
habituate after only a few exposures to clicking moths (Bates and Fenton 1990). Only for
jamming should the defense be effective throughout the experiment, and this was found
to be the case for bats attacking the abundantly clicking and palatable B. trigona
(Corcoran et al., 2009).
Three mechanisms have been proposed for how moths jam bat sonar. First, the
phantom echo hypothesis states that moth clicks that are sufficiently similar to bat calls
could be misperceived by bats as echoes from objects that do not exist (Fullard et al.,
1979; Fullard et al., 1994). If perceived as clutter, bats should veer away from phantom
objects that occur on the flight path leading to the moth; or, if perceived as another prey
item, bats should be observed trying to capture “phantom targets”. Second, the ranging
interference hypothesis holds that clicks that overlap or closely precede echoes may
diminish a bat’s precision in determining target distance and therefore prevent the bats
from properly coordinating their final capture maneuvers (Miller, 1991). Ranging
interference has been demonstrated for bats conducting standardized tasks in
psychophysical experiments, but only when clicks occur in a 2 ms window preceding
returning echoes (Miller, 1991; Masters and Raver, 1996). Finally, the masking
hypothesis suggests that if clicks are sufficiently numerous and intense, they may prevent
the bat from detecting the moth’s echo entirely (Møhl and Surlykke, 1989; Troest and
Møhl, 1986). This would make the moth temporarily invisible to the bat. While other
mechanisms of sonar-jamming could be proposed, we aimed to test these three
hypotheses, which have been the focus of the literature on the subject to date.

45
The three jamming hypotheses can be differentiated by what the bat perceives:
multiple objects surrounding the moth for the phantom echo hypothesis, a blurred target
for the ranging interference hypothesis, and no target for the masking hypothesis.
Therefore, the bats’ flight and echolocation behavior should vary according to each
hypothesis. Here we expand upon our previous work demonstrating the existence of a
sonar jamming defense (Corcoran et al., 2009) by analyzing details of bat 3-D flight and
echolocation behavior to address the question of how moths jam bat sonar.
46
MATERIALS AND METHODS
Animals and equipment
B. trigona were collected using Bioquip (Rancho Dominguez, CA, USA) black
lights set over riparian corridors at the Southwestern Research Station near Portal, AZ in
July 2008. Moths were shipped overnight to our lab at Wake Forest University where
they were held at 12.5º C until experimentation. Noctuid control moths were collected at
lights on the campus of Wake Forest University. Three naïve pre-volant juvenile big
brown bats (Eptesicus fuscus Beauvois; J1, J2, and J3) and one adult big brown bat (A1)
were taken from a roost in Forsyth County, North Carolina and held in captivity for the
duration of the experiment. Three of the four bats were found to readily eat B. trigona,
while one did not (Corcoran et al., 2009). To exclude the possibility that bats were
responding to clicks as aposematic signals, only bats that ate B. trigona were used in our
analysis. Animal care has been described elsewhere (Corcoran et al., 2009) and was
conducted in accordance with Wake Forest University’s Animal Care and Use
Committee (ACUC # A04-188). After each bat could reliably capture silent control
moths (female Galleria mellonella Linnaeus) off a monofilament line in our anechoic
indoor flight room (5.8m x 4.0m x 3.0m), they were put through a seven-night
experiment. Each night, 16 moths – four B. trigona, four similarly sized noctuid novelty
controls, and eight G. mellonella—were tethered to a monofilament line, one at a time,
and presented in random order to an individual bat in the flight room. The line was 60 cm
long and attached to the ceiling at a point 1.2 m from each of two walls. Moths flew
freely on the tether, eliminating the possibility that bats could memorize the moth’s exact
location from previous trials. Bats were allowed one minute or five attack attempts on
47
each moth, however here we only analyze the first attack attempt on each moth (N = 47).
Attacks on moths that did not click (N =19) and attacks that were not fully captured on
video (N =16) were excluded from our analysis.
All interactions were recorded with two digital high-speed video cameras
(Photron FastCam PCI 500, Tokyo, Japan) sampling 250 frames per second directly to
the hard drive of a desktop computer. Nine Wildlife Engineering (Tucson, AZ, USA)
infrared LED arrays illuminated the interaction space, as well as a low intensity deep red
light for behavioral observation by the experimenter. An ultrasonic microphone
(Pettersson D940, Pettersson Elektronik, Uppsala, Sweden; ±8 dB frequency response
from 20 – 80 kHz) was placed on the ceiling, facing downwards directly above the
tethered moth to record audio of all interactions. The microphone was connected to a
laptop computer via a National Instruments (Austin, TX, USA) 6062 PCMCIA A/D card.
Audio was sampled at 250 kHz using BatSound Pro v. 3.3 and externally triggered to
record synchronously with the high-speed video.
3-D flight-track analysis
Four calibration frames constituting 192 points and a volume of 1.4 x 1.5 x 2.1 m were
placed in view of both cameras to calibrate the interaction space. All points were
digitized from frames taken from each camera using a custom Matlab (Natick,
Massachusetts, USA) program (Hedrick, 2008), which fit a set of Direct Linear
Transform (DLT) coordinates to the data. These DLT coordinates were then used in a
second Matlab program (Hedrick, 2008) to calculate the 3-D coordinates of objects
48
occurring in view of both cameras. For each interaction, the “center-of-object” of bat and
moth were determined for each frame while both animals were visible in each camera.
A third custom Matlab program (BATracker.m; coded by B. Chadwell) fit a
quintic smoothing spline (Matlab SPAPS routine) to the 3-D coordinates. The bat and
moth spline functions were then used to determine flight vectors, distances between bat
and moth, and vectors from bat to moth for each point of each interaction. For all time
parameters, time zero was taken as the time of bat-moth contact or when the distance
between bat and moth was minimized. φ is defined as the angular deviation between the
bat’s flight vector and the vector from bat to moth (Fig. 3.1A). To quantify the
trajectories of bats completing successful attacks, φ values were measured from 20
successful bat attacks on noctuid control moths. For each frame of the attack (occurring
at 4 ms intervals) from t = -600 ms to t = 0 ms, the mean, upper and lower 95%
confidence intervals of φ were calculated. For each interaction between a bat and a
clicking moth, the time when φ first exceeded the upper 95% confidence limit for control
attacks was taken as an indication of when an attack was aborted (Time of flight abort; T-
Fabort; Fig. 3.1).
Bioacoustic Analysis
We used a custom version of Sonobat v. 2.9 (DnDesign, Arcata, CA, USA) to
semi-automatically detect and measure parameters from echolocation calls from bat
attacks. The automated processing routines of Sonobat were overseen by an observer to
manually confirm the accuracy of all measurements. The time of each echolocation call
and the time interval between successive echolocation calls, or pulse interval, were
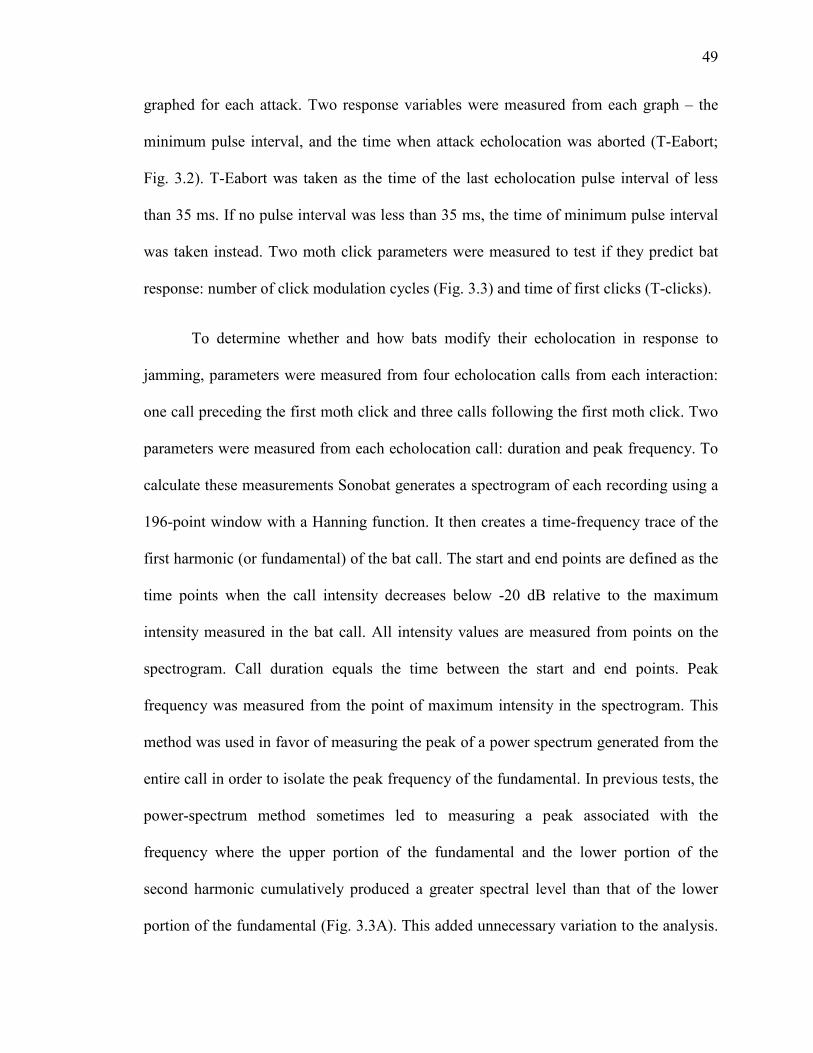
49
graphed for each attack. Two response variables were measured from each graph – the
minimum pulse interval, and the time when attack echolocation was aborted (T-Eabort;
Fig. 3.2). T-Eabort was taken as the time of the last echolocation pulse interval of less
than 35 ms. If no pulse interval was less than 35 ms, the time of minimum pulse interval
was taken instead. Two moth click parameters were measured to test if they predict bat
response: number of click modulation cycles (Fig. 3.3) and time of first clicks (T-clicks).
To determine whether and how bats modify their echolocation in response to
jamming, parameters were measured from four echolocation calls from each interaction:
one call preceding the first moth click and three calls following the first moth click. Two
parameters were measured from each echolocation call: duration and peak frequency. To
calculate these measurements Sonobat generates a spectrogram of each recording using a
196-point window with a Hanning function. It then creates a time-frequency trace of the
first harmonic (or fundamental) of the bat call. The start and end points are defined as the
time points when the call intensity decreases below -20 dB relative to the maximum
intensity measured in the bat call. All intensity values are measured from points on the
spectrogram. Call duration equals the time between the start and end points. Peak
frequency was measured from the point of maximum intensity in the spectrogram. This
method was used in favor of measuring the peak of a power spectrum generated from the
entire call in order to isolate the peak frequency of the fundamental. In previous tests, the
power-spectrum method sometimes led to measuring a peak associated with the
frequency where the upper portion of the fundamental and the lower portion of the
second harmonic cumulatively produced a greater spectral level than that of the lower
portion of the fundamental (Fig. 3.3A). This added unnecessary variation to the analysis.
50
To account for the directionality of bat emissions the vertical and horizontal angular
deviations between bat and moth and bat and microphone were calculated for all attacks
at the time when bat calls were measured. The horizontal deviation in angle was 7.6±6.7º
and the vertical deviation was 23±6.7º. These values are within the -6 dB bandwidth of E.
fuscus (Ghose and Moss 2003; Hartley and Suthers 1989).
Statistical Analysis
To quantify what factors affected bat echolocation and flight responses to moth
clicks, we conducted a series of multivariate linear regressions on each of four response
variables: minimum bat-moth distance, T-Fabort, minimum pulse interval, and T-Eabort.
Five predictor variables were used for each regression: bat experience (in nights), moth
click modulation cycle number, T-clicks, J1 dummy, and J2 dummy. Each dummy
variable codes the attacks of J1 and J2 separately, allowing us to test and account for
individual differences. Predictor variables had low correlations (R2 < 0.12). For each
response variable we created a single regression model that added all five predictor
variables simultaneously. We also analyzed correlation values between all predictor and
response variables and compared these results to our multiple regressions to look for
interaction effects among predictor variables. This approach avoids the numerous
problems associated with stepwise multiple linear regression (Tabachnick and Fidell
2007).
To determine how bats responded acoustically to moth clicks, we conducted a
series of repeated-measures Analysis of Variance (ANOVA) tests on echolocation call
parameters measured from one echolocation call preceding moth clicks and three calls
51
following clicks. In cases where sphericity could not be assumed the Greenhouse-Geisser
correction was applied. Post-hoc pairwise comparisons were made between all groups
with Bonferroni correction applied to adjust P-values for multiple comparisons. Due to
heterogeneity of variance, we used a non-parametric Friedman’s ANOVA to test for
differences in pulse interval values before and after moth clicks. Non-parametric post-hoc
tests with adjusted P-values for multiple comparisons were used to test for differences
between mean values.
For all tests, a separate statistical analysis was conducted for each category of bat
attack (for categories, see Results) and on 20 randomly selected attacks on silent control
moths. We selected four calls (one before clicks and three after clicks) from each control
attack so that they matched the timing of calls selected from attacks on clicking moths.
Measured T-click values were selected at random from attacks on clicking moths and
applied to control attacks. For example, if a T-click value of -450 ms was selected, the
control attack was processed as though clicks occurred 450 ms before the point of contact.
Statistical analysis was conducted in SPSS 16.0 (SPSS, Inc., Chicago, IL, USA). α was
set at 0.05 and data are reported as mean ± s.d.
3-D Simulations
To test the plausibility of the three jamming hypotheses (phantom echo, ranging
interference, and masking), we simulated attacks according to assumptions that follow
from each hypothesis. According to the phantom echo hypothesis, bats perceive click
bursts not as extrinsic sounds, but as echoes from objects. We assume that the bats would
perceive these sounds in the same directional vector as that of the sound source – the
52
moth. Because the interval (325 µs) between moth clicks (Corcoran et al., 2009) is less
than the bat’s 400 µs temporal resolution (Simmons et al. 1989), clicks within a burst
would blur into one continuous sound, and are therefore modeled as one object. Due to
the mechanism of sound production, moth click bursts come in pairs. The first click burst
(termed the active half-modulation cycle) decreases in frequency over time, as does the
sweep of an echolocation call (Fig. 3.3). The second burst (the passive half-modulation
cycle) changes frequency in the opposite direction. We therefore modeled only the active
half-modulation cycles as phantom echoes. To calculate the distance from the bat to each
phantom object, the time interval from the beginning of the echolocation call preceding a
click burst to the beginning of the click burst was divided by the speed of sound (approx.
343 m/s) and again divided by two for the two-way travel distance. Measurements were
made on click bursts from each of five randomly selected attacks from each of the three
bats used in the experiment.
Ranging interference occurs only when clicks are present within a 2 ms interval
preceding the return of echoes (Masters and Raver, 1996; Miller, 1991). For each attack,
we determined how often clicks occurred within this crucial time window. To do this, we
first used the 3-D reconstruction of the attack to determine the distance between bat and
moth at the time each call was produced. We then calculated the two-way travel time of
sound covering this distance and marked whether or not moth clicks occurred within the
2 ms time interval surrounding the estimated time of the returning echo. Masking requires
sound to overlap the short time window of returning echoes (Møhl and Surlykke, 1989).
While the masking window is slightly offset from the ranging interference window they
53
are of similar durations, and therefore our measurements on ranging interference should
roughly apply to the hypothesis of masking.
RESULTS
3-D flight and echolocation responses to jamming
Bat flight response to clicking moths took three forms: (1) in direct attacks bats
completed flight paths typical of successful attacks on control moths (N = 11; Fig. 3.4 A,
D) and either captured the moths or made contact after making at least a partial capture
attempt; (2) in close-range attacks bats continued their attacks after clicks and narrowly
missed the moth without making a capture attempt (N = 24; Fig 3.4 B, E); and (3) in
avoidances bats aborted attacks soon after hearing clicks and also did not make capture
attempts (N = 14; Fig. 3.4 C, F). The three attack types were distinguished by their φ vs.
time plots (Fig. 3.4D-F). In direct attacks, φ values (the angle between the bat’s flight
vector and the bat-moth vector) did not exceed the upper 95% confidence limit of control
attacks on non-clicking moths; close-range plots showed decreasing or constant φ values
(indicating continued moth pursuit) after the moth clicked, followed by a breach of the
upper 95% confidence level of control attacks; avoidances showed immediate increases
in φ values towards the upper 95% confidence level of control attacks after the moths
clicked.
Bat echolocation responses (Fig. 3.4G-I) mirrored the differences in flight
responses (Fig. 3.4D-F). Bats in direct attacks typically completed echolocation
sequences with a buzz, or trill of calls with low (approx. 6 ms) pulse intervals. Buzzes
were always present in attacks on control moths (Fig. 3.6A). Close-range attacks were
54
dominated by short pulse intervals (10-40 ms) that are typically used for bats
investigating near-by objects. Buzzes in these attacks were often highly abbreviated (Fig.
3.4H, 3.6B). In avoidances, bats began elongating pulse intervals early in the attack
(approx. 250 ms before minimum bat-moth distance; Fig. 3.4I, 3.6C), and did not buzz.
Bat experience was a consistent predictor of bat flight and echolocation response
to moth clicks (Table 3.1); bats continued attack flight and attack echolocation longer,
and flew closer to their prey, as they gained experience. This trend appears to be driven
by the higher proportion of avoidances and lower proportion of direct and close-range
attacks on the first two nights of the experiment (Fisher’s exact test; Χ2 =6.66; P = 0.04;
Fig. 3.5). This suggests that bats were initially startled by the clicks and habituated after
about two nights. After the habituation period, close-range attacks were the most frequent
result (Fig. 3.5).
The number of click modulation cycles was also important in predicting bat
response (Table 3.1); bats flew closer, used attack echolocation later into the attack and
achieved shorter minimum pulse intervals against moths that clicked less. This result
appears to be driven by the difference in number of modulation cycles between direct
attacks and other attack categories (18.7±16.7 modulation cycles in direct attacks vs.
38.0±23.7 modulation cycles for all other attacks; Student’s t-test; t=-2.52; d.f. = 47; P =
0.02). Moths that clicked less were less successful at deterring their predators. The timing
of clicks was also found to be important in when bats aborted attack echolocation, but not
any of the other three response variables.
55
Finally, J1 dummy was significant in the T-Fabort model; that is, one juvenile bat
aborted flight earlier than the adult bat. J2 dummy was not significant in any model. The
relatively small impact of individual dummy variables in our models indicates that the
three bats tended to respond similarly to jamming. Together, these models account for
about one third of the variation in bat responses to clicking moths. In summary, bat flight
and echolocation responses to moth clicks demonstrated a high level of agreement on
three results: (1) bats aborted attacks more frequently early in the experiment; (2) bats
completed successful attacks more often against moths that clicked less; and (3) after the
initial habituation period the most frequent result was for bats to narrowly miss their prey.
Immediate echolocation reaction to jamming
We looked for differences in parameters from echolocation calls made prior to
and just after moth clicks to determine the bats’ acoustic reaction to jamming (Table 3.2).
As expected, in control attacks the bats decreased their call durations, and while not
statistically significant, a trend towards decreasing pulse intervals and decreasing peak
frequencies was observed. In contrast, in close-range attacks and avoidances bats
increased call durations and pulse intervals in response to moth clicks (Table 3.2; Fig.
3.6). These results show a reversal of the changes in echolocation emissions typical of
attack sequences. No changes in peak frequency were found. Interestingly, the changes
of echolocation observed in close-range attacks were short-lived – the bats frequently
advanced echolocation towards a buzz a second time as they continued pursuing their
prey (Fig. 3.6B).
3-D simulations
56
To determine the plausibility of each sonar-jamming mechanism, the frequency of
clicks occurring at critical time periods were calculated according to assumptions made
for each hypothesis. Moths began clicking 379±190 ms before minimum bat-moth
distance and produced 33.7±23.6 modulation cycles per attack. Moth clicks occurred in
13.5±5.8 of 16.1±6.8 pulse intervals (83.4%) that occurred after moths began clicking.
The locations of phantom echoes relative to actual targets were simulated for 15
randomly selected attacks that occurred after the habituation period. Of the 385 simulated
phantom echoes, 307 (79.9%) occurred 25 -2624 cm beyond the target; 39 (1.0%), or 2.6
phantom echoes per attack, occurred within 25 cm of the target, and 38 (1.0%), or 2.5
phantom echoes per attack, occurred 25 – 134 cm in front of the target. These figures are
roughly what would be expected by chance, as the time intervals that would place
phantom objects between bat and moth or within 25 cm of the moth are much shorter
than the time interval that would place phantom objects distant to the moth. Fig. 3.7A, C
and Movie 1 show the modeled locations of phantom objects, as well as the measured
locations of the bat and moth of an example attack. The locations of phantom objects are
randomly distributed spatially and lack spatial continuity over time. If perceived in such a
way, phantom objects would flash briefly in disparate locations. While a small number of
simulated phantom objects do occur near the bat’s flight path, the bat’s flight trajectory
does not appear to be influenced by them.
The frequency of clicks occurring in the critical ranging interference window was
measured for all attacks. Moth clicks occurred in 11.6±5.5 (85.3% of calls with clicks in
preceding call intervals) critical call windows per attack. Fig. 3.7B, C and Movie 2 show
an individual attack with overlaid ranging errors based on previous interference estimates

57
(Miller, 1991). In this incidence, and in close-range attacks overall, the bat missed its
prey by a distance similar to the ranging error predicted by the ranging interference
hypothesis (approx. 15-20 cm) and no capture attempt was made.
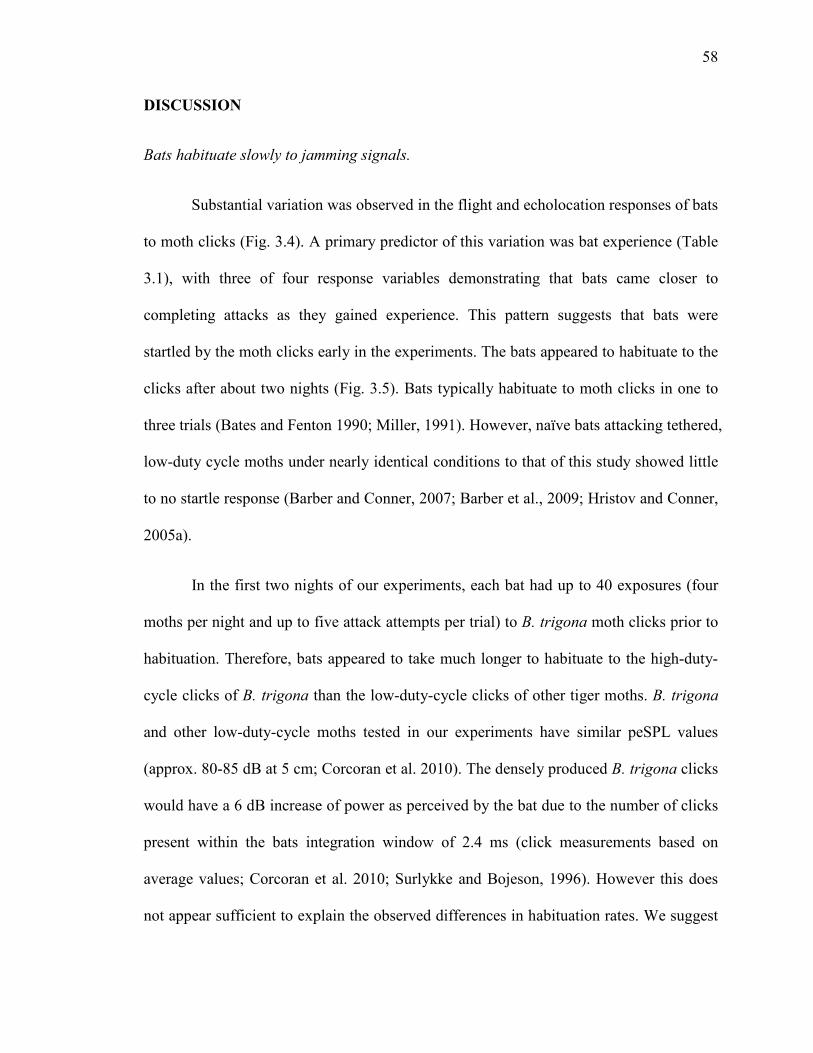
58
DISCUSSION
Bats habituate slowly to jamming signals.
Substantial variation was observed in the flight and echolocation responses of bats
to moth clicks (Fig. 3.4). A primary predictor of this variation was bat experience (Table
3.1), with three of four response variables demonstrating that bats came closer to
completing attacks as they gained experience. This pattern suggests that bats were
startled by the moth clicks early in the experiments. The bats appeared to habituate to the
clicks after about two nights (Fig. 3.5). Bats typically habituate to moth clicks in one to
three trials (Bates and Fenton 1990; Miller, 1991). However, naïve bats attacking tethered,
low-duty cycle moths under nearly identical conditions to that of this study showed little
to no startle response (Barber and Conner, 2007; Barber et al., 2009; Hristov and Conner,
2005a).
In the first two nights of our experiments, each bat had up to 40 exposures (four
moths per night and up to five attack attempts per trial) to B. trigona moth clicks prior to
habituation. Therefore, bats appeared to take much longer to habituate to the high-duty-
cycle clicks of B. trigona than the low-duty-cycle clicks of other tiger moths. B. trigona
and other low-duty-cycle moths tested in our experiments have similar peSPL values
(approx. 80-85 dB at 5 cm; Corcoran et al. 2010). The densely produced B. trigona clicks
would have a 6 dB increase of power as perceived by the bat due to the number of clicks
present within the bats integration window of 2.4 ms (click measurements based on
average values; Corcoran et al. 2010; Surlykke and Bojeson, 1996). However this does
not appear sufficient to explain the observed differences in habituation rates. We suggest
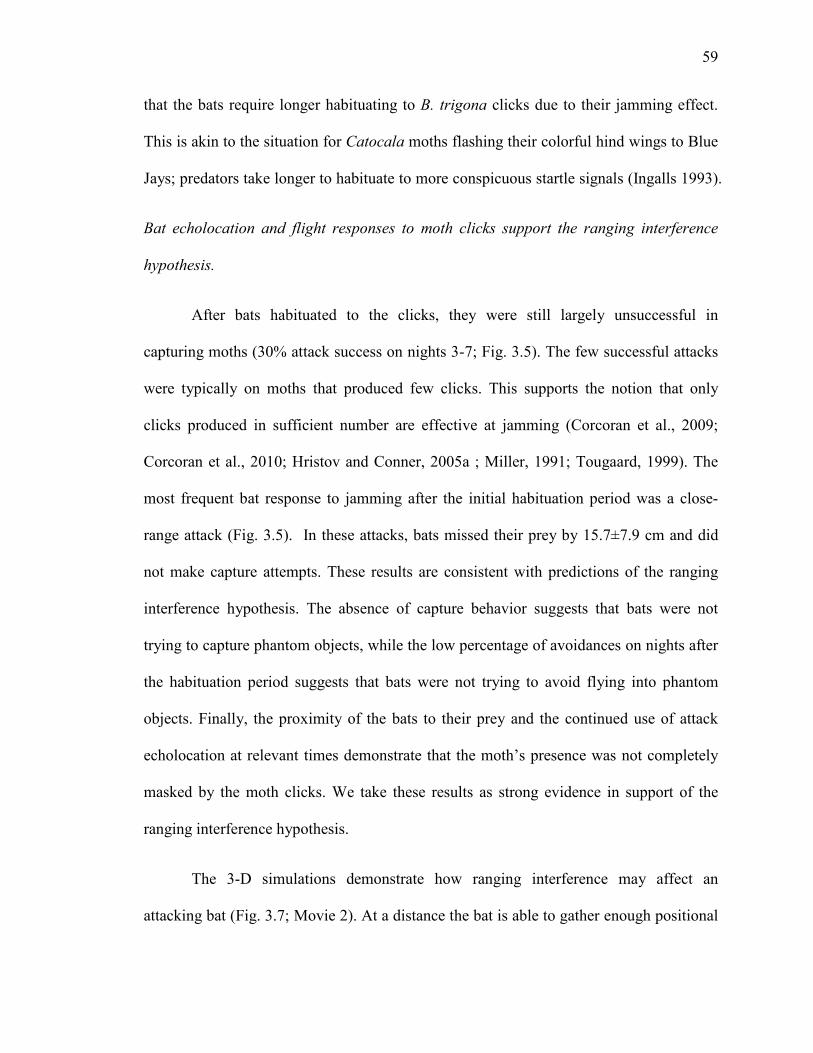
59
that the bats require longer habituating to B. trigona clicks due to their jamming effect.
This is akin to the situation for Catocala moths flashing their colorful hind wings to Blue
Jays; predators take longer to habituate to more conspicuous startle signals (Ingalls 1993).
Bat echolocation and flight responses to moth clicks support the ranging interference
hypothesis.
After bats habituated to the clicks, they were still largely unsuccessful in
capturing moths (30% attack success on nights 3-7; Fig. 3.5). The few successful attacks
were typically on moths that produced few clicks. This supports the notion that only
clicks produced in sufficient number are effective at jamming (Corcoran et al., 2009;
Corcoran et al., 2010; Hristov and Conner, 2005a ; Miller, 1991; Tougaard, 1999). The
most frequent bat response to jamming after the initial habituation period was a close-
range attack (Fig. 3.5). In these attacks, bats missed their prey by 15.7±7.9 cm and did
not make capture attempts. These results are consistent with predictions of the ranging
interference hypothesis. The absence of capture behavior suggests that bats were not
trying to capture phantom objects, while the low percentage of avoidances on nights after
the habituation period suggests that bats were not trying to avoid flying into phantom
objects. Finally, the proximity of the bats to their prey and the continued use of attack
echolocation at relevant times demonstrate that the moth’s presence was not completely
masked by the moth clicks. We take these results as strong evidence in support of the
ranging interference hypothesis.
The 3-D simulations demonstrate how ranging interference may affect an
attacking bat (Fig. 3.7; Movie 2). At a distance the bat is able to gather enough positional
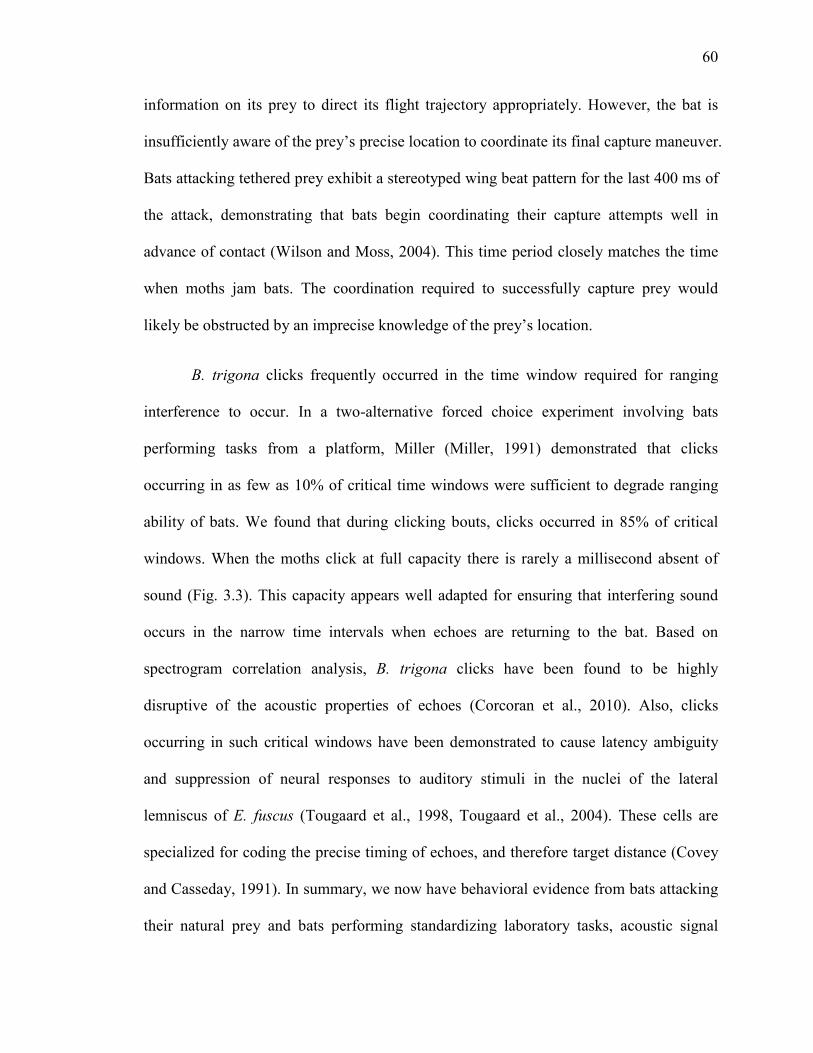
60
information on its prey to direct its flight trajectory appropriately. However, the bat is
insufficiently aware of the prey’s precise location to coordinate its final capture maneuver.
Bats attacking tethered prey exhibit a stereotyped wing beat pattern for the last 400 ms of
the attack, demonstrating that bats begin coordinating their capture attempts well in
advance of contact (Wilson and Moss, 2004). This time period closely matches the time
when moths jam bats. The coordination required to successfully capture prey would
likely be obstructed by an imprecise knowledge of the prey’s location.
B. trigona clicks frequently occurred in the time window required for ranging
interference to occur. In a two-alternative forced choice experiment involving bats
performing tasks from a platform, Miller (Miller, 1991) demonstrated that clicks
occurring in as few as 10% of critical time windows were sufficient to degrade ranging
ability of bats. We found that during clicking bouts, clicks occurred in 85% of critical
windows. When the moths click at full capacity there is rarely a millisecond absent of
sound (Fig. 3.3). This capacity appears well adapted for ensuring that interfering sound
occurs in the narrow time intervals when echoes are returning to the bat. Based on
spectrogram correlation analysis, B. trigona clicks have been found to be highly
disruptive of the acoustic properties of echoes (Corcoran et al., 2010). Also, clicks
occurring in such critical windows have been demonstrated to cause latency ambiguity
and suppression of neural responses to auditory stimuli in the nuclei of the lateral
lemniscus of E. fuscus (Tougaard et al., 1998, Tougaard et al., 2004). These cells are
specialized for coding the precise timing of echoes, and therefore target distance (Covey
and Casseday, 1991). In summary, we now have behavioral evidence from bats attacking
their natural prey and bats performing standardizing laboratory tasks, acoustic signal
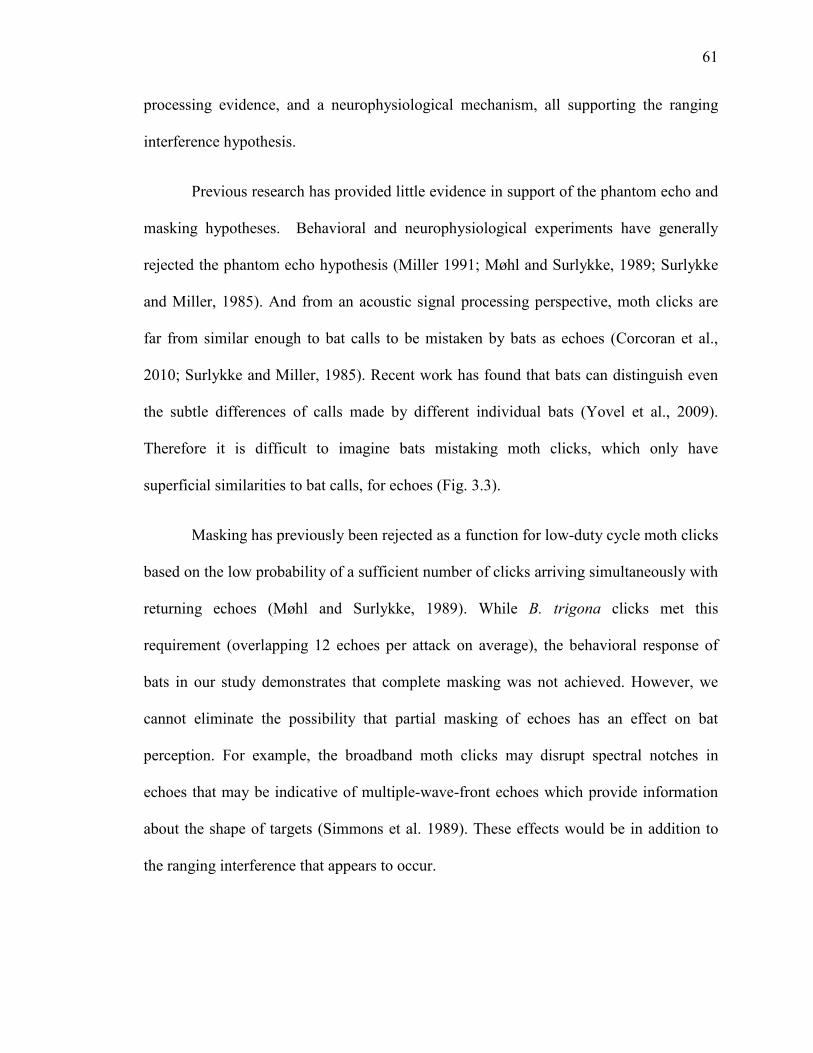
61
processing evidence, and a neurophysiological mechanism, all supporting the ranging
interference hypothesis.
Previous research has provided little evidence in support of the phantom echo and
masking hypotheses. Behavioral and neurophysiological experiments have generally
rejected the phantom echo hypothesis (Miller 1991; Møhl and Surlykke, 1989; Surlykke
and Miller, 1985). And from an acoustic signal processing perspective, moth clicks are
far from similar enough to bat calls to be mistaken by bats as echoes (Corcoran et al.,
2010; Surlykke and Miller, 1985). Recent work has found that bats can distinguish even
the subtle differences of calls made by different individual bats (Yovel et al., 2009).
Therefore it is difficult to imagine bats mistaking moth clicks, which only have
superficial similarities to bat calls, for echoes (Fig. 3.3).
Masking has previously been rejected as a function for low-duty cycle moth clicks
based on the low probability of a sufficient number of clicks arriving simultaneously with
returning echoes (Møhl and Surlykke, 1989). While B. trigona clicks met this
requirement (overlapping 12 echoes per attack on average), the behavioral response of
bats in our study demonstrates that complete masking was not achieved. However, we
cannot eliminate the possibility that partial masking of echoes has an effect on bat
perception. For example, the broadband moth clicks may disrupt spectral notches in
echoes that may be indicative of multiple-wave-front echoes which provide information
about the shape of targets (Simmons et al. 1989). These effects would be in addition to
the ranging interference that appears to occur.
62
The echolocation reaction to moth clicks interferes with the stereotyped echolocation
attack sequence
Bats attacking prey use a stereotyped pattern of changes in echolocation whereby
pulse intervals, call durations, call intensities, and call frequencies decrease as bats near
their prey (Griffin et al., 1960, Kick and Simmons 1984, Wilson and Moss, 2004). These
acoustic alterations are highly adaptive for bats pursuing prey. The rapid emission of
pulses late in the attack allows the bats to quickly update their “sonar screens” as to the
position of their prey. The decreasing call durations prevent overlap between calls and
echoes, which occur closer together as bats near their prey (Wilson and Moss, 2004). The
decreased intensity of call emissions keeps returning echoes at a relatively stable level,
which may help bats avoid ranging errors caused by time-intensity trading neurons, and
allow bats to isolate amplitude changes caused by prey movements (Hartley 1992; Hiryu
et al. 2008). And finally, the lower frequency of terminal buzz calls has the effect of
changing the directionality of the emissions from a narrow beam to a wide angle in order
to keep the prey in the ensonified volume (Jakobsen and Surlykke, 2010).
The bats in our study reversed this stereotyped pattern by elongating call
durations and pulse intervals after hearing moth clicks, resulting in highly abbreviated or
absent buzzes (Table 3.2; Fig. 3.6). In some cases (avoidances) these changes in
echolocation reflected a decision to abandon pursuit of the prey. In others (close-range
attacks) the changes in call structure were temporary and the bats continued pursuing the
moths with a highly atypical echolocation sequence (Fig. 3.6B). Others have reported
bats elongating pulse intervals in response to moth clicks, albeit for much shorter periods
of time than what is reported here (Barber and Conner, 2007; Ratcliffe and Fullard, 2005).
63
These changes do not appear to be in response to the ranging interference caused by the
clicks, as bats elongate pulse intervals even when clicks do not overlap echoes (Ratcliffe
and Fullard, 2005) and ranging interference alone does not cause bats to change their
echolocation (Miller, 1991). Instead, the bats may be compensating for the processing
demands of two information streams (Barber et al., 2003).
Mexican free-tailed bats (Tadarida brasiliensis) flying in the laboratory increase
the duration, bandwidth and amplitude of sonar emissions in response to broadband noise,
an acoustic response typical of many vertebrates (Tressler and Smotherman, 2009). This
response is presumably aimed at improving the detection of the signal in noise. The
lengthening of call durations that we observed may be an attempt to do the same. Bats
also shift call frequency in order to avoid jamming by conspecifics (Gillam et al., 2007;
Ratcliffe et al., 2004; Ulanovsky et al., 2004), chorusing insects (Gillam and McCracken,
2007), and synthetic narrowband noise (Bates et al., 2008; Tressler and Smotherman,
2009), but not broadband noise (Bates et al., 2008; Tressler and Smotherman, 2009). We
did not observe bats changing the frequency of their emissions in response to moth clicks,
only the durations and pulse intervals. The changes in echolocation we observed in close-
range attacks appear to be an effort to avoid jamming; however, this comes at the cost of
losing the advantages conferred by the specialized attack echolocation that bats more
commonly employ. This has the end result of the bats being unable to capture their
clicking prey.
64
CONCLUSION
The primary objective of this study was to determine the mechanism of the sonar
jamming defense used by high-duty-cycle tiger moths. Our results, combined with
evidence from the literature, provide strong support for the ranging interference
hypothesis. In addition, the clicks disrupt the bats’ stereotyped echolocation attack
sequence. The primary requirement for this defense is the ability to produce numerous,
densely packed clicks continuously for several hundred milliseconds. By comparing the
sounds produced by low-duty-cycle and high-duty-cycle moths (Barber and Conner, 2006;
Corcoran et al., 2010), we see that this is accomplished in three ways: (1) the
morphological development of many striations on the bilateral tymbal organs in order to
produce numerous clicks per modulation cycle; (2) the rapid and repeated behavioral
activation of the tymbal organs; and (3) the rhythmic, alternating activation of the two
tymbal organs to maximally occupy time with clicks. These observations provide a
hypothetical blueprint for the evolution of a sonar-jamming signal. As has been suggested
previously (Barber and Conner, 2006; Corcoran et al., 2010), it appears likely that tiger
moths originally developed the ability to click in order to advertise their toxic chemistry
(Hristov and Conner, 2005a; Hristov and Conner 2005b), and later other tiger moths took
advantage of this association through Batesian and Mullerian mimicry (Barber and
Conner, 2007; Barber et al., 2009). A rudimentary form of jamming may have made for
a more salient warning cue for acoustic aposematic moths (Ratcliffe and Fullard, 2005),
or provided some modest benefit to mimetic animals avoiding capture by potentially
discerning predators (Barber et al., 2009). At this point a clear path was open to the
evolution of a jamming signal. Currently, the arctiine phylogeny remains unresolved

65
(Weller et al. 2009). Without this evolutionary framework, we are unable to understand
the order in which their various chemical and acoustic defenses were acquired. However,
by understanding the mechanism of the sonar-jamming defense, we have demonstrated
that in all probability, few barriers existed for tiger moths to adapt their pre-existing
clicking defenses for sonar-jamming.
66
REFERENCES
Barber, J. R. and Conner, W. E. (2006). Tiger moth responses to a simulated bat attack:
timing and duty cycle. J. Exp. Biol. 209, 2637-2650.
Barber, J. R. and Conner, W. E. (2007). Acoustic mimicry in a predator-prey
interaction. Proc. Nat. Acad. Sci. 104, 9331-9334.
Barber, J. R., Razak, K. A., and Fuzessery, Z. M. (2003). Can two streams of auditory
information be processed simultaneously? Evidence from the gleaning bat
Antrozous pallidus. J. Comp. Physiol. A 189, 843-855.
Barber, J. R., Chadwell, B. A., Garrett, N., Schmidt-French, B., and Conner, W. E.
(2009). Naïve bats discriminate arctiid moth warning sounds but generalize their
aposematic meaning. J. Exp. Biol. 212, 2141-2148.
Bates, D. L. and Fenton, M. B. (1990). Aposematism or startle? Predators learn their
responses to the defenses of prey. Can. J. Zool. 68, 49-52.
Bates, M. E., Stamper, S. A., and Simmons, J. A. (2008). Jamming avoidance response
of big brown bats in target detection. J. Exp. Biol. 211, 106-113.
Corcoran, A. J., Barber, J. R., and Conner, W. E. (2009). Tiger moth jams bat sonar.
Science 325, 325-327.
Corcoran, A. J., Conner, W. E., and Barber, J. R. (2010). Anti-bat tiger moth sounds:
Form and function. Curr. Zool. 56, 358-369.
Covey, E., and Casseday, J. H. (1991). The monaural nuclei of the lateral lemniscus in
an echolocation bat: parallel pathways for analyzing temporal features of sound. J.
Neurosci. 11, 3456-3470.
67
Fullard, J. H., Fenton, M. B., and Simmons, J. A. (1979). Jamming bat echolocation:
the clicks of arctiid moths. Can. J. Zool. 57, 647-649.
Fullard, J. H., Simmons, J. A., and Saillant, P. A. (1994). Jamming bat echolocation:
the dogbane tiger moth Cycnia tenera times its clicks to the terminal attack calls
of the big brown bat Eptesicus fuscus. J. Exp. Biol. 194, 285-298.
Ghose, K., and Moss, C. F. (2003). The sonar beam pattern of a flying bat as it tracks
tethered insects. J. Acoust. Soc. Am. 114, 1120-1131.
Gillam, E. H., Ulanovsky, N. and McCracken, G. F. (2007). Rapid jamming avoidance
in biosonar. Proc. R. Soc. B 274, 651-660.
Gillam, E. H., and McCracken, G. F. (2007). Variability in the echolocation of
Tadarida brasiliensis: effects of geography and local acoustic environment. Anim.
Behav. 74, 277-286.
Griffin, D. R., Webster, F. A., and Michael, C. R., (1960). The echolocation of flying
insects by bats. Anim. Behav. 8, 141-154.
Hartley, D. J., and Suthers, R. A. (1989). The sound emission pattern of the
echolocating bat, Eptesicus fuscus. J. Acoust. Soc. Am. 85, 1348-1351.
Hartley, D. J. (1992). Stabilizaton of perceived echo amplitudes in echolocating bats. II.
The acoustic behavior of the big brown bat, Eptesicus fuscus, when tracking
moving prey. J. Acoust. Soc. Am. 91, 1133-1149.
Hedrick, T.L. (2008). Software techniques for two- and three-dimensional kinematic
measurements of biological and biomimetic systems. Bioinsp. Biomim. 034001.
Hiryu, S., Shiori, Y., Hosokawa, T., Riquimaroux, H., and Watanabe, Y. (2008). On-
board telemetry of emitted sounds from free-flying bats: compensation for
68
velocity and distance stabilizes echo frequency and amplitude. J. Comp. Physiol.
A 194, 841-851.
Hristov, N. I., and Conner, W. E. (2005a). Sound strategy: acoustic aposematism in the
bat-tiger moth arms race. Naturwissenschaften 92, 164-169.
Hristov, N. I., and Conner, W. E. (2005b). Effectiveness of tiger moth (Lepidoptera,
Arctiidae) chemical defenses against an insectivorous bat (Eptesicus fuscus).
Chemoecology 15, 105-113.
Jakobsen, L, and Surlykke, A. (2010). Vespertilionid bats control the width of their
biosonar sound beam dynamically during prey pursuit. Proc. Nat. Acad. Sci. 107,
13930-13935.
Kick, S. A., and Simmons, J. A. (1984). Automatic gain control in the bat’s sonar
receiver and the neuroethology of echolocation. J. Neurosci. 4, 2725-2737.
Lindström, L., Alatalo, R. V., and Mappes, J. (1997). Imperfect Batesian mimicry—
the effects of the frequency and the distastefulness of the model. Proc. R. Soc. B.
264, 149-153.
Masters, W. M. and Raver, K. A. (1996). The degradation of distance discrimination in
big brown bats (Eptesicus fuscus) caused by different interference signals. J.
Comp. Physiol. A 179, 703-713.
Møhl, B., and Surlykke, A. (1989). Detection of sonar signals in the presence of pulses
of masking noise by the echolocation bat, Eptesicus fuscus. J. Comp. Physiol. A
165, 119-124.
Miller, L. A. and Surlykke, A. (2001). How some insects detect and avoid being eaten
by bats: tactics and countertactics of prey and predator. Bioscience 51, 570-581.
69
Miller. L. A. (1991). Arctiid moth clicks can degrade the accuracy of range difference
discrimination in echolocating big brown bats, Eptesicus fuscus. J. Comp. Physiol.
A 168, 571-579.
Nishida, R. (2002). Sequestration of defensive substances from plants by Lepidoptera.
Annu. Rev. Entomol. 47, 57-92.
Pfennig, D. W., Harcombe, W. R., and Pfennig, K. S. (2001). Frequency-dependent
Batesian mimicry. Nature 410, 323-323.
Ratcliffe, J. M., and Fullard, J. H. (2005). The adaptive function of tiger moth clicks
against echolocation bats: an experimental and synthetic approach. J. Exp. Biol.
208, 4689-4698.
Ratcliffe, J. M., ter Hofstede, H. M., Avila-Flores, R., Fenton, M. B., McCracken, G.
F., Biscardi, S., Blasko, J., Gillam, E., Orprecio, J. and Spanjer, G. (2004).
Conspecifics influence call design in the Brazilian free-tailed bat, Tadarida
brasiliensis. Can. J. Zool. 82, 966-971.
Roeder, K. D. (1967). Nerve Cells and Insect Behavior Cambridge, MA: Harvard
University Press.
Simmons, J.A., Freedman, E. G., Stevenson, S. B., Chen, L, and Wohlgenant, T. J.
(1989). Clutter interference and the integration time of echoes in the echolocating
bat, Eptesicus fuscus. J. Acoust. Soc. Am. 86, 1318-1332.
Surlykke, A., and Miller, L. A. (1985). The influence of arctiid moth clicks on bat
echolocation; jamming or warning? J. Comp. Physiol. A 156, 831-843.
Surlykke, A. and Bojesen, O. (1996). Integration time for short broad band clicks in
echolocating FM-bats. J. Comp. Physiol. A 178, 235-241.
70
Tabachnick, B. G., and Fidell, L. S. (2007). Using Multivariate Statistics, 5th ed. Boston:
Pearson Education Inc.
Tougaard, J., Cassedy, J. H., and Covey, E. (1998). Arctiid moths and bat echolocation:
broad-band clicks interfere with neural responses to auditory stimuli in the nuclei
of the lateral lemniscus of the big brown bat. J. Comp. Physiol. A 182, 203-215.
Tougaard, J., Miller, L. A. and Simmons, J. A. (2004). The role of arctiid moth clicks
in defense against echolocating bats: interference with temporal processing. In
Advances in the Study of Echolocation in Bats and Dolphins (ed. J.A. Thomas, C.
F. Moss and M. Vater), pp. 365-371. Chicago: University of Chicago Press.
Tressler, J., and Smotherman, M. S. (2009). Context-dependent effects of noise on
echolocation pulse characteristics in free-tailed bats. J. Comp. Physiol. A 195,
923-934.
Troest, N., and Møhl, B. (1986). The detection of phantom targets in noise by serotine
bats; negative evidence for the coherent receiver. J. Comp. Physiol. A 159, 559-
567.
Ulanovsky, N., Fenton, M. B., Tsoar, A. and Korine, C. (2004). Dynamics of jamming
avoidance in echolocating bats. Proc. R. Soc. B 271, 1467–1475.
Weller, S., Dacosta, M., Simmons, R., Dittmar, K., and Whiting, M. (2009).
Evolution and taxonomic confusion in Arctiidae. In Tiger Moths and Woolly
Bears: Behavior, Ecology and Evolution of the Arctiidae (ed. W. E. Conner), pp.
11-30. New York: Oxford University Press.
Wilson, W. W., and Moss, C. F. (2004). Sensory-motor behavior of free-flying FM bats
during target capture. In Advances in the Study of Echolocation in Bats and
71
Dolphins (ed. J. A. Thomas, C. F. Moss, and M. Vater), pp. 22-27. Chicago:
Chicago University Press.
Wotton, J. M., Haresign, T, and Simmons, J. A. (1995). Spatially dependent acoustic
cues generated by the external ear of the big brown bat, Eptesicus fuscus. J.
Acoust. Soc. Am. 98: 1423-1445
Yovel, Y., Melcon, M. L., Franz, M. O., Denzinger, A., and Schitzler, H.-U. (2009).
The voice of bats: How greater mouse-eared bats recognize individuals based on
their echolocation calls. PloS Comput. Biol. 5, e1000400.
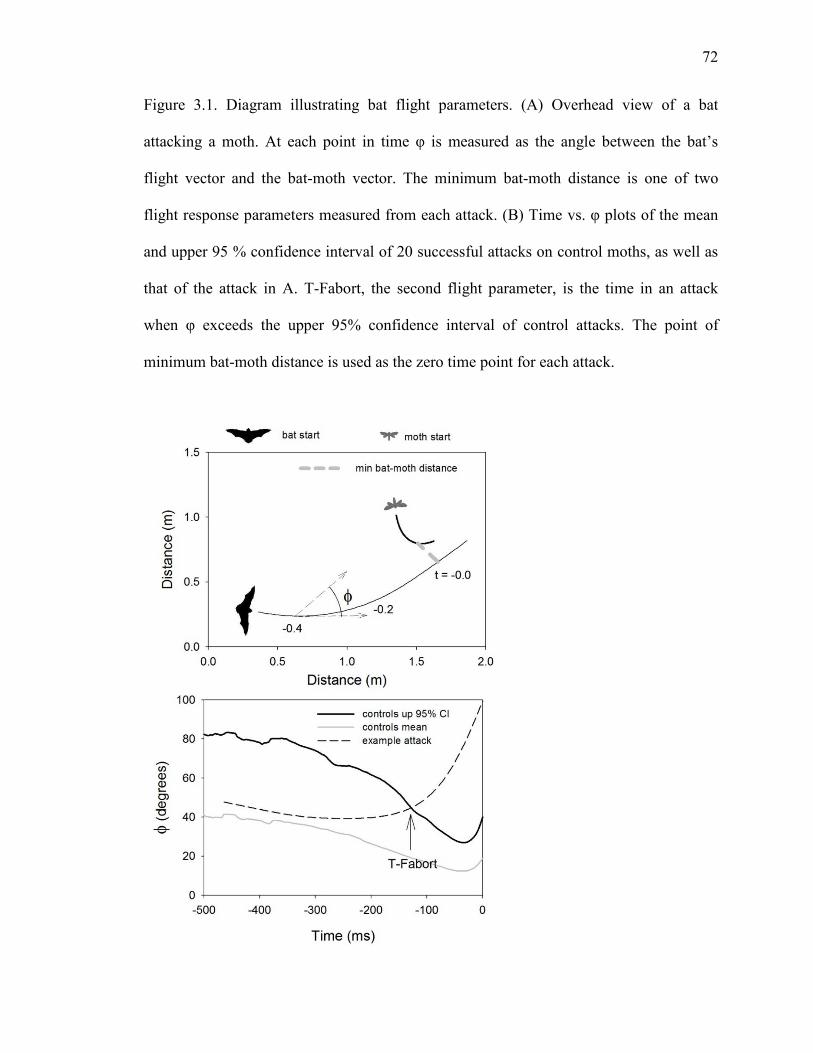
72
Figure 3.1. Diagram illustrating bat flight parameters. (A) Overhead view of a bat
attacking a moth. At each point in time φ is measured as the angle between the bat’s
flight vector and the bat-moth vector. The minimum bat-moth distance is one of two
flight response parameters measured from each attack. (B) Time vs. φ plots of the mean
and upper 95 % confidence interval of 20 successful attacks on control moths, as well as
that of the attack in A. T-Fabort, the second flight parameter, is the time in an attack
when φ exceeds the upper 95% confidence interval of control attacks. The point of
minimum bat-moth distance is used as the zero time point for each attack.
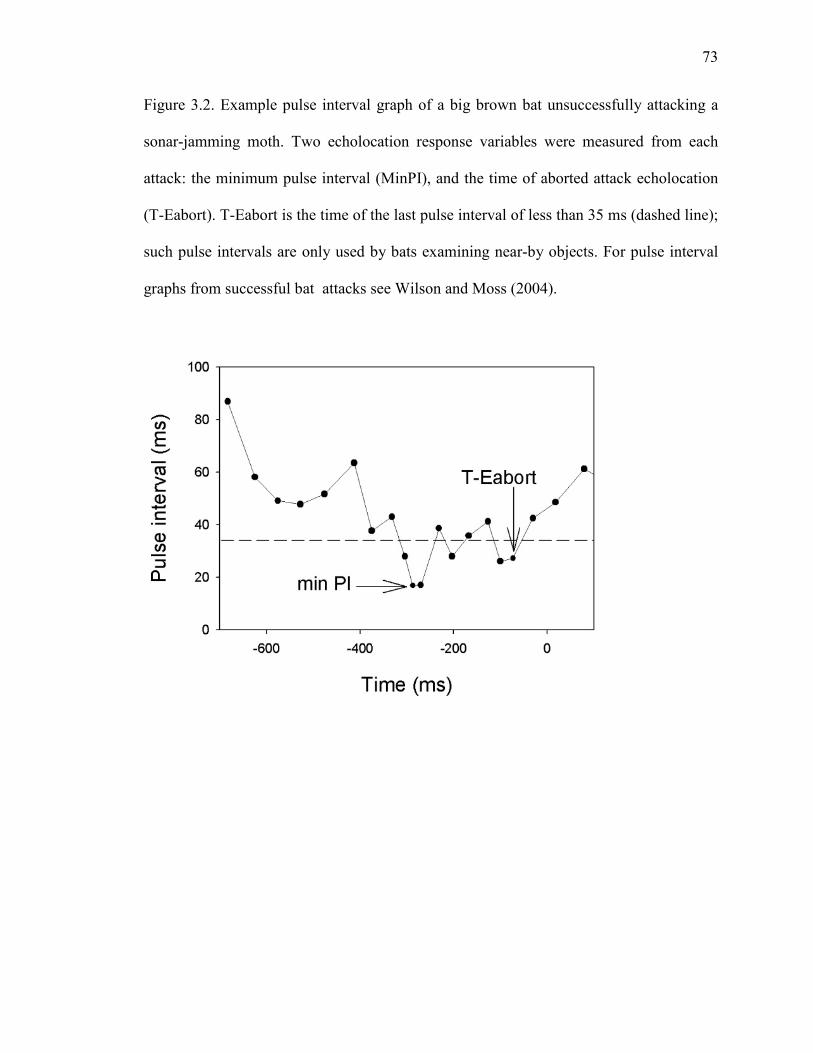
73
Figure 3.2. Example pulse interval graph of a big brown bat unsuccessfully attacking a
sonar-jamming moth. Two echolocation response variables were measured from each
attack: the minimum pulse interval (MinPI), and the time of aborted attack echolocation
(T-Eabort). T-Eabort is the time of the last pulse interval of less than 35 ms (dashed line);
such pulse intervals are only used by bats examining near-by objects. For pulse interval
graphs from successful bat attacks see Wilson and Moss (2004).
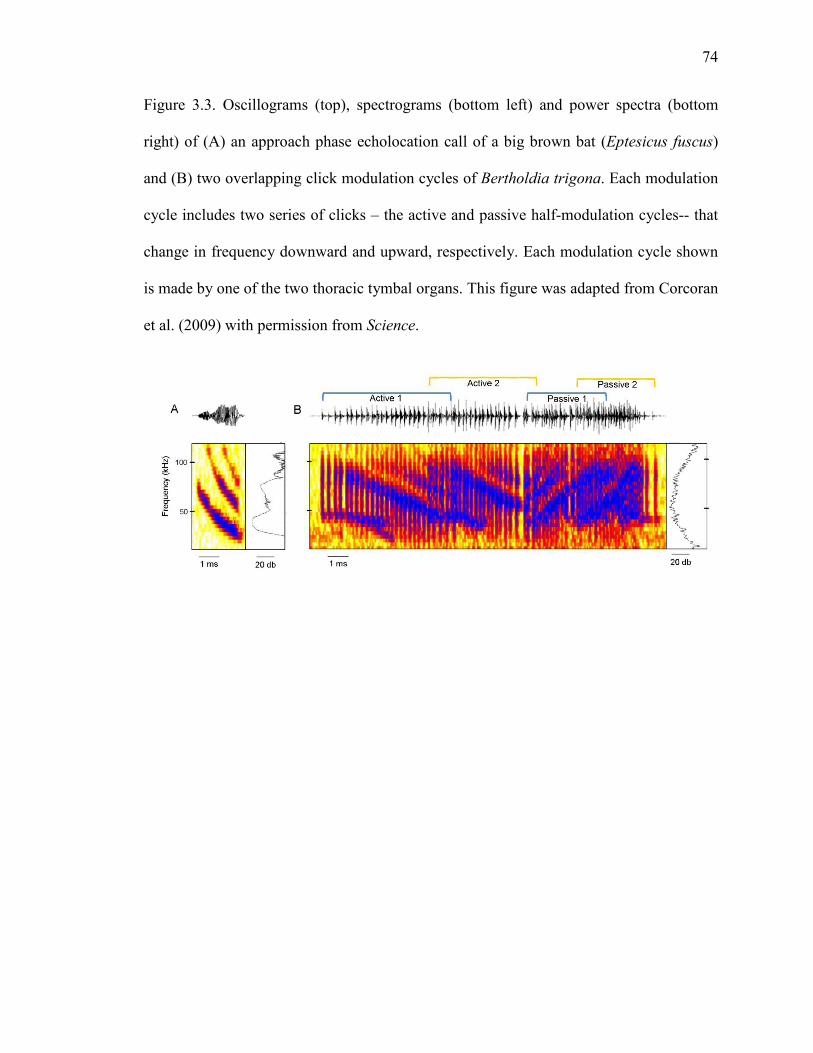
74
Figure 3.3. Oscillograms (top), spectrograms (bottom left) and power spectra (bottom
right) of (A) an approach phase echolocation call of a big brown bat (Eptesicus fuscus)
and (B) two overlapping click modulation cycles of Bertholdia trigona. Each modulation
cycle includes two series of clicks – the active and passive half-modulation cycles-- that
change in frequency downward and upward, respectively. Each modulation cycle shown
is made by one of the two thoracic tymbal organs. This figure was adapted from Corcoran
et al. (2009) with permission from Science.
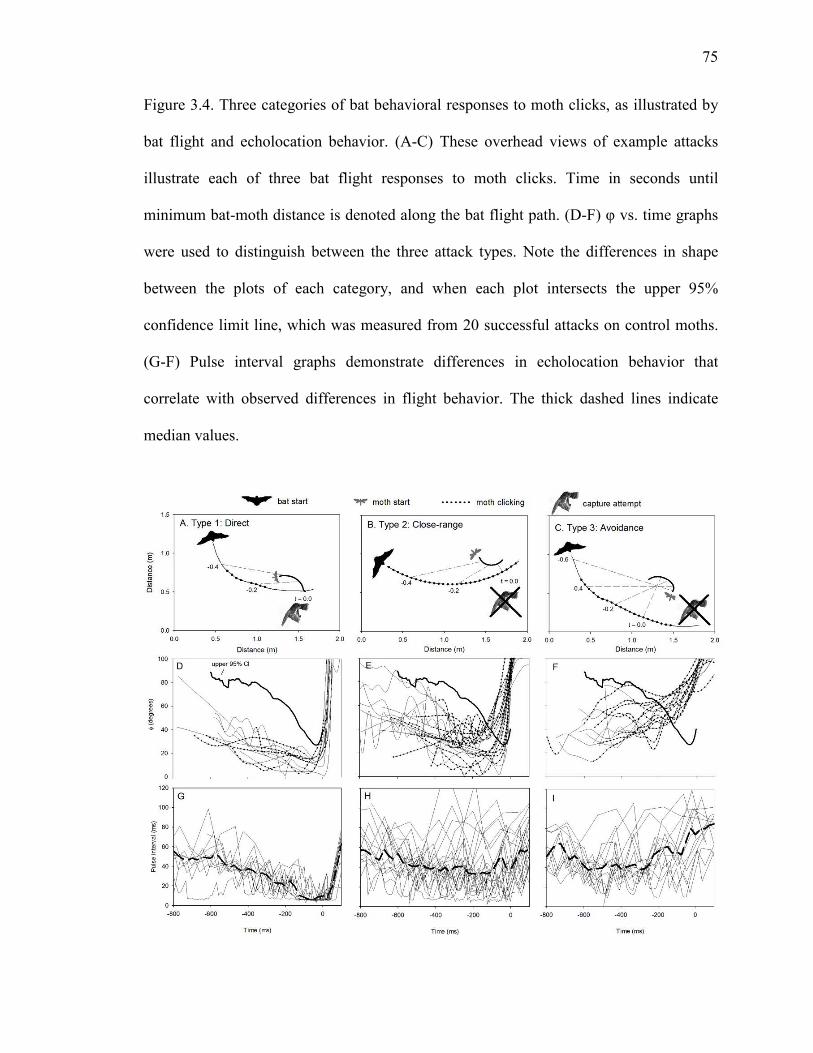
75
Figure 3.4. Three categories of bat behavioral responses to moth clicks, as illustrated by
bat flight and echolocation behavior. (A-C) These overhead views of example attacks
illustrate each of three bat flight responses to moth clicks. Time in seconds until
minimum bat-moth distance is denoted along the bat flight path. (D-F) φ vs. time graphs
were used to distinguish between the three attack types. Note the differences in shape
between the plots of each category, and when each plot intersects the upper 95%
confidence limit line, which was measured from 20 successful attacks on control moths.
(G-F) Pulse interval graphs demonstrate differences in echolocation behavior that
correlate with observed differences in flight behavior. The thick dashed lines indicate
median values.
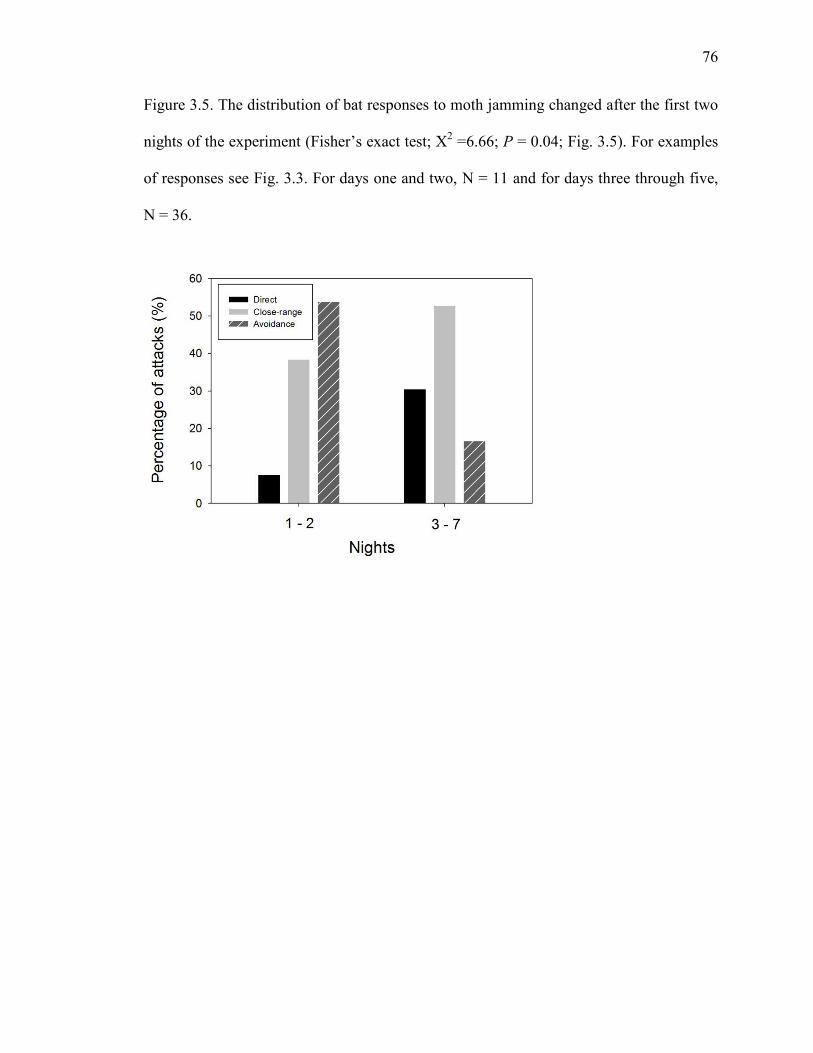
76
Figure 3.5. The distribution of bat responses to moth jamming changed after the first two
nights of the experiment (Fisher’s exact test; Χ2 =6.66; P = 0.04; Fig. 3.5). For examples
of responses see Fig. 3.3. For days one and two, N = 11 and for days three through five,
N = 36.
77
Figure 3.6. Spectrograms of three attacks on silent control or clicking experimental moths.
Arrows indicate locations of echolocation calls in attacks where Bertholdia trigona moth
clicks are present. (A) A big brown bat (Eptesicus fuscus) successfully attacks a noctuid
control moth using a stereotyped pattern of echolocation emissions whereby the interval
between pulses decreases as the bat nears its prey. The attack ends with a buzz, or a series
of rapidly emitted calls. (B) In a close-range attack on a clicking B. trigona, the moth’s
clicks disrupt the bat’s normal pattern of echolocation emissions. The bat’s ensuing use
of intermediate pulse intervals and an abbreviated buzz just before 0 ms indicates a
continued, but unsuccessful, pursuit of the moth. (C) In an avoidance attack on a clicking
B. trigona, the bat immediately lengthens pulse intervals to a rate that indicates the bat is
no longer pursuing the moth. No buzz is present. Time zero represents the point of
contact in A and the point of minimum bat-moth distance in B, C. This figure was
adapted from Corcoran et al. (2009) with permission from Science.
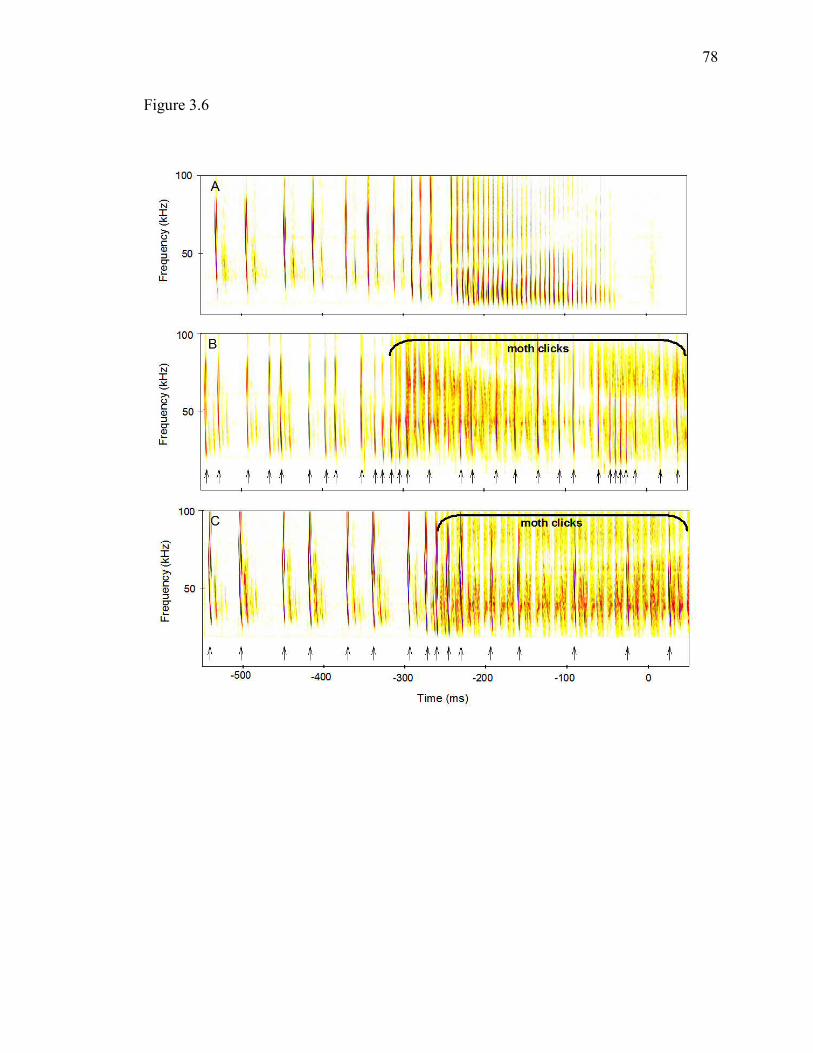
78
Figure 3.6
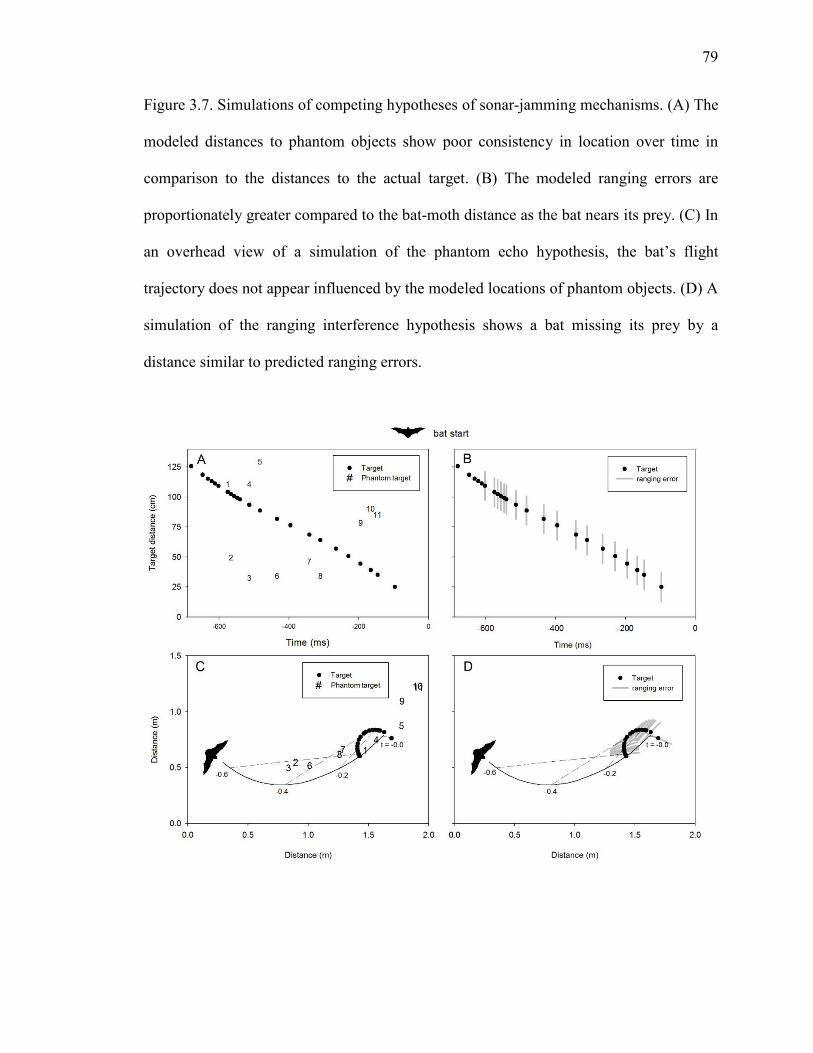
79
Figure 3.7. Simulations of competing hypotheses of sonar-jamming mechanisms. (A) The
modeled distances to phantom objects show poor consistency in location over time in
comparison to the distances to the actual target. (B) The modeled ranging errors are
proportionately greater compared to the bat-moth distance as the bat nears its prey. (C) In
an overhead view of a simulation of the phantom echo hypothesis, the bat’s flight
trajectory does not appear influenced by the modeled locations of phantom objects. (D) A
simulation of the ranging interference hypothesis shows a bat missing its prey by a
distance similar to predicted ranging errors.
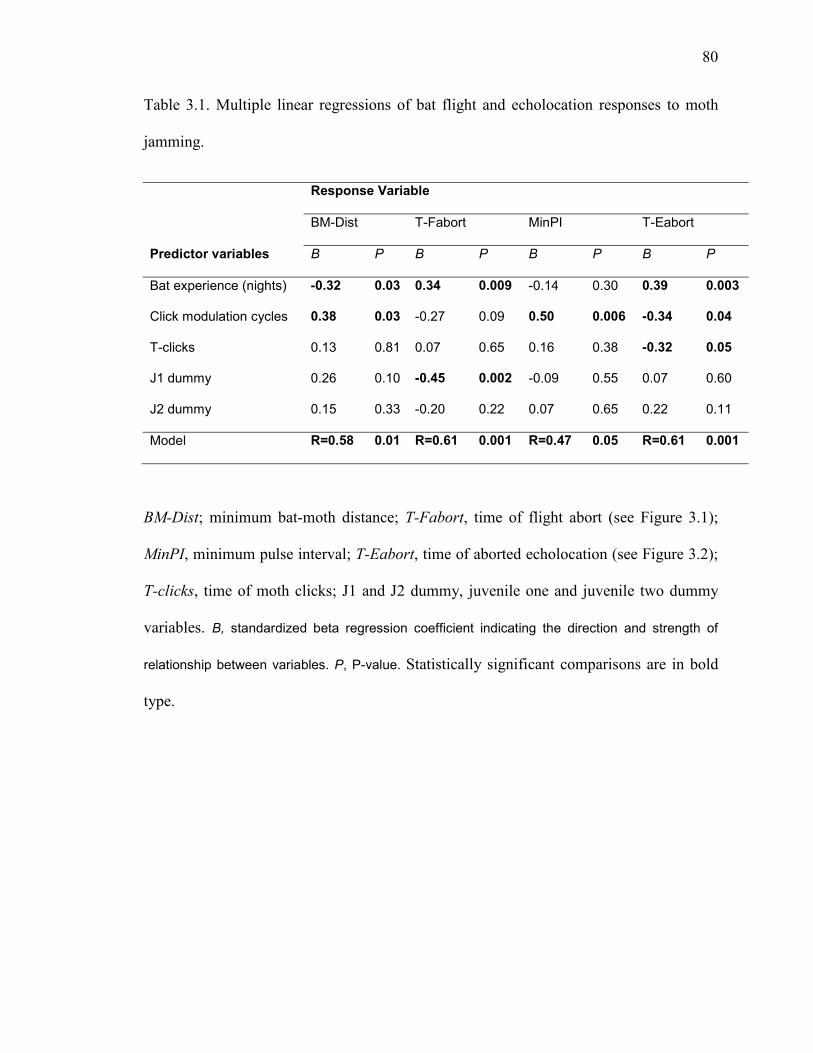
80
Table 3.1. Multiple linear regressions of bat flight and echolocation responses to moth
jamming.
Response Variable
BM-Dist T-Fabort MinPI T-Eabort
Predictor variables B P B P B P B P
Bat experience (nights) -0.32 0.03 0.34 0.009 -0.14 0.30 0.39 0.003
Click modulation cycles 0.38 0.03 -0.27 0.09 0.50 0.006 -0.34 0.04
T-clicks 0.13 0.81 0.07 0.65 0.16 0.38 -0.32 0.05
J1 dummy 0.26 0.10 -0.45 0.002 -0.09 0.55 0.07 0.60
J2 dummy 0.15 0.33 -0.20 0.22 0.07 0.65 0.22 0.11
Model R=0.58 0.01 R=0.61 0.001 R=0.47 0.05 R=0.61 0.001
BM-Dist; minimum bat-moth distance; T-Fabort, time of flight abort (see Figure 3.1);
MinPI, minimum pulse interval; T-Eabort, time of aborted echolocation (see Figure 3.2);
T-clicks, time of moth clicks; J1 and J2 dummy, juvenile one and juvenile two dummy
variables. B, standardized beta regression coefficient indicating the direction and strength of
relationship between variables. P, P-value. Statistically significant comparisons are in bold
type.
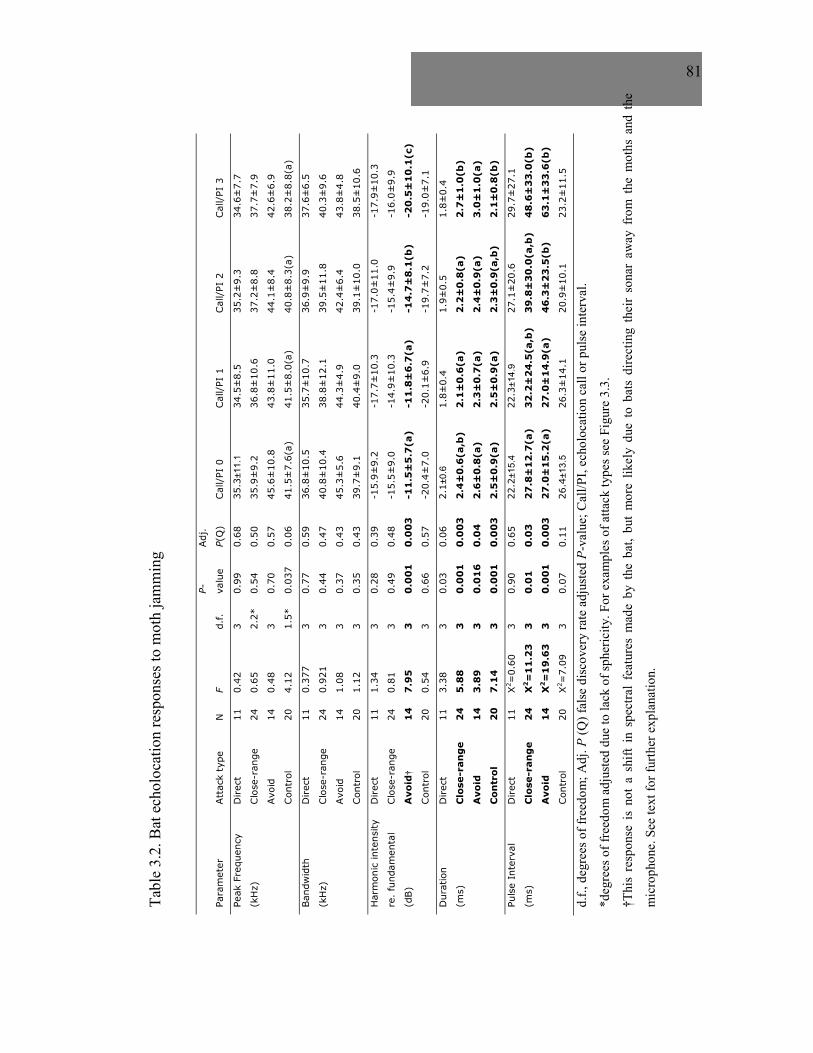
81
Tabl
e 3.
2. B
at e
chol
ocat
ion
resp
onse
s to
mot
h ja
mm
ing
Para
met
er
Att
ack
type
N
F
d.f.
P- valu
e
Adj
.
P(Q
) C
all/
PI 0
C
all/
PI 1
C
all/
PI 2
C
all/
PI 3
Peak
Fre
quen
cy
Direc
t 11
0.
42
3 0.
99
0.68
35
.3±1
1.1
34.5
±8.
5 35
.2±
9.3
34.6
±7.
7
(kH
z)
Clo
se-r
ange
24
0.
65
2.2*
0.
54
0.50
35
.9±
9.2
36.8
±10
.6
37.2
±8.
8 37
.7±
7.9
Avo
id14
0.48
30.
700.
5745
.6±
10.8
43.8
±11
.044
.1±
8.4
42.6
±6.
9
Con
trol
204.
121.
5*0.
037
0.06
41.5
±7.
6(a)
41.5
±8.
0(a)
40.8
±8.
3(a)
38.2
±8.
8(a)
Ban
dwid
th
Direc
t 11
0.
377
3 0.
77
0.59
36
.8±
10.5
35
.7±
10.7
36
.9±
9.9
37.6
±6.
5
(kH
z)C
lose
-ran
ge24
0.92
13
0.44
0.47
40.8
±10
.438
.8±
12.1
39.5
±11
.840
.3±
9.6
Avo
id
14
1.08
3
0.37
0.
43
45.3
±5.
6 44
.3±
4.9
42.4
±6.
4 43
.8±
4.8
Con
trol
20
1.
12
3 0.
35
0.43
39
.7±
9.1
40.4
±9.
0 39
.1±
10.0
38
.5±
10.6
Har
mon
ic in
tens
ity
Direc
t 11
1.
34
3 0.
28
0.39
-1
5.9±
9.2
-17.
7±10
.3
-17.
0±11
.0
-17.
9±10
.3
re.
fund
amen
tal
Clo
se-r
ange
24
0.
81
3 0.
49
0.48
-1
5.5±
9.0
-14.
9±10
.3
-15.
4±9.
9 -1
6.0±
9.9
(dB)
Avo
id†
14
7
.95
3
0
.00
1
0.0
03
-1
1.5
±5
.7(a
) -1
1.8
±6
.7(a
) -1
4.7
±8
.1(b
) -2
0.5
±1
0.1
(c)
Con
trol
200.
543
0.66
0.57
-20.
4±7.
0-2
0.1±
6.9
-19.
7±7.
2-1
9.0±
7.1
Dur
atio
n D
irec
t 11
3.
38
3 0.
03
0.06
2.
1±0.
61.
8±0.
4 1.
9±0.
5 1.
8±0.
4
(ms)
Clo
se-r
ang
e2
45
.88
30
.00
10
.00
32
.4±
0.6
(a,b
)2
.1±
0.6
(a)
2.2
±0
.8(a
)2
.7±
1.0
(b)
Avo
id
14
3
.89
3
0
.01
6
0.0
4
2.6
±0
.8(a
) 2
.3±
0.7
(a)
2.4
±0
.9(a
) 3
.0±
1.0
(a)
Co
ntr
ol
20
7
.14
3
0
.00
1
0.0
03
2
.5±
0.9
(a)
2.5
±0
.9(a
) 2
.3±
0.9
(a,b
) 2
.1±
0.8
(b)
Puls
e In
terv
al
Direc
t 11
Χ
2 =0.
60
3 0.
90
0.65
22
.2±1
5.4
22.3
±14.
927
.1±
20.6
29
.7±
27.1
(ms)
C
lose
-ran
ge
2
4
Χ2=
11
.23
3
0
.01
0
.03
2
7.8
±1
2.7
(a)
32
.2±
24
.5(a
,b)
39
.8±
30
.0(a
,b)
48
.6±
33
.0(b
)
Avo
id
14
Χ
2=
19
.63
3
0
.00
1
0.0
03
2
7.0
±1
5.2
(a)
27
.0±
14
.9(a
) 4
6.3
±2
3.5
(b)
63
.1±
33
.6(b
)
Con
trol
20
Χ
2 =7.
09
3 0.
07
0.11
26
.4±1
3.5
26.3
±14
.1
20.9
±10
.1
23.2
±11
.5
d.f.,
deg
rees
of f
reed
om; A
dj. P
(Q) f
alse
dis
cove
ry ra
te a
djus
ted
P-va
lue;
Cal
l/PI,
echo
loca
tion
call
or p
ulse
inte
rval
.
*deg
rees
of f
reed
om a
djus
ted
due
to la
ck o
f sph
eric
ity. F
or e
xam
ples
of a
ttack
type
s see
Fig
ure
3.3.
†Thi
s re
spon
se i
s no
t a
shift
in
spec
tral
feat
ures
mad
e by
the
bat
, bu
t m
ore
likel
y du
e to
bat
s di
rect
ing
thei
r so
nar
away
fro
m t
he m
oths
and
the
mic
roph
one.
See
text
for f
urth
er e
xpla
natio
n.
82
CHAPTER IV
Sonar Jamming in the Field: Effectiveness and Behavior of a Unique Prey Defense
A.J. Corcoran, and W. E. Conner
The following manuscript was published in Journal of Experimental Biology (vol. 215,
pgs. 4278-87, 2012) and is reprinted with permission. Stylistic variations are due to
requirements of the journal. A.J.C. designed and executed the experiments, conducted
data analysis, and wrote the manuscript. W.E.C. provided oversight and editorial
assistance on the project.
83
ABSTRACT
Bats and insects provide a model system for integrating our understanding of predator-
prey ecology, animal behavior, and neurophysiology. Previous field studies of bat-insect
interactions have been limited by the technological challenges involved with studying
nocturnal, volant animals that use ultrasound and engage in battles that frequently last a
fraction of a second. We overcame these challenges using a robust field methodology that
included multiple infrared cameras calibrated for three-dimensional reconstruction of bat
and moth flight trajectories and four ultrasonic microphones that provided a spatial
component to audio recordings. Our objectives were to document bat-moth interactions in
a natural setting and to test the effectiveness of a unique prey defense – sonar jamming.
We tested the effect of sonar jamming by comparing the results of interactions between
bats and Grote’s tiger moth, Bertholdia trigona, with their sound-producing organs either
intact or ablated. Jamming was highly effective, with bats capturing more than ten times
as many silenced moths as clicking moths. Moths frequently combined their acoustic
defense with two separate evasive maneuvers – flying away from the bat, and diving.
Diving decreased bat capture rates for both clicking and silenced moths, while flying
away did not. The diving showed a strong directional component, a first for insect
defensive maneuvers. We discuss the timing of B. trigona defensive maneuvers – which
differs from that of other moths – in the context of moth auditory neuroethology.
Studying bat-insect interactions in their natural environment provides valuable
information that complements work conducted in more controlled settings.
84
INTRODUCTION
The study of bats and moths has provided fundamental biological insights in areas
ranging from the neurological basis of behavior (Roeder, 1967a; Yager, 2012) to the co-
evolution of predator and prey (Fullard, 1998; Goerlitz et al., 2010). It has also revealed a
suite of defensive behaviors that either have not previously been known to occur in the
acoustic modality (aposematism and mimicry) or, in the case of sonar-jamming, are
unique in the natural world (reviewed by Conner and Corcoran, 2012).
Kenneth Roeder established the paradigm for moth defensive behaviors (Roeder,
1967a). Eared moths employ one of two flight behaviors depending on the intensity, and
therefore proximity, of an echolocating bat (Roeder, 1962; Roeder, 1964). Quiet
echolocation calls indicate a distant bat that has not yet detected the moth; these calls
elicit a controlled negative phonotactic response (“turning away”) aimed at avoiding
detection (Roeder, 1962; Roeder, 1967b; Goerlitz et al., 2010). Louder echolocation calls
indicate a nearby bat in pursuit and elicit a non-directional evasive maneuver such as a
dive or spiral to the ground (Roeder, 1962).
Moths of the superfamily Noctuoidea have received most attention in the study of
anti-bat defenses. Most Noctuoids have paired metathoracic tympana which each have
only two auditory receptor neurons: A1, which is sensitive to lower intensity ultrasound,
and A2, which is sensitive to higher intensity ultrasound (Fullard et al. 2003; Roeder,
1967a). A1 firing is thought to initiate negative phonotactic behavior, while A2 firing has
long been associated with late-attack defenses such as diving (Roeder, 1974). However,
recent work disputes this hypothesis, and instead proposes that late-attack defenses are
85
stimulated by the summation of A1 and A2 firing (Fullard et al. 2003; Ratcliffe et al.,
2009).
Tiger moths (Lepidoptera: Erebidae, Arctiinae; formerly Lepidoptera: Arctiidae)
(Zahiri et al. 2011) respond to attacking bats by producing ultrasonic clicks through the
buckling of metathoracic tymbal organs (Fullard and Heller, 1990; Barber and Conner,
2006). Depending on whether a species is chemically defended and the amount of sound
it produces, moth clicks serve as acoustic aposematic (Hristov and Conner, 2005a;
Hristov and Conner, 2005b; Ratcliffe and Fullard, 2005), mimetic (Barber and Conner,
2007; Barber et al., 2009), or sonar-jamming signals (Corcoran et al., 2009; Corcoran et
al., 2010; Corcoran et al., 2011; Conner and Corcoran, 2012). In some cases these
defenses may be combined; for example, a small degree of sonar-jamming may enhance
bat learning of aposematic signals (Ratcliffe and Fullard, 2005). Sonar-jamming has long
existed as a hypothesis for the function of moth clicks (Fullard et al., 1979; Fullard, 1994),
but only recently has this hypothesis been confirmed in a study pitting a tiger moth with
exceptional sound-producing abilities [Bertholdia trigona (Grote, 1879)] against big
brown bats (Eptesticus fuscus) in captivity (Corcoran et al., 2009). To disrupt
echolocation, moth clicks must occur in a narrow 1-2 ms window surrounding the time
echoes return to the bat from the ensonified moth (Miller, 1991). These clicks then
disrupt the timing of the firing of bat auditory neurons which are involved in encoding
target distance (Touggard et al. 1998). The number of clicks that fall within this window
determine the size of ranging errors (Miller, 1991) and the likelihood of bat capture
(Corcoran et al. 2011). In captivity, jammed bats narrowly miss their prey by a distance
86
predicted by psychophysical studies (Corcoran et al. 2011). Field studies of sonar-
jamming moths have not previously been attempted.
Research documenting the pursuit and escape flight of bats and insects has largely
been restricted to captive animals in controlled environments (Corcoran et al., 2010;
Dawson et al., 2004; Ghose et al., 2006; Ghose et al., 2009; Triblehorn et al., 2008).
While these laboratory studies have yielded many novel discoveries, the limited space of
a flight room prevents the animals from exhibiting the full suite of behaviors that occur in
nature. Bats in captivity alter the temporal and spectral features of echolocation calls, and
also the directionality and intensity of their sonar beams (Surlykke and Moss, 2000;
Surlykke et al., 2009). This may substantially alter the timing of insect defensive
responses, and therefore the result of encounters.
Field studies of bats and insects suffer from their own limitations. First, the species of
bat and insect being observed are frequently not known (Acharya and Fenton, 1999;
Roeder, 1962; Rydell, 1992). Second, echolocation calls of bats are rarely recorded
(Acharya and Fenton, 1999; Agee, 1969; Roeder, 1962; Rydell, 1992), and moth clicks
have never been recorded from free-flying tiger moths in the field (Acharya and Fenton,
1992). Third, visual observation without video documentation is the norm (e.g., Acharya
and Fenton, 1999). This is especially problematic because attack sequences typically last
only a fraction of a second. Fourth, observations, whether visual or photographed, are
frequently made only from a single location, making assessment of directionality of
movement prone to error. And fifth, the effect of artificial lights, frequently used to
attract moth and bat activity to a focal observation area (Rydell, 1992; Acharya and
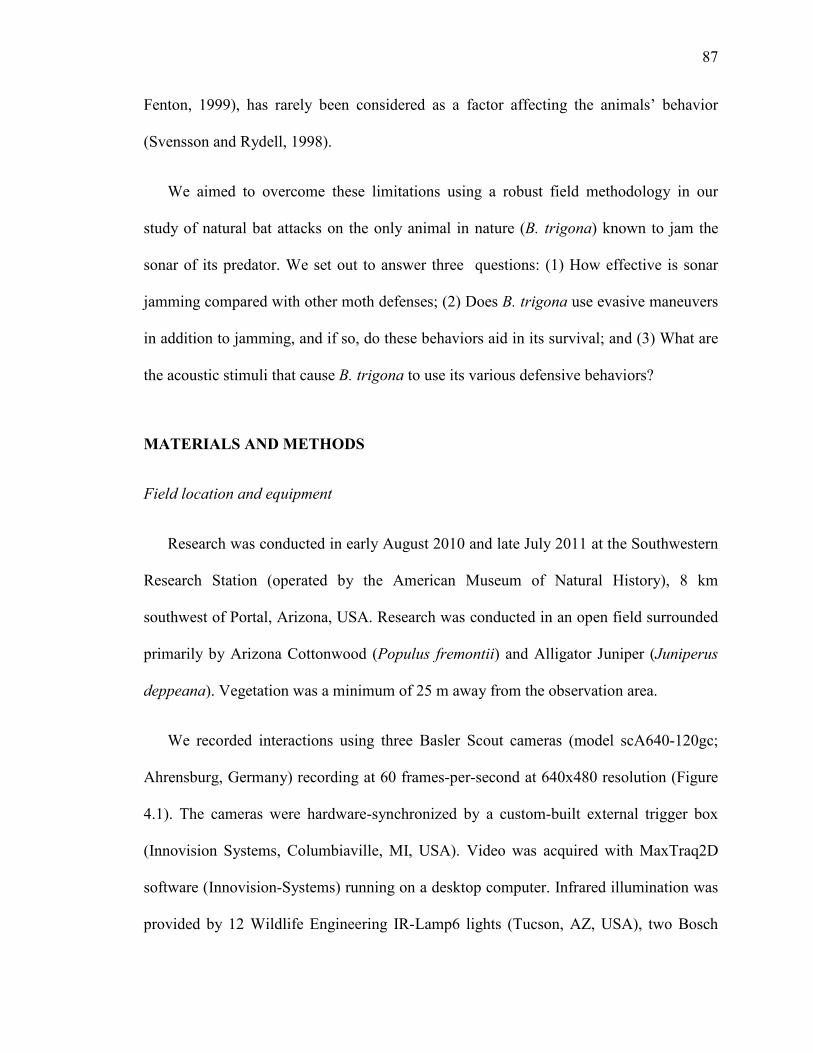
87
Fenton, 1999), has rarely been considered as a factor affecting the animals’ behavior
(Svensson and Rydell, 1998).
We aimed to overcome these limitations using a robust field methodology in our
study of natural bat attacks on the only animal in nature (B. trigona) known to jam the
sonar of its predator. We set out to answer three questions: (1) How effective is sonar
jamming compared with other moth defenses; (2) Does B. trigona use evasive maneuvers
in addition to jamming, and if so, do these behaviors aid in its survival; and (3) What are
the acoustic stimuli that cause B. trigona to use its various defensive behaviors?
MATERIALS AND METHODS
Field location and equipment
Research was conducted in early August 2010 and late July 2011 at the Southwestern
Research Station (operated by the American Museum of Natural History), 8 km
southwest of Portal, Arizona, USA. Research was conducted in an open field surrounded
primarily by Arizona Cottonwood (Populus fremontii) and Alligator Juniper (Juniperus
deppeana). Vegetation was a minimum of 25 m away from the observation area.
We recorded interactions using three Basler Scout cameras (model scA640-120gc;
Ahrensburg, Germany) recording at 60 frames-per-second at 640x480 resolution (Figure
4.1). The cameras were hardware-synchronized by a custom-built external trigger box
(Innovision Systems, Columbiaville, MI, USA). Video was acquired with MaxTraq2D
software (Innovision-Systems) running on a desktop computer. Infrared illumination was
provided by 12 Wildlife Engineering IR-Lamp6 lights (Tucson, AZ, USA), two Bosch
88
UFLED20-8BD illuminators (Farmington Hills, MI, USA), and one Raytec Raymax 200
platinum illuminator (Ashington, UK).
Three-dimensional calibration of video recording
The cameras were calibrated for three-dimensional (3-D) reconstruction of bat and
moth flight paths using the relative orientation method (Svoboda et al., 2005) as
implemented in the MaxTraq3D software (“Dynamic Wand Method”; Innovision
Systems). For this method, two spherical infrared markers are anchored at a fixed
distance from each other on a calibration object, or “wand.” This wand is moved
throughout the interaction volume, and the markers are later digitized in the software. A
second calibration object with four calibration points along two perpendicular axes is
used to set the origin of the 3-D space and the x-, y-, and z-axes. We tested the accuracy
of our calibration by moving the wand through the recorded volume a second time and
determining the distance between the two points (which were set 146 cm apart) using the
MaxTraq3D software. Over 2500 frames, the points had a mean error of 3.8 mm, or
0.26%. Our calibration volume was approximately 6 m x 6 m x 5 m, or 180 m3.
Audio equipment
Audio was recorded using four Avisoft Bioacoustics CM16/CMPA ultrasonic
microphones (Berlin, Germany) connected to an Avisoft Ultrasound Gate 416Hb
recording interface. Each of the four microphones was placed on a stand 1.5 m off the
ground, in a square-like arrangement around the calibration volume (Figure 4.1). Audio
was triggered to begin simultaneously with the video by a signal sent from the triggering
box to the recording interface. Tests showed the error of synchronization between audio
89
and video to be <1 ms. The four microphones allowed us to record the relatively quiet
clicks of B. trigona and the directional echolocation calls of bats over a larger volume
than would be possible with a single microphone. The arrangement of microphones also
provided a spatial component to our audio recordings that was useful for assigning bat
and moth sounds to individual animals captured in our video recordings.
Bat-moth field observations
One of the challenges of studying bats and moths in the field and capturing
interactions on audio and video is finding a situation where attacks occur reliably within a
predefined volume. To overcome this limitation we attracted moths to a focal area using
two 15-watt ultraviolet lights (Leptraps LLC, Georgetown, KY, USA) placed on 4-m
poles, with the two poles placed approximately 5 m apart (Figure 4.1). This arrangement
allowed for varied movement of the moths as they flew between and around the lit areas.
The large numbers of moths around the lights attracted foraging bats. Early in the
evening (between approximately sunset and midnight), the many moths around the lights
interfered with our ability to isolate individual bat-moth interactions. As the evening
progressed (between 0000 and 0400), moth activity decreased, but the foraging bats
remained. This is when we conducted our experiments. Individual B. trigona had
previously been collected at black-lights within 100 m of the recording area. Moths were
held individually in 30-ml plastic cups for up to 24 hours prior to experimentation.
Individuals held over from the previous night were fed a saturated sugar water solution.
Moths were either left intact or had both tymbal organs ablated by puncturing the cuticle
of the tymbal. No external bleeding was ever observed from the ablation. Clicking and
90
silenced moth flight behavior was analyzed to assess whether the ablation procedure had
an effect on moth flight (see below).
During experimentation B. trigona were placed on a release platform consisting of a
heating pad attached to a 1-m pole anchored in the ground. Individual moths flew from
the heating pad to the observation area of their own volition, and bat attacks ensued
within one to three minutes. Several methods were used to ensure that the moths being
attacked were indeed B. trigona. In many cases an observer could track an individual
moth from the release platform to an encounter with a bat. In other cases moths could be
identified based on their distinctive clicks in the audio tracks. The relative timing and
intensity of the clicks on the four audio channels was used to ensure that the clicks came
from the moth being attacked in the video. Only attacks in which the identity of the moth
could be unambiguously confirmed were used in the analysis.
Bat species identification
The species of bat in each encounter was determined using the automated acoustic
species recognition algorithms (Corcoran, 2007) of Sonobat 3.0 (Arcata, CA, USA).
Sonobat makes classifications by measuring numerous acoustic properties of bat
echolocation calls and running them through a discriminant function analysis classifier
that was created using recordings of known species. A species classification is accepted
only if the discriminant probability (a measure of statistical confidence) is > 0.90. If a
species cannot be determined, an individual is assigned to a species group, which consists
of multiple species that make similar echolocation calls (Parsons and Jones, 2000).
91
Based on 19 years of mist-netting capture data, 16 insectivorous bat species are
known to regularly occur at our field site (J. Tyburec, Bat Conservation International,
personal communication). Of these, 12 were included in our acoustic species classifier;
Idionycteris phylottis, Myotis auriculus, M.velifer, and Nyctinomops macrotus lacked a
sufficient number of known recordings to be included. I. phylottis and N. macrotus
produce characteristically low-frequency calls (12-17 kHz) that were not recorded during
the experiments. M. auriculus and M velifer both produce calls with peak frequency in
the 40-kHz range (J. Szewczak, personal communication). Therefore, any calls identified
to the genus Myotis in the 40-kHz range are reported only to the species-group level.
Analysis of bat and moth flight trajectories
The flight trajectories of bats and moths were manually digitized using Maxtraq2D. A
single point representing the “center of mass” for each animal was used. The digitized
values were then imported into MaxTraq3D, which generated 3-D coordinates for the bat
and moth for each frame of each attack. These values were then imported into a custom
MATLAB (Natick, MA, USA) program (BATracker; coded by B. Chadwell). A
smoothing spline function (MATLAB spaps routine) was fit to each flight trajectory, and
this function was used to estimate various flight parameters.
A 3-D plot of the bat and moth for each encounter was analyzed. The moth’s flight
response was first described qualitatively, and discrete behaviors were then confirmed
using quantitative metrics. Two categories of behaviors were observed – flying away, and
diving. Fly-aways were designated by a rapid decrease in β (the angular deviation
between the moth’s flight vector and the bat-moth vector) combined with a rapid rise in
92
tangential acceleration. Alternatively, a fly-away could also be designated by the moth
rapidly increasing translational acceleration while β remained low. Diving involved a
rapid vertical acceleration toward the ground. The number of attacks where bats aborted
pursuit in response to moth clicks was determined using previously established criteria
(Corcoran et al. 2011); these include lengthening pulse intervals and bats veering away
from the moth soon (100-300 ms) after clicking began. The duration of each attack was
taken as the total time when φ (the angular deviation between the bat’s instantaneous
flight vector and the vector from the bat to the moth) was less than 45 degrees.
In order to visualize moth evasive behavior with greater detail than that possible in
the field, high-speed video of big brown bats attacking free-flying B. trigona in captivity
was taken using a RedLake N3 camera (Tallahassee, FL, USA) shooting at 1000 frames-
per-second. In order to restrain the moths’ flight to an area within the camera’s view, two
ultraviolet LEDs were suspended 1.5 m from the ceiling of an outdoor flight cage (6m x
4m x 3m) and approximately one meter from each other. This effectively replicated our
outdoor recording setup, but on a much smaller scale. The moths were attracted to the
area around the suspended LEDs and bats released into the flight cage attacked the freely
flying moths.
Statistical analysis
Statistical analysis was conducted in IBM SPSS version 19 (Armonk, NY, USA) and
R version 2.12.1 (Vienna, Austria). The G-test was used to test for independence between
categorical variables (Sokal and Rohlf, 1995). The Williams correction was applied when
expected cell values in the G-test were less than five (Sokal and Rohlf, 1995). In such
93
cases, the G-statistic is labeled “G-adjusted.” For continuous variables normality was
assessed visually using normal quantile plots (Sokal and Rohlf, 1995) and quantitatively
using the Shapiro-Wilk test of normality. Alpha was set at 0.05.
RESULTS
Effectiveness of the sonar-jamming defense
The presence of moth clicks had a strong effect on the result of bat-moth
encounters (Figure 4.2; G-test; G-adjusted =56.1; d.f. = 3; P < 0.0001). Nearly all of the
clicking moths avoided capture from attacking bats (Movie 1, Movie 2), and the few
moths that were captured were released unharmed. In contrast, bats captured a large
majority of the silenced moths, and ate two-thirds of those they captured (Figure 4.2). In
order to later compare the effectiveness of different defenses, we will use a measure we
call the “defense ratio,” which equals the capture rate when a defense is absent divided by
the capture rate when the defense is present. In this case the defense ratio for sonar
jamming is 10.4 (71% divided by 6.8%).
B. trigona evasive maneuvers
Moths employed two distinct evasive maneuvers – fly-aways and dives (Figure
4.3). Fly-aways involved a sharp turn or acceleration away from an oncoming bat. We
prefer this term over “turn-away” as turning is not necessarily required if the moth
accelerates away from a bat approaching from the rear. Dives involved a rapid
acceleration toward the ground with vertical speed of 1.5 to 4 m·s-1. The resolution of our
cameras did not allow us to determine visually whether these dives were passive or active.
94
However, the rate of maximum vertical acceleration during dives (18.8 ± 7.0 m∙s-2) well
exceeded the rate of gravitational acceleration (9.8 m∙s-2), indicating that the dives are
active. A high-resolution video of the diving behavior obtained in captivity confirms this
finding (Movie 2).
Diving occurred in more than half of all bat-moth encounters, and at similar rates
for both clicking and silenced moths (G-test; G = 0.279; d.f. = 1; P = 0.60); fly-aways
and no evasive maneuvering were less common (Figure 4.4A). Fly-aways occurred twice
as often in silenced moths, while attacks where moths exhibited no evasive maneuvers
were twice as common in clicking moths (Figure 4.4A); however, these differences were
not statistically significant (Fly-aways; G = 3.09; d.f. = 1; P = 0.08; no maneuvers; G =
1.648; d.f. = 1; P = 0.20). Bats captured more silenced than clicking moths regardless of
whether the moths were diving (G-test; G = 22.0; d.f. = 1; P < 0.0001), flying away (G-
test; G = 24.7; d.f. = 1; P < 0.0001), or exhibiting no (G-test; G = 12.2; d.f. = 1; P < 0.001)
evasive maneuvers (Figure 4.4B). Both clicking (G-adjusted = 4.78; d.f. = 1; P = 0.03)
and silenced (G-adjusted = 5.37; d.f. = 1; P =0.02) moths that dove had lower capture
rates than moths that either flew away or did no evasive maneuver (Figure 4.4B). Moths
that flew away and moths that did no evasive maneuvers had similar capture rates
(clicking moths, P = 0.30; silenced moths P = 0.37).
Clicking caused bats to abort their attacks rapidly (as evidenced by increasing
pulse intervals and bats veering away from the moth soon after clicking began) in 61%
(27 of 44) of bat-moth encounters. This behavior was never observed in 38 attacks on
silenced B. trigona, a significantly different margin (G-test; G = 45.2; d.f. = 1; P <
0.0001). The duration of attacks on silenced moths (median 1.4 s; interquartile range 1.0-
95
1.5 s) was twice that of attacks on clicking moths (median 0.7 s; interquartile range 0.6 –
1.0 s), which was significantly different (Mann-Whitney U test; U = 1012.5; d.f. = 1; P <
0.0001). The distance silenced moths flew during attacks (median 2.2 m; interquartile
range 1.7 - 3.4 m) was 47% greater than that of clicking moths (median 1.5 m;
interquartile range 1.1 - 2.2 m); this difference was statistically significant (Mann-
Whitney U test; U = 882.0; d.f. = 1; P = 0.002), and may be an underestimate as some
silenced moths were chased out of the calibrated volume during attacks. Finally, of moths
that were not captured in attacks, 64% (7 of 11) of silenced moths, but only 7% (3 of 41)
of clicking moths, flew to the ground, a significantly significant margin (G-adjusted =
13.8; d.f. = 1; P = 0.0002).
Effect of light on moth evasive maneuvers and bat capture success
The moth’s distance from a light did not affect the moth’s likelihood of diving
(Figure 4.5A; G-adjusted = 1.67; d.f. = 3; P = 0.64) or of being captured (Figure 4.5B;
silenced moths; G-adjusted = 2.55; d.f. = 3; P = 0.46; clicking moths; G-adjusted = 3.34;
d.f. = 3; P = 0.34). Silenced moths within 1 m of a light appeared to be captured less
often than moths flying farther from a light (Figure 4.5B), although this may be a result
of the small sample size of moths flying within 1 m of a light (N = 3).
Timing of moth defenses
Moth clicking, diving, and flying away were all initiated after the bat detected the
moth and began its approach (Figure 4.6). Moth defenses occurred within a similar range
of bat-moth distances and bat pulse intervals. The one exception to this was that fly-
aways for silenced moths occurred when the bat was particularly close (Figure 4.6). This
96
late response may not have been observed for clicking moths because bats frequently
aborted their attacks earlier in the sequence, not providing the moths an opportunity to
evade at such a close distance.
Directionality of moth diving
An additional analysis was conducted on the directionality of moth flight prior to
and during diving (Figure 4.7). Prior to dives, the horizontal component of moth flight
was random with respect to the oncoming bat (Rayleigh test; z = 0.207; P =0.86; Figure
4.7A). However, during dives the horizontal component of the moths’ flight showed a
significant directional trend away from the oncoming bat (Rayleigh test; z = 4.77; P
=0.007 ; Figure 4.7B). Moths flew slightly upward (Rayleigh test; z = 5.03; P =0.006 ;
Figure 4.7C) prior to diving at a sharp angle away from the approaching bat (Rayleigh
test; z = 27.4.03; P <0.0001; Figure 4.7D).
Bat species identification and capture success rates
Ninety percent of bats attacking clicking B. trigona and 79% of bats attacking
silenced B. trigona were classified in the 40-kHz Myotis group (Table 4.1). Three other
bat species were identified in one to nine attacks. While sample sizes for species other
than 40-kHz Myotis were small, capture rates for both clicking and silenced moths were
fairly consistent between species (0-8.3% for clicking moths, 70-100% for silenced
moths; Table 4.1).
DISCUSSION
Sonar-jamming is highly effective against a range of bat species
97
Bats captured over ten times more silenced moths than clicking moths, indicating
that sonar-jamming is a highly effective defense (Figure 4.2). Sonar jamming’s defense
ratio (10.4) compares favorably with that of insect evasive flight maneuvers (2.1-4.9;
Figure 4.8). Aposematic clicking in Hypoprepia fucosa has a defense ratio of 9.6.
Clicking therefore appears to be more effective than evasive flight maneuvers regardless
of whether it is used to warn bats of toxicity or jam their sonar. B. trigona clicking also
appears to increase survival after capture, as none of the three clicking B. trigona that
were captured were eaten, while two-thirds of silenced B. trigona that were captured
were eaten (Figure 4.2). Clicking itself may therefore have an aversive effect on bats,
either because of the high intensity of the clicks at close range or possibly through tactile
stimulation (Masters, 1979). This effect could be important against gleaning bats, whose
relatively quiet echolocation calls do not elicit a clicking response prior to capture
(Ratcliffe and Fullard, 2005).
Can B. trigona clicks jam the sonar of a variety of bat species? As the moth’s
tymbal buckles, it produces a burst of broadband microclicks covering frequencies of 25-
89 kHz and with peaks of energy that sweep from 85 kHz down to 50 kHz and back again
(Corcoran et al. 2009). It is not clear what role, if any, these acoustic properties play in
enhancing the jamming function. The most common predators in this study were Myotis
bats that use peak echolocation frequencies between 40 and 45 kHz (Table 4.1). These
bats’ (which at our field site could include M. volans, M. auriculus, M. ciliolabrum, and
M. velifer) most frequent prey are lepidopterans (Fenton and Bell, 1979; Fitch et al., 1981;
Warner, 1985) and they only overcame the jamming defense in 8.3% of attacks. M.
californicus (which uses echolocation above 50 kHz) (Gannon et al. 2001) and Lasiurus
98
blossevillii (a highly agile flyer) (Norberg and Rayner, 1987) were also each defeated by
sonar-jamming in two of two encounters in the current study (Table 4.1). Previous
laboratory work found that sonar-jamming is also effective against E. fuscus (Corcoran et
al., 2009; Corcoran et al., 2010), whose peak echolocation frequency is near 30 kHz.
Therefore, the current data suggests that sonar-jamming by B. trigona is effective against
bats that use a range of echolocation frequencies (30-50 kHz) and flight behaviors. This
is impressive considering that moths do not dynamically alter their jamming defense to
the bat predator, as moths are tone deaf (Roeder, 1967a), and largely lack the ability to
alter the frequency and temporal composition of sounds they produce (Barber and Conner,
2006; Corcoran et al., 2010; Fullard, 1992).
B. trigona combine sonar-jamming with evasive maneuvering
To our knowledge, this study represents the first 3-D analysis of moth flight
patterns in response to attacking bats in the natural environment. We found that B.
trigona use the same evasive maneuvers employed by other moths – 1) flying-away and 2)
diving. Diving behavior in silenced B. trigona had a defense ratio of 1.8, a value only
slightly less than other insects’ diving behaviors (Figure 4.8). Diving and clicking proved
the most effective defense, with none of the 24 moths exhibiting both behaviors being
captured (Figure 4.4B). Diving may therefore serve two potential functions in B. trigona
– 1) enhancing the effectiveness of sonar jamming and 2) serving as a “backup” defense
in cases where their tymbal organs are not functioning. In captivity, B. trigona did not
click in 22% of attacks (Corcoran et al. 2009). Since these moths were tethered it is not
possible to know whether they would have exhibited diving behavior, but if they had they
would have increased their chances of survival. These results demonstrate that evasive
99
flight maneuvers in B. trigona are not vestigial traits, such as are the auditory systems of
certain Noctuid moths that inhabit remote, bat-free islands (Fullard et al., 2004; Fullard et
al., 2007a), or have diurnal activity periods (Fullard et al., 1997).
Jamming occurs by interfering with the bat’s neural processing of prey echoes
(Tougaard et al., 1998). This diminishes the bat’s precision in determining target distance
and prevents it from coordinating its capture maneuver (Miller, 1991; Corcoran et al.,
2011). By simultaneously diving and clicking, B. trigona presents a dual challenge to the
attacking bat, which must simultaneously overcome its errors in echo processing and
adjust its flight path to intercept the diving moth (Ghose et al., 2006). This proves to be
too great a challenge, and the bat is unable to capture the moth. Based on visual
observations, some researchers have reported that tiger moths use diving or spiraling
evasive maneuvers in addition to clicking (Agee, 1969; Roeder, 1974; Fullard et al.,
1979); others have reported that evasive maneuvers were absent during bat attacks
(Dunning, 1968; Acharya and Fenton, 1992). It is not clear why some tiger moths use
evasive flight maneuvers while others do not.
A number of differences in flight were observed between silenced and clicking
moths. Silenced moths appeared to more frequently exhibit fly-aways and they did so
with bats at a closer distance, and less frequently exhibit no evasive maneuvers compared
to clicking moths. Attacks on silenced moths lasted longer and silenced moths flew
longer distances evading capture. Silenced moths also flew to the ground nearly ten times
as often as clicking moths. It is unlikely that these differences are due to the ablation
procedure, as manipulated animals would not be expected to exhibit evasive maneuvers
more frequently than unaltered animals. Instead, they are likely a result of bats behaving
100
differently when attacking clicking and silenced moths. Bats frequently (61%) aborted
attacks on clicking moths after hearing clicks, but never aborted attacks on silenced
moths prior to making a capture attempt.
These findings are the first evidence that moths dynamically alter their evasive
flight pattern depending on the behavior of an attacking bat. They also demonstrate that
moths are capable of processing bat echolocation call information in the very late stages
of attack. This contradicts a hypothesis made by Fullard and colleagues (Fullard et al.,
2003), which stated that moth tympanic receptors are not capable of encoding bat calls in
the final stage of attack, as these calls have reduced intensity, duration, and time intervals
between calls. Finally, these results demonstrate that combining jamming and diving
provides maximum defensive advantage with minimum costs in time spent avoiding
predators.
Timing and directionality of B. trigona evasive maneuvers.
B. trigona exhibited the same two categories of defenses – flying away and diving
– as was first described in the pioneering experiments of Kenneth Roeder (Roeder, 1962;
Roeder, 1967a). However, two key differences exist between our results and the
paradigm established by Roeder some 50 years ago. First, Roeder found that moths
exhibited negative phonotaxis in response to relatively quiet ultrasound pulses that
simulated distant bats (Roeder, 1962). In contrast, B. trigona exhibited negative
phonotaxis after bats had already begun their approach and locked their intense sonar
beams on the moth (Ghose and Moss, 2003). This finding supports prior evidence that
clicking tiger moths do not alter their flight activity in response to search-phase
101
echolocation, while silent noctuoid moths do (Ratcliffe et al., 2008). This finding is also
supported by evidence that some tiger moths have reduced sensitivity of the A1 auditory
neuron (Fullard et al. 2003), the sensory cell implicated in the moth negative phonotactic
response. However, we cannot exclude the possibility that the lights used in our
experiment prevent the moths from exhibiting negative phonotactic behavior earlier in
attacks, or that the moths have habituated to the relatively low-danger threat of quiet bat
search calls (Ratcliffe et al. 2011).
Second, Roeder argued that the intense calls of bats late in an attack saturate the
moth’s tympanic receptors and eliminate its ability to determine the directionality of the
sound (Roeder, 1967b). Diving behavior elicited late in the attack should therefore be
non-directional, as Roeder observed from unidentified moths using stroboscopic flash
photography (Roeder, 1962). In contrast, B. trigona diving has a clear directional
component, indicating that their tympanic receptors are not saturated by approach-phase
echolocation. When a bat echolocation attack sequence was broadcast to preparations of
five species of Noctuoid moths while recording the auditory receptor cells, the dogbane
tiger moth (Cycnia tenera) demonstrated the highest thresholds for both the A1 and A2
receptors. Tiger moths may be less susceptible to saturation of auditory receptor cells,
and directional diving responses may be limited to this group. Alternatively, directional
diving responses may be more common than has previously been documented. The only
other insect that has been systematically tested for this behavior is the praying mantis
Parasphendale agrionina, whose single functional ear precludes directional behavioral
responses (Ghose et al. 2009).
102
B. trigona begins clicking earlier in attacks in the field compared to in captivity.
Having data on the defensive responses of B. trigona in the field (current study)
and in captivity (Corcoran et al. 2009; Corcoran et al. 2011) allows us to compare the
stimuli that provoke clicking under the two environmental conditions. Clicking by tiger
moths is triggered primarily by the intensity and pulse intervals (the inverse of pulse rate)
of echolocation calls (Fullard et al, 2007b). In the field bats triggered B. trigona to click
in response to longer pulse intervals (47 ms vs. 25 ms) and at a greater distance (170 cm
vs. 76 cm). This cannot be explained by the two studies using different bat species as the
larger bodied E. fuscus used in captivity should have echolocated more loudly and
elicited clicking earlier than the smaller Myotis used in the field (Holderied and von
Helverson, 2003). Bats in the field echolocate about 20 dB louder than bats in captivity
(Surlykke and Kalko, 2008; Holderied and von Helverson, 2003; Waters and Jones,
1995), because they are typically further from background objects (Surlykke and Kalko,
2008). However, the intensity of bat calls used during attack has not been measured in the
field (Fullard et al., 2007). Studies that broadcast calls of attacking bats while recording
moth auditory nerve cell and behavioral responses have employed echolocation attack
sequences recorded in captivity (Fullard et al. 1994; Fullard et al. 2003; Barber and
Conner 2006; Corcoran et al. 2010). Results of such studies may therefore differ from
what occurs in open habitats in nature. Further work is needed to characterize the
acoustic field moths are exposed to when being attacked by bats under natural conditions,
and to apply this information to our understanding of moth neuroethology.
Moth proximity to ultraviolet lights does not inhibit defenses or affect capture rates.
103
Manmade lights provide a useful tool in the study of bat-insect interactions by
drawing the animal participants into a focal observation area (Acharya and Fenton 1992;
Acharya and Fenton 1999; Roeder, 1962; Rydell, 1992). These lights, however,
undoubtedly affect the behavior of moths, and likely bats, under study. Geometrid winter
moths flying within 4 m of a 125-watt mercury vapor lamp exhibit fewer evasive flight
maneuvers in response to pulsed ultrasound compared to moths flying in a dark woodland
(Svennssen and Rydell, 1998). Studies of bats attacking insects around lights have
typically not quantified the effects of lights on moth behavior and on the outcome of
interactions (Acharya and Fenton, 1992; Acharya and Fenton, 1999; Rydell, 1992). In the
current study (where 15-watt ultraviolet lights were used) we found no such effect, as the
percentage of moths diving and being captured were independent of moth distance to
ultraviolet lights (Figure 4.5). The one difference that appeared to stand out (albeit not
statistically significant and with the small sample size of N=3) was a decrease in capture
success of silenced moths within 1 m of lights. This result is the opposite of what would
be expected if lights reduced the effectiveness of moth defenses. Instead, this more likely
demonstrates the difficulty aerial hawking bats have when trying to capture prey close to
background objects (Siemers and Schnitzler, 2004). We conclude that low wattage
ultraviolet lights appear to be a valid method for attracting naturally behaving bats and
moths for study. This finding also demonstrates that the insect species and the type of
light may be critical for understanding the environmental impacts of light pollution.
There may be effects of lights on moth and bat behavior that we cannot observe, and
further work is required to confirm these findings using conditions that do not require
light.
104
Ecological benefits of sonar-jamming
Sonar-jamming provides many benefits to a nocturnal, volant insect. It is more
effective than evasive maneuvering, and as effective as acoustic aposematism (Figure
4.8), without the costs of sequestering toxins and having a limited number of available
host plants (Nishida, 2002). In environments where toxic, clicking moths are present
(including our field site), palatable, jamming moths may gain additional protection
through acoustic Batesian mimicry (Barber and Conner 2007; Barber et al. 2009),
whereby bats misperceive the clicks as aposematic messages. However, the large
differences in the acoustic signals of aposematic moths and jamming moths (Corcoran et
al. 2010; Conner and Corcoran 2012) would facilitate predators’ ability to differentiate
the two (Barber et al. 2009). Given that jamming moths far outnumber aposematic moths
at our field site (Corcoran and Conner, unpublished data) Batesian mimicry would be
predicted to be ineffective (Harper and Pfennig, 2007; Pfennig et al. 2001). B. trigona
clicks may sometimes also serve as a legitimate aposematic signal, as 33% of silenced B.
trigona that were captured were rejected (Figure 4.2B), a number similar to what was
found in palatability assays conducted using big brown bats in captivity (Corcoran et al.
2009). Therefore, jamming would be expected to be the predominant defense in about
two-thirds of attacks.
B. trigona clicks frequently turned away bat predators without a chase, thus
preventing lengthy and energetically expensive escape sequences. Clicking moths also
less frequently flew to the ground during bat attacks, avoiding encounters with other
predators (Guignion and Fullard, 2004), and time lost foraging and looking for mates.
Having the security of a clicking defense may also allow moths to continue their normal
105
activities when echolocating bats are present but not yet attacking (Ratcliffe et al., 2008).
The question thus arises, why isn’t jamming more common if it confers so many
advantages over other defenses? One possible answer is that jamming defenses are more
common than we realize, especially in the tropics, where tiger moth diversity is high and
most species remain unstudied (Corcoran et al., 2010). Selection on anti-bat defenses
may be stronger in the tropics, where bat species richness is high (Stevens and Willig,
2002). Costs of clicking for jamming and other purposes -- be they energetic,
developmental or other -- have not been investigated.
CONCLUSION
We have demonstrated a reliable method for studying 3-D flight trajectories and
acoustic behavior of bats attacking insects in their natural environment. This approach
allows for determining the effectiveness of defense and attack strategies, the
documentation and description of flight behaviors, and measurement of the effect of the
environment (such as proximity to lights or background vegetation) on bat-insect
interactions. The primary limitation of the current method is the use of lights for
confining moth activity within a pre-defined observation area. Further field studies are
needed to complement the existing literature on bat-insect interactions, which consists
largely of dietary analyses of fecal pellets (Clare et al., 2009; Whitaker et al., 2009),
bioacoustic and physiological studies of sound production in bats and sound reception in
moths (e.g., Goerlitz, 2010), and laboratory experiments using captive animals (Corcoran
et al., 2009; Ghose et al, 2006; Ghose et al., 2009). Field studies also provide an

106
opportunity to generate and test hypotheses in neuroethology, such as the relationship
between insect hearing sensitivity and initiation of defensive behaviors.
The current study focused on a few species of bat and one species of moth with a
unique defensive ability. We found that sonar-jamming is a highly effective defense
against a variety of bat predators, particularly when used in conjunction with diving
behaviors. Future work will highlight the similarities and differences in behaviors of
different predator and prey species. When combined with our understanding of insect
auditory systems, we will finally understand the connections between physiology and
behavior that Kenneth Roeder began to unravel decades ago.
107
List of Symbols and Abbreviations
3-D Three-dimensional
β The angular difference between the bat-moth vector and the moth flight vector
φ The angular difference between the bat-moth vector and the bat flight vector
FUNDING
Funding was provided by the National Science Foundation [grant number IOS-0615164
and IOS-0951160 to W. E. C.], the American Museum of Natural History and Wake
ForestUniversity.
108
REFERENCES
Acharya, L. and Fenton, M. B. (1992). Echolocation behaviour of vespertilionid bats (Lasiurus
cinereus and Lasiurus borealis) attacking airborne targets including arctiid moths. Can. J.
Zool. 70, 1292-1298.
Acharya, L. and Fenton, M. B. (1999). Bat attacks and moth defensive behaviour around street
lights. Can. J. Zool. 77, 27-33.
Agee, H. (1969). Response of flying bollworm moths and other tympanate moths to pulsed
ultrasound. Ann. Rev. Entomol. Soc. Am. 62, 801-807.
Barber, J. R. and Conner, W. E. (2006). Tiger moth responses to a simulated bat attack: timing
and duty cycle. J. Exp. Biol. 209, 2637-2650.
Barber, J. R. and Conner, W. E. (2007). Acoustic mimicry in a predator–prey interaction. Proc.
Natl. Acad. Sci. U. S. A.104, 9331.
Barber, J. R., Chadwell, B. A., Garrett, N., Schmidt-French, B. and Conner, W. E. (2009).
Naïve bats discriminate arctiid moth warning sounds but generalize their aposematic
meaning. J. Exp. Biol. 212, 2141-2148.
Clare, E. L., Fraser, E. E., Braid, H. E., Fenton, M. B. and Hebert, P. D. (2009) Species on
the menu of a generalist predator, the eastern red bat (Lasiurus borealisi): using a
molecular approach to detect arthropod prey. Mol. Ecol. 18, 2532-2542.
Conner, W. E. and Corcoran, A. J. (2012). Sound strategies: The 65 million-year-old battle
between bats and insects. Annu. Rev. Entomol. 57.
Corcoran, A. J. (2007). Automated acoustic identification of nine bat species of the eastern
United States. Master’s Thesis. Humboldt State University.
Corcoran, A. J., Barber, J. R. and Conner, W. E. (2009). Tiger moth jams bat sonar. Science
325, 325-327.
109
Corcoran, A. J., Conner, W. E. and Barber, J. R. (2010). Anti-bat tiger moth sounds: Form
and function. Curr. Zool. 56, 358-369.
Corcoran, A. J., Barber, J. R., Hristov, N. I. and Conner, W. E. (2011). How do tiger moths
jam bat sonar? J. Exp. Biol. 214, 2416-2425.
Dawson, J., Kutsch, W. and Robertson, R. (2004). Auditory-evoked evasive manoeuvres in
free-flying locusts and moths. J. Comp Physiol., A 190, 69-84.
Dunning, D. C. (1968). Warning sounds of moths. Zeitschrift für Tierpsychologie 25, 129-138.
Fenton, M. B. and Bell, G. P. (1979). Echolocation and feeding behaviour in four species of
Myotis (Chiroptera). Can. J. Zool. 57, 1271-1277.
Fitch, J. H., Shump, K. A. and Shump, A. U. (1981). Myotis velifer. Mammalian Species, 1-5.
Fullard, J. H. (1992). The neuroethology of sound production in tiger moths (Lepidoptera,
Arctiidae). J. Comp. Physiol. A 170, 575-588.
Fullard, J. H. (1994). Jamming bat echolocation: the dogbane tiger moth Cycnia tenera times its
clicks to the terminal attack calls of the big brown bat Eptesicus fuscus. J. Exp. Biol. 194,
285-298
Fullard, J. H. (1998). The sensory coevolution of moths and bats. In Comparative hearing:
insects (ed. R. R. Hoy, A. N. Popper, R. R. Fay) pp. 279-326.
Fullard, J. and Heller, B. (1990). Functional organization of the arctiid moth tymbal (Insecta,
Lepidoptera). J. Morphol. 204, 57-65.
Fullard, J. H., Fenton, M. B. and Simmons, J. A. (1979). Jamming bat echolocation: the clicks
of arctiid moths. Can. J. Zool. 57, 647-649.
Fullard, J. H., Dawson, J. W., Otero, L. D. and Surlykke, A. (1997). Bat-deafness in day-
flying moths (Lepidoptera, Notodontidae, Dioptinae). J. Comp. Physiol. A 181, 477-483.
Fullard, J. H., Dawson, J. W. and Jacobs, D. S. (2003). Auditory encoding during the last
moment of a moth's life. J. Exp. Biol. 206, 281-294. New York: Spring-Verlag
110
Fullard, J. H., Ratcliffe, J. M. and A. R. Soutar. (2004) Extinction of the acoustic startle
response in moths endemic to a bat-free habitat. J. Evolution Biol. 17, 856-861.
Fullard, J. H., Ratcliffe, J. M. and Ter Hofstede, H. (2007a). Neural evolution in the bat-free
habitat of Tahiti: partial regression in an anti-predator auditory system. Biol. Lett. 3, 26-
28.
Fullard, J. H., Ratcliffe, J. M., and C. G. Christie. (2007b). Acoustic feature recognition in the
dogbane tiger moth, Cycnia tenera. J. Exp. Biol. 210, 2481-2488.
Gannon, W. L., Sherwin, R. E., DeCarvalho, T. N. and O'Fallell, M. J. (2001). Pinnae and
echolocation call differences between Myotis californicus and M. ciliolabrum (Chiroptera:
Vespertilionidae). Acta Chiropterol. 3, 77-91.
Ghose, K. and Moss, C. F. (2003). The sonar beam pattern of a flying bat as it tracks tethered
insects. J. Acoust. Soc. Am. 114, 1120.
Ghose, K., Horiuchi, T. K., Krishnaprasad, P. and Moss, C. F. (2006). Echolocating bats use
a nearly time-optimal strategy to intercept prey. PLoS Biol. 4, e108.
Ghose, K., Triblehorn, J. D., Bohn, K., Yager, D. D. and Moss, C. F. (2009). Behavioral
responses of big brown bats to dives by praying mantises. J. Exp. Biol. 212, 693-703.
Goerlitz, H. R., Ter Hofstede, H. M., Zeale, M. R. K., Jones, G. and Holderied, M. W. (2010).
An aerial-hawking bat uses stealth echolocation to counter moth hearing. Curr. Biol. 20,
1568-1572.
Guignion, C. and Fullard, J. H. (2004). A potential cost of responding to bats for moths flying
over water. Can. J. Zool. 82, 529-532.
Harper Jr, G. R. and Pfennig, D. W. (2007). Mimicry on the edge: why do mimics vary in
resemblance to their model in different parts of their geographical range? Proc. R. Soc. B
274, 1955-1961.
Holderied, M. W. and Von Helversen, O. (2003). Echolocation range and wingbeat period
111
match in aerial-hawking bats. Proc. R. Soc. B 270, 2293-2299.
Hristov, N. I. and Conner, W. E. (2005a). Effectiveness of tiger moth (Lepidoptera, Arctiidae)
chemical defenses against an insectivorous bat (Eptesicus fuscus). Chemoecology 15,
105-113.
Hristov, N. I. and Conner, W. E. (2005b). Sound strategy: acoustic aposematism in the bat–
tiger moth arms race. Naturwissenschaften 92, 164-169.
Kick, S. A. and Simmons, J. A. (1984). Automatic gain control in the bat's sonar receiver and
the neuroethology of echolocation. J. Neurosci. 4, 2725-2737.
Masters, W. M. (1979). Insect disturbance stridulation: Its defensive role. Behav. Ecol. Sociobiol.
5, 187-200.
Miller, L. A. (1991). Arctiid moth clicks can degrade the accuracy of range difference
discrimination in echolocating big brown bats, Eptesicus fuscus. J. Comp. Physiol. A 168,
571-579.
Miller, L. A. and Olesen, J. (1979). Avoidance behavior in green lacewings. J. Comp. Physiol. A
131, 113-120.
Nishida, R. (2002). Sequestration of defensive substances from plants by Lepidoptera. Annu. Rev.
Entomol. 47, 57-92.
Norberg, U. M. and Rayner, J. M. V. (1987). Ecological morphology and flight in bats
(Mammalia; Chiroptera): wing adaptations, flight performance, foraging strategy and
echolocation. Phil. Tran.R. Soc. B, 335-427.
Parsons, S. and Jones, G. (2000). Acoustic identification of twelve species of echolocating bat
by discriminant function analysis and artificial neural networks. J. Exp. Biol. 203, 2641-
2656.
Pfennig, D. W., Harcombe, W. R. and Pfennig, K. S. (2001). Frequency-dependent Batesian
mimicry. Nature 410, 323.
112
Ratcliffe, J. M. and Fullard, J. H. (2005). The adaptive function of tiger moth clicks against
echolocating bats: an experimental and synthetic approach. J. Exp. Biol. 208, 4689-4698.
Ratcliffe, J. M., Soutar, A. R., Muma, K. E., Guignion, C. G. C. and Fullard, J. H. (2008).
Anti-bat flight activity in sound-producing versus silent moths. Can. J. Zool. 86, 582-587.
Ratcliffe, J. M., Fullard, J. H., Arthur, B. J. and Hoy, R. R. (2009). Tiger moths and the threat
of bats: decision-making based on the activity of a single sensory neuron. Biol. Lett. 5,
368-371.
Ratcliffe, J. M., Fullard, J. H., Arthur, B. J., and Hoy, R. R. (2011). Adaptive auditory risk
assessment in the dogbane tiger moth when pursued by bats. Proc R. Soc. B 278, 364-370.
Siemers, B. M. and Schnitzler, H. U. (2004). Echolocation signals reflect niche differentiation
in five sympatric congeneric bat species. Nature 429, 657-661.
Roeder, K. D. (1962). The behaviour of free flying moths in the presence of artificial ultrasonic
pulses. Anim. Behav. 10, 300-304.
Roeder, K. D. (1964). Aspects of the noctuid tympanic nerve response having significance in the
avoidance of bats. J. Insect Physiol. 10, 529-532, IN1-IN4, 533-546.
Roeder, K. D. (1967a). Nerve cells and insect behavior. Cambridge, Mass.: Harvard University
Press
Roeder, K. D. (1967b). Turning tendency of moths exposed to ultrasound while in stationary
flight. J. Insect Physiol. 13, 873-880.
Roeder, K. D. (1974). Acoustic sensory responses and possible bat-evasion tactics of certain
moths. In Proceedings of the Canadian Society of Zoologists Annual Meeting (ed. M. D.
B. Burt), pp. 71-78. Fredericton, NB: University of New Brunswick Press.
Rydell, J. (1992). Exploitation of insects around streetlamps by bats in Sweden. Funct. Ecol.
744-750.
Stevens, R. D., and Willig, M. R. (2002). Geographical ecology at the community level:
113
perspectives on the diversity of new world bats. Ecology 83, 545-560.
Sokal, R. R. and Rohlf, F. J. (1995). Biometry: the principles and practice of statistics in
biological research. New York: W. H. Freeman and Company.
Surlykke, A. and Moss, C. F. (2000). Echolocation behavior of big brown bats, Eptesicus fuscus,
in the field and the laboratory. J. Acoust. Soc. Am. 108, 2419.
Surlykke, A., and Kalko E. K. V. (2008). Echolocation bats cry out loud to detect their prey.
PLoS ONE 3, e2036
Surlykke, A., Pedersen, S. B. and Jakobsen, L. (2009). Echolocating bats emit a highly
directional sonar sound beam in the field. Proc. R. Soc. B 276, 853-860.
Svensson, A. and Rydell, J. (1998). Mercury vapour lamps interfere with the bat defence of
tympanate moths (Operophteraspp.; Geometridae). Anim. Behav. 55, 223-226.
Svoboda, T., Martinec, D. and Pajdla, T. (2005). A convenient multicamera self-calibration for
virtual environments. Presence-Telop. Virt. 14, 407-422.
Tougaard, J., Casseday, J. and Covey, E. (1998). Arctiid moths and bat echolocation: broad-
band clicks interfere with neural responses to auditory stimuli in the nuclei of the lateral
lemniscus of the big brown bat. J. Comp. Physiol., A 182, 203-215.
Triblehorn, J., Ghose, K., Bohn, K., Moss, C. and Yager, D. (2008). Free-flight encounters
between praying mantids (Parasphendale agrionina) and bats (Eptesicus fuscus). J. Exp.
Biol. 211, 555-562.
Warner, R. M. (1985). Interspecific and temporal dietary variation in an Arizona bat community.
J. Mammal., 66, 45-51.
Whitaker, J. O., McCracken, G. F. and Siemers, B. J. (2009) Food habits analysis of
insectivorous bats In Ecological and Behavioral Methods for the Study of Bats, 2nd ed.
(ed. T. H. Kunz and S. Parsons), pp. 567-592 Baltimore, MD: Johns Hopkins University
Press
114
Yager, D. D. (2012). Predator detection and evasion by flying insects. Curr. Opin. Neurobiol.22,
201-207.
Zahiri, R., Kitching, I. J., Lafontaine, J. D., Mutanen, M., Kaila, L., Holloway, J. D. and
Wahlberg, N. (2011). A new molecular phylogeny offers hope for a stable family level
classification of the Noctuoidea (Lepidoptera). Zool. Scr. 40, 158-173.
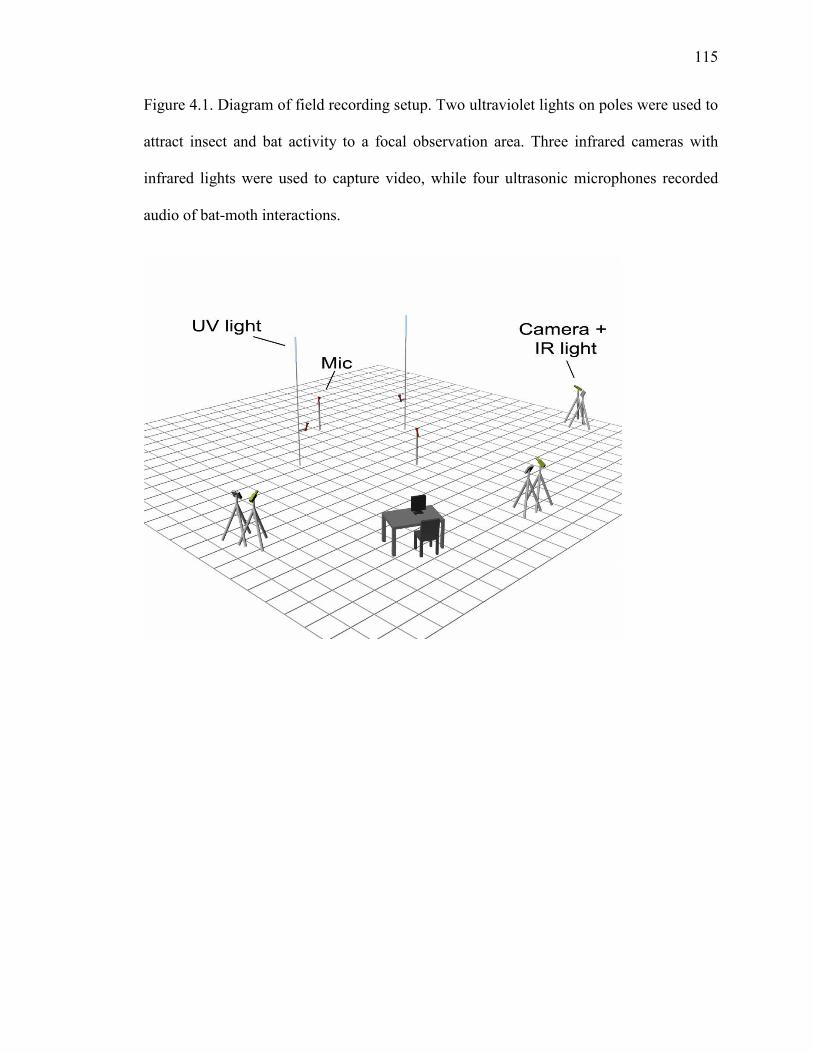
115
Figure 4.1. Diagram of field recording setup. Two ultraviolet lights on poles were used to
attract insect and bat activity to a focal observation area. Three infrared cameras with
infrared lights were used to capture video, while four ultrasonic microphones recorded
audio of bat-moth interactions.
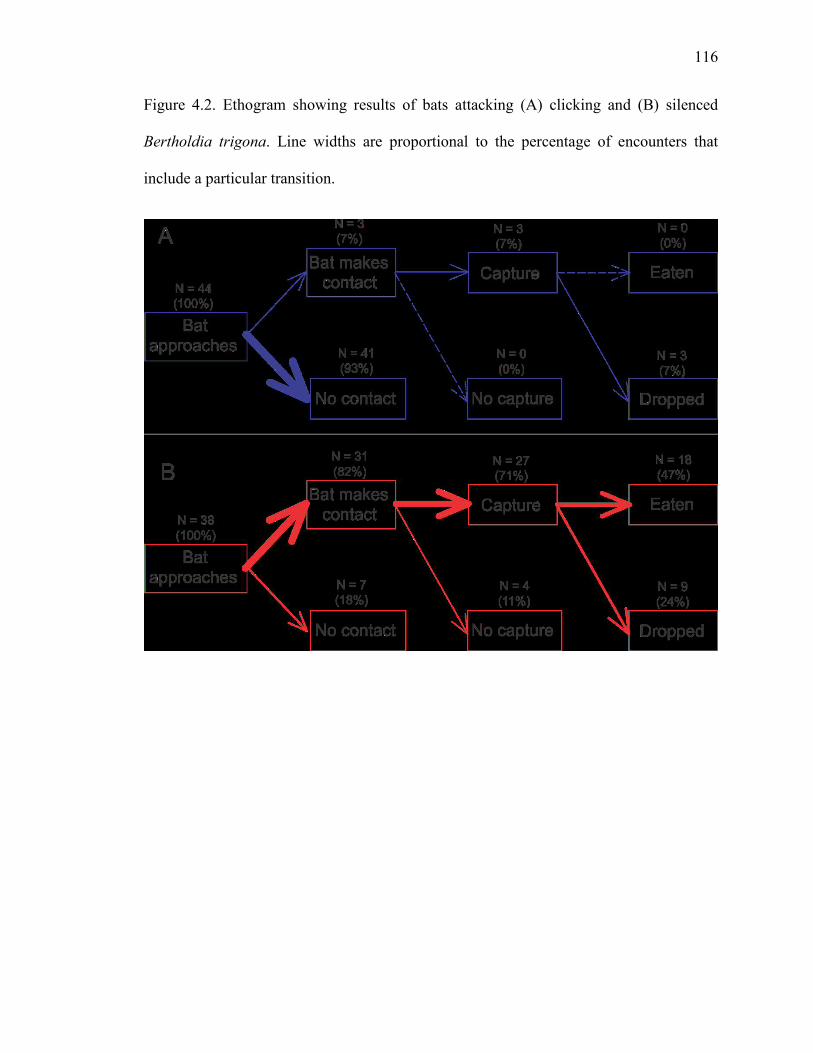
116
Figure 4.2. Ethogram showing results of bats attacking (A) clicking and (B) silenced
Bertholdia trigona. Line widths are proportional to the percentage of encounters that
include a particular transition.
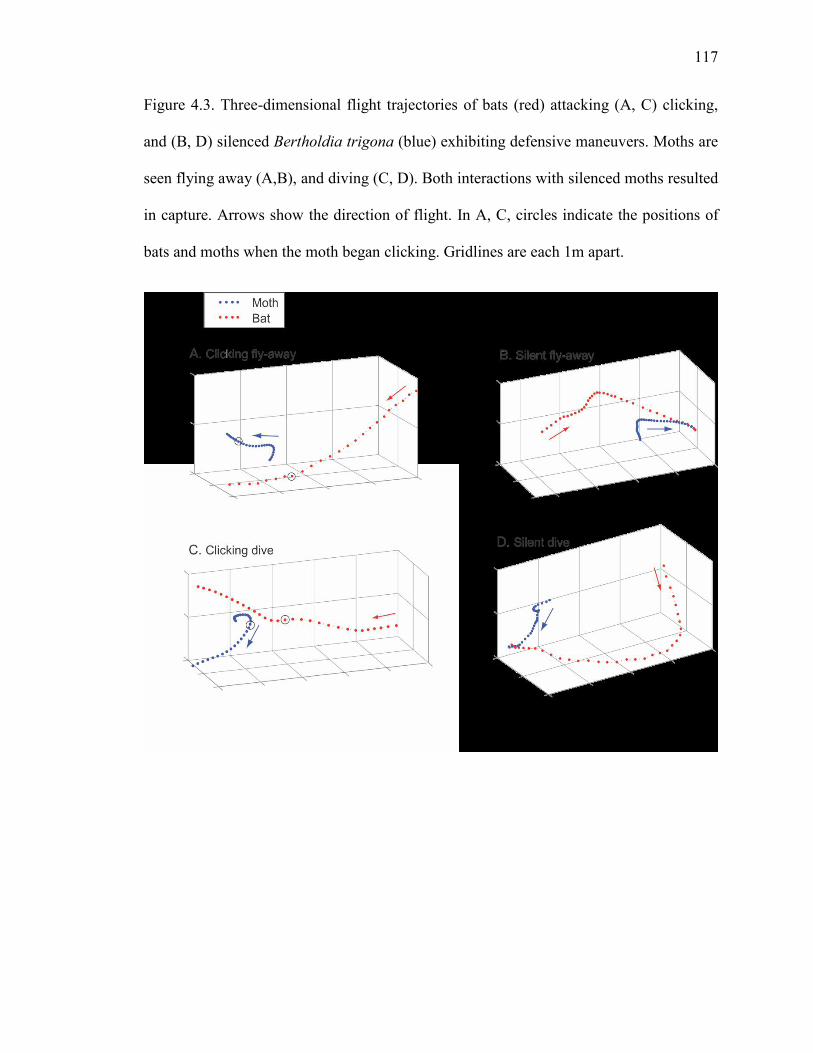
117
Figure 4.3. Three-dimensional flight trajectories of bats (red) attacking (A, C) clicking,
and (B, D) silenced Bertholdia trigona (blue) exhibiting defensive maneuvers. Moths are
seen flying away (A,B), and diving (C, D). Both interactions with silenced moths resulted
in capture. Arrows show the direction of flight. In A, C, circles indicate the positions of
bats and moths when the moth began clicking. Gridlines are each 1m apart.
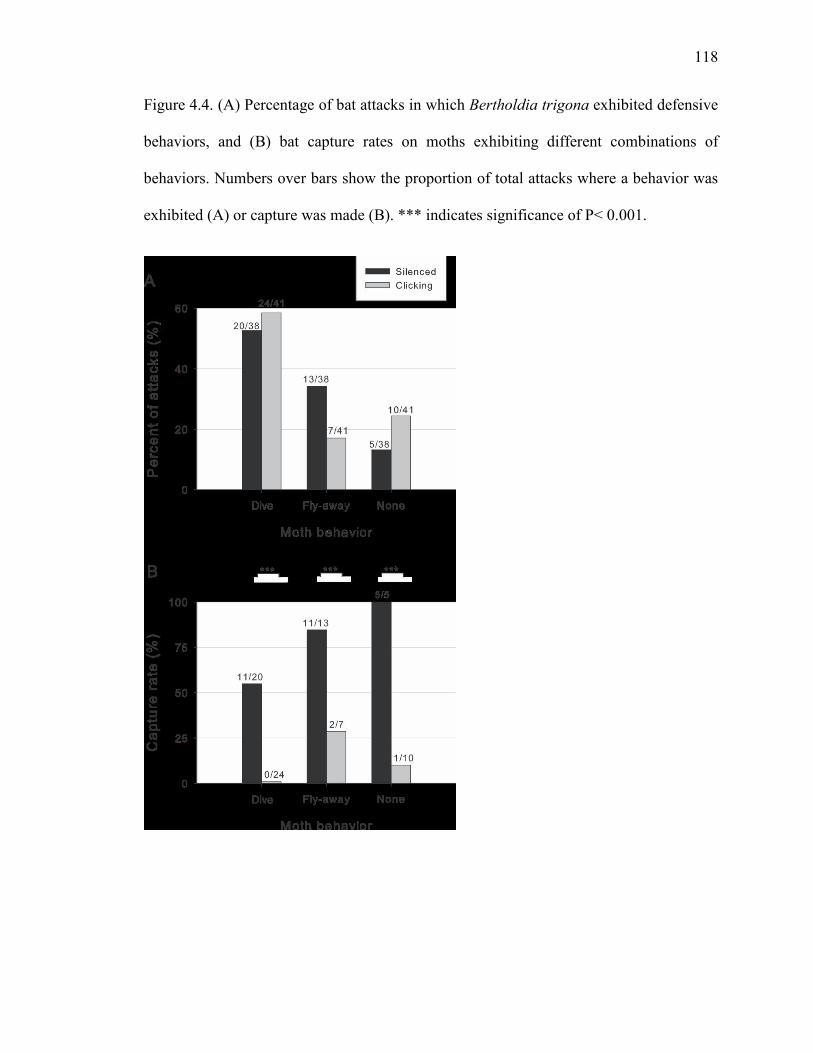
118
Figure 4.4. (A) Percentage of bat attacks in which Bertholdia trigona exhibited defensive
behaviors, and (B) bat capture rates on moths exhibiting different combinations of
behaviors. Numbers over bars show the proportion of total attacks where a behavior was
exhibited (A) or capture was made (B). *** indicates significance of P< 0.001.
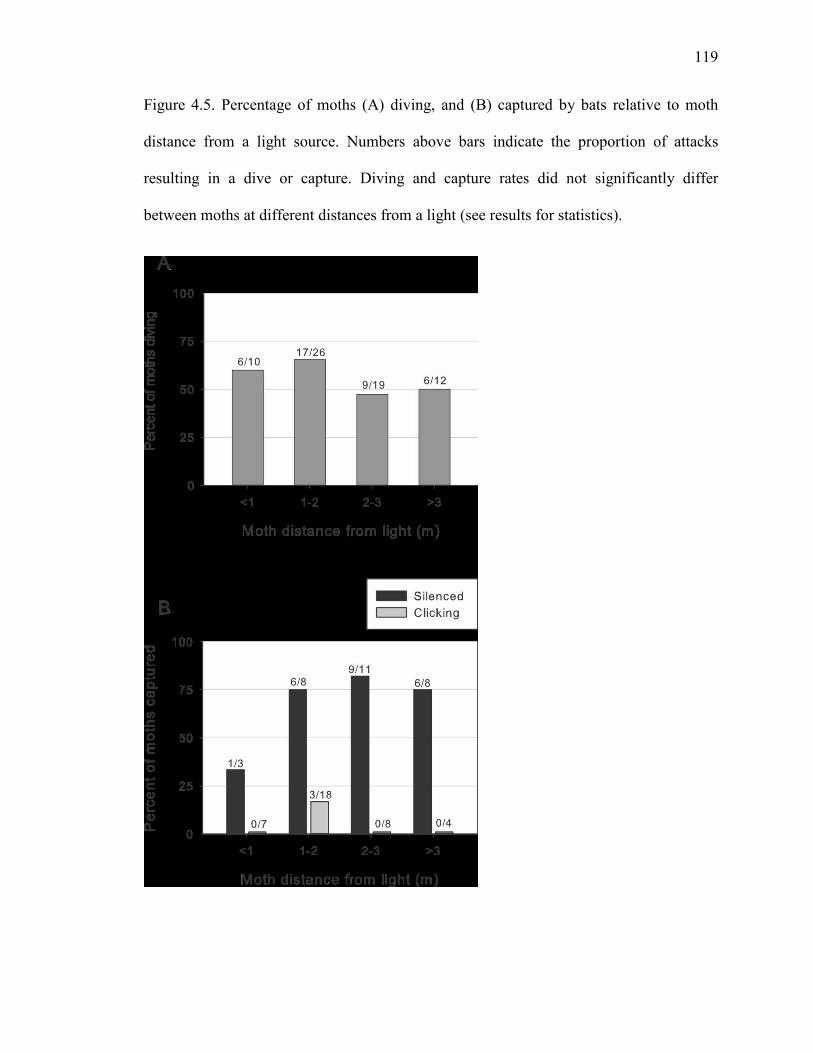
119
Figure 4.5. Percentage of moths (A) diving, and (B) captured by bats relative to moth
distance from a light source. Numbers above bars indicate the proportion of attacks
resulting in a dive or capture. Diving and capture rates did not significantly differ
between moths at different distances from a light (see results for statistics).
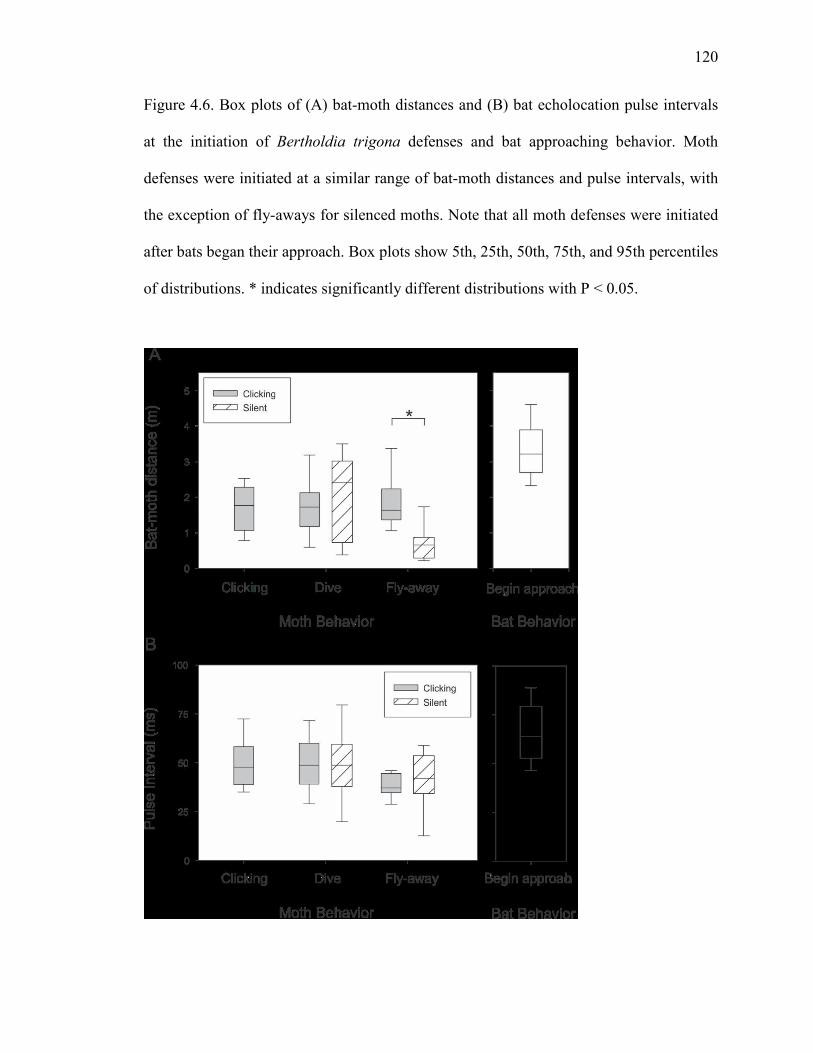
120
Figure 4.6. Box plots of (A) bat-moth distances and (B) bat echolocation pulse intervals
at the initiation of Bertholdia trigona defenses and bat approaching behavior. Moth
defenses were initiated at a similar range of bat-moth distances and pulse intervals, with
the exception of fly-aways for silenced moths. Note that all moth defenses were initiated
after bats began their approach. Box plots show 5th, 25th, 50th, 75th, and 95th percentiles
of distributions. * indicates significantly different distributions with P < 0.05.
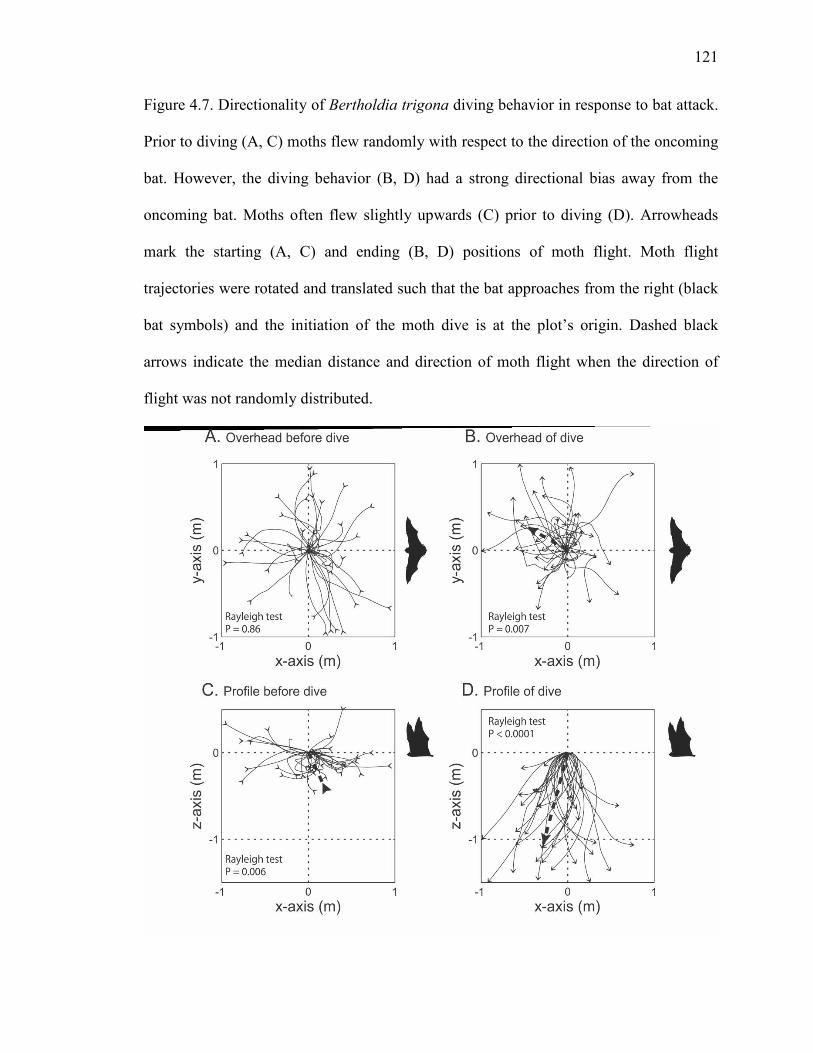
121
Figure 4.7. Directionality of Bertholdia trigona diving behavior in response to bat attack.
Prior to diving (A, C) moths flew randomly with respect to the direction of the oncoming
bat. However, the diving behavior (B, D) had a strong directional bias away from the
oncoming bat. Moths often flew slightly upwards (C) prior to diving (D). Arrowheads
mark the starting (A, C) and ending (B, D) positions of moth flight. Moth flight
trajectories were rotated and translated such that the bat approaches from the right (black
bat symbols) and the initiation of the moth dive is at the plot’s origin. Dashed black
arrows indicate the median distance and direction of moth flight when the direction of
flight was not randomly distributed.
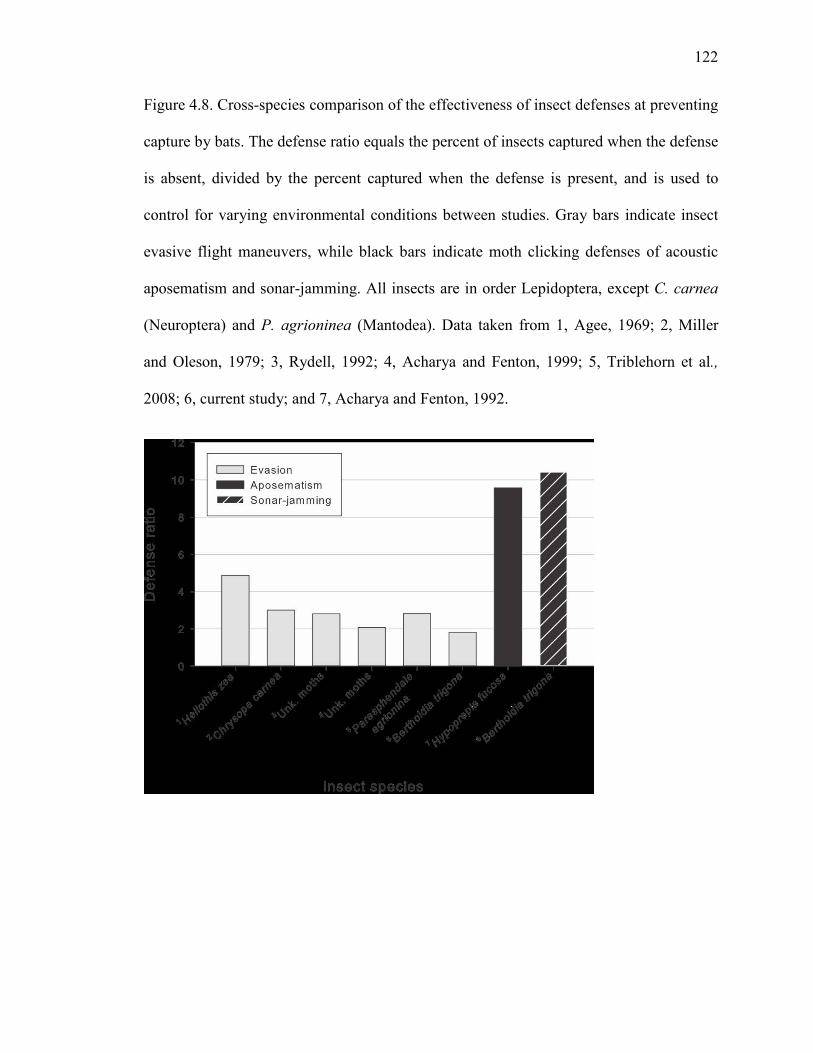
122
Figure 4.8. Cross-species comparison of the effectiveness of insect defenses at preventing
capture by bats. The defense ratio equals the percent of insects captured when the defense
is absent, divided by the percent captured when the defense is present, and is used to
control for varying environmental conditions between studies. Gray bars indicate insect
evasive flight maneuvers, while black bars indicate moth clicking defenses of acoustic
aposematism and sonar-jamming. All insects are in order Lepidoptera, except C. carnea
(Neuroptera) and P. agrioninea (Mantodea). Data taken from 1, Agee, 1969; 2, Miller
and Oleson, 1979; 3, Rydell, 1992; 4, Acharya and Fenton, 1999; 5, Triblehorn et al.,
2008; 6, current study; and 7, Acharya and Fenton, 1992.
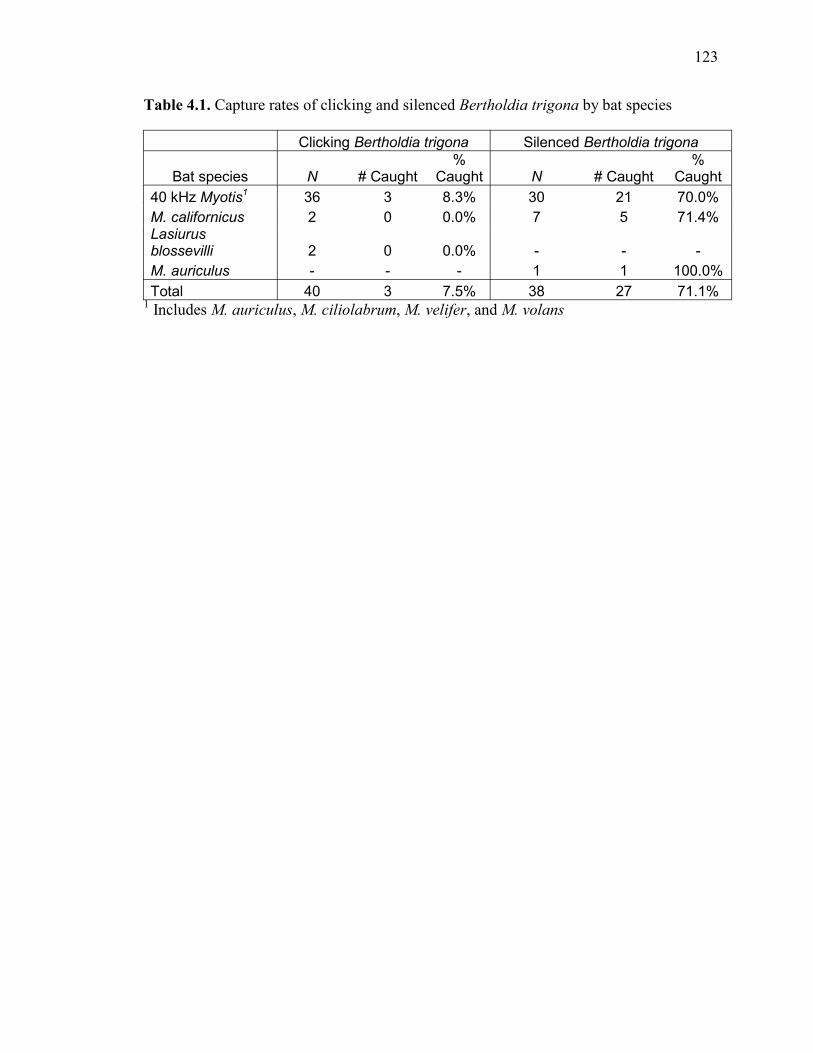
123
Table 4.1. Capture rates of clicking and silenced Bertholdia trigona by bat species
Clicking Bertholdia trigona Silenced Bertholdia trigona
Bat species N # Caught%
Caught N # Caught%
Caught40 kHz Myotis1 36 3 8.3% 30 21 70.0%M. californicus 2 0 0.0% 7 5 71.4%Lasiurus blossevilli 2 0 0.0% - - -M. auriculus - - - 1 1 100.0%Total 40 3 7.5% 38 27 71.1%
1 Includes M. auriculus, M. ciliolabrum, M. velifer, and M. volans
124
CHAPTER V
Optimal predator risk assessment by the sonar-jamming Arctiine moth Bertholdia trigona
Aaron J. Corcoran, Ryan D. Wagner, and W. E. Conner
The following manuscript has been submitted for publication to PLoS ONE. Stylistic
variations are due to requirements of the journal. A.J.C. designed and executed the
experiment experiments, conducted data analysis, and wrote the manuscript. R.D.W. also
designed and executed the experiments, assisted collecting and analyzing data and
provided editorial assistance. W.E.C. provided oversight and editorial assistance on the
project.
125
ABSTRACT
Nearly all animals face a tradeoff between seeking food and mates and avoiding
predation. Optimal escape theory holds that an animal confronted with a predator should
only flee when benefits of flight (increased survival) outweigh the costs (energetic, lost
foraging time, etc.). We propose a model for prey risk assessment based on the predator’s
stage of attack. Risk level should increase rapidly after the predator detects the prey and
commits to the attack. We tested this hypothesis using a predator – bats – whose active
sensory system of echolocation reveals its stage of attack. We used a prey defense –
clicking used for sonar jamming by the tiger moth Bertholdia trigona– that can be readily
studied in the field and laboratory and is enacted simultaneously with evasive flight. We
predicted that prey employ defenses soon after being detected, and that prey defensive
thresholds discriminate between legitimate and false predatory threats. Laboratory and
field experiments using playbacks of simulated bat calls and naturally behaving bats,
respectively, confirmed our predictions. Moths clicked soon after bats detected and
targeted them. Also, B. trigona clicking thresholds closely matched predicted optimal
thresholds for discriminating legitimate and false predator threats for bats using search
and approach phase echolocation – the period when bats are looking for and assessing
prey. This is the first study to correlate quantitatively the sensory stimuli that trigger
defensive behaviors with measurements of cues provided by predators during natural
attacks. We propose theoretical models for explaining prey risk assessment depending on
the availability of cues that reveal a predator’s stage of attack.

126
INTRODUCTION
Nearly all animals face a tradeoff between avoiding predation and seeking food
and mates. This problem is most acute when an animal detects a predator. What actions
will lead to maximum fitness? What defenses should be employed and when? These
questions are the subject of optimal escape theory, which holds that an animal must
balance the benefits of initiating a defense (i.e., the likelihood of increasing survival) with
the costs (e.g., expended time and energy) (Ydenberg and Dill, 1986; Cooper and
Frederick, 2007).
Studies on optimal escape theory typically examine the factors that influence how
close predators are allowed to approach before prey flee (flight initiation distance, FID).
A greater threat to survival should lead to a longer FID, while higher costs of fleeing
should decrease FID (Ydenberg and Dill, 1986; Stankowich and Blumstein, 2005;
Cooper and Frederick, 2007). The predictions of optimal escape theory have largely been
supported by empirical evidence (Lima and Dill, 1990; Stankowich and Blumstein, 2005),
with aspects from the prey (e.g. morphological and behavioral defenses, amount of
experience), predator (size, speed, approach trajectory) and environment (distance to
refuge) consistently modulating FID.
A critical component of escape theory is the prey’s ability to recognize the threat
level a predator presents, and to respond accordingly. Defensive responses are frequently
graded in intensity depending on the threat level that is perceived. This behavioral
response is termed “threat sensitivity” (Helfman, 1989). For example, prey frequently
assign higher risk to predators that approach faster and use a more direct approach
(Cooper, 1997; Stankowich and Coss, 2006). A few studies have tested whether prey use
127
other cues from the predator that could establish “intent”. At least two studies have found
that prey use predator gaze to indicate higher risk (Bateman and Fleming, 2011; Cooper
et al. 2012); however, others found no effect of gaze on FID (Helfman and Winkelman,
1997; Stankowich and Coss 2006).
With the amounting body of literature on optimal escape theory, efforts have
recently been made to find broad rules to explain the diversity of patterns examined
(Blumstein, 2010; Stankowich and Blumstein, 2005). Blumstein (2010) noted a trend
common to birds, mammals, lizards, and an invertebrate where FID is dependent on the
distance a predator begins its approach (start distance). These results suggest that the
predator’s approaching movement causes the prey to flee, a finding that was not
anticipated by early escape theory models (Blumstein, 2003). Blumstein suggested a
general rule that prey flee as soon as they detect a predator and identify it as a threat. He
argues that this minimizes the time prey spend devoting attention to a predator. However,
it was not specified how prey should determine whether a predator is a threat, and if this
rule holds, how it can be reconciled with our current understanding of optimal escape
theory (Ydenberg and Dill, 1986; Cooper and Frederick, 2007).
A successful predation sequence can be catalogued into a series of stages to aid in
description and analysis (Endler, 1986). A modified version of Endler’s (1986) predation
sequence is illustrated in Figure 5.1A. The sequence begins with a predator searching for
prey (search stage). After detection the predator will identify the prey and assess whether
it is worth pursuing (assessment stage). If the predator immediately recognizes a
profitable target, this stage will be rapid; however the predator may need to approach the
prey to gather more information. After the predator decides the prey is profitable the
128
pursuit stage begins. We hypothesize that predator threat markedly escalates during the
assessment stage until the predator commits to the attack (Figure 5.1B). At this time prey
defenses of crypsis have failed and unless an alternate defensive strategy is available (e.g.
aposematic signaling, startle), escape is the primary remaining option. We hypothesize
that prey risk assessment is driven by determining whether the predator has reached the
assessment stage and how close the predator is to committing to pursuit. If evidence
suggests the predator is near or at the pursuit stage, then the prey should flee, as there is
little benefit to waiting. At this point, the prey’s cost of attending to the predator is
increasing (Blumstein, 2010) and the likelihood of escape is decreasing. While this
hypothesis has been stated previously in various forms (Broom and Ruxton, 2005;
Cooper, 2005; Endler, 1986; Blumstein, 2010), it has not been tested using prey
responding to their naturally-behaving predators in a situation where the predator’s stage
of attack can be easily determined. Bats attacking insects provide just such an opportunity,
as the bat echolocation attack sequence reliably indicates their stage of attack (Figure
5.1C).
Bats search for insect prey by emitting echolocation (or sonar) pulses at a
relatively low rate of 7 – 12 calls per second (Holderied and von Helverson, 2003); this is
termed search phase echolocation. Upon detecting a prey echo, the bat gradually
increases the rate of emissions, beginning approach phase echolocation (figure 5.1C). The
increased emission rate allows rapid updating of the bat’s “acoustic image” of the
environment (Moss and Surlykke, 2001). During approach phase the bat localizes the
target, eventually locking its directional sonar-beam to within 3˚ of the prey item (Figure
5.2; Ghose and Moss, 2003). Late in the approach phase (a period sometimes referred to
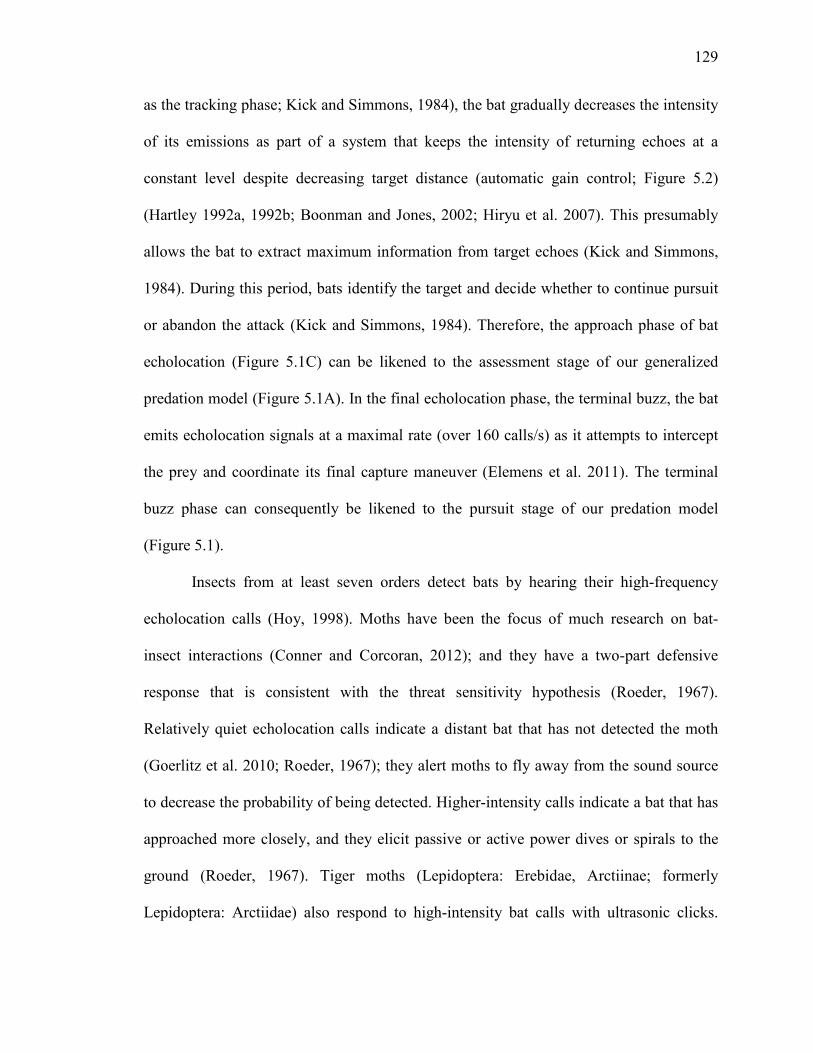
129
as the tracking phase; Kick and Simmons, 1984), the bat gradually decreases the intensity
of its emissions as part of a system that keeps the intensity of returning echoes at a
constant level despite decreasing target distance (automatic gain control; Figure 5.2)
(Hartley 1992a, 1992b; Boonman and Jones, 2002; Hiryu et al. 2007). This presumably
allows the bat to extract maximum information from target echoes (Kick and Simmons,
1984). During this period, bats identify the target and decide whether to continue pursuit
or abandon the attack (Kick and Simmons, 1984). Therefore, the approach phase of bat
echolocation (Figure 5.1C) can be likened to the assessment stage of our generalized
predation model (Figure 5.1A). In the final echolocation phase, the terminal buzz, the bat
emits echolocation signals at a maximal rate (over 160 calls/s) as it attempts to intercept
the prey and coordinate its final capture maneuver (Elemens et al. 2011). The terminal
buzz phase can consequently be likened to the pursuit stage of our predation model
(Figure 5.1).
Insects from at least seven orders detect bats by hearing their high-frequency
echolocation calls (Hoy, 1998). Moths have been the focus of much research on bat-
insect interactions (Conner and Corcoran, 2012); and they have a two-part defensive
response that is consistent with the threat sensitivity hypothesis (Roeder, 1967).
Relatively quiet echolocation calls indicate a distant bat that has not detected the moth
(Goerlitz et al. 2010; Roeder, 1967); they alert moths to fly away from the sound source
to decrease the probability of being detected. Higher-intensity calls indicate a bat that has
approached more closely, and they elicit passive or active power dives or spirals to the
ground (Roeder, 1967). Tiger moths (Lepidoptera: Erebidae, Arctiinae; formerly
Lepidoptera: Arctiidae) also respond to high-intensity bat calls with ultrasonic clicks.
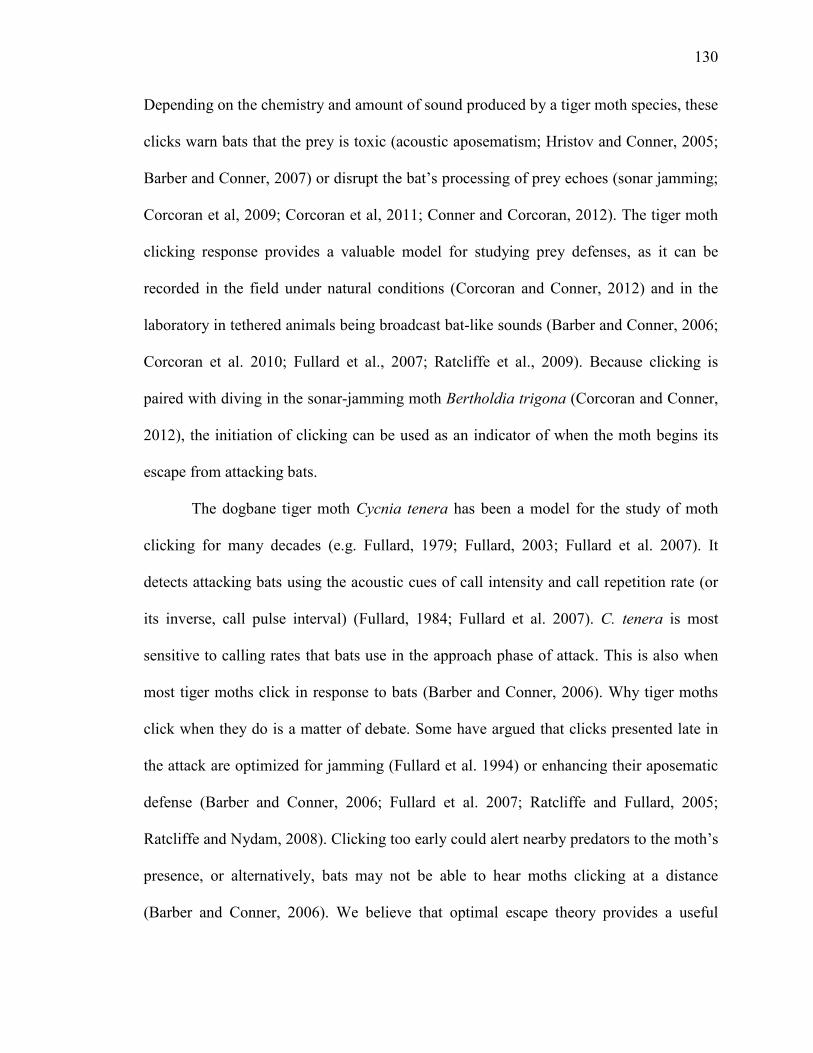
130
Depending on the chemistry and amount of sound produced by a tiger moth species, these
clicks warn bats that the prey is toxic (acoustic aposematism; Hristov and Conner, 2005;
Barber and Conner, 2007) or disrupt the bat’s processing of prey echoes (sonar jamming;
Corcoran et al, 2009; Corcoran et al, 2011; Conner and Corcoran, 2012). The tiger moth
clicking response provides a valuable model for studying prey defenses, as it can be
recorded in the field under natural conditions (Corcoran and Conner, 2012) and in the
laboratory in tethered animals being broadcast bat-like sounds (Barber and Conner, 2006;
Corcoran et al. 2010; Fullard et al., 2007; Ratcliffe et al., 2009). Because clicking is
paired with diving in the sonar-jamming moth Bertholdia trigona (Corcoran and Conner,
2012), the initiation of clicking can be used as an indicator of when the moth begins its
escape from attacking bats.
The dogbane tiger moth Cycnia tenera has been a model for the study of moth
clicking for many decades (e.g. Fullard, 1979; Fullard, 2003; Fullard et al. 2007). It
detects attacking bats using the acoustic cues of call intensity and call repetition rate (or
its inverse, call pulse interval) (Fullard, 1984; Fullard et al. 2007). C. tenera is most
sensitive to calling rates that bats use in the approach phase of attack. This is also when
most tiger moths click in response to bats (Barber and Conner, 2006). Why tiger moths
click when they do is a matter of debate. Some have argued that clicks presented late in
the attack are optimized for jamming (Fullard et al. 1994) or enhancing their aposematic
defense (Barber and Conner, 2006; Fullard et al. 2007; Ratcliffe and Fullard, 2005;
Ratcliffe and Nydam, 2008). Clicking too early could alert nearby predators to the moth’s
presence, or alternatively, bats may not be able to hear moths clicking at a distance
(Barber and Conner, 2006). We believe that optimal escape theory provides a useful
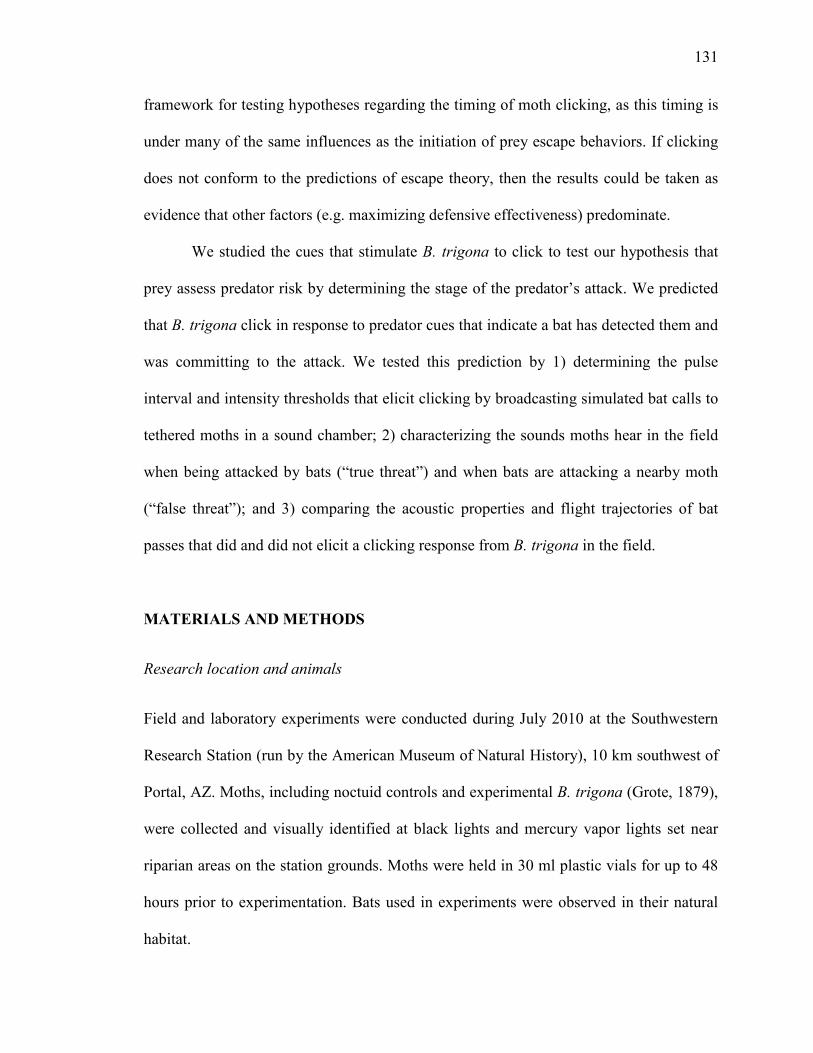
131
framework for testing hypotheses regarding the timing of moth clicking, as this timing is
under many of the same influences as the initiation of prey escape behaviors. If clicking
does not conform to the predictions of escape theory, then the results could be taken as
evidence that other factors (e.g. maximizing defensive effectiveness) predominate.
We studied the cues that stimulate B. trigona to click to test our hypothesis that
prey assess predator risk by determining the stage of the predator’s attack. We predicted
that B. trigona click in response to predator cues that indicate a bat has detected them and
was committing to the attack. We tested this prediction by 1) determining the pulse
interval and intensity thresholds that elicit clicking by broadcasting simulated bat calls to
tethered moths in a sound chamber; 2) characterizing the sounds moths hear in the field
when being attacked by bats (“true threat”) and when bats are attacking a nearby moth
(“false threat”); and 3) comparing the acoustic properties and flight trajectories of bat
passes that did and did not elicit a clicking response from B. trigona in the field.
MATERIALS AND METHODS
Research location and animals
Field and laboratory experiments were conducted during July 2010 at the Southwestern
Research Station (run by the American Museum of Natural History), 10 km southwest of
Portal, AZ. Moths, including noctuid controls and experimental B. trigona (Grote, 1879),
were collected and visually identified at black lights and mercury vapor lights set near
riparian areas on the station grounds. Moths were held in 30 ml plastic vials for up to 48
hours prior to experimentation. Bats used in experiments were observed in their natural
habitat.
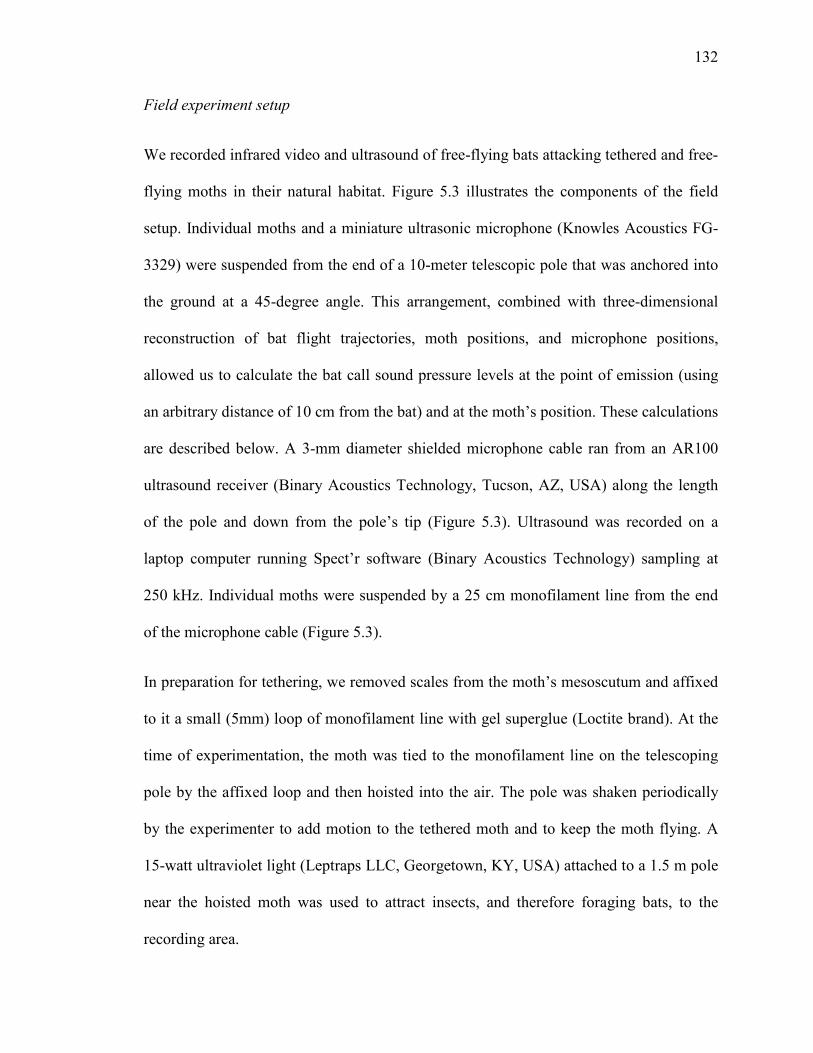
132
Field experiment setup
We recorded infrared video and ultrasound of free-flying bats attacking tethered and free-
flying moths in their natural habitat. Figure 5.3 illustrates the components of the field
setup. Individual moths and a miniature ultrasonic microphone (Knowles Acoustics FG-
3329) were suspended from the end of a 10-meter telescopic pole that was anchored into
the ground at a 45-degree angle. This arrangement, combined with three-dimensional
reconstruction of bat flight trajectories, moth positions, and microphone positions,
allowed us to calculate the bat call sound pressure levels at the point of emission (using
an arbitrary distance of 10 cm from the bat) and at the moth’s position. These calculations
are described below. A 3-mm diameter shielded microphone cable ran from an AR100
ultrasound receiver (Binary Acoustics Technology, Tucson, AZ, USA) along the length
of the pole and down from the pole’s tip (Figure 5.3). Ultrasound was recorded on a
laptop computer running Spect’r software (Binary Acoustics Technology) sampling at
250 kHz. Individual moths were suspended by a 25 cm monofilament line from the end
of the microphone cable (Figure 5.3).
In preparation for tethering, we removed scales from the moth’s mesoscutum and affixed
to it a small (5mm) loop of monofilament line with gel superglue (Loctite brand). At the
time of experimentation, the moth was tied to the monofilament line on the telescoping
pole by the affixed loop and then hoisted into the air. The pole was shaken periodically
by the experimenter to add motion to the tethered moth and to keep the moth flying. A
15-watt ultraviolet light (Leptraps LLC, Georgetown, KY, USA) attached to a 1.5 m pole
near the hoisted moth was used to attract insects, and therefore foraging bats, to the
recording area.
133
Field experiment overview
We conducted two field experiments where we characterized the bat sounds moths hear
in their natural environment. In experiment 1, using soundless noctuid control moths, the
bat sounds correlating to “real” threats were compared to the bat sounds correlating to
“false” threats. A real threat was characterized as an attack on the tethered noctuid moth;
a false threat was an attack on a neighboring, free-flying moth. In experiment 2, we
recorded bats flying near and sometimes approaching tethered B. trigona. We then
compared acoustic and flight parameters of bat passes that elicited a clicking response
with those that did not elicit a response.
Videography
Three infrared-sensitive Basler Scout cameras (model scA640-120gc; Ahrensburg,
Germany) recording at 60 frames-per-second at 640x480 resolution were placed around
the experimental area and focused on the tethered moth. Cameras were hard-wired to start
simultaneously by a signal sent from a custom Innovision Systems (Columbiaville, MI)
synchronization box, which was controlled by MaxTraq software (Innovision Sysetms)
running on a desktop computer. Infrared illumination was provided by 12 Wildlife
Engineering IR-Lamp6 lights (Tucson, AZ, USA), and two Bosch UFLED20-8BD
illuminators (Farmington Hills, MI, USA).
3-D calibration and reconstruction
Using the relative orientation method (Svoboda et al., 2005) in MaxTraq3D (“Dynamic
Wand Method”; Innovision Systems) and the video recordings by the three cameras, the
three-dimensional positions of bats, moths, and the microphone were reconstructed. This
134
approach has been used recently for studying bat-moth interactions in the field and is
explained in more detail elsewhere (Corcoran and Conner, 2012). The accuracy of our
reconstructions was tested by moving a “wand” (two spherical infrared markers fastened
to a rod at fixed distance from each other) throughout our calibrated volume and
comparing the known distance between the two markers to that measured using our 3-D
reconstructions. Over 1500 frames, we found a mean error of 0.4 cm for the two markers
set 145 cm apart (0.28 % error). Our calibration volume was approximately 6 m (width)
by 6 m (depth) by 4 m (height) or 144 m3.
Two infrared tape markers were placed at known positions on the microphone
cable in order to determine the microphone’s position and directional axis. The “center-
of-mass” of the bats, moths and two microphone markers were digitized from our video
using MaxTraq2D (Innovision Systems). These 2-D data were transformed into 3-D
coordinates using MaxTraq3D. The 3-D coordinates were then imported into Matlab
(Natick, MA, USA), where a custom program (BATracker.m, coded by B. Chadwell and
A. Corcoran) was used to fit a quintic smoothing spline to the 3-D data. This spline
function was used to generate bat flight vectors, bat-moth vectors, bat approach angles,
and other flight parameters (Barber et al. 2009; Corcoran et al. 2011; Corcoran et al.
2012).
Audio calibration
We used our audio recordings and 3-D reconstructions to determine the SPLs of bat calls
at the tethered moth’s position and 10 cm from the bat (dB peSPL re. 20 µPa). Bats emit
a highly directional call (Ghose and Moss, 2003). The estimated SPLs for bat emissions
135
represent that emitted in the moth’s direction. Early in the attack, until the bat has locked
its sonar beam on the target, the moth is typically off-axis from the bat’s sonar beam
emission (Figure 5.2; Ghose and Moss, 2003), and estimated emission SPLs are likely
less than the maximum emitted by the bat.
Bat call intensities were first determined at the position of the microphone using
several adjustment factors. The frequency response of the Knowles microphone was
determined by playing pure tone signals from an Avisoft ScanSpeak Ultrasonic speaker
(Avisoft Bioacoustics, Berlin, Germany) to the exact microphone, cable, and receiving
unit used in the experiments. Audio was recorded at the same position (50 cm directly in
front of the speaker) by our Knowles microphone and by a Brüel & Kjær ¼” microphone
(grid off) connected to a Brüel & Kjær Type 2610 measuring amplifier. Playbacks were
delivered at 5 kHz increments from 20 -100 kHz. These values provided a frequency-
specific conversion from recorded voltage to SPL. The frequency response was fairly flat
(± 1.5 dB) from 20 – 40 kHz, followed by decreased sensitivity of approximately 5 dB
per 10 kHz from 40-100 kHz. This response resulted partly from the long, thin
microphone cable which was important for our experimental design. For 20 kHz, 30 kHz,
40 kHz, 50 kHz, and 60 kHz (the range of potential peak frequencies used by bats in this
study) the directionality of the Knowles microphone was determined in 22.5˚ increments
from the microphone pointing directly at the speaker to directly away from the speaker.
The microphone was fairly omnidirectional with adjustments ranging from ± 2-4 dB
depending on frequency.
The estimated SPL of bat calls recorded by the microphone and the 3-D positions
of the bat, moth, and microphone were used to determine the SPL at the moth’s position
136
and 10cm from the bat. Attenuation due to spherical spreading and excess atmospheric
attenuation were accounted for using the temperature and humidity recorded at the
beginning of each session (Bazley, 1976). There may have been a difference in the
recorded SPL at the microphone’s position and the moth’s position due to the
directionality of the bat call. This was minimized by having the microphone as close to
the moth as possible while still allowing bats to interact naturally with the tethered prey.
To account for this we measured the angle between the bat-moth vector and the bat-
microphone vector throughout each attack. Bat call directionality depends on the phase of
attack, with search and approach phase calls having -6dB horizontal beam width of 80˚
(40˚ off axis in either direction) and buzz phase calls having a -6dB horizontal beam
width of 180˚ (90˚ off axis; Jakobsen and Surlykke, 2010). During search and approach
phase the angle measured between bat-moth vector and bat-microphone vector was 23.5
± 9.7˚ and for buzz phase the angle was 44.4± 17.3˚. To compensate for this, we added 3
dB to our calculations of bat call SPLs; ± 1-3 dB of error in our calculations cannot be
accounted for since the exact direction of bat calls was unknown.
In attack sequences in which the moths clicked, intensity was determined by
averaging the intensity of the two pulses preceding the response. Pulse interval was
measured as the distance from the start of one pulse to the start of the next. In attack
sequences in which the moth did not click intensity was measured as the average of the
most intense pulse, the pulse before, and the pulse after. Pulse interval was measured as
the average of the distance between these three pulses.
Laboratory experimental setup
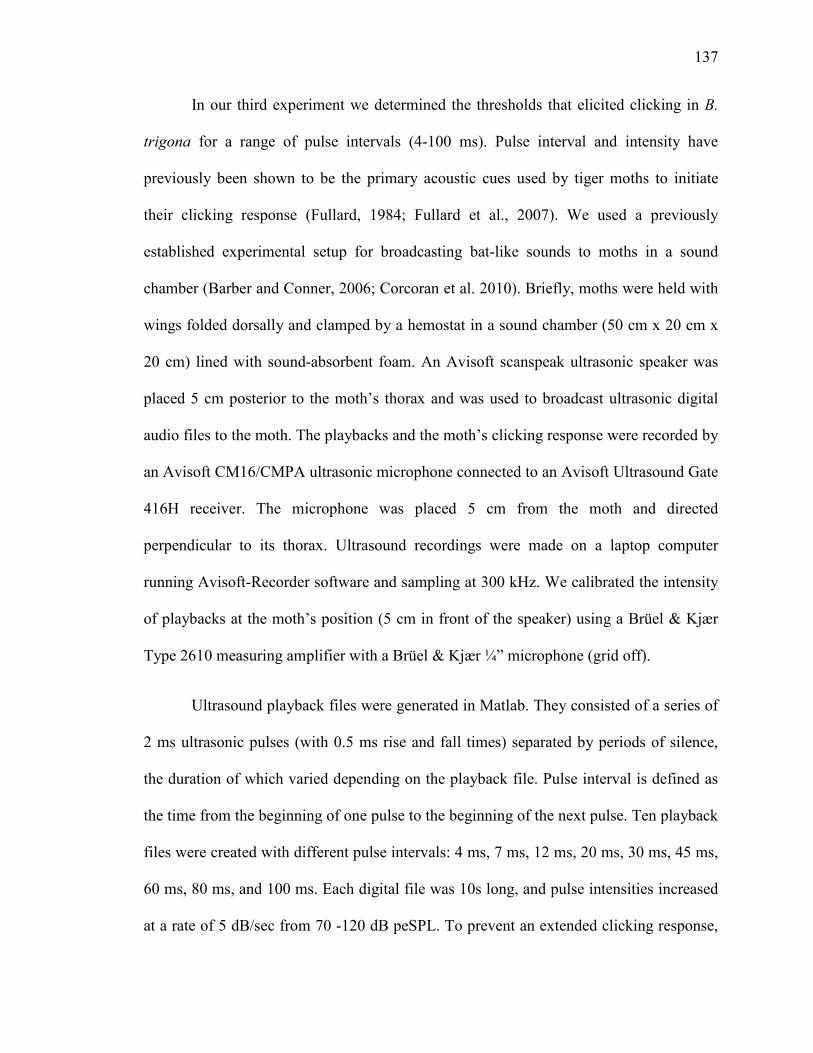
137
In our third experiment we determined the thresholds that elicited clicking in B.
trigona for a range of pulse intervals (4-100 ms). Pulse interval and intensity have
previously been shown to be the primary acoustic cues used by tiger moths to initiate
their clicking response (Fullard, 1984; Fullard et al., 2007). We used a previously
established experimental setup for broadcasting bat-like sounds to moths in a sound
chamber (Barber and Conner, 2006; Corcoran et al. 2010). Briefly, moths were held with
wings folded dorsally and clamped by a hemostat in a sound chamber (50 cm x 20 cm x
20 cm) lined with sound-absorbent foam. An Avisoft scanspeak ultrasonic speaker was
placed 5 cm posterior to the moth’s thorax and was used to broadcast ultrasonic digital
audio files to the moth. The playbacks and the moth’s clicking response were recorded by
an Avisoft CM16/CMPA ultrasonic microphone connected to an Avisoft Ultrasound Gate
416H receiver. The microphone was placed 5 cm from the moth and directed
perpendicular to its thorax. Ultrasound recordings were made on a laptop computer
running Avisoft-Recorder software and sampling at 300 kHz. We calibrated the intensity
of playbacks at the moth’s position (5 cm in front of the speaker) using a Brüel & Kjær
Type 2610 measuring amplifier with a Brüel & Kjær ¼” microphone (grid off).
Ultrasound playback files were generated in Matlab. They consisted of a series of
2 ms ultrasonic pulses (with 0.5 ms rise and fall times) separated by periods of silence,
the duration of which varied depending on the playback file. Pulse interval is defined as
the time from the beginning of one pulse to the beginning of the next pulse. Ten playback
files were created with different pulse intervals: 4 ms, 7 ms, 12 ms, 20 ms, 30 ms, 45 ms,
60 ms, 80 ms, and 100 ms. Each digital file was 10s long, and pulse intensities increased
at a rate of 5 dB/sec from 70 -120 dB peSPL. To prevent an extended clicking response,
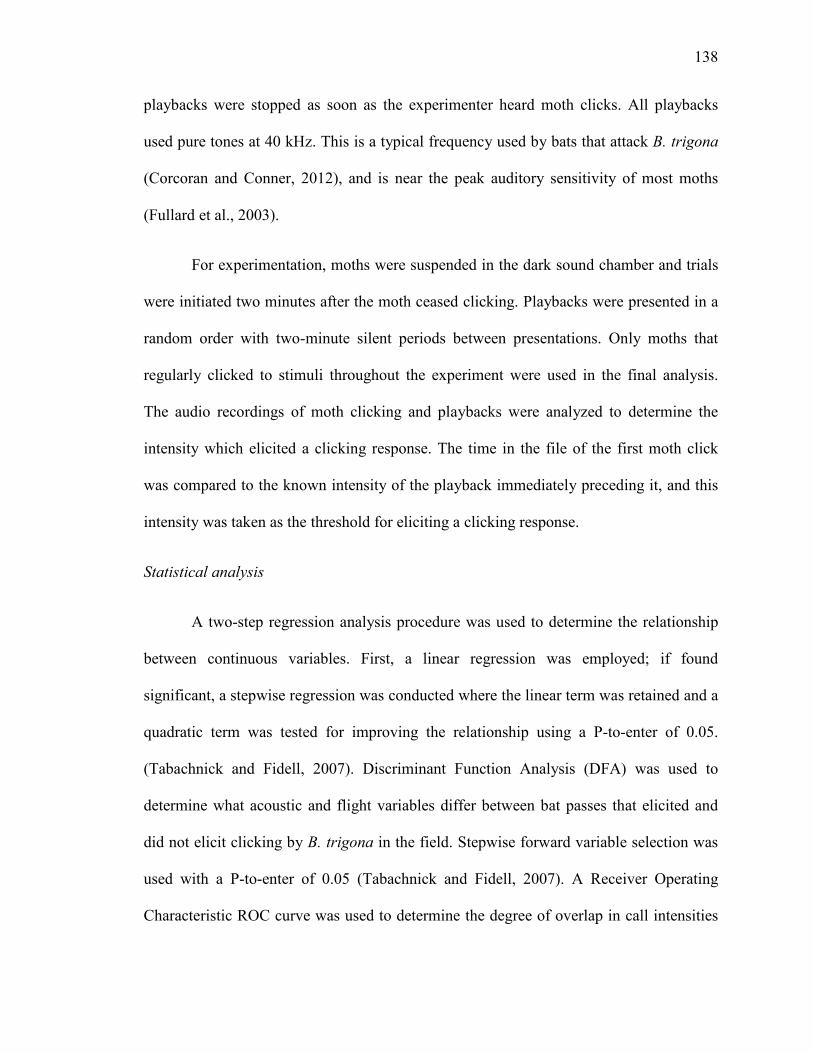
138
playbacks were stopped as soon as the experimenter heard moth clicks. All playbacks
used pure tones at 40 kHz. This is a typical frequency used by bats that attack B. trigona
(Corcoran and Conner, 2012), and is near the peak auditory sensitivity of most moths
(Fullard et al., 2003).
For experimentation, moths were suspended in the dark sound chamber and trials
were initiated two minutes after the moth ceased clicking. Playbacks were presented in a
random order with two-minute silent periods between presentations. Only moths that
regularly clicked to stimuli throughout the experiment were used in the final analysis.
The audio recordings of moth clicking and playbacks were analyzed to determine the
intensity which elicited a clicking response. The time in the file of the first moth click
was compared to the known intensity of the playback immediately preceding it, and this
intensity was taken as the threshold for eliciting a clicking response.
Statistical analysis
A two-step regression analysis procedure was used to determine the relationship
between continuous variables. First, a linear regression was employed; if found
significant, a stepwise regression was conducted where the linear term was retained and a
quadratic term was tested for improving the relationship using a P-to-enter of 0.05.
(Tabachnick and Fidell, 2007). Discriminant Function Analysis (DFA) was used to
determine what acoustic and flight variables differ between bat passes that elicited and
did not elicit clicking by B. trigona in the field. Stepwise forward variable selection was
used with a P-to-enter of 0.05 (Tabachnick and Fidell, 2007). A Receiver Operating
Characteristic ROC curve was used to determine the degree of overlap in call intensities
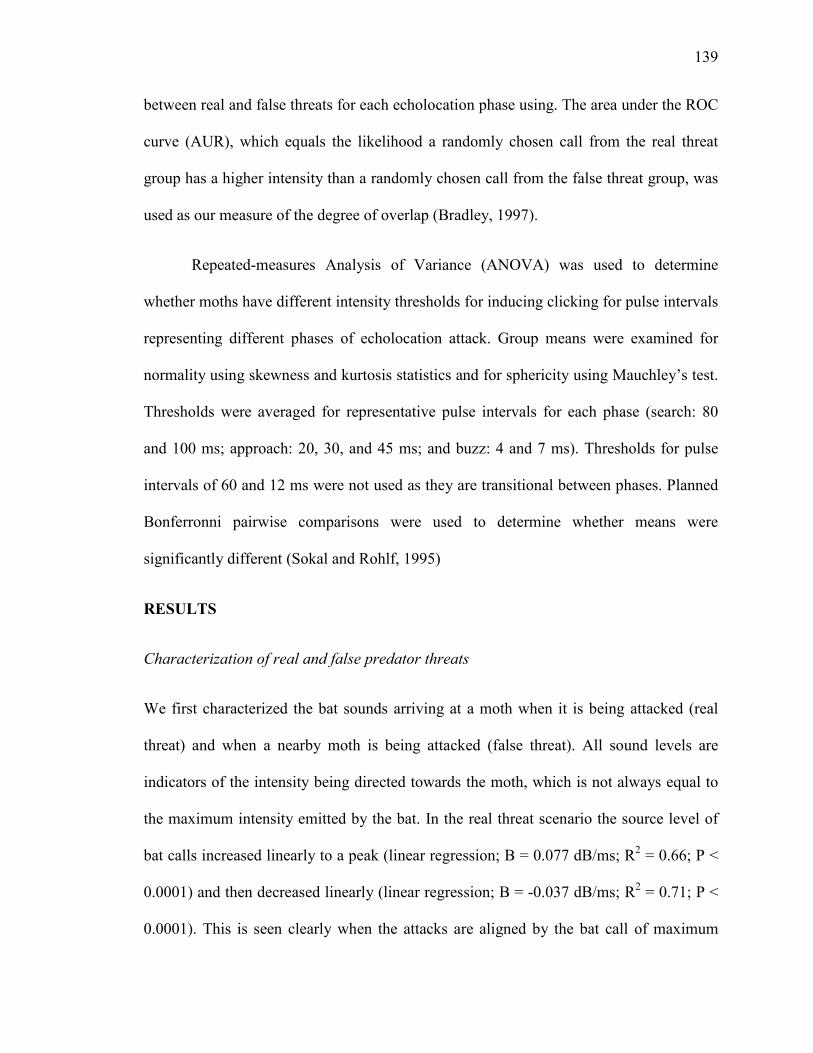
139
between real and false threats for each echolocation phase using. The area under the ROC
curve (AUR), which equals the likelihood a randomly chosen call from the real threat
group has a higher intensity than a randomly chosen call from the false threat group, was
used as our measure of the degree of overlap (Bradley, 1997).
Repeated-measures Analysis of Variance (ANOVA) was used to determine
whether moths have different intensity thresholds for inducing clicking for pulse intervals
representing different phases of echolocation attack. Group means were examined for
normality using skewness and kurtosis statistics and for sphericity using Mauchley’s test.
Thresholds were averaged for representative pulse intervals for each phase (search: 80
and 100 ms; approach: 20, 30, and 45 ms; and buzz: 4 and 7 ms). Thresholds for pulse
intervals of 60 and 12 ms were not used as they are transitional between phases. Planned
Bonferronni pairwise comparisons were used to determine whether means were
significantly different (Sokal and Rohlf, 1995)
RESULTS
Characterization of real and false predator threats
We first characterized the bat sounds arriving at a moth when it is being attacked (real
threat) and when a nearby moth is being attacked (false threat). All sound levels are
indicators of the intensity being directed towards the moth, which is not always equal to
the maximum intensity emitted by the bat. In the real threat scenario the source level of
bat calls increased linearly to a peak (linear regression; B = 0.077 dB/ms; R2 = 0.66; P <
0.0001) and then decreased linearly (linear regression; B = -0.037 dB/ms; R2 = 0.71; P <
0.0001). This is seen clearly when the attacks are aligned by the bat call of maximum
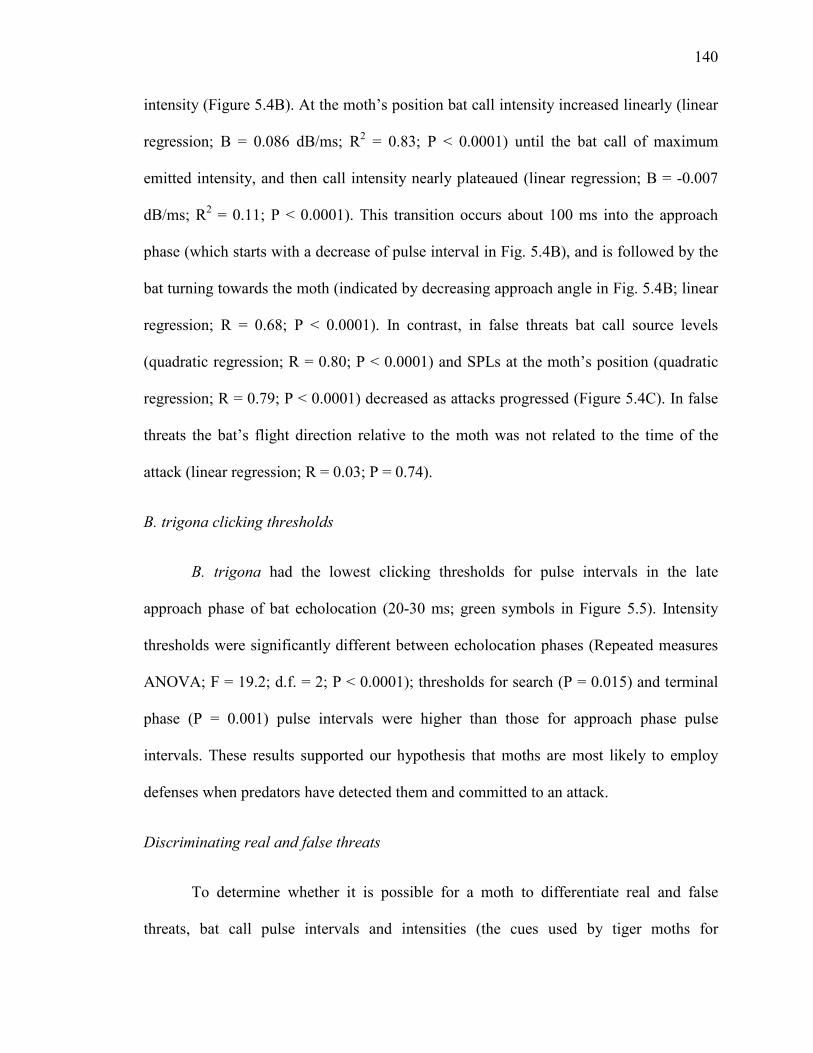
140
intensity (Figure 5.4B). At the moth’s position bat call intensity increased linearly (linear
regression; B = 0.086 dB/ms; R2 = 0.83; P < 0.0001) until the bat call of maximum
emitted intensity, and then call intensity nearly plateaued (linear regression; B = -0.007
dB/ms; R2 = 0.11; P < 0.0001). This transition occurs about 100 ms into the approach
phase (which starts with a decrease of pulse interval in Fig. 5.4B), and is followed by the
bat turning towards the moth (indicated by decreasing approach angle in Fig. 5.4B; linear
regression; R = 0.68; P < 0.0001). In contrast, in false threats bat call source levels
(quadratic regression; R = 0.80; P < 0.0001) and SPLs at the moth’s position (quadratic
regression; R = 0.79; P < 0.0001) decreased as attacks progressed (Figure 5.4C). In false
threats the bat’s flight direction relative to the moth was not related to the time of the
attack (linear regression; R = 0.03; P = 0.74).
B. trigona clicking thresholds
B. trigona had the lowest clicking thresholds for pulse intervals in the late
approach phase of bat echolocation (20-30 ms; green symbols in Figure 5.5). Intensity
thresholds were significantly different between echolocation phases (Repeated measures
ANOVA; F = 19.2; d.f. = 2; P < 0.0001); thresholds for search (P = 0.015) and terminal
phase (P = 0.001) pulse intervals were higher than those for approach phase pulse
intervals. These results supported our hypothesis that moths are most likely to employ
defenses when predators have detected them and committed to an attack.
Discriminating real and false threats
To determine whether it is possible for a moth to differentiate real and false
threats, bat call pulse intervals and intensities (the cues used by tiger moths for

141
identifying an attack) for five attacks on a focal soundless moth (real threat) and five
attacks on a nearby soundless moth (false threat) were plotted (Figure 5.5). We compared
the degree of overlap in call intensities between real and false threats for each
echolocation phase using the area under the ROC curve (AUR), which equals the
likelihood a randomly chosen call from the real threat group has a higher intensity than a
randomly chosen call from the false threat group. Search phase calls had a moderate
degree of overlap between the two conditions (AUR = 0.72; P =0.009); however,
approach (AUR = 0.97; P < 0.0001) and terminal phase calls (AUR = 0.997; P < 0.0001)
had a large degree of separation. Using quadratic discriminant analysis we determined the
optimal thresholds for discriminating real and false threats with 50% (p=0.5) and 75%
(p=0.75) likelihoods of the threat being real. Measured B. trigona clicking thresholds
matched predicted p=0.75 thresholds for pulse intervals of 35-100 ms, but not for pulse
intervals at or below 20 ms (Figure 5.5). Pulse intervals in the terminal buzz
demonstrated the worst fit. These results support the hypothesis that B. trigona clicking
thresholds are optimized for differentiating predator threat levels for bats in search phase
and most of approach phase, but not for bats in buzz phase echolocation.
Clicking responses of tethered moths in the field
Using tethered B. trigona in the vicinity of free-flying bats, we determined how
well two groups of characteristics – bat call properties and bat flight trajectories – could
discriminate interactions where moths did or did not click. Bat call intensity at the moth’s
position was significant in predicting whether or not moths clicked for all three moths
tested (DFA; P < 0.0001); pulse interval was a significant discriminating variable for two
of three moths tested (DFA; P < 0.0001), with shorter pulse intervals (higher repetition
142
rates) being more likely to elicit a clicking response (Figure 5.6). Moths typically clicked
in response to bats in early to middle approach-phase (25-60 ms pulse intervals). Moth 3
also responded to moths in late search-phase (60-70 ms pulse intervals). Moth clicking
was preceded by bat calls that increased in intensity and slightly decreased in pulse
interval (bottom two rows of graphs in Figure 5.6), both indications that the moth had
recently been detected and targeted by the bat.
For interactions where bats flew through the calibrated volume, bat distance (DFA;
P < 0.01), but not approach angle (P > 0.1), significantly discriminated between clicking
and non-clicking cases for moths 1 and 2 (Figure 5.6). Neither variable was significant
for moth 3 (DFA; P > 0.1). All bat passes outside of the calibrated volume (which had a
minimum distance of 4 m from the moth) failed to elicit a clicking response. Because a
threshold could not be determined for moth 3 using only passes occurring with the
calibrated volume, we conducted an ROC analysis on bat distance using interactions in
and out of the calibrated volume. This analysis found a statistically significant threshold
(Figure 5.6, moth 3; P < 0.001). Moths 1 and 2 had similar bat distance clicking
thresholds, which were about 1.5 m less than the threshold for moth 3. Acoustic
characteristics were slightly better at predicting whether moths clicked than bat flight
characteristics. Acoustic characteristics correctly predicted an average of 98% of
interactions where moths clicked (positive predictive value; PPV) and 93% of
interactions where moths did not click (negative predictive value; NPV). Flight
characteristics had an average PPV of 90% and an average NPV of 80%. This indicates
that there were several cases where a bat’s flight trajectory could not explain the moth
clicking response, but bat acoustic characteristics could.
143
DISCUSSION
Using a combination of field and laboratory experiments we tested the hypothesis
that moths initiate defensive clicking in response to acoustic characteristics that reveal
they have been detected and targeted by a bat. To determine if this is the case we first
characterized the acoustic cues available to a moth under attack (Figure 5.4). Bats
typically detect insects from their periphery, and then direct their beam towards the target
as they decrease their pulse intervals (Figure 5.2; Ghose and Moss, 2003). To the moth
this is perceived as a rapid increase in intensity and a small decrease in pulse interval
(time -200 ms to 0 ms in Figure 5.4B). These are the earliest cues available to a moth that
it has been detected and targeted, and these cues appear to trigger moth clicking (Figure
5.4).
Another way to analyze the timing of moth clicking is by comparing the pulse
intervals and intensities of real and false threats (Figure 5.5). Intensities of search phase
calls are ill suited for discriminating predator threat levels, whereas approach and buzz
phase calls of real and false threats are easily distinguished. Therefore, early approach
phase (30-60 ms pulse intervals) is the first time moths could distinguish real and false
threats, and this is when tethered (Figure 5.6) and free-flying moths (Corcoran and
Conner, 2012) click in response to naturally foraging bats.
Finally, we found that moth clicking thresholds closely matched predicted optimal
thresholds for discriminating real and false threats for search and most of approach phase
echolocation (Figure 5.5).This is when it is most important for a moth to determine
whether it is under attack. After this point, in the terminal buzz, it may be too late for
144
clicking to be effective (Corcoran et al., 2010). Moths may also have difficulty accurately
encoding buzz phase echolocation in nervous signals (Fullard et al. 2003), and moths
may not be able to discriminate buzz phase echolocation from insect stridulations
(Fullard et al. 2007), however this has not been tested empirically. Together, these data
support the hypothesis that moth clicking thresholds have been shaped by natural
selection to discriminate between legitimate and false predatory threats. Moths appear to
initiate clicking at the earliest time when they can determine that they have been detected
and targeted by an echolocating bat. At least for sonar-jamming, it is not necessary to
include other explanations for the timing of moth clicking, for example that moths click
at a time to maximize the defense’s effectiveness (Fullard et al. 1994; Barber and Conner,
2006).
How do these results contribute to our understanding of optimal escape theory?
We hypothesized that prey assess predator risk based on where the predator is in its
attack sequence, with risk increasing after detection and as the predator commits to an
attack (Figure 5.1). Our results support this hypothesis, as moths reliably began their
jamming defense in response to cues that indicated they had recently been detected and
targeted. This happened when bats were at distances of 1-3 m (Figure 5.6), just inside the
range where bats detect moths (2.2-4.5 m) (Corcoran and Conner, 2012). Moths did not
click in response to several bats that flew within the distance expected to excite a
response (Figure 5.6). Because acoustic features of bat calls explained whether a moth
clicked in about 95% of interactions, it appears that these bats did not direct their sonar
beams at the moths, and the moths correctly ignored a false threat.
145
Growing evidence suggests that prey dynamically respond to predator behaviors
that indicate the predator’s stage of attack. Birds, mammals, lizards and invertebrates
often appear to wait a fixed amount of time after a predator begins approaching to begin
flight, regardless of the predator’s distance (Blumstein, 2003, 2010, Blumstein et al. 2005;
Cooper, 2005; Cooper, 2009; Stankowich and Coss, 2006). This response is more
common when predators move rapidly, supporting the idea that prey perceive these
movements as a directed attack (Cooper, 2005, 2009). Prey also flee from predators
(usually humans) at greater distances when they approach more directly (Cooper, 1997a;
Stankowich and Coss, 2006) turn towards prey (Cooper, 1997b, 1998), move faster
(Cooper, 2006; Stankowich and Coss, 2006 ), or approach while gazing at the prey
(Bateman and Fleming, 2011; Cooper, 2012). However, these finding are not universal.
For example, deer do not appear to respond to predator gaze or the presence of a gun
(Stankowich and Coss, 2006) and lizards do not flee from an approaching distant predator
if it moves slowly (Cooper, 2005, 2009). Different prey, therefore, use different predator
cues to assess risk. This may be a result of differing sensory capabilities, predators that
provide different cues in their approach, and differing environmental conditions (Caro,
2005). Further comparative work is needed, especially with studies of naturally behaving
predators and prey where predator cues, and prey responses to them, can be measured.
Bats and moths provide a useful system for testing the hypothesis that prey
determine predator risk based on the predator’s stage of attack because bats inadvertently
advertise when they have detected the prey and are committing to an attack. For many
predator-prey systems this is unlikely to be the case, and there may be selective pressure
for predators to conceal their stage of attack. For example, some bats use “stealth
146
echolocation” – that is, they purposefully echolocate quietly to prevent moths and other
eared insects from knowing they are under attack (Goerlitz et al. 2010). Depending on the
animals involved and environmental conditions, prey will have differing levels of
information about a predator’s stage of attack.
We propose that a prey’s ability to perceive cues that reveal the predator’s stage
of attack alters the shape of the predator risk assessment curve (Figure 5.7). Predator risk
(which equals to the benefit of fleeing) is typically presented as a linear (Cooper and
Frederick, 2007) or quadratic (Ydenberg and Dill, 1986) function of predator distance,
with risk increasing as the predator approaches. The cost of prey fleeing is assumed to
increase with predator distance (Figure 5.7A; Ydenberg and Dill, 1986; Stankowich and
Blumstein, 2005; Cooper and Frederick, 2007). The intercepts and slopes of these
functions can change depending on factors relating to the prey, predator, and environment
(Stankowich and Blumstein, 2005).These factors shift the intersection of the two
functions, and therefore the distance where it is optimal for prey to flee (D*). We argue
that this model holds for prey that have little or no information about predator attack
stage. For prey that have near complete information on predator attack stage (such as in
the current study), we propose that the predator risk function is sigmoidal and risk
increases rapidly in the predator’s assessment stage (Figure 5.1). The predator’s distance
where it detects and assesses prey would differ between interactions, and therefore the
predicted FID would vary depending on the predator’s detection/assessment distance.
The sigmoidal shape of the risk function reduces the effect that prey flight costs have on
the optimal FID (Figure 5.7C). A prey’s cost of fleeing is rarely if ever greater than the
threat posed by a lethal predator intent on capturing it. There may also be cases where
147
prey have partial information on predator attack stage. In this case we suggest that the
predator risk function would be a mixture of the linear and sigmoidal functions relating to
predator distance and attack stage, respectively (Figure 5.7B). This function may also
relate to situations where prey have information on predator attack stage but are at a
disadvantage if they are discovered at close range. This mixed model is similar to a
model where risk shifts from a lower to a higher risk functions when prey recognize a
change in predator behavior (Cooper, 2009).
The proposed model offers a theoretical explanation for the previous assertion
that prey should flee as soon as they detect a predator and determine it is a threat
(Blumstein, 2010). When prey can easily determine a predator’s attack stage (such as
with moths and bats), that factor overwhelms decision making. Prey costs and predator
distance become less important. When it is unknown whether a predator is attacking, prey
must use indicators like predator distance and approach speed to estimate the likelihood
of attack. In this case risk level may rise more slowly as the predator approaches, and
prey costs will have a greater effect on FID.
In summary, we have provided some of the first quantitative evidence linking
prey defensive thresholds with cues measured from natural predatory attacks. B. trigona
use relatively simple rules for determining when to initiate clicking based on two acoustic
parameters: pulse interval and intensity. These rules, which are encoded in the moth’s
nervous system (see discussion in Fullard et al. 2007), allow moths to respond rapidly
soon after being targeted by echolocating bats. They also allow moths to discriminate
between legitimate and false predatory threats with remarkable accuracy. This ability is
facilitated by a predator who nearly continuously advertises its stage of attack through

148
echolocation. This finding demonstrates that economic considerations determine the time
at which B. trigona exhibits its combined jamming-and-diving defense, despite the
possibility that other factors such as timing the defense for maximum effect (e.g. Fullard
et al. 1994), may be providing conflicting selective forces.
149
REFERENCES
1. Barber JR, Conner WE (2006) Tiger moth responses to a simulated bat attack: timing
and duty cycle. Journal of Experimental Biology 209: 2637-2650.
2. Barber JR, Chadwell BA, Garrett N, Schmidt-French B, Conner WE (2009) Naïve bats
discriminate arctiid moth warning sounds but generalize their aposematic
meaning. Journal of Experimental Biology 212: 2141-2148.
3. Barber JR, Conner WE (2007) Acoustic mimicry in a predator–prey interaction.
Proceedings of the National Academy of Sciences 104: 9331.
4. Bateman P, Fleming P (2011) Who are you looking at? Hadeda ibises use direction of
gaze, head orientation and approach speed in their risk assessment of a potential
predator. Journal of Zoology 285: 316-323.
5. Bazley E (1976) Sound absorption in air at frequencies up to 100 kHz. National
Physics Laboratory Acoustics Report no. AC74.
6. Blumstein DT (2003) Flight-initiation distance in birds is dependent on intruder
starting distance. The Journal of Wildlife Management 67: 852-857.
7. Blumstein DT (2010) Flush early and avoid the rush: a general rule of antipredator
behavior? Behavioral Ecology 21: 440-442.
8. Blumstein DT, Fernandex‐Juricic E, Zollner PA, Garity SC (2005) Inter‐specific
variation in avian responses to human disturbance. Journal of Applied Ecology 42:
943-953.
9. Boonman A, Jones G (2002) Intensity control during target approach in echolocating
bats; stereotypical sensori-motor behaviour in Daubenton's bats, Myotis
daubentonii. Journal of Experimental Biology 205: 2865-2874.
150
10. Broom M, Ruxton GD (2005) You can run—or you can hide: optimal strategies for
cryptic prey against pursuit predators. Behavioral Ecology 16: 534-540.
11. Caro T (2005) Antipredator defenses in birds and mammals: University of Chicago
Press.
12. Conner WE , Corcoran AJ (2012) Sound Strategies: The 65 million-year-old battle
between bats and insects. Annual Review of Entomology 57: 21-39.
13. Cooper WE Jr (1997) Factors affecting risk and cost of escape by the broad-headed
skink (Eumeces laticeps): predator speed, directness of approach, and female
presence. Herpetologica 53: 464-474.
14. Cooper WE Jr (1997) Threat factors affecting antipredatory behavior in the broad-
headed skink (Eumeces laticeps): repeated approach, change in predator path, and
predator's field of view. Copeia 1997: 613-619.
15. Cooper WE Jr (2005) When and how do predator starting distances affect flight
initiation distances? Canadian Journal of Zoology 83: 1045-1050.
16. Cooper WE Jr (2006) Dynamic risk assessment: prey rapidly adjust flight initiation
distance to changes in predator approach speed. Ethology 112: 858-864.
17. Cooper WE Jr (2009) Optimal escape theory predicts escape behaviors beyond flight
initiation distance: risk assessment and escape by striped plateau lizards
Sceloporus virgatus. Curr Zool 55: 123-131.
18. Cooper WE Jr, Frederick WG (2007) Optimal flight initiation distance. Journal of
Theoretical Biology 244: 59-67.
19. Cooper WE Jr, López P, Martín J, Pérez-Mellado V (2012) Latency to flee from an
immobile predator: effects of predation risk and cost of immobility for the prey.
151
Behavioral Ecology 23: 790-797.
20. Corcoran AJ, Barber JR, Conner WE (2009) Tiger moth jams bat sonar. Science 325:
325-327.
21. Corcoran AJ, Barber JR, Hristov NI, Conner WE (2011) How do tiger moths jam bat
sonar? The Journal of Experimental Biology 214: 2416-2425.
22. Corcoran AJ, Conner WE (2012) Sonar jamming in the field: effectiveness and
behavior of a unique prey defense. Journal of experimental biology. In press
23. Corcoran AJ, Conner WE, Barber JR (2010) Anti-bat tiger moth sounds: Form and
function. Current Zoology 56: 358-369.
24. Elemans CPH, Mead AF, Jakobsen L, Ratcliffe JM (2011) Superfast muscles set
maximum call rate in echolocating bats. Science 333: 1885-1888.
25. Endler J (1986) Defense against predators. In Feder EM, Lauder GV editors.
Predator-prey relationships: perspectives and approaches from the study of lower
vertebrates. Chicago: University of Chicago Press. pp. 169-202.
26. Fullard JH (1979) Behavioral analyses of auditory sensitivity in Cycnia tenera
Hübner (Lepidoptera: Arctiidae). Journal of Comparative Physiology A:
Neuroethology, Sensory, Neural, and Behavioral Physiology 129: 79-83.
27. Fullard JH (1984) Listening for bats: pulse repetition rate as a cue for a defensive
behavior in Cycnia tenera (Lepidoptera: Arctiidae). Journal of Comparative
Physiology A: Neuroethology, Sensory, Neural, and Behavioral Physiology 154:
249-252.
28. Fullard JH, Dawson JW, Jacobs DS (2003) Auditory encoding during the last moment
of a moth's life. Journal of Experimental Biology 206: 281-294.
152
29. Fullard JH, Ratcliffe JM, Ter Hofstede H (2007) Neural evolution in the bat-free
habitat of Tahiti: partial regression in an anti-predator auditory system. Biology
Letters 3: 26-28.
30. Fullard JH, Simmons JA, Saillant PA (1994) Jamming bat echolocation: the dogbane
tiger moth Cycnia tenera times its clicks to the terminal attack calls of the big
brown bat Eptesicus fuscus. Journal of Experimental Biology 194: 285-298.
31. Ghose K, Horiuchi TK, Krishnaprasad P, Moss CF (2006) Echolocating bats use a
nearly time-optimal strategy to intercept prey. PLoS Biology 4: e108.
32. Ghose K, Moss CF (2003) The sonar beam pattern of a flying bat as it tracks tethered
insects. The Journal of the Acoustical Society of America 114: 1120-1131.
33. Ghose K, Moss CF (2006) Steering by hearing: a bat’s acoustic gaze is linked to its
flight motor output by a delayed, adaptive linear law. The Journal of neuroscience
26: 1704-1710.
34. Goerlitz HR, Ter Hofstede HM, Zeale MRK, Jones G, Holderied MW (2010) An
aerial-hawking bat uses stealth echolocation to counter moth hearing. Current
Biology 20: 1568-1572.
35. Hartley DJ (1992a) Stabilization of perceived echo amplitudes in echolocating bats. I.
Echo detection and automatic gain control in the big brown bat, Eptesicus fuscus,
and the fishing bat, Noctilio leporinus. The Journal of the Acoustical Society of
America 91: 1120-1132.
36. Hartley DJ (1992b) Stabilization of perceived echo amplitudes in echolocating bats. II.
The acoustic behavior of the big brown bat, Eptesicus fuscus, when tracking
moving prey. The Journal of the Acoustical Society of America 91: 1133-1149.
153
37. Helfman GS (1989) Threat-sensitive predator avoidance in damselfish-trumpetfish
interactions. Behavioral Ecology and Sociobiology 24: 47-58.
38. Helfman GS, Winkelman DL (1997) Threat sensitivity in bicolor damselfish: effects
of sociality and body size. Ethology 103: 369-383.
39. Hiryu S, Hagino T, Riquimaroux H, Watanabe Y (2007) Echo-intensity compensation
in echolocating bats (Pipistrellus abramus) during flight measured by a telemetry
microphone. The Journal of the Acoustical Society of America 121: 1749-1757.
40. Holderied MW, Von Helversen O (2003) Echolocation range and wingbeat period
match in aerial-hawking bats. Proceedings of the Royal Society of London Series
B: Biological Sciences 270: 2293-2299.
41. Hoy RR (1998) Acute as a bug’s ear: an informal discussion of hearing in insects. In:
Hoy RR, Popper AN and Fay RR, editors. Comparative hearing: insects. New
York: Spring pp.1-17.
42. Hristov NI, Conner WE (2005) Sound strategy: acoustic aposematism in the bat–tiger
moth arms race. Naturwissenschaften 92: 164-169.
43. Jakobsen L, Surlykke A (2010) Vespertilionid bats control the width of their biosonar
sound beam dynamically during prey pursuit. Proceedings of the National
Academy of Sciences 107: 13930-13935.
44. Kick SA, Simmons JA (1984) Automatic gain control in the bat's sonar receiver and
the neuroethology of echolocation. The Journal of Neuroscience 4: 2725-2737.
45. Lima SL, Dill LM (1990) Behavioral decisions made under the risk of predation: a
review and prospectus. Canadian Journal of Zoology 68: 619-640.
46. Moss CF, Surlykke A (2001) Auditory scene analysis by echolocation in bats. The
154
Journal of the Acoustical Society of America 110: 2207-2226.
47. Ratcliffe JM, Fullard JH (2005) The adaptive function of tiger moth clicks against
echolocating bats: an experimental and synthetic approach. Journal of
Experimental Biology 208: 4689-4698.
48. Ratcliffe JM, Fullard JH, Arthur BJ, Hoy RR (2009) Tiger moths and the threat of
bats: decision-making based on the activity of a single sensory neuron. Biology
Letters 5: 368-371.
49. Ratcliffe JM, Nydam ML (2008) Multimodal warning signals for a multiple predator
world. Nature 455: 96-99.
50. Roeder KD (1967) Nerve cells and insect behavior. Cambridge MA: Harvard Univ.
Pres. 229 p.
51. Stankowich T, Blumstein DT (2005) Fear in animals: a meta-analysis and review of
risk assessment. Proceedings of the Royal Society B: Biological Sciences 272:
2627-2634.
52. Stankowich T, Coss RG (2006) Effects of predator behavior and proximity on risk
assessment by Columbian black-tailed deer. Behavioral Ecology 17: 246-254.
53. Svoboda T, Martinec D, Pajdla T (2005) A convenient multicamera self-calibration
for virtual environments. Presence: Teleoperators & Virtual Environments 14:
407-422.
54. Tabachnick BG, Fidell LS (2007) Using multivariate statistics. Boston: Pearson. 1008
p.
55. Yager DD (2012) Predator detection and evasion by flying insects. Current Opinion
in Neurobiology 22: 201-207

155
56. Ydenberg R, Dill L (1986) The economics of fleeing from predators. Advances in the
Study of Behavior 16: 229-249.
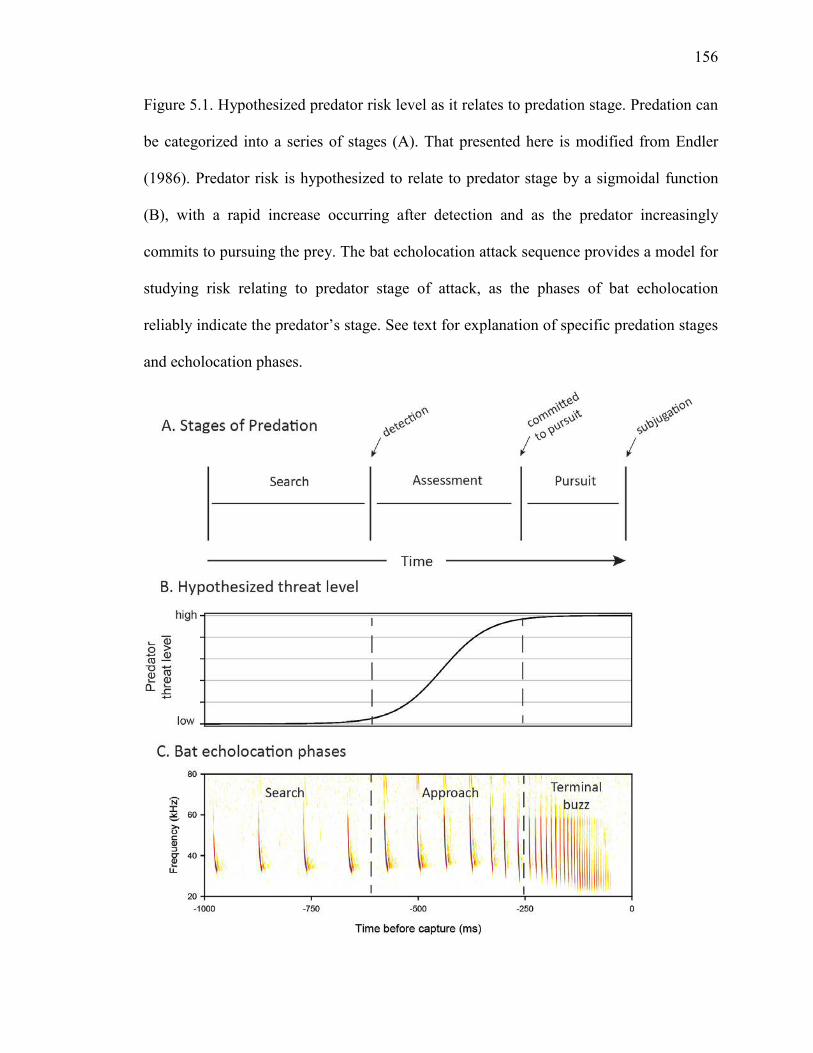
156
Figure 5.1. Hypothesized predator risk level as it relates to predation stage. Predation can
be categorized into a series of stages (A). That presented here is modified from Endler
(1986). Predator risk is hypothesized to relate to predator stage by a sigmoidal function
(B), with a rapid increase occurring after detection and as the predator increasingly
commits to pursuing the prey. The bat echolocation attack sequence provides a model for
studying risk relating to predator stage of attack, as the phases of bat echolocation
reliably indicate the predator’s stage. See text for explanation of specific predation stages
and echolocation phases.
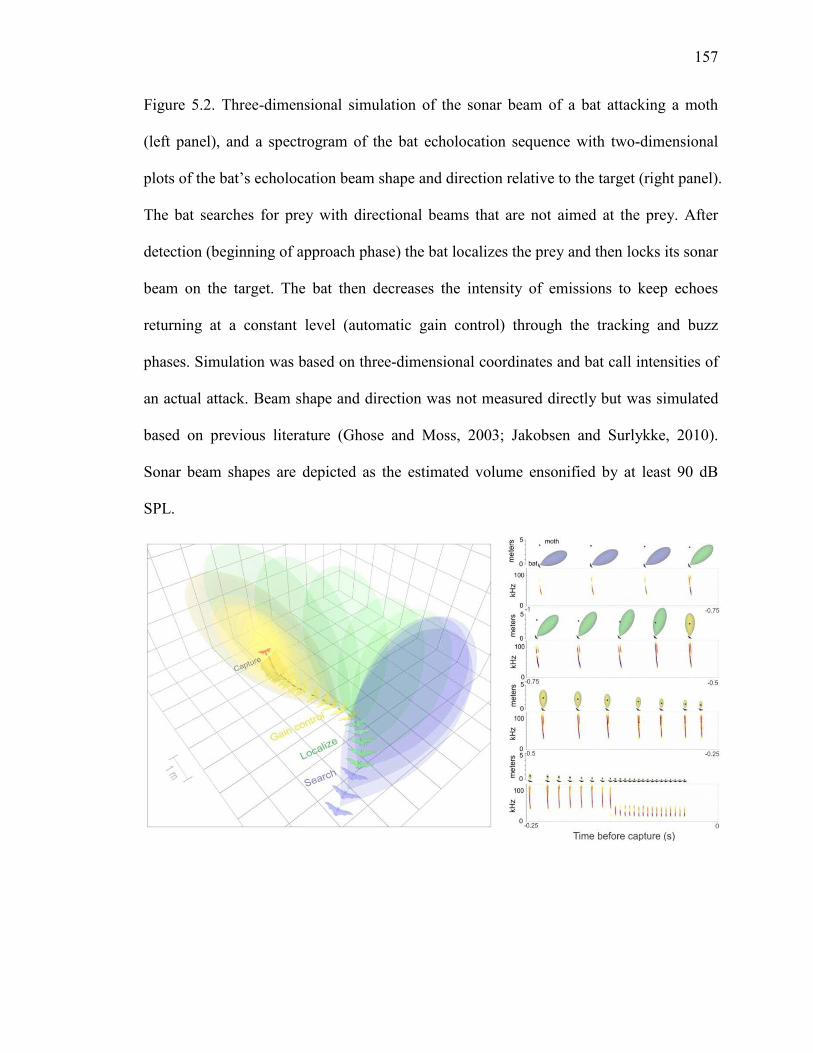
157
Figure 5.2. Three-dimensional simulation of the sonar beam of a bat attacking a moth
(left panel), and a spectrogram of the bat echolocation sequence with two-dimensional
plots of the bat’s echolocation beam shape and direction relative to the target (right panel).
The bat searches for prey with directional beams that are not aimed at the prey. After
detection (beginning of approach phase) the bat localizes the prey and then locks its sonar
beam on the target. The bat then decreases the intensity of emissions to keep echoes
returning at a constant level (automatic gain control) through the tracking and buzz
phases. Simulation was based on three-dimensional coordinates and bat call intensities of
an actual attack. Beam shape and direction was not measured directly but was simulated
based on previous literature (Ghose and Moss, 2003; Jakobsen and Surlykke, 2010).
Sonar beam shapes are depicted as the estimated volume ensonified by at least 90 dB
SPL.
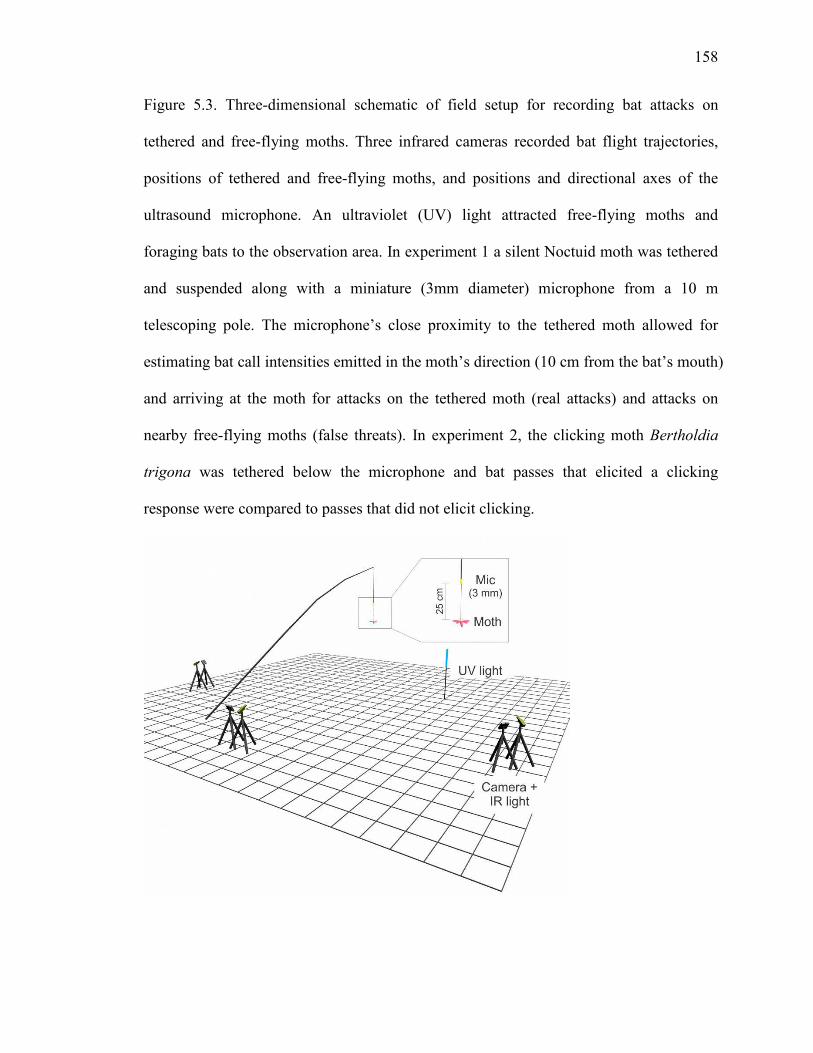
158
Figure 5.3. Three-dimensional schematic of field setup for recording bat attacks on
tethered and free-flying moths. Three infrared cameras recorded bat flight trajectories,
positions of tethered and free-flying moths, and positions and directional axes of the
ultrasound microphone. An ultraviolet (UV) light attracted free-flying moths and
foraging bats to the observation area. In experiment 1 a silent Noctuid moth was tethered
and suspended along with a miniature (3mm diameter) microphone from a 10 m
telescoping pole. The microphone’s close proximity to the tethered moth allowed for
estimating bat call intensities emitted in the moth’s direction (10 cm from the bat’s mouth)
and arriving at the moth for attacks on the tethered moth (real attacks) and attacks on
nearby free-flying moths (false threats). In experiment 2, the clicking moth Bertholdia
trigona was tethered below the microphone and bat passes that elicited a clicking
response were compared to passes that did not elicit clicking.
159
Figure 5.4. Acoustic and kinematic characterization of “real” and “false” threats. A real
threat is a bat attacking the target moth (A, B); a false threat is a bat attacking a nearby
moth (C). Real threats are shown (A) aligned by the end of the attack, and (B) aligned by
the echolocation call of maximum intensity. The top panels show the bat echolocation
intensities 10 cm from the bat (emitted in the moth’s direction) and at the moth’s position.
Middle and bottom panels show how bat pulse intervals and approach angles change over
the course of an attack, respectively. The rise in bat call intensity early in attacks in A and
B reflects the bat localizing the moth, followed by an immediate decrease in emission
intensity, which is the bat’s automatic gain control (see text and Figure 5.2). Bats engage
gain control (time=0 s in B) in the middle of approach phase and then soon turn towards
the prey (a decrease in approach angle). False threats are characterized by decreasing call
intensities at the moth’s position and approach angles not correlated with time in the
attack.
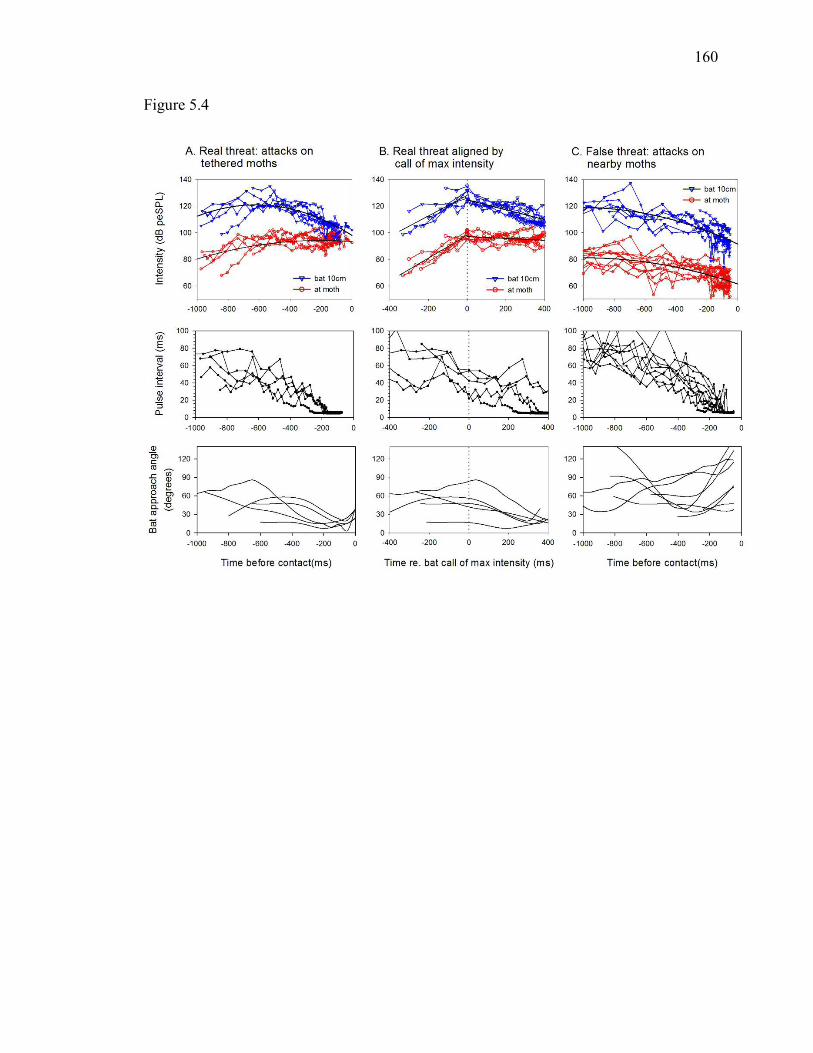
160
Figure 5.4
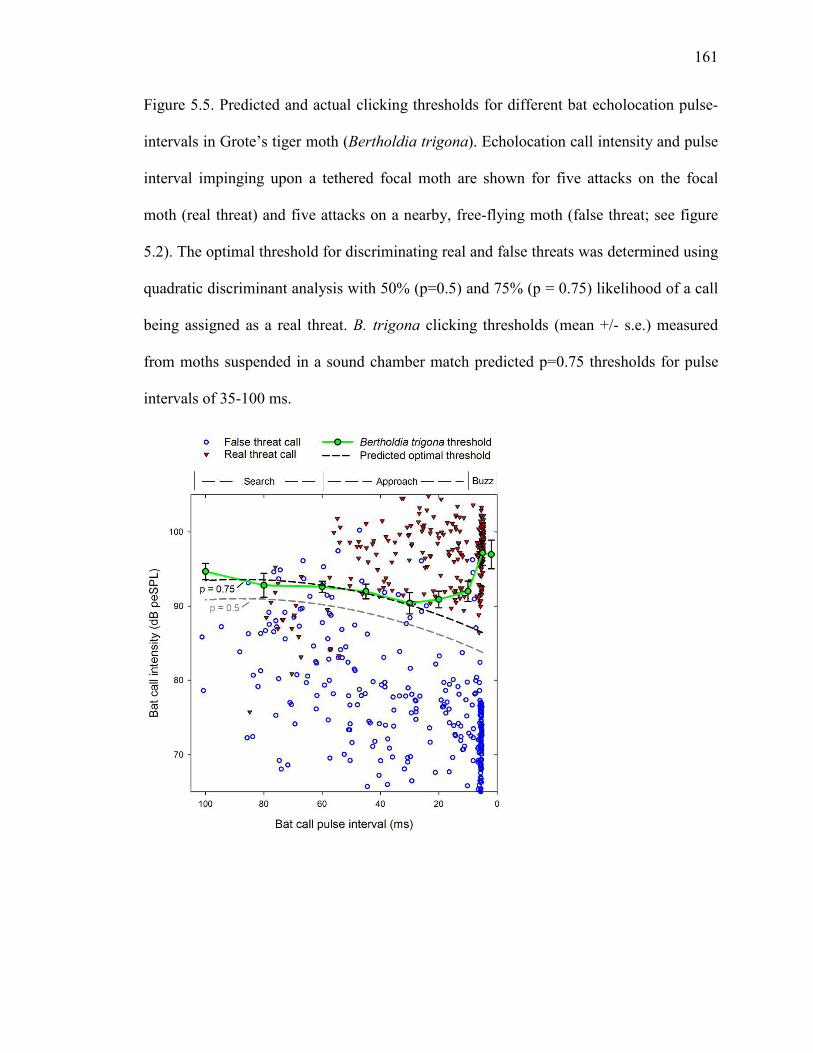
161
Figure 5.5. Predicted and actual clicking thresholds for different bat echolocation pulse-
intervals in Grote’s tiger moth (Bertholdia trigona). Echolocation call intensity and pulse
interval impinging upon a tethered focal moth are shown for five attacks on the focal
moth (real threat) and five attacks on a nearby, free-flying moth (false threat; see figure
5.2). The optimal threshold for discriminating real and false threats was determined using
quadratic discriminant analysis with 50% (p=0.5) and 75% (p = 0.75) likelihood of a call
being assigned as a real threat. B. trigona clicking thresholds (mean +/- s.e.) measured
from moths suspended in a sound chamber match predicted p=0.75 thresholds for pulse
intervals of 35-100 ms.
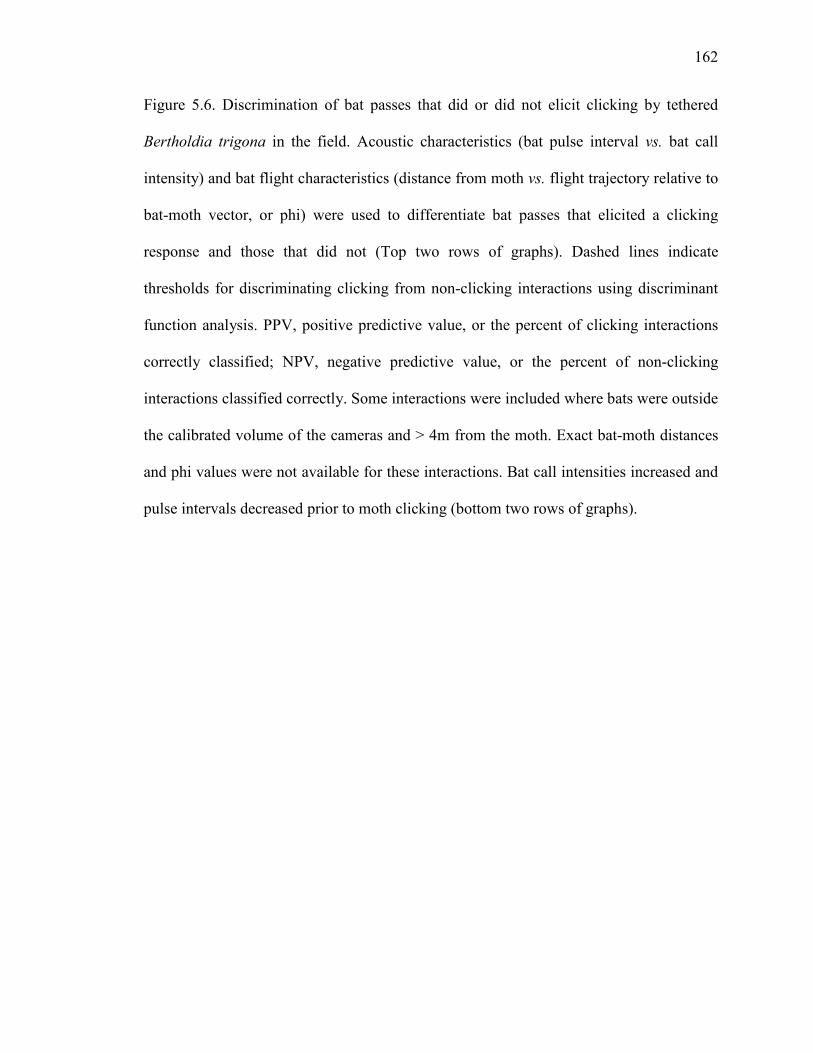
162
Figure 5.6. Discrimination of bat passes that did or did not elicit clicking by tethered
Bertholdia trigona in the field. Acoustic characteristics (bat pulse interval vs. bat call
intensity) and bat flight characteristics (distance from moth vs. flight trajectory relative to
bat-moth vector, or phi) were used to differentiate bat passes that elicited a clicking
response and those that did not (Top two rows of graphs). Dashed lines indicate
thresholds for discriminating clicking from non-clicking interactions using discriminant
function analysis. PPV, positive predictive value, or the percent of clicking interactions
correctly classified; NPV, negative predictive value, or the percent of non-clicking
interactions classified correctly. Some interactions were included where bats were outside
the calibrated volume of the cameras and > 4m from the moth. Exact bat-moth distances
and phi values were not available for these interactions. Bat call intensities increased and
pulse intervals decreased prior to moth clicking (bottom two rows of graphs).
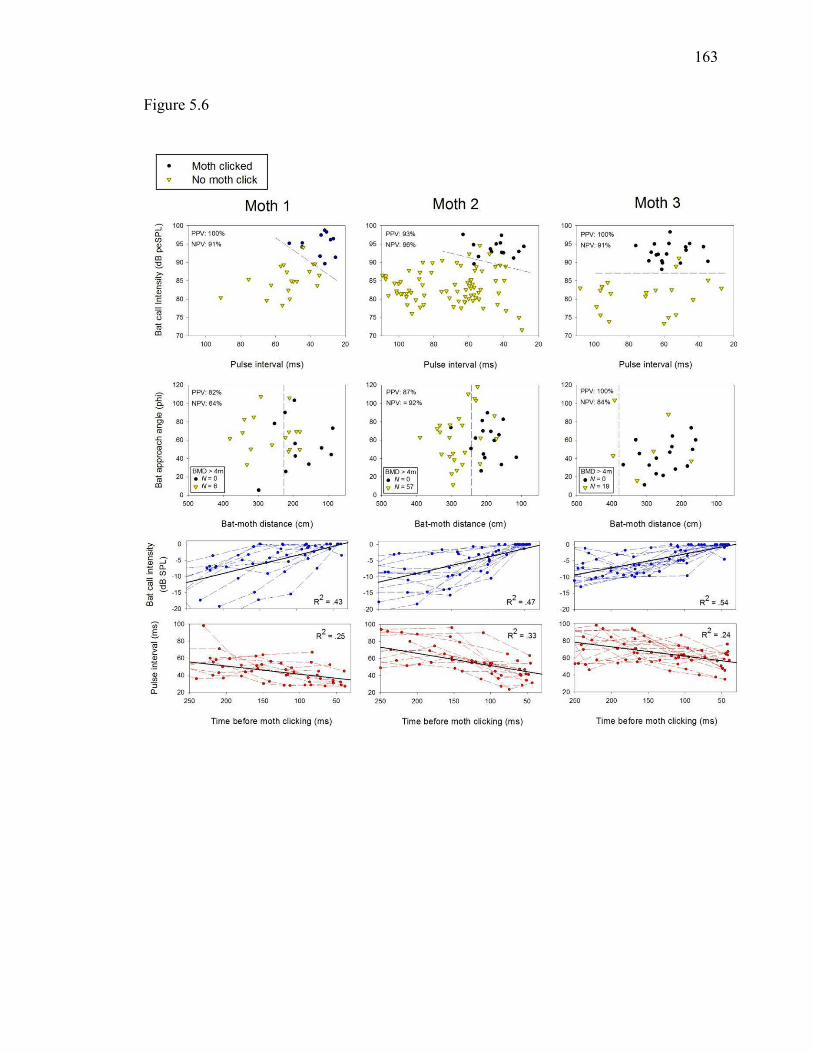
163
Figure 5.6
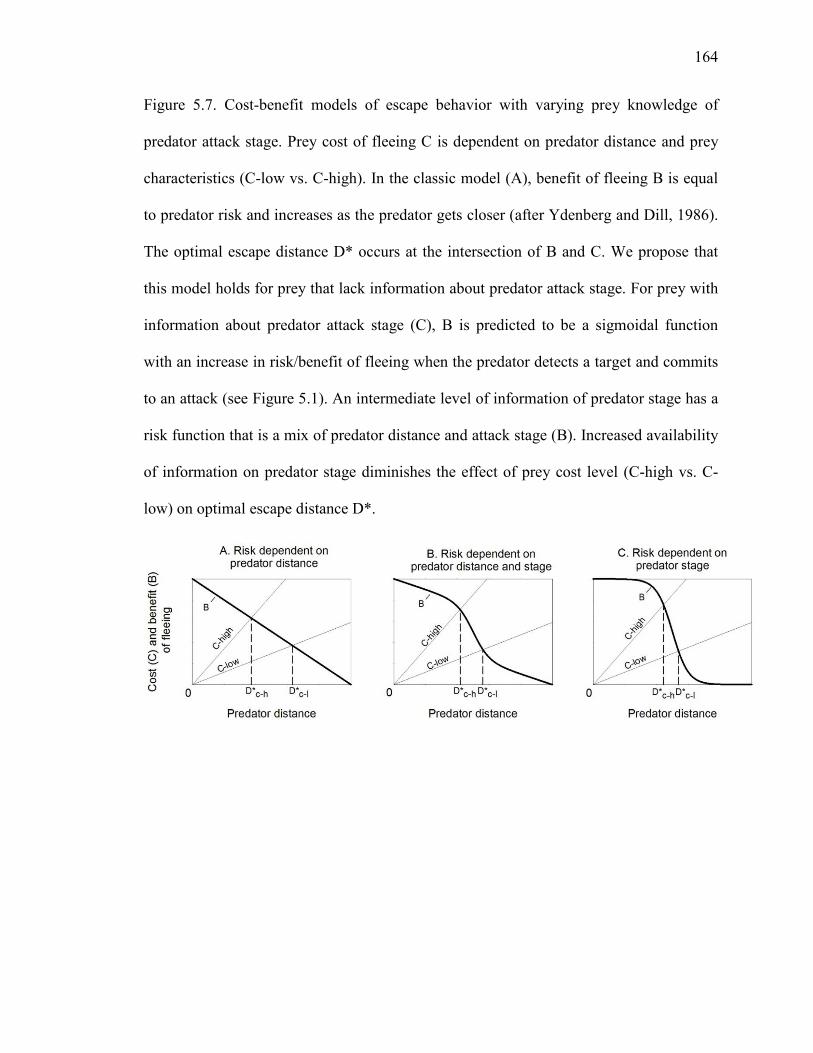
164
Figure 5.7. Cost-benefit models of escape behavior with varying prey knowledge of
predator attack stage. Prey cost of fleeing C is dependent on predator distance and prey
characteristics (C-low vs. C-high). In the classic model (A), benefit of fleeing B is equal
to predator risk and increases as the predator gets closer (after Ydenberg and Dill, 1986).
The optimal escape distance D* occurs at the intersection of B and C. We propose that
this model holds for prey that lack information about predator attack stage. For prey with
information about predator attack stage (C), B is predicted to be a sigmoidal function
with an increase in risk/benefit of fleeing when the predator detects a target and commits
to an attack (see Figure 5.1). An intermediate level of information of predator stage has a
risk function that is a mix of predator distance and attack stage (B). Increased availability
of information on predator stage diminishes the effect of prey cost level (C-high vs. C-
low) on optimal escape distance D*.
165
CONCLUSIONS AND FUTURE DIRECTIONS
This dissertation and the two that preceded it (Hristov, 2004; Barber 2007) have
provided substantial evidence to settle a dispute over the defensive function of tiger moth
clicks that is nearly 50 years old. All three hypotheses regarding click function are
effective under certain conditions. Most tiger moths appear to click to warn bats of their
toxic chemistry (Hristov, 2004), and this sets the stage for Batesian and Mullerian
mimicry (Barber, 2007). Startle can be an effective defense against bats that have not
habituated to clicking moths. This appears to be especially true for moths with high
clicking rates (Chapter III). Finally, some minority of moth species with high clicking
rates can jam bats sufficiently to prevent capture (Chapter II). It is unclear whether moths
with low clicking rates gain advantage through a small degree of jamming, perhaps as a
more potent message of toxicity (Ratcliffe and Fullard, 2005).
We have seen (Chapters IV and V) that the benefits of studying bat-insect
interactions in the field, and the methodology developed for these projects, makes
possible studies of many aspects of bat-moth biology. I predict in the coming years we
will see a sharp increase in the number of field studies on bats and insects.
Now that we have a more detailed grasp on the diversity of defensive strategies
employed by Arctiine moths, a next step is to place these discoveries in a phylogenetic
context, and such studies are planned. Of course it will not be possible to put each species
through the rigors of experimentation that have been the subject of this dissertation. New
methods will need to be developed to determine a moth’s primary defensive strategy
using relatively simple assays. The rate of moth clicking in response to bat echolocation
166
attacks can be determined using playbacks in a sound chamber, and this approach has
yielded comparative acoustic recordings on dozens of species (Barber and Conner, 2006;
Corcoran et al. 2010). However, it is unknown if there is a specific threshold of clicking
rate for jamming to effectively deter bats. Therefore a study is planned where bats can be
trained to attack a prey and a miniature ultrasonic speaker where clicks can be broadcast
at different rates and with different timing with respect to the bat’s attack. If a clicking
threshold for jamming can be found, then a simple recording of a moth clicking would be
all that is required for determining if it is a “jammer” species. Rapid assays are also
required for determining moth palatability to bats. This could be accomplished using
chemical or bio-assays including controlled feedings (Hristov and Conner, 2005). After
these challenges have been overcome, it will be possible to understand the evolution of
these fascinating defensive strategies in nature.
Another line of study would be to use a comparative ecological approach. Are
acoustic Batesian mimics limited in their seasonal and nightly time of activity based on
that of their models? Do jammers take advantage of their extraordinary defensive ability
by being active at times of night other moths avoid? We know aposematic moths tend to
be feeding specialists as caterpillars and are restricted to host plants with specific
chemicals. Is this relaxed for Batesian mimics and jammers? Do they tend to be
generalist foragers and benefit from this in some way? The list of questions is nearly
endless.
Taking the broader view, the discovery that moths jam bat sonar demonstrates the
powerful selective force that drives survival in a predator-prey system. It shows that,
regardless of their sophistication, communication systems (including the
167
autocommunication of sonar) are subject to disruption and distortion. This is especially
true when the organism taking advantage of the communication breakdown is relatively
rare. The communicators are then under less selective pressure to overcome the
disruption. In the case of sonar-jamming moths, these animals constitute a small
percentage of the moths that are available as prey at a given time. It is unlikely that bats
would be under sufficient selective pressure to specifically evolve a counter-measure to
the jamming defense. It is more likely that bats would evolve strategies that give them
advantage over all or most eared moths, which frequently make up a large percentage of
the lepidopteran prey available (Goerlitz et al. 2010). Because of the diffuse co-
evolutionary process, where many prey and predator species compete simultaneously, we
can expect numerous attacking and defensive strategies to coexist. We should therefore
expect sonar jamming to be only one entry on a long list of discoveries in the bat-moth
arms race.
168
LITERATURE CITED
Barber, J. R. and Conner, W. E. (2006). Tiger moth responses to a simulated bat attack:
timing and duty cycle. Journal of Experimental Biology 209, 2637-2650.
Barber, J.R. (2007). Diversity and Deception: Acoustic Aposematism and Mimicry in
the Bat-Moth Arms Race. Ph.D. Dissertation. Wake Forest University, Winston
Salem, NC.
Corcoran, A. J., Conner, W. E. and Barber, J. R. (2010). Anti-bat tiger moth sounds:
Form and function. Current Zoology 56, 358-369.
Goerlitz, H. R., ter Hofstede, H. M., Zeale, M. R. K., Jones, G. and Holderied, M. W.
(2010). An aerial-hawking bat uses stealth echolocation to counter moth hearing.
Current Biology 20, 1568-1572.
Hristov, N. I. (2004). A Multi-level Analysis of the Bat-Tiger Moth Arms Race. Ph.D.
Dissertation. Wake Forest University, Winston Salem, NC.
Hristov, N. I. and Conner, W. E. (2005a). Effectiveness of tiger moth (Lepidoptera,
Arctiidae) chemical defenses against an insectivorous bat (Eptesicus fuscus).
Chemoecology 15, 105-113.
Ratcliffe, J. M. and Fullard, J. H. (2005). The adaptive function of tiger moth clicks
against echolocating bats: an experimental and synthetic approach. Journal of
Experimental Biology 208, 4689-4698.

169
Aaron J. Corcoran Department of Biology, Wake Forest University
Winston Salem, NC 27106 336-251-2638 | [email protected]
EDUCATION
Ph.D. Biology, Wake Forest University, 2013 (projected) - Dissertation: Sonar Jamming in the Bat-Moth Arms Race
M.A. Biology, Humboldt State University, 2007 - Thesis: Automated Acoustic Identification of Twelve Bat Species of the Eastern United States
B.S. Wildlife, with Honors Purdue University, 2003
RESEARCH EXPERIENCE
2008 - 2012 NSF Graduate Research Assistantship, Wake Forest University
2007 - 2008 Research Analyst and Field Research Coordinator, Humboldt State University
2005 - 2007 SERDP Graduate Research Assistantship, Humboldt State University
2004 - 2005 Field Research Assistant, U.C. Davis, Oregon St. Univ., Utah St. Univ.(Separate appointments)
TEACHING EXPERIENCE
2012 Teaching Assistant, Animal Behavior and Comparative Physiology, Wake Forest University
2011 Teaching Assistant, Lepidoptera Field Course, Southwestern Research Station
2010 - 2012 Guest Lecturer, Animal Behavior, Sensory Biology, and Entomology, Wake Forest University
2008 Lecturer, General Zoology Lab, Humboldt State University
2005 - 2007 Teaching Associate, General Zoology Lab, Humboldt State University
PUBLICATIONS
Corcoran, A.J., R. D. Wagner, and W.E. Conner 2012. Optimal predator risk assessment by the sonar-jamming moth, Bertholdia trigona. In preparation.
Corcoran, A. J., and W. E. Conner 2012. Sonar jamming in the field: Effectiveness and behavior of a unique prey defense. Journal of Experimental Biology. 215: 4278-4287
170
Conner, W. E., and A. J. Corcoran 2012. Sound strategies: the 65-million-year-old battle between bats and insects. Annual Review of Entomology. 57: 21-39
Corcoran, A. J., J. R. Barber, N. I. Hristov, and W. E. Conner 2011. How do tiger moths jam bat sonar? Journal of Experimental Biology. 214: 2416-2425
Corcoran, A. J., W. E. Conner, and J. R. Barber 2010. Anti-bat tiger moth sounds: Form and function. Current Zoology. 56: 358-369
Corcoran, A. J., Barber, J. R., and W. E. Conner 2009. Tiger moth jams bat sonar. Science. 325: 325-327
SCHOLARLY PRESENTATIONS
Corcoran, A.J. and W. E. Conner (2012) Sonar jamming in the field: Effectiveness and behavior of a unique prey defense. International Congress of Neuroethology, College Park, MD. Poster.
Corcoran, A.J. (2012) Sonar-jamming in the bat-moth arms race. Invited speaker, Department of Biology seminar series, Clemson University.
Corcoran, A.J. (2012) Sonar-jamming in the bat-moth arms race. Invited speaker, Department of Biology seminar series, Utah State University.
Corcoran, A.J. (2012) Sonar-jamming in the bat-moth arms race. Invited speaker, Center for Evolutionary and Comparative Biology of Hearing, University of Maryland.
Corcoran, A.J. , J.R. Barber, N.I. Hristov, and W.E. Conner (2010). How do tiger moths jam bat sonar? North American Symposium for Bat Research. Denver, CO.
Corcoran, A.J. , and J.M. Szewczak (2010). Niche Breadth, Foraging Plasticity and Conservation of Myotis septentrionalis, M. lucifugus, and M. leibii. Southeastern Bat Diversity Network Annual Meeting, Asheville, NC
Corcoran, A.J. , Barber, J.R., W.E. Conner (2009). Tiger moth jams bat sonar. North American Symposium for Bat Research, Portland, OR
Corcoran, A.J. , Barber, J.R., W.E. Conner (2009). Limitations of biosonar: a tiger moth sonar jamming defense. Animal Sonar Symposium, Kyoto, Japan
Corcoran, A.J. , Barber, J.R., Cullen, M.A. and W.E. Conner (2009). Sound strategies: acoustic aposematism, mimicry, and sonar jamming in the bat-moth arms race. Society for Integrative and Comparative Biology Annual Meeting, Boston, MA
Corcoran, A.J. and J.M. Szewczak (2007). Automated acoustic identification of nine bat species of the Eastern United States. International Bat Research Conference, Merida, Mexico
Corcoran, A.J. and J.M. Szewczak (2006). Automated acoustic identification of three bat species – Lasiurus borealis, Nycticeius humeralis, and Pipistrellus subflavus. North American Symposium on Bat Research, Wilmington, NC

171
GRANTS AND AWARDS
2012 Outstanding Graduate Student of the year, Wake Forest University
2012 Vecellio Award for Graduate Research, Wake Forest University
2011 Theodore Roosevelt Memorial Grant, American Museum Natural History
2010 Elton C. Cocke Scholarship, Wake Forest University
2010 Graduate School Alumni Student Travel Award, Wake Forest University
2010 National Science Foundation Grant w/ Dr. William Conner
2009 North American Symposium for Bat Research Outstanding Student Presentation
2009 Vecellio Award for Graduate Research, Wake Forest University
2008 Dean’s Fellowship, Wake Forest University
2008 Andrew’s Fellowship, Purdue University (declined)
2002 Agriculture Research Scholarship, Purdue University
UNDERGRADUATE MENTORING
2012 Kaitlyn Roman – Bats jamming bats? A playback experiment
2011 Zachary Walker – Defending food patches by jamming sonar
2010 Ryan Wagner – Acoustic cue recognition by sonar-jamming moths
2009 Wesley Johnson – Acoustic Müllerian mimicry in the field
2008 Megan Cullen – Sensory perception of prey by captive bats
OUTREACH AND MEDIA RELATIONS
2013
Featured in the nature documentary “Micro Monsters 3D” with David Attenborough
2012
Interviewed for feature article on field study of sonar jamming. Inside JEB
Public presentation on sonar-jamming moths. Science Café, hosted by Sciworks and Reynolda village
Youth presentation on bats and moths. King County Public Library
Research on sonar-jamming moths featured in textbook. Animal Behavior by Shawn E. Nordell and Thomas J. Valone
Provided materials and information for children’s article on sonar-jamming moths. Wild Magazine, Canadian Wildlife Federation
Public presentation on sonar-jamming moths. Southwestern Research Station, Portal, Arizona
2011
Scientific consultant for National Geographic television mini-series Untamed Americas

172
Public presentation on sonar-jamming moths Southwestern Research Station, Portal, Arizona
Presented on “Moth ears for bat defense and moth courtship”. Lepidoptera Field Course, Southwestern Research Station, Portal, Arizona
Research highlighted in article “Masters of Disguise: Animal Mimics Fool Their Foes”. Scientific American Magazine
Research on sonar-jamming moths featured in textbook. Animal Communication by Jack W. Bradbury and Sandra L. Vehrencamp
2010
Public presentation on sonar-jamming moths. Southwestern Research Station, Portal, Arizona
Wrote “Featured Scientist of the Year” article on sonar-jamming moths. Southwestern Research Station Bulletin
2009
Live broadcast, nationwide radio interview on sonar-jamming moths. NPR’s Science Friday. (Also featured for video pick-of-the-week)
Research featured worldwide including by L.A. Times, National Geographic, New York Times, NewsTrack India,NPR, Scientific American, Sydney Morning Herald, Wired News,and Voice of America
Interviewed on sonar-jamming research. Science Magazine podcast
Televised interview on sonar-jamming moths. Discovery Channel Canada.
PROFESSIONAL AFFILIATIONS
American Society of Mammalogists
Animal Behavior Society
North American Society for Bat Research
Phi Beta Kappa Honor Society
Society for Integrative and Comparative Biology
PROFESSIONAL SERVICE
Reviewer for PLOS ONE and ETHOLOGY


![Expert opinion on BAT-associated emission levels (BAT-AELs ... · PDF fileExpert opinion . on . BAT-associated emission levels ... final draft [1] BAT-associated emission levels (BAT](https://img.pdfslide.us/doc/110x75/5aafbbcb7f8b9a22118d916a/expert-opinion-on-bat-associated-emission-levels-bat-aels-opinion-on-bat-associated.jpg)