Embed Size (px)
Citation preview

THE MISSING WEALTH OF NATIONS:ARE EUROPE AND THE U.S. NET DEBTORS OR
NET CREDITORS?
Gabriel ZucmanParis School of Economics∗
February 25, 2013†
Abstract
This paper shows that official statistics substantially underestimate the net for-eign asset positions of rich countries because they fail to capture most of the assetsheld by households in offshore tax havens. Drawing on a unique Swiss datasetand exploiting systematic anomalies in countries’ portfolio investment positions,I find that around 8% of the global financial wealth of households is held in taxhavens, three-quarters of which goes unrecorded. On the basis of plausible assump-tions, accounting for unrecorded assets turns the eurozone, officially the world’ssecond largest net debtor, into a net creditor. It also reduces the U.S. net debtsignificantly. The results shed new light on global imbalances and challenge thewidespread view that, after a decade of poor-to-rich capital flows, external assetsare now in poor countries and debts in rich countries. I provide concrete proposalsto improve international statistics.
Keywords: Tax havens, International investment positions, Global imbalancesJEL classifications: F32, H26, H87.
∗48 boulevard Jourdan, 75014 Paris, France, [email protected]. A detailed Appendix is availableonline.†I am very grateful to my advisor Thomas Piketty for his continuous support and guidance. I
thank the editor (Robert Barro), five anonymous referees, Jean-Edouard Colliard, Mihir Desai, NicolasFrémeaux, Lucie Gadenne, Pierre-Olivier Gourinchas, Philip Lane, Gian Maria Milesi-Ferretti, RichardSylla, Daniel Waldenström, Edward Wolff, and participants at numerous seminars. Paul Farello, Christo-pher Gohrband, Steve Landefeld, and Robert Yuskavage from the Bureau of Economic Analysis alsoprovided helpful comments. Part of this paper was drafted while I was visiting NYU; I am grateful toJess Benhabib who made this visit possible.
1

I. Introduction
There are two puzzles in international investment statistics. The first is a set of sta-
tistical anomalies. At the global level, liabilities tend to exceed assets: the world as a
whole is a net debtor (Lane and Milesi-Ferretti, 2007). Similarly, the global balance of
payments shows that more investment income is paid than received each year. Since the
problem was identified in the 1970s, the International Monetary Fund has commissioned
a number of reports to investigate its causes, and national statistical agencies have put
considerable resources into improving their data. Yet despite a great deal of progress,
large anomalies remain; many European securities, in particular, have no identifiable
owner (Milesi-Ferretti, Strobbe, and Tamirisa, 2010).
The second puzzle is a theoretical challenge. Since the latter half of the 1990s, capital
has been flowing from poor to rich countries. As a result, the rich world now appears to
be a sizeable net debtor in the official data, dragged down by the U.S. and Europe. While
the literature has put forward possible explanations for the U.S. net debt and the rise in
China’s assets,1 the negative net positions of Europe and the overall rich world remain
largely unexplained. Despite this, many observers have grown accustomed to the view
that external assets are now in poor countries and debts in rich countries. In the public
debate, the view that “China owns the world” has become particularly popular. Should
it be correct, the implications for policymaking and open-economy modeling would be
far-reaching.
My paper challenges this view. The negative net foreign asset position of the rich
world, I argue, is an illusion caused by tax havens. International statistics fail to capture
most of the assets held by households through tax havens: they overlook the portfolios
of equities, bonds, and mutual fund shares that households own via banks in Switzerland
and other countries with strict bank secrecy rules. This coverage gap explains many
of the long-standing anomalies in global data. My computations find that around 8%1See Dooley, Folkerts-Landau, and Garber (2003), Bernanke (2005), Dollar and Kraay (2006), Engel
and Rogers (2006), Caballero, Farhi, and Gourinchas (2008), Mendoza, Rios-Rull, and Quadrini (2009),Carroll and Jeanne (2009), Ma and Haiwen (2009), Obstfeld, Shambaugh, and Taylor (2010), Aguiarand Amador (2011), Song, Storesletten, and Zilibotti (2011), and Alfaro, Kalemli-Ozcan, and Volosovych(2011) among others.
2

of households’ financial wealth is held through tax havens, three-quarters of which goes
unrecorded. This stock of unrecorded assets is double the recorded net debt of the rich
world (Figure I). Since a body of evidence suggests that most of the wealth in tax havens
belongs to residents of rich countries, accounting for it turns the rich world into a net
creditor. Despite a decade of global imbalances, therefore, external wealth is still probably
in rich countries overall: China does not own the world yet. Back in the 1980s-1990s the
rich world had a large positive net position; over the last decade it has eaten some of
its claims away; but today poor countries are still repaying their debts to advanced
economies.
These findings have direct implications for core issues in international macroeco-
nomics. On the basis of plausible assumptions, accounting for the wealth in tax havens
turns the eurozone, officially the world’s second largest net debtor, into a net creditor.
It also improves the U.S. net position. Now, the net foreign asset position is a key state
variable in dynamic macroeconomic models. Accurate net positions are essential to assess
the merits of the different views put forward on the causes of global imbalances and they
are important to monitor financial stability. A large body of literature has questioned the
sustainability of global imbalances.2 If indeed the net positions of Europe and the U.S.
are higher than in the official statistics, the required international adjustment is smaller
than commonly thought. Domestic imbalances and public finance issues may be more
serious today for rich countries than global imbalances: rich countries taken as a whole
are richer than we think, but some of their wealthiest residents hide part of their assets in
tax havens, which contributes to making governments poor. So far, tax havens have been
ignored by the literature that studies the evolution of top income shares around the world
(Atkinson, Piketty, and Saez, 2011).3 My findings, therefore, also have implications for
this strand of research: my macro-based estimate of the funds held through tax havens2See Obstfeld and Rogoff (2005), Blanchard, Giavazzi, and Sa (2005), Gourinchas and Rey (2007a),
the papers in Clarida (2007), Hausmann and Sturzenegger (2007), Curcuru, Dvorak, andWarnock (2008),and Blanchard and Milesi-Ferretti (2009) among others.
3The two exceptions are Roine and Waldenström (2009) who use anomalies in Sweden’s balance ofpayments to approximate capital flight, and Dell, Piketty, and Saez (2007) who use Swiss tax data toput an upper bound on the amount of capital income earned in Switzerland by non-resident taxpayers.Tax data, however, are not an appropriate source in this case, because the bulk of income earned byforeigners in Switzerland does not have to be declared to Swiss tax authorities.
3

could be used as a first step to include these funds into micro-based studies of income
and wealth distributions.
The paper proceeds as follows. Section II begins with a brief primer on the activities
that take place in tax havens and the statistical issues involved. Section III analyses a
previously unused official dataset from the Swiss National Bank. A considerable amount
of wealth is held unrecorded in Swiss accounts, and contrary to popular belief, this wealth
mostly belongs to residents of rich countries. Section IV then presents a novel method
to estimate the personal wealth in all the world’s tax havens, using anomalies in the
aggregate portfolio stock data of countries (the key source here is Lane and Milesi-Ferretti,
2007). My method is indirect and relies on data with known imperfections, so it is subject
to some margin of error. Section V presents consistency and robustness checks, based on
bilateral and flow data from the IMF, suggesting that the order of magnitude I find is
reliable. The many datasets used in this paper all paint the same picture: households
own a large amount of mutual fund shares through unrecorded accounts in tax havens. In
Section VI, I propose scenarios as to how including the unrecorded assets in the statistics
would affect published international investment positions. I discuss the implications for
global imbalances and the uncertainties that remain. The conclusion provides concrete
proposals to improve the official data. There are numerous intricacies in the financial
activities of tax havens and the international statistics. The most important ones are
discussed in the paper; others are detailed in a comprehensive Online Appendix.
II. Tax Havens and Their Implications for International Statistics
First, let’s look at the basic concepts that will be used throughout the paper. A country’s
foreign assets and liabilities are recorded in its international investment position (IIP).
The IIP is the stock equivalent of the financial account of the balance of payments: the
IIP shows the stock of existing cross-border investments at the end of each year, while
the balance of payments shows the yearly flow of new investments. There are three broad
categories of cross-border claims: direct investments (holdings of over 10%), portfolio
4

securities (equities and bonds that do not qualify as direct investment), and other assets
(mainly loans and deposits).4 At the end of 2008, as shown by Table I, securities were
the largest category: they accounted for $40tr out of $90tr.
Tax havens host numerous financial activities. About 40% of the world’s foreign
direct investments are routed through tax havens such as the British Virgin Islands.5
Many investment funds and financial vehicles are incorporated offshore. Luxembourg is
the second largest mutual fund center in the world after the U.S; a great deal of the
world’s money market funds are incorporated in Ireland; and most hedge funds are in
the Cayman Islands. Multinational corporations routinely use tax havens for treasury
operations and group insurance. Some of these activities have legitimate roles and are
satisfactorily covered in the statistics.6 My paper focuses on one specific tax haven
activity: personal wealth management or “private banking”. This activity is present in
many but not all tax havens. Leaders include countries with strict bank secrecy rules such
as Switzerland, the Cayman Islands, the Bahamas, Hong Kong, Singapore, and Jersey.
Banks incorporated in these countries – which are often subsidiaries of large global banks
– attract foreign individuals and provide them with investment advice and services. In
the IIPs of countries, the personal wealth management activities of tax havens do not
affect direct investment data, slightly affect “other assets”, but cause large, systematic
errors for portfolio securities.
II.A. How Cross-Border Securities Should be Recorded in Principle
To see what errors occur in portfolio data, denote Aij the amount of securities issued
by country j, owned by residents of country i 6= j. To measure Aij, the data collection
system of each country i covers some agents directly and others indirectly (IMF, 2002).
Financial corporations such as banks, investment funds, and insurance companies, are4On the asset side of official IIPs, statisticians isolate a fourth category, reserve assets, which includes
the portfolio securities and other assets held by central banks. In this paper, “securities” will alwaysinclude the fraction of reserve assets invested in securities.
5See data gathered by the IMF for its Coordinated Direct Investment Survey. In 2011 for instance, 30%of India’s inward direct investments came from Mauritius; 25% of Brazils’ came from the Netherlands;60% of China’s came from Hong Kong and the British Virgin Islands.
6See for instance IMF (2000).
5

direct reporters. They provide data on their own holdings (the securities that are on
their balance sheets) and on their clients’ holdings (the securities that are off their bal-
ance sheets, but that they can observe). Governments and nonfinancial corporations
above a certain size threshold are also direct reporters. By contrast, households are indi-
rectly covered, for practical reasons. Their holdings are reported by financial companies.
Trusts, personal wealth-holding companies, and other small nonfinancial corporations are
indirectly covered as well, and I include them in the household sector. We can therefore
write Aij as the sum of the foreign securities owned by directly covered agents (aij) and
households (aij).
All types of investors entrust their securities to domestic or to foreign banks for
custody. Through to the 1960s, all securities existed in the form of paper certificates
that were deposited in safe places such as bank vaults. Keeping their clients’ certificates
safe was the custodians’ job. Today, paper has been replaced by electronic records, but
investors still use custodian banks as book-keepers and for other services. Let’s denote
the custodian’s country of residence with a superscript letter:
Aij =∑k
Akij =∑k
(akij + akij) = [aiij + aiij]︸ ︷︷ ︸onshore
+∑k 6=i
(akij + akij︸ ︷︷ ︸offshore
)
To fix ideas, consider a portfolio of U.S. (j) equities held by a household living in
France (i). This portfolio can either be entrusted to a French bank – in which case we
will say that it is held onshore – or to an offshore bank, say in Switzerland (k).
Offshore banks provide investment advice and services just like onshore banks do.
But they also provide opportunities to evade personal income taxes. In most non-haven
countries, onshore banks automatically report the investment income earned by their
clients to tax authorities. Such third-party reporting makes tax evasion impossible. By
contrast, in tax havens with strict bank secrecy rules, banks do not generally report
information. Taxes can be collected only if taxpayers self-declare their income.
International investment statistics work on the basis of the residence principle (IMF,
1993). The residence principle states that a security issued by the U.S. and held by a
6

French resident through a Swiss bank must be recorded as an asset for France on the U.S.
and a liability for the U.S. vis-à-vis France. The location of the custodian is irrelevant.
II.B. Offshore Portfolios: A Blind Spot in Securities Statistics
In practice, offshore custodian banks cause a blind spot in portfolio assets data. When
French households entrust U.S. securities to Swiss banks, these assets akij cannot be
captured by surveying French custodians. They go completely unrecorded in the French
IIP.7 This blind spot is well known among statisticians: Bertaut, Griever, and Tryon
(2006, p. A67) discuss it in the context of the U.S. data reporting system, the ECB
(2002, p. 8) in the context of the eurozone’s.
Household offshore portfolios do not appear on the IIPs of tax havens either. To
compile Switzerland’s external accounts, the Swiss National Bank asks domestic banks
to report on the securities that they hold in custody. Swiss bankers observe that they
hold U.S. securities belonging to French residents. These securities are neither assets nor
liabilities for Switzerland, so in keeping with the residence principle, they are excluded
from Switzerland’s position.
Household offshore portfolios, however, do appear in the liabilities of countries’ IIPs.
U.S. securities held by French savers are duly recorded as liabilities for the U.S. whether
they are held in France or in Switzerland. Most of the securities issued by the U.S. are
ultimately kept by the U.S. central securities depository, the final book-keeper where set-
tlements take place. This centralization makes it relatively easy to estimate the amount
of U.S. equities and bonds held by foreigners. (The country allocation of liabilities, how-
ever, are distorted: U.S. securities held by French savers through Switzerland are wrongly
attributed to Switzerland, because seeing through the Swiss banks is not possible.)
The failure to record the offshore portfolios of households plagues countries’ interna-
tional data. An obvious solution would be to ask each tax haven k to provide information
about the portfolios held by foreign individuals through their banks, the akij (k 6= i). No7As Section IV.A will show, transfers of funds to tax havens are not well recorded, so that it is not
possible to capture offshore portfolios by cumulating banking flows. That is why errors in portfoliopositions translate into errors for the full IIP.
7

haven, however, discloses this information. No haven, except Switzerland.
III. Offshore Wealth in Switzerland
Since 1998, the Swiss National Bank has published the value of the offshore portfolios
in Swiss banks. A monthly survey of Swiss-domiciled custodians covers 95% of these
holdings. The SNB conducts a full survey yearly. Portfolios are broken down by asset
class and currency. The SNB also provides evidence as to who owns Swiss accounts. I
am not aware of any other paper that uses this unique set of data to investigate the
wealth held offshore. The outsized role that Switzerland plays in the offshore wealth
management industry means that this one data source can do a lot to fill in the gaps in
countries’ portfolio assets data. This Section analyzes what we learn from the Swiss case,
before attempting to compute the amount of wealth held in tax havens globally.
III.A. The Level and Composition of the Offshore Fortunes in Switzerland
The first striking result, reported in the first column of Table II, is the huge amount of
offshore wealth in Swiss banks. At the end of 2008 – when global stock markets were
low – foreigners held through Switzerland portfolios of foreign (i.e., non Swiss) securities
worth Ωs = $1.5tr.8 Once you add bank deposits (more on these below), the total offshore
wealth in Swiss banks comes to more than $2tr – as much as China’s foreign exchange
reserves.
For comparison, the second column of Table II shows the value of the assets belonging
to Swiss residents in Swiss banks. They are much smaller. In 2008, only one-third of
all the foreign securities in the Swiss banks vaults belonged to Swiss savers – two-thirds
belonged to foreigners. This pattern epitomizes what offshore financial centers do: Swiss
banks essentially help foreigners invest out of Switzerland, the banks acting only as8In the above accounting framework, Ωs (where Ω stands for offshore, and s for Switzerland) is equal
to∑i 6=s∑j 6=s(asij + asij). Ideally we would like to exclude from the offshore portfolios Ωs the portfolios
of foreign securities that belong to foreign direct reporters (∑i6=s∑j 6=s a
sij), and we would like to include
the portfolios of Swiss securities that belong to foreign households (∑i 6=s a
sis). As discussed below, in
all likelihood both are relatively small, so that Ωs is a good proxy for the amount of wealth held inSwitzerland that goes completely unrecorded in other countries’ positions,
∑i 6=s∑j asij .
8

conduits.9 In 2004 there was a survey of the custodial holdings in French banks. In sharp
contrast to the Swiss case, almost all the foreign securities in French banks belong to
French investors (Gest and Dajean, 2005).
The second interesting result relates to the composition of the offshore portfolios in
Swiss banks. Mutual fund shares account for one half, bonds for one-third, and equities
for the rest. The SNB does not provide statistics on the type of mutual funds that for-
eigners own (do they invest in bond funds? equity funds?). But we do know that out of
the 8,000 funds registered for distribution in Switzerland, about 4,600 are incorporated
in Luxembourg and 1,200 in Ireland.10 The data, therefore, reveal a clear pattern, sum-
marized by Figure II. On their Swiss accounts, foreigners do own some U.S. equities, but
they mostly own Luxembourg and Irish fund shares (the funds, in turn, invest all around
the world).
Investing in a Luxembourg fund through a Swiss account makes perfect sense for a
French tax evader: Luxembourg does not withhold taxes on cross-border payments, so the
tax evader receives the full dividend paid by the fund on his or her account, and French
personal income tax can be evaded, since there is no automatic exchange of information
between Swiss banks and the French tax authority. Conversely, a French person has
to go through each step of the France-Switzerland-Luxembourg circuit to evade taxes.
Investing in a Luxembourg fund through a French bank does not save on taxes. Investing
in a Swiss mutual fund through a Swiss bank is also useless, because capital income paid
by Swiss corporations is subject to a 35% advance tax withheld at source by Switzerland.
The advance tax can only be refunded when taxpayers self-declare income in their home
country. The tax does not apply to income credited to Swiss accounts but paid by foreign
corporations, such as Luxembourg funds. This fact explains why the vast majority of the
mutual funds distributed in Switzerland are incorporated abroad.
In all likelihood, the foreign securities held in Switzerland by foreigners belong to
households. It makes little sense for foreign banks, insurance companies, or investment9One common misconception is that having a Swiss account means having Swiss francs or Swiss assets.
In general, this is not the case.10See http://www.swissfunddata.ch. Most hedge funds are not registered, hence not covered by
these statistics. Section V.A. will specifically address the important case of hedge funds.
9

funds to entrust their non-Swiss holdings to Swiss custodians: doing so does not secure
any tax or regulatory advantage. There is no evidence that Swiss banks provide significant
custody services for foreign corporations. There is, by contrast, considerable evidence
from newspaper investigations, industry reports, and high-profile tax scandals that they
offer extensive wealth management services to foreign individuals. Ωs is thus a good
proxy for household offshore portfolios in Swiss banks.11
The foregoing discussion has centered on portfolio wealth. In tax havens, however,
households can hold not only securities, but also bank deposits. Swiss banks provide
a unique kind of deposit owned by households only, in the form of what are known as
fiduciary deposits. Fiduciary deposits cannot be used as a medium of exchange: they
are useless for corporations. Swiss banks invest the funds placed in fiduciary deposits
in foreign money markets on behalf of their clients. Legally speaking, all interest is
considered to be paid by foreigners to the depositors, with the Swiss banks acting merely
as “fiduciaries.” Thus, fiduciary deposits are not subject to the 35% Swiss advance tax.
As shown by Table II, in 2008 fiduciary deposits accounted for one-quarter of the total
amount of offshore wealth in Swiss banks.
III.B. Who Owns Swiss Bank Accounts?
The last contribution made by the Swiss data is to provide unique evidence as to the
likely owners of unrecorded fortunes in tax havens. Since 1976, the SNB has published a
full country breakdown of the owners of fiduciary deposits.
Country breakdowns are puzzling at first glance. As Figure III shows, the SNB records
a large and growing fraction of Swiss fiduciary deposits as belonging to tax havens,
most notably Panama, Liechtenstein, and the British Virgin Islands. What happens?
The SNB records such holdings because it does not see through sham corporations used11Note that the SNB provides a breakdown of Ωs by owner sector (private customers, commercial
customers, and institutional investors). But this breakdown is misleading: the SNB does not see throughintermediate wealth-holding structures used by individuals with a Swiss account. The SNB counts thesecurities of a French individual who uses a sham Panamanian holding company as belonging to theforeign “institutional investors” sector. This is a first-order issue: few individuals have an account inSwitzerland with their own personal address; most Swiss bank clients use intermediate wealth-holdingstructures (see Section III.B. below).
10

by households. If a French saver opens an account in the name of a shell company
incorporated in Panama, the SNB assigns the funds to Panama. Using sham corporations
as nominal owners of Swiss accounts has a long tradition, dating back to at least the end
of the Second World War (Schaufelbuehl, 2009). Once you understand the purposes that
sham corporations serve, it becomes clear that most fiduciary deposits assigned to tax
havens by the SNB belong to residents of rich countries, in particular to Europeans.
A sham corporation adds a layer of secrecy between the owner of a Swiss account
and his holdings, making it harder for tax authorities to investigate cases of tax evasion.
When tax evaders combine numerous sham corporations in multiple tax havens, foreign
authorities have practically no way to find out who is the beneficial owner of a Swiss
account. Sham corporations are less useful to residents of countries where there is no
income tax or where tax administrations have no resources to investigate offshore tax
evasion. Sham corporations also help Europeans evade taxes. The European Union has
adopted the Savings Directive in a move to curb tax evasion: since 2005, Swiss and other
offshore banks must withhold a tax on interest earned by European Union residents.12
But the Directive only applies to accounts opened by European households in their own
name; sham corporations are a straightforward way of eschewing it.
Figure III shows that there is a clear negative correlation between the share of fiduciary
deposits held by Europeans and the share of fiduciary deposits assigned to tax havens.
European depositors have shifted their deposits to sham corporations over time. They
reacted particularly strongly to the introduction of the EU Savings Directive in July 2005:
between December 2004 and December 2005, Europe’s share of Swiss fiduciary deposits
declined by 10 percentage points while tax havens gained 8 percentage points.13 Zaki
(2010, p. 54) documents how Swiss bankers created sham corporations on a large scale
during the summer of 2005 to help their European clients circumvent the Directive.
The U.S. Internal Revenue Service (IRS) provides additional evidence that rich coun-
tries’ residents use sham corporations extensively. In 2009, the IRS released case studies12In July 2011, the tax rate was set at 35%. Tax havens keep one-quarter of the tax revenue and
transfer the remaining three-quarters to the European country where the account owner is resident. Thiswithholding tax allows tax havens to avoid automatic exchange of bank information, the EU standard.
13See Johannesen (2010) for an analysis of the reaction of Swiss bank deposits to the Directive.
11

of tax evasion by U.S. residents in a big Swiss bank.14 In almost all cases, U.S. tax evaders
owned their accounts through sham entities incorporated in Panama, the British Virgin
Islands, and Hong Kong. Many of them had transferred their accounts to shell companies
in the 1990s or 2000s. In many IRS cases, the sums involved are huge, attaining $100
million for a single family in a single bank.
Let’s assume that in 2004, before the EU Savings Directive, if a country owned 10%
of the fiduciary deposits not assigned to tax havens, it also owned 10% of the deposits
assigned to tax havens. Let’s also assume that Gulf countries do not use sham corpo-
rations, which is plausible since they have no capital income tax. Then the rich world
owned 62% of Swiss fiduciary deposits in 2004.15 Contrary to popular belief, there is no
indication that African dictators or rich Asian investors own the bulk of Swiss accounts.
IV. An Estimate of the Global Offshore Wealth
Switzerland is not the only tax haven that offers wealth management services to foreign
individuals. Just like in Switzerland, banks incorporated in the Bahamas, Singapore, and
other havens with strict bank secrecy rules attract foreign individuals and provide them
with similar private banking services – securities custody and investment advice.16 The
goal of this Section is to present a novel method to estimate the amount of wealth held
by individuals through all the world’s tax havens. The method is independent from the
official Swiss statistics, which will enable us to check its results against the Swiss data.
IV.A. Using Anomalies in Countries’ Portfolio Securities Data
The method exploits the anomalies that the personal wealth management activities of
tax havens cause in the portfolio data of countries. Take the typical investment revealed14http://www.irs.gov/uac/Offshore-Tax-Avoidance-and-IRS-Compliance-Efforts.15See Appendix, Table A26.16The testimony of a former Cayman banker can be read in U.S. Senate (2001). Many of the large
global banks have subsidiaries with private wealth management activities in Hong Kong, the CaymanIslands, and so on. Based on interviews with offshore wealth managers, the Boston Consulting Group(2009) estimates that about a third of the global offshore wealth is in Switzerland; 20% in Jersey,Guernsey, and Ireland; 20% in the Caribbean and the U.S.; 15% in Luxembourg; 10% in Singapore andHong Kong.
12

by the Swiss data: French residents who own Luxembourg fund shares through their
Swiss accounts. (In turn, the Luxembourg funds invest in U.S. bonds, German equities,
and so on, but forget about the investments made by the funds: they are irrelevant for
the argument). These fund shares should be recorded as portfolio assets for France and
liabilities for Luxembourg.17 In practice, France has no way to record assets. Luxembourg
statisticians duly record portfolio liabilities – they are aware that foreigners own shares of
domestic funds.18 And Switzerland rightly records nothing on its balance sheet. Portfolio
liabilities are bound to exceed assets globally.
The same argument applies when you replace France by any country i whose house-
holds use tax havens (say the U.S.), Switzerland by any tax haven k that hosts personal
wealth management activities (say the Bahamas), and Luxembourg by any country j
that attracts investments or where a lot of mutual funds are incorporated (say the U.K.).
Denote Lj the portfolio liabilities of country j, Aij the true assets of country i on country
j, and Aij statisticians’ estimates. Because of the personal wealth management activ-
ities of tax havens, there will be a fundamental anomaly in the portfolio stock data of
countries:
Anomaly 1: More cross-border portfolio liabilities ∑j Lj than assets ∑j∑i Aij willbe recorded at the global level.
Corollary of Anomaly 1: For the countries j in which holders of offshore accounts
invest, debtor-reported portfolio liabilities Lj will be greater than creditor-derived liabilities∑i Aij.
Tax havens also cause anomalies in flow data. First, statisticians usually compute
dividends and interest income by applying representative yields to stock positions, be-17In international investment statistics, mutual funds are treated as regular corporations, they are
never made transparent. All mutual fund shares are classified as a type of portfolio equities (even theshares issued by mutual funds that only invest in bonds). This statistical convention can be seen asbizarre, but it is uniformly applied across the world. To clarify matters, I keep the word “equity” forregular portfolio equities and distinguish equities from fund shares.
18Note that the investments made by Luxembourg funds are also duly recorded: U.S. equities purchasedby the funds will be recorded as portfolio assets for Luxembourg and liabilities for the U.S. Further,imagine that the funds in Luxembourg are in fact affiliates of German financial companies. In top ofeverything else, Luxembourg will record a direct investment liability and Germany an asset. The valueof the direct investment will be the residual net worth of the funds (e.g., the value of the funds’ offices),which is very small compared to the funds’ gross portfolio assets and liabilities. Any error here does notaffect the argument.
13

cause observed positions are considered more reliable than flows.19 If some securities are
missing from the stocks, then Anomaly 2 follows:
Anomaly 2: More cross-border dividends and interest will be paid than received
globally.
In addition, offshore banks do not only provide custody but also brokerage services:
they buy and sell securities on behalf of their clients. Take a U.S. individual who purchases
U.K. equities from her account in the Bahamas. In principle, Bahamian statisticians will
notice that the buyer is not a resident of the Bahamas, so in keeping with the residence
principle they will not record any equity purchase.20 The U.K., by contrast, will duly
record a sale.
Anomaly 3: When offshore account holders are net purchasers of securities, more
securities are sold than purchased globally. (And more securities are purchased than sold
when offshore account holders are net sellers).
Transfers of funds to tax havens can also cause anomalies. Take a U.S. saver who wires
funds to the Bahamas. Following the double-entry bookkeeping system used in balance
of payments accounting, such a transfer must be recorded twice in the U.S.: both as
an other investment credit (funds flow from a U.S. bank to a Bahamian bank) and an
other investment debit (a U.S. person purchases a foreign asset, namely a Bahamian
bank deposit).21 In practice, a credit will be recorded but a debit will not, thus causing
negative net errors and omissions in the U.S.22
U.S. savers can also purchase securities from their onshore accounts and then entrust
them to offshore banks for custody. In this case, U.S. portfolio investment flow data will be
accurate but the positions will not: there will be negative other changes in the statistics
that reconcile flows and stocks as per the identity ∆Stocks = Flows + V aluation +
OtherChange.19See for instance BEA (2011, p. 42) in the case of the U.S.20A practical reason why they will indeed not record a purchase is that transaction data are increasingly
inferred from variations in observed positions – and statisticians do establish positions in keeping withthe residence principle, as the Swiss data exemplify.
21In the financial account of the balance of payments, credits denote a reduction in assets or an increasein liabilities, while debits denote an increase in assets or a reduction in liabilities.
22See Appendix D.4.2 for a detailed analysis.
14

Anomaly 4: In individual countries’ statistics, some transfers of funds to tax havens
cause net errors and omissions and flow-stock discrepancies.
But tax evaders can also carry banknotes, gold, and diamonds overseas. Such transfers
will go fully unrecorded in U.S. international accounts, and thus will not cause any
anomalies. Funds legally earned are unlikely to be massively transferred this way but
funds illegally earned may well be.
We can use Anomaly 1 to compute the value of the assets globally held unrecorded
by households in all the world’s havens provided we make two assumptions. On the asset
side, we need to assume that the securities held by direct reporters (such as financial
corporations and governments) and those held onshore by households are well measured
globally (H1). Second, the global amount of recorded portfolio liabilities must be accurate
(H2). Under these assumptions, the global gap between identifiable portfolio liabilities
and assets captures the value of the portfolios held by households through all tax havens.
In this paper, my estimate of the unrecorded wealth in all tax havens is equal to the
difference between globally identifiable portfolio liabilities and assets.
At first glance, this estimation method might seem trivial and crude. It is neither.
It requires quite a lot of data, some of which have become available only recently and
are assembled here for the first time. More importantly, although assumptions (H1) and
(H2) are not fully verified in practice, they are reasonable starting points and the results
are robust to relaxing them.
Leaving aside household offshore wealth, portfolio positions are indeed considered
quite reliable. Securities markets are highly centralized. Most countries have a long-
standing tradition of monitoring custodians, and custodians observe all the securities
held onshore. There is usually no valuation issue: traded stocks and bonds have readily
available market prices. That is why, in a reference article, Bertaut, Griever, and Tryon
(2006, p. A67) write that: “In general, the data on U.S. liabilities are considered to be
reasonably comprehensive [my assumption H2 in the U.S. case], as debt instruments tend
to be issued by and bought or sold through large institutions that can be fairly readily
identified and included in the data reporting network. U.S. foreign assets held by or
15

through large U.S. institutions should also be well recorded [H1].”23
The relatively good quality of portfolio stock data extends to other leading countries.
In response to a number of reports (IMF, 1987; 1992), the IMF launched in the 1990s
a program to harmonize collection methods and spread best practices across the world
(IMF, 2002). Since 2008, in all leading economies portfolio asset data have been based on
security-by-security surveys. These surveys collect information at the level of individual
securities, allowing for extensive cross-checking and error spotting.
Some issues do remain. But as we will see, they are minor for the paper’s results.
What they simply mean is that my method to compute the wealth in all the world’s
havens can only give an order of magnitude – not an exact figure as in the Swiss case.
IV.B. Data on Countries’ Aggregate Portfolio Securities
To compute the value of the global offshore portfolio using Anomaly 1, we need aggregate
portfolio securities asset and liability figures for all countries. The key source is the August
2009 updated and extended version of the External Wealth of Nations dataset constructed
by Lane and Milesi-Ferretti (2007), which covers 178 economies. In the database, portfolio
position data come from published IIPs or in minor cases are derived by cumulating flows
and adjusting for valuation effects.24
There are three data challenges here: the External Wealth of Nations does not include
data for all the world’s territories; I want to include the securities held by central banks
(which are classified as “reserves”) in my portfolio assets total; and there are uncertainties
on the holdings of Middle Eastern oil exporters. To address these challenges, many studies
exist to rely on, drawing on independent sources. By construction, my figures are in line
with these studies, which makes me confident in their accuracy. When uncertainties
remain, they can be quantified and they are small compared to my estimate of the global23The authors then go on by describing the problem in which we are precisely interested in this pa-
per: “However, for smaller U.S. investors, directly purchasing foreign securities abroad without usingthe services of a large, U.S.-resident institution is increasingly easy. Such acquisitions will not be cap-tured in the U.S. recording system but will most likely be recorded as liabilities by the counterpartycountry’s measurement system. Because all countries face this problem, cross-border assets are probablyundercounted worldwide.”
24Starting in 2001, the portfolio data for almost all the largest economies and financial centers comefrom published IIPs. That is why I only use post-2001 data in this research.
16

offshore wealth.
First, filling in the coverage gaps in the External Wealth of Nations database does
not pose major difficulties. The only significant country not covered is the Cayman
Islands, a large financial center where about 10,000 hedge funds are incorporated.25 But
the Cayman Islands’ Monetary Authority has been publishing data on the holdings of
Cayman hedge funds since 2006. Based on this information, I reckon that the Cayman
Islands had about $1.25tr in portfolio assets at the end of 2008, of which about $700bn
were U.S. equities and bonds.26
Second, most countries disclose to the IMF what fractions of their reserves are held in
the form of bank deposits versus bonds and other securities.27 Notable exceptions include
China and Taiwan. On average, central banks invest 75% of their assets in securities and
25% in bank deposits; I assume that the same holds true for those countries that do
not provide data. However, Wooldridge (2006) suggests that the share of securities is
probably higher in China, so I assume a 85% securities share for China. There is a $100-
200bn uncertainty on China’s portfolio and a 30$bn uncertainty on Taiwan’s.28 This is
negligible compared to my estimate of the global offshore wealth ($4,500bn in 2008).
Lastly, little public information exists about oil exporters’ holdings. In principle, one
could use counterpart country data – such as the Treasury survey of U.S. portfolio liabili-
ties – to capture oil exporters’ assets. But oil exporters sometimes invest abroad through
offshore banks; the U.S. securities that they hold through Swiss banks will wrongly be
attributed by the U.S. to Switzerland.
To estimate oil exporters’ onshore assets, I start with their holdings of U.S. securities
as recorded in the Treasury liabilities survey. I then make assumptions regarding the
share of U.S. securities in their portfolio. The many studies recently published on the25For the other countries not covered, see Appendix Sections B.3 and B.4.26Although there remains some uncertainty on the holdings of Cayman hedge funds, this does not
affect my estimate of household offshore wealth, because I use the same method to compute the CaymanIslands’ assets as to compute its liabilities. If my assets estimate is $200bn too small, then my liabilitiesestimate is also $200bn too small, leaving the global assets-liabilities gap unchanged. See Sections A.2and B.3.1 of the Appendix for more details on the Cayman Islands.
27The two key sources here are the IMF Special Data Dissemination Standard and an IMF survey ofsecurities held as reserve assets, called SEFER.
28See Appendix Sections A.4 (China) and A.6.2 (Taiwan and other non-SEFER reporters).
17

subject share two conclusions: the U.S. share is high and it has declined in the 2000s.
The assumption for 2001 of a 70% share of U.S. assets and a regular decline of two
percentage points per year fits the available estimates best. To simplify matters, I do
not try to specifically estimate the value of oil exporters’ offshore assets; I include these
in my globally unrecorded offshore wealth total. Although some uncertainties remain,
available studies, official sources, and Swiss statistics suggest that oil exporters account
for about 10% of my estimated total offshore wealth Ω.29
IV.C. The Global Portfolio Assets-Liabilities Gap
Exploiting the global database, Figure IV reveals a first striking result: each year, less
securities assets than liabilities are identifiable worldwide. In 2008, liabilities ∑i Li equal$40tr, while assets ∑i Ai reach $35.5tr only. There is a $4.5tr gap Ω = ∑i Li −∑i Ai.(Note that selecting 2008 as the benchmark year tends to understate the absolute size of
unrecorded claims given the collapse in world equity prices after the Lehman Brothers
bankruptcy). Each year, more than 10% of all cross-border equities and bonds have
unknown owners. Figures V and VI plot the discrepancy for equities (including fund
shares) and bonds separately. 20% of all cross-border equities and fund shares have no
identifiable owners; bonds are less affected.
Table III compares the portfolios that have no readily identifiable owners globally
(Ω) with the offshore portfolios in Swiss banks (Ωs), as of the end of 2008. Both look
strikingly the same, although they rely on fully independent data. In each case, equities
including fund shares account for two thirds, bonds for one third. (And as we will see
below, most of the globally missing equities are actually mutual fund shares, just like
most of the equities held through Swiss offshore accounts). This fact suggests that the
global portfolio assets-liabilities gap does reflect the assets held by households through
tax havens. One third of the global missing wealth (Ω =$4,490bn) can be traced back to
Switzerland (Ωs =$1,545bn), a finding consistent with industry reports estimating that
about a third of the world’s offshore wealth is in Switzerland (e.g., Boston Consulting29Section A.5 of the Appendix provides a thorough discussion of oil exporters.
18

Group, 2009).
At end 2008, the global net financial wealth of households – households’ bank deposits,
equities, bonds, and insurance contracts, net of debts – was about $74tr.30 By my
estimate, individuals held unrecorded portfolios worth Ω=$4.5tr in tax havens – that
is, about 6% of their net financial wealth.
In tax havens households not only own portfolio securities but also bank deposits.
Contrary to what happens for portfolios, offshore deposits do not go completely un-
recorded in the international statistics. The major financial centers tell the Bank for
International Settlements (BIS) how much deposits foreigners have placed in their banks.
In principle, French statisticians can use the BIS data to estimate the value of French
residents’ offshore bank deposits, which will then be recorded in France’s IIP as “other
assets.” The IMF has been advocating the use of the BIS data by national agencies since
the 1990s. Not all countries do so, however, and the BIS does not separate out corporate
from household deposits.
In order to give a rough estimate of the global amount of household offshore wealth, I
assume in the first column of Table III that 25% of it takes the form of deposits and 75%
of securities, as is the case in Switzerland. In 2008, global offshore wealth then amounts
to $4.5tr (securities) plus $1.4tr (deposits). The resulting $5.9tr total represents 8% of
household financial wealth. Of this 8%, at most 2% (deposits) are recorded as assets in
countries’ IIPs.31
While this paper is the first in the academic literature to estimate the personal wealth
held in tax havens, a number of studies have provided estimates before. The most detailed
industry report puts the amount of household offshore wealth at $6.7tr in 2008 (Boston
Consulting Group, 2009, p. 31). Cap Gemini and Merrill Lynch (2002, p. 11) put it30This figure comes from the work of Davies et al. (2011) who provide the first comprehensive estimate
of the level and distribution of world wealth in 2000 based on an exhaustive exploitation of availablenational balance sheets. A report by Credit Suisse (2010) builds on the methodology developed by Davieset al. (2011) to provide yearly estimates for the 2000-2010 period, and finds $74tr for 2008.
31Deposits are only partially recorded, because not all statisticians use the BIS data as inputs totheir IIPs. And more importantly, the BIS data under-estimate the offshore deposits of rich countries’households, because they do not see through the intermediate wealth-holding structures that the ownersof offshore accounts use. The Swiss bank deposits held by French savers through sham Panamaniancorporations are assigned to Panama in the BIS data. This is a first-order concern (see Section III.B).
19

at $8.5tr in 2002. The Tax Justice Network (2005) has a $11.5tr figure for 2005 and
Palan, Murphy, and Chavagneux (2010, p. 5) write that “the global rich held in 2007
approximately $12 trillion of their wealth in tax havens.” My estimate, $5.9tr in 2008, is
therefore at the low-end of the scale. Note that I focus on financial wealth only, whereas
households can also use tax havens for works of art and real estate.32
V. Consistency and Robustness Checks
My method to estimate the personal wealth globally held offshore is indirect, and as
such subject to a margin of error. Future statistical improvements will make it possible
to refine my estimate. In the meantime, this Section provides evidence that the order
of magnitude I find is correct, robust to relaxing the key estimation assumptions, and
consistent with independent flow data.
V.A. Using Bilateral Assets Data to Decompose the Assets-Liabilities Gap
A basic objection to my estimation procedure is that the global portfolio assets-liabilities
gap may reflect data deficiencies unrelated to tax havens. How can we be reasonably
sure that it mostly reflects household offshore portfolios? Because of one key reason: the
wealth does not vanish randomly, but following a specific pattern that closely mirrors
what the independent Swiss data show.
To make this point, I use bilateral portfolio assets data to decompose the global
portfolio assets-liabilities gap Ω and investigate its source. The main data source is the
Coordinated Portfolio Investment Survey (CPIS), conducted under the auspices of the
IMF on a yearly basis since 2001. I use the 2008 wave of the survey, which presents the
bilateral portfolio holdings Aij of 74 countries on 238 debtors. The CPIS is rounded out
by a survey of securities held as reserve assets and by international organizations.
In its early years, the CPIS had important shortcomings. Initially, only 7 of the32Whether these elements can explain the difference between my estimate and previous studies is a
question that I leave for future research. Cross-border real estate, in particular, is an important assetclass for households. I also disregard the wealth of individuals who live in tax havens.
20

countries surveyed by the IMF conducted the security-by-security surveys required to
accurately measure bilateral portfolio holdings. The majority of the entries in the CPIS
were estimated by participating countries on the basis of ad hoc methods. Over the
years, progress was made. In 2008, most leading economies conducted security-by-security
surveys, including the U.S., the entire eurozone, and Japan. For these countries, the
geographical allocation of assets is likely to be very accurate.33 Some problems still
remain. The U.S., for instance, does not currently count short positions as negative
assets, so reported figures are slightly too high. There are some valuation issues: when
partial repayment of a debt security is possible, as is the case for asset-backed securities,
some custodians keep track of the original principal, others only of what is remaining.
But as Section V.B. will show, these shortcomings cannot affect the main conclusions I
draw from the analysis of the CPIS data.
To analyze the source of the global gap Ω we need bilateral portfolio assets data
for all countries. I have therefore filled in the coverage gaps in the CPIS. This is not
problematic, because the CPIS has a very good coverage rate: it captures 86% of all cross-
border securities in 2008.34 All the leading industrial countries and the large financial
centers participate – although the Cayman Islands only reports on its banks’ portfolio
holdings, disregarding its large hedge fund industry. To reach a 98-99% coverage rate,
we only need to add data on four non-reporters: China, Middle Eastern oil exporters,
Taiwan, and the Cayman Islands’ hedge funds. We have reasonably good information
about the investments these non-reporters make: we know that they invest in the U.S.
a lot. To allocate some of the non-U.S. investments of CPIS non-reporters, I employ a
gravity model of portfolio holdings.35 The online Appendix extensively discusses the raw
sources and methods used to fill in the gaps in the CPIS.
Figure VII decomposes the 2008 global portfolio assets-liabilities gap Ω using the
extended CPIS data. Each dot is equal to the difference between the portfolio liabilities33See for instance Bertaut, Griever, and Tryon (2006, p. A63) in the case of the U.S.34See Appendix Table A1.35As shown by Portes and Rey (2005) and Lane and Milesi-Ferretti (2008), the gravity model fits
cross-border portfolio flow and stock data well. Because I apply the gravity model to less than 5% ofglobal assets, any error introduced by the model has negligible consequences.
21

reported by a country j (Lj) and the sum of the assets on j identifiable worldwide
(∑i Aij). By construction, the dots sum to $4,490bn, the global portfolio gap Ω. For 90%
of the world’s countries, debtor-reported and creditor-derived liabilities match (Lj =∑i Aij). But for the three financial centers that host large mutual fund industries –
Luxembourg, the Cayman Islands, and Ireland – there is a huge discrepancy.36 For
instance, Luxembourg had around Lj=$2tr in equity liabilities at end 2008. Yet only∑i Aij=$1.1tr in equity assets on Luxembourg were identifiable worldwide: about $900bn
of Luxembourg mutual fund shares had no known owner.37 Overall, claims on funds
incorporated in Luxembourg, Ireland, and the Cayman, account for 48% of the globally
missing wealth Ω.
The missing wealth thus follows a clear pattern that mirrors what the Swiss data
showed. We learned in Section III that foreigners own a great deal of Luxembourg and
Irish fund shares through their Swiss accounts (Figure II). We now observe that many
of such fund shares have no identifiable owners globally (Figure VII). Banks all over the
world, and not only in Switzerland, sell Luxembourg and Irish fund shares to their cus-
tomers – simply because a considerable fraction of the world’s mutual funds are incorpo-
rated in these two countries that do not withhold taxes on cross-border payments.38 The
specific pattern of anomalies in Figure VII can thus readily be explained by the fact that
households own fund shares through unrecorded accounts in Switzerland, Singapore, and
the Bahamas. It cannot satisfactorily be explained by other known issues with the data
– including with the 2008 CPIS –, nor by my imputations for non-CPIS participating
countries. There is admittedly some uncertainty on the holdings of China, oil exporters,36These discrepancies have previously been documented by Lane and Milesi-Ferretti (2007) and the
ECB (2009) in the case of Luxembourg and Ireland, and suggested by Lane and Milesi-Ferretti (2011) inthe case of the Cayman Islands, but my paper is the first to provide a consistent explanation for them.Section D.4.6 of the Appendix discusses the preliminary steps taken by the ECB to address the issue.Statistical agencies cannot do much until all tax havens disclose who owns the offshore portfolios in theirbanks (see Section VII).
37Almost 100% of the equity liabilities of Luxembourg, Ireland, and the Cayman are fund shares.38One exception is that not many foreign funds are sold on the U.S. territory, because of restrictions
put by the Investment Company Act of 1940. Statistics gathered by the European Fund and AssetManagement Association (EFAMA) show that Luxembourg and Ireland are the two leaders for theincorporation of mutual funds in Europe. At the global level, Luxembourg comes second to the U.S. Butthe U.S. withholds taxes on payments made by domestic funds to foreigners, which explains why in taxhavens individuals own Luxembourg rather than U.S. fund shares.
22

and Taiwan, but no indication that these countries massively invest in Luxembourg and
Irish funds.39
The large amount of missing claims on the Cayman can also be explained by the use of
tax havens by individuals, although the mechanism is slightly different. Most of the funds
incorporated in the Cayman are hedge and private equity funds. Shares of such funds
are usually directly purchased by investors rather than distributed by Swiss and other
banks. Because shares of hedge funds are not entrusted to custodian banks, it is hard for
U.S. statisticians to measure U.S. claims on Cayman funds. At the end of 2008, the U.S.
recorded less than $100bn in equity assets on the Cayman while funds incorporated there
had more than $1tr in foreign equity liabilities.40 In all likelihood a large amount of U.S.
claims went unrecorded. For U.S. savers, directly investing in Cayman hedge funds offers
roughly the same potential tax evasion opportunities as holding Luxembourg fund shares
through Swiss accounts. When filling tax returns, taxpayers can choose to report income
or not, since there is no automatic exchange of information between Cayman funds and
the IRS.41
Why should we care that a considerable amount of Luxembourg, Irish, and Cayman
fund shares have no identifiable owners? Because the funds in turn invest in U.S. equities
and other securities. Since we do not know who owns a large fraction of the world’s
mutual funds, we cannot know who ultimately owns a large fraction of U.S. equities.42
The missing claims on France, Japan, and other rich countries in Figure VII can be
attributed to the fact that through their offshore accounts savers directly invest in French
equities, Japanese bonds, and other securities issued by rich countries.43 Again this would39It makes little sense for central banks or sovereign funds to invest in mutual funds (except in hedge
funds and private equity funds) since they already pay wealth managers to design suitable investmentstrategies. The largest sovereign wealth fund, Norway’s, discloses its portfolio on a security-by-securitybasis: it has virtually no assets on Luxembourg, Ireland, and the Cayman Islands.
40See Department of the Treasury, Federal Reserve Bank of New York, and Board of Governors of theFederal Reserve System (2009, Table 30 p. 68)
41A Foreign Account Tax Compliance Act passed in 2010 seeks to strengthen information reporting.For more information on the taxation of hedge fund investors, see Sheppard (2008). I have no data onwhat fraction of offshore income goes undeclared in tax returns globally. In the U.S., the IRS estimatesthat personal income tax evasion through offshore accounts and hedge funds might cost up to $70bnannually (Gravelle, 2009).
42Along these lines, Section C.2. of the Appendix reckons that at least 15% of U.S. cross-borderportfolio equity liabilities have no identifiable ultimate owner.
43In principle, these anomalies could also be attributed to problems in the 2008 CPIS and in my impu-
23

be congruent with the Swiss data, which showed that households directly own equities
and bonds in addition to their Irish and Luxembourg fund shares.
V.B. How Known Issues with Available Data Affect My Estimate
My estimate that about 6% of household financial wealth is held unrecorded in all the
world’s tax havens relies on two assumptions. First, portfolio asset figures must accurately
reflect the securities held by corporations and governments and those held onshore by
households (H1); second, portfolio liabilities must be accurate (H2). Here I briefly review
the main known issues with countries’ portfolio data and discuss how relaxing the two
assumptions affects the results.
On the asset side, asset-backed securities and short positions are sometimes imper-
fectly recorded – this, however, cannot explain the considerable amount of globally miss-
ing mutual fund shares. The assets surveys of a number of economies also have idiosyn-
cratic weaknesses: in the U.S., some hedge and private equity funds have for a long time
been unaware of their reporting duties; in Singapore, official statistics have traditionally
excluded important semi-official holders of portfolio claims.44 Yet it is unlikely that these
shortcomings play an important role for the 2008 pattern of anomalies identified in Fig-
ure VII. Between 2009 et 2011, both the U.S. and Singapore significantly strengthened
their assets data,45 but this did not affect much the pattern of debtor-reported/creditor-
derived anomalies. In 2011, for instance, Luxembourg reported close to $2.6tr in portfolio
equity liabilities, and this was still considerably larger than the $1.4tr of equity claims
on Luxembourg reported in the CPIS; similarly, Ireland had close to $1.5tr in equity
liabilities and yet CPIS creditors only $0.5tr in assets.46 And despite notable statistical
tations. However, there is no particular reason why these problems should specifically cause anomaliesfor France, Japan, Netherlands, and the U.S., as in Figure VII. Note that France is also one of the lead-ing mutual fund centers in Europe along with Luxembourg and Ireland, and that many multinationalcorporations are headquartered in the Netherlands.
44See Appendix Section A.1.2. In Europe, Germany and Italy traditionally measured portfolio posi-tions by cumulating flows and adjusting for valuation, but security-by-security surveys were introducedrespectively in 2006 and 2008. See Appendix Sections A.1.1 (Germany) and B.2.3 (Italy).
45At the end of 2011, in the frame of the introduction of a new reporting form, the TIC SLT, theFederal Reserve Board significantly expanded its coverage of U.S. hedge and private equity funds (seeSection VI.B below). Singapore integrated semi-official investors in its IIP and CPIS data.
46Note that here I do not attempt to estimate the holdings of non-CPIS reporters, including those ofCayman-based hedge funds.
24

improvements in the U.S., identifiable equity claims on the Cayman remained smaller
than the size of the Cayman fund industry.
A second potential issue has to do with liability figures, which might be overesti-
mated. Take a French person who owns French equities via a Swiss bank. From the
viewpoint of international statistics, these equities are not cross-border claims, but they
will likely be recorded by French statisticians as liabilities for France. In this case, the
use of offshore banks by households does not bias asset data downwards but liability
data upwards. However, such round-tripping does not affect the paper’s argument. Too
much liabilities are recorded globally, and the observed assets-liabilities gap still directly
reflects household offshore portfolios.
Liability figures, on the contrary, may be under-estimated. Take a French saver who
owns U.S. equities via a Swiss bank. U.S. statisticians will not always be able to record
these equities as U.S. liabilities. But these equities will not be recorded on the asset side
of the French IIP either. So accounting for them would both deteriorate the U.S.’s net
foreign asset position and improve France’s by the same amount. The wealth held in tax
havens would be even greater than I have found.
In sum, available aggregate portfolio data do not always verify my two identifica-
tion assumptions. In light of what we know today, however, nothing indicates that my
methodology substantially over- or under-estimates the wealth offshore. While future
improvements in portfolio statistics will make it possible to refine my estimate, there is
no particular reason to expect they could radically affect the order of magnitude I find.
V.C. Consistency Between Flow and Stock Anomalies
A last consistency check comes from the flow data. The global assets-liabilities gap Ω has
its counterpart in the world balance of payments computed by the IMF independently
from the present study. The IMF world balance of payments includes all countries’ reports
plus undisclosed IMF estimates for all non-reporters. It displays two inconsistencies.
First, more investment income is paid than received each year (Anomaly 2). In 2008,
25

the discrepancy amounted to D=$156bn.47 To see how this flow anomaly fits in with
my estimated stock anomaly, denote rΩ the yield on the missing portfolios Ω – that is,
the flow of missing dividends and interest divided by the stock of missing securities. A
missing flow of $156bn implies a yield of rΩ=3.5%, consistent with the average yield on
recorded cross-border securities.48
Second, barring one exception in 1998, there are more securities sold than purchased
globally (Anomaly 3). Again, this anomaly fits in well with the portfolio assets-liabilities
gap Ω. To see why, denote It the net unrecorded purchases of securities, and V ALt
the net capital gains on existing unrecorded portfolios. We can write the change in the
stock of unrecorded portfolios Ω between t − 1 and t as Ωt − Ωt−1 = It + V ALt. Table
IV breaks Ω down as per this equation. A reasonable pattern emerges: steady inflows,
negative valuation effects during equity bear markets, positive valuation effects during
bull markets, and reasonable yields rΩ throughout the period.
One anomaly that is not systematic in the data is “net errors and omissions” in
individual countries’ balances of payments (Anomaly 4). Over the 1970-2004 period,
some countries have exhibited large net errors, such as Italy, Norway, or Russia (Lane
and Milesi-Ferretti, 2007, Table 3 p. 243). But some EU countries and the U.S. have
not. Does that invalidate my results? Not at all, for two reasons. First, transfers of
funds offshore need not systematically cause net errors – carrying banknotes overseas,
granting a loan to a shell offshore company, and receiving wage on an offshore account
will not.49 And conversely, “net errors” reflect many issues unrelated to tax havens –
such as differences in the timing of trade and financial transactions – that make them a
poor indicator of the magnitude of capital flight.47See Appendix Table A21.48See Appendix Table A22.49Section D.4 of the Appendix discusses five concrete case studies of transfers and how they should be
recorded.
26

VI. Implications of Tax Havens for International Imbalances
In 2008, globally identifiable portfolio liabilities exceeded assets by about $4.5tr. The
missing assets must belong to some countries. This Section proposes scenarios as to how
accounting for them affects international imbalances – both stock and flow imbalances,
commonly referred to as “global imbalances.” The scenarios are thought experiments
such as: “What is the true U.S. net foreign asset position if the U.S. owns 20% of the
unrecorded wealth?”; as such, they are speculative. However, a number of qualitative
findings emerge.
VI.A. The Eurozone and the Rich World are Probably Net Creditors
As we have seen, about one-third of the missing assets can readily be attributed to house-
holds with Swiss accounts, and the remaining two-thirds probably belong to households
with accounts in other tax havens. The SNB’s statistics suggest that more than half the
offshore wealth in Switzerland belongs to Europeans. Although we do not know who owns
the offshore wealth in the Cayman Islands and Singapore, surveys of wealth managers
give some direction. For instance, the Boston Consulting Group (2009) estimates that
42% of all offshore wealth belongs to Europeans and 60% to residents of rich countries.
Table V presents scenarios as to how unrecorded assets affect the net position of the
eurozone, officially the world’s second largest net debtor. Accounting for the offshore
wealth in Switzerland alone considerably improves the eurozone’s position. If in addition
the eurozone owns 25% of the offshore portfolios in the world’s other tax havens, then it
is balanced. If it owns 50% of all the unrecorded portfolios, it is in actual facts a sizeable
net creditor. In all plausible scenarios, the eurozone shifts into the black.
Table VI presents similar computations for the U.S. Accounting for unrecorded assets
improves the U.S. net position, albeit by a smaller amount. If U.S. residents own 20% of
all unrecorded wealth – say, 15% of the offshore wealth in Swiss banks and 25% of the
other missing assets – then the net position of the U.S. is significantly better than in the
official data: -12% of GDP on average over 2001-2008 as opposed to -18% in the data.
27

My benchmark scenario where the eurozone owns about half the unrecorded wealth
and the U.S. 20% turns the overall rich world into a net creditor. This result is robust
to alternative assumptions. The rich world shifts into the black as long as it owns more
than half the globally unrecorded assets. Available Swiss data suggest that it is a lower
bound, which is hardly surprising since residents of rich countries own 80% of recorded
world wealth (Davies et al., 2011). Remember also that most of the unrecorded assets are
Luxembourg, Irish, and Cayman fund shares. We have reason to believe that these fund
shares belong in the main to Europeans (especially Luxembourg fund shares) and Ameri-
cans (especially Cayman fund shares).50 Developing countries have offshore accounts too,
but plausibly not more than 30% of all offshore wealth: about 10% for oil exporters and
20% for non-oil developing countries is a reasonable take in light of available evidence.51
Lastly, among rich countries, Japanese residents do not seem to use tax havens exten-
sively – they own less than 1% of Swiss bank deposits – plausibly because capital income
is much less taxed in Japan than in other developed economies.52
VI.B. Implications for Current Account Dynamics
Accounting for tax havens sheds light on the true size of debtor and creditor positions:
the eurozone is likely to be a net creditor and the U.S. less indebted than in the official
statistics. Although my methodology focuses on positions rather than transactions, the
results have two implications for the analysis of current accounts dynamics.
First, we know that capturing household offshore portfolios has always been impossi-
ble. Although available data do not enable me to estimate the wealth held unrecorded
before 2001, accounting for the missing assets must improve the pre-2001 net positions50Felettigh and Monti (2008) document that about half the foreign equity holdings recorded by Italy
are in Luxembourg funds. The ECB (2009) considers that most of the missing assets on Luxembourgand Ireland probably belong to eurozone residents. Lane and Milesi-Ferretti (2007) document that Irishstatisticians recorded five times more U.S. investments in Irish equities than U.S. statisticians did in2004, so U.S. residents may own a significant fraction of the missing claims on Ireland.
51The hypothesis that Middle Eastern oil exporters own 10% of the globally unrecorded portfolios Ωimplies total portfolio holdings for Middle Eastern countries well in line with the literature, see AppendixTable A8. Middle Eastern countries own 10% of Swiss bank deposits and non-oil developing countries25%, see Appendix Table A26.
52In 2005, the OECD reports that the net personal tax rate on dividends was 22% in Germany, 32%in France, as opposed to 10% in Japan, and 18% in the United States.
28

of Europe and the U.S. The rich world was therefore probably a sizeable net creditor in
the 1980s and 1990s (Figure I). Now, if the rich world starts from a positive position in
the mid-1990s, then poor-to-rich flows are a factor of convergence rather than divergence
in the external positions of countries: developing countries are simply repaying their
debts to advanced economies, as if output convergence was accompanied by net exter-
nal wealth convergence. Although this is not necessarily what theory predicts – many
open-economy models do not have clear-cut predictions on steady-state net foreign asset
positions, and in standard models one can have persistent inequalities in net wealth even
if output converges –, it seems important to keep this possibility in mind when analyzing
the determinants of current account imbalances and the risks involved.
A second implication of my findings is that some of the most egregious inconsistencies
between financial flow and stock data, both in Europe and the U.S., may be related to
tax havens.
Consider households moving portfolio securities to offshore accounts. The securities
leave the radar of domestic statistical systems. This tends to make recorded portfolio
positions smaller than cumulated past financial flows adjusted for valuation changes. Such
capital flight probably explains in part why the eurozone’s net international position has
deteriorated from about zero in 1985 to -14% of GDP in 2011, despite zero current account
deficit. A case in point is the dramatic evolution of Ireland’s net international position
during the crisis, from about -20% of GDP in 2007 to -100% in 2010. This development
cannot satisfactorily be explained by financial flows and valuation losses (Lane, 2011).
Capital flight in the midst of the eurozone crisis has probably played a significant role.
Conversely, statisticians sometimes improve their coverage of the wealth held in tax
havens. The U.S., in particular, keeps discovering new portfolio assets from year to year
(Curcuru, Dvorak, and Warnock, 2008; Lane and Milesi-Ferretti, 2009). These discoveries
partly reflect an improvement in the coverage of U.S. corporations’ offshore assets. One
prominent example is the 2011 U.S. portfolio asset survey which significantly improved the
coverage of the Cayman hedge fund shares held by U.S. companies: the 2011 survey found
close to $500bn in Cayman equity assets, three times the 2010 level. Such improvements
29

partly explain why the deterioration of the U.S. position has been much smaller than U.S.
borrowing and valuation effects would suggest, a puzzle that has attracted considerable
attention since the work of Gourinchas and Rey (2007b). The results of the 2011 U.S.
survey may be pointing to a gradual reduction in the total amount of unrecorded wealth,
as it identified some $500bn in previously unreported holdings.53 But a lot of wealth
clearly remains to be discovered globally: the U.S. still does not attempt to capture
households’ offshore portfolios, and in other countries such as Ireland, new waves of
capital flight seem to vastly exceed discoveries of previously unreported assets.
VI.C. Remaining Anomalies in International Statistics
The failure to record the personal wealth in tax havens is certainly not the only issue in
the investment statistics of countries. Could other errors in the data offset the improve-
ment in rich countries’ IIP resulting from accounting for households’ offshore wealth?
There is one necessary (though not sufficient) condition for countries’ IIP to be accurate:
globally, recorded claims should match liabilities. Here I briefly discuss scenarios where
this condition is verified.
Accounting for tax havens can entirely solve the global assets-liabilities discrepancy
for one category of claims: portfolio investments. It can also explain why more investment
income is paid than received, which is the key driver of the current account deficit that
the world has tended to run up (Motala, 1997). Two anomalies remain, however. First,
contrary to the phenomenon found for portfolio securities, for foreign direct investments,
slightly more assets can be identified than liabilities (Lane and Milesi-Ferretti, 2007,
Figure 2 p. 232). Second, in a spectacular reversal of past trends, the world started
running up a current account surplus in 2004. The surplus has been driven by the trade
balance: since 2004, recorded exports have exceeded imports significantly (Figure VIII).
Although there is no reason why the FDI and trade anomalies should be linked with
household offshore assets, a brief discussion of their likely sources is in order.
FDI data raise huge challenges. Direct investments are decentralized, unlike portfolio53See Department of the Treasury, Federal Reserve Bank of New York, and Board of Governors of the
Federal Reserve System (2012, Table 4 p. 7).
30

holdings. Statisticians have only recently started spreading best practices and harmoniz-
ing data across countries by means of a Coordinated Direct Investment Survey conducted
for the first time in 2009. Most importantly, direct investments have no observable mar-
ket value, because they do not usually take the form of traded securities. Developing
countries compile FDI statistics on a book value basis, while most rich countries try to
infer market values based on the market prices of portfolio investments. Because asset
prices rose more in developing than in rich countries in the 2000s, much of the direct
investment discrepancy may come from the fact that the book values recorded by the
developing countries for their direct investment liabilities are too low. The developing
world may be more indebted than we think.
The trade discrepancy also likely comes from errors in developing countries’ statistics.
There is no particular reason to believe that exports are overestimated in rich countries.
In fact, the U.S. Census Bureau (1998) has argued that U.S. goods exports have tended
to be systematically underestimated, by as much as 10%. In contrast, there is substan-
tial evidence that the developing world underestimates its imports: Fisman and Wei
(2004) show that China’s imports from Hong Kong are systematically under-reported for
tax reasons. Now, developing countries’ IIPs are still mostly compiled by cumulating
current account flows (in particular for the “other assets” category). If developing coun-
tries’ current account balances are overestimated, then their net foreign assets are also
overestimated. Once again, the developing world may be more indebted than we think.
If the FDI and trade discrepancies are due purely to errors in developing countries’
statistics, then they do not affect the results of this paper: when the world IIP is purged
of all its errors, the rich world and the eurozone are net creditors, and the developing
world a net debtor. If each country contributes to the FDI and trade discrepancies in
proportion to the size of its international balance sheet – a worst case scenario given the
available evidence – the central conclusions of this paper still hold. The eurozone remains
a net creditor – albeit smaller – and the rich world is roughly balanced.54
As a final word of caution, it is worth remembering that in top of the FDI and trade54See Appendix Tables A31-A32. Appendix Table A30 provides a line-by-line reconciliation of Ω with
the world net foreign asset discrepancy (the world’s puzzling net debt).
31

issues, there are substantial uncertainties on cross-border holdings of real estate, which
in many countries are insufficiently captured or even not at all. Curcuru, Thomas, and
Warnock (2009) estimate that on net real estate increased U.S. liabilities of $565bn in
2007. Emerging economies might own a substantial fraction of foreign-owned U.S. and
European real estate and miss these holdings in their statistics. Further studies are called
for on this important issue to improve estimates of the debtor and creditor positions of
leading economies.
VII. Conclusion: Two Proposals to Improve Official Statistics
This paper takes a serious look at the enormous challenges that the personal wealth
management activities of tax havens pose for international data. The main finding is
that around 8% of the global financial wealth of households is held in tax havens, three-
quarters of which goes unrecorded. Available evidence suggests that offshore assets belong
in the main to residents of rich countries, in particular to Europeans. On the basis of
plausible assumptions, accounting for the wealth in tax havens turns the eurozone into
a net international creditor and significantly improves the U.S. net position. Contrary
to conventional wisdom that views Europe and the U.S. as severely indebted economies,
the rich world is still overall likely to be a net creditor. Much of the literature on global
imbalances has been preoccupied with major divergence trends in current accounts and
net positions that could ultimately cause a sharp drop in the dollar and recessions in
rich countries. My results suggest that poor-to-rich capital flows may be a factor of
convergence rather than divergence in the net foreign asset positions of countries.
Accurate foreign asset data are crucial to many research and policy issues. They form
a key input for the analysis of patterns in capital flows. Countries with high recorded
net foreign debt are labelled high risk, which has direct consequences on their borrowing
terms and increases the chances of disorderedly adjustments. Better investment data
would improve our ability to track fundamental aspects of globalization and to monitor
financial stability. All of this calls for changes to be made to the way data are compiled.
32

Two simple reforms would make for substantial improvements. First, statistics show-
ing that 60% of Swiss deposits are owned by a small set of unpopulated tax havens are
unhelpful. Cross-border banking data on the household sector should be compiled on a
beneficial ownership basis. A bank deposit owned in Switzerland by a French individual
through a sham Panamanian corporation should not be recorded as a Panamanian but as
a French deposit. The key principle of anti-money laundering regulations is that bankers
need to know at all times who are the beneficial owners of the funds they manage, even
if they are held via a long chain of intermediate entities. Banks should be asked to use
this information to compile cross-border banking data on the household sector. It would
not require much extra work, since the information already exists within the banks.
Second, countries should exchange data on portfolio securities held offshore by house-
holds. All international financial centers should report to the Bank for International
Settlements on the value of the securities held in custody by foreign residents in their
banks – just as they do today for bank deposits. Custodial surveys have a long history
and they do not raise any great practical problems. The reform would not violate any
bank secrecy provisions. But it would only work if custodial holding data were also
established on a beneficial ownership basis.
The combination of both reforms would enable statisticians to fill in long-standing
gaps in portfolio investment data. As this paper has argued, this would radically change
the international investment positions of rich countries.
A third source can be used as input to the statistics on the external positions of coun-
tries: tax data. These data would be reliable if offshore financial institutions exchanged
information with foreign tax authorities on an automatic basis. Since the beginning of the
financial crisis, and under G20 pressure, a number of tax havens have started exchanging
bank information with foreign countries. But they only provide information “upon re-
quest:” in practice, the amount of information exchanged remains negligible (Johannesen
and Zucman, 2013). Absent automatic information exchange, tax data may well remain
an unreliable source to capture the offshore wealth of households.
33

ReferencesM. Aguiar and M. Amador. Growth in the shadow of expropriation. Quarterly Journalof Economics, 126:651–697, 2011.
L. Alfaro, S. Kalemli-Ozcan, and V. Volosovych. Sovereigns, upstream capital flows andglobal imbalances. NBER Working Paper 17396, August 2011.
A. Atkinson, T. Piketty, and E. Saez. Top incomes in the long run of History. Journalof Economic Literature, 49(1):3–71, 2011.
BEA. U.S. International Transactions Accounts. Bureau of Economic Analysis, Wash-ington, D.C., June 2011.
B. Bernanke. The global saving glut and the U.S. current account deficit. SandridgeLecture, Virginia Association of Economics, March 2005.
C. C. Bertaut, W. L. Griever, and R. W. Tryon. Understanding U.S. cross-border secu-rities data. Federal Reserve Bulletin, pages A59–A75, 2006.
O. Blanchard and G. M. Milesi-Ferretti. Global imbalances: In midstream? IMF StaffPosition Note, December 2009.
O. Blanchard, F. Giavazzi, and F. Sa. International investors, the U.S. current account,and the Dollar. Brookings Papers on Economic Activity, 1:1–49, 2005.
Boston Consulting Group. Global wealth report, “Delivering on the client promise”,September 2009.
R. J. Caballero, E. Farhi, and P.-O. Gourinchas. An equilibrium model of “global imbal-ances” and low interest rates. American Economic Review, 98(1):358–393, 2008.
Cap Gemini and Merrill Lynch. World wealth report, 2002.
C. D. Carroll and O. Jeanne. A tractable model of precautionary reserves, net foreignassets, or sovereign wealth funds. NBER Working Paper 15228, August 2009.
R. H. Clarida, editor. G7 Current Account Imbalances: Sustainability and Adjustment.University of Chicago Press, May 2007.
Credit Suisse. Global wealth report, October 2010.
S. E. Curcuru, T. Dvorak, and F. E. Warnock. Cross-border returns differentials. Quar-terly Journal of Economics, 123(4):1495–1530, November 2008.
S. E. Curcuru, C. P. Thomas, and F. E. Warnock. Current account sustainability and rel-ative reliability. In J. Frankel and C. Pissarides, editors, NBER International Seminarson Macroeconomics 2008. University of Chicago Press, 2009.
J. B. Davies, S. Sandström, A. Shorrocks, and E. N. Wolff. The level and distribution ofglobal household wealth. Economic Journal, 121(551):223–254, March 2011.
34

F. Dell, T. Piketty, and E. Saez. Income and wealth concentration in Switzerland over the20th century. In A. Atkinson and T. Piketty, editors, Top income over the twentiethcentury: A contrast between continental european and english-speaking countires, pages472–500. Oxford University Press, 2007.
Department of the Treasury, Federal Reserve Bank of New York, and Board of Governorsof the Federal Reserve System. Report on U.S. portfolio holdings of foreign securitiesas of December 31, 2008, October 2009.
Department of the Treasury, Federal Reserve Bank of New York, and Board of Governorsof the Federal Reserve System. Report on U.S. portfolio holdings of foreign securitiesas of December 31, 2011, October 2012.
D. Dollar and A. Kraay. Neither a borrower nor a lender: Does China’s zero net foreignasset position make economic sense? Journal of Monetary Economics, 53:943–971,2006.
M. P. Dooley, D. Folkerts-Landau, and P. Garber. An essay on the revived BrettonWoods system. NBER Working Paper 9971, September 2003.
ECB. Task force on portfolio investment collection systems, final report. Technical report,European Central Bank, June 2002.
ECB. Methodoligcal changes in the compilation of the euro area balance of payments andinternational investment position. Technical report, European Central Bank, 2009.
C. Engel and J. H. Rogers. The U.S. current account deficit and the expected share ofworld output. Journal of Monetary Economics, 53:1063–1093, 2006.
A. Felettigh and P. Monti. How to interpret the CPIS data on the distribution of for-eign portfolio assets in the presence of sizeable cross-border positions in mutual funds.Evidence for Italy and the main euro-area countries. Banca d’Italia Occasional Paper,August 2008.
R. Fisman and S.-J. Wei. Tax rates and tax evasion: Evidence from “missing imports”in China. Journal of Political Economy, 112(2):471–496, 2004.
I. Gest and A. Dajean. Les placements en valeurs mobilières des agents économiques auquatrième trimestre 2004. Bulletin de la Banque de France, 136, Avril 2005.
P.-O. Gourinchas and H. Rey. International financial adjustment. Journal of PoliticalEconomy, 115(4):665–703, 2007a.
P.-O. Gourinchas and H. Rey. From world banker to world venture capitalist: US externaladjustment and the exorbitant privilege. In R. Clarida, editor, G7 Current AccountImbalances: Sustainability and Adjustment. University of Chicago Press, 2007b.
J. G. Gravelle. Tax havens: International tax avoidance and evasion. National TaxJournal, 62(4):727–753, December 2009.
R. Hausmann and F. Sturzenegger. Global imbalances or bad accounting? The miss-ing dark matter in the wealth of nations and its implications for global imbalances.Economic Policy, 22:469–518, July 2007.
35
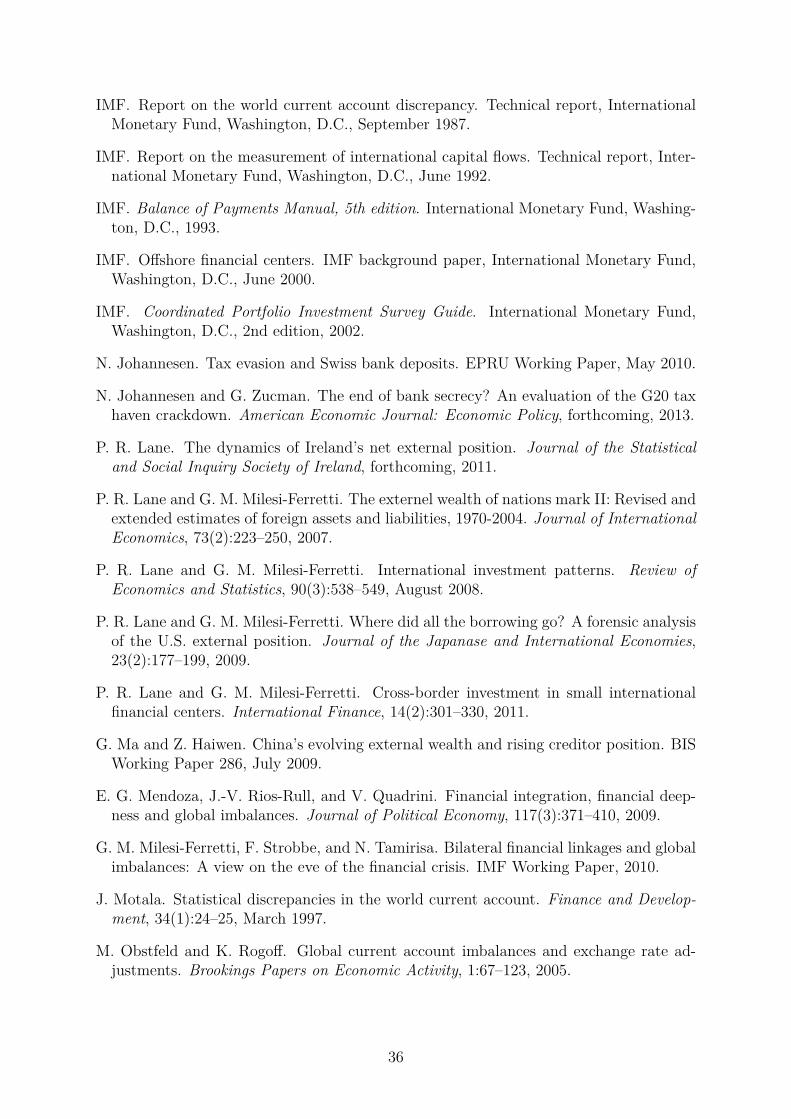
IMF. Report on the world current account discrepancy. Technical report, InternationalMonetary Fund, Washington, D.C., September 1987.
IMF. Report on the measurement of international capital flows. Technical report, Inter-national Monetary Fund, Washington, D.C., June 1992.
IMF. Balance of Payments Manual, 5th edition. International Monetary Fund, Washing-ton, D.C., 1993.
IMF. Offshore financial centers. IMF background paper, International Monetary Fund,Washington, D.C., June 2000.
IMF. Coordinated Portfolio Investment Survey Guide. International Monetary Fund,Washington, D.C., 2nd edition, 2002.
N. Johannesen. Tax evasion and Swiss bank deposits. EPRU Working Paper, May 2010.
N. Johannesen and G. Zucman. The end of bank secrecy? An evaluation of the G20 taxhaven crackdown. American Economic Journal: Economic Policy, forthcoming, 2013.
P. R. Lane. The dynamics of Ireland’s net external position. Journal of the Statisticaland Social Inquiry Society of Ireland, forthcoming, 2011.
P. R. Lane and G. M. Milesi-Ferretti. The externel wealth of nations mark II: Revised andextended estimates of foreign assets and liabilities, 1970-2004. Journal of InternationalEconomics, 73(2):223–250, 2007.
P. R. Lane and G. M. Milesi-Ferretti. International investment patterns. Review ofEconomics and Statistics, 90(3):538–549, August 2008.
P. R. Lane and G. M. Milesi-Ferretti. Where did all the borrowing go? A forensic analysisof the U.S. external position. Journal of the Japanase and International Economies,23(2):177–199, 2009.
P. R. Lane and G. M. Milesi-Ferretti. Cross-border investment in small internationalfinancial centers. International Finance, 14(2):301–330, 2011.
G. Ma and Z. Haiwen. China’s evolving external wealth and rising creditor position. BISWorking Paper 286, July 2009.
E. G. Mendoza, J.-V. Rios-Rull, and V. Quadrini. Financial integration, financial deep-ness and global imbalances. Journal of Political Economy, 117(3):371–410, 2009.
G. M. Milesi-Ferretti, F. Strobbe, and N. Tamirisa. Bilateral financial linkages and globalimbalances: A view on the eve of the financial crisis. IMF Working Paper, 2010.
J. Motala. Statistical discrepancies in the world current account. Finance and Develop-ment, 34(1):24–25, March 1997.
M. Obstfeld and K. Rogoff. Global current account imbalances and exchange rate ad-justments. Brookings Papers on Economic Activity, 1:67–123, 2005.
36

M. Obstfeld, J. C. Shambaugh, and A. M. Taylor. Financial stability, the trilemmaand international reserves. American Economic Journal: Macroeconomics, 2(2):57–94,2010.
R. Palan, R. Murphy, and C. Chavagneux. Tax Havens: How Globalization Really Works.Cornell Studies in Money. Cornell University Press, 2010.
R. Portes and H. Rey. The determinants of cross-border equity flows. Journal of Inter-national Economics, 65:269–296, 2005.
J. Roine and D. Waldenström. Wealth concentration over the path of development: Swe-den, 1873-2005. Scandinavian Journal of Economics, 111(1):151–187, October 2009.
J. M. Schaufelbuehl. La France et la Suisse ou la force du petit. Evasion fiscale, relationscommerciales et financières (1940-1954). Presses de Sciences Po, Paris, 2009.
L. A. Sheppard. Offshore explorations: Caribbean hedge funds, part 1. Tax Notes,page 95, January 7 2008.
Z. Song, K. Storesletten, and F. Zilibotti. Growing like China. American EconomicReview, 101(1):196–233, 2011.
Tax Justice Network. The price of offshore, 2005.
U.S. Census Bureau. Understatement of export merchandise trade data, available onlineat http://www.census.gov/foreign-trade/misc/expunder.html, 1998.
U.S. Senate. Role of U.S. correspondent banking in international money laundering. Hear-ings, Permanent Subcommitee on Investigations of the Committee on GovernmentalAffairs, March 2001.
P. D. Wooldridge. The changing composition of official reserves. BIS Quarterly Review,pages 25–38, September 2006.
M. Zaki. Le secret bancaire est mort, vive l’évasion fiscale ! Favre, Lausanne, 2010.

Figure I: Recorded Net Assets of the Rich World and Estimated Unrecorded Assets Held in Tax Havens
-8%
-6%
-4%
-2%
0%
2%
4%
6%
8%
10%
1985 1990 1995 2000 2005
Net
fore
ign
asse
t pos
ition
s / w
orld
GD
P
Japan
Europe
U.S.A
Rich world (Japan + Europe + U.S.A)
My estimate of households' unrecorded assets held in tax havens
Note: The figure charts the value of unrecorded household assets in tax havens along with the officially recorded net foreignasset positions of Japan, the U.S., and Europe. All series are scaled by world GDP. In 2008, by my estimate, unrecordedhousehold assets amounted to 7.3% of world GDP. Total household financial assets stood at 120% of world GDP (Davieset al., 2011) so unrecorded household assets amounted to 6% of total household financial assets. Europe includes the 16members of the eurozone as at the end of 2010, five additional European countries (the UK, Norway, Sweden, Denmarkand Switzerland), and three non-European countries (Australia, New Zealand, and Canada).Source: Appendix Tables A3 and A27.

Figure II: Through Their Swiss Accounts, Foreigners Mostly Invest in Mutual Funds
Residents of France, Italy,
Germany, U.S.,…
Switzerland
Luxembourg mutual funds
Irish mutual funds
French equities
U.S. bonds
Etc.
Note: This Figure presents the typical pattern of investments revealed by the Swiss National Bank’s statistics studied inthis paper. These statistics show that at the end of 2008, foreigners owned about US$ 2tr in Swiss banks in the form ofbank deposits and portfolio investments. A large fraction of these assets were invested in mutual funds. Most of the mutualfunds sold by Swiss banks to their clients are incorporated in Luxembourg and Ireland.
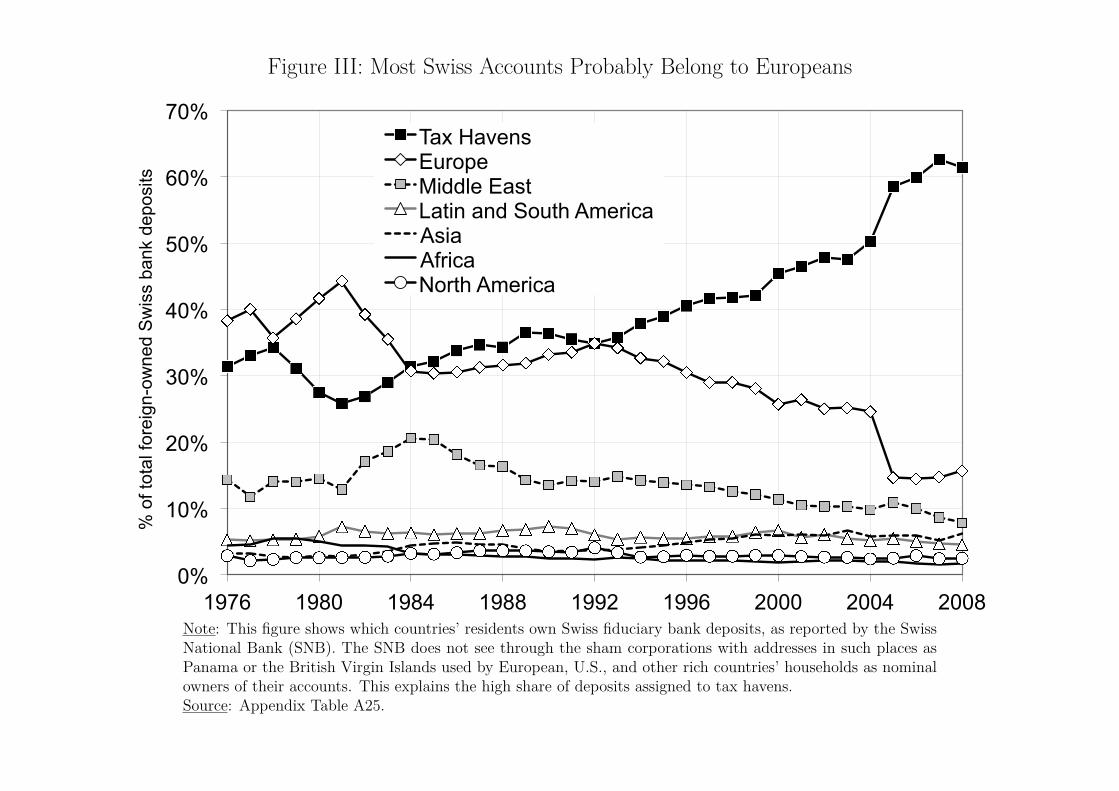
Figure III: Most Swiss Accounts Probably Belong to Europeans
0%
10%
20%
30%
40%
50%
60%
70%
1976 1980 1984 1988 1992 1996 2000 2004 2008
% o
f tot
al fo
reig
n-ow
ned
Sw
iss
bank
dep
osits
Tax Havens Europe Middle East Latin and South America Asia Africa North America
Note: This figure shows which countries’ residents own Swiss fiduciary bank deposits, as reported by the SwissNational Bank (SNB). The SNB does not see through the sham corporations with addresses in such places asPanama or the British Virgin Islands used by European, U.S., and other rich countries’ households as nominalowners of their accounts. This explains the high share of deposits assigned to tax havens.Source: Appendix Table A25.

Figure IV: Each Year, Less Securities Assets Are Recorded Than Liabilities!"#$%&'
()#&*+
0
1,000
2,000
3,000
4,000
5,000
6,000
0
10,000
20,000
30,000
40,000
50,000
60,000
2001 2002 2003 2004 2005 2006 2007 2008
Bill
ions
of c
urre
nt U
.S. d
olla
rs
Bill
ions
of c
urre
nt U
.S. d
olla
rs
Total Assets (left-hand scale)
Total Liabilities (left-hand scale)
Discrepancy (right-hand scale)
Note: This figure charts the securities assets and liabilities identifiable worldwide. Secu-rities include all equities and bonds classified as portfolio investments or reserves. Thetotals cover 237 countries and territories along with international organizations.Source: Appendix Table A3.

Figure V: Each Year, Less Equity Assets Are Recorded Than Liabilities!"#$%&'
()#&*+
0
1,000
2,000
3,000
4,000
5,000
0
5,000
10,000
15,000
20,000
25,000
2001 2002 2003 2004 2005 2006 2007 2008
Bill
ions
of c
urre
nt U
.S. d
olla
rs
Bill
ions
of c
urre
nt U
.S. d
olla
rs
Total Assets (left-hand scale)
Total Liabilities (left-hand scale)
Discrepancy (right-hand scale)
Note: This figure charts the equity assets and liabilities identifiable worldwide. Equitiesinclude all equities classified as portfolio investments or reserves. The totals cover 237countries and territories along with international organizations.Source: Appendix Table A3.

Figure VI: Each Year, Less Bond Assets Are Recorded Than Liabilities
0
1,000
2,000
0
5,000
10,000
15,000
20,000
25,000
30,000
2001 2002 2003 2004 2005 2006 2007 2008
Bill
ions
of c
urre
nt U
.S. d
olla
rs
Bill
ions
of c
urre
nt U
.S. d
olla
rs
Total Assets (left-hand scale)
Total Liabilities (left-hand scale)
Discrepancy (right-hand scale)
Note: This figure charts the bond assets and liabilities identifiable worldwide. Bondsinclude all debt securities classified as portfolio investments or reserves. The totals cover237 countries and territories along with international organizations.Source: Appendix Table A3.

Figure VII: Many Mutual Fund Shares Have no Readily Identifi-able Owners in the Official Statistics
Guernsey
Guernsey
GuernseySwitzerland
Switzerland
SwitzerlandUnited States
United States
United StatesItaly
Italy
ItalyJapan
Japan
JapanNetherlands
Netherlands
NetherlandsFrance
France
FranceIreland
Ireland
IrelandCayman Islands
Cayman Islands
Cayman IslandsLuxembourg
Luxembourg
Luxembourg0
0
0200
200
200400
400
400600
600
600800
800
8001000
1000
1000Billions of current U.S. dollars
Billio
ns o
f cur
rent
U.S
. dol
lars
Billions of current U.S. dollars.1
.1
.1.2
.2
.2.3
.3
.3.4
.4
.4.5
.5
.5.6
.6
.6.7
.7
.7.8
.8
.8.9
.9
.91
1
1
Note: Each dot represents a country j and is equal to the difference between thesecurities liabilities reported in 2008 by j (Lj) and the sum of the securities assetson j held by 236 countries i and international organizations (∑i Aij). The securitiesissued by Luxembourg, the Cayman Islands, and Ireland, are mostly mutual fundshares.Source: Appendix Tables A13 and A14.

Figure VIII: The World Now Runs a Large Trade Surplus
-200
-100
0
100
200
300
400
500
1994 1996 1998 2000 2002 2004 2006 2008
Bill
ions
of c
urre
nt U
.S. d
olla
rs
Current Account
Trade Balance
FDI Income
Portfolio and Other Investment Income
Note: This figure charts the statistical anomalies in the world’s balance of payments, which includes data forall countries and territories. Each year, more portfolio and other investment income is paid than received, theflow counterpart of missing assets in international investment positions. Since 2004, the world has been runninga large trade surplus, driving a large current account surplus.Source: Appendix Table A21.

Table I: Securities Form the Bulk of Cross-Border Wealth
(End of 2008 values) Trillions of current US$ % of world GDP
Securities 40.1 65%
Bonds 26.4 43%
Equities (including mutual fund shares) 13.7 22%
FDI 17.7 29%
Other (loans, deposits...) 32.0 52%
Total cross-border wealth 89.9 146%
Memo: World GDP (2008) = US$ 61.4tr
Note: Securities include all “portfolio investments” and the fraction of “reserveassets” invested in equities and bonds. In international investment statistics, allmutual fund shares are classified as equities (irrespective of whether the funds investin equities or bonds). FDI stands for foreign direct investment. Derivatives areexcluded because they are not measured yet in all leading economies.Source: IMF Balance of Payments Statistics and the updated and extended versionof the External Wealth of Nations database constructed by Lane and Milesi-Ferretti(2007).

Table II: Large Portfolios of Securities Are Held in Swiss Banks byForeigners
(End of 2008 values in billions of current US$)
Belonging to foreigners
Belonging to Swiss residents
Foreign securities 1,545 810
Bonds 540 484
Equities 1,005 326
(Of which: mutual fund shares) 767 196
Fiduciary bank deposits 478 45
Total 2,022 855
Source: Securities: Swiss National Bank’s Monthly Statistical Bulletin (http://www.snb.ch/en/iabout/stat/statpub/statmon/stats/statmon), series D51,D51a, D51, D51b, D52 and D52b and Banks in Switzerland (http://www.snb.ch/en/iabout/stat/statpub/bchpub/stats/bankench), series 38a, 38b, 38c. Fidu-ciary deposits: Monthly Statistical Bulletin, series D4, D41a, D42a, and Banks inSwitzerland series 36, 37, 38.

Table III: Estimated Offshore Wealth, World and Switzerland
(End of 2008 values in billions of current US$) World Switzerland
Offshore securities 4,490 1,545
Bonds 37% 35%
Equities 63% 65%
(Of which: mutual fund shares) 48% 50%
Offshore bank deposits 1,388 478
Total offshore financial wealth 5,878 2,022
Memo: Global household financial wealth = 73,625
Note: Global household financial wealth includes bank deposits, portfolios of secu-rities, insurance contracts of households net of households’ debt. Offshore financialwealth includes the bank deposits and portfolios of securities held by households intax havens. It excludes real estate and other real assets held in tax havens.Source: Offshore financial wealth: Appendix Tables A3, A23, and A24. Globalhousehold financial wealth: Credit Suisse (2010).

Table IV: The Anomalies Caused by Unrecorded Assets Are Internally Consistent
2001 2002 2003 2004 2005 2006 2007 2008
[1] Stock (Ω), bn$ 2,532 2,392 2,858 3,316 3,676 3,760 5,131 4,490
[2] Inflows (I), bn$ 38 164 153 240 230 116 189 364
[3] Valuation (VAL), bn$ n.a. -304 313 218 130 -31 1,182 -1,006
[4]Interest and dividends (D), bn$ 126 124 118 121 128 121 106 156
[5] Yield (rΩ=D/Ω) 5.0% 5.2% 4.1% 3.6% 3.5% 3.2% 2.1% 3.5%
Note: This table reports on the estimated stocks and flows of unrecorded portfolios. Inflows are the net purchases of securitiesfrom unrecorded accounts. Valuation denotes the net capital gains/losses on unrecorded portfolios. Interest and dividends arethe income earned by the owners of unrecorded portfolios.Source: Appendix Tables A3 and A21; IMF Balance of Payments Statistics 2010, Table C-1: “Global discrepancies in balanceof payments statistics.”

Table V: Accounting for the Wealth in Tax Havens Can Turn theEurozone Into a Net Creditor
0% 40% 50% 60%
0% -11% -6% -5% -3%
25% -6% 0% 1% 2%
50% 0% 5% 7% 8%
75% 6% 11% 12% 13%
Share of offshore portfolios in Switzerland belonging to eurozone residents
Share of offshore
portfolios in other havens belonging to
eurozone residents
Note: The Table reads as follows. The official eurozone’s net foreign asset posi-tion/GDP ratio averaged -11% over the 2001-2008 period. If eurozone residentsowned 40% of the unrecorded assets held through Switzerland and 50% of thoseheld through the other tax havens, the true net foreign asset position/GDP ratio ofthe eurozone averaged +5%.Source: Appendix Table A28.
Table VI: Accounting for the Wealth in Tax Havens Improves theU.S. Net Foreign Asset Position
0% 5% 15%
0% -18% -17% -16%
25% -13% -13% -12%
50% -9% -8% -7%
75% -5% -4% -3%
Share of offshore
portfolios in other havens belonging to
U.S. residents
Share of offshore portfolios in Switzerland belonging to U.S. residents
Note: The table reads as follows. The official U.S. net foreign asset position/GDPratio averaged -18% over the 2001-2008 period. If U.S. residents owned 15% of theunrecorded assets held through Switzerland and 25% of those held through the othertax havens, the true net foreign asset position/GDP ratio of the U.S. averaged -12%.Source: Appendix Table A29.