Embed Size (px)
Citation preview
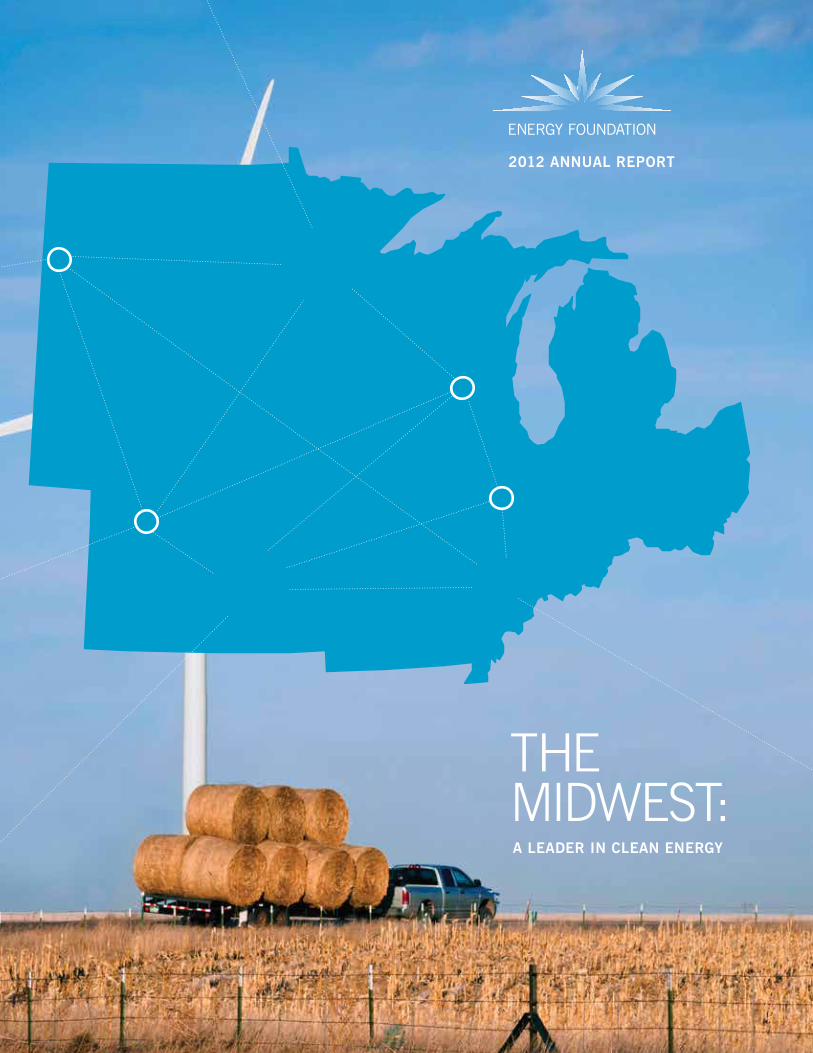
THE MIDWEST:
2012 ANNUAL REPORT
A LEADER IN CLEAN ENERGY
POLITICAL SUPPORT
JOBS AND PROSPERITY
ENERGY POLICY
GROWTH OF INDUSTRY
The Midwest: A Leader in Clean Energy 03
Programs and grants 16
Financial statements 18
Board of directors 20
More information 21
Endnotes 21
TABLE OF CONTENTS
The Energy Foundation is a partnership of philanthropic investors promoting clean energy
technology. Our goal is to build a new energy future by advancing energy efficiency and
renewable energy.
ENERGY FOUNDATION PARTNERS: Bloomberg Philanthropies, ClimateWorks
Foundation, Children’s Investment Fund Foundation, David and Lucile Packard Foundation,
Grantham Foundation, Lakeshore Foundation, McKnight Foundation, Oak Foundation, Pisces
Foundation, Robertson Foundation, Schmidt Family Foundation, Tilia Fund,
TomKat Trust, TOSA Foundation, William and Flora Hewlett Foundation
WE ALSO THANK AND RECOGNIZE OUR SUPPORTERS: Argosy Foundation,
Barr Foundation, Gund Foundation, Pickman Foundation, Red Crane Foundation
THE MIDWEST: A LEADER IN CLEAN ENERGY
WisconsinSouth DakotaOhio
Nebraska
North Dakota
Missouri
Minnesota
Michigan
Kansas
Indiana
Illinois
Iowa
0
5,000
10,000MEG
AWAT
TS
15,000
20,000
25,000
2002 2003 2004 2005 2006 2007 2008 2009 2010 2011 2012
Authors: Bentham Paulos Energy Consultant
Gregg D. Ander, FAIA Vice President, Power and Efficiency Energy Foundation
Eric Heitz President Energy Foundation
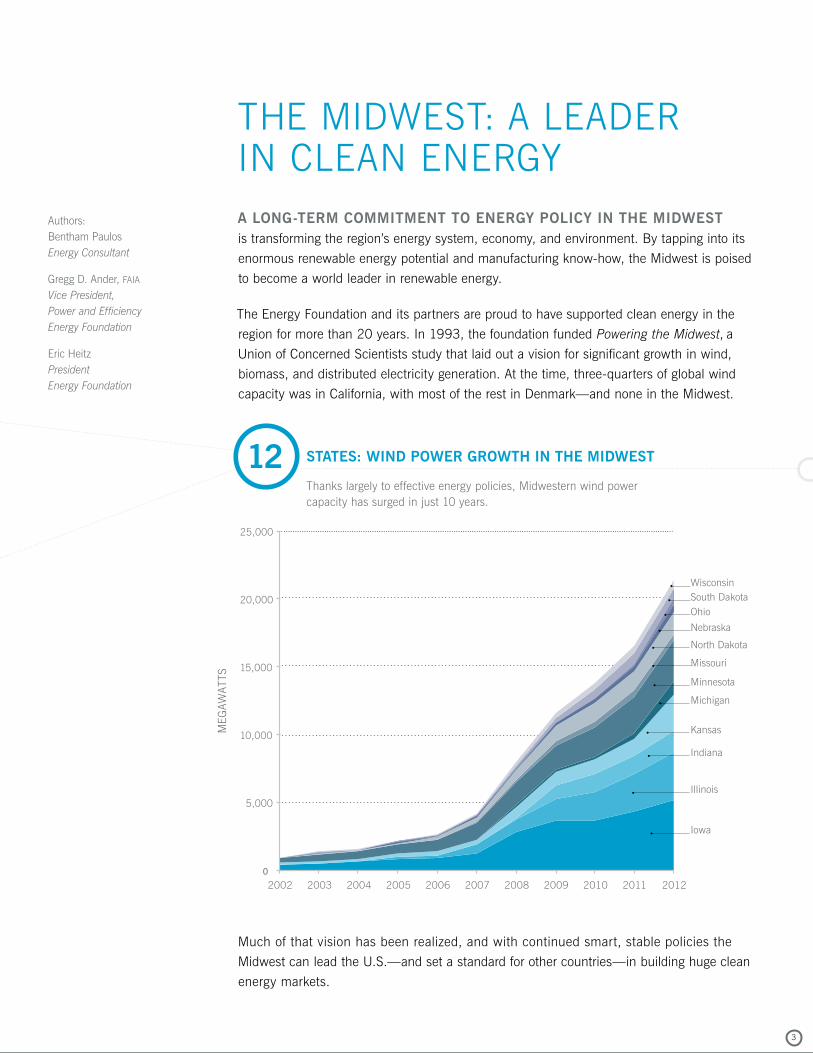
Thanks largely to effective energy policies, Midwestern wind power capacity has surged in just 10 years.
STATES: WIND POWER GROWTH IN THE MIDWEST
A LONG-TERM COMMITMENT TO ENERGY POLICY IN THE MIDWEST
is transforming the region’s energy system, economy, and environment. By tapping into its
enormous renewable energy potential and manufacturing know-how, the Midwest is poised
to become a world leader in renewable energy.
The Energy Foundation and its partners are proud to have supported clean energy in the
region for more than 20 years. In 1993, the foundation funded Powering the Midwest, a
Union of Concerned Scientists study that laid out a vision for significant growth in wind,
biomass, and distributed electricity generation. At the time, three-quarters of global wind
capacity was in California, with most of the rest in Denmark—and none in the Midwest.
Much of that vision has been realized, and with continued smart, stable policies the
Midwest can lead the U.S.—and set a standard for other countries—in building huge clean
energy markets.
12
3
Toledo
Cleveland
Columbus
Cincinnati Auxiliary
Bearings
Composites
Control systems
Electrical/electronics
Fabrication
Fasteners
Forge
Foundry
Gears
Hydraulics
Machine shops
Metal coatings
Power electronics
Sensors
Other services*
Total
29
6
27
8
22
162
11
13
19
6
16
204
59
25
6
5
47
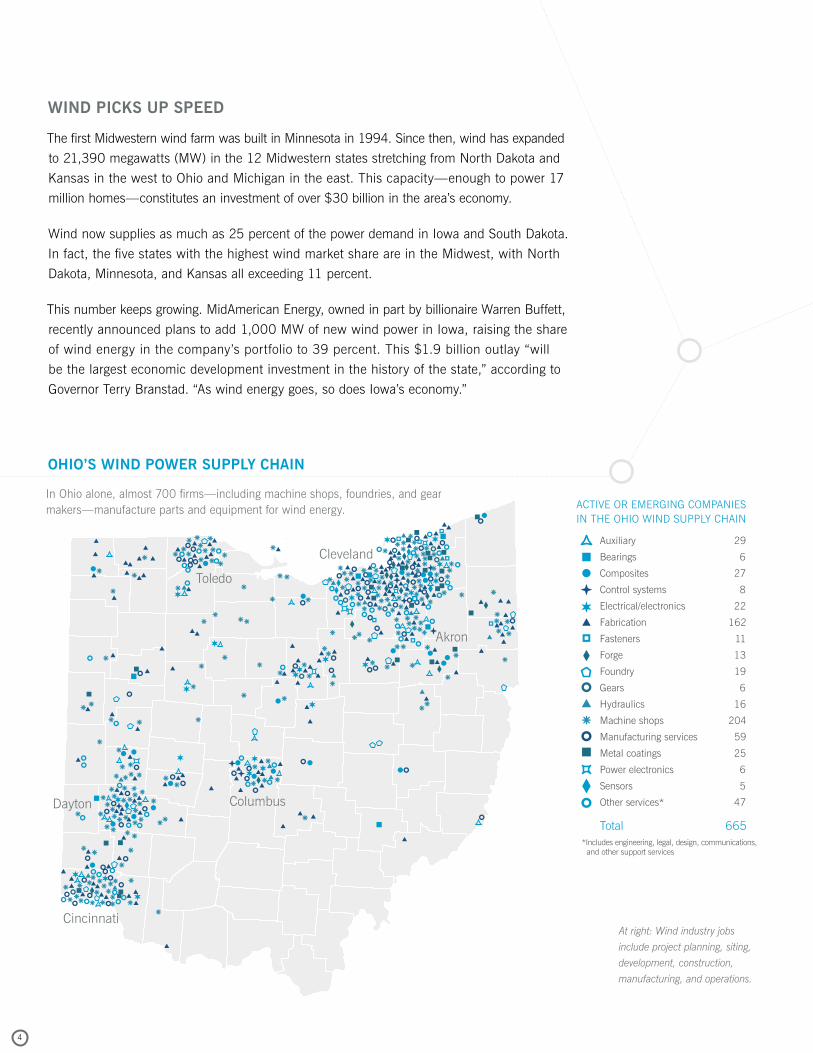
665*Includes engineering, legal, design, communications, and other support services
Dayton
Akron
Manufacturing services
WIND PICKS UP SPEED
The first Midwestern wind farm was built in Minnesota in 1994. Since then, wind has expanded
to 21,390 megawatts (MW) in the 12 Midwestern states stretching from North Dakota and
Kansas in the west to Ohio and Michigan in the east. This capacity—enough to power 17
million homes—constitutes an investment of over $30 billion in the area’s economy.
Wind now supplies as much as 25 percent of the power demand in Iowa and South Dakota.
In fact, the five states with the highest wind market share are in the Midwest, with North
Dakota, Minnesota, and Kansas all exceeding 11 percent.
This number keeps growing. MidAmerican Energy, owned in part by billionaire Warren Buffett,
recently announced plans to add 1,000 MW of new wind power in Iowa, raising the share
of wind energy in the company’s portfolio to 39 percent. This $1.9 billion outlay “will
be the largest economic development investment in the history of the state,” according to
Governor Terry Branstad. “As wind energy goes, so does Iowa’s economy.”
4
Toledo
Cleveland
Columbus
Cincinnati Auxiliary
Bearings
Composites
Control systems
Electrical/electronics
Fabrication
Fasteners
Forge
Foundry
Gears
Hydraulics
Machine shops
Metal coatings
Power electronics
Sensors
Other services*
Total
29
6
27
8
22
162
11
13
19
6
16
204
59
25
6
5
47
665*Includes engineering, legal, design, communications, and other support services
Dayton
Akron
Manufacturing services
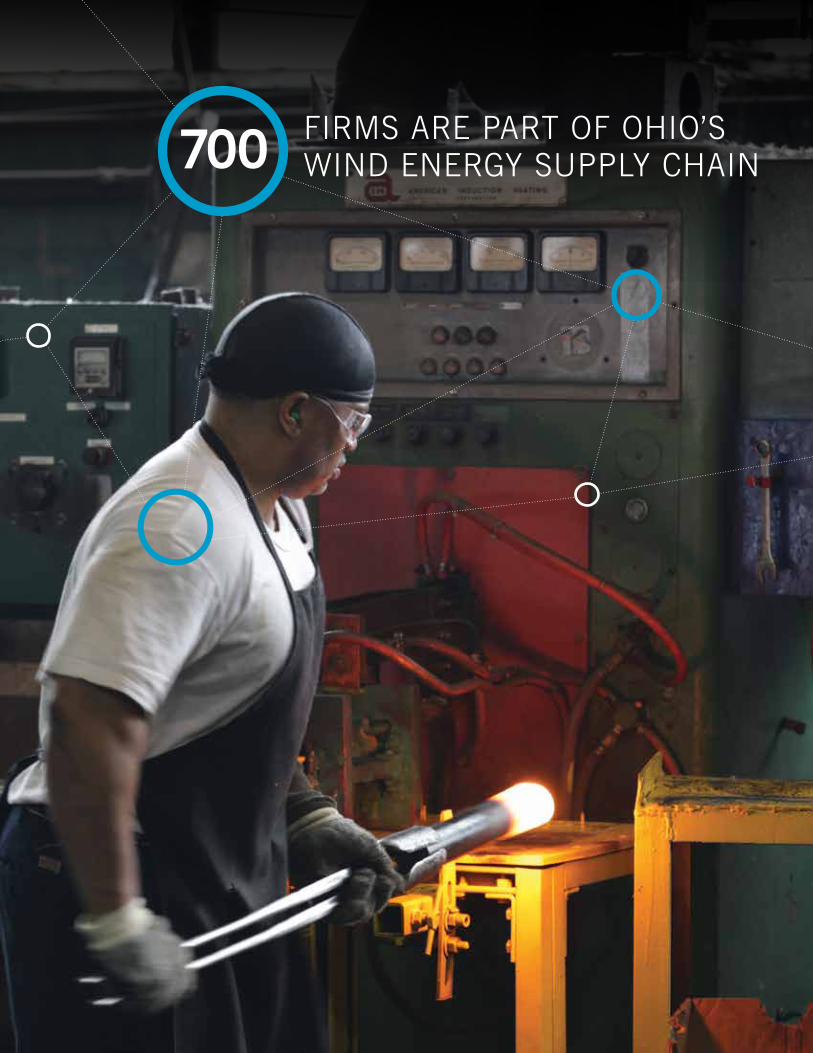
OHIO’S WIND POWER SUPPLY CHAIN
ACTIVE OR EMERGING COMPANIES IN THE OHIO WIND SUPPLY CHAIN
In Ohio alone, almost 700 firms—including machine shops, foundries, and gear makers—manufacture parts and equipment for wind energy.
At right: Wind industry jobs
include project planning, siting,
development, construction,
manufacturing, and operations.
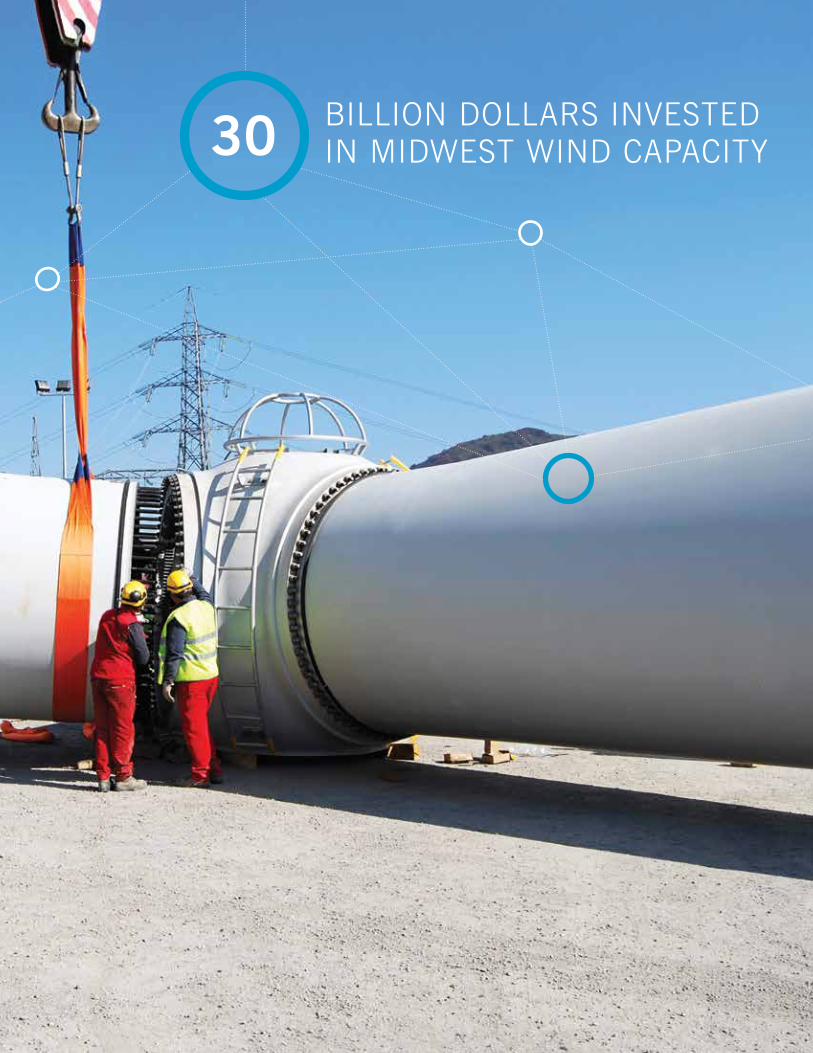
BILLION DOLLARS INVESTED IN MIDWEST WIND CAPACITY30
6
At right: Cardinal Fastener in
Ohio manufacturers bolts for
wind turbines, making it part of
the Midwest’s renewable-energy
supply chain.
Companies have invested nearly $10 billion in Iowa wind, paying $16 million per year to
landowners and providing the equivalent of more than 6,000 full-time jobs. At the end
of 2012, the U.S. wind industry supported 80,700 such jobs, 30,000 of which were in
the Midwest.1 In fact, Iowa, Illinois, and Kansas are among the top five states in terms of
wind-related employment.
The massive deployment of wind has spurred a vibrant manufacturing sector throughout the
component supply chain. Building on a traditional strength of the Great Lakes region, small
manufacturers of mechanical equipment have retooled to supply wind components, from
ball bearings to cables and towers. The Ohio Department of Development has cataloged over
600 firms in the wind energy supply chain, including machine shops, foundries, and gear
makers. “Ohio’s long history of manufacturing excellence and the continued transformation of
its industrial base,” the agency writes, “make Ohio the ideal location for global leadership in
the wind energy industry.”
Notably, this growth has happened without a significant net cost to the region. In Iowa, wind
went from zero to filling a quarter of demand, yet MidAmerican Energy, the state’s largest
utility, hasn’t increased rates in 18 years. The next build-out of wind power, the company
says, will help reduce rates by $10 million per year by 2017. 2 This is reinforced by reports
from the Michigan utility commission, which determined last year that new wind power
is one-third cheaper than new coal.3 And more wind means more savings. Synapse Energy
Economics analyzed the effect of adding an additional 20,000–50,000 MW of wind in the
Midwest and concluded that the biggest increase would create the greatest net savings—as
much as $4 billion a year.4
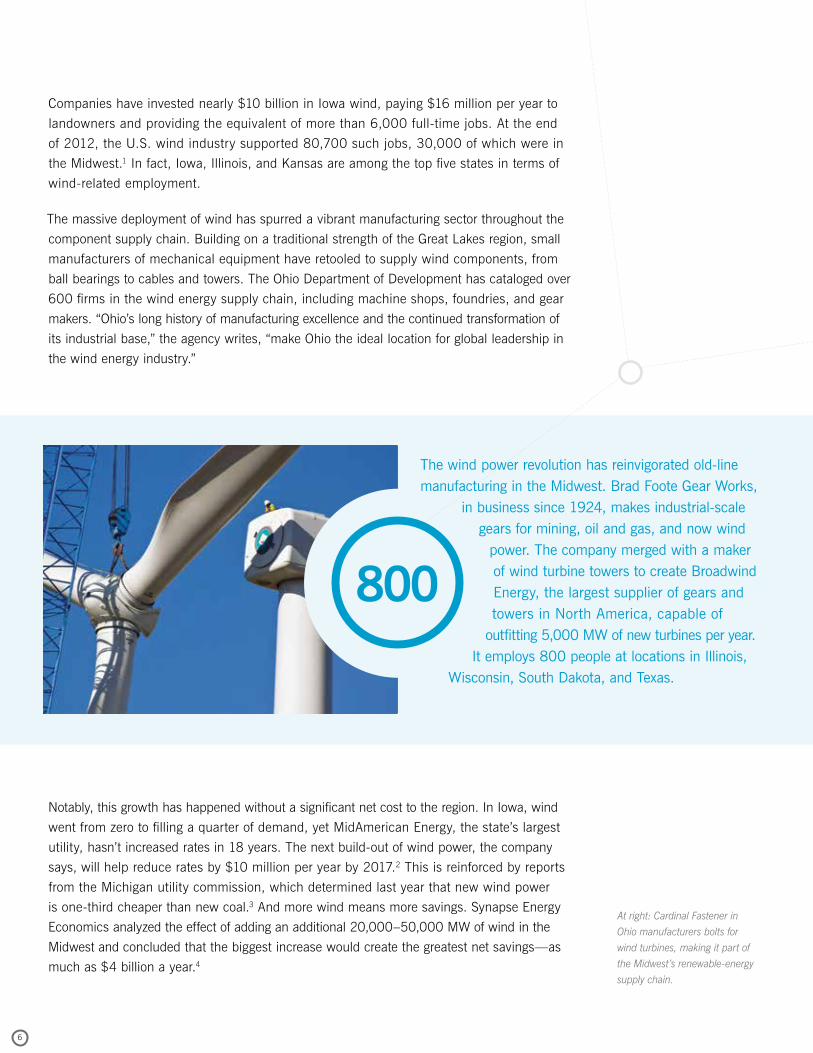
The wind power revolution has reinvigorated old-line manufacturing in the Midwest. Brad Foote Gear Works,
in business since 1924, makes industrial-scale gears for mining, oil and gas, and now wind
power. The company merged with a maker of wind turbine towers to create Broadwind Energy, the largest supplier of gears and towers in North America, capable of
outfitting 5,000 MW of new turbines per year. It employs 800 people at locations in Illinois,
Wisconsin, South Dakota, and Texas.
800
FIRMS ARE PART OF OHIO’S WIND ENERGY SUPPLY CHAIN700
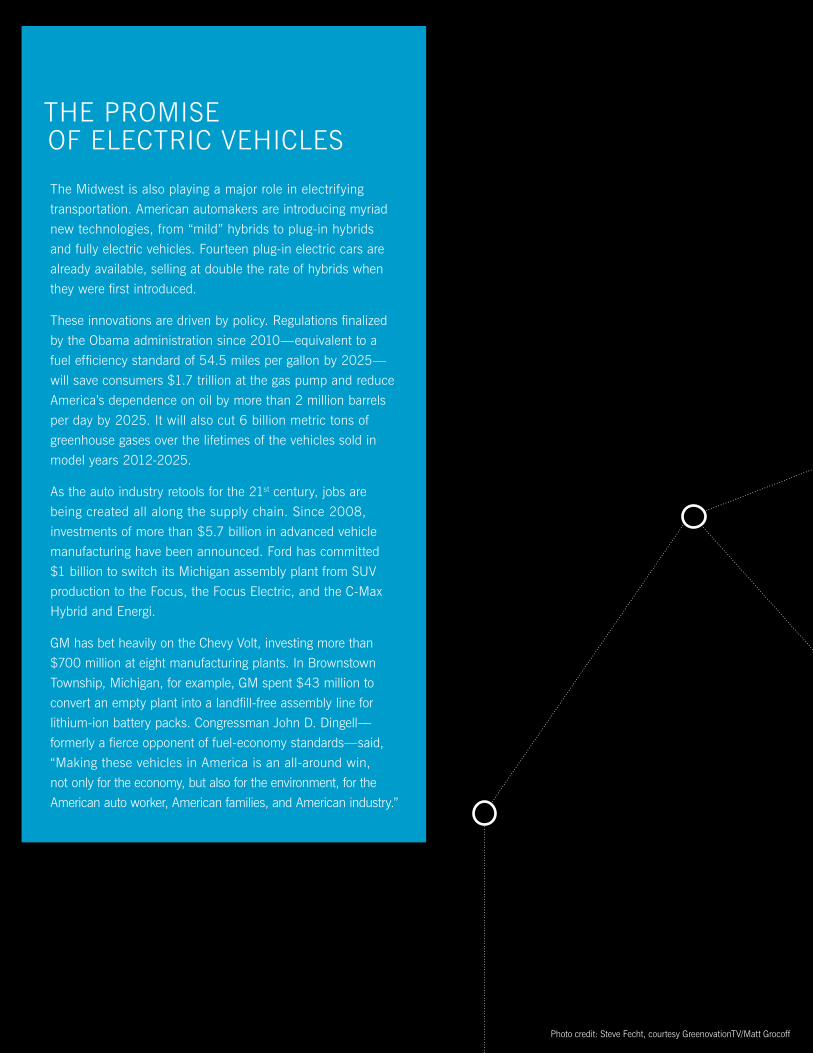
THE PROMISE OF ELECTRIC VEHICLES
The Midwest is also playing a major role in electrifying
transportation. American automakers are introducing myriad
new technologies, from “mild” hybrids to plug-in hybrids
and fully electric vehicles. Fourteen plug-in electric cars are
already available, selling at double the rate of hybrids when
they were first introduced.
These innovations are driven by policy. Regulations finalized
by the Obama administration since 2010—equivalent to a
fuel efficiency standard of 54.5 miles per gallon by 2025—
will save consumers $1.7 trillion at the gas pump and reduce
America’s dependence on oil by more than 2 million barrels
per day by 2025. It will also cut 6 billion metric tons of
greenhouse gases over the lifetimes of the vehicles sold in
model years 2012-2025.
As the auto industry retools for the 21st century, jobs are
being created all along the supply chain. Since 2008,
investments of more than $5.7 billion in advanced vehicle
manufacturing have been announced. Ford has committed
$1 billion to switch its Michigan assembly plant from SUV
production to the Focus, the Focus Electric, and the C-Max
Hybrid and Energi.
GM has bet heavily on the Chevy Volt, investing more than
$700 million at eight manufacturing plants. In Brownstown
Township, Michigan, for example, GM spent $43 million to
convert an empty plant into a landfill-free assembly line for
lithium-ion battery packs. Congressman John D. Dingell—
formerly a fierce opponent of fuel-economy standards—said,
“Making these vehicles in America is an all-around win,
not only for the economy, but also for the environment, for the
American auto worker, American families, and American industry.”
Photo credit: Steve Fecht, courtesy GreenovationTV/Matt Grocoff
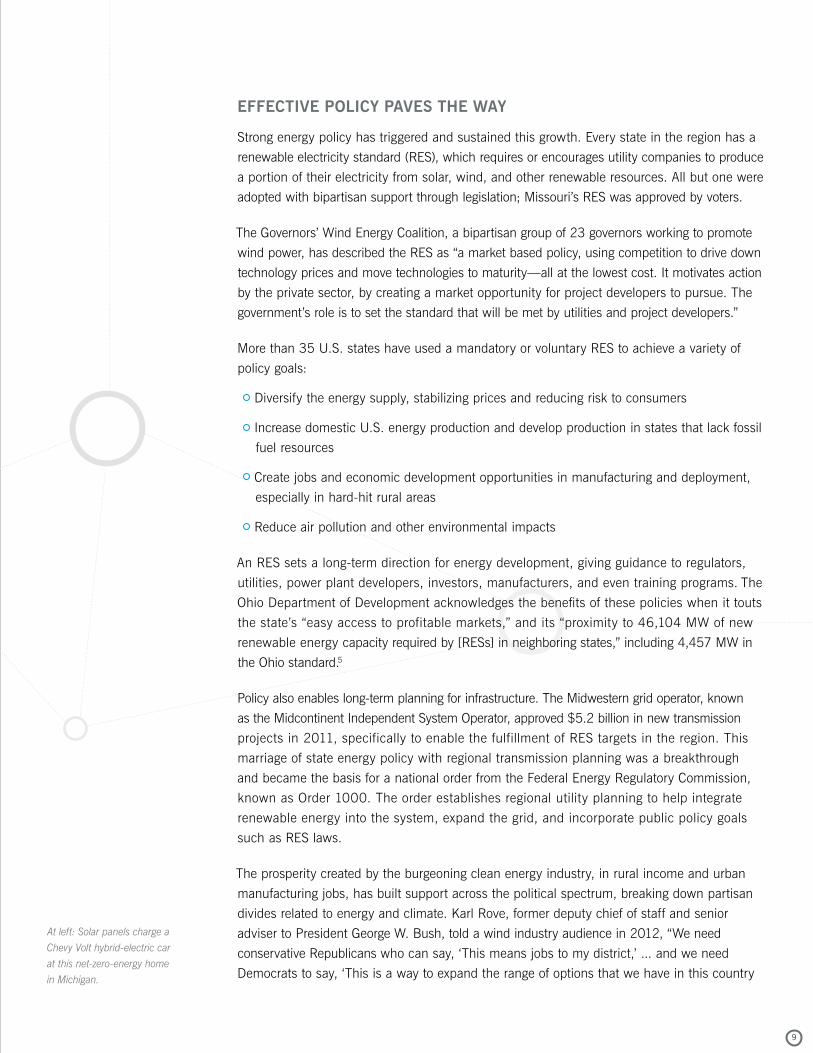
At left: Solar panels charge a
Chevy Volt hybrid-electric car
at this net-zero-energy home
in Michigan.
9
EFFECTIVE POLICY PAVES THE WAY
Strong energy policy has triggered and sustained this growth. Every state in the region has a
renewable electricity standard (RES), which requires or encourages utility companies to produce
a portion of their electricity from solar, wind, and other renewable resources. All but one were
adopted with bipartisan support through legislation; Missouri’s RES was approved by voters.
The Governors’ Wind Energy Coalition, a bipartisan group of 23 governors working to promote
wind power, has described the RES as “a market based policy, using competition to drive down
technology prices and move technologies to maturity—all at the lowest cost. It motivates action
by the private sector, by creating a market opportunity for project developers to pursue. The
government’s role is to set the standard that will be met by utilities and project developers.”
More than 35 U.S. states have used a mandatory or voluntary RES to achieve a variety of
policy goals:
Diversify the energy supply, stabilizing prices and reducing risk to consumers
Increase domestic U.S. energy production and develop production in states that lack fossil
fuel resources
Create jobs and economic development opportunities in manufacturing and deployment,
especially in hard-hit rural areas
Reduce air pollution and other environmental impacts
An RES sets a long-term direction for energy development, giving guidance to regulators,
utilities, power plant developers, investors, manufacturers, and even training programs. The
Ohio Department of Development acknowledges the benefits of these policies when it touts
the state’s “easy access to profitable markets,” and its “proximity to 46,104 MW of new
renewable energy capacity required by [RESs] in neighboring states,” including 4,457 MW in
the Ohio standard.5
Policy also enables long-term planning for infrastructure. The Midwestern grid operator, known
as the Midcontinent Independent System Operator, approved $5.2 billion in new transmission
projects in 2011, specifically to enable the fulfillment of RES targets in the region. This
marriage of state energy policy with regional transmission planning was a breakthrough
and became the basis for a national order from the Federal Energy Regulatory Commission,
known as Order 1000. The order establishes regional utility planning to help integrate
renewable energy into the system, expand the grid, and incorporate public policy goals
such as RES laws.
The prosperity created by the burgeoning clean energy industry, in rural income and urban
manufacturing jobs, has built support across the political spectrum, breaking down partisan
divides related to energy and climate. Karl Rove, former deputy chief of staff and senior
adviser to President George W. Bush, told a wind industry audience in 2012, “We need
conservative Republicans who can say, ‘This means jobs to my district,’ ... and we need
Democrats to say, ‘This is a way to expand the range of options that we have in this country
Photo credit: Steve Fecht, courtesy GreenovationTV/Matt Grocoff
10
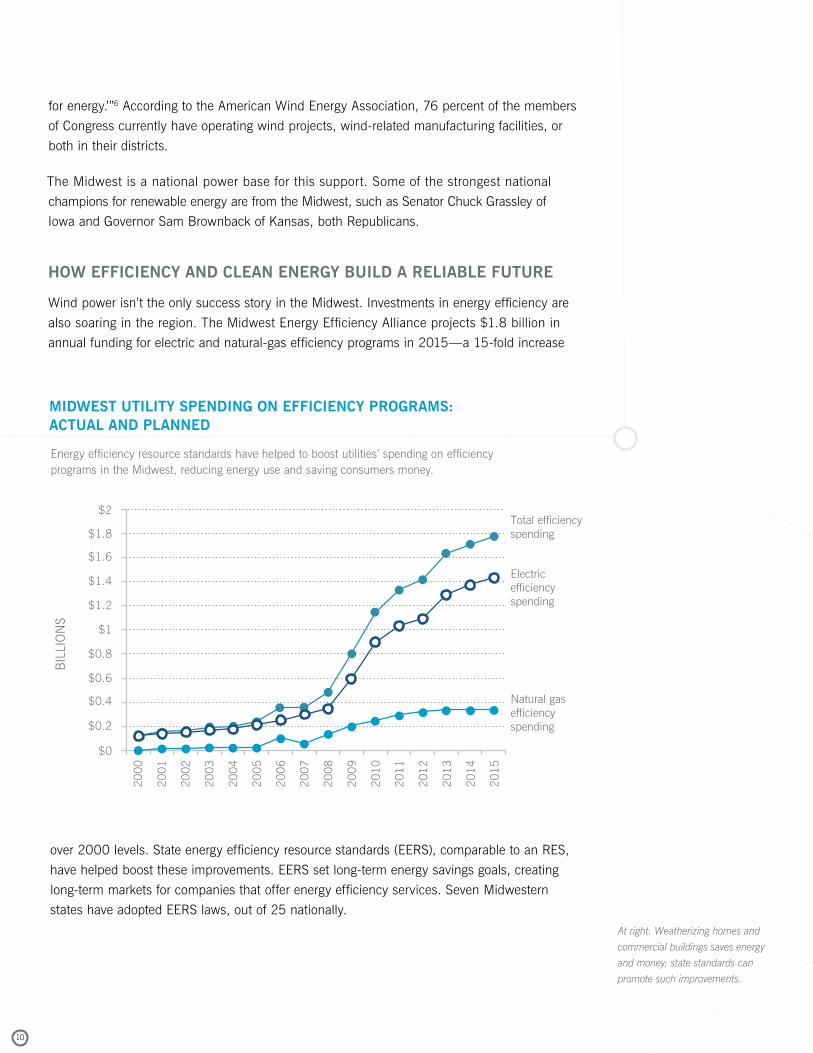
over 2000 levels. State energy efficiency resource standards (EERS), comparable to an RES,
have helped boost these improvements. EERS set long-term energy savings goals, creating
long-term markets for companies that offer energy efficiency services. Seven Midwestern
states have adopted EERS laws, out of 25 nationally.
for energy.’”6 According to the American Wind Energy Association, 76 percent of the members
of Congress currently have operating wind projects, wind-related manufacturing facilities, or
both in their districts.
The Midwest is a national power base for this support. Some of the strongest national
champions for renewable energy are from the Midwest, such as Senator Chuck Grassley of
Iowa and Governor Sam Brownback of Kansas, both Republicans.
HOW EFFICIENCY AND CLEAN ENERGY BUILD A RELIABLE FUTURE
Wind power isn’t the only success story in the Midwest. Investments in energy efficiency are
also soaring in the region. The Midwest Energy Efficiency Alliance projects $1.8 billion in
annual funding for electric and natural-gas efficiency programs in 2015—a 15-fold increase
$2
$1.8
2000
2001
2002
2003
2004
2005
2006
2007
2008
2009
2010
2011
2012
2013
2014
2015
$1.6
$1.4
$1.2
$1
$0.8
$0.6
$0.4
$0.2
$0
Total efficiency spending
Electric efficiency spending
Natural gas efficiency spending
BIL
LIO
NS
MIDWEST UTILITY SPENDING ON EFFICIENCY PROGRAMS: ACTUAL AND PLANNED
Energy efficiency resource standards have helped to boost utilities’ spending on efficiency programs in the Midwest, reducing energy use and saving consumers money.
At right: Weatherizing homes and
commercial buildings saves energy
and money; state standards can
promote such improvements.
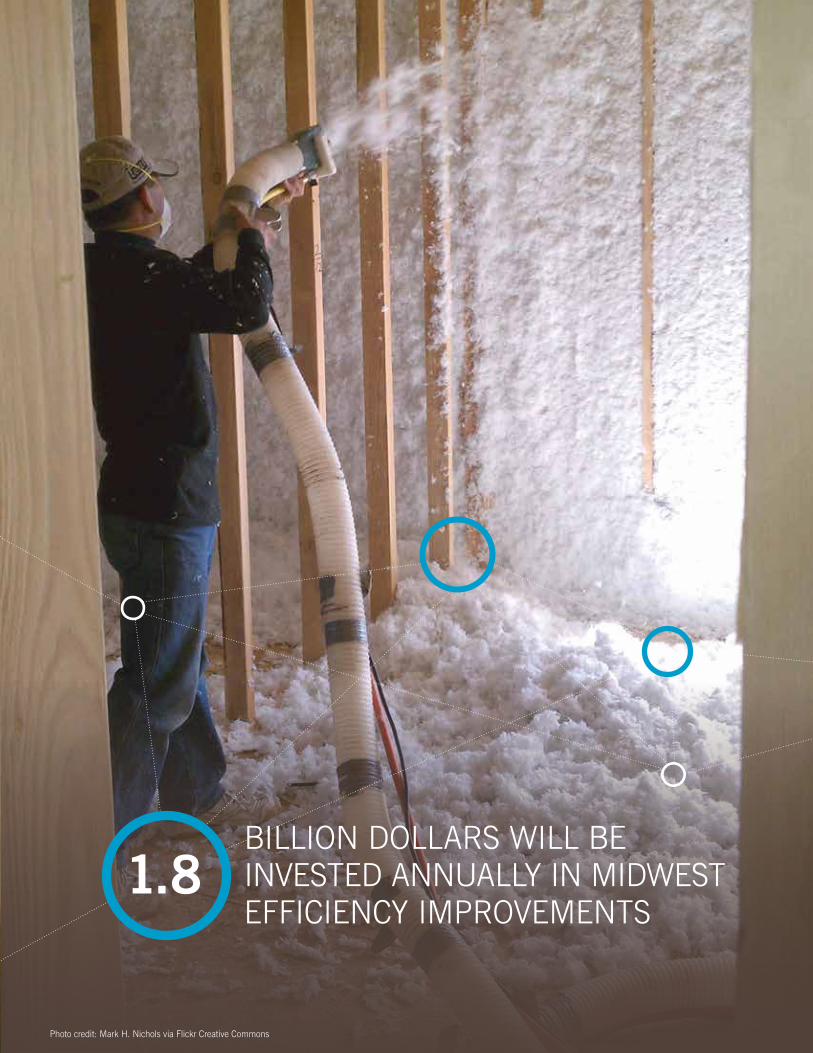
1.8BILLION DOLLARS WILL BE INVESTED ANNUALLY IN MIDWEST EFFICIENCY IMPROVEMENTS
Photo credit: Mark H. Nichols via Flickr Creative Commons
12
Every new wind turbine manufactured and every efficiency program successfully completed
helps to build the political base for new energy as part of a continuing cycle of progress:
Political support leads to energy policy, policy spurs the growth of industry, industry creates
jobs and prosperity, and prosperity generates still more political support.
The region’s power system is also undergoing a rapid transition away from coal. In the 12
Midwestern states, there are 499 coal units with a total capacity of 111,000 MW—and an average
age of 46 years. As aging coal plants face new competition from cheaper alternatives like energy
efficiency, wind, and natural gas—plus stricter environmental regulations—their owners are deciding
the best option is to shut them down. Utilities have announced as much as 58,000 MW of coal
retirements over the next three years, with potentially 18,000 MW of those in the Midwest.
Meanwhile, natural gas is growing rapidly. Hydraulic fracturing, known as “fracking,” has
driven down gas prices 60 percent since 2008, making natural gas power cheaper than
coal. The gas revolution has been a mixed blessing for the cleanest power sources: While
low-cost gas has helped push coal out of the market, it has made efficiency and renewables
less competitive in many places. In Michigan, however, new wind energy costs 25 percent
less than new natural-gas power generation.7 And Michigan Public Service Commission Chair
John Quackenbush and Energy Office Director Steve Bakkal say the state’s utility companies
should be able to triple Michigan’s renewable energy use—to 30 percent—by 2035 with
current resources.8 Moreover, significant questions remain about the environmental impacts of
fracking, such as water pollution and methane leakage.
All of these factors are contributing to a future power system that will be more diverse and less
dependent on a single fuel. It will be more flexible, more reliable, and more efficient, saving
consumers money, making industry more competitive, and reducing environmental damage.
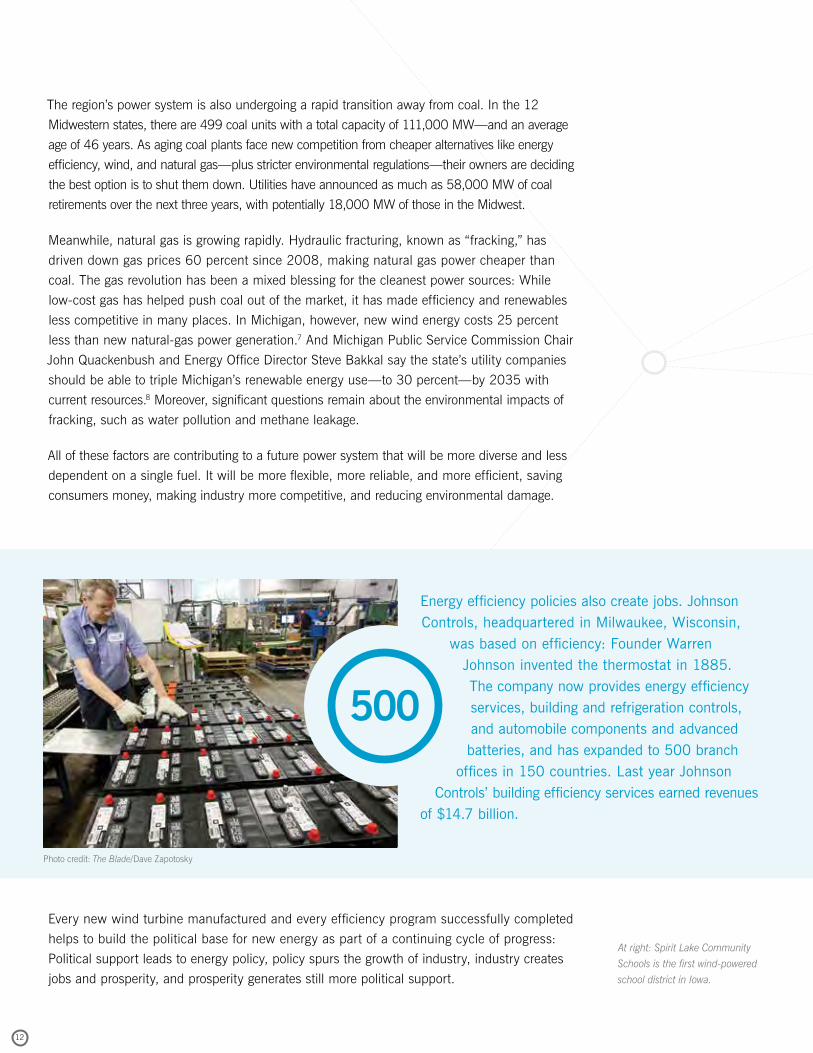
500
Energy efficiency policies also create jobs. Johnson Controls, headquartered in Milwaukee, Wisconsin,
was based on efficiency: Founder Warren Johnson invented the thermostat in 1885. The company now provides energy efficiency services, building and refrigeration controls, and automobile components and advanced batteries, and has expanded to 500 branch
offices in 150 countries. Last year Johnson Controls’ building efficiency services earned revenues
of $14.7 billion.
Photo credit: The Blade/Dave Zapotosky
At right: Spirit Lake Community
Schools is the first wind-powered
school district in Iowa.
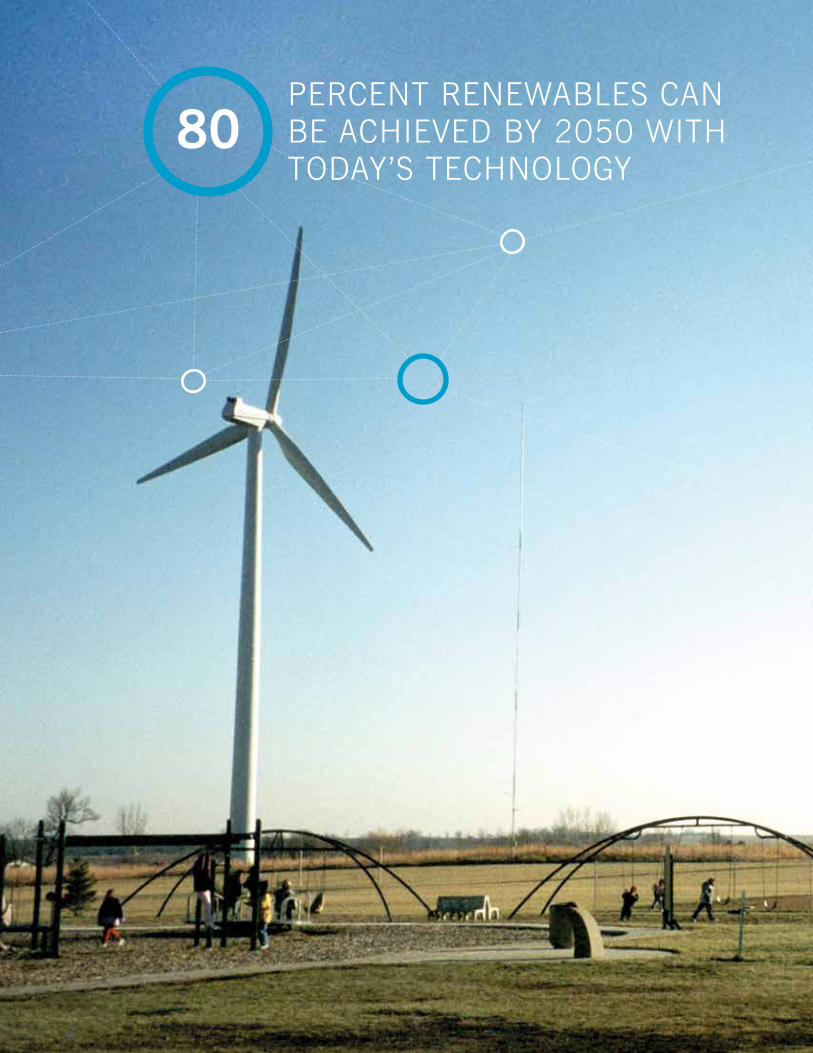
PERCENT RENEWABLES CAN BE ACHIEVED BY 2050 WITH TODAY’S TECHNOLOGY
80
14
At right: Tim Hemphill—a lifelong
corn, soybean, and hog farmer in
Iowa—leases a portion of his land
to a wind energy project.Endnotes are on page 21.
THE MIDWEST: LEADING THE NATION
Just as 1993’s Powering the Midwest presaged the significant renewable energy generation
of today, the National Renewable Energy Lab has described a future that takes clean energy
to the next level. The Renewable Electricity Futures study lays out a number of scenarios in
which the U.S. grid would be powered by up to 90 percent renewables by 2050. In a central
80 percent scenario, Midwestern states account for 8 of the top 10 spots for wind energy
production, and 9 of the top 10 for biomass power.
But more must be done to realize this vision. The Energy Foundation is supporting a project
called America’s Power Plan, which taps over 100 experts to develop a policy roadmap for a
clean power system.
America’s Power Plan recommends that the U.S.:
Develop new business models for utilities that reward renewables, efficiency, and innovation.
Refine the rules for regional electricity markets to reward greater operational flexibility,
allowing new technologies to blossom.
Provide stable policies to expand energy efficiency and renewable energy markets. Financial
policies must be predictable and affordable for public budgets and efficient for investors.
Encourage customers who want to generate their own clean energy and compensate them
fairly for it.
Allow all options to compete to provide clean, affordable electricity services, including
central and distributed generation, improved transmission, efficiency, and demand
response services.
Engage stakeholders early and often; be transparent and respect landowner rights and land
conservation values.
“The moment is approaching when our nation must decide how it’s going to power the future,”
says Kansas Governor Sam Brownback. “The importance of renewable energy to the nation
becomes clear … as we examine the importance of true energy independence and security
more closely, and as we continue our work on rebuilding the economy and job creation.”
“We, as a nation,” Brownback says, “have been waiting for the moment when a true balance
between environmental concerns, economic benefits and energy needs is in view. I believe that
moment has arrived.”9
The Midwest is starting to achieve a vision of clean energy security: a domestic energy supply,
local economic development, and low carbon emissions. The region can lead the transition to
smart energy policies that benefit people, businesses, and communities across the nation.
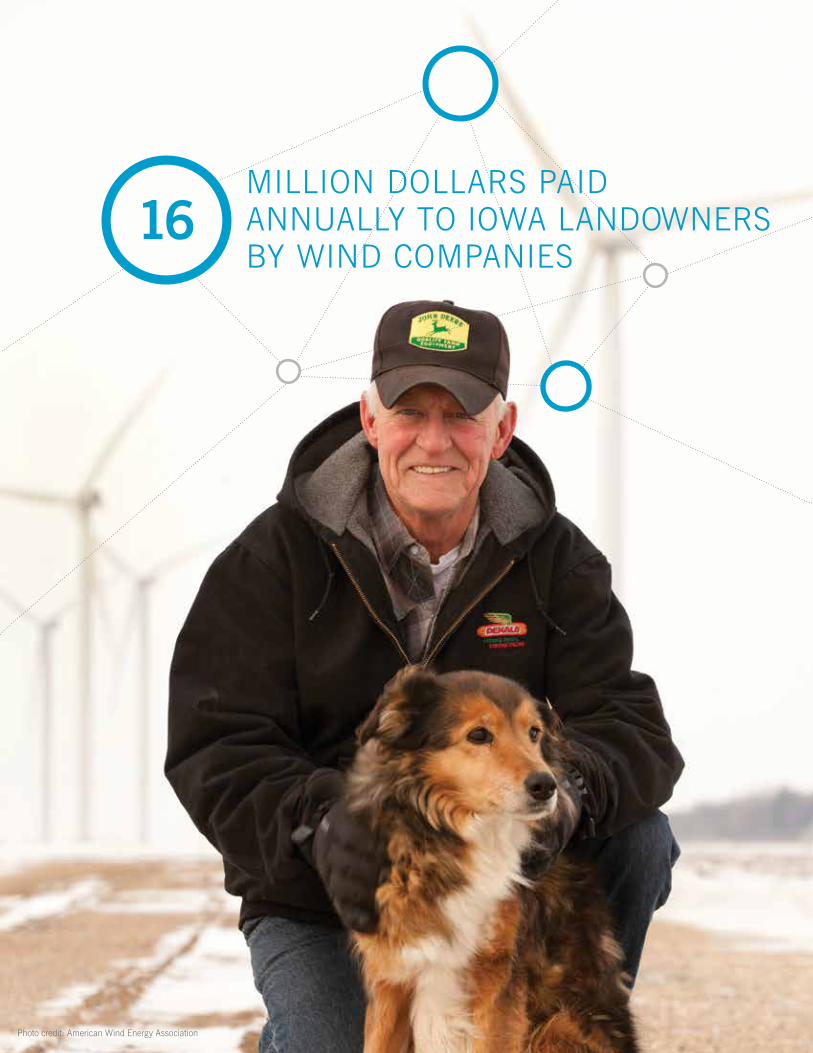
Photo credit: American Wind Energy Association
16MILLION DOLLARS PAID ANNUALLY TO IOWA LANDOWNERS BY WIND COMPANIES
U.S. POWER
U.S. TRANSPORTATION
U.S. CLIMATE
U.S. BUILDINGS
CHINA INDUSTRY
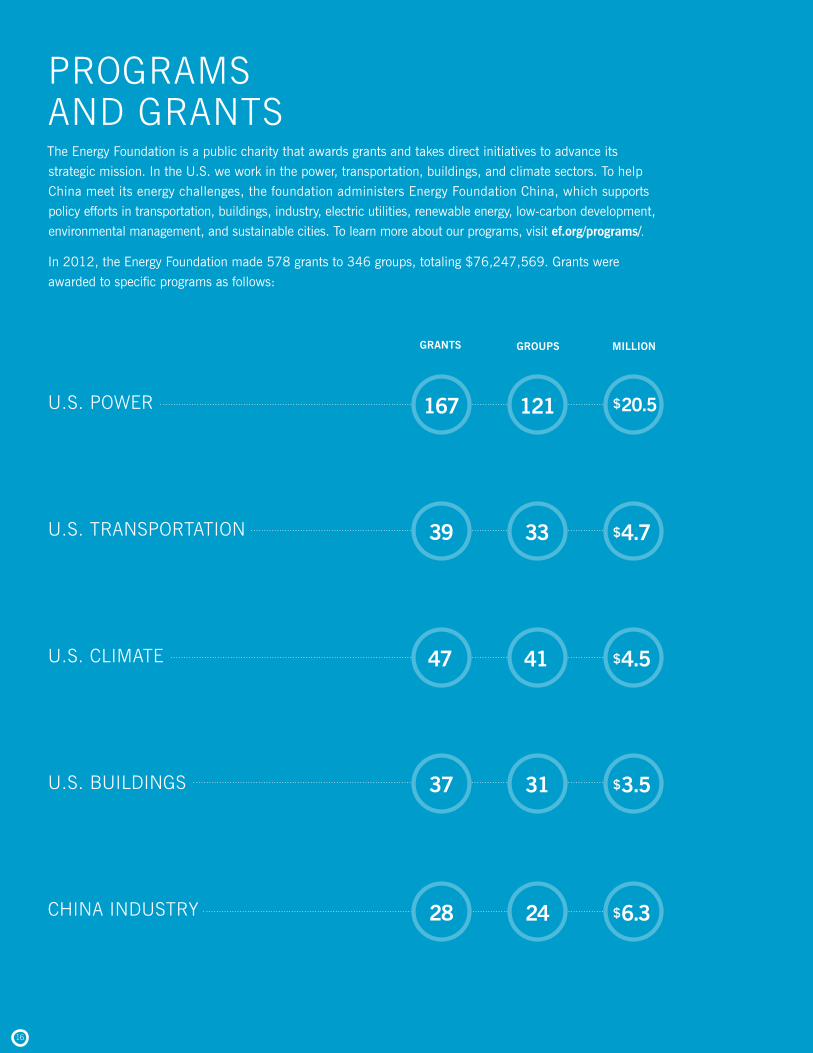
The Energy Foundation is a public charity that awards grants and takes direct initiatives to advance its
strategic mission. In the U.S. we work in the power, transportation, buildings, and climate sectors. To help
China meet its energy challenges, the foundation administers Energy Foundation China, which supports
policy efforts in transportation, buildings, industry, electric utilities, renewable energy, low-carbon development,
environmental management, and sustainable cities. To learn more about our programs, visit ef.org/programs/.
In 2012, the Energy Foundation made 578 grants to 346 groups, totaling $76,247,569. Grants were
awarded to specific programs as follows:
PROGRAMS AND GRANTS
GRANTS GROUPS MILLION
$6.3
$3.5
$4.5
$4.7
$20.5
24
31
41
33
121
28
37
47
39
167
16
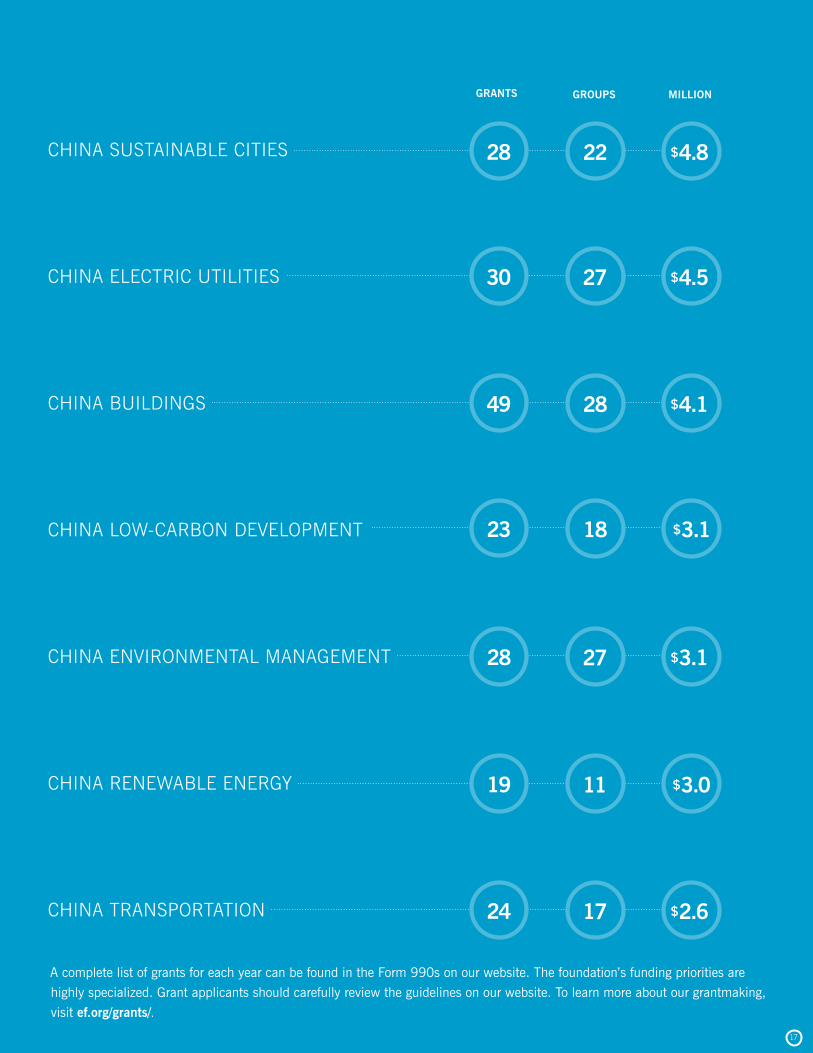
A complete list of grants for each year can be found in the Form 990s on our website. The foundation’s funding priorities are
highly specialized. Grant applicants should carefully review the guidelines on our website. To learn more about our grantmaking,
visit ef.org/grants/.
CHINA SUSTAINABLE CITIES
CHINA ELECTRIC UTILITIES
CHINA BUILDINGS
CHINA LOW-CARBON DEVELOPMENT
CHINA ENVIRONMENTAL MANAGEMENT
CHINA RENEWABLE ENERGY
CHINA TRANSPORTATION
17
GRANTS GROUPS MILLION
$2.6
$3.0
$3.1
$3.1
$4.1
$4.8
17
11
27
18
28
22
24
19
28
23
49
$4.52730
28
18
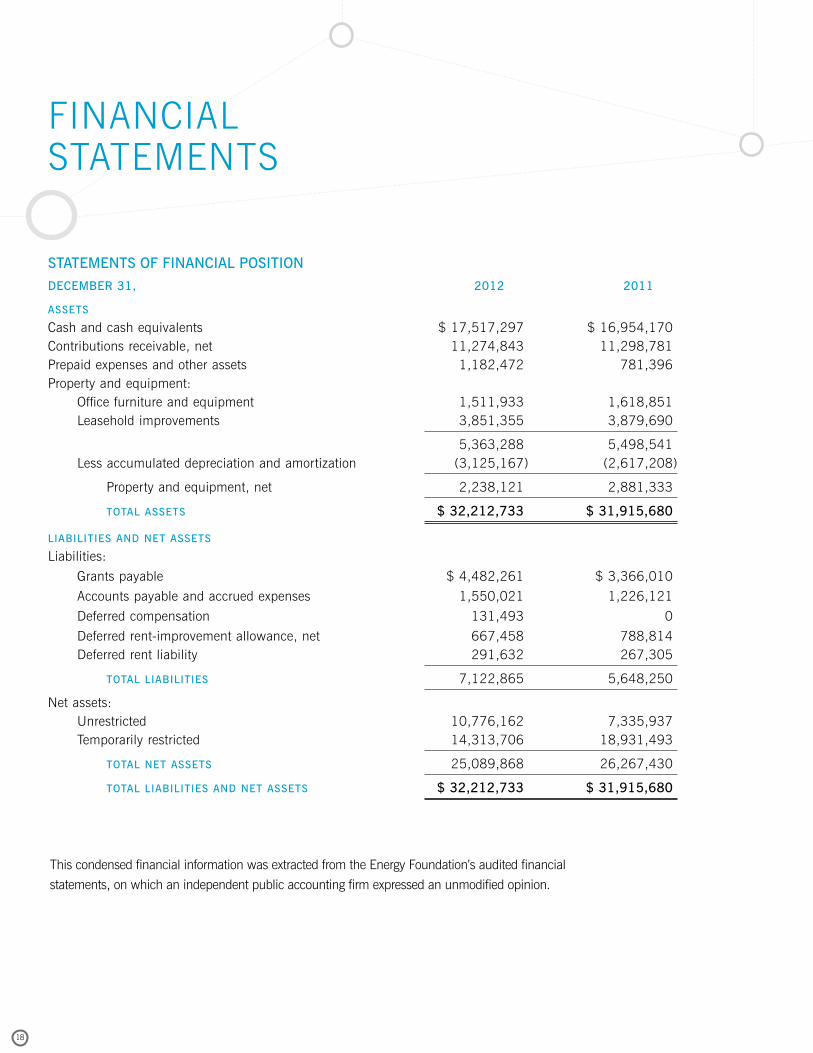
STATEMENTS OF FINANCIAL POSITIONDECEMBER 31, 2012 2011
ASSETS
Cash and cash equivalents $ 17,517,297 $ 16,954,170 Contributions receivable, net 11,274,843 11,298,781Prepaid expenses and other assets 1,182,472 781,396Property and equipment: Office furniture and equipment 1,511,933 1,618,851 Leasehold improvements 3,851,355 3,879,690
5,363,288 5,498,541 Less accumulated depreciation and amortization (3,125,167) (2,617,208)
Property and equipment, net 2,238,121 2,881,333
TOTAL ASSETS $ 32,212,733 $ 31,915,680
LIABILITIES AND NET ASSETS
Liabilities:
Grants payable $ 4,482,261 $ 3,366,010
Accounts payable and accrued expenses 1,550,021 1,226,121
Deferred compensation 131,493 0
Deferred rent-improvement allowance, net 667,458 788,814 Deferred rent liability 291,632 267,305
TOTAL LIABILITIES 7,122,865 5,648,250
Net assets: Unrestricted 10,776,162 7,335,937 Temporarily restricted 14,313,706 18,931,493
TOTAL NET ASSETS 25,089,868 26,267,430
TOTAL LIABILITIES AND NET ASSETS $ 32,212,733 $ 31,915,680
This condensed financial information was extracted from the Energy Foundation’s audited financial
statements, on which an independent public accounting firm expressed an unmodified opinion.
FINANCIALSTATEMENTS
19
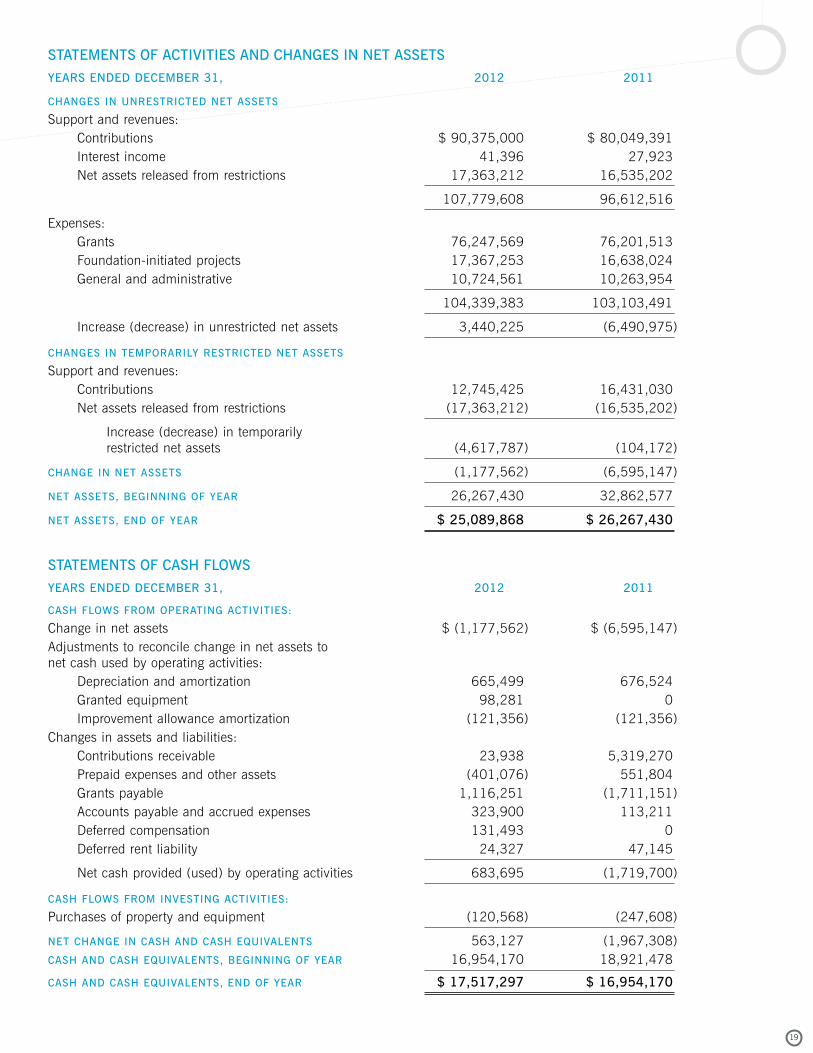
STATEMENTS OF ACTIVITIES AND CHANGES IN NET ASSETSYEARS ENDED DECEMBER 31, 2012 2011
CHANGES IN UNRESTRICTED NET ASSETS
Support and revenues: Contributions $ 90,375,000 $ 80,049,391 Interest income 41,396 27,923 Net assets released from restrictions 17,363,212 16,535,202
107,779,608 96,612,516
Expenses: Grants 76,247,569 76,201,513 Foundation-initiated projects 17,367,253 16,638,024 General and administrative 10,724,561 10,263,954
104,339,383 103,103,491
Increase (decrease) in unrestricted net assets 3,440,225 (6,490,975)
CHANGES IN TEMPORARILY RESTRICTED NET ASSETS Support and revenues: Contributions 12,745,425 16,431,030 Net assets released from restrictions (17,363,212) (16,535,202)
Increase (decrease) in temporarily restricted net assets (4,617,787) (104,172)
CHANGE IN NET ASSETS (1,177,562) (6,595,147)
NET ASSETS, BEGINNING OF YEAR 26,267,430 32,862,577
NET ASSETS, END OF YEAR $ 25,089,868 $ 26,267,430
STATEMENTS OF CASH FLOWSYEARS ENDED DECEMBER 31, 2012 2011
CASH FLOWS FROM OPERATING ACTIVITIES:
Change in net assets $ (1,177,562) $ (6,595,147)Adjustments to reconcile change in net assets to net cash used by operating activities: Depreciation and amortization 665,499 676,524 Granted equipment 98,281 0 Improvement allowance amortization (121,356) (121,356)Changes in assets and liabilities: Contributions receivable 23,938 5,319,270 Prepaid expenses and other assets (401,076) 551,804 Grants payable 1,116,251 (1,711,151) Accounts payable and accrued expenses 323,900 113,211 Deferred compensation 131,493 0 Deferred rent liability 24,327 47,145
Net cash provided (used) by operating activities 683,695 (1,719,700)
CASH FLOWS FROM INVESTING ACTIVITIES:
Purchases of property and equipment (120,568) (247,608)
NET CHANGE IN CASH AND CASH EQUIVALENTS 563,127 (1,967,308)CASH AND CASH EQUIVALENTS, BEGINNING OF YEAR 16,954,170 18,921,478
CASH AND CASH EQUIVALENTS, END OF YEAR $ 17,517,297 $ 16,954,170
20
Mark BurgetEXECUTIVE VICE PRESIDENT AND NORTH AMERICAN REGIONAL DIRECTORTHE NATURE CONSERVANCYSAN FRANCISCO, CA
Robert CraneFORMER PRESIDENT AND CEOJEHT FOUNDATIONNEW YORK, NY
Eric HeitzPRESIDENTENERGY FOUNDATIONSAN FRANCISCO, CA
Khee Poh LamPROFESSOR OF ARCHITECTURECARNEGIE MELLON UNIVERSITYPITTSBURGH, PA
Alan LloydPRESIDENTINTERNATIONAL COUNCIL ON CLEAN TRANSPORTATIONSAN FRANCISCO, CA
Kris MayesDIRECTOR, PROGRAM ON LAW AND SUSTAINABILITYSANDRA DAY O’CONNOR COLLEGE OF LAW ARIZONA STATE UNIVERSITYTEMPE, AZ
Bill Ritter, Jr.DIRECTOR CENTER FOR THE NEW ENERGY ECONOMYCOLORADO STATE UNIVERSITYFORT COLLINS, CO
William RuckelshausSTRATEGIC DIRECTORMADRONA VENTURE GROUP LLCSEATTLE, WA
Phil SharpPRESIDENTRESOURCES FOR THE FUTUREWASHINGTON, DC
Noa StarykPARTNERCNOTE MANAGEMENTMINNEAPOLIS, MN
Sue TierneyPRESIDENT MANAGING PRINCIPALANALYSIS GROUP INC.BOSTON, MA
Michael WangSENIOR SCIENTISTCENTER FOR TRANSPORTATION RESEARCH ARGONNE NATIONAL LABORATORYLEMONT, IL
Hongjun ZhangPARTNERHOLLAND AND KNIGHT LLPWASHINGTON, DC
BOARDOF DIRECTORS

21
ENDNOTES
1. Environmental and Energy Study Institute, Jobs in Renewable Energy and Energy Efficiency, June 2013.
2. “MidAmerican Energy Company Announces Details of 1,050 Megawatt Wind Expansion,” August 12, 2013, http://www.midamericanenergy.com/wind_news.aspx.
3. Michigan Public Service Commission, Department of Licensing and Regulatory Affairs, Report on the Implementation of the P.A. 295 Renewable Energy Standard and the Cost-effectiveness of the Energy Standards, February 15, 2013.
4. Synapse Energy Economics Inc., The Potential Rate Effects of Wind Energy and Transmission in the Midwest ISO Region, August 31, 2012.
5. Ohio Department of Development, Ohio: Wind Works in Ohio, http://development.ohio.gov/files/bs/WindEnergy_Brochure.pdf.
6. Kristi E. Swartz, “Wind Energy Tax Credit Has Bipartisan Support, Rove, Gibbs Say,” The Atlanta Journal Constitution, June 5, 2012, http://www.ajc.com/news/business/wind-energy-tax-credit-has-bipartisan-support-rove/nQWKc.
7. Consumers Energy, discovery response to the Association of Businesses Advocating Tariff Equity in Michigan Public Service Commission Case U-17429, August 12, 2013.
8. Michigan Public Service Commission and Michigan Energy Office, Readying Michigan to Make Good Energy Decisions: Renewable Energy, September 20, 2013.
9. Governor Sam Brownback, “Wind Offers Clean Path to Growth,” The Wichita Eagle, September 11, 2011, http://www.kansas.com/2011/09/11/2011116/gov-sam-brownback-wind-offers.html.
MORE INFORMATION
DESIGN Karen Capraro, San Francisco PRINTING 100% post-consumer recycled paper with soy-based inks.
Visit our new website to find out more about our programs, grantmaking, grantees, board members,
and staff at www.ef.org.
A PARTNERSHIP OF PHILANTHROPIC INVESTORS PROMOTING CLEAN ENERGY TECHNOLOGY
U.S. OFFICES
HEADQUARTERS
301 Battery St., 5th Floor
San Francisco, CA 94111
P 415.561.6700
F 415.561.6709
www.ef.org
SOUTHEAST
14 East Peace Street, 3rd Floor
Raleigh, NC 27602
P 919.425.0086
MIDWEST
Chicago, Illinois, office opening
January 2014
CHINA OFFICE
CITIC Building, Room 2403
No. 19, Jianguomenwai Dajie
Beijing, 100004 P.R., China
P 86.10.8526.2422
F 86.10.6525.3764
www.efchina.org