Embed Size (px)
Citation preview

This paper presents preliminary findings and is being distributed to economists
and other interested readers solely to stimulate discussion and elicit comments.
The views expressed in this paper are those of the authors and do not necessarily
reflect the position of the Federal Reserve Bank of New York or the Federal
Reserve System. Any errors or omissions are the responsibility of the authors.
Federal Reserve Bank of New York
Staff Reports
The Microstructure of a U.S. Treasury ECN:
The BrokerTec Platform
Michael J. Fleming
Bruce Mizrach
Giang Nguyen
Staff Report No. 381
July 2009
Revised March 2017

The Microstructure of a U.S. Treasury ECN: The BrokerTec Platform
Michael J. Fleming, Bruce Mizrach, and Giang Nguyen
Federal Reserve Bank of New York Staff Reports, no. 381
July 2009; revised March 2017
JEL classification: C32, G12, G14
Abstract
We assess the microstructure of the U.S. Treasury securities market following its migration to
electronic trading. We model price discovery using a vector autoregression model of price and
order flow. We show that both trades and limit orders affect price dynamics, suggesting that
traders also choose limit orders to exploit their information. Moreover, while limit orders have
smaller price impact, their greater variation contributes more to the variance of price updates.
Lastly, we find increased price impact of trades and especially limit orders following major
announcements (such as FOMC rate decisions and macroeconomic data releases), suggesting that
the private information derived from public information is disproportionally exploited through
limit orders.
Key words: microstructure, Treasury market, bid-ask spread, price impact, information
_________________
Fleming: Federal Reserve Bank of New York (e-mail: [email protected]). Mizrach: Rutgers University (e-mail: [email protected]). Nguyen: Pennsylvania State University (e-mail: [email protected]). The authors thank Gideon Saar for editing the paper and two anonymous referees for their suggestions. They also thank Bruno Biais, Peter Dunne, Sergio Ginebri, Frank de Jong, Carol Osler, Jennifer Roush, and seminar participants at the Bank of Canada, the Third Annual Central Bank Conference on the Microstructure of Financial Markets, the Federal Reserve System Conference on Financial Markets and Institutions, the Fourth MTS Conference on Financial Markets, and the University of Cambridge conference “High Frequency Dynamics and Bond Markets” for helpful comments. The authors thank Nicholas Klagge, Neel Krishnan, Michal Lementowski, Weiling Liu, Ron Yang, and Collin Jones for invaluable research assistance and Arthur D’Arcy, Dan Cleaves, and Stuart Wexler from ICAP for clarifying how the BrokerTec platform works. The views expressed in this paper are those of the authors and do not necessarily reflect the position of the Federal Reserve Bank of New York or the Federal Reserve System.
1 Introduction
Since the early 2000’s, interdealer trading in the most recently auctioned U.S. Treasury securities
has migrated from voice-assisted brokers to two electronic communications networks (ECNs),
BrokerTec and eSpeed. This paper examines the microstructure of the U.S. Treasury securities
market using tick data from the BrokerTec ECN. It is the first paper to provide a comprehensive
picture of this important market in the new electronic trading era, and one of the first to analyze
any fixed income ECN.1 Our study is motivated by the fact that many previous papers on the
microstructure of the Treasury market are based on data from GovPX, which consolidates data from
voice-assisted brokers.2 The migration of bond trading to the electronic platforms (which do not
contribute to GovPX) sharply reduced GovPX coverage of the interdealer market, as noted by Boni
and Leach (2004) and others, and naturally shifted interest to the electronic platforms.
However, it is not only the change in coverage, but also the change in the trading environment
that warrants a revisit of this market. Barclay, Hendershott, and Kotz (2006) suggest that auto-
mated trading systems will grow to dominate human intermediation as trading activity increases,
especially in the actively traded Treasury securities. Electronic trading facilitates greater speed of
order manipulation and execution, permits an increased role for computer-driven and automated
trading processes, and enables better market information collection, dissemination and processing.
Accordingly, trading activity, market liquidity and price discovery might differ from the earlier
1Campbell and Hendry (2007) examine price discovery in the 10-year U.S. Treasury note using transactions datafrom BrokerTec. Mizrach and Neely (2006) estimate bid-ask spreads and market impact using transactions data fromeSpeed. Additional studies examine the euro area sovereign debt market using data from MTS (e.g., Cheung, de Jong,and Rindi (2005), Menkveld, Cheung, and de Jong (2005), and Beber, Brandt, and Kavajecz (2009)). In addition, sincethe first draft of this paper, several newer studies have looked at different aspects of the U.S. Treasury market using datafrom BrokerTec or eSpeed. For example, Dungey, Henry, and McKenzie (2013) model trade duration on the eSpeedplatform, Engle, Fleming, Ghysels, and Nguyen (2012) examine intraday dynamics of market liquidity and volatility onthe BrokerTec platform, and Fleming and Nguyen (2013) study the order flow segmentation induced by the workupprotocol on BrokerTec and evaluate the informational content of workup and non-workup trades, and Jiang and Lo(2014) quantify the intensity of private information flow on BrokerTec and examine its impact on price discovery.
2Fleming (1997) characterizes intraday liquidity, Fleming and Remolona (1997), Fleming and Remolona (1999),Balduzzi, Elton, and Green (2001), Huang, Cai, and Wang (2002), and Fleming and Piazzesi (2005) look at announce-ment effects, Fleming (2002) examines the relationship between issue size and liquidity, Fleming (2003), Brandt andKavajecz (2004), Green (2004), and Pasquariello and Vega (2007) assess the information content of trades, Goldreich,Hanke, and Nath (2005) gauge the relationship between liquidity and value, and Brandt, Kavajecz, and Underwood(2007), Campbell and Hendry (2007), and Mizrach and Neely (2008) compare the information content of trades in spotand futures markets.
1

market structure in important ways, which we seek to analyze.
Using tick data from 2010 and 2011, we examine trading activity and liquidity on the BrokerTec
platform for the on-the-run 2-, 3-, 5-, 7-, 10-, and 30-year Treasury securities.3 Our findings suggest
that liquidity on the BrokerTec platform is markedly greater than that found by earlier studies using
data from GovPX. BrokerTec trading volume in the on-the-run securities has increased sharply over
the years, albeit declined during the crisis, and averaged $126 billion per day for the 2010-2011
period. Inside bid-ask spreads for maturities of five years or less average less than 1/100th of one
percent. An average of over $300 million is available on the platform at the best price on either side
of the book for the 2-year note, $80 million for the 3-year note, and roughly $30 million for the 5-,
7- and 10-year notes. The breadth of the BrokerTec tick data allows us to examine market liquidity
beyond the inside tier for the first time and, in fact, there are even greater amounts available at the
adjacent price tiers. Across the whole book, there is about $2.4 billion on each side for the 2-year
note, $700 million for the 3-year note, and around $400 million for the 5- and 10-year notes.
In addition to describing the BrokerTec ECN, our paper makes two further contributions. First,
we examine the price impact of not only trades but also of order book activities. Previous studies
based on GovPX data (e.g. Fleming (2003), Brandt and Kavajecz (2004), and Green (2004)), or
more recent papers based on data from either of the electronic platforms (e.g., Jiang and Lo (2014)),
are only concerned with the price impact of trades. However, given the sheer levels of limit order
book activities in comparison to trades, there is much to be learned about how such activities affect
price dynamics. As discussed in O’Hara (2015), in today’s high frequency trading world, the
classical notion of trades being the basic unit of market information is no longer sufficient. Instead,
underlying limit orders are also likely to contain information. Earlier studies of equity markets that
incorporate order book information into the market impact function, e.g., Engle and Patton (2004),
Mizrach (2008), and Hautsch and Huang (2012), show that limit orders also have significant impact.
We first calculate the permanent price impact of trades following the framework in Hasbrouck
(1991a). We find that the price impact of trades on BrokerTec is generally quite small, but increases
3On-the-run securities are the most recently auctioned securities of a given maturity
2
in the maturity of the securities considered, ranging from 0.006/256 of one percent of par per $1
million buyer-initiated volume for the 2-year note to 0.450/256 for the 30-year bond. Equivalently,
it takes about $363 million in signed trading volume to move the price of the 2-year note by 2/256
(one tick), whereas the required volume is only $4.5 million to move the price of the 30-year bond
by the same amount (or roughly $9 million to move the price by one tick, which is twice as wide for
the 30-year bond as it is for the 2-year note). Taking into account individual securities’ variability
in trading sizes and price changes, we find that a one standard deviation shock in trade order flow
increases the price permanently by about 0.2-0.3 standard deviations of the trade-to-trade price
change.
More importantly, we show that limit order activities affect prices, and in fact contribute more
to the variance of efficient price updates than trades, given limit orders’ much higher intensity and
variation as compared to trades. The evidence that limit orders also contain value-relevant infor-
mation suggests that, contrary to the conventional assumption that traders with better information
are liquidity demanders (i.e., trade immediately via aggressive orders), they also use limit orders in
their trading strategies. Our results support O’Hara (2015)’s view that the nature of information
in a high frequency world has changed, and that learning from market data is more complex than
observing merely the aggressive side to each trade. From an empirical analysis perspective, our
finding shows that ignoring limit orders in analyzing price discovery results in an overestimation
of trades’ price impact. Specifically, the price impact of trades is about 20-50% higher when limit
orders are ignored than when they are accounted for.
Furthermore, one commonly cited characteristic of a high speed market is the large number
of order submissions and cancellations. On the BrokerTec platform, cancellation rates during our
sample period are over 95%. Quickly submitting and cancelling orders appears to have become the
new normal in electronic markets (see O’Hara (2015), Baruch and Glosten (2015), and references
therein). Nevertheless, as O’Hara (2015) points out, the information effects of these activities are
not yet well understood. Given that submissions and cancellations occur much more frequently than
trades, and that trading algorithms draw inferences from market data to devise trading strategies, it
3

is natural to expect that these activities play a non-trivial role in the price discovery process. To this
end, we incorporate order submissions and cancellations separately in our price discovery analysis,
and find that they do have significant and differential price effects, with submissions having a price
impact that is about 4-11% higher than that of cancellations.
Another contribution of our paper is to further understanding of the nature of “private informa-
tion” in the Treasury market. We perform price discovery analysis around major announcements
to explore the idea put forth by Pasquariello and Vega (2007), among others, that Treasury traders
obtain information advantage from public information. The information events we study include
FOMC rate decision announcements, and five key macroeconomic reports, including employment,
retail sales, GDP, CPI, and PPI (see Faust, Rogers, Wang, and Wright (2007)). We find that trades
and limit orders are generally more informative in the 60-minute window after these announcements
as compared to a similar time window on non-announcement days, and that they also contain
relatively more information in the post-announcement period than in the pre-announcement period.
Moreover, the proportionate increase in information content is greater for limit orders than it is for
trades. These findings suggest that the private information derived from public information in the
Treasury market is disproportionately exploited through limit orders.
The paper is organized as follows. Section 2 discusses the evolution of U.S. Treasury market
structure to provide essential background for the main analysis. Section 3 describes the BrokerTec
data and the microstructure of the BrokerTec platform, and presents univariate analyses of trading
activity and market liquidity. Next, Section 4 presents and discusses evidence on the information
content of trades and limit orders. Section 5 then shows our price discovery analysis around key
public information events. Section 6 summarizes our key results and provides concluding remarks.
2 The Evolution of U.S. Treasury Market Structure
The secondary market for U.S. Treasury securities is a multiple dealer, over-the-counter market.
Traditionally, the predominant market makers were the primary government securities dealers, those
4

dealers with a trading relationship with the Federal Reserve Bank of New York. The dealers trade
with the Fed, their customers, and one another. The core of the market is the interdealer broker
(IDB) market, which accounts for nearly all interdealer trading. Trading in the IDB market takes
place 22-23 hours per day during the week, although we find that slightly over 90% of trading
occurs during New York hours, roughly 7:00 to 17:30 Eastern time (comparable with what Fleming
(1997) finds using GovPX data).
Until 1999, nearly all trading in the IDB market occurred over the phone via voice-assisted
brokers. Voice-assisted brokers provide dealers with proprietary electronic screens that post the
best bid and offer prices called in by the dealers, along with the associated quantities. Quotes are
binding until and unless withdrawn. Dealers execute trades by calling the brokers, who post the
resulting trade price and size on their screens. The brokers thus match buyers and sellers, while
ensuring anonymity, even after a trade. In compensation for their services, brokers charge a fee.
Most previous research on the microstructure of the Treasury market has used data from voice-
assisted brokers, as reported by GovPX, Inc. GovPX receives market information from IDBs and
re-disseminates the information in real time via the internet and data vendors. Information provided
includes the best bid and offer prices, the quantity available at those quotes, and trade prices and
volumes. In addition to the real-time data, GovPX sells historical tick data, which provides a record
of the real-time data feed for use by researchers and others.
When GovPX started operations in June 1991, five major IDBs provided it with data, but Cantor
Fitzgerald did not, so that GovPX covered about two-thirds of the interdealer market. The migration
from voice-assisted to fully electronic trading in the IDB market began in March 1999 when Cantor
Fitzgerald introduced its eSpeed electronic trading platform.4 In June 2000, BrokerTec Global LLC,
a rival electronic trading platform, began operations.5 As trading of on-the-run securities migrated
to these two electronic platforms, and the number of brokers declined due to mergers, GovPX’s data
coverage dwindled. By the end of 2004, GovPX was receiving data from only three voice-assisted
4Cantor spun eSpeed off in a December 1999 public offering. After many ownership changes, eSpeed merged withBGC Partners, an offshoot of the original Cantor Fitzgerald. In 2013, eSpeed was purchased by NASDAQ OMX Group.
5BrokerTec had been formed the previous year as a joint venture of seven large fixed income dealers. BrokerTecwas acquired in May 2003 by ICAP PLC.
5

brokers. After ICAP’s purchase of GovPX in January 2005, ICAP’s voice brokerage unit was the
only brokerage entity reporting through GovPX.6
The BrokerTec and eSpeed ECNs are fully automated electronic trading platforms where buyers
are matched to sellers without human intervention. A comparison of BrokerTec trading activity
with that of eSpeed reported in Luo (2010) and Dungey, Henry, and McKenzie (2013) shows that
BrokerTec accounts for about 60% of electronic interdealer trading in the on-the-run 2-, 5-, and
10-year notes and slightly above 50% for the 30-year bond.
Both brokers provide electronic screens that display the best bid and offer prices and associated
quantities. On BrokerTec, for example, a manual trader can see five price tiers and corresponding
total size for each tier on each side of the book, plus individual order sizes for the best 10 bids
and offers. For computer-based traders, the complete order book information is available. Traders
enter limit orders or hit/take existing orders electronically. As with the voice brokers, the electronic
brokers ensure trader anonymity, even after a trade, and charge a small fee for their services.
In the early days of BrokerTec, market participants were mainly government securities dealers.
However, since 2004, BrokerTec has opened access to non-dealer participants, including hedge
funds, asset managers, and high frequency trading firms (HFTs). Table 3.3 (p. 59) in the recent
Joint Staff Report (2015) on the U.S. Treasury market shows that bank-dealers account for 34.7% of
trading volume in the on-the-run 10-year note, compared to HFTs’ share of 56.3%. The remaining
9% is split among non-bank dealers, hedge funds, and asset managers.7 These statistics show that
the interdealer market for U.S. Treasury securities, despite the name, is no longer solely for dealers.
The BrokerTec platform operates as an electronic limit order market. Traders send in orders
that can be aggressive (market orders) or passive (limit orders), but they must all be priced. The
priority of execution of limit orders is based on price and time. The minimum order size is $1
million par value. Traders can enter aggressive orders at a price worse than the current best price.
This is typically the case when a trader needs to trade a large quantity for which the limit order
6See Mizrach and Neely (2006) for a detailed description of the migration to electronic trading, and Mizrach andNeely (2011) for a summary of the evolution of the microstructure in the Treasury market.
7The mentioned statistics are based on trading activity on the BrokerTec platform from April 2-17, 2014.
6

quantity at the best price is not sufficient. The order will first exhaust all depth, both displayed and
hidden, at better price levels, until it reaches the originally stated price. Therefore, large aggressive
orders can be executed at multiple prices. However, the incidence of market orders walking up or
down the book is very small. This is likely because of the large amount of depth usually available at
the best price tier, and the ability to work up volume at a given price point.8
The BrokerTec platform allows iceberg orders, whereby a trader can choose to show only part
of the amount he is willing to trade. As trading takes away the displayed portion of an iceberg order,
the next installment of hidden depth equal to the pre-specified display size is then shown. This
process continues until trading completely exhausts the iceberg order. It is not possible to enter
iceberg orders with zero displayed quantity; that is, limit orders cannot be completely hidden.
Beside iceberg orders, the electronic brokers have retained the workup feature similar to the ex-
pandable limit order protocol of the voice-assisted brokers, but with some important modifications.9
On BrokerTec, the most important change is that the right-of-first-refusal – previously given to the
original parties to the transaction – has been eliminated, giving all market participants immediate
access to workups. All trades consummated during a workup are assigned the same aggressive side
as the original market order.10
3 Data
Our analysis is based on tick data from the BrokerTec platform. The database provides a compre-
hensive record of every trade and order book change in the BrokerTec system for the on-the-run 2-,
3-, 5-, 7- and 10-year Treasury notes as well as the 30-year Treasury bond. We choose to focus on
the period from January 2, 2010 to December 31, 2011 to provide a characterization of the market’s
8Fleming and Nguyen (2013) show that, with the workup protocol in place, marketable orders rarely walk the book.The percent of marketable orders sweeping more than one price levels is less than 0.5%.
9Boni and Leach (2004) provide a thorough explanation of this feature in the voice-assisted trading system. Thefeature allows a Treasury market trader whose order has been executed to have the right-of-first-refusal to tradeadditional volume at the same price. As a result, the trader might be able to have his market order fulfilled even thoughthe original quoted depth is not sufficient. That is, the quoted depth is expandable.
10For a detailed analysis of workup activity on BrokerTec, see Fleming and Nguyen (2013).
7

microstructure in a non-crisis trading environment.11
3.1 Data Processing
From BrokerTec’s detailed record of every trade and order book change, time-stamped to the
millisecond, we process the data into two main parts: the trade data and the order book data.
The trade data include price, quantity, and whether a trade was seller-initiated or buyer-initiated.
The trading process on BrokerTec takes place as follows. When a marketable order arrives, it is
instantaneous matched with outstanding limit order(s) in the book to the extent possible. The market
then enters a workup during which additional quantity can be transacted at the same price as that of
the initial marketable order execution, until there is no further trading interest.
BrokerTec records the execution of each marketable order against multiple limit orders, as
well as further matches during the ensuing workup, as separate trade records. We aggregate these
multiple trade records as one trade (and use the ending time of the workup as the time of trade from
which we compute trade-to-trade price changes).12 The aggregation is in line with BrokerTec’s
workup patent document which states that a workup is conceptually a “single deal extended in
time”. There are further reasons for the aggregation. First, treating the individual trade records as
separate and distinct trades would artificially inflate the serial correlation in both trade initiation and
signed trade flow and might compromise econometric modeling and inferences. Furthermore, our
aggregation permits a more precise analysis of market order submission and the price impact of
market orders, the size of which is better measured by the total volume exchanged during a trade
and its associated workup. Nevertheless, the aggregation is not without cost in that it sometimes
overestimates the market order size.
The second part of the data concerns the limit order book, which we recreate from order book
changes on a tick-by-tick basis. Each order book change record specifies the price, quantity change,
shown and total quantities for that order, whether the order is a bid or an ask, and the reason for the
11For market dynamics during the crisis period, see Engle, Fleming, Ghysels, and Nguyen (2012).12In the BrokerTec database, the arrival of each marketable order, as well as the start and finish of the ensuing workup,
is clearly marked. Therefore, the aggregation of trade records is unambiguous.
8

change. The book can be changed as a result of limit order submission, modification, cancellation,
or execution against market orders. The order book data provide a view of the Treasury market far
more detailed than that provided by GovPX data. In particular, our processed dataset not only tells
us the best bid and offer and associated sizes at any given time, but also the depth available outside
of the first tier. Moreover, we are able to discern what quantities were visible to market participants
at the time and what quantities were hidden.
3.2 Summary Statistics
Over our sample of 500 trading days in 2010 and 2011, BrokerTec intermediated almost $63 trillion
in trading of on-the-run coupon securities, or $125.6 billion per day. The activity involved nearly
6 million transactions (each comprised of one or more order matches), or almost 12,000 per day.
Moreover, there were roughly 2.4 billion order book changes at the first five price tiers alone for
these securities over our sample period, amounting to over 4.7 million per day.
Table 1 provides summary statistics of the transaction data. Trade size is the total quantity
transacted through the execution of a market order and associated workup trades. Trading in the
2-year note averages about $28 million per trade, with a standard deviation of about $54 million,
indicating the presence of very large trades. Average trade sizes in the other securities are markedly
lower, ranging from $3 million to $13 million, and with less variability. Each trade on average
consists of about 2 to 8 individual order matches, of which less than half typically arise from the
initial instantaneous execution of a marketable order against standing limit orders, and the rest
during the ensuing workup. Average trade-to-trade price changes (in 256th’s of one percent of
par) are roughly zero, with standard deviations ranging from 1.01 to 8.17. Average absolute price
changes increase monotonically with maturity, except for the 10-year note, from 0.55 256th’s for
the 2-year note to 4.27 256th’s for the 30-year bond.
We next report the volume of limit orders that flow into and out of the best price level between
trades. These quantities are partly dependent on the trade arrival rate of a given security and thus
show a considerable cross-sectional variation. A key observation is that the volume of limit orders
9
canceled is almost as large as the volume of limit orders submitted. Accordingly, the average limit
order flow net of cancellations is quite small, less than $2 million for all securities except for the
2-year note, which has about $6-7 million in average net limit order flow between trades. We notice
that limit order flows are highly variable, suggesting that at times there are extremely large flows
into or out of the limit order book. For example, at the beginning of each trading day, traders start
sending in orders and the order book fills up quickly. Likewise, the data show that there are massive
withdrawals of limit orders immediately before important announcements and the subsequent entry
of limit orders following such announcements.
3.3 Trends in Trading Activity
To provide historical perspective of trading activity on the BrokerTec platform, we plot in Figure 1
average daily trading volume for the respective on-the-run coupon securities for each year from
2001 to 2011. The figure shows that there has been a sharp increase in trading activity over time,
especially in the early years of the platform’s history before the financial crisis intensified in late
2008. For the 10-year note, for example, average daily trading volume grew from $2.9 billion in
2001 to a level over ten times larger in 2007 and, except for 2009, remained above $30 billion after.
It is worth noting that activity in the 2-year note, which used to exceed that of any other security,
with an average daily trading volume of nearly $50 billion in 2008, did not quickly recover after the
crisis. This contrasts with the post-crisis recovery observed in other securities. In 2010 and 2011,
the 5-year note was the most actively traded, followed by the 10-year note and then the 2-year note.
The post-crisis stagnation in activity for the 2-year note may be explained by the prolonged period
in which the short rate was held at the zero lower bound, dampening volatility and trading interest
in the note.
3.4 Daily Trading Activity
Focusing on the most recent years of 2010 and 2011, Table 2 reports average daily trading volume
and trading frequency for each security. The table shows that trading in the 5- and 10-year notes is
10

most frequent, with over 3,000 transactions per day, on average. The 5-year note is the most actively
traded in terms of volume, with a daily trading volume exceeding $36 billion. The 30-year bond is
also quite frequently traded with nearly 2,000 transactions per day, but each trade is of much smaller
size than that of the other securities, so that its total daily trading volume of nearly $6 billion is far
below the others. On the other hand, the 2-year note has the lowest trading intensity. However, as
noted earlier, trades in this security tend to occur in larger sizes, so the total trading volume per day
is still the third highest, grossing about $26 billion per day.
We also examine the balance between buying and selling pressures in this market. The buy
and sell volume figures appear to split rather evenly, with the sell dollar volume being slightly
higher than the buy volume across all securities. For example, the average daily excess selling
pressure in the 10-year note is $135 million, which is less than one half of one percent of the daily
trading volume of $31.5 billion in this security. Even though the magnitude of the imbalance is
economically small, a formal statistical test allows us to reject the null hypothesis that daily net
order flow (buy volume minus sell volume) is zero.
3.5 Liquidity Around the Clock
Figure 2 plots average BrokerTec trading volume by half-hour interval over the round-the-clock
trading day. To make the intraday patterns comparable across securities, we standardize the half-
hour volume figures by the total daily volume of the relevant security. The patterns are consistent
with what Fleming (1997) finds using GovPX data from 1994 and are strikingly similar across the
six securities. Trading activity is extremely low during Tokyo trading hours (roughly 18:30 or 19:30
the previous day to 3:00 Eastern time), picks up somewhat during morning trading hours in London,
then rises sharply during morning trading hours in New York, peaking between 8:30 and 9:00, and
then peaking locally between 10:00 and 10:30. Trading reaches a final local peak between 14:30
and 15:00 and then tapers off by 17:30. Engle, Fleming, Ghysels, and Nguyen (2012) also find
increased volatility and temporary disappearance of market depth around the 8:30, 10:00, 13:00,
11

14:15 and 15:00 time marks.13 The patterns are probably largely explained by public information
events, the hours of open outcry Treasury futures trading (8:20 to 15:00), and the pricing of fixed
income indices at 15:00.
3.6 Spreads
In Table 3, we report quoted bid-ask spreads for the New York trading hours of 7:00 to 17:30. The
inside quoted spread, shown in the middle column, is the difference between the highest bid price
and lowest ask price expressed in multiples of tick size of the relevant security.14 To compute the
spreads, we sample bid and ask prices every five minutes, and then average over all five-minute
observations in our sample period (we have about 62,000 such five-minute observations for each
security). Spreads are generally increasing in maturity, from 1.03 ticks (2.06 256ths) at the 2-year
maturity to 2.66 ticks (10.64 256ths) at the 30-year maturity. The 10-year note, however, has a
narrower spread than the 7-year note. Statistical tests (not shown) indicate that the spreads are
significantly different across the various maturities.
It is also helpful to compare these spreads to those reported in earlier studies using GovPX
data. In general, BrokerTec spreads are narrower. Fleming (2003), for example, reports average
bid-ask spreads of 3.12 256ths for the 5-year note and 6.24 256ths for the 10-year note, whereas the
corresponding BrokerTec spreads are 1.18 ticks (or 2.36 256ths) and 1.15 ticks (or 4.60 256ths)
respectively for these securities.15 As discussed in the Joint Staff Report (2015) (pp. 37-39), there
has been a major change in the composition of market participants in recent years, leading to
increased competition in liquidity provision. A narrower spread is consistent with this development.
A noteworthy feature of the average BrokerTec spreads is that they are quite close to one tick
for all of the notes, suggesting that the minimum increment is constraining. Further examining the
13Many important scheduled macroeconomic announcements are released at 8:30 and 10:00. U.S. Treasury auctionstypically close at 13:00. Most Federal Open Market Committee (FOMC) announcements in recent years have beenmade at 14:15, although three FOMC announcements were made at 12:30 in 2011.
14The tick size for the 2-, 3-, and 5-year securities is 1/128 of one percent of par, equivalent to $78.125 per $1 millionpar, and that for the 7-, 10- and 30-year securities is 1/64 of one percent of par, or $156.25 per $1 million par.
15Note that the prices in both databases do not reflect brokerage fees. Such fees are proprietary, and can vary bycustomer and with volume, but are unquestionably lower for the electronic brokers than the voice-assisted brokers.
12

frequency distribution of inside spreads, shown in Figure 3, we observe a high degree of clustering
at one tick (e.g., 97% for the 2-year note), except for the 30-year bond whose distribution is more
spread out and peaks at two ticks. Compared to equity markets’ tick size of one penny, the minimum
tick size in the U.S. Treasury market appears large given its relatively low volatility. This means
that the compensation for liquidity provision is relatively large, but also means that the transaction
costs for those who need to trade is large. Crossing the spread in the 2-year note – the shortest
maturity among the coupon Treasury securities – is particularly costly in the zero rate environment.
Furthermore, we show in Table 3 that these securities, except for the 30-year bond, have tightly
populated order books over the first five price levels. That is, the average price distance between
adjacent price levels (up to the fifth level in the book) is roughly one tick, although it gets slightly
wider further away from the inside tier.
3.7 Market Depth
As a limit order market, liquidity on BrokerTec is supplied by limit orders submitted by market
participants. Table 4 reports the average total visible quantity of limit orders available at the best
price level on each side of the market. We compute market depth variables from five-minute
snapshots of the limit order book - the same data used in our analysis of the bid-ask spread. We also
report for the first time the amount of standing limit orders at the best five price levels, as well as
the total depth across all price levels in the limit order book. This provides a complete overview of
liquidity supply in the market at a given point in time, and helps further our understanding of the
extent to which liquidity supply is concentrated at the top of the book.
The table shows that market depth is generally declining in maturity, greatest at the 2-year and
lowest at the 30-year segment. At the inside price tier, there is about $300 million available on
either side for trading in the 2-year note. We observe that, despite being the most actively traded,
the 5- and 10-year notes’ market depth is on the lower end, averaging $26-31 million, suggesting
higher replenishment rates of liquidity to meet the high trading activity levels. Our observations are
supported by statistical tests (not reported) that confirm that the differences in market depth among
13

various maturities are statistically significant.
The inside depths reported here greatly exceed average depths on GovPX reported by earlier
studies. For the 2-year note, for example, Fleming (2003) reports average depth on GovPX at the
first tier of just $25 million (averaging across the bid and ask side), less than one tenth the level
observed on BrokerTec.
Additionally and importantly, earlier studies using GovPX data are limited to the inside tier,
leaving market liquidity beyond the first tier unknown. We show that market liquidity away from
the first tier is substantial, several orders of magnitude larger than that available at the inside tier.
Collectively across the best five tiers on each side, there is over $1.5 billion market depth for the
2-year note, about $460 million for the 3-year note, in the range of $210-280 million for each of the
5-, 7- and 10-year notes, and $28 million for the 30-year bond. The first five tiers account for about
55-79% of total market depth for the notes and 47% of total market depth for the bond. That is,
the first five tiers collect a disproportionately large amount of depth, given that there are typically
around 16-18 price tiers with positive depth on each side (slightly higher for the 5- and 10-year
notes).16
While depth in the book concentrates among the best five tiers, the inside tier is not the one with
the greatest depth. To learn more about the depth distribution in the book away from the inside tier,
we graph the average depth at each of the best five tiers on the bid and ask side of the order book in
Figure 4. The figure illustrates again that order book depth outside the first tier is considerable. A
common pattern emerges across all securities in that there is consistently more quantity available at
the second and third price tiers (and even fourth and fifth for some securities) than the first. The
available quantity generally peaks at the second tier on both the bid and ask sides for the notes, and
at the third tier for the bond. Depth then declines monotonically as one moves further away from
the inside quotes. Biais, Hillion, and Spatt (1995) also find depth lower at the first tier than the
second tier, but find similar depths at the second through fifth tiers.
16The maximum number of price levels on one side during our sample period ranges from 43 for the 30-year bond(on the bid side) to 101 for the 2-year note (on the ask side).
14

3.8 Hidden Depth
On the BrokerTec platform, traders have the option to hide part of their order size. Therefore, the
visible depth might not reflect the full extent of liquidity in the market. However, as revealed in
Figure 4, hidden depth is only a small share of total depth at each price tier on average, with the first
tier having proportionally more hidden depth than others. Our data show that less than 2% of the
limit orders submitted to the top tier of the book contains some hidden volume, which contributes
to explain the low level of hidden depth in the limit order book at any given point in time.17
4 Price Impact Analysis
In this section, we address the question of whether, and the extent to which, trading and limit
order activities convey value-relevant information. It is often believed that there is no private
information in this market, as everyone has access to the same set of public information. However,
as noted in Pasquariello and Vega (2007), information advantage in this market might come from
private knowledge of client order flow, or a superior ability in processing and interpreting public
information. As a result, some market participants might be more informed than others.
We quantify the information content of traders’ activities by the permanent price impact of
these activities, building upon the vector autoregression (VAR) model of trade and price revision
developed by Hasbrouck (1991a) to measure the information content of stock trades. This VAR
model is rooted in theoretical microstructure models of information asymmetry. Upon observing a
trade, the market maker infers the probability of trading with an informed trader, and update prices
accordingly. The price revision process thus reflects the information set of the market maker at each
price update, which includes the contemporaneous trade, as well as the history of prices and trades
up to that point. The dynamics of trade are modeled to account for the possible autocorrelation in
trade flow, and the possibility that past price movements play a role in a trade decision, by including
17Studies on hidden depth in equity markets reveal greater prevalence of iceberg orders. For example, Bessembinder,Panayides, and Venkataraman (2009) show that iceberg orders account for 18% of order flow for stocks on Euronext-Paris, while Frey and Sandas (2012) report 9% for 30 German blue chip stocks on Deutsche Borse’s Xetra platform.
15

lagged trades and the price history up to the trade. As clearly laid out by theory, price revision is
contemporaneously affected by trades, but not vice versa.
Empirically, we estimate a structural vector autoregression model with five lags for a vector of
endogenous variables that consist of return and order flow variables. We measure the return as the
change in the best bid-ask midpoint, i.e., rt = mt −mt−1, where t indexes transaction time, and mt
is the midpoint prevailing at the end of the tth transaction. We let Xt denote order flow variables
(Xt can be a vector), so that the general structural VAR model is:
B0
rtXt
=5∑
j=1
Bj
rt−jXt−j
+
ur,tuX,t
,where ut is the structural innovation vector. The matrix B0 captures the contemporaneous effects
among the variables in the system. More specifically, as discussed above, order flow variables affect
price revision contemporaneously, whereas price has only lagged effects on order flow.
The VAR representation as developed in Hasbrouck (1991a) is theoretically of an infinite order
(to reflect the history of trades and prices in the information set of the market maker at each price
update). We choose to truncate the VAR at five lags as in Hasbrouck (1991a).18 In addition, given the
many specifications estimated in this paper, and the need for comparison of price impact estimates
across specifications, we adopt the same lag length throughout the analysis.
We then measure the information content of trades and/or order activities by the long run
cumulative response of price to a unit shock in order flow, that is,
∂rt+∞∂Xt
.
The focus on the long-run price response is to ensure that our measure is not contaminated by
transitory price effects, and at the same time incorporates any delayed response. For empirical
purpose, we truncate the impulse response function at a sufficiently long lag at which it has stabilized.
18We examine the autocorrelation of residuals of the VAR models presented later in the paper and find that thereis little autocorrelation of residuals, providing econometric support for the choice of lag length. See Table 10 in theOnline Appendix for more details.
16

We choose to compute the impulse response out to 50 transactions after the shock.19 The permanent
price impact is approximated by the cumulative return over this horizon. We compute confidence
intervals for our price impact estimates by bootstrapping with 1000 replications.20
4.1 Price Impact of Trades
We begin the estimation of market impact with a bivariate VAR model of return and signed trade
volume qt (i.e., volume of the tth transaction, signed positive if it is buyer-initiated and negative if
seller-initiated). Trade initiation is recorded in the BrokerTec dataset, so all trades are classified
properly. Moreover, in an ECN like BrokerTec, we can be sure that transactions, as well as the
sequence of events associated with each transaction, are recorded in the proper order. That is, a
market order arrives, executes against available limit orders on the opposite side, and the order
book subsequently updates to reflect the transaction just taking place. This supports the identifying
assumption that trade flow contemporaneously affects return, but not vice versa. Accordingly, the
model specification is:
1 −α1,2
0 1
rtqt
=5∑
j=1
Bj
rt−jqt−j
+
ur,tuq,t
, (1)
The permanent price impact estimates from model (1) are reported in Table 5 (under column
“Model 1”). They are statistically greater than zero, indicating that there is value-relevant information
revealed through trading activity, although the magnitude of such effects is generally small. The
smallest price impact is observed at the 2-year maturity, for which a $1 million increase in buyer-
19Visual inspection of the impulse response function indicates that the 50-tick horizon is sufficiently long for theprice response to stabilize. For further information on the pattern of price adjustment over the 50-tick horizon, pleaserefer to Figures 1 and 2 in the Online Appendix.
20We calculate the standard errors for the estimates using the bootstrapping method developed by Runkle (1987).First, we draw a random sample with replacement from the model residuals (T × n matrix of model residuals, whereT is the number of observations and n is the number of dependent variables in the VAR model). Second, using thissample of residuals and model parameter estimates, we reconstruct the dependent variable series. Third, we re-estimatethe VAR model on the reconstructed dependent variable series and compute the corresponding cumulative impulseresponse function. We repeat this procedure 1000 times and obtain a bootstrap sample of our price impact estimates.The 2.5%-97.5% percentiles computed from the bootstrap sample serve as the 95% confidence band.
17

initiated trade flow moves price by a minuscule 0.006/256 of one percent. In economic terms, it
means that it takes about $363 million in buyer-initiated transaction volume to move the price
permanently by one tick (or 2/256). On the other hand, for the least liquid among the six benchmark
securities, the 30-year bond, a $1 million shock in the buyer-initiated order flow permanently
increases the price by 0.450/256. Equivalently, only $8.9 million is sufficient to move the price by
one tick (or 4/256).
If we consider the variability of trading sizes and price changes across securities, the price
impact estimates are more comparable. For example, a one standard deviation shock in trade order
flow for the 2-year note ($53.53 million from Table 1) moves the price by 0.2944 256ths, which is
0.29 standard deviations of the trade-to-trade price change (1.01 from the same table). By the same
calculation, the permanent price impact of a one standard deviation shock in trading volume for the
other securities is in the range of 0.2-0.25 standard deviations of price change.
Finally, to entertain the possibility that the price impact does not increase linearly in trade
size, we also estimate a specification that includes both signed trade volume and signed squared
volume, but find that the concavity of the price impact function is quite mild, almost visually
indistinguishable from linearity for the notes.21
4.2 Asymmetric Effects of Buys and Sells
We extend the baseline specification in equation (1) to explore if there is any asymmetry in the
price impact of buyer-initiated versus seller-initiated trades. Saar (2001), for example, motivates
theoretically an asymmetric response to buyer- and seller-initiated block trades. The model we
estimate is: 1 −α1,2 −α1,3
0 1 0
0 0 1
rt
V Bt
V St
=5∑
j=1
Bj
rt−j
V Bt−j
V St−j
+
ur,t
uV B,t
uV S,t
, (2)
where V B and V S are the buy and sell transaction volume respectively. For buyer-initiated
21For a graph of this non-linear price impact function, please refer to Figure 3 in the Online Appendix.
18

transactions, V Bt is equal to the transaction volume and V St = 0 (and vice versa for seller-initiated
transactions).
The permanent price impact estimates are reported separately for buy and sell trades in Table 5
under column “Model 2”. The estimates are not statistically different in magnitude to the baseline
estimates from model 1. More importantly, there is little evidence to suggest that the market
responds asymmetrically to buy versus sell trade initiation, as shown in column “Asymmetry Test.”
The column shows the difference in magnitude between the price impact of buy trades and sell
trades as a percent of the latter. While we find that buy trades generally have higher price impact
than that of sell trades by a few percent, most of these differences are not statistically significant.
4.3 Price Impact of Limit Orders
We now extend our price impact analysis to incorporate information on limit order activities. Given
that the order book information is observable by market participants, the decision to place a trade
and its size can be influenced by activities in the book. As noted earlier, there are about 4.7 million
order book changes per day across the six securities in the best five tiers alone, overwhelmingly
outnumbering trading activity (about 12,000 transactions per day). Theoretically, Boulatov and
George (2013) suggest the concept of an “informed liquidity provider”; that is, informed traders
can also be on the supply side, as opposed to the common assumption that informed traders merely
consume liquidity. If so, relevant information might also be present in limit order flow. Empirically,
Mizrach (2008) shows that excluding this order book information is likely to overstate the market
impact of trades. Hautsch and Huang (2012) document significant price impact of limit orders for
select NASDAQ stocks.
19

We modify specification (2) by adding the inside bid and ask net order flow between trades:
1 −α1,2 −α1,3 −α1,4 −α1,5
0 1 0 −α2,4 −α2,5
0 0 1 −α3,4 −α3,5
0 0 0 1 0
0 0 0 0 1
rt
V Bt
V St
lbt
lat
=
5∑j=1
Bj
rt−j
V Bt−j
V St−j
lbt−j
lat−j
+
ur,t
uV B,t
uV S,t
ulb,t
ula,t
, (3)
where lb, the bid limit order flow, is the volume of limit buy orders submitted to (positive) or
canceled from (negative) the first tier between trades, i.e., between the (t− 1) and t transactions.
Similarly, la is the ask limit order flow. The measurement timing of the endogenous variables
supports the direction of contemporaneous effects from limit order flow to trade flow to return in
the above specification.
The measurement of limit order flow variables warrants some further discussion. Because our
model already incorporates the effects of trades directly, we explicitly exclude order book changes
caused by trade execution from our limit order flow measures. Specifically, the net flow of limit
orders on each side of the market is computed as the difference between the quantity of new order
submissions and that of cancellations from the last trade until immediately before the current trade.
Our resulting measures of limit order flow account for the non-trade related change in liquidity
supply in the market. As a result, our model can capture the dynamic interactions of liquidity
demand (trade flow), liquidity supply (limit order flow) and price revisions. The model thus enables
the delineation of the price impact of liquidity supply change from the price impact of liquidity
demand change, a novel feature of our empirical exercise.22
22Hautsch and Huang (2012) measure the price impact of limit orders by modeling the limit order book as a co-integrating vector comprised of price and depth up to the third level in the limit order book. Our model has a similarspirit in that it also incorporates limit order information in the vector of variables of interest. However, our model differsfrom Hautsch and Huang (2012) in its focus on the trading process and the price dynamics as affected by both tradingand limit order activities.
20

4.3.1 Price Impact Estimates
We analyze the permanent price impact of trades and limit order activities by computing the
cumulative price response to a shock vector that is zero everywhere except for the relevant order
flow variable, which has a unitary shock. The estimates are reported in the first four columns
in Panel A of Table 6. All estimates, including those for the price impact of limit orders, are
statistically significant at the 5% level. Consistent with equity market evidence (e.g., Hautsch and
Huang (2012)), our results show that limit order activity also has a significant permanent effect on
price. For example, a $1 million increase in bid limit order volume raises the best bid-ask midpoint
by approximately 0.0017/256, 0.0179/256, and 0.0457/256 for the 2-, 5- and 10-year notes. This
implies that an increase in bid depth of $1.18 billion, $112 million and $88 million is required to
raise the best bid-ask midpoint of the respective notes by one tick. In the less liquid 30-year bond,
the price impact of 0.3598/256 per $1 million shock in bid order flow implies that it takes an $11
million shock to raise the midpoint by one tick (4/256).
To put these price impact estimates in perspective, we can translate them into standard deviation
terms by computing the permanent response of price to one standard deviation shocks in the order
flow variables, and then scaling the resulting price impact by the corresponding standard deviation
of the trade-to-trade price change. For example, a one standard deviation shock in bid limit order
flow permanently raises the price by 0.14, 0.21, 0.18, 0.22, 0.15, and 0.22 standard deviations
respectively for the 2-, 3-, 5-, 7-, 10-, and 30-year maturities. The standardized price impacts have
much smaller cross-sectional variation, but they still suggest that the 2-, 5-, and 10-year notes are
more liquid than the other securities.
That limit order activities play a role in the price discovery process is consistent with O’Hara
(2015)’s suggestion that information in high frequency markets no longer pertains to only the active
side of a trade. For example, algorithms and dynamic trading strategies enable traders to chop a large
order into smaller ones and hide them in the limit order book at various layers. They subsequently
show up on the passive side in resultant executions. Thus, a study of price discovery based on solely
trade data is not likely to be complete.
21
The increased presence of high frequency trading activities, however, also raises a natural
question of whether limit orders placed away from the market also contribute to price discovery.23
To address this question, we estimate the same specification as in equation (3) except that the limit
order flow variables are the bid and ask net order flow to the best five price tiers between trades. To
save space, we summarize our key findings here, and provide the detailed results from this analysis
in Tables 1 and 2 of the Online Appendix. We find that the price impact of limit orders, when
averaged across all orders submitted to the best five price levels, is somewhat smaller than the price
impact of limit orders submitted to the best price level (as reported in Table 6, Panel A in the paper),
for all securities except the 7-year note. This suggests that orders placed at the inside are the most
informative among limit orders. Intuitively, limit order traders with information would prefer to
have their orders executed sooner rather than later, so it is not surprising to find that informative
limit orders are likely to rise to the top of the book. It is also for this reason that we continue to use
limit order flows at the inside tier in our subsequent analyses.
4.3.2 Do Limit Orders Carry More Information than Trades?
Having established that both trades and limit orders affect prices, we analyze and compare the
price impact estimates in order to assess the relative importance of different order types in the
price discovery process. Do limit orders carry more or less information than trades? To answer
this question, we test 1) whether price responds differently to a buy trade versus a bid limit order,
and 2) whether price responds differently to a sell trade versus an ask limit order. The findings of
these tests are presented in the “Asymmetry Tests” columns in Panel A of Table 6. Specifically,
the column “Buy/Bid - 1” shows the extent to which the impact of a buyer-initiated trade exceeds
that of a bid limit order of equal size, expressed as a percent of the latter (likewise for the column
“Sell/Ask - 1”). An asterisk indicates statistical significance at the 5% level.
The numbers reported in both columns are all positive and almost always significant, providing
clear evidence that trades have greater permanent price impact than limit orders of equal size.
23We thank a referee for raising this point.
22

Consider the 2-year note, for example. The price impact of market orders is 153% higher than that
of limit orders of equal size on the buying side, and 378% higher on the selling side. A similar
comparison for the 10-year note shows that trades have effects that are 17% and 34% larger than the
corresponding impact of limit orders on the buying and selling sides respectively.
Furthermore, our results show that including information on limit order activities affects es-
timates of the price impact of trades. This is because trade flows are correlated with limit order
flows. Examining the impulse response of trade flow to limit order flow shocks, we observe that an
unexpected increase in limit order flow to the bid side subsequently increases buyer-initiated trade
flow.24 Likewise, seller-initiated trade flow increases following an increase in the ask order flow.
Arguably, limit order activities might provide important information that enters into the decision to
trade. Once this relation is taken into account, trades show smaller price impact estimates than those
estimated from earlier specifications without limit order flow (as in Table 5). Our results suggest
that ignoring limit order activity overstates the price impact of trades by about 20-50%. Based on
the bootstrap confidence intervals of price impact estimates from the two models, we confirm that
the differences are statistically significant.
4.3.3 Do Limit Orders Have Higher Impact in Thin Markets?
Lastly, we examine whether the same shock to limit order flow would have different effects under
different market depth conditions.25 To test this hypothesis, we expand the VAR model specified in
equation (3) to include two additional variables: 1) the interaction of the bid limit order flow with
the contemporaneous market depth at the best bid price level, and 2) the interaction of the ask limit
order flow with the contemporaneous market depth at the best ask price level. From the estimated
VAR model, we then compute the impulse response of price to a unit shock in the bid (ask) limit
order flow when the inside bid (ask) depth is low, medium, and high (corresponding to the 5th,
50th, and 95th percentile of the inside bid (ask) depth distribution). We find that price impact is
monotonically decreasing as market depth is increasing, indicating that a shock to the limit order
24This impulse response analysis is available upon request.25We thank a referee for suggesting this additional analysis.
23
flow has greater price impact when the market is thin than when it is deep.26
4.4 Information Shares of Trades and Limit Orders
While price impact provides an indication of how much price changes permanently in response
to a unit shock in trade or limit order flow, it does not tell us the extent to which the variation in
these order flow variables drives the variation in the efficient price updating process. For instance,
trades may have significantly higher price impact, but if there is not much variation in trade flow, its
role in the price updating process might be limited. Thus, to complement the price impact measure,
we also compute the information shares of trades and limit orders following Hasbrouck (1991b).27
Our information share estimates are reported in Panel B of Table 6. Similar to Panel A, we also
report the results of asymmetry tests to determine if the information share of trades is significantly
different from that of limit orders.
In general, trade and limit order flow variation collectively explains between 17% and 30% of
the variance of price updates. The most important observation from Panel B is that the asymmetry
between trade and limit order flow remains, but that limit order flow generally contributes more to
efficient price variance because limit order activities occur at much greater intensity than trades.
This is especially the case for the less actively traded securities, namely the 3-, 7-, and 30-year,
for which the variation of trade flow contributes 30-78% less to price discovery than the variation
of limit order flow, despite the fact that trades have higher price impact per $1 million shock. For
example, variation in bid and ask limit order flows collectively explains about 24% of the efficient
price variance for the 7-year note, compared to the 5.7% explained by buy and sell trade flows.
The 2-year note is an exception in that both the price impact and the information share of trades
are far greater than those of limit orders. In other words, trades have higher per unit price impact as
well as higher total variance contribution to the price discovery process. This result supports the
idea that better-informed traders are more likely to trade than to submit limit orders in the 2-year
26The results for this specification are provided in Table 9 in the Online Appendix.27In this framework, the variance of the random walk component of the price process is decomposed into parts that
are due to variation in trade and limit order flows respectively.
24

note. This result is not surprising given that there is typically a very large quantity of standing
limit orders in the book for the 2-year note, which in turn implies that a marginal limit order might
take longer to be executed. The potentially delayed execution of limit orders appears to make limit
orders less appealing for traders with some information advantage.
4.5 Price Impact of Limit Order Submissions and Cancellations
The Treasury “flash rally” event of October 15, 2014 has drawn significant attention to the changing
structure of the U.S. Treasury market, following the migration to electronic trading (of on-the-
run Treasury securities) and the increased participation of non-traditional high frequency market
participants. As the Joint Staff Report (2015) (p.59) documents, HFTs now account for the majority
of trading activity on the interdealer trading platforms. One of the key characteristics of HFTs is
their massive number of order submissions and cancellations (as identified in the SEC’s Concept
Release on Equity Market Structure).28 An important question that arises out of the current debate
on high frequency trading is whether such submissions and cancellations have potentially disruptive
effects.
While there are potentially many aspects of the market that might be affected by high frequency
trading and that warrant further study, we focus specifically here on measuring the price impact
of order submissions and cancellations separately. We seek to answer the question of whether
these respective activities have differing effects on price discovery. According to O’Hara (2015),
order submissions and cancellations are an important part of market data gathered and processed by
trading algorithms, but whose role in the price discovery process is not yet well understood. There
are only a few studies that have examined explicitly the role of order submissions and cancellations
in price discovery (for example, Brogaard, Hendershott, and Riordan (2015)).
Ex ante, it is not clear whether a submission should have a smaller or larger price impact than a
cancellation. On the one hand, one might argue that an order submission (an active undertaking)
is more likely to depend on some information, whereas a cancellation is more likely in response
28Securities Exchange Act Release No. 34-61358. 75 FR 3594, 3606 (January 21, 2010).
25

to a change in market conditions (a reactive undertaking). Accordingly, the information content
of a submission would be higher than that of a cancellation. On the other hand, if limit orders
are submitted then quickly canceled with the intention of driving price in a certain direction, it
is plausible that the cancellation might have a greater (permanent) effect because one is not only
learning about the lack of trading interest in that direction, but that the trading interest may actually
lie on the other side of the book.
Up to this point, we have mainly focused on exposing the differences in price impact between
limit orders and trades, and thus have worked with net limit order flow in our specifications. In
this section, we include submissions and cancellations as separate variables. Due to the lack of
asymmetry in the price impact of buy and sell trades, and to keep the econometric model manageable,
we use signed trade volume qt in place of two separate variables for buy volume and sell volume.
The specification is as follows:
1 −α1,2 −α1,3 −α1,4 −α1,5 −α1,6
0 1 −α2,3 −α2,4 −α2,5 −α2,6
0 0 1 0 0 0
0 0 0 1 0 0
0 0 0 0 1 0
0 0 0 0 0 1
rt
qt
BSubt
BCant
ASubt
ACant
=
5∑j=1
Bj
rt−j
qt−j
BSubt−j
BCant−j
ASubt−j
ACant−j
+
ur,t
uq,t
uBSub,t
uBCan,t
uASub,t
uACan,t
,
(4)
where BSubt, BCant, ASubt, and ACant measure the quantity of limit orders submitted to or
canceled from the top of the limit order book on each side of the market in between the (t− 1)th and
tth transactions. We report the price impact estimates resulting from this specification in Panel A of
Table 7, and information share estimates in Panel B. The magnitudes of the price impact estimates
for trades remain close to those reported in Table 6. In addition, we continue to find that limit orders
have significant market impact and that such price impact estimates are smaller than those of trades.
The most interesting takeaway from this table, however, comes from the asymmetry tests that
26
examine whether submissions have statistically different price impact from cancellations. Such
tests, which we perform for both the bid and the ask side, indicate that submissions tend to have
greater price impact, especially for the medium- and long-term maturities. Specifically, as observed
for the 5-, 7-, 10-, and 30-year securities, the price impact of a limit order submission is 4-11%
higher than that of a cancellation of equal size.
If we take into account not only the respective unit price impacts, but also the varying degree
of variation in submission and cancellation activities of each security, we find an even stronger
result. The asymmetry tests based on information shares (reported in Panel B) show that limit order
submissions contribute more to the price discovery process than cancellations, across all securities
and for both the bid and the ask side. More specifically, depending on security, submissions
contribute 6-65% more to the variation of price updates as compared to cancellations. Our empirical
evidence thus supports the notion that submissions are more likely induced by information than is
the case for cancellations, consistent with the results for equity markets documented in a similar
type of analysis by Brogaard, Hendershott, and Riordan (2015).
5 Price Impact around Public Information Events
As our price impact estimates are based on all transactions over the sample period, one question
that arises is whether price impact varies by the information environment. Answering this question
can help further our understanding of what constitutes an information advantage in this market.
Pasquariello and Vega (2007) point out two main sources of information in the Treasury market:
one based on private information about future demand shocks (e.g., a dealer may know of a large
incoming order by one of its mutual fund clients) and the other based on the ability to process and
interpret publicly available information better and faster.
While we do not have data to test for the presence of the first source of information, the
Treasury market provides a great laboratory for studying the second source of information advantage.
Important macroeconomic announcements and monetary policy decisions present shocks in public
27

information and are publicly released at pre-scheduled times. If some traders derive information
advantage from public information, we expect to see trading and/or limit order activities more
informative around these events. Indeed, Green (2004) shows that the information content of trades
increases following 8:30 macroeconomic announcements. Our analysis adds to this line of inquiry
by examining the price impact of not only trades but also limit orders around these information
events, given that limit order activities constitute an increasingly large share of market activity.
For our analysis, we focus on two types of announcements: rate decision announcements by
the Federal Open Market Committee (FOMC) and 8:30 macroeconomic reports. We focus on the
five most important of these reports, as documented in Faust, Rogers, Wang, and Wright (2007),
comprised of employment, retail sales, GDP, CPI, and PPI. Our approach is to quantify the price
impact of trades and limit orders during a short period before and after these announcements, and
compare with that computed for the same time windows on non-announcement days. Any evidence
of increased private information prior to announcements would suggest that some information
advantage comes from the ability to forecast the market ahead of public news arrival. On the other
hand, evidence of increased private information after announcements would suggest that some
traders can better interpret the implications of public news.
5.1 FOMC Announcements
FOMC announcements communicate the Federal Reserve’s monetary policy decisions and are key
information events for the formation of Treasury securities prices. Fleming and Piazzesi (2005)
document that these events precipitate high price volatility, high trading volume, and wide bid-ask
spreads.29 During our sample period, there are 16 announcements following FOMC meetings, three
of which occurred at about 12:30, and the rest of which occurred around 14:15. We collect the exact
time at which the announcements reached the market, using the time stamp of the first news report
in Bloomberg. We focus on the 60-minute intervals before and after these announcements. The
29Gao and Mizrach (2015) show that price impact in the equity market rose substantially following regularlyscheduled Permanent Open Market Operations during the Federal Reserve’s first large-scale asset purchase program.
28

pre-announcement interval finishes at the second immediately before announcement time, and the
post-announcement interval starts at the second immediately after announcement time. We choose
the same time window on the five days preceding and five days following each FOMC announcement
to serve as the non-announcement counterpart, effectively controlling for the time-of-day effect and
general market conditions.
We estimate model (3) using data in the pre- and post-announcement windows on FOMC days
and in the comparable windows on non-FOMC days. In Table 8, Panel A, we report the price
impact differentials following FOMC announcements as compared to non-announcement days
(expressed in percent of the latter) and note with an asterisk if the former is statistically different
from the latter at the 5% significance level. Panel B is similar to Panel A except for the focus on the
pre-announcement interval.
As shown in Panel A, price impact is higher following FOMC announcements for all types
of orders, as indicated by most numbers being positive and significant. Four of the six securities
experience an increase in the average price impact of buy trades in the range of 48-118%. Meanwhile,
for all six securities, sell trades result in average permanent price impact that is 24-134% higher
than normal, depending on security.
Moreover, and perhaps more strikingly, the increase in the price impact of limit orders after
FOMC announcements is much more pronounced than the corresponding increase in the price
impact of trades. This can be seen by comparing the percentage increase in the price impact of
bid limit orders from the “Bid” column with that of buy trades from the “Buy” column (similarly
for the “Ask” and “Sell” columns). The former is almost always greater than the latter. For the
2-year note for example, the price impact of buy trades is 56% higher than on non-announcement
days, while that of bid orders is 140% higher. The extent of the increase in price impact of limit
orders is as high as 460%. The evidence implies that in the post-FOMC information environment,
disproportionally more information is conveyed through limit orders.30
30Unreported analysis of market depth and bid-ask spreads in the period immediately after FOMC announcementsreveals that spreads are significantly wider while market depth significantly lower than usual. Placing a limit order insuch market conditions arguably allows those traders who have an advantage in rapidly processing public informationto better monetize their information advantage, as compared to placing a market order.
29

We now turn to the 60-minute interval leading to FOMC announcements. During this time,
there is presumably heightened uncertainty with regard to the actual information to be released at
announcement time, so it is reasonable to expect the permanent price impact of trades and limit
orders to be also higher as compared to the same window on non-FOMC days. Indeed, Panel B
shows that there is greater information content of trades and limit orders in the 60 minutes leading
up to FOMC announcements, as compared to that on non-FOMC days. However, the increase in
price impact is more moderate, and not as widespread, as that in the post-announcement period.
Considering Panels A and B together, it appears that post-FOMC price impact is generally
higher than its pre-FOMC counterpart, especially for limit orders. Unreported tests (available upon
request) confirm that the differences are statistically significant in many cases. One might think
that the announcements would clear out any uncertainty among market participants with respect
to the public information revealed. Accordingly, adverse selection should be lower after such
announcements. However, our results indicate that uncertainty is not completely and immediately
resolved upon announcement releases. Instead, the continued (and increased) informativeness of
trades and limit orders in the 60-minute period following FOMC announcements suggests that
information advantage does not cease with the announcements and that some market participants
continue to derive an information advantage from the announced public information.
5.2 Macroeconomic Announcements
The releases of macroeconomic reports are also major public information events in the Treasury mar-
ket. Faust, Rogers, Wang, and Wright (2007), among others, show that the release of employment,
retail sales, GDP, CPI, and PPI reports affects U.S. interest rates significantly. Accordingly, these
announcements provide another valuable opportunity to examine whether some market participants
can derive valuable insights from pre-scheduled public information announcements.
Since the examined macroeconomic reports are released monthly, there are 120 announcements
in total over our two-year sample period. Similar to the FOMC analysis, we compute the permanent
price impact of trading and limit order book activities in the 60-minute period before and after these
30
announcements. Given that these announcements are all released at 8:30, our pre-announcement
period is from 7:30 to 8:30, and our post-announcement period is from 8:30 to 9:30. For comparison,
the “control group” consists of days in our sample period without any announcements between 7:00
and 9:59 (there are 113 such days). We report the results in Table 9.
Panel A shows the extent to which the post-announcement price impact exceeds that usually
observed on non-announcement days during the same time interval, i.e., [8:30-9:30]. While the
incremental price impact is mostly small or even negative for buy trades, we observe positive and
significant increases in price impact for sell trades and limit orders in most cases. The increase
ranges from 1% to 23%. The extent of the increase is clearly smaller than that which occurs after
FOMC announcements.
A similar comparison for the pre-announcement period is shown in Panel B. Here, the evidence
is more indicative of lower price impact leading up to the announcements than that observed on
non-announcement days. It is a rather puzzling result in that the uncertainty leading up to these
announcements should be conducive to exploitation of information asymmetry. It is perhaps harder
to forecast reliably these macroeconomic reports ahead of announcement times to derive some
information advantage and form a basis for trading and limit order activities. Therefore, market
activities in the pre-announcement period might be disproportionately liquidity-motivated.31
Finally, similar to our FOMC analysis, we compare the incremental price impact between the
post- and pre-announcement periods.32 Consistent with the FOMC results, we find evidence of
higher price impact in the post-announcement period, as supported by 17 positive and significant
statistics out of 24 tested pairs. Both results corroborate the hypothesis that trading and limit orders
contain relatively more information after announcements than before announcements.
31It is also possible that the expectation of an announcement induces traders to arrive earlier in the day (given that theannouncement time is 8:30) and perhaps fine-tune their positions in advance of the announcement, both of which mightbenefit liquidity.
32Formal test results are available upon request.
31

5.3 Additional Analysis
The preceding analysis shows increased information content of trades and limit orders after an-
nouncements, suggesting the presence of private information. A key question arises as to the nature
or source of this private information. If private information is indeed derived from the announced
public information, we would expect to see this private information being exploited right after the
announcements. This is because, as Hasbrouck (1991a) (p. 189) notes, the value of information
advantage generally dissipates over time, so there is an incentive for those traders who possess such
advantage to trade as soon as possible after the announcements.
This intuition allows us to formulate a formal test for possible information decay following
announcements as follows. We estimate the VAR model over three post-announcement window
lengths: 30 minutes, 60 minutes, and 90 minutes. We then test to see whether the average price
impact estimated over the 30-minute window is greater than that for the longer 60-minute window,
and similarly with the 60-minute window versus the 90-minute window. If the conjecture discussed
above were true, we would expect that the price impact estimated over shorter periods after
announcements would be higher. The results, which are reported in Tables 3 and 4 in the Online
Appendix, are highly indicative of information decay following announcements, and support the
hypothesis that the increased information content of trades and limit orders after announcements
reflects an information advantage derived from the announced public information.
This finding is further corroborated by our analysis of trade size, the use of iceberg orders, and
workups around these information events, the details of which are provided in Tables 6-8 in the
Online Appendix. Larger trade sizes following announcements could indicate increased trading
demand, perhaps coming from traders who possess some information advantage related to the
just announced public information. Likewise, there is a greater incentive for those with better
information to use hidden liquidity channels, namely iceberg orders and the workup protocol, so the
use of such channels is expected to increase in the post-announcement periods. Indeed, the results
provide support for the increased presence of private information after announcements.
32

6 Conclusion
The microstructure of the U.S. Treasury securities market has changed markedly in recent years,
with trading activity migrating from voice-assisted brokers to fully electronic brokers. We use tick
data from one of these platforms, BrokerTec, to reassess market liquidity. We find that the market is
more liquid than that found by earlier studies using data from the voice-assisted brokers, with much
greater depth, higher trading activity, and bid-ask spreads that are narrow (and often constrained
by the minimum tick size). Our price discovery analysis reveals that the price impact of trades is
generally quite small in magnitude, supporting the common belief that the U.S. Treasury market is
highly liquid and that information-based trading in this market is limited. A one-standard deviation
shock in trade order flow moves the price permanently by about 0.2-0.3 standard deviations of the
trade-to-trade price change.
In addition, we show that limit orders also contribute to the price discovery process. Although
the price impact of limit orders is generally smaller than that of trades of equal size, such orders
contribute more to the variation of the random walk component of price given that there is much
higher variation in limit order activities than trades. Our evidence is consistent with O’Hara (2015)’s
argument that sophisticated and dynamic trading strategies in electronic marketplaces allow traders
to be much more flexible with their trading choices, and informed traders may choose limit orders
over market orders to exploit their information advantage.
Our analysis also addresses a topical question with regard to the impact of order cancellations.
With cancellation rates averaging above 95%, a natural question to ask is whether these cancellations
have a significant impact on price discovery. We show that cancellations have significant price
impact, but that such impact is somewhat smaller than that of order submissions. Consistent with
earlier findings for equity markets, our result supports the hypothesis that submissions, which tend
to reflect an active undertaking by traders, are more likely induced by information than cancellations,
which might more commonly be in response to changes in market conditions.
To further our understanding of the nature of “private information” in the Treasury market, we
quantify and examine the information content of trades and limit order activities around important
33

public information events, including FOMC and key macroeconomic announcements. We find
that the price impact of trades and limit orders increases in the 60-minute period immediately
following such announcements, compared to both non-announcement days and the corresponding
pre-announcement period. Moreover, the increase in information content tends to be proportionately
greater for limit orders than it is for trades. Our findings support the hypothesis that there is valuable
insights to be gained from interpreting public information better (or faster) than other market
participants, and that this information is disproportionately exploited through limit orders.
Overall, our paper highlights how the electronic market for trading in U.S. Treasury securities
differs from its voice-assisted precedent and from other markets studied in the literature. Comparing
with the voice-assisted trading system, the electronic market facilitates a much greater frequency and
volume of trades and limit order activities, resulting in greater competition for liquidity provision
and thus lower bid-ask spreads and market impact. The electronic market also makes it easier for
traders to dynamically manage limit orders, and such orders are shown to also contribute to the
price discovery process. These new findings contribute to the growing discussion on the changing
structure of securities markets and the effects of electronification.
34

References
Balduzzi, P., E. J. Elton, and T. C. Green, 2001, “Economic News and Bond Prices: Evidence from
the U.S. Treasury Market,” Journal of Financial and Quantitative Analysis, 36, 523–543.
Barclay, M. J., T. Hendershott, and K. Kotz, 2006, “Automation versus Intermediation: Evidence
from Treasuries Going Off the Run,” Journal of Finance, 61, 2395–2414.
Baruch, S., and L. Glosten, 2015, “Fleeting Orders,” University of Utah and Columbia University
Working Paper.
Beber, A., M. W. Brandt, and K. A. Kavajecz, 2009, “Flight-to-Quality or Flight-to-Liquidity?
Evidence from Euro-Area Bond Market,” Review of Financial Studies, 22, 925–957.
Bessembinder, H., M. A. Panayides, and K. Venkataraman, 2009, “Hidden Liquidity: An Analysis
of Order Exposure Strategies in Electronic Stock Markets,” Journal of Financial Economics, 94,
361–383.
Biais, B., P. Hillion, and C. Spatt, 1995, “An Empirical Analysis of the Limit Order Book and the
Order Flow in the Paris Bourse,” Journal of Finance, 50, 1655–1689.
Boni, L., and C. Leach, 2004, “Expandable Limit Order Markets,” Journal of Financial Markets, 7,
145–185.
Boulatov, A., and T. J. George, 2013, “Hidden and Displayed Liquidity in Securities Markets with
Informed Liquidity Providers,” Review of Financial Studies, 26, 2096–2137.
Brandt, M., and K. Kavajecz, 2004, “Price Discovery in the U.S. Treasury Market: the Impact of
Order Flow and Liquidity on the Yield Curve,” Journal of Finance, 59.
Brandt, M. W., K. A. Kavajecz, and S. E. Underwood, 2007, “Price Discovery in the Treasury
Futures Market,” Journal of Futures Markets, 27, 1021–1051.
35
Brogaard, J., T. Hendershott, and R. Riordan, 2015, “Price Discovery without Trading: Evidence
from Limit Orders,” University of Washington, University of California at Berkeley and University
of Ontario Institute of Technology Working Paper.
Campbell, B., and S. Hendry, 2007, “Price Discovery in Canadian and U.S. 10-Year Government
Bond Markets,” Bank of Canada Working Paper 2007-43.
Cheung, Y. C., F. de Jong, and B. Rindi, 2005, “Trading European Sovereign Bonds: The Mi-
crostructure of the MTS Trading Platforms,” ECB Working Paper No. 432, January 2005.
Dungey, M., O. Henry, and M. McKenzie, 2013, “Modeling Trade Duration in U.S. Treasury
Markets,” Quantitative Finance, 13, 1431–1442.
Engle, R. F., M. J. Fleming, E. Ghysels, and G. Nguyen, 2012, “Liquidity, Volatility, and Flights
to Safety in the U.S. Treasury Market: Evidence from a New Class of Dynamic Order Book
Models,” Federal Reserve Bank of New York Staff Report 590, December 2012.
Engle, R. F., and A. J. Patton, 2004, “Impacts of Trades in an Error Correction Model of Quote
Prices,” Journal of Financial Markets, 7, 1–25.
Faust, J., J. Rogers, S.-Y. Wang, and J. Wright, 2007, “The High-Frequency Response of Exchange
Rates and Interest Rates to Macroeconomic Announcements,” Journal of Monetary Economics,
54, 1051–1068.
Fleming, M., 2003, “Measuring Treasury Market Liquidity,” Federal Reserve Bank of New York
Economic Policy Review, 9, 83–108.
Fleming, M. J., 1997, “The Round-the-Clock Market for U.S. Treasury Securities,” Federal Reserve
Bank of New York Economic Policy Review, 3, 9–32.
Fleming, M. J., 2002, “Are Larger Treasury Issued More Liquid? Evidence from Bill Reopenings,”
Journal of Money, Credit, and Banking, 34, 707–735.
36

Fleming, M. J., and G. Nguyen, 2013, “Order Flow Segmentation and the Role of Dark Trading in
the Price Discovery of U.S. Treasuries,” Federal Reserve Bank of New York Staff Report 624,
August 2013.
Fleming, M. J., and M. Piazzesi, 2005, “Monetary Policy Tick-by-Tick,” Working Paper, Federal
Reserve Bank of New York.
Fleming, M. J., and E. M. Remolona, 1997, “What Moves the Bond Market?,” Federal Reserve
Bank of New York Economic Policy Review, 3, 31–50.
Fleming, M. J., and E. M. Remolona, 1999, “Price Formation and Liquidity in the U.S. Treasury
Market: The Response to Public Information,” Journal of Finance, 54, 1901–1915.
Frey, S., and P. Sandas, 2012, “Effective Search for Liquidity Using Iceberg Orders,” Working
Paper.
Gao, C., and B. Mizrach, 2015, “High Frequency Trading in the Equity Markets During U.S.
Treasury POMO,” Rutgers University Working Paper.
Goldreich, D., B. Hanke, and P. Nath, 2005, “The Price of Future Liquidity: Time-Varying Liquidity
in the U.S. Treasury Market,” Review of Finance, 9.
Green, T. C., 2004, “Economic News and the Impact of Trading on Bond Prices,” Journal of
Finance, 59, 1201–1233.
Hasbrouck, J., 1991a, “Measuring the Information Content of Stock Trades,” Journal of Finance,
46, 179–207.
Hasbrouck, J., 1991b, “The Summary Informativeness of Stock Trades: An Econometric Analysis,”
Review of Financial Studies, 4, 571–595.
Hautsch, N., and R. Huang, 2012, “The Market Impact of A Limit Order,” Journal of Economic
Dynamics & Control, 36, 501–522.
37

Huang, R. D., J. Cai, and X. Wang, 2002, “Information-Based Trading in the Treasury Note
Interdealer Broker Market,” Journal of Financial Intermediation, 11, 269–296.
Jiang, G., and I. Lo, 2014, “Private Information Flow and Price Discovery in the U.S. Treasury
Market,” Journal of Banking and Finance, 47, 118–133.
Joint Staff Report, 2015, “The U.S. Treasury Market on October 15, 2014,” U.S. Department of the
Treasury, Board of Governors of the Federal Reserve System, Federal Reserve Bank of New York,
U.S. Securities and Exchange Commission, and U.S. Commodity Futures Trading Commission.
Luo, H., 2010, “Profitable Opportunities around Macroeconomic Announcements in the U.S.
Treasury Market,” Brock University Thesis.
Menkveld, A. J., Y. C. Cheung, and F. de Jong, 2005, “Euro-Area Sovereign Yield Dynamics: The
Role of Order Imbalance,” ECB Working Paper No. 385, November 2005.
Mizrach, B., 2008, “The Next Tick on NASDAQ,” Quantitative Finance, 8, 19–40.
Mizrach, B., and C. Neely, 2006, “The Transition to Electronic Communication Networks in the
Secondary Treasury Market,” Federal Reserve Bank of St. Louis Review, 88, 527–541.
Mizrach, B., and C. Neely, 2008, “Information Shares in the U.S. Treasury Market,” Journal of
Banking and Finance, 32, 1221–1233.
Mizrach, B., and C. Neely, 2011, “The Microstructure of the U.S. Treasury Market,” in Bruce
Mizrach, and Brian Dangerfield (ed.), The Encyclopedia of Complexity and System Science . pp.
863–877, Springer-Verlag.
O’Hara, M., 2015, “High Frequency Market Microstructure,” Journal of Financial Economics, 116,
257–270.
Pasquariello, P., and C. Vega, 2007, “Informed and Strategic Order Flow in the Bond Markets,”
Review of Financial Studies, 20.
38

Runkle, D. E., 1987, “Vector Autoregression and Reality,” Journal of Business and Economic
Statistics, 5, 437–442.
Saar, G., 2001, “Price Impact Asymmetry of Block Trades: An Institutional Trading Explanation,”
Review of Financial Studies, 14, 1153–1181.
39

Table 1: Summary Statistics of Transaction Data
Variable 2-Year 3-Year 5-Year 7-Year 10-Year 30-Year
Trade Size ($m par) 28.22 12.49 11.88 6.43 10.26 2.97(53.53) (21.38) (17.47) (10.64) (14.48) (3.66)
# of Order Matches 8.38 6.32 7.02 4.47 6.73 2.42(13.71) (9.28) (9.40) (6.72) (8.85) (2.52)
# of Initial Matches 3.43 2.75 3.05 2.16 3.05 1.30# of Workup Matches 4.95 3.57 3.97 2.31 3.68 1.12
Price Change 0.0005 0.0004 0.0008 0.0011 0.0011 0.0088(1.01) (1.51) (1.90) (4.08) (4.18) (8.17)
Absolute Price Change 0.5461 0.7642 0.9731 1.9930 1.8300 4.2746(0.73) (0.87) (1.05) (2.21) (1.93) (5.31)
Bid Submission ($m par) 92.65 43.01 18.08 50.11 13.55 5.59(199.79) (70.40) (30.11) (80.93) (22.88) (10.24)
Bid Cancellation ($m par) 86.67 42.16 16.97 48.49 12.52 4.37(190.03) (67.79) (28.82) (79.63) (21.79) (8.87)
Bid Net Flow ($m par) 5.98 0.84 1.12 1.62 1.04 1.22(84.76) (35.78) (18.70) (32.64) (14.05) (4.89)
Ask Submission ($m par) 102.50 44.82 18.05 50.04 13.59 5.52(224.97) (76.29) (30.05) (81.52) (23.23) (10.12)
Ask Cancellation ($m par) 95.13 43.59 17.05 48.46 12.59 4.33(215.74) (71.69) (28.99) (79.96) (22.03) (8.75)
Ask Net Flow ($m par) 7.37 1.24 1.00 1.58 1.00 1.19(110.41) (41.70) (18.57) (32.63) (14.42) (4.87)
# Obs 466,873 648,542 1,526,109 749,896 1,532,851 960,375
The table reports the averages (with standard deviations in parentheses) of trade and limit orderactivities at the transaction frequency for on-the-run Treasury coupon securities on the BrokerTecplatform over the 2010-2011 sample period. Trade Size is the dollar par volume per transaction,while # of Order Matches Per Trade is the number of order matches per transaction. Price Changeis the price difference between consecutive transactions, in 256th’s of one percent of par. BidSubmission (Bid Cancellation) is the volume of bid limit orders submitted to (canceled from) thebest bid price queue in the order book between consecutive transactions. Bid Net Flow equals bidsubmission volume minus cancellation volume. Ask Submission, Ask Cancellation, and Ask NetFlow are computed similarly for ask limit orders.
40

Table 2: Daily Trading Activity
Trading Volume Trade Frequency
Security Total Buy Sell Total Buy Sell
2-Year 26,354 12,967 13,387 934 463 471
3-Year 16,204 8,005 8,198 1,297 646 651
5-Year 36,262 18,005 18,257 3,052 1,524 1,529
7-Year 9,640 4,816 4,824 1,500 754 746
10-Year 31,462 15,664 15,798 3,066 1,534 1,532
30-Year 5,705 2,823 2,882 1,921 954 967
The table reports the average daily trading activity for on-the-run Treasury coupon securities on theBrokerTec platform over the 2010-2011 sample period. For each day, trading volume is the totaldollar volume (in $ million par), while trade frequency is the total number of transactions. For eachvariable, we report the total and provide a break-down by whether a transaction is buyer-initiated(“Buy”) or seller-initiated (“Sell”).
41
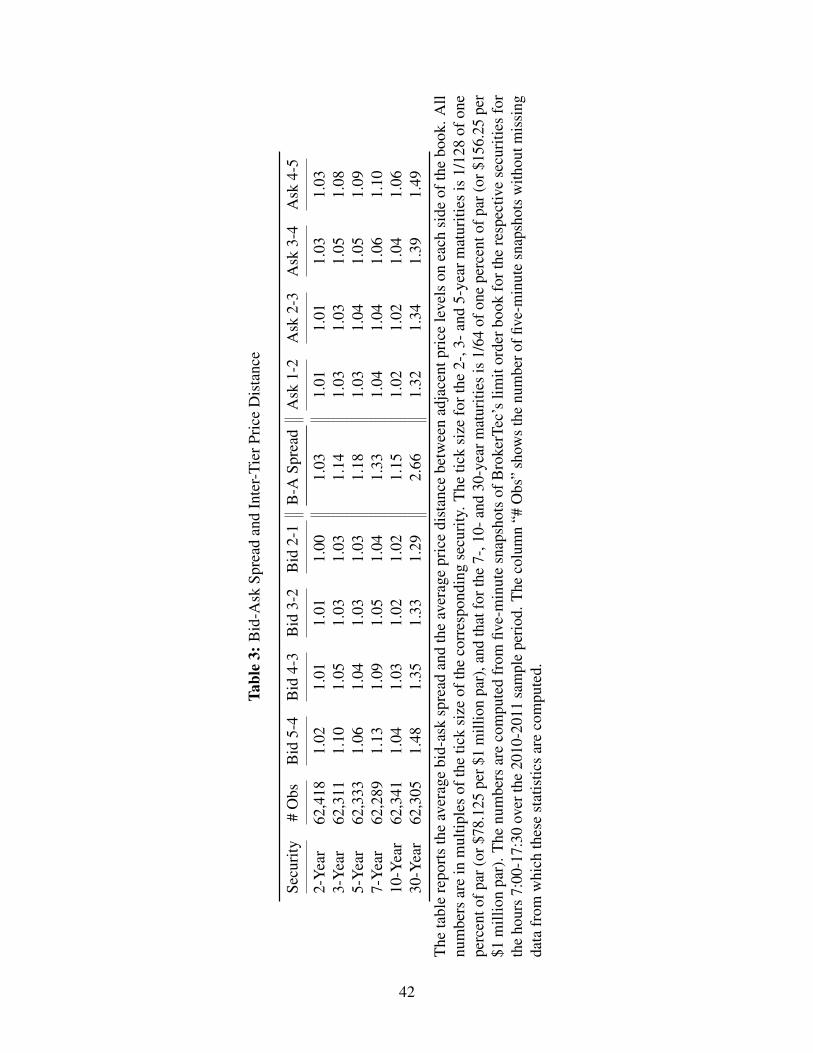
Tabl
e3:
Bid
-Ask
Spre
adan
dIn
ter-
Tier
Pric
eD
ista
nce
Secu
rity
#O
bsB
id5-
4B
id4-
3B
id3-
2B
id2-
1B
-ASp
read
Ask
1-2
Ask
2-3
Ask
3-4
Ask
4-5
2-Y
ear
62,4
181.
021.
011.
011.
001.
031.
011.
011.
031.
033-
Yea
r62
,311
1.10
1.05
1.03
1.03
1.14
1.03
1.03
1.05
1.08
5-Y
ear
62,3
331.
061.
041.
031.
031.
181.
031.
041.
051.
097-
Yea
r62
,289
1.13
1.09
1.05
1.04
1.33
1.04
1.04
1.06
1.10
10-Y
ear
62,3
411.
041.
031.
021.
021.
151.
021.
021.
041.
0630
-Yea
r62
,305
1.48
1.35
1.33
1.29
2.66
1.32
1.34
1.39
1.49
The
tabl
ere
port
sth
eav
erag
ebi
d-as
ksp
read
and
the
aver
age
pric
edi
stan
cebe
twee
nad
jace
ntpr
ice
leve
lson
each
side
ofth
ebo
ok.A
llnu
mbe
rsar
ein
mul
tiple
sof
the
tick
size
ofth
eco
rres
pond
ing
secu
rity
.The
tick
size
fort
he2-
,3-a
nd5-
year
mat
uriti
esis
1/12
8of
one
perc
ento
fpar
(or$
78.1
25pe
r$1
mill
ion
par)
,and
that
fort
he7-
,10-
and
30-y
earm
atur
ities
is1/
64of
one
perc
ento
fpar
(or$
156.
25pe
r$1
mill
ion
par)
.The
num
bers
are
com
pute
dfr
omfiv
e-m
inut
esn
apsh
ots
ofB
roke
rTec
’slim
itor
derb
ook
fort
here
spec
tive
secu
ritie
sfo
rth
eho
urs
7:00
-17:
30ov
erth
e20
10-2
011
sam
ple
perio
d.Th
eco
lum
n“#
Obs
”sh
ows
the
num
bero
ffive
-min
ute
snap
shot
sw
ithou
tmis
sing
data
from
whi
chth
ese
stat
istic
sar
eco
mpu
ted.
42

Table 4: Limit Order Book Depth
First Tier First 5 Tiers All Tiers
Security Bid Ask Bid Ask Bid Ask
2-Year 308 300 1,561 1,538 2,422 2,3553-Year 77 77 460 455 664 6395-Year 31 31 278 275 465 4437-Year 37 36 236 236 301 29710-Year 26 26 213 211 393 37630-Year 3 3 28 28 59 59
The table reports the average visible depth (in $ million of par) on BrokerTec at the best price level(First Tier), the best five price levels (First 5 Tiers), and across the whole limit order book (All Tiers).The statistics are computed from five-minute snapshots of the limit order book for the respectivesecurities for the hours 7:00-17:30 over the 2010-2011 sample period. The number of observationsis as reported in Table 3.
43

Table 5: Price Impact of Trades
Model 1 Model 2 Asymmetry Test
Security Signed Volume Buy Volume Sell Volume Buy/Sell - 1
2-Year 0.0055* 0.0057* −0.0054* 6% *3-Year 0.0166* 0.0168* −0.0164* 2%5-Year 0.0276* 0.0281* −0.0271* 4%7-Year 0.0780* 0.0807* −0.0753* 7%10-Year 0.0658* 0.0663* −0.0654* 1%30-Year 0.4476* 0.4352* −0.4602* −5%
The table reports the 50-tick cumulative impulse response of price (price impact) to a $1 millionshock in trade volume, based on two alternative models. Model 1 is a bivariate VAR(5) model ofsigned trade volume (positive for buys and negative for sells) and return (based on the best bid-askmidpoint). Model 2 is a VAR(5) model of buy trade volume, sell trade volume and return (based onthe best bid-ask midpoint). Price impacts are in 256ths of one percent of par. Estimation is basedon BrokerTec tick data for the 2010-2011 sample period. The number of observations used in theestimation is the same as reported in Table 1. The column “Asymmetry Test” reports the differencein magnitude between the price impact of buy trades and that of sell trades, expressed as a percentof the latter. An asterisk (*) indicates statistical significance at the 5% level, based on standarderrors computed by bootstrapping with 1000 replications.
44

Tabl
e6:
Pric
eIm
pact
ofTr
ades
and
Lim
itO
rder
s
Trad
eL
imit
Ord
erA
sym
met
ryTe
sts
Secu
rity
Buy
Sell
Bid
Ask
Buy
/Bid−
1Se
ll/A
sk−
1
Pane
lA:P
erm
anen
tPri
ceC
hang
ePe
r$1
Mill
ion
Shoc
k
2-Y
ear
0.00
43*−
0.00
43*
0.00
17*−
0.00
09*
153%
*37
8%*
3-Y
ear
0.01
09*−
0.01
15*
0.00
87*−
0.00
53*
25%
*11
7%*
5-Y
ear
0.02
20*−
0.02
20*
0.01
79*−
0.01
83*
23%
*20
%*
7-Y
ear
0.05
30*−
0.05
07*
0.02
73*−
0.02
54*
94%
*10
0%*
10-Y
ear
0.05
36*−
0.05
45*
0.04
57*−
0.04
07*
17%
*34
%*
30-Y
ear
0.36
86*−
0.39
31*
0.35
98*−
0.35
79*
2%10
%*
Pane
lB:C
ontr
ibut
ion
toPr
ice
Vari
atio
n
2-Y
ear
9.0%
*9.
5%*
6.7%
*3.
4%*
34%
*18
2%*
3-Y
ear
3.7%
*4.
3%*
12%
*6.
1%*
−70
%*
−29
%*
5-Y
ear
4.8%
*4.
8%*
6.2%
*6.
5%*
−24
%*
−26
%*
7-Y
ear
2.9%
*2.
8%*
13%
*11
%*
−78
%*
−75
%*
10-Y
ear
4.0%
*4.
3%*
4.8%
*4.
0%*
−16
%*
6%*
30-Y
ear
3.3%
*3.
7%*
8.5%
*8.
3%*
−61
%*
−55
%*
The
tabl
ere
port
spr
ice
impa
cts
(Pan
elA
)an
din
form
atio
nsh
ares
(Pan
elB
)of
trad
esan
dlim
itor
ders
.T
hese
stat
istic
sar
eco
mpu
ted
from
aVA
R(5
)mod
elof
buy
trad
evo
lum
e,se
lltr
ade
volu
me,
bid
limit
orde
rflow
,ask
limit
orde
rflow
,and
retu
rn(b
ased
onth
ebe
stbi
d-as
km
idpo
int)
.Est
imat
ion
isba
sed
onB
roke
rTec
tick
data
fort
he20
10-2
011
sam
ple
peri
od.T
henu
mbe
rofo
bser
vatio
nsus
edin
the
estim
atio
nis
the
sam
eas
repo
rted
inTa
ble
1.T
helim
itor
derfl
owva
riab
les
are
mea
sure
das
the
tota
lvol
ume
oflim
itor
ders
subm
itted
toth
ein
side
tierb
etw
een
trade
s,ne
tofm
odifi
catio
ns/c
ance
llatio
ns.P
rice
impa
cts
are
in25
6ths
ofon
epe
rcen
tofp
ar.T
he“A
sym
met
ryTe
st”
colu
mns
show
the
diff
eren
ces
inpr
ice
impa
ct(i
nPa
nelA
)orc
ontr
ibut
ion
toef
ficie
ntpr
ice
vari
atio
n(i
nPa
nelB
)bet
wee
nty
pes
oftr
ades
and
limit
orde
rs.A
nas
teris
k(*
)ind
icat
esst
atis
tical
sign
ifica
nce
atth
e5%
leve
l,ba
sed
onst
anda
rder
rors
com
pute
dby
boot
stra
ppin
gw
ith10
00re
plic
atio
ns.
45
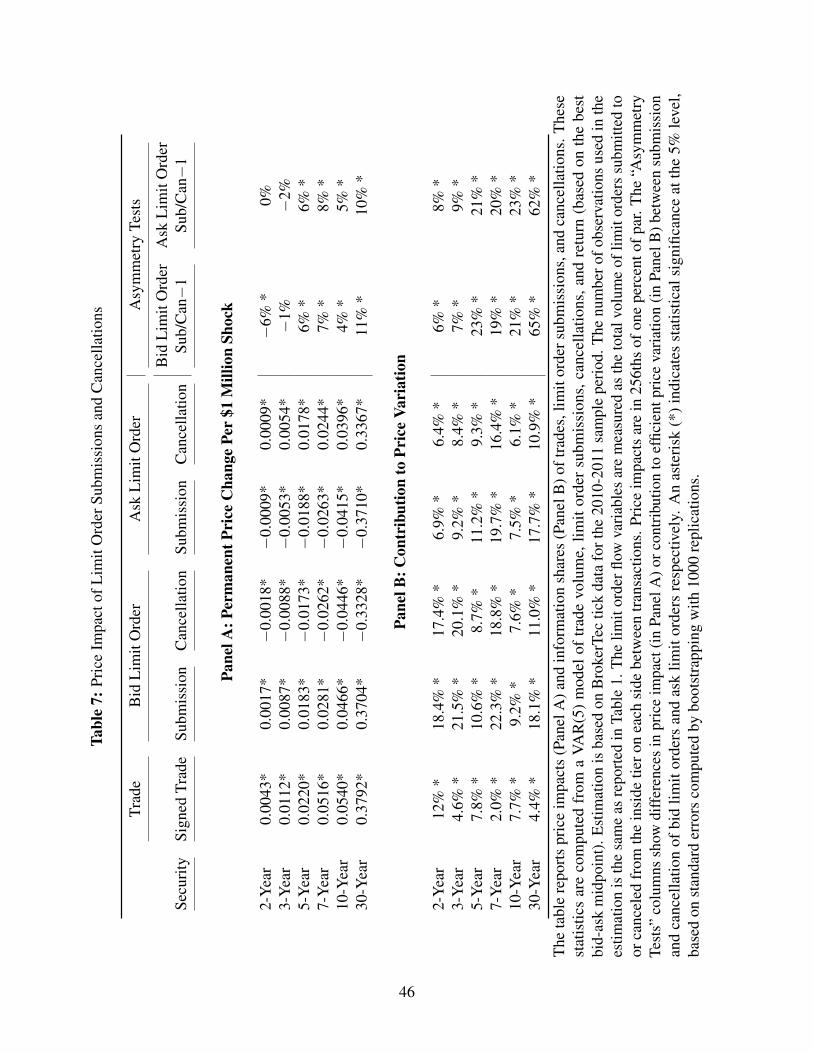
Tabl
e7:
Pric
eIm
pact
ofL
imit
Ord
erSu
bmis
sion
san
dC
ance
llatio
ns
Trad
eB
idL
imit
Ord
erA
skL
imit
Ord
erA
sym
met
ryTe
sts
Bid
Lim
itO
rder
Ask
Lim
itO
rder
Secu
rity
Sign
edTr
ade
Subm
issi
onC
ance
llatio
nSu
bmis
sion
Can
cella
tion
Sub/
Can−
1Su
b/C
an−
1
Pane
lA:P
erm
anen
tPri
ceC
hang
ePe
r$1
Mill
ion
Shoc
k
2-Y
ear
0.00
43*
0.00
17*
−0.
0018
*−
0.00
09*
0.00
09*
−6%
*0%
3-Y
ear
0.01
12*
0.00
87*
−0.
0088
*−
0.00
53*
0.00
54*
−1%
−2%
5-Y
ear
0.02
20*
0.01
83*
−0.
0173
*−
0.01
88*
0.01
78*
6%*
6%*
7-Y
ear
0.05
16*
0.02
81*
−0.
0262
*−
0.02
63*
0.02
44*
7%*
8%*
10-Y
ear
0.05
40*
0.04
66*
−0.
0446
*−
0.04
15*
0.03
96*
4%*
5%*
30-Y
ear
0.37
92*
0.37
04*
−0.
3328
*−
0.37
10*
0.33
67*
11%
*10
%*
Pane
lB:C
ontr
ibut
ion
toPr
ice
Vari
atio
n
2-Y
ear
12%
*18
.4%
*17
.4%
*6.
9%*
6.4%
*6%
*8%
*3-
Yea
r4.
6%*
21.5
%*
20.1
%*
9.2%
*8.
4%*
7%*
9%*
5-Y
ear
7.8%
*10
.6%
*8.
7%*
11.2
%*
9.3%
*23
%*
21%
*7-
Yea
r2.
0%*
22.3
%*
18.8
%*
19.7
%*
16.4
%*
19%
*20
%*
10-Y
ear
7.7%
*9.
2%*
7.6%
*7.
5%*
6.1%
*21
%*
23%
*30
-Yea
r4.
4%*
18.1
%*
11.0
%*
17.7
%*
10.9
%*
65%
*62
%*
The
tabl
ere
port
spr
ice
impa
cts
(Pan
elA
)and
info
rmat
ion
shar
es(P
anel
B)o
ftra
des,
limit
orde
rsub
mis
sion
s,an
dca
ncel
latio
ns.T
hese
stat
istic
sar
eco
mpu
ted
from
aVA
R(5
)m
odel
oftr
ade
volu
me,
limit
orde
rsu
bmis
sion
s,ca
ncel
latio
ns,a
ndre
turn
(bas
edon
the
best
bid-
ask
mid
poin
t).E
stim
atio
nis
base
don
Bro
kerT
ectic
kda
tafo
rthe
2010
-201
1sa
mpl
epe
riod
.The
num
bero
fobs
erva
tions
used
inth
ees
timat
ion
isth
esa
me
asre
port
edin
Tabl
e1.
The
limit
orde
rflow
vari
able
sar
em
easu
red
asth
eto
talv
olum
eof
limit
orde
rssu
bmitt
edto
orca
ncel
edfr
omth
ein
side
tiero
nea
chsi
debe
twee
ntr
ansa
ctio
ns.P
rice
impa
cts
are
in25
6ths
ofon
epe
rcen
tofp
ar.T
he“A
sym
met
ryTe
sts”
colu
mns
show
diff
eren
ces
inpr
ice
impa
ct(i
nPa
nelA
)orc
ontr
ibut
ion
toef
ficie
ntpr
ice
vari
atio
n(i
nPa
nelB
)bet
wee
nsu
bmis
sion
and
canc
ella
tion
ofbi
dlim
itor
ders
and
ask
limit
orde
rsre
spec
tivel
y.A
nas
teri
sk(*
)in
dica
tes
stat
istic
alsi
gnifi
canc
eat
the
5%le
vel,
base
don
stan
dard
erro
rsco
mpu
ted
bybo
otst
rapp
ing
with
1000
repl
icat
ions
.
46

Table 8: Price Discovery around FOMC Announcements
# Obs
Security Buy Sell Bid Ask FOMC Non-FOMC
Panel A: Post-Announcement Incremental Price Impact2-Year 56% * 134% * 140% * 460% * 3,174 10,6003-Year 91% * 101% * 201% * 131% * 4,442 16,5245-Year −2% 24% * 153% * 89% * 7,450 38,4117-Year 118% * 42% * 132% * 0% 5,051 20,34510-Year −33% * 26% * 121% * 97% * 7,543 37,86330-Year 48% * 116% * 54% * 155% * 6,333 32,674
Panel B: Pre-Announcement Incremental Price Impact2-Year 39% * 74% * 67% * 17% * 1,552 10,4273-Year 66% * 58% * 0% 107% * 1,878 16,5915-Year 83% * 1% −8% * 44% * 4,155 38,2937-Year 2% 56% * 226% * −91% * 2,069 20,51410-Year 49% * 35% * −21% * 5% * 3,910 37,46130-Year −46% * 35% * 12% * 18% * 2,861 29,712
The table reports changes in the price impact of trades and limit orders in the 60 minutes beforeand after FOMC announcements as compared to the same intervals on non-FOMC days. Panel Ashows the incremental price impact in the 60-minute post-announcement period on FOMC days ascompared to non-FOMC days, expressed in percent of the latter. Panel B shows a similar comparisonfor the 60-minute period before FOMC announcements. Price impact estimates are based on aVAR(5) model of buy trade volume, sell trade volume, bid limit order flow, ask limit order flow andreturn (based on the best bid-ask midpoint). Estimation is based on BrokerTec tick data aroundFOMC announcements and a similar time interval on non-FOMC days over the 2010-2011 sampleperiod. Non-FOMC days include five days before and five days after each FOMC announcement.An asterisk (*) indicates significant difference at the 5% level (t-test of difference in mean based onbootstrap samples of price impact estimates with 1000 replications).
47

Table 9: Price Discovery around 8:30 Macroeconomic Announcements
# Obs
Security Buy Sell Bid Ask Ann. Non-Ann.
Panel A: Post-Announcement Incremental Price Impact2-Year 31% * 12% * −17% * 22% * 30,502 8,7603-Year 1% * 11% * 23% * 11% * 46,995 13,1655-Year −8% * 13% * 23% * −8% * 100,496 30,5847-Year −20% * 14% * 10% * −4% * 56,467 15,59810-Year −12% * −14% * 8% * 9% * 98,012 29,28630-Year 1% −3% * 8% * 1% * 68,834 19,713
Panel B: Pre-Announcement Incremental Price Impact2-Year −10% * −9% * −9% * −14% * 21,896 7,9293-Year −3% * 7% * 2% * −6% * 29,028 10,4385-Year 4% * −12% * −17% * 0% 66,913 24,0057-Year 12% * −15% * 23% * −13% * 31,879 11,28110-Year 12% * −6% * −15% * 1% * 65,725 23,78730-Year −8% * −19% * −21% * −9% * 37,726 12,936
This table reports changes in the price impact of trades and limit orders in the 60 minutes beforeand after five important 8:30 macroeconomic announcements as compared to the same intervals onnon-announcement days. The five announcements considered are employment, retail sales, GDP,CPI, and PPI. Panel A shows the incremental price impact in the 60-minute post-announcementperiod on announcement days as compared to non-announcement days, expressed in percent of thelatter. Panel B shows a similar comparison for the 60-minute period before these announcements.Price impact estimates are based on a VAR(5) model of buy trade volume, sell trade volume, bidlimit order flow, ask limit order flow and return (based on the best bid-ask midpoint). Estimationis based on BrokerTec tick data around these announcements and a similar time interval on non-announcement days over the 2010-2011 sample period. Non-announcement days are days forwhich there is no announcement at 8:30. An asterisk (*) indicates significant difference at the 5%level (t-test of difference in mean based on bootstrap samples of price impact estimates with 1000replications).
48
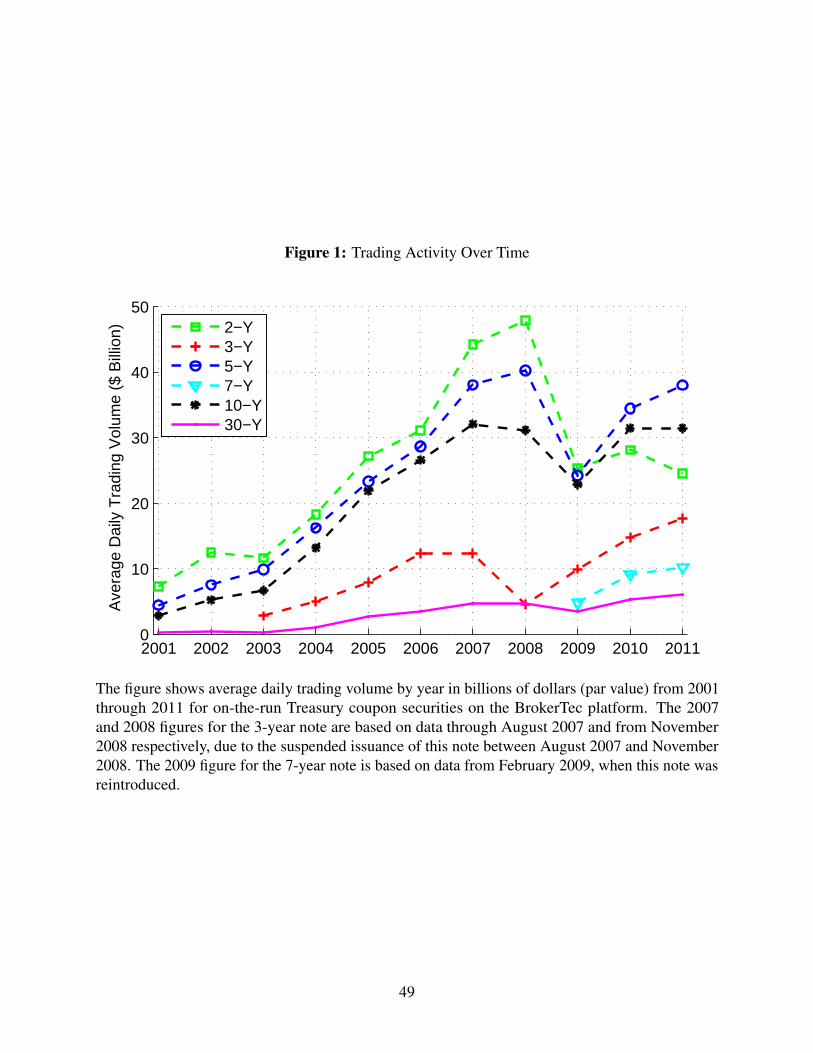
Figure 1: Trading Activity Over Time
2001 2002 2003 2004 2005 2006 2007 2008 2009 2010 20110
10
20
30
40
50
Ave
rage
Dai
ly T
radi
ng V
olum
e ($
Bill
ion)
2−Y3−Y5−Y7−Y10−Y30−Y
The figure shows average daily trading volume by year in billions of dollars (par value) from 2001through 2011 for on-the-run Treasury coupon securities on the BrokerTec platform. The 2007and 2008 figures for the 3-year note are based on data through August 2007 and from November2008 respectively, due to the suspended issuance of this note between August 2007 and November2008. The 2009 figure for the 7-year note is based on data from February 2009, when this note wasreintroduced.
49

Figure 2: Round-the-Clock Trading Activity
18:00 21:00 0:00 3:00 6:00 9:00 12:00 15:00 18:000
0.01
0.02
0.03
0.04
0.05
0.06
0.07
0.08
Fra
ctio
n of
Dai
ly T
radi
ng V
olum
e
2−Y3−Y5−Y7−Y10−Y30−Y
The figure shows the fraction of daily total trading volume by half-hour interval for on-the-runTreasury coupon securities on the BrokerTec platform for the 2010-2011 sample period. Times areEastern time and indicate start of half-hour interval.
50

Figure 3: Frequency Distribution of Inside Spread
0 1 2 3 4+0
20
40
60
80
100
Inside Spread (in Ticks)
Rel
ativ
e F
requ
ency
(%
)
2−Y3−Y5−Y7−Y10−Y30−Y
The figure shows the frequency distribution of the inside spread (measured in number of ticks) onthe BrokerTec platform. The tick size for the 2-, 3- and 5-year maturities is 1/128 of one percent ofpar, and that for the 7-, 10- and 30-year maturities is 1/64 of one percent of par. The numbers arecomputed from five-minute snapshots of BrokerTec’s limit order book for the respective securitiesfor the hours 7:00-17:30 over the 2010-2011 sample period.
51

Figu
re4:
Dis
play
edan
dH
idde
nL
iqui
dity
atth
eFi
rstF
ive
Tier
s
B5
B4
B3
B2
B1
A1
A2
A3
A4
A5
0
100
200
300
400
500
2Y
B5
B4
B3
B2
B1
A1
A2
A3
A4
A5
050100
150
3Y
B5
B4
B3
B2
B1
A1
A2
A3
A4
A5
0204060805Y
B5
B4
B3
B2
B1
A1
A2
A3
A4
A5
0204060807Y
B5
B4
B3
B2
B1
A1
A2
A3
A4
A5
010203040506010
Y
B5
B4
B3
B2
B1
A1
A2
A3
A4
A5
0246830
Y
The
figur
esh
owst
heav
erag
edi
spla
yed
dept
h(b
lue)
and
hidd
ende
pth
(red
)by
pric
etie
rup
toth
efif
thle
velo
nea
chsi
deof
the
mar
ket.
The
num
bers
are
com
pute
dfr
omfiv
e-m
inut
esn
apsh
ots
ofB
roke
rTec
’slim
itor
derb
ook
fort
here
spec
tive
secu
ritie
sfo
rthe
hour
s7:
00-1
7:30
over
the
2010
-201
1sa
mpl
epe
riod
.Dep
this
repo
rted
inm
illio
nsof
dolla
rs(p
arva
lue)
.
52