Embed Size (px)
Citation preview

The Mediating Effect of Strategic Project Selection in Process Improvement Program Success
Weiyong Zhang
Assistant Professor [email protected]
Phone: (804) 828-3196
Department of Management School of Business
Virginia Commonwealth University 1015 Floyd Avenue
Richmond, VA 23284-4000
Arthur V. Hill †
The John and Nancy Lindahl Professor of Operations and Management Science [email protected]
Phone: (612) 624-4015
Roger G. Schroeder Frank A. Donaldson Chair in Operations Management
[email protected] Phone: (612) 624-9544
Kevin W. Linderman
Associate Professor of Operations and Management Science [email protected]
Phone: (612) 626-8632
Operations and Management Science Department Curtis L. Carlson School of Management
University of Minnesota 3-150 Carlson School of Management Building
321-19th Avenue South Minneapolis, MN 55455 USA
== DRAFT ==
March 16, 2006
Not to be reproduced or quoted without written permission from the authors. † Corresponding author

The Mediating Effect of Strategic Project Selection in Process Improvement Program Success
Abstract Process Improvement Programs (PIPs) such as Total Quality Management, Six Sigma, JIT, and Lean have been the subject of much research over the last two decades. Most research on PIPs examines one specific type of PIP and attempts to evaluate the impact of specific PIP practices on performance. While most scholars agree that PIP research is extremely important, they also agree that it is difficult to make valid assessments about PIPs because the content of PIPs is not clearly defined and changes over time. This research takes a more strategic program management perspective for the study of PIPs. The research empirically examined the fit between two PIP management factors: Strategic Project Selection (SPS) and Disciplined Project Management (DPM), and the impact of fit on performance. Using data collected from 53 supplier plants, regression analysis found that the relationship between DPM and Performance was mediated by SPS. This finding contributes to future theory development and suggests a viable strategy for PIP success: organizations that maintain a focus on DPM will achieve SPS and this will lead to program success. Keywords: Process improvement programs, empirical research, quality management, project management

The Mediating Effect of Strategic Project Selection in Process Improvement Program Success
1. Introduction
The focus of this research is on Process Improvement Programs (PIPs), which Zhang, Hill,
Schroeder, and Linderman (2006) define as a systematic approach for improving organizational
performance that consists of specific practices, tools, techniques, and terminology and is
implemented as a set of process improvement projects. PIP research been directed towards Total
Quality Management (Easton and Jarrell, 1998; Hendricks and Singhal, 1996, 1997, 2001a, b;
Kaynak, 2003; Samson and Terziovski, 1999), Six Sigma (Linderman, Schroeder, and Choo,
2005; Linderman, Schroeder, Zaheer, and Choo, 2003), JIT (Huson and Nanda, 1995), and Lean
(Womack and Jones, 2003; Womack, Jones, and Roos, 1991). Most of the PIP research studies
attempt to evaluate the impact of one type of PIP on performance.
While most scholars agree that research on PIPs is extremely important and that the
existing research on PIPs has added value to the literature, most scholars also agree that it is
extremely difficult to make any strong valid statements about PIPs. One of the most significant
challenges for research on PIPs is that widely accepted definitions for most PIPs do not exist in
either the research literature or in practice. This challenge is exacerbated by the fact that PIPs
tend to change over time, and, in some cases, are even converging (e.g., Lean and Six Sigma).
Research on PIPs is further complicated by the fact that few firms implement more than one
program at the same time, which makes is difficult (if not impossible) to have a valid comparison
of the efficacy of different PIPs in exactly the same business context.
In response to these challenges, this research follows the work by Zhang et al. (2006) and
takes a more strategic “program management” perspective for the study of PIPs. They defined

2
Process Improvement Program Management (PIPM) as the planning, staffing, organizing,
monitoring, and controlling of the projects in a process improvement program. PIPM activities
include project selection, prioritization, resource allocation, and chartering. Schroeder,
Linderman, Liedtke, and Choo (2006) supported the PIPM perspective when they pointed out
that Six Sigma and TQM share very similar program practices but differ mostly in program
management. This approach is also supported by Pande, Neuman, and Cavanagh (2000) who
compared Six Sigma to TQM and ascribed much of the success of Six Sigma programs to
program management.
Zhang et al. (2006) proposed two internal PIPM factors, Strategic Project Selection (SPS)
and Disciplined Project Management (DPM), and empirically validated a plant-level
measurement instrument for these factors. However, that research did not test the relationship
between SPS, DPM, and organizational performance. This research tests the relationship
between these two factors and organizational performance, and more importantly, also tests how
these two factors fit together to improve performance.
Fit theory suggests that the fit between SPS and DPM will lead to performance
improvement. However, the specific form of the fit relationship between these two factors has
not yet been defined in the literature. Fit can be operationalized as moderation or mediation
(Venkatraman, 1989). A clear understanding of the fit relationship between the two factors is
needed to further theory development and provide guidance to practicing managers. The goal of
this paper, therefore, is to better understand the relationship between the two factors (SPS and
DPM) and organizational performance by comparing the two competing forms of fit –
moderation and mediation.

3
This paper is organized as follows. Section 2 briefly reviews the theoretical foundation for
the SPS and DPM factors and then contrasts the two competing forms of fit (moderation and
mediation). Section 3 describes the empirical research design and the measurement instrument.
Sections 4 and 5 describe the research methods, present the empirical results, and discuss the
limitations of the research. Section 6 concludes the paper with a discussion of the theoretical and
managerial implications.
2. Theoretical development
2.1. Strategic Project Selection (SPS)
Strategic Project Selection (SPS) measures the degree of strategic alignment an
organization achieves in selecting and prioritizing process improvement projects. SPS is
reflected in the critical program management tasks of project selection and prioritization. Norrie
and Walker (2004) argue that the best organizations are careful to select projects that implement
their business strategies. The level of strategic alignment in project selection and prioritization
demonstrates an organization’s capability to wisely allocate scarce resources to achieve its most
important strategic objectives.
The positive association between SPS and performance is supported by both the project
management and strategic management literature. The Project Management Institute (PMI)
considers project selection as one of the most important program success factors (PMI Standards
Committee, 2004). Strategy scholars point out that the alignment between strategy and its
implementation significantly impacts performance (Chandler, 1969; Porter, 1980; Venkatraman,
1989). SPS reflects the degree of alignment hence is positively associated with performance.
While a positive association between SPS and performance is supported by the literature,
an empirical examination of this relationship is lacking in the context of process improvement
programs. Therefore, this research will empirically test the following hypothesis:

4
H1: SPS is positively associated with performance.
2.2. Disciplined Project Management (DPM)
Disciplined Project Management (DPM) measures the degree to which an organization
applies a consistent, structured, and accountable approach in managing process improvement
projects. DPM includes dedicated and accountable improvement specialists (Flynn, Flynn,
Amundson, and Schroeder, 1999; Schroeder et al., 2006) and a standard process improvement
methodology with a project charter that defines the project metrics, goals, deliverables, scope,
and timeline (Deming, 2000; Pande et al., 2000; PMI Standards Committee, 2004).
The positive association between DPM and performance is supported by the project
management literature. The project management literature has long recognized the importance
of project management discipline. A project typically consists of multiple interdependent tasks.
Without a disciplined approach to project management, projects will not meet their stated
objectives, and will not be completed on time and within budget (Eckes, 2003; Gray and Larson,
2000).
The positive association between DPM and performance is also supported by the quality
management literature. Well-known standard project management methodologies such as PDCA
and DMAIC emphasize a disciplined approach to project management and encourages rational
decision making. Rational decisions, in general, will lead to positive outcomes (Churchman,
1962; Goll and Rasheed, 1997; Latane, 1959; Simon, 1979). One important aspect of DPM is a
project charter that clearly defines the project objectives. The goal theoretical perspective
suggests that clearly defined objectives (goals) can help explain the success of Six Sigma
programs (Linderman et al., 2003). In a recent follow-up study, Linderman, Schroeder, and
Choo (2005) established a positive association between Six Sigma methods, tools adherence, and

5
project success. Their research provides strong support for the positive association between
DPM and performance.
Overall, strong support can be found for the positive relationship between standard project
management methodology, dedicated improvement specialists, and project success. Aggregated
project successes will contribute to organization level performance. This research hypothesizes,
therefore, that:
H2: DPM is positively associated with performance.
2.3. The fit between SPS and DPM
The structural contingency theory (Donaldson, 2001) provides a framework to understand
the relationship between SPS and DPM. A key idea of the theory is fit, that is, various
components of a system must fit with each other for the system to achieve performance (Miller,
1992; Venkatraman and Camillus, 1984). SPS and DPM represent two different aspects of
process improvement program management. They should fit together for a process improvement
program to be successful. Fig. 1 depicts the model theoretically. Then it is necessary to specify
the form of fit because the meaning of the theory itself can be fundamentally different if
researchers fail to pay adequate attention to the form of fit (Van de Ven, 1979; Van de Ven and
Drazin, 1985; Venkatraman, 1989).
A review of the literature suggests that two competing forms of fit are both reasonable:
moderation and mediation. These two forms of fit are in the criterion-specific group in the
framework developed by Venkatraman (1989). Forms of fit in the criterion-free group are
irrelevant to this study because the goal of this research is to investigate the impact of fit on
performance. The next two sections discuss these two competing forms. Once the models are
developed, empirical data is used to test the two models to find the most plausible one.

6
Fig. 1. The general fit model
2.3.1. Fit as moderation
Fit can be operationalized as moderation. Moderation means the relationship between an
independent variable and a dependent variable is dependent on the level of a third variable, the
moderator (Hair, 1995; Venkatraman, 1989). The fit between the independent variable and the
moderator is the key determinant of the dependent variable. A moderator can affect the direction
or the strength of the relationship between an independent and a dependent variable.
One plausible fit model is that SPS positively moderates the relationship between DPM
and performance. As mentioned above, the positive relationship between DPM and project
success is strongly supported by both the academic and practitioner literature, and aggregated
project successes can contribute to organizational performance. Strategically selected projects
support an organization’s mission and project successes can quickly translate into organizational-
level performance.
In contrast, the success of many trivial projects may have little or no impact on
organizational-level performance. Robinson’s (1950) “ecological fallacy” suggests that the
Strategic Project Selection (SPS)
Disciplined Project Management (DPM)
Performance

7
simple sum of individual project successes may not equate to significant organization-level
performance.
This research hypothesizes, therefore, that the relationship between DPM and
organizational performance is positively moderated by SPS. The positive moderating effect of
SPS is depicted in Fig. 2 below and reflected in Hypothesis H3.
H3: The relationship between DPM and performance is positively moderated by SPS.
Fig. 2. The moderation model
2.3.2. Fit as mediation
Fit can also be operationalized as mediation. Mediation means that the effect of an
independent variable on a dependent variable is intervened by a third variable, the mediator. The
theoretical basis for the mediation model is the existence of a cause and effect relationship along
the chain of the three variables (Baron and Kenny, 1986).
The mediation model posits that SPS mediates the relationship between DPM and
performance. The causal link between DPM and SPS is supported by two arguments. First,
DPM promotes a highly disciplined, analytical, and fact-based organizational culture that
encourages a structured project selection process. The argument is that an organization that is
good at DPM will lean toward having a structured analytical process for difficult decisions such
as project selection and prioritization. The second argument is that the causal link is also
supported by the motivation and reward system for project leaders. DPM promotes the idea of
Disciplined Project Management (DPM)
Strategic Project Selection (SPS)
Performance

8
using dedicated project leaders and holding them responsible for project results. Dedicated
project leaders are motivated to select strategic process improvement projects so they can bring
significant results to their organization and earn positive performance reviews for themselves. It
stands to reason, therefore, that higher DPM will lead to higher SPS, which will in turn lead to
better performance. The mediation model is depicted in Fig. 3 and stated in hypothesis H4.
H4: The relationship between DPM and performance is mediated by SPS.
Fig. 3. The mediation model
In studying mediation models, it is necessary to distinguish between a full and a partial
mediation model. In a full mediation model, the relationship between the independent variable
and the dependent variable is completely mediated by the mediator. In a partial mediation
relationship, the independent variable still has some direct effect on the dependent variable
despite the mediated effect through the mediator. For the mediating relationship between DPM,
SPS and performance, the current literature does not favor either one of the models. Analysis of
the empirical data will show which model is most plausible.
3. Empirical research design
Plant-level empirical data was collected from the suppliers of a large high-technology
electronics manufacturer. This firm will be referred to as High-Technology Inc. (HTI) hereafter,
as per the confidentiality agreement between the firm and the university research team. The
university research team and HTI invited supplier plants to participate in a web-based survey.
Strategic Project Selection (SPS)
Disciplined Project Management (DPM) Performance

9
Multiple responses were requested from each plant. The HTI buyer group evaluated all supplier
plants to measure performance.
3.1. Survey design
HTI is the largest division of a world-class Fortune 500 electronics manufacturer
headquartered in North America with more than 10,000 employees worldwide. It is a world
leader in the design and development of high-quality electronics products. HTI considered
quality to be critical to its long-term success and emphasized this concept with its suppliers.
Almost all HTI suppliers have implemented one or more process improvement programs.
The supplier base for HTI included a wide variety of suppliers from a number of different
industries, making both mechanical and electrical parts, engineered and commodity parts, and
high-value and low-value parts. Most suppliers were based in North America with a few of them
in Europe and Asia. The size of the suppliers, in terms of the number of employees, also varied
significantly. The entire population of plants in this supplier base was surveyed. Although the
sample was limited to the suppliers for this one large manufacturer, the variety in the supplier
base suggests that the research conclusions should be fairly generalizeable across industries.
A web-based survey was conducted to collect empirical data for this study. The decision
was made based on a thorough comparison of web-based and paper-based survey methods
(Boyer, Olson, Calantone, and Jackson, 2002). Klassen and Jacobs (2001) suggested five criteria:
cost, coverage error, response rate, item completion rate, and systematic error. The target
respondents were professional managers and all had access to the Internet. A web-based survey
was considered better than (or at least comparable to) other alternatives on all five criteria.
The survey website was easy to use. All the survey items were listed on one page using
the same 7-point Likert scale. This effectively reduced the cognitive burden on the respondents.
The items could be answered by simply clicking radio buttons. Several pilot tests were

10
performed with managers at HTI and other firms not in the sample to ensure that the survey
could be completed within 10 minutes.
The survey invitation specifically requested three respondents (one sales manager, one
manufacturing manager, and one quality manager) from each supplier plant. The goal was to
find respondents who had good knowledge of the research subject (Flynn, Sakakibara, Schroeder,
Bates, and Flynn, 1990). Having multiple respondents is desirable for studying complex
problems because “a multitude of people at all levels are involved with various operating
decisions, then efforts to measure competitive priorities [and other similar constructs] should
encompass a broader scope than a single respondent” (Boyer and Pagell, 2000, p. 365, text in
bracket added). Using a single respondent can lead to biased results because of the high risk of
receiving a skewed perspective from one individual in a plant (Boyer and Verma, 2000).
A high response rate was achieved following the techniques suggested by Frohlich (2002).
Response rate measures the quality and relevance of a study and a low response rate immediately
raises the concern of nonresponse bias (Flynn et al., 1990; Malhotra and Grover, 1998). The
university research team leveraged HTI’s close relationships with its suppliers and had the HTI
commodity managers send out the initial survey invitations to suppliers. The survey website was
hosted by the university rather than by HTI and the website clearly stated that HTI did not have
access to any individual responses. This strong confidentiality protocol was designed to alleviate
concerns about confidentiality that might lead respondents to not respond or to provide a biased
response. The university research team actively engaged in the follow-up activities, assuring
confidentiality, and promising to share the valuable benchmarking analysis to encourage
participation.

11
3.2. Empirical data
All supplier plants (130) of HTI were invited to participate in the survey. The final
complete data set included 104 valid individual responses from 53 plants, achieving a response
rate of 40.8% at the plant level. Table 1 presents some characteristics of the sample.
No evidence of significant non-response bias was found in the data. Some previous studies
checked for nonresponse bias by comparing early to late responses, assuming that late
respondents represented non-respondents (Armstrong and Overton, 1977; Lambert and
Harrington, 1990). This research collected demographic information from 20 randomly selected
non-responding plants. A two-sample t test on this data showed no evidence of significant
nonresponse bias (p = 0.34).
Table 1 Sample characteristics Individual responses Total individual responses 104 Individuals from sales 37 Individuals from manufacturing 34 Individuals from quality 33 Plant responses Total number of plants 53
Number of plants with 4 responses 2 Number of plants with 3 responses 17 Number of plants with 2 responses 11 Number of plants with 1 response 23 Average number of employees 544
Using multiple raters is more difficult in empirical studies but it can provide “a greater
degree of methodological rigor, thus leading to a greater degree of confidence in the findings”
(Boyer and Verma, 2000, p. 129). However, to obtain the benefits, researchers must carefully
assess the inter-rater reliability measures. The Interclass Correlation (ICC) measures for the SPS
and DPM factors were both greater than the suggested 0.6.

12
3.3. Measures
SPS and DPM were measured using the instrument developed by Zhang et al. (2006). The
measurement instrument was developed and validated through a rigorous process similar to that
of Flynn, Schroeder, and Sakakibara (1994). All the items in the measurement instrument used
the same 7-point Likert scale (1=Disagree strongly, 2=Disagree, 3=Disagree somewhat,
4=Neutral, 5=Agree somewhat, 6=Agree, 7=Agree strongly, and N=No response). Ahire et al.
(1996) argue that the 7-point scale is better than a 5-point scale because of its capability to
capture more variation. Reverse items were used to detect invalid data from respondents who
answered questions without reading them. The large-scale empirical test using the Confirmatory
Factor Analysis (CFA) method supported the validity of the instrument (Zhang et al., 2006).
Table 2 shows the items for the SPS and DPM constructs.
The dependent variable for this study was the Supplier Operating Performance (SOP)
factor. Operating performance is typically measured in five dimensions: quality, cycle time,
delivery, cost, and flexibility (Benson, Cunningham, and Leachman, 1995; Ferdows and De
Meyer, 1990). The scales used by Ahire et al. (1996) were adapted for this study. Their scale
was anchored on the worst companies in the industry and was essentially a reversed scale. This
research asked the HTI buyers to give their evaluation of supplier performance on all five
performance dimensions compared to the “best in the industry” (see Table 2).
Multiple responses from the same plant were first averaged to obtain one observation for
that plant. Then the validities of the measurement instrument were examined statistically with
SPSS. Principal Components Analysis (PCA) with the Varimax rotation was performed to
determine scale unidimensionality. Finally, Cronbach’s alpha for all three scales was examined.
SPS consists of three items. Cronbach’s alpha for the SPS scale was 0.694, clearly
exceeding the minimum acceptable standard of 0.6 suggested by Nunnally and Bernstein (1994).

13
PCA found that all three SPS items loaded onto a single factor. The eigenvalue was 1.893,
higher than the minimum acceptable level of 1.0. The SPS factor explained 63.1% of the
variation. The factor loadings for all the items ranged from 0.604 to 0.898, all above the
acceptable lower bound of 0.4 (Carmines and Zeller, 1979).
DPM consists of four items. The DPM scale had a Cronbach’s alpha of 0.868, much
higher than the minimum value of 0.6. All four items loaded onto a single factor and the
loadings ranged from 0.794 to 0.913. The eigenvalue associated with the scale was 2.938. The
DPM factor explained 73.4% of the variation.
Table 2 Measurement instrument
Construct Item N Mean S.D.Process improvement projects are generated based on our strategy.
53 5.67 0.93
We prioritize new process improvement projects based on our strategy.
53 5.80 0.88
Strategic Project Selection (SPS)
Process improvement project selection is driven by our customers’ needs.
53 5.74 0.93
Our process improvement projects are led by full-time process improvement experts.
53 4.98 1.65
Our leadership holds process improvement project team leaders accountable for project results.
52 5.51 1.13
Our projects use a standard process improvement methodology and language.
53 5.37 1.18
Disciplined Project Management (DPM)
Our projects have a charter that defines the metrics, goals, deliverables, scope, and timeline.
52 5.55 1.24
This supplier has the best internal first pass yield rate in the industry.
42 4.64 1.18
This supplier's throughput time is the best in the industry.
51 4.35 1.37
This supplier's delivery performance is the best in the industry.
53 5.04 1.51
This supplier has the best unit cost in the industry. 53 4.37 1.22
Supplier Operating Performance (SOP)
This supplier has the best ability to quickly adjust production capacity in the industry.
52 4.46 1.26
The SOP factor consists of five items. However, factor analysis showed that all five items
except for the cost item loaded onto one factor. Therefore, cost was dropped from the factor.

14
The cost item is really the price as seen by the HTI buyers. The suppliers’ prices are affected by
many different factors such as the plant’s total volume, market position vis-à-vis its competitors,
product technology, process technology, and many other factors that are likely to be outside the
buyer’s ability to interpret accurately (Hendricks and Singhal, 2001a). Among the operating
performance dimensions, the cost data is confounded by many factors and was eventually
excluded from the performance factor. Cronbach’s alpha for SOP with four items was 0.689.
Items loadings ranged from 0.437 to 0.921. The eigenvalue was 2.108. The factor explained
52.7% of the variation (see Table 3).
Table 3 The SPS, DPM and SOP factors SPS DPM SOP Cronbach’s Alpha 0.694 0.868 0.689 Factor loadings
Item 1 0.898 0.794 0.773 Item 2 0.850 0.869 0.921 Item 3 0.604 0.913 0.685 Item 4 0.847 0.437
Eigenvalue 1.893 2.938 2.108 Variation explained 63.1% 73.4% 52.7%
HTI buyers evaluated SOP for each plant. This avoided problems that can occur with
common method bias. Common method biases occur when the variance is attributable to the
measurement method rather than to the constructs that the measures represent (Campbell and
Fiske, 1959). It is most likely to occur in survey research when all variables are collected from
the same informants. With common method bias, the validity of the conclusions is threatened
because it is hard to tell whether the relationships represent the reality or just the respondents’
perception (Podsakoff, MacKenzie, Lee, and Podsakoff, 2003). Having different informants for
the independent and dependent variables eliminates concern about common method bias and
increases the credibility of the results.

15
Once factor analysis confirmed the validity of all three scales, the factor scores for each
construct were calculated using regression in SPSS. Hair (1995) noted that factor scores are
“composite measures for each factor representing each subject … Conceptually speaking, the
factor score represents the degree to which each individual scores high on the group of items that
load high on a factor … these scores are saved for further use in subsequent analyses.” (p. 390).
The subsequent regression analyses used factor scores.
Finally, organizational size has been recognized as a critical control variable in empirical
studies. Daft (2000) suggested that “because organizations are social systems, size is typically
measured by number of employees” (p. 18). Because the distribution of Number of Employees
(EMP) was highly skewed (as expected), a natural log transformation was applied following
Neter, Kutner, Nachtsheim, and Wasserman (1996).
4. Methods
This study used the ordinary least squares (OLS) regression method. Moderated
Regression Analysis (MRA) was used to test the moderation hypothesis. In addition, the Baron
and Kenny (1986) procedure was used to test the mediation model. All assumptions of OLS
regression were examined before any conclusions were drawn.
4.1. Moderated Regression
Testing the moderation effect by MRA requires the addition of an interaction term in the
regression equation. The interaction term is the cross product of factors scores of SPS and DPM
in this study. If the interaction term is statistically significant, the moderation hypothesis is
supported. Because all regression assumptions were met, it was appropriate to add the
interaction term to the models.
Venkatraman (1989) cautioned researchers that the MRA method should only be used
when the research hypothesis states that the outcome is jointly determined by the interaction of

16
the independent variable and moderator. In contrast, if the research hypothesis is that the impact
of the independent variable on outcome differs across different levels of the moderator, subgroup
analysis is more appropriate. Since the hypothesis states that it is the interaction between SPS
and DPM that determines the performance level, MRA is the appropriate method.
4.2. Mediation model test method
Testing mediation models is more complicated than that of moderation models. Baron and
Kenny (1986) and Judd and Kenny (1981) suggested a general procedure for testing mediation
using multiple regression, illustrated in Fig. 4. The procedure has four steps with the fourth step
being optional. The steps are:
Step 1: Conduct a regression analysis to show that the independent variable (IV) is
correlated with the dependent variable (DV) (path c). A statistically significant correlation is the
prerequisite for a mediation model to hold.
Step 2: Show that the IV is correlated with the mediation variable (MV) (path a). Path a
must be significant for the mediation model to hold.
Step 3: Show that the MV affects the DV by regressing the DV on both the IV and MV
together. Regressing the DV on the MV only is insufficient because the MV and the DV may be
correlated if the IV causes them both. Thus, the IV must be controlled when establishing the
effect of the MV on the DV.
Step 4: To establish that the MV fully mediates the IV-DV relationship, the effect of the
IV on the DV controlling for the MV (path c’) should be zero, otherwise a partial mediation
model is supported.
Mediation is supported when all the paths (except c’) are statistically significant, provided
that the causal links among variables are established by the theory. Step 4 is optional because it
is only required for the test of full mediation effect. If the IV no longer has any effect on the DV

17
when the MV has been controlled, the full mediation has occurred. If the coefficient of path c’ is
different from zero, the effects can be partitioned into direct and indirect effects. Statistical
significance of path c’ is irrelevant in Step 4 because trivially small coefficients can be
statistically significant with large sample sizes and very large coefficients can be insignificant
with small sample sizes (Baron and Kenny, 1986).
Fig. 4: The mediation model test
To establish a mediation relationship, it is important to rule out other possible models that
are consistent with the data. One possibility is the reverse causal effects, that is, the MV is, in
fact, caused by the DV. Because regression analysis does not assume causality, it is not possible
to rule out this alternative model simply by evaluating the regression results. However, a
reversed causal effect is not a concern in this study because the reversed causal link (SOP SPS)
is not supported by the literature or by logical reasoning.
One important methodological issue is whether the IV should be controlled in Step 3.
James and Brett (1984) argued that Step 3 should be modified by not controlling for the IV.
Their rationale is that if there is full mediation, there would be no need to control for the IV.
However, full mediation does not always occur. In this study it is more sensible to control for
the IV in Step 3 so that the empirical results can reveal whether the full or partial mediation
model is most plausible.
b
c (c’)
aMediating
Variable (MV)
Independent Variable (IV)
Dependent Variable (DV)

18
Although the above steps can be used to informally judge whether mediation is occurring
or not, a formal assessment will involve statistical tests (MacKinnon, Warsi, and Dwyer, 1995).
The mediation effect is also called an indirect effect and is defined as the reduction of the effect
of the IV on the DV, mathematically, c – c’. Studies have shown that the reduction is
theoretically the same as the product of the effect of the IV on the MV times the effect of the MV
on the DV, mathematically, c – c’ ≈ ab, when there are no missing observations (Baron and
Kenny, 1986). A test of the null hypothesis of ab = 0 can reveal whether a mediation effect is
present. Although it is possible to test both a = 0 and b = 0 simultaneously with the appropriate
family alpha level, a single test is preferred (MacKinnon, Lockwood, Hoffman, West, and Sheets,
2002).
The most commonly used test is the Sobel (1982) test, which is a z test, with two major
variants. This test is based on the fact that the standard error of ab is approximately the square
root of b2Sa2 + a2Sb
2. The two major variants are Aroian and Goodman (Sobel, 1982). The
difference is whether the term Sa2Sb
2 is included in the denominator or not. The Aroian version
is recommended by some scholars because it does not make the unnecessary assumption that the
product Sa2Sb
2 is vanishingly small. The Goodman version of the test subtracts the third term for
an unbiased estimate of the variance of the mediated effect, but this can sometimes have the
unfortunate effect of yielding a negative variance estimate. The Sobel test and the Aroian test
seemed to perform the best in a Monte Carlo study, and converge closely with a sample size
greater than 50 (MacKinnon et al., 1995). This study performed all three tests and found the
same results for all three. The equations for these three tests are given below.
2222 z
ba SaSbab+
= 222222
zbaba SSSaSb
ab++
= 222222
zbaba SSSaSb
ab−+
=
Sobel version Aroian version Goodman version

19
4.3. Multicollinearity
Multicollinearity is an important analytical issue in regression. When two or more
independent variables are highly correlated with each other, the overall fit of the model to the
data will not change significantly but estimation of individual coefficients can be significantly
comprised (Hair, 1995). Usually with multicollinearity, the estimation of the standard error of
individual coefficients is not stable and is biased toward enlargement. This can lead to
incorrectly concluding that an important variable is statistically insignificant
In analyzing both the moderation and mediation models, multicollinearity is expected. In
moderation models, the interaction term is likely to be strongly correlated with the independent
variables. However, it is worth noting that although statistical estimations might be problematic
due to multicollinearity, establishing the existence of moderation effects is not a problem
(Venkatraman, 1989). In fact, simple transformation of variables such as centering can reduce
the level of correlation between the interaction term and the original variables, hence decreasing
the negative impact of multicollinearity.
In mediation models, multicollinearity exists by definition. For a mediation model to hold,
the IV is correlated with the MV, hence the estimation of the coefficients of path b and c’ is
compromised. The Variance Inflation Factor (VIF) and a large sample can be used to manage
the issue. VIF measures the impact of collinearity among the independent variables in a
regression model on the precision of estimation. It expresses the degree to which collinearity
among the independent variables degrades the precision of an estimate. In general, a high VIF
suggests an unstable regression analysis and the resultant estimation is invalid. However,
different disciplines have suggested different cutoff values. Hair et al. (1995) suggested a cutoff
value of 10, whereas many social science disciplines suggest 4. All VIF values reported in the

20
regression analyses in this study were lower than 2. Multicollinearity, therefore, was judged not
to be a problem in this study.
5. Results and Discussion
5.1. Results
The means, standard deviations, and correlations of the variables under consideration are
displayed in Table 4. The effect of the control variable is examined first, followed by the
hypotheses in order.
Table 4 Descriptive statistics and correlationsa
Variable Nb Mean S.D. 1 2 3 4 1. SOP 53 0 1 1.000 2. SPS 53 0 1 0.492*** 1.000 3. DPM 53 0 1 0.407** 0.620*** 1.000 4. Ln(EMP) 49 5.223 1.357 0.254 0.067 0.282 1.000 a * p < 0.05, ** p < 0.01, *** p < 0.001 b Sample size adjusted for missing data.
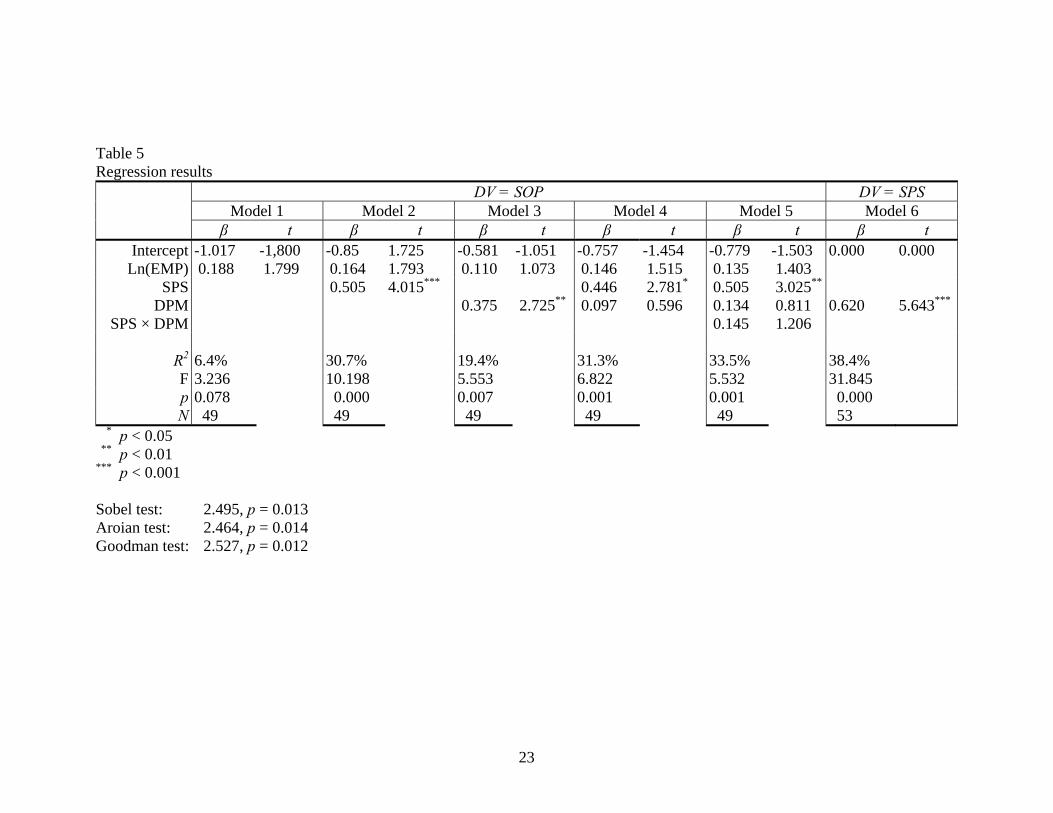
Table 5 provides the results of the regression analysis. Model 1 gives the regression of the
control variable on the performance variable, which is insignificant (F = 3.236, p = 0.078). This
suggests that HTI buyers’ evaluation of supplier plant performance was independent of plant size.
Model 2 examines the individual contribution of SPS on performance. The model is highly
significant (F = 10.198, p = 0.000) with a positive coefficient for SPS, suggesting that SPS is
positively associated with performance. The R2 is a very decent 30.7%. Therefore, hypothesis
H1 is supported. Similarly, Model 3 examines the individual contribution of DPM on
performance. The model is also highly significant (F = 5.553, p = 0.007) with a positive
coefficient for DPM. Therefore, hypothesis H2 is supported. DPM is positively associated with
performance.
Model 5 examines the moderation hypothesis. The cross product of SPS and DPM is
added to the model. The model is highly significant (F = 5.532, p = 0.001); however, the

21
coefficient for the interaction term is not significant (p = 0.234). The analysis does not find
support for the moderation effect of SPS. Hypothesis H3 is not supported.
A test of the mediation hypothesis requires several simultaneous regression analyses as
suggested by Baron and Kenny (1986). First, Model 3 proves that DPM is positively associated
with performance. This establishes the basis that there could be an effect to be mediated. Model
6 then shows that SPS and DPM are positively correlated (F = 31.845, p = 0.000). Finally,
Model 4 shows that the coefficient of DPM is smaller than that of Model 3 when the mediator
SPS is added. This pattern informally suggests the existence of mediation effect from SPS. The
three formal Sobel tests reached the same conclusion, statistically confirming the mediating role
of SPS. Hypothesis H4, therefore, is supported.
5.2. Discussion
These empirical results confirm that both SPS and DPM are important factors in the
effectiveness of process improvement programs. Individually, each is significantly correlated
with SOP. This result confirms both the content and predictive validity of the constructs.
Empirical results further reveal that the inter-relationship between the two factors is best
described by a partial mediation model rather than a moderation model. The moderation
hypothesis is not supported, suggesting that the effect of DPM on SOP is not moderated by SPS.
Instead, the mediation hypothesis is supported. Overall, a higher level of DPM will lead to both
a higher level of SPS and a higher level of SOP, and a higher level SPS further contributes to
SOP.
The coefficient of DPM in Model 4 is smaller than in Model 3. This size reduction is key
to the establishment of the mediation effect. The coefficient, although smaller, is not close to
zero. This suggests that a partial mediation model is more appropriate than a full mediation

22
model. While SPS mediates the relationship between DPM and SOP, DPM still has some direct
effect on SOP.
5.3. Limitations
Two limitations of this study need to be acknowledged. First, empirical data for this study
was from supplier plants for one large high-tech firm. The study, therefore, may not be
generalizeable beyond the types of suppliers in that sample. Replication of this study is needed
to address this concern. Second, the sample size (N = 53 plants) was not large. A larger sample
size would provide for more statistical power and also enable the use of more powerful statistical
methods such as Structural Equation Models.
6. Conclusions
This research began with a definition of process improvement programs (PIPs) and the
program management mechanism for PIPs. The research posited that two process improvement
program management (PIPM) factors, Strategic Project Selection (SPS) and Disciplined Project
Management (DPM), had significant impact on performance. The research further posited that
SPS and DPM need to fit with each other to achieve performance, but raised the question of the
nature of that fit. The paper then developed four hypotheses dealing with relationships between
SPS, DPM, and Supplier Operating Performance (SOP), with emphasis on the form of fit
between the two factors.
A large-scale empirical study was conducted in collaboration with the largest division of a
large high-tech electronics firm that allowed the research team to survey its key suppliers. This
cross-program study did not ask respondents to identify which process improvement programs
they had implemented. This approach avoided the difficult definitional issues around specific
process improvement programs such as Six Sigma and changed the focus of the research to the
program management issues that are shared by all process improvement programs.
23
Table 5 Regression results
DV = SOP DV = SPS Model 1 Model 2 Model 3 Model 4 Model 5 Model 6
β t β t β t β t β t β t Intercept -1.017 -1,800 -0.85 1.725 -0.581 -1.051 -0.757 -1.454 -0.779 -1.503 0.000 0.000
Ln(EMP) 0.188 1.799 0.164 1.793 0.110 1.073 0.146 1.515 0.135 1.403 SPS 0.505 4.015*** 0.446 2.781* 0.505 3.025**
DPM 0.375 2.725** 0.097 0.596 0.134 0.811 0.620 5.643***
SPS × DPM 0.145 1.206
R2 6.4% 30.7% 19.4% 31.3% 33.5% 38.4% F 3.236 10.198 5.553 6.822 5.532 31.845 p 0.078 0.000 0.007 0.001 0.001 0.000 N 49 49 49 49 49 53
* p < 0.05 ** p < 0.01 *** p < 0.001 Sobel test: 2.495, p = 0.013 Aroian test: 2.464, p = 0.014 Goodman test: 2.527, p = 0.012

24
The majority of the 53 plants in the sample provided multiple respondents. The analysis of
empirical data strongly supported the posited relationship between both factors (SPS and DPM)
and Supplier Operating Performance (SOP). More importantly, the empirical results found that
SPS partially mediates DPM and SOP.
This study makes several contributions to the literature. First, the study empirically
confirms the validity of the PIPM research perspective: how process improvement programs are
managed has a significant impact on the program effectiveness. Second, this is the first paper to
empirically test the relationships between two new PIPM factors (SPS and DPM) and
performance. The empirical results show that the two factors can explain a large portion of the
variation in performance. The validity of the PIPM research perspective is thus empirically
confirmed and the research perspective can now be used to explain some of the differences in
program success for process improvement programs. The study shows that SPS and DPM are
generalizeable “best practices” for process improvement program management, independent of
which process improvement program is implemented. Third, the study contrasts two common
forms of fit and finds that SPS partially mediates the effect of DPM on performance. This is the
first research study to identify the mediating role of SPS in process improvement programs. This
new insight will contribute to future theory development.
This research also provides some guidance for practicing managers. Many managers are
perplexed by the problem of selecting the right process improvement program for their
organization -- Lean, Six Sigma, Lean Sigma, etc. This study challenges managers to reframe
the question in terms of PIPM factors SPS and DPM. While process improvement program
selection is important, this research suggests that program management may be even more
important. This study also challenges practicing managers to re-think the role of both SPS and

25
DPM. Leading Six Sigma consultants and successful business leaders have emphasized DPM in
the practitioner literature (e.g., Bossidy, Charan, and Burck, 2002). However, this body of
literature has never explored the relationships between SPS, DPM, and performance. An
important message for the managers from this study is that DPM will, in fact, promote a highly
disciplined organizational culture and positively influence SPS. This approach suggests that
managers should focus on creating a disciplined project management environment. The
disciplined culture will then drive improvement into their organization’s process improvement
project selection effort, and eventually lead to performance.
References
Ahire, S. L., Golhar, D. Y., Waller, M. A. 1996. Development and validation of TQM implementation constructs. Decision Sciences, 27(1): 23-56.
Armstrong, J. S., Overton, T. S. 1977. Estimating nonresponse bias in mail surveys. Journal of Marketing Research, 14(3): 396-402.
Baron, R. M., Kenny, D. A. 1986. The moderator-mediator variable distinction in social psychological research: Conceptual, strategic, and statistical considerations. Journal of Personality and Social Psychology, 51(6): 1173-1182.
Benson, R. F., Cunningham, S. P., Leachman, R. C. 1995. Benchmarking manufacturing performance in the semiconductor industry. Production and Operations Management, 4(3): 201-216.
Bossidy, L., Charan, R., Burck, C. 2002. Execution: the discipline of getting things done (1st ed.). Crown Business, New York.
Boyer, K. K., Olson, J. R., Calantone, R. J., Jackson, E. C. 2002. Print versus electronic surveys: a comparison of two data collection methodologies. Journal of Operations Management, 20(4): 357-373.
Boyer, K. K., Pagell, M. 2000. Measurement issues in empirical research: improving measures of operations strategy and advanced manufacturing technology. Journal of Operations Management, 18(3): 361-374.
Boyer, K. K., Verma, R. 2000. Multiple raters in survey-based operations management research: A review and tutorial. Production and Operations Management, 9(2): 128-140.
Campbell, D. T., Fiske, D. W. 1959. Convergent and discriminant validation by the multitrait-multimethod matrix. Psychological Bulletin, 58: 81-105.
Carmines, E. G., Zeller, R. A. 1979. Reliability and validity assessment. Sage Publications, Beverly Hills, CA.
Chandler, A. D. 1969. Strategy and structure: Chapters in the history of the industrial enterprise. M.I.T. Press, Cambridge, MA.

26
Churchman, C. W. 1962. On rational decision making. Management Technology, 2(2): 71-76. Daft, R. L. 2000. Organization theory and design (7th ed.). West Pub. Co., Minneapolis/St. Paul,
MN. Deming, W. E. 2000. Out of the crisis. MIT Press, Cambridge, MA. Donaldson, L. 2001. The contingency theory of organizations. Sage Publications, Thousand
Oaks, CA. Easton, G. S., Jarrell, S. L. 1998. The effects of total quality management on corporate
performance: an empirical investigation. Journal of Business, 71(2): 253-307. Eckes, G. 2003. Six Sigma team dynamics: The elusive key to project success. John Wiley, New
York. Ferdows, K., De Meyer, A. 1990. Lasting improvements in manufacturing performance: In
search of a new theory. Journal of Operations Management, 9(2): 168-184. Flynn, B. B., Flynn, E. J., Amundson, S., K., Schroeder, R. G. 1999. Product development speed
and quality: a new set of synergies? In Stahl, M.J. (Ed.), Perspectives in total quality: 245-271. Oxford, UK: Blackwell Publishers.
Flynn, B. B., Sakakibara, S., Schroeder, R. G., Bates, K. A., Flynn, E. J. 1990. Empirical research methods in operations management. Journal of Operations Management, 9(2): 250-284.
Flynn, B. B., Schroeder, R. G., Sakakibara, S. 1994. A framework for quality management research and an associated measurement instrument. Journal of Operations Management, 11(4): 339-366.
Frohlich, M. T. 2002. Techniques for improving response rates in OM survey research. Journal of Operations Management, 20(1): 53-62.
Goll, I., Rasheed, A. M. A. 1997. Rational decision-making and firm performance: The moderating role of environment. Strategic Management Journal, 18(7): 583-591.
Gray, C. F., Larson, E. W. 2000. Project management: The managerial process. Irwin/McGraw-Hill, Boston.
Hair, J. F. 1995. Multivariate data analysis with readings (4th ed.). Prentice Hall, Englewood Cliffs, NJ.
Hendricks, K. B., Singhal, V. R. 1996. Quality awards and the market value of the firm: An empirical investigation. Management Science, 42(3): 415-436.
Hendricks, K. B., Singhal, V. R. 1997. Does implementing an effective TQM program actually improve operating performance? Empirical evidence from firms that have won quality awards. Management Science, 43(9): 1258-1274.
Hendricks, K. B., Singhal, V. R. 2001a. Firm characteristics, total quality management, and financial performance. Journal of Operations Management, 19(3): 269-285.
Hendricks, K. B., Singhal, V. R. 2001b. The long-run stock price performance of firms with effective TQM programs. Management Science, 47(3): 359-368.
Huson, M., Nanda, D. 1995. The impact of Just-In-Time manufacturing on firm performance in the US. Journal of Operations Management, 12(3-4): 297-310.
James, L. R., Brett, J. M. 1984. Mediators, moderators and tests for mediation. Journal of Applied Psychology, 69(2): 307-321.
Judd, C. M., Kenny, D. A. 1981. Process analysis: Estimating mediation in treatment evaluations. Evaluation Review, 5: 602-619.
Kaynak, H. 2003. The relationship between total quality management practices and their effects on firm performance. Journal of Operations Management, 21(4): 405-435.
27
Klassen, R. D., Jacobs, J. 2001. Experimental comparison of Web, electronic and mail survey technologies in operations management. Journal of Operations Management, 19(6): 713-728.
Lambert, D. M., Harrington, T. C. 1990. Measuring nonresponse bias in customer service mail surveys. Journal of Business Logistics, 11(2): 5-25.
Latane, H. A. 1959. Rational decision-making in portfolio management. Journal of Finance, 14(3): 429-430.
Linderman, K., Schroeder, R. G., Choo, A. S. 2005. Six Sigma: The role of goals in improvement teams. Journal of Operations Management, Forthcoming.
Linderman, K., Schroeder, R. G., Zaheer, S., Choo, A. S. 2003. Six Sigma: A goal-theoretic perspective. Journal of Operations Management, 21(2): 193-203.
MacKinnon, D. P., Lockwood, C. M., Hoffman, J. M., West, S. G., Sheets, V. 2002. A comparison of methods to test the significance of the mediated effect. Psychological Methods, 7(1): 83-104.
MacKinnon, D. P., Warsi, G., Dwyer, J. H. 1995. A simulation study of mediated effect measures. Multivariate Behavioral Research, 30(1): 41-62.
Malhotra, M. K., Grover, V. 1998. An assessment of survey research in POM: From constructs to theory. Journal of Operations Management, 16(4): 407-425.
Miller, D. 1992. Environmental fit versus internal fit. Organization Science, 3(2): 159-178. Neter, J., Kutner, M. H., Nachtsheim, C. J., Wasserman, W. 1996. Applied linear statistical
models (4th ed.). WCB/McGraw-Hill, Norrie, J., Walker, D. H. T. 2004. A balanced scorecard approach to project management
leadership. Project Management Journal, 35(4): 47-56. Nunnally, J. C., Bernstein, I. H. 1994. Psychometric theory (3rd ed.). McGraw-Hill, New York,
NY. Pande, P. S., Neuman, R. P., Cavanagh, R. R. 2000. The Six Sigma way: How GE, Motorola,
and other top companies are honing their performance. McGraw-Hill, New York, NY. PMI Standards Committee. 2004. A guide to the project management body of knowledge (3rd
ed.). Project Management Institute, Podsakoff, P. M., MacKenzie, S. B., Lee, J.-Y., Podsakoff, N. P. 2003. Common method biases
in behavioral research: A critical review of the literature and recommended remedies. Journal of Applied Psychology, 88(5): 879-903.
Porter, M. E. 1980. Competitive strategy: Techniques for analyzing industries and competitors. Free Press, New York, NY.
Robinson, W. S. 1950. Ecological correlations and the behavior of individuals. American Sociological Review, 15(3): 351-357.
Samson, D., Terziovski, M. 1999. The relationship between total quality management practices and operational performance. Journal of Operations Management, 17(4): 393-409.
Schroeder, R. G., Linderman, K., Liedtke, C., Choo, A. S. 2006. Six Sigma: Definitions and theory. Working paper, University of Minnesota. Minneapolis, MN.
Simon, H. A. 1979. Rational decision making in business organizations. The American Economic Review, 69(4): 493-513.
Sobel, M. E. 1982. Asymptotic confidence intervals for indirect effects in structural equation models. Sociological Methodology, 13: 290-312.
Van de Ven, A. H. 1979. Review of Aldrich's book - Organizations and environments. Administrative Science Quarterly, 24(2): 320-326.

28
Van de Ven, A. H., Drazin, R. 1985. The concept of fit in contingency theory. Research in Organizational Behavior, 7: 333-365.
Venkatraman, N. 1989. The concept of fit in strategy research: toward verbal and statistical correspondence. Academy of Management Review, 14(3): 423-444.
Venkatraman, N., Camillus, J. C. 1984. Exploring the concept of "Fit" in strategic management. Academy of Management Review, 9(3): 513-525.
Womack, J. P., Jones, D. T. 2003. Lean thinking: Banish waste and create wealth in your corporation (1st Free Press ed.). Free Press, New York, NY.
Womack, J. P., Jones, D. T., Roos, D. 1991. The machine that changed the world (1st HarperPerennial ed.). HarperPerennial, New York, NY.
Zhang, W., Hill, A. V., Schroeder, R. G., Linderman, K. W. 2006. Development of a measurement instrument for three process improvement program management constructs. Minneapolis, MN.