Embed Size (px)
Citation preview
sustainability
Article
Automobile Industry Strategic Alliance PartnerSelection: The Application of a Hybrid DEA andGrey Theory Model
Chia-Nan Wang 1, Xuan-Tho Nguyen 1,* and Yen-Hui Wang 2
1 Department of Industrial Engineering and Management, National Kaohsiung University of AppliedSciences, No. 415 Chien Kung Road, Sanmin District, Kaohsiung City 80778, Taiwan;[email protected]
2 Department of Information Management, Chihlee University of Technology, New Taipei City 22050, Taiwan;[email protected]
* Correspondence: [email protected]; Tel.: +886-970-456-070
Academic Editor: Adam JabłonskiReceived: 21 December 2015; Accepted: 6 February 2016; Published: 17 February 2016
Abstract: Finding the right strategic alliance partner is a critical success factor for many enterprises.Therefore, the purpose of this study is to propose an effective approach based on grey theory and dataenvelopment analysis (DEA) for selecting better partners for alliance. This study used grey forecastingto predict future business performances and used DEA for the partner selection of alliances. Thisresearch was implemented with realistic public data in four consecutive financial years (2009–2012) ofthe world’s 20 biggest automobile enterprises. Nissan Motor Co., Ltd was set to be the target decisionmaking unit (DMU). The empirical results showed that, among 19 candidate DMUs, Renault (DMU10)and Daimler (DMU11) were the two feasible beneficial alliance partners for Nissan. Although thisresearch is specifically applied to the automobile industry, the proposed method could also be appliedto other manufacturing industries.
Keywords: strategic alliance; data envelopment analysis; grey prediction; automobile industry
1. Introduction
The automobile industry is a pillar of the global economy and a main driver of macroeconomicgrowth and innovation. Its cycle intertwines with all major business cycles [1]. Since it has stronglinkages with other parts of the economy, this industry has been severely affected by the economicrecession starting in 2008. In spite of manufacturers trying various strategies, production is still belowits pre-crisis level.
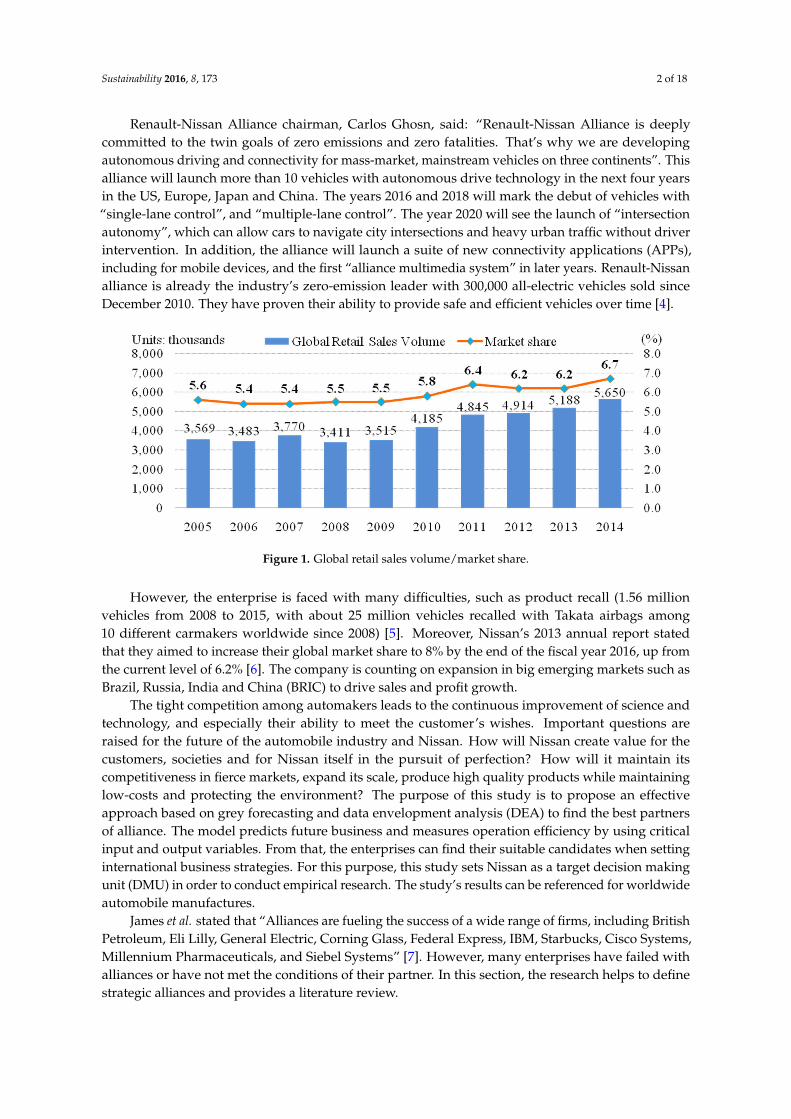
This research investigation began with the top 50 automobile enterprises, by using the WorldRanking OICAs’ survey of 2012 [2]. However, the study was obliged to focus on the top 20, due toa lack of public data. These enterprises played major roles and could fully represent the automobileindustry. Among them, Nissan Motor Company was ranked sixth by production volume. Establishedin Japan in 1933, Nissan manufactures vehicles in 20 countries now. It also provides products andservices in more than 160 countries. Figure 1 shows Nissan’s global retail sales volume and marketshare. Except for 2008, the enterprise had increased its sale volume and market share year by year(3,569,000–5,650,000 units and 5.6%–6.7% from 2005 to 2014) [3].
Sustainability 2016, 8, 173; doi:10.3390/su8020173 www.mdpi.com/journal/sustainability
Sustainability 2016, 8, 173 2 of 18
Renault-Nissan Alliance chairman, Carlos Ghosn, said: “Renault-Nissan Alliance is deeplycommitted to the twin goals of zero emissions and zero fatalities. That’s why we are developingautonomous driving and connectivity for mass-market, mainstream vehicles on three continents”. Thisalliance will launch more than 10 vehicles with autonomous drive technology in the next four yearsin the US, Europe, Japan and China. The years 2016 and 2018 will mark the debut of vehicles with“single-lane control”, and “multiple-lane control”. The year 2020 will see the launch of “intersectionautonomy”, which can allow cars to navigate city intersections and heavy urban traffic without driverintervention. In addition, the alliance will launch a suite of new connectivity applications (APPs),including for mobile devices, and the first “alliance multimedia system” in later years. Renault-Nissanalliance is already the industry’s zero-emission leader with 300,000 all-electric vehicles sold sinceDecember 2010. They have proven their ability to provide safe and efficient vehicles over time [4].
Figure 1. Global retail sales volume/market share.
However, the enterprise is faced with many difficulties, such as product recall (1.56 millionvehicles from 2008 to 2015, with about 25 million vehicles recalled with Takata airbags among10 different carmakers worldwide since 2008) [5]. Moreover, Nissan’s 2013 annual report statedthat they aimed to increase their global market share to 8% by the end of the fiscal year 2016, up fromthe current level of 6.2% [6]. The company is counting on expansion in big emerging markets such asBrazil, Russia, India and China (BRIC) to drive sales and profit growth.
The tight competition among automakers leads to the continuous improvement of science andtechnology, and especially their ability to meet the customer’s wishes. Important questions areraised for the future of the automobile industry and Nissan. How will Nissan create value for thecustomers, societies and for Nissan itself in the pursuit of perfection? How will it maintain itscompetitiveness in fierce markets, expand its scale, produce high quality products while maintaininglow-costs and protecting the environment? The purpose of this study is to propose an effectiveapproach based on grey forecasting and data envelopment analysis (DEA) to find the best partnersof alliance. The model predicts future business and measures operation efficiency by using criticalinput and output variables. From that, the enterprises can find their suitable candidates when settinginternational business strategies. For this purpose, this study sets Nissan as a target decision makingunit (DMU) in order to conduct empirical research. The study’s results can be referenced for worldwideautomobile manufactures.
James et al. stated that “Alliances are fueling the success of a wide range of firms, including BritishPetroleum, Eli Lilly, General Electric, Corning Glass, Federal Express, IBM, Starbucks, Cisco Systems,Millennium Pharmaceuticals, and Siebel Systems” [7]. However, many enterprises have failed withalliances or have not met the conditions of their partner. In this section, the research helps to definestrategic alliances and provides a literature review.
Sustainability 2016, 8, 173 3 of 18
Mockler difined “Strategic alliances are agreements between companies (partners) to reachobjectives of common interest” [8]. International strategic alliances (ISAs) are voluntary, long-term,contractual, cross-border relationships between two firms, designed to achieve specific objectives [9].These definitions emphasize the importance of common business goals with the involved companies.Cravens et al., distinguished strategic alliance as a horizontal collaborative relationship that does notinclude any kind of equity exchange or creation of a new entity as in joint ventures [10]. Chan et al.stated that: Strategic alliance is a cooperative agreement between different organizations. The purposeof action aims at achieving the competitive advantages and sharing resources in product design,production, marketing and/or distribution [11]. The types of alliances range from simple agreementswith no equity ties to more formal arrangements involving equity ownership and shared managerialcontrol over joint activities. The alliance activities can be supplier–buyer partnerships, outsourcingagreements, technical collaboration, joint research projects, shared new product development, sharedmanufacturing arrangements, common distribution agreements, and cross-selling arrangements.The type that should be applied depends on the structures or objectives of each enterprise.
Besides that, the alliance should conform to competition laws, with the world’s largest and mostinfluential anti-trust law systems existing in the United States and European Union. However, businesscooperation could be seen as one kind of alliance as well. This research focuses on the selection ofbusiness partners, so anti-trust law issues are not major focus of this study.
Candace et al. had investigated 89 high technology alliances and suggested that direct-competitoralliances might be an inefficient means for innovating [12]. Cho et al. observed the trend of worldtelecommunication and sought to answer whether alliance strategies needed to be regulated by thegovernment. By reviewing global alliance strategies in some countries, the research pointed towardssome reasonable recommendations for regulation of telecommunication enterprises [13]. Kauser andShaw investigated strategic alliance agreements among UK firms and their European, Japanese andUS partners. The results indicated that the majority of UK firms engaged in international partnershipsfor marketing of relevant activities and for entering a foreign market. The findings had also indicatedthat the majority of UK managers were satisfied with the overall performance of their internationalstrategic alliances [14]. Those papers had investigated alliances in various type of firms, however,the lack of focus on the automobile industry is one of the impetuses for this research.
Forecast time series have been used quite regularly by researchers. There are various forecastingmodels which have different mathematical backgrounds such as fuzzy predictors, neural networks,trend extrapolation, and grey prediction. Grey system theory as an interdisciplinary scientific area wasfirst introduced in the early 1980s by Deng in 1982 [15].From then on, the theory has become a quitepopular method to deal with the uncertainty problems under partially unknown parameters and pooror missing information. Superior to conventional statistical models, grey models claim only a limitedamount of data to evaluate the action of unknown systems [16].
The techniques of frontier analysis had been described by Farrel in 1957 [17], but a mathematicalframework to handle frontier analysis was established only after two decades. The DEA was introducedby Charnes et al. [18]. They proposed a “data oriented” approach for measuring the performance ofmultiple DMUs, by converting multiple input into multiple output. DMU could include manufacturingunits, schools, universities, bank branches, hospitals, power plants, etc. Recently, there have beenvarious DEA applications in private and public sectors of different countries.
Martín and Roman used DEA to analyze the technical efficiency and performance of eachindividual Spanish airport. They used the results to put forward some policy considerations inpreparation for the process of privatization of the Spanish airport system [19]. Wang et al. applieddata envelopment analysis and the heuristic technique approach to help department stores find themost proper partners for strategic alliances. The results indicated that candidate selection of strategicalliances could be an effective strategy for enterprises to find out the right partners for cooperation [20].Wang et al. used Grey and DEA techniques to measure production and marketing efficiencies of23 companies in the printing circuit board industry. The results showed that 15 companies require
Sustainability 2016, 8, 173 4 of 18
improvements in both production and marketing efficiency, while four companies had their productionefficiency improved and the remaining four firms experienced both improvement in production andmarketing efficiency [21]. Yuan and Tian applied the two-stage method of the DEA model to analyzethe science and technology resources efficiency of industrial enterprises and its influencing factors.The results reflected the independence of the input element and the concentration of the outputelement [22].
For the above reasons, the integrating model of Grey and DEA in alliance decision making is anew effective approach in this research. The model predicts future business and measures operationefficiency by using critical input and output variables. From that, automobile manufacturers can findfeasible candidates for alliance strategies.
2. Methodologies
2.1. Research Development
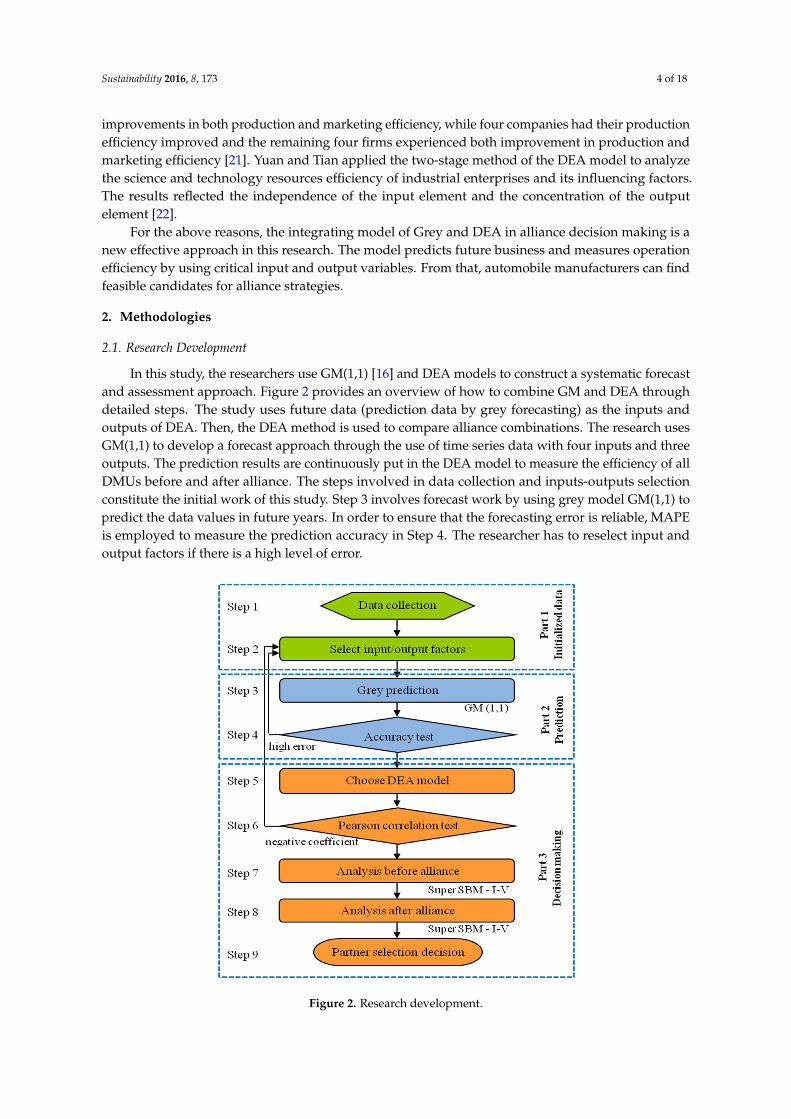
In this study, the researchers use GM(1,1) [16] and DEA models to construct a systematic forecastand assessment approach. Figure 2 provides an overview of how to combine GM and DEA throughdetailed steps. The study uses future data (prediction data by grey forecasting) as the inputs andoutputs of DEA. Then, the DEA method is used to compare alliance combinations. The research usesGM(1,1) to develop a forecast approach through the use of time series data with four inputs and threeoutputs. The prediction results are continuously put in the DEA model to measure the efficiency of allDMUs before and after alliance. The steps involved in data collection and inputs-outputs selectionconstitute the initial work of this study. Step 3 involves forecast work by using grey model GM(1,1) topredict the data values in future years. In order to ensure that the forecasting error is reliable, MAPEis employed to measure the prediction accuracy in Step 4. The researcher has to reselect input andoutput factors if there is a high level of error.
Figure 2. Research development.
Sustainability 2016, 8, 173 5 of 18
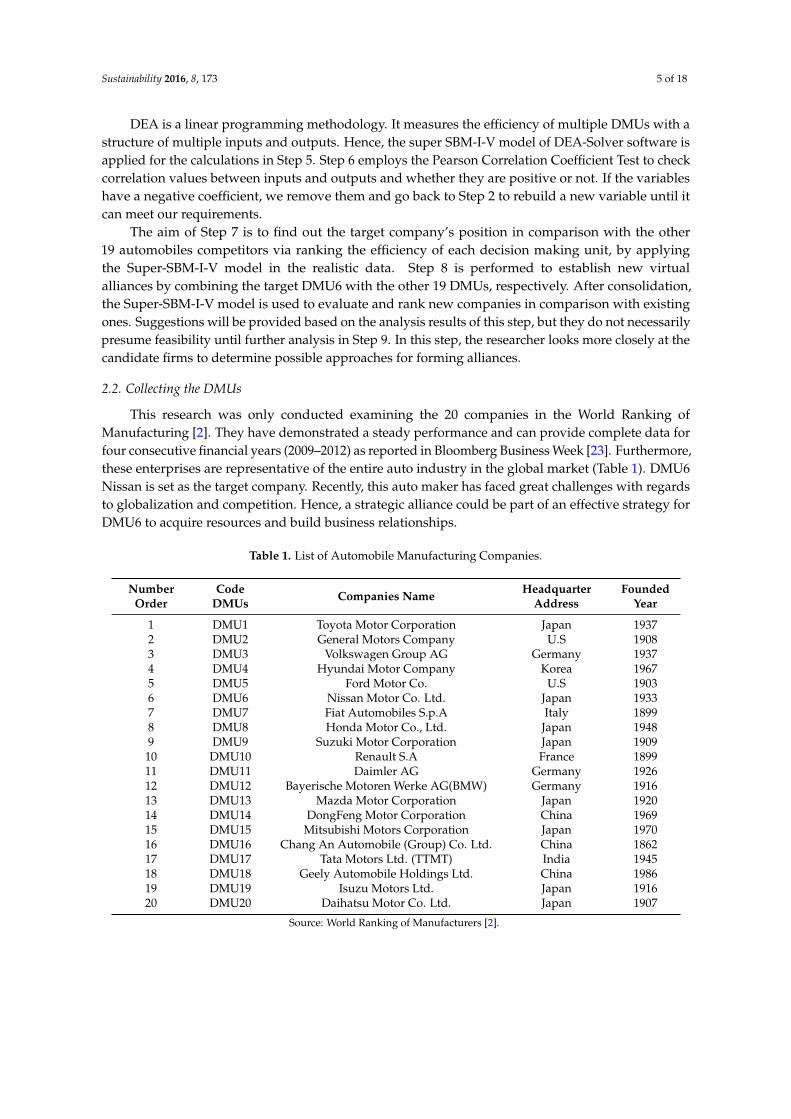
DEA is a linear programming methodology. It measures the efficiency of multiple DMUs with astructure of multiple inputs and outputs. Hence, the super SBM-I-V model of DEA-Solver software isapplied for the calculations in Step 5. Step 6 employs the Pearson Correlation Coefficient Test to checkcorrelation values between inputs and outputs and whether they are positive or not. If the variableshave a negative coefficient, we remove them and go back to Step 2 to rebuild a new variable until itcan meet our requirements.
The aim of Step 7 is to find out the target company’s position in comparison with the other19 automobiles competitors via ranking the efficiency of each decision making unit, by applyingthe Super-SBM-I-V model in the realistic data. Step 8 is performed to establish new virtualalliances by combining the target DMU6 with the other 19 DMUs, respectively. After consolidation,the Super-SBM-I-V model is used to evaluate and rank new companies in comparison with existingones. Suggestions will be provided based on the analysis results of this step, but they do not necessarilypresume feasibility until further analysis in Step 9. In this step, the researcher looks more closely at thecandidate firms to determine possible approaches for forming alliances.
2.2. Collecting the DMUs
This research was only conducted examining the 20 companies in the World Ranking ofManufacturing [2]. They have demonstrated a steady performance and can provide complete data forfour consecutive financial years (2009–2012) as reported in Bloomberg Business Week [23]. Furthermore,these enterprises are representative of the entire auto industry in the global market (Table 1). DMU6Nissan is set as the target company. Recently, this auto maker has faced great challenges with regardsto globalization and competition. Hence, a strategic alliance could be part of an effective strategy forDMU6 to acquire resources and build business relationships.
Table 1. List of Automobile Manufacturing Companies.
NumberOrder
CodeDMUs Companies Name Headquarter
AddressFounded
Year
1 DMU1 Toyota Motor Corporation Japan 19372 DMU2 General Motors Company U.S 19083 DMU3 Volkswagen Group AG Germany 19374 DMU4 Hyundai Motor Company Korea 19675 DMU5 Ford Motor Co. U.S 19036 DMU6 Nissan Motor Co. Ltd. Japan 19337 DMU7 Fiat Automobiles S.p.A Italy 18998 DMU8 Honda Motor Co., Ltd. Japan 19489 DMU9 Suzuki Motor Corporation Japan 190910 DMU10 Renault S.A France 189911 DMU11 Daimler AG Germany 192612 DMU12 Bayerische Motoren Werke AG(BMW) Germany 191613 DMU13 Mazda Motor Corporation Japan 192014 DMU14 DongFeng Motor Corporation China 196915 DMU15 Mitsubishi Motors Corporation Japan 197016 DMU16 Chang An Automobile (Group) Co. Ltd. China 186217 DMU17 Tata Motors Ltd. (TTMT) India 194518 DMU18 Geely Automobile Holdings Ltd. China 198619 DMU19 Isuzu Motors Ltd. Japan 191620 DMU20 Daihatsu Motor Co. Ltd. Japan 1907
Source: World Ranking of Manufacturers [2].
Sustainability 2016, 8, 173 6 of 18
2.3. Grey Forecasting Model
GM(1,1) model of this study is built based on two basic operations. Accumulated generationoperation (AGO) is applied to reduce the randomization of the raw data, and inverse accumulatedgeneration (IAGO) is used to find the predicted values of initial data. The data series must be morethan four, taking equal intervals and in consecutive order without neglecting any data [16]. TheGM(1,1) model establishment process in this study is summarized as follows:
Establish the initial series Xp0q by
Xp0q “´
Xp0q p1q , Xp0q p2q , . . . , Xp0q pnq¯
, n ě 4 (1)
where Xp0q is a non-negative sequence and n is the number of years observed.Based on initial series Xp0q, a new sequence Xp1q is set up through the AGO, which is
Xp1q “´
Xp1q p1q , Xp1q p2q , . . . , Xp1q pnq¯
, n ě 4 (2)
where Xp1q p1q “ Xp0q p1q and Xp1q pkq “kÿ
i“1
Xp0qpiq , k “ 1, 2, 3, . . . , n (3)
Define mean value series Zp1q of adjacent data Xp1q as:
Zp1q “´
Zp1q p1q , Zp1q p2q , . . . , Zp1q pnq¯
(4)
where Zp1q(k) is calculated as follow:
Zp1q pkq “ 0.5ˆ´
Xp1q pkq ` Xp1q pk´ 1q¯
, k “ 2, 3, . . . , n (5)
The GM(1,1) model can be built by establishing first order differential equation for Xp1q pkq.
dXp1q pkqdk
` aXp1qk “ b (6)
where parameter a is developing coefficient and b is grey input.The solution to Equation (6) can be found by using the least square method to find parameters
a and b:«
ab
ffT
“
´
BT B¯´1
BTYN (7)
B “
»
—
–
´Zp1q p2q 1. . . . . . . . . . . .´Zp1q pnq 1
fi
ffi
fl
(8)
and
YN “
»
—
–
Xp0q p2q. . . . . . . . .Xp0q pnq
fi
ffi
fl
(9)
(B is called data matrix, Y is called data series, and ra, bsT is called parameter series).According to Equation (6), the solution of Xp1q(k) at time k:
Xp1q pk` 1q “„
Xp0q p1q ´ba
e´ak `bapk “ 1, 2, 3, . . .q (10)
Sustainability 2016, 8, 173 7 of 18
We acquired Xp1q from Equation (10). Let Xp0q be the GM(1,1) fitted and predicted series
Xp0q “´
Xp0q p1q , Xp0q p2q , . . . , Xp0q pnq , . . .¯
, where Xp0q p1q “ Xp0q p1q (11)
Finally, to obtain the predicted value of the primitive data at time (k + 1), the inverse accumulatedgenerating operation (IAGO) is used to establish the following grey model:
Xp0q pk` 1q “„
Xp0q p1q ´ba
e´ak p1´ eaq pk “ 1, 2, 3, . . .q (12)
In general, the grey forecasting model uses this operation to construct differential Equations.
2.4. Non-Radial Super Efficiency Model (Super-SBM)
The super SBM was developed on a non-radial model called SBM “Slacks-based measure ofefficiency” introduced by Tone in 2001 [24], which directly deals with input and output slacks andreturn efficiency scores between 0 and 1. SBM deals with n DMUs, each DMU having input/outputmatrices X “
`
xij˘
P Rmˆ n and Y “`
Yij˘
P Rsˆn, respectively. λ is a non-negative vector in Rn.Vectors S´ P Rm and S` P Rs are the input excess and output shortfalls, respectively [25]. To estimatethe efficiency of (x0, y0q, the SBM programwas formulated as follows [24]:
min ρ “1´
1m
řmi“1 S´i {xi0
1`1sřs
i“1 S`i {yi0
(13)
st.x0 “ Xλ` S´, y0 “ Yλ´ S`, λ ě 0, S´ ě 0, S` ě 0 (14)
Let an optimal solution for SBM be pp˚, λ˚, S´˚, S`˚q. A DMU(x0, y0q is SBM-efficient, if p˚ “ 1.That means S´˚ “ 0, and S`˚ “ 0 (or no input excesses and no output shortfalls). Based on thisassumption, Tone has proposed a super-efficiency model for ranking DMUs and it was identified asfollowing program [26]:
min δ “
1m
řmi“1 xi{xi0
1sřs
r“1 yr{yr0
(15)
st.x ěÿ
nj“1,‰0λjxj, y ď
ÿ
nj“1,‰0λjxj, x ě x0, and y ď y0, y ě 0, λ ě 0 (16)
If the denominator is equal to 1, the objective function will become the input-oriented of the superSBM model and it returns a value for the objective function which is greater or equal to one.
By the nature of things, inputs should be positive, but outputs may be negative. Nevertheless,many DEA models including SBM models cannot handle non-positive outputs, until a new schemewas introduced in DEA-Solver pro 4.1 Manual [25].
Suppose that yr0 ď 0. It has defined y`r and y`´r by
y`r “ maxj“1,...,n
yrjˇ
ˇyrj ą 0(
, (17)
y`r “ minj“1,...,n
yrjˇ
ˇyrj ą 0(
, (18)
In the objective function, if the output r has no positive elements, then it is defined asy`r “ y`´r “ 1. The term s`r {yr0 will be replaced in the following way. (The value yr0 of in theconstraints has never changed).
Sustainability 2016, 8, 173 8 of 18
If y`r ą y`´r the term is replaced by:
s`r {y `´r
`
y`r ´ y`´r˘
y`r ´ yr0(19)
If y`r “ y`´r the term is replaced by:
s`r {
`
y `´r˘2
B`
y`r ´ yr0˘ (20)
where B is a large positive number, (in DEA-Solver B = 100).Furthermore, the denominator is positive and strictly less than y`´r. Moreover, it isinverse to the
distance y`r ´ yr0. Hence, this scheme concerns the magnitude of the nonpositive output positively.The score obtained is units invariant; it is independent of the units of measurement used [25].
2.5. EstablishingInput/Output Variables
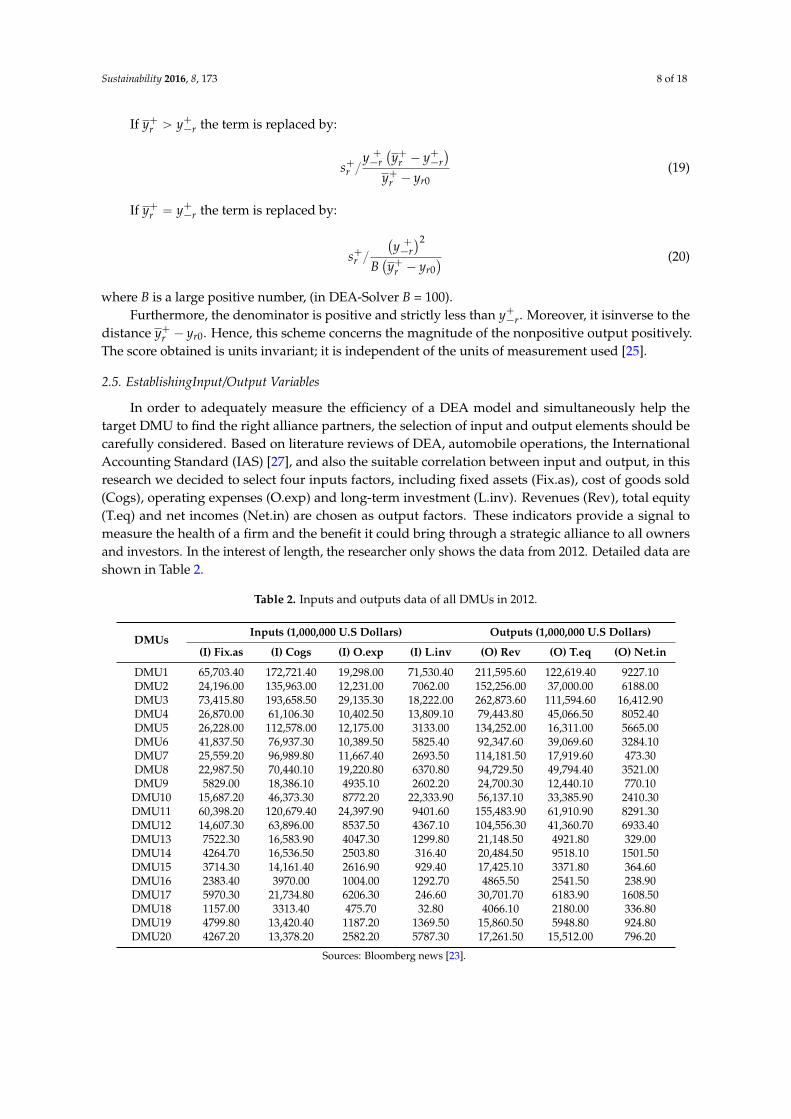
In order to adequately measure the efficiency of a DEA model and simultaneously help thetarget DMU to find the right alliance partners, the selection of input and output elements should becarefully considered. Based on literature reviews of DEA, automobile operations, the InternationalAccounting Standard (IAS) [27], and also the suitable correlation between input and output, in thisresearch we decided to select four inputs factors, including fixed assets (Fix.as), cost of goods sold(Cogs), operating expenses (O.exp) and long-term investment (L.inv). Revenues (Rev), total equity(T.eq) and net incomes (Net.in) are chosen as output factors. These indicators provide a signal tomeasure the health of a firm and the benefit it could bring through a strategic alliance to all ownersand investors. In the interest of length, the researcher only shows the data from 2012. Detailed data areshown in Table 2.
Table 2. Inputs and outputs data of all DMUs in 2012.
DMUsInputs (1,000,000 U.S Dollars) Outputs (1,000,000 U.S Dollars)
(I) Fix.as (I) Cogs (I) O.exp (I) L.inv (O) Rev (O) T.eq (O) Net.in
DMU1 65,703.40 172,721.40 19,298.00 71,530.40 211,595.60 122,619.40 9227.10DMU2 24,196.00 135,963.00 12,231.00 7062.00 152,256.00 37,000.00 6188.00DMU3 73,415.80 193,658.50 29,135.30 18,222.00 262,873.60 111,594.60 16,412.90DMU4 26,870.00 61,106.30 10,402.50 13,809.10 79,443.80 45,066.50 8052.40DMU5 26,228.00 112,578.00 12,175.00 3133.00 134,252.00 16,311.00 5665.00DMU6 41,837.50 76,937.30 10,389.50 5825.40 92,347.60 39,069.60 3284.10DMU7 25,559.20 96,989.80 11,667.40 2693.50 114,181.50 17,919.60 473.30DMU8 22,987.50 70,440.10 19,220.80 6370.80 94,729.50 49,794.40 3521.00DMU9 5829.00 18,386.10 4935.10 2602.20 24,700.30 12,440.10 770.10DMU10 15,687.20 46,373.30 8772.20 22,333.90 56,137.10 33,385.90 2410.30DMU11 60,398.20 120,679.40 24,397.90 9401.60 155,483.90 61,910.90 8291.30DMU12 14,607.30 63,896.00 8537.50 4367.10 104,556.30 41,360.70 6933.40DMU13 7522.30 16,583.90 4047.30 1299.80 21,148.50 4921.80 329.00DMU14 4264.70 16,536.50 2503.80 316.40 20,484.50 9518.10 1501.50DMU15 3714.30 14,161.40 2616.90 929.40 17,425.10 3371.80 364.60DMU16 2383.40 3970.00 1004.00 1292.70 4865.50 2541.50 238.90DMU17 5970.30 21,734.80 6206.30 246.60 30,701.70 6183.90 1608.50DMU18 1157.00 3313.40 475.70 32.80 4066.10 2180.00 336.80DMU19 4799.80 13,420.40 1187.20 1369.50 15,860.50 5948.80 924.80DMU20 4267.20 13,378.20 2582.20 5787.30 17,261.50 15,512.00 796.20
Sources: Bloomberg news [23].
Sustainability 2016, 8, 173 9 of 18
3. Results and Discussion
3.1. Prediction Results
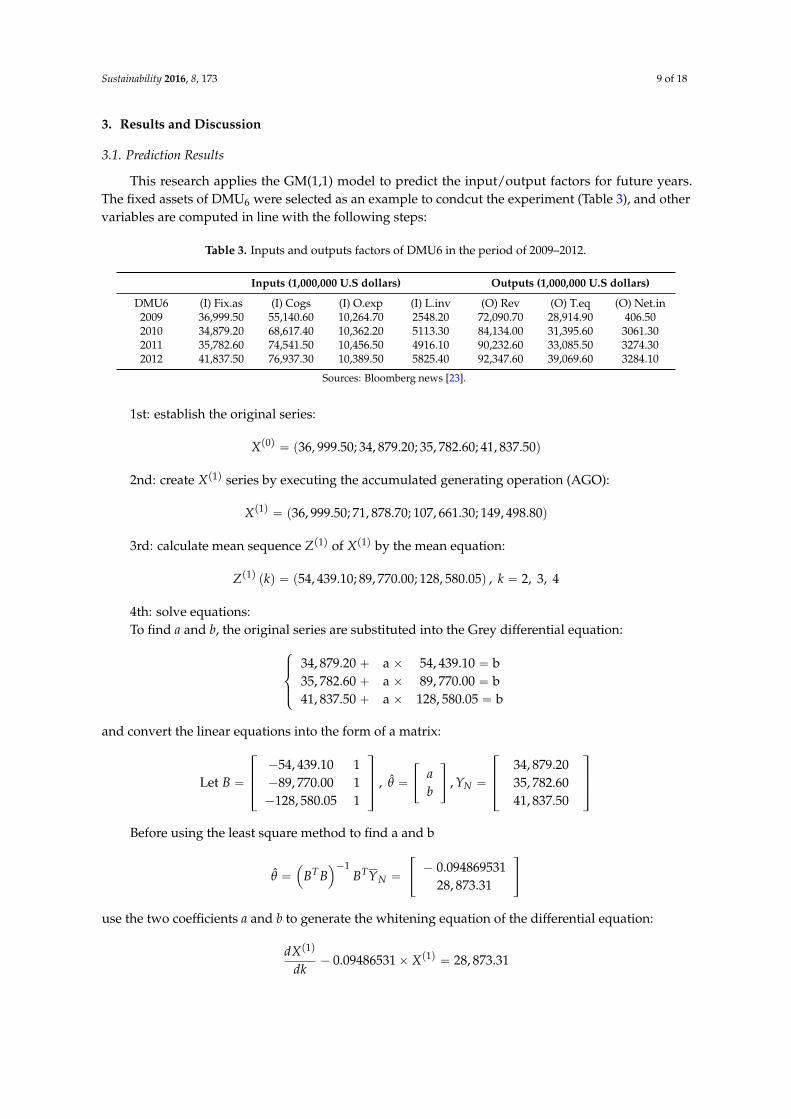
This research applies the GM(1,1) model to predict the input/output factors for future years.The fixed assets of DMU6 were selected as an example to condcut the experiment (Table 3), and othervariables are computed in line with the following steps:
Table 3. Inputs and outputs factors of DMU6 in the period of 2009–2012.
Inputs (1,000,000 U.S dollars) Outputs (1,000,000 U.S dollars)
DMU6 (I) Fix.as (I) Cogs (I) O.exp (I) L.inv (O) Rev (O) T.eq (O) Net.in2009 36,999.50 55,140.60 10,264.70 2548.20 72,090.70 28,914.90 406.502010 34,879.20 68,617.40 10,362.20 5113.30 84,134.00 31,395.60 3061.302011 35,782.60 74,541.50 10,456.50 4916.10 90,232.60 33,085.50 3274.302012 41,837.50 76,937.30 10,389.50 5825.40 92,347.60 39,069.60 3284.10
Sources: Bloomberg news [23].
1st: establish the original series:
Xp0q “ p36, 999.50; 34, 879.20; 35, 782.60; 41, 837.50q
2nd: create Xp1q series by executing the accumulated generating operation (AGO):
Xp1q “ p36, 999.50; 71, 878.70; 107, 661.30; 149, 498.80q
3rd: calculate mean sequence Zp1q of Xp1q by the mean equation:
Zp1q pkq “ p54, 439.10; 89, 770.00; 128, 580.05q , k “ 2, 3, 4
4th: solve equations:To find a and b, the original series are substituted into the Grey differential equation:
$
’
&
’
%
34, 879.20 ` a ˆ 54, 439.10 “ b35, 782.60 ` a ˆ 89, 770.00 “ b41, 837.50 ` a ˆ 128, 580.05 “ b
and convert the linear equations into the form of a matrix:
Let B “
»
—
–
´54, 439.10 1´89, 770.00 1´128, 580.05 1
fi
ffi
fl
, θ “
«
ab
ff
, YN “
»
—
–
34, 879.2035, 782.6041, 837.50
fi
ffi
fl
Before using the least square method to find a and b
θ “´
BT B¯´1
BTYN “
«
´ 0.09486953128, 873.31
ff
use the two coefficients a and b to generate the whitening equation of the differential equation:
dXp1q
dk´ 0.09486531ˆ Xp1q “ 28, 873.31
Sustainability 2016, 8, 173 10 of 18
Find the prediction model from equation:
Xp1q pk` 1q “„
Xp0q p1q ´ba
e´ak `ba“ 341, 347.05 ˚ e0.094869531 k ´ 304, 347.56
Finding X(1) series by substituting different values of k into above equation:
K “ 0 Xp1q p1q “ 36, 999.50
K “ 1 Xp1q p2q “ 70, 968.78
K “ 2 Xp1q p3q “ 108, 318.53
K “ 3 Xp1q p4q “ 149, 385.16
K “ 4 Xp1q p5q “ 194, 538.55
K “ 5 Xp1q p6q “ 244, 185.39
K “ 6 Xp1q p7q “ 298, 772.86
K “ 7 Xp1q p8q “ 358, 792.60
K “ 8 Xp1q p9q “ 424, 785.30
Originate the predicted value of the original series according to the IAGO and obtain:
Xp0q p1q “ Xp1q p1q “ 36, 999.50
Xp0q p2q “ Xp1q p2q ´ Xp1q p1q “ 33, 969.28
Xp0q p3q “ Xp1q p3q ´ Xp1q p2q “ 37, 349.75
Xp0q p4q “ Xp1q p4q ´ Xp1q p3q “ 41, 066.63
Xp0q p5q “ Xp1q p5q ´ Xp1q p4q “ 45, 153.39
Xp0q p6q “ Xp1q p6q ´ Xp1q p5q “ 49, 646.84
Xp0q p7q “ Xp1q p7q ´ Xp1q p6q “ 54, 587.47 ppredicted value of 2015q
Xp0q p8q “ Xp1q p8q ´ Xp1q p7q “ 60, 019.76 ppredicted value of 2016q
Xp0q p9q “ Xp1q p9q ´ Xp1q p8q “ 65, 992.65 ppredicted value of 2017q
Using the above computation process, this research could obtain the forecasting result of all DMUs forsubsequent years; the detailed data is shown in the following Table 4:
Sustainability 2016, 8, 173 11 of 18
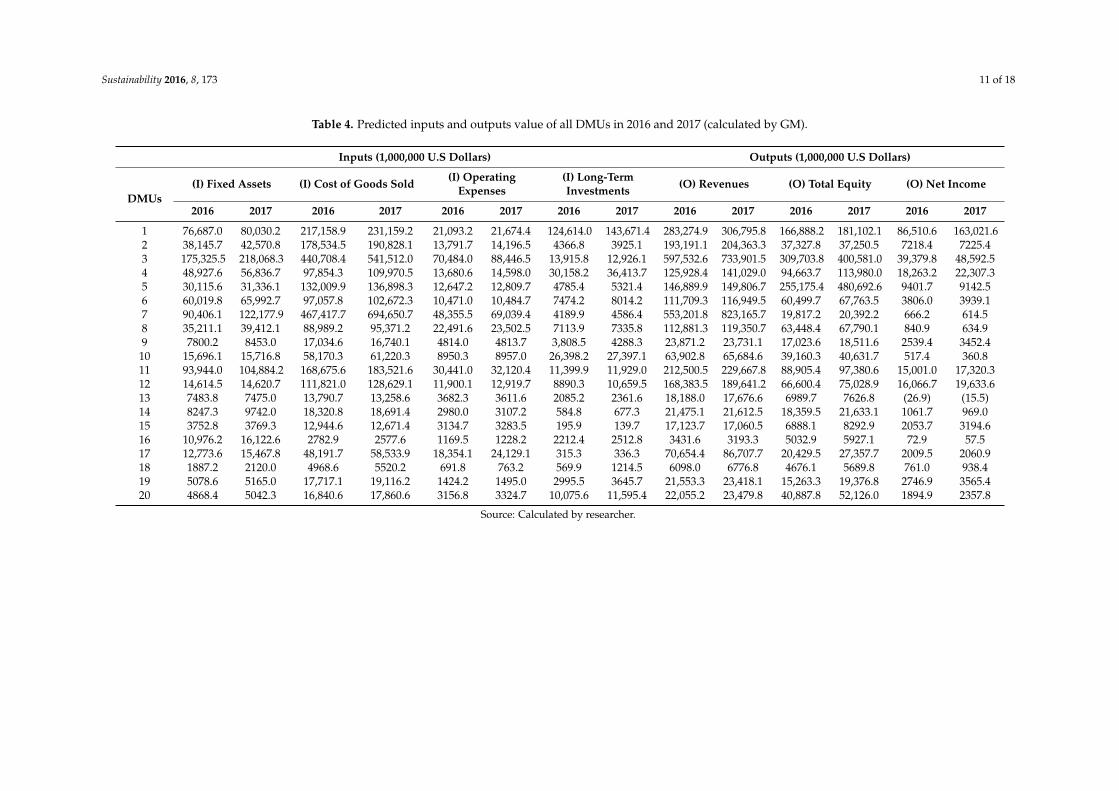
Table 4. Predicted inputs and outputs value of all DMUs in 2016 and 2017 (calculated by GM).
Inputs (1,000,000 U.S Dollars) Outputs (1,000,000 U.S Dollars)
DMUs(I) Fixed Assets (I) Cost of Goods Sold (I) Operating
Expenses(I) Long-TermInvestments (O) Revenues (O) Total Equity (O) Net Income
2016 2017 2016 2017 2016 2017 2016 2017 2016 2017 2016 2017 2016 2017
1 76,687.0 80,030.2 217,158.9 231,159.2 21,093.2 21,674.4 124,614.0 143,671.4 283,274.9 306,795.8 166,888.2 181,102.1 86,510.6 163,021.62 38,145.7 42,570.8 178,534.5 190,828.1 13,791.7 14,196.5 4366.8 3925.1 193,191.1 204,363.3 37,327.8 37,250.5 7218.4 7225.43 175,325.5 218,068.3 440,708.4 541,512.0 70,484.0 88,446.5 13,915.8 12,926.1 597,532.6 733,901.5 309,703.8 400,581.0 39,379.8 48,592.54 48,927.6 56,836.7 97,854.3 109,970.5 13,680.6 14,598.0 30,158.2 36,413.7 125,928.4 141,029.0 94,663.7 113,980.0 18,263.2 22,307.35 30,115.6 31,336.1 132,009.9 136,898.3 12,647.2 12,809.7 4785.4 5321.4 146,889.9 149,806.7 255,175.4 480,692.6 9401.7 9142.56 60,019.8 65,992.7 97,057.8 102,672.3 10,471.0 10,484.7 7474.2 8014.2 111,709.3 116,949.5 60,499.7 67,763.5 3806.0 3939.17 90,406.1 122,177.9 467,417.7 694,650.7 48,355.5 69,039.4 4189.9 4586.4 553,201.8 823,165.7 19,817.2 20,392.2 666.2 614.58 35,211.1 39,412.1 88,989.2 95,371.2 22,491.6 23,502.5 7113.9 7335.8 112,881.3 119,350.7 63,448.4 67,790.1 840.9 634.99 7800.2 8453.0 17,034.6 16,740.1 4814.0 4813.7 3,808.5 4288.3 23,871.2 23,731.1 17,023.6 18,511.6 2539.4 3452.4
10 15,696.1 15,716.8 58,170.3 61,220.3 8950.3 8957.0 26,398.2 27,397.1 63,902.8 65,684.6 39,160.3 40,631.7 517.4 360.811 93,944.0 104,884.2 168,675.6 183,521.6 30,441.0 32,120.4 11,399.9 11,929.0 212,500.5 229,667.8 88,905.4 97,380.6 15,001.0 17,320.312 14,614.5 14,620.7 111,821.0 128,629.1 11,900.1 12,919.7 8890.3 10,659.5 168,383.5 189,641.2 66,600.4 75,028.9 16,066.7 19,633.613 7483.8 7475.0 13,790.7 13,258.6 3682.3 3611.6 2085.2 2361.6 18,188.0 17,676.6 6989.7 7626.8 (26.9) (15.5)14 8247.3 9742.0 18,320.8 18,691.4 2980.0 3107.2 584.8 677.3 21,475.1 21,612.5 18,359.5 21,633.1 1061.7 969.015 3752.8 3769.3 12,944.6 12,671.4 3134.7 3283.5 195.9 139.7 17,123.7 17,060.5 6888.1 8292.9 2053.7 3194.616 10,976.2 16,122.6 2782.9 2577.6 1169.5 1228.2 2212.4 2512.8 3431.6 3193.3 5032.9 5927.1 72.9 57.517 12,773.6 15,467.8 48,191.7 58,533.9 18,354.1 24,129.1 315.3 336.3 70,654.4 86,707.7 20,429.5 27,357.7 2009.5 2060.918 1887.2 2120.0 4968.6 5520.2 691.8 763.2 569.9 1214.5 6098.0 6776.8 4676.1 5689.8 761.0 938.419 5078.6 5165.0 17,717.1 19,116.2 1424.2 1495.0 2995.5 3645.7 21,553.3 23,418.1 15,263.3 19,376.8 2746.9 3565.420 4868.4 5042.3 16,840.6 17,860.6 3156.8 3324.7 10,075.6 11,595.4 22,055.2 23,479.8 40,887.8 52,126.0 1894.9 2357.8
Source: Calculated by researcher.
Sustainability 2016, 8, 173 12 of 18
3.2. Forecasting Accuracy
Forecasting method is implemented to predict future results using the present uncompletedinformation, so we do not introduce new errors. Hence, the MAPE (Mean absolute percent error) isemployed to measure the accuracy values in statistics. The smaller values of MAPE demonstrate thatthe forecasting values are more reasonable [28]. The results of MAPE are shown in Table 5:
Table 5. Average MAPE of DMUs.
DMUs Average MAPE DMUs Average MAPE
DMU1 5.84809% DMU11 0.79240%DMU2 3.52436% DMU12 1.30784%DMU3 1.90186% DMU13 10.8717%DMU4 1.71334% DMU14 1.65806%DMU5 45.3331% DMU15 3.07850%DMU6 1.51432% DMU16 6.56818%DMU7 11.4944% DMU17 3.83133%DMU8 6.64905% DMU18 3.48085%DMU9 3.99930% DMU19 2.67108%DMU10 2.22754% DMU20 0.68057%Average MAPE of 20 DMUs 5.95730%
Most of the MAPE values are good and qualified, being smaller than 10%. The average of allMAPE reaches 5.95730%.This affirms that the GM(1,1) model offers a high accurate prediction. DMU5obtains a 45% higher MAPE value because it is strongly affected by the 2008 crisis. However, based onthe MAPE accuracy standards, only this value is qualified.
3.3. Pearson Correlation
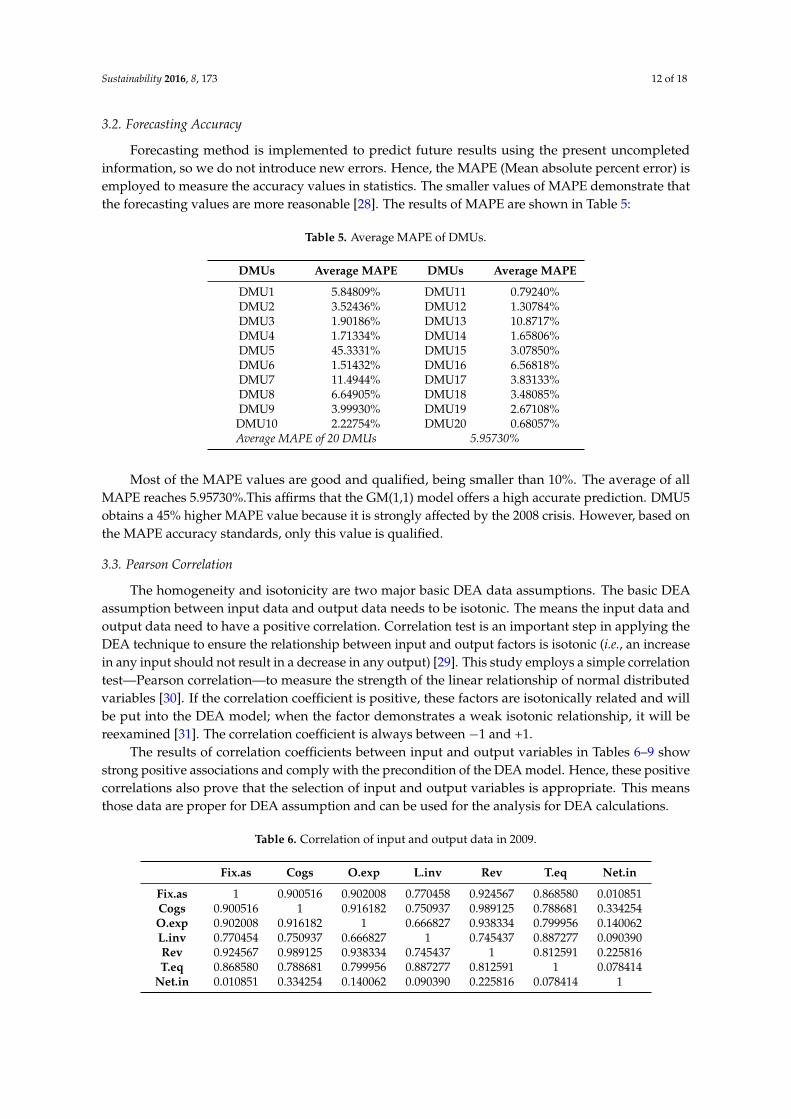
The homogeneity and isotonicity are two major basic DEA data assumptions. The basic DEAassumption between input data and output data needs to be isotonic. The means the input data andoutput data need to have a positive correlation. Correlation test is an important step in applying theDEA technique to ensure the relationship between input and output factors is isotonic (i.e., an increasein any input should not result in a decrease in any output) [29]. This study employs a simple correlationtest—Pearson correlation—to measure the strength of the linear relationship of normal distributedvariables [30]. If the correlation coefficient is positive, these factors are isotonically related and willbe put into the DEA model; when the factor demonstrates a weak isotonic relationship, it will bereexamined [31]. The correlation coefficient is always between ´1 and +1.
The results of correlation coefficients between input and output variables in Tables 6–9 showstrong positive associations and comply with the precondition of the DEA model. Hence, these positivecorrelations also prove that the selection of input and output variables is appropriate. This meansthose data are proper for DEA assumption and can be used for the analysis for DEA calculations.
Table 6. Correlation of input and output data in 2009.
Fix.as Cogs O.exp L.inv Rev T.eq Net.in
Fix.as 1 0.900516 0.902008 0.770458 0.924567 0.868580 0.010851Cogs 0.900516 1 0.916182 0.750937 0.989125 0.788681 0.334254O.exp 0.902008 0.916182 1 0.666827 0.938334 0.799956 0.140062L.inv 0.770454 0.750937 0.666827 1 0.745437 0.887277 0.090390Rev 0.924567 0.989125 0.938334 0.745437 1 0.812591 0.225816T.eq 0.868580 0.788681 0.799956 0.887277 0.812591 1 0.078414
Net.in 0.010851 0.334254 0.140062 0.090390 0.225816 0.078414 1
Sustainability 2016, 8, 173 13 of 18
Table 7. Correlation of input and output data in 2010.
Fix.as Cogs O.exp L.inv Rev T.eq Net.in
Fix.as 1 0.908011 0.901304 0.760279 0.915191 0.888756 0.712517Cogs 0.908011 1 0.884399 0.701945 0.991911 0.821255 0.810075O.exp 0.901304 0.884399 1 0.598485 0.907604 0.826895 0.827244L.inv 0.760279 0.701945 0.598485 1 0.680493 0.878784 0.421430Rev 0.915191 0.991911 0.907604 0.680493 1 0.831531 0.851679T.eq 0.888756 0.821255 0.826895 0.878784 0.831531 1 0.626496
Net.in 0.712517 0.810075 0.827244 0.421430 0.851679 0.626496 1
Table 8. Correlation of input and output data in 2011.
Fix.as Cogs O.exp L.inv Rev T.eq Net.in
Fix.as 1 0.908680 0.911810 0.691419 0.915207 0.909611 0.535213Cogs 0.908680 1 0.872887 0.627072 0.991641 0.853222 0.728935O.exp 0.911810 0.872887 1 0.547521 0.893166 0.855927 0.586748L.inv 0.691419 0.627072 0.547521 1 0.600729 0.846506 0.142137Rev 0.915207 0.991641 0.893166 0.600729 1 0.867635 0.750202T.eq 0.909612 0.853222 0.855927 0.846506 0.867635 1 0.413475
Net.in 0.535214 0.728935 0.586748 0.142137 0.750202 0.413475 1
Table 9. Correlation of input and output data in 2012.
Fix.as Cogs O.exp L.inv Rev T.eq Net.in
Fix.as 1 0.916378 0.921629 0.632545 0.925523 0.913111 0.85602Cogs 0.916377 1 0.898532 0.594043 0.992487 0.861108 0.857803O.exp 0.921629 0.898532 1 0.481858 0.919848 0.860337 0.84896L.inv 0.632545 0.594043 0.481858 1 0.580518 0.796618 0.50826Rev 0.925523 0.992487 0.919848 0.580518 1 0.886316 0.897967T.eq 0.913110 0.861108 0.860337 0.796617 0.886316 1 0.874886
Net.in 0.856015 0.857803 0.84896 0.508260 0.897967 0.874886 1
Remark: Fixed assets (Fix.as), Cost of goods sold (Cogs), Operating expenses (O.exp); Long-term investment(L.inv). Revenues (Rev), Total equity (T.eq) and Net incomes (Net.in).
3.4. Analysis before Alliance
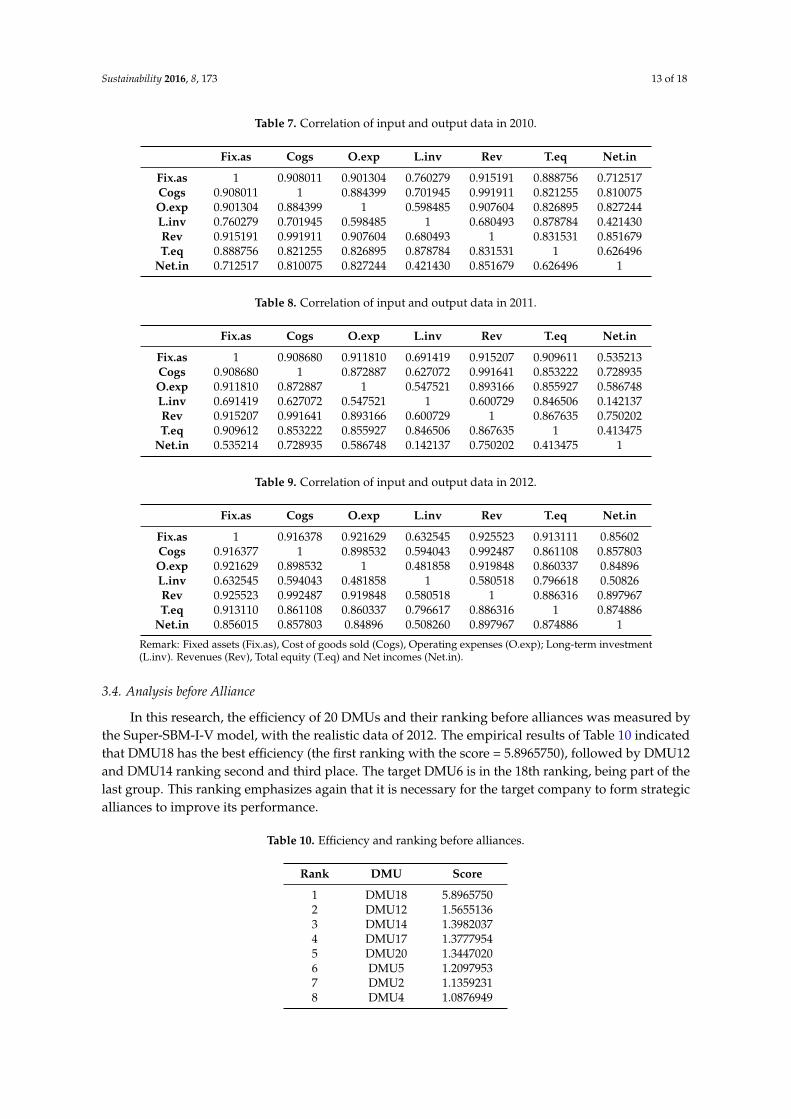
In this research, the efficiency of 20 DMUs and their ranking before alliances was measured bythe Super-SBM-I-V model, with the realistic data of 2012. The empirical results of Table 10 indicatedthat DMU18 has the best efficiency (the first ranking with the score = 5.8965750), followed by DMU12and DMU14 ranking second and third place. The target DMU6 is in the 18th ranking, being part of thelast group. This ranking emphasizes again that it is necessary for the target company to form strategicalliances to improve its performance.
Table 10. Efficiency and ranking before alliances.
Rank DMU Score
1 DMU18 5.89657502 DMU12 1.56551363 DMU14 1.39820374 DMU17 1.37779545 DMU20 1.34470206 DMU5 1.20979537 DMU2 1.13592318 DMU4 1.0876949
Sustainability 2016, 8, 173 14 of 18
Table 10. Cont.
Rank DMU Score
9 DMU19 1.048409510 DMU8 1.030741311 DMU7 1.013316812 DMU1 112 DMU3 114 DMU11 0.744877015 DMU9 0.717640016 DMU15 0.710539117 DMU10 0.710449818 DMU6 0.649288319 DMU13 0.581693420 DMU16 0.5283717
3.5. Analysis after Alliance
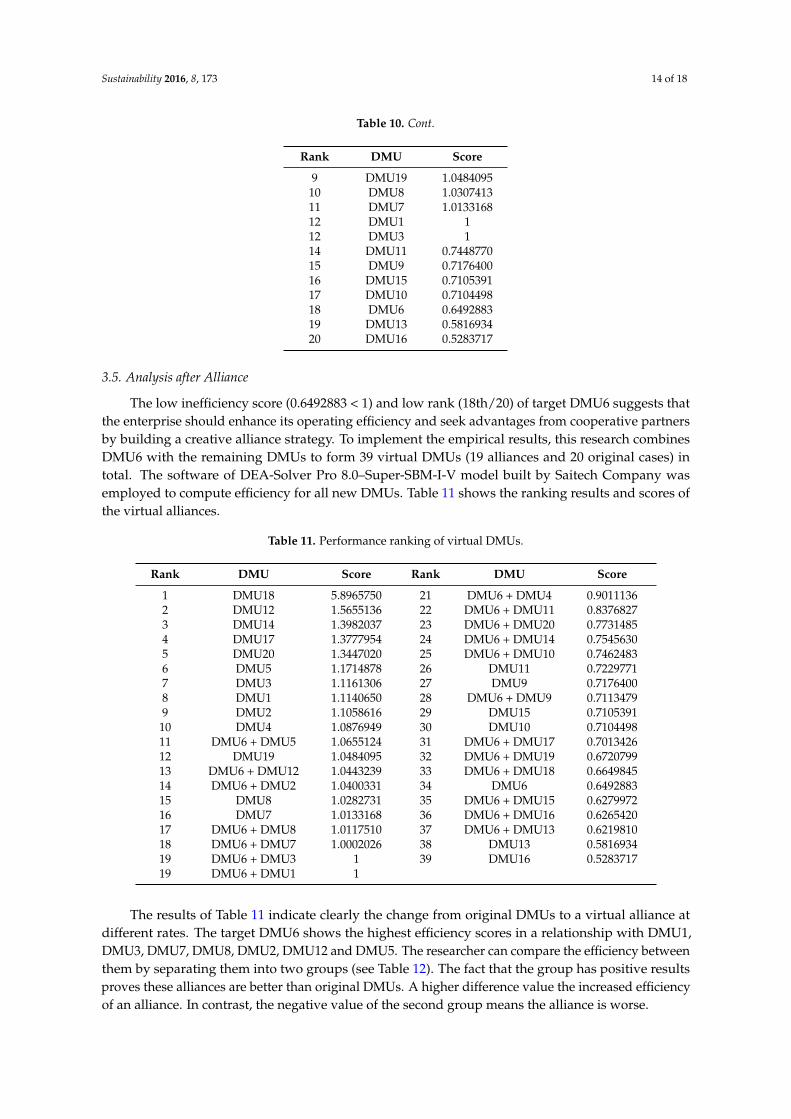
The low inefficiency score (0.6492883 < 1) and low rank (18th/20) of target DMU6 suggests thatthe enterprise should enhance its operating efficiency and seek advantages from cooperative partnersby building a creative alliance strategy. To implement the empirical results, this research combinesDMU6 with the remaining DMUs to form 39 virtual DMUs (19 alliances and 20 original cases) intotal. The software of DEA-Solver Pro 8.0–Super-SBM-I-V model built by Saitech Company wasemployed to compute efficiency for all new DMUs. Table 11 shows the ranking results and scores ofthe virtual alliances.
Table 11. Performance ranking of virtual DMUs.
Rank DMU Score Rank DMU Score
1 DMU18 5.8965750 21 DMU6 + DMU4 0.90111362 DMU12 1.5655136 22 DMU6 + DMU11 0.83768273 DMU14 1.3982037 23 DMU6 + DMU20 0.77314854 DMU17 1.3777954 24 DMU6 + DMU14 0.75456305 DMU20 1.3447020 25 DMU6 + DMU10 0.74624836 DMU5 1.1714878 26 DMU11 0.72297717 DMU3 1.1161306 27 DMU9 0.71764008 DMU1 1.1140650 28 DMU6 + DMU9 0.71134799 DMU2 1.1058616 29 DMU15 0.7105391
10 DMU4 1.0876949 30 DMU10 0.710449811 DMU6 + DMU5 1.0655124 31 DMU6 + DMU17 0.701342612 DMU19 1.0484095 32 DMU6 + DMU19 0.672079913 DMU6 + DMU12 1.0443239 33 DMU6 + DMU18 0.664984514 DMU6 + DMU2 1.0400331 34 DMU6 0.649288315 DMU8 1.0282731 35 DMU6 + DMU15 0.627997216 DMU7 1.0133168 36 DMU6 + DMU16 0.626542017 DMU6 + DMU8 1.0117510 37 DMU6 + DMU13 0.621981018 DMU6 + DMU7 1.0002026 38 DMU13 0.581693419 DMU6 + DMU3 1 39 DMU16 0.528371719 DMU6 + DMU1 1
The results of Table 11 indicate clearly the change from original DMUs to a virtual alliance atdifferent rates. The target DMU6 shows the highest efficiency scores in a relationship with DMU1,DMU3, DMU7, DMU8, DMU2, DMU12 and DMU5. The researcher can compare the efficiency betweenthem by separating them into two groups (see Table 12). The fact that the group has positive resultsproves these alliances are better than original DMUs. A higher difference value the increased efficiencyof an alliance. In contrast, the negative value of the second group means the alliance is worse.
Sustainability 2016, 8, 173 15 of 18
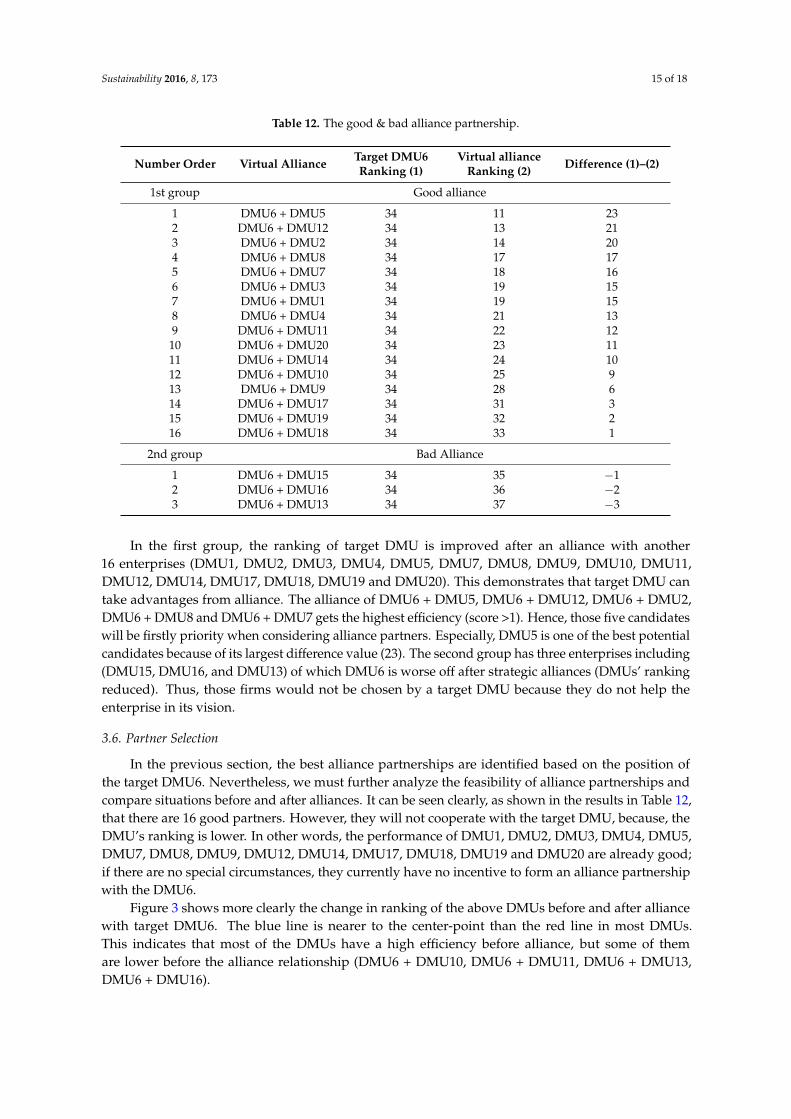
Table 12. The good & bad alliance partnership.
Number Order Virtual Alliance Target DMU6Ranking (1)
Virtual allianceRanking (2) Difference (1)–(2)
1st group Good alliance
1 DMU6 + DMU5 34 11 232 DMU6 + DMU12 34 13 213 DMU6 + DMU2 34 14 204 DMU6 + DMU8 34 17 175 DMU6 + DMU7 34 18 166 DMU6 + DMU3 34 19 157 DMU6 + DMU1 34 19 158 DMU6 + DMU4 34 21 139 DMU6 + DMU11 34 22 12
10 DMU6 + DMU20 34 23 1111 DMU6 + DMU14 34 24 1012 DMU6 + DMU10 34 25 913 DMU6 + DMU9 34 28 614 DMU6 + DMU17 34 31 315 DMU6 + DMU19 34 32 216 DMU6 + DMU18 34 33 1
2nd group Bad Alliance
1 DMU6 + DMU15 34 35 ´12 DMU6 + DMU16 34 36 ´23 DMU6 + DMU13 34 37 ´3
In the first group, the ranking of target DMU is improved after an alliance with another16 enterprises (DMU1, DMU2, DMU3, DMU4, DMU5, DMU7, DMU8, DMU9, DMU10, DMU11,DMU12, DMU14, DMU17, DMU18, DMU19 and DMU20). This demonstrates that target DMU cantake advantages from alliance. The alliance of DMU6 + DMU5, DMU6 + DMU12, DMU6 + DMU2,DMU6 + DMU8 and DMU6 + DMU7 gets the highest efficiency (score >1). Hence, those five candidateswill be firstly priority when considering alliance partners. Especially, DMU5 is one of the best potentialcandidates because of its largest difference value (23). The second group has three enterprises including(DMU15, DMU16, and DMU13) of which DMU6 is worse off after strategic alliances (DMUs’ rankingreduced). Thus, those firms would not be chosen by a target DMU because they do not help theenterprise in its vision.
3.6. Partner Selection
In the previous section, the best alliance partnerships are identified based on the position ofthe target DMU6. Nevertheless, we must further analyze the feasibility of alliance partnerships andcompare situations before and after alliances. It can be seen clearly, as shown in the results in Table 12,that there are 16 good partners. However, they will not cooperate with the target DMU, because, theDMU’s ranking is lower. In other words, the performance of DMU1, DMU2, DMU3, DMU4, DMU5,DMU7, DMU8, DMU9, DMU12, DMU14, DMU17, DMU18, DMU19 and DMU20 are already good;if there are no special circumstances, they currently have no incentive to form an alliance partnershipwith the DMU6.
Figure 3 shows more clearly the change in ranking of the above DMUs before and after alliancewith target DMU6. The blue line is nearer to the center-point than the red line in most DMUs.This indicates that most of the DMUs have a high efficiency before alliance, but some of themare lower before the alliance relationship (DMU6 + DMU10, DMU6 + DMU11, DMU6 + DMU13,DMU6 + DMU16).
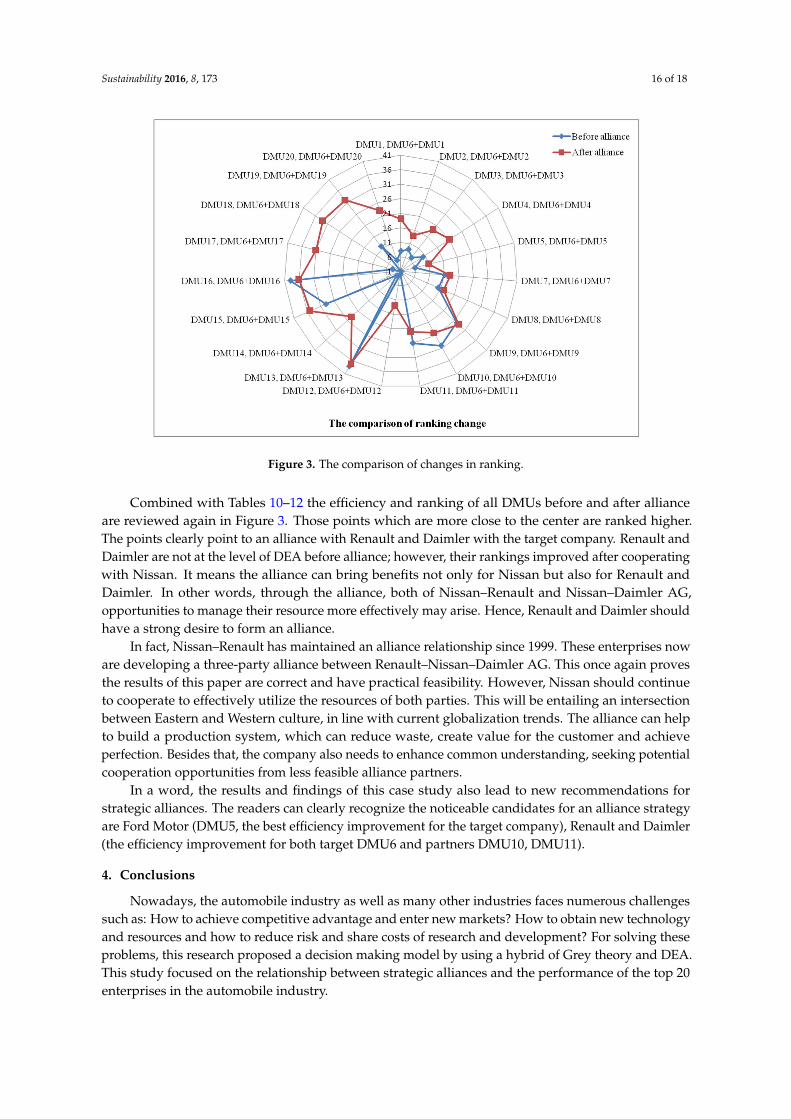
Sustainability 2016, 8, 173 16 of 18
Figure 3. The comparison of changes in ranking.
Combined with Tables 10–12 the efficiency and ranking of all DMUs before and after allianceare reviewed again in Figure 3. Those points which are more close to the center are ranked higher.The points clearly point to an alliance with Renault and Daimler with the target company. Renault andDaimler are not at the level of DEA before alliance; however, their rankings improved after cooperatingwith Nissan. It means the alliance can bring benefits not only for Nissan but also for Renault andDaimler. In other words, through the alliance, both of Nissan–Renault and Nissan–Daimler AG,opportunities to manage their resource more effectively may arise. Hence, Renault and Daimler shouldhave a strong desire to form an alliance.
In fact, Nissan–Renault has maintained an alliance relationship since 1999. These enterprises noware developing a three-party alliance between Renault–Nissan–Daimler AG. This once again provesthe results of this paper are correct and have practical feasibility. However, Nissan should continueto cooperate to effectively utilize the resources of both parties. This will be entailing an intersectionbetween Eastern and Western culture, in line with current globalization trends. The alliance can helpto build a production system, which can reduce waste, create value for the customer and achieveperfection. Besides that, the company also needs to enhance common understanding, seeking potentialcooperation opportunities from less feasible alliance partners.
In a word, the results and findings of this case study also lead to new recommendations forstrategic alliances. The readers can clearly recognize the noticeable candidates for an alliance strategyare Ford Motor (DMU5, the best efficiency improvement for the target company), Renault and Daimler(the efficiency improvement for both target DMU6 and partners DMU10, DMU11).
4. Conclusions
Nowadays, the automobile industry as well as many other industries faces numerous challengessuch as: How to achieve competitive advantage and enter new markets? How to obtain new technologyand resources and how to reduce risk and share costs of research and development? For solving theseproblems, this research proposed a decision making model by using a hybrid of Grey theory and DEA.This study focused on the relationship between strategic alliances and the performance of the top 20enterprises in the automobile industry.
Sustainability 2016, 8, 173 17 of 18
Based on the realistic public data of automobile enterprises from 2009 to 2012, this studyused GM(1,1) model to predict the future change in value of the specific input/output variables.The accuracy forecast value had been tested by average MAPE and a reliable percentage of 5.9573%was obtained.
Nissan was used as a case study to determine the potential benefits of strategic alliances betweenfirms. The DEA-Super SBM model was applied to evaluate efficiency all real DMUs and virtual DMUs.The empirical results showed that 16 candidates are suitable for Nissan to form strategic alliances with,of which Ford, BMW, General Motors, Honda, and Fiat are strongly recommended. However, onlytwo partnerships are feasible for Nissan (Nissan–Renault and Nissan–Daimler). If a firm decides toform an alliance, it is necessary to conduct extensive an assessment of performance before and afterthe alliance in terms of many aspects.
In conclusion, by combining Grey theory and the Super SBM model, this research proposed a newaccurate and appropriate approach to forecast and evaluate automobile firms. This model provides areference for decision making for automaker strategists when developing alliance strategies.
The DEA is one kind of sensitive method for factor selection. The selection of input/outputvariables could be different, and the results would be impacted. Therefore, robust checking is necessary.The different input/output variables and removing outlierd from DMUs should be re-calculatedand re-discussed.
For future study, sensitive analysis for different inputs or outputs of DMUs or data of differentyears can be discussed further. Moreover, the methodology should be further developed by usingqualitative data and should be applied in different industries.
Author Contributions: In this paper, Chia-Nan Wang contributed to design the theoretical verifications.Xuan-Tho Nguyen collected and analyzed data and prepared for the manuscript. Yen-Hui Wang is involved inresults discussion. All authors have both read and approved the manuscript.
Conflicts of Interest: The authors declare no conflict of interest.
References
1. Haugh, D.; Mourougane, A.; Chatal, O. The automobile industry in and beyond the crisis. OECD Econ. Dep.Work. Pap. 2010, 2009. [CrossRef]
2. OICA. World Ranking of Manufacturers. Available online: http://www.oica.net/wp-content/uploads/2013/03/worldpro2012-modification-ranking.pdf (accessed on 20 May 2014).
3. Global Retail Sales Volume/Market Share. Available online: http://www.nissan-global.com/EN/DOCUMENT/PDF/AR/2014/p23_e.pdf (accessed on 12 August 2015).
4. Renault-Nissan to Launch More than 10 Driverless Cars through 2020. Available online: http://www.autoevolution.com/news/renault-nissan-to-launch-more-than-10-driverless-cars-through-2020-103503.html(accessed on 25 January 2016).
5. Toyota and Nissan Recall 6.5 Million Cars Over Airbags. Available online: http://www.bbc.com/news/business-32716802 (accessed on 13 May 2015).
6. Nisan Annual Report. Available online: http://www.nissan-global.com/EN/DOCUMENT/PDF/AR/2013/AR2013_E_All.pdf (accessed on 20 May 2014).
7. James, D.B.; Benjamin, G.C.; Michael, S.R. Mastering Alliance Strategy; John Wiley & Sons, Inc: New York, NY,USA, 2003; pp. 1–19.
8. Mockler, R.J. Multinational strategic alliances: A manager’s perspective. Strateg. Chang. 1997, 6, 391–405.[CrossRef]
9. Brouthers, K.D.; Bamossy, G.J. Post-formation processes in eastern and western European joint ventures.J. Manag. Stud. 2006, 43, 203–229. [CrossRef]
10. Cravens, D.W.; Shipp, S.H.; Cravens, K.S. Analysis of cooperative inter-organizational relationships, strategicalliance formation, and strategic alliance effectiveness. J. Strateg. Mark. 1993, 1, 55–70. [CrossRef]
11. Chan, S.H.; Kensinger, J.W.; Keown, A.J.; Martin, J.D. Do strategic alliances create value? J. Financ. Econ.1997, 46, 199–221. [CrossRef]
Sustainability 2016, 8, 173 18 of 18
12. Candace, E.Y.; Thomas, A.T. Strategic alliances with competing firms and shareholder value. J. Manag.Mark. Res. 2011, 6, 1–10.
13. Cho, B.S.; Kang, S.W.; Cha, S.M. Trends in telecommunication strategic alliance regulation. In Proceedings ofthe IEEE Technology Management for the Global Future, Istanbul, Turkey, 8–13 July 2006; IEEE: Piscataway,NJ, USA, 2006; Volume 4, pp. 1994–2004.
14. Kauser, S.; Shaw, V. International strategic alliances: Objectives, motives and success. J. Glob. Mark. 2004, 17,7–43. [CrossRef]
15. Deng, J.L. Control problems of Grey systems. Syst. Control Lett. 1982, 5, 288–294.16. Deng, J.L. Introduction to Grey system theory. J. Grey Syst. 1989, 1, 1–24.17. Farrell, M.J. The measurement of productivity efficiency. J. R. Stat. Soc. 1957, 120, 499–513.18. Charnes, A.; Cooper, W.W.; Rhodes, E. Measuring the efficiency of decision making units. Eur. J. Oper. Res.
1978, 2, 429–444. [CrossRef]19. Martín, J.C.; Roman, C. An application of DEA to measure the efficiency of Spanish airports prior to
privatization. J. Air Transp. Manag. 2001, 7, 149–157. [CrossRef]20. Wang, C.N.; Li, K.Z.; Ho, C.T.; Yang, K.L.; Wang, C.H. A model for candidate selection of strategic alliances:
Case on industry of department store. In Proceedings of the Second International Conference on InnovativeComputing, Information and Control, Kumamoto, Japan, 5–7 September 2007; IEEE: Piscataway, NJ,USA, 2007.
21. Wang, R.T.; Ho, C.T.B.; Oh, K. Measuring production and marketing efficiency using grey relation analysisand data envelopment analysis. Int. J. Prod. Res. 2010, 48, 183–199. [CrossRef]
22. Yuan, L.N.; Tian, L.N. A new DEA model on science and technology resources of industrial enterprises.Int. Conf. Mach. Learn. Cybern. 2012, 3, 986–990.
23. Bloomberg Business Week. Available online: http://www.business-week.com/ (accessed on 5 May 2014).24. Tone, K.A. Slacks-based measure of efficiency in data envelopment analysis. Eur. J. Oper. Res. 2001, 130,
498–509. [CrossRef]25. Düzakın, E.; Düzakın, H. Measuring the performance of manufacturing firms with super slacks based model
of data envelopment analysis: An application of 500 major industrial enterprises in Turkey. Eur. J. Oper. Res.2007, 182, 1412–1432. [CrossRef]
26. Tone, K. A slacks-based measure of super-efficiency in data envelopment analysis. Eur. J. Oper. Res. 2002,143, 32–41. [CrossRef]
27. IAS (International Accounting Standards). Available online: http://www.iasplus.com/en/standards/ias(accessed on 20 May 2014).
28. Stevenson, W.J.; Sum, C.C. Operations Management: An Asian Perspective; McGraw-Hill Education (Asia):Singapore, 2010.
29. Golany, B.; Roll, Y. An application procedure for DEA. Omega 1989, 17, 237–250. [CrossRef]30. Pruessner, J.C.; Kirschbaum, C.; Meinlschmid, G.; Hellhammer, D.H. Two formulas for computation of the
area under the curve represent measures of total hormone concentration versus time-dependent change.Psychoneuroendocrinology 2003, 28, 916–931. [CrossRef]
31. Lo, F.Y.; Chien, C.F.; Lin, J.T. A DEA study to evaluate the relative efficiency and investigate the districtreorganization of the Taiwan power company. IEEE Trans. Power Syst. 2001, 16, 170–178. [CrossRef]
© 2016 by the authors; licensee MDPI, Basel, Switzerland. This article is an open accessarticle distributed under the terms and conditions of the Creative Commons by Attribution(CC-BY) license (http://creativecommons.org/licenses/by/4.0/).