Embed Size (px)
Citation preview
0
THE MEASUREMENT AND DETERMINANTS OF X-INEFFICIENCY INCOMMERCIAL BANKS IN SUB-SAHARAN AFRICA
COLIN KIRKPATRICK, IDPM, University of Manchester, UKVICTOR MURINDE, Birmingham Business School, University of Birmingham, UKMOSES TEFULA, United Nations Relief and Works Agency, Jordan
Correspondence Address:Victor MurindeBirmingham Business SchoolUniversity of BirminghamUniversity HouseEdgbastonBirmingham B15 2TTUK.Tel: 0121-414-6704Fax: 0121-414-6238E-mail: [email protected]
1
The Measurement and Determinants of X-Inefficiency in Commercial Banks in Sub-
Saharan Africa
ABSTRACT This paper uses the translog stochastic cost and profit frontier approach to
measure the degree of x-inefficiency in a panel of 89 commercial banks drawn from nine Sub-
Sahara African countries, covering the period 1992-99. The paper then models the
determinants of x-inefficiency in terms of bank-specific factors and general macroeconomic
variables. It is found that profit x-inefficiency is slightly higher than cost x-inefficiency, which
suggests that revenue x-inefficiency is rather small. The evidence also shows that the degree
of cost x-inefficiency is exacerbated by bad loans, high capital ratios and financial
liberalisation. In contrast, it is shown that larger banks are more efficient and the level of
foreign bank penetration reduces x-inefficiency. These findings have important implications
for bank managers and regulators in Sub-Saharan Africa.
KEY WORDS: x-inefficiency, commercial banks, Sub-Sahara Africa

2
1. Introduction
The corpus of evidence from a recent international survey of financial institutions highlights
the usefulness of x-inefficiency studies to policymakers (see Berger and Humphrey, 1997).1 It
is argued that one important use of x-inefficiency metrics is the early detection of distress in
problem banks, which can be used by regulators to initiate prompt early corrective action (see
also Maimbo, 2002; Mester, 1997). Moreover, some studies suggest that bank management
quality is positively related to cost efficiency, which is in turn related to asset quality (De
Young, 1998). Overall, it is important to look at these studies in the context of the fact that,
since the late 1970s, the financial sector in many developing countries has been characterised
by periodic banking crises, with three-quarters of International Monetary Fund (IMF) member
countries experiencing serious banking sector problems between 1980 and 1995 (Lindgren,
Garcia and Saal, 1996).
Hence, this paper aims to measure the degree of x-inefficiency in commercial banks in
Sub-Saharan Africa; the paper then attempts to model the determinants of x-inefficiency in
terms of bank-specific variables and general macroeconomic factors, including financial
liberalisation. Problem banks and subsequent bank failure have been endemic in the region in
the last two decades, and continue to pose a threat to financial stability (Brownbridge and
Harvey, 1998).2 There has also been extensive financial sector liberalisation in the region
during the same period (Popiel, 1994; Mehran et al, 1998). However, there has been relatively
little investigation of the causes of these failures and systemic crises, and their relationship
with financial liberalisation.3
The main contributions of the paper to the existing literature are threefold. First, the
paper evaluates the key theoretical issues in measuring x-inefficiency, and then applies the
main parametric techniques (namely the stochastic frontier approach and the distribution free

3
approach) to measure and compare cost and profit x-inefficiency. It is found that profit x-
inefficiency is slightly higher than cost x-inefficiency, which suggests that revenue x-
inefficiency is rather small. Second, the paper attempts to model the main determinants of x-
inefficiency in terms of bank-specific variables and general macroeconomic factors. The
econometric results show that the degree of cost x-inefficiency is positively influenced by bad
loans, bank capital ratios, and financial liberalisation, but is inversely related to bank size and
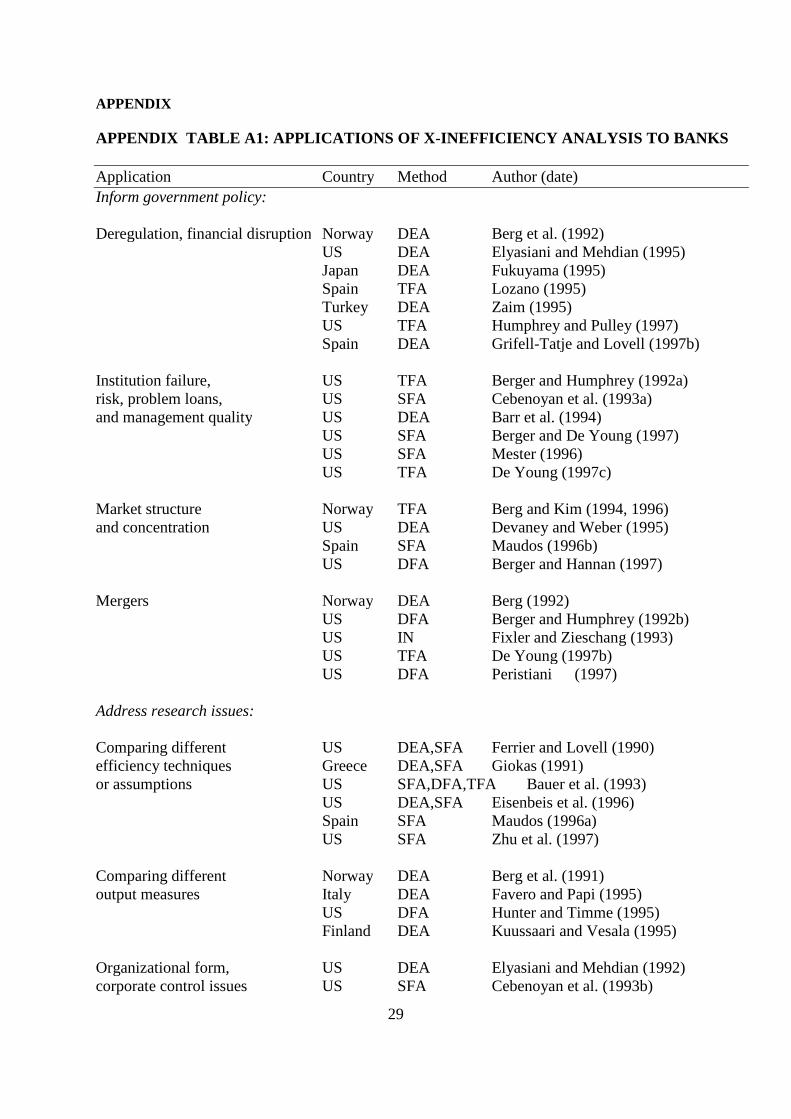
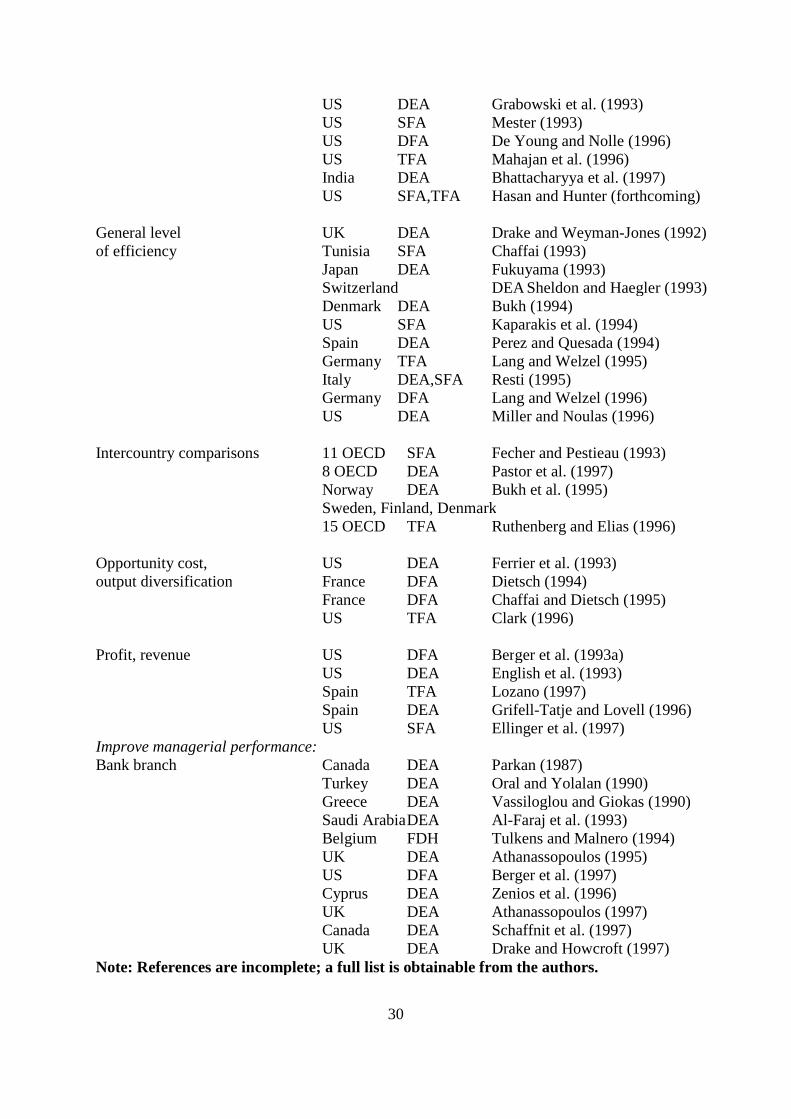
the degree of foreign bank penetration. Third, to our knowledge and in the light of Appendix
Table A1, this is the first empirical study on x-inefficiency in commercial banks in Sub-
Sahara Africa.
The rest of the paper is structured into four sections. Section 2 provides an overview
of recent studies on x-inefficiency in banks, in order to distinguish among the cost function,
the standard profit function and the alternative profit function. Section 3 discusses the
methodology used in this paper, including data and measurement as well as the procedures
used to model x-inefficiency. Section 4 presents the estimation and testing results. The final
section summarises the main findings.
2. Overview of Studies on Bank X-inefficiency
Existing studies show that x-inefficiency can be measured in a number of ways (see, for
example, Sathye, 2001; Altunbas, Liu, Molyneux and Seth, 2000; Tefula, 2001). The first is
cost inefficiency. The cost concept assumes that the primary objective of the bank is to
minimise cost (Berger and Mester, 1997). It relies on the following simple cost function:
ln C = f(p, q, z) + ln ec (1)
where ln denotes natural logarithm; C represents variable costs; p is a vector of prices of
inputs; q is the vector of quantity of outputs; z represents any control variables; and ec is the
error term.
4
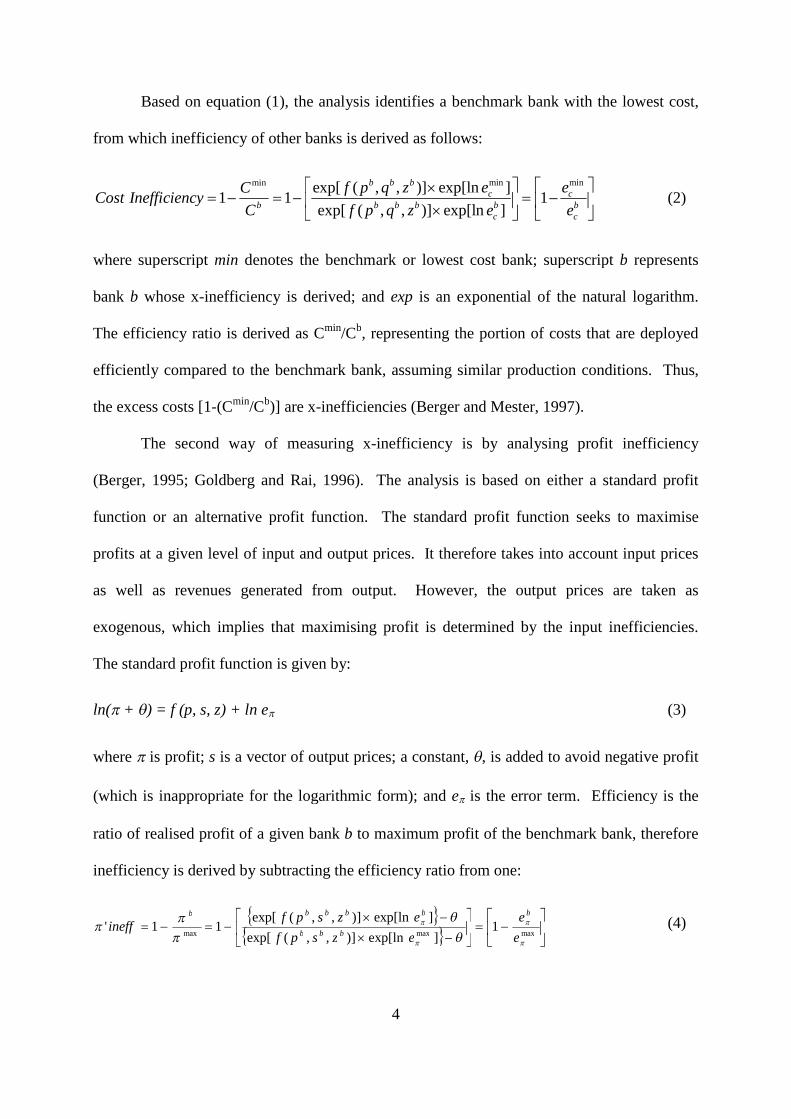
Based on equation (1), the analysis identifies a benchmark bank with the lowest cost,
from which inefficiency of other banks is derived as follows:
min minmin exp[ ( , , )] exp[ln ]1 1 1
exp[ ( , , )] exp[ln ]
b b bc c
b b b b b bc c
f p q z e eCCost Inefficiency
C f p q z e e
(2)
where superscript min denotes the benchmark or lowest cost bank; superscript b represents
bank b whose x-inefficiency is derived; and exp is an exponential of the natural logarithm.
The efficiency ratio is derived as Cmin/Cb, representing the portion of costs that are deployed
efficiently compared to the benchmark bank, assuming similar production conditions. Thus,
the excess costs [1-(Cmin/Cb)] are x-inefficiencies (Berger and Mester, 1997).
The second way of measuring x-inefficiency is by analysing profit inefficiency
(Berger, 1995; Goldberg and Rai, 1996). The analysis is based on either a standard profit
function or an alternative profit function. The standard profit function seeks to maximise
profits at a given level of input and output prices. It therefore takes into account input prices
as well as revenues generated from output. However, the output prices are taken as
exogenous, which implies that maximising profit is determined by the input inefficiencies.
The standard profit function is given by:
ln( + ) = f (p, s, z) + ln e (3)
where is profit; s is a vector of output prices; a constant, , is added to avoid negative profit
(which is inappropriate for the logarithmic form); and e is the error term. Efficiency is the
ratio of realised profit of a given bank b to maximum profit of the benchmark bank, therefore
inefficiency is derived by subtracting the efficiency ratio from one:
maxmaxmax1
]exp[ln)],,(exp[
]exp[ln)],,(exp[11'
e
e
ezspf
ezspfineff
b
bbb
bbbbb
(4)
5
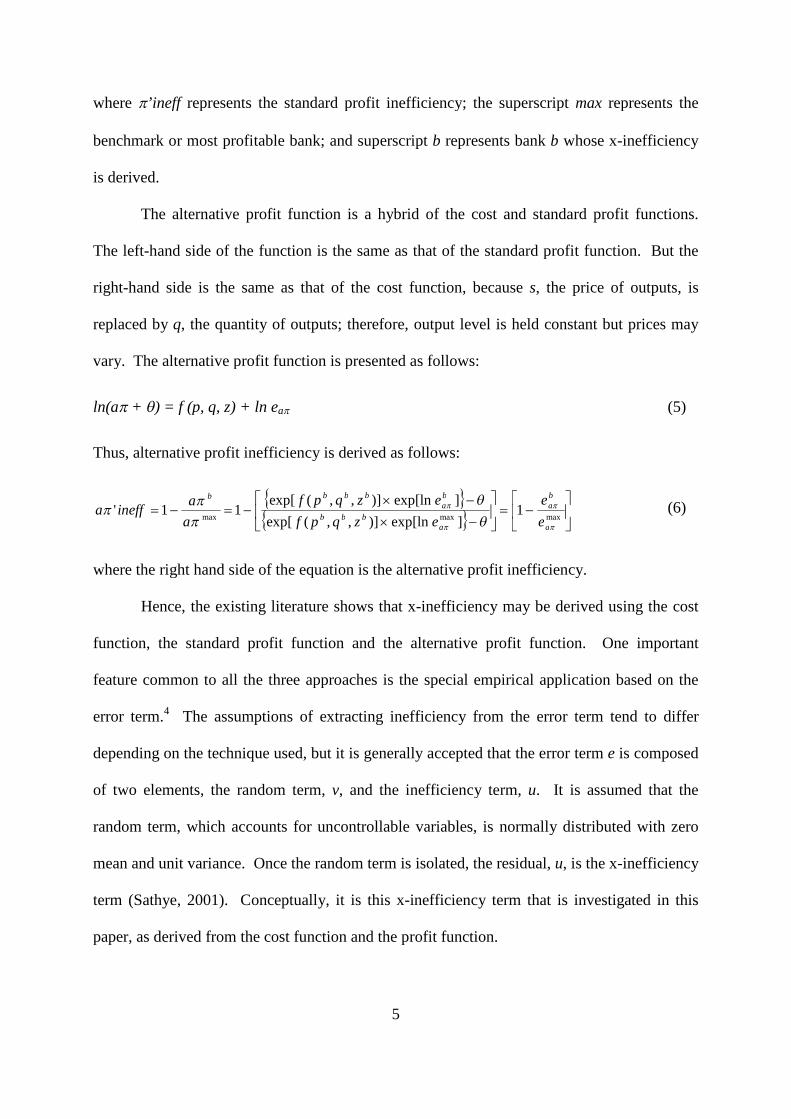
where ’ineff represents the standard profit inefficiency; the superscript max represents the
benchmark or most profitable bank; and superscript b represents bank b whose x-inefficiency
is derived.
The alternative profit function is a hybrid of the cost and standard profit functions.
The left-hand side of the function is the same as that of the standard profit function. But the
right-hand side is the same as that of the cost function, because s, the price of outputs, is
replaced by q, the quantity of outputs; therefore, output level is held constant but prices may
vary. The alternative profit function is presented as follows:
ln(a + ) = f (p, q, z) + ln ea (5)
Thus, alternative profit inefficiency is derived as follows:
maxmaxmax1
]exp[ln)],,(exp[
]exp[ln)],,(exp[11'
a
ba
abbb
ba
bbbb
e
e
ezqpf
ezqpf
a
aineffa (6)
where the right hand side of the equation is the alternative profit inefficiency.
Hence, the existing literature shows that x-inefficiency may be derived using the cost
function, the standard profit function and the alternative profit function. One important
feature common to all the three approaches is the special empirical application based on the
error term.4 The assumptions of extracting inefficiency from the error term tend to differ
depending on the technique used, but it is generally accepted that the error term e is composed
of two elements, the random term, v, and the inefficiency term, u. It is assumed that the
random term, which accounts for uncontrollable variables, is normally distributed with zero
mean and unit variance. Once the random term is isolated, the residual, u, is the x-inefficiency
term (Sathye, 2001). Conceptually, it is this x-inefficiency term that is investigated in this
paper, as derived from the cost function and the profit function.
6
It should be noted that the above literature review focuses on the parametric approach
to the study of costs and efficiency in banking. An important alternative is the non-parametric
approach, typically data envelopment analysis (DEA), which provides a piecewise linear
frontier by enveloping the observed data points. See Drake (2003) for a competent review and
comparison of these two main approaches.
3. Methodology
3.1 Measuring the Degree of X-inefficiency
Taking as a point of departure the simple cost and profit functions reviewed in equations (1),
(3) and (5) above, we invoke a multi-product translog function. We argue that, because of its
general quadratic flexibility, the multi-product translog function is the most credible
functional form, which can provide a basis for estimating x-inefficiency (see Drake, 1992).
Worthington (1998) notes that it has generally performed well in previous studies due to its
strong attributes, one of which is not to impose restrictions on the elasticity of substitution
between inputs. Furthermore, it caters for multiple inputs and outputs, and also recognises
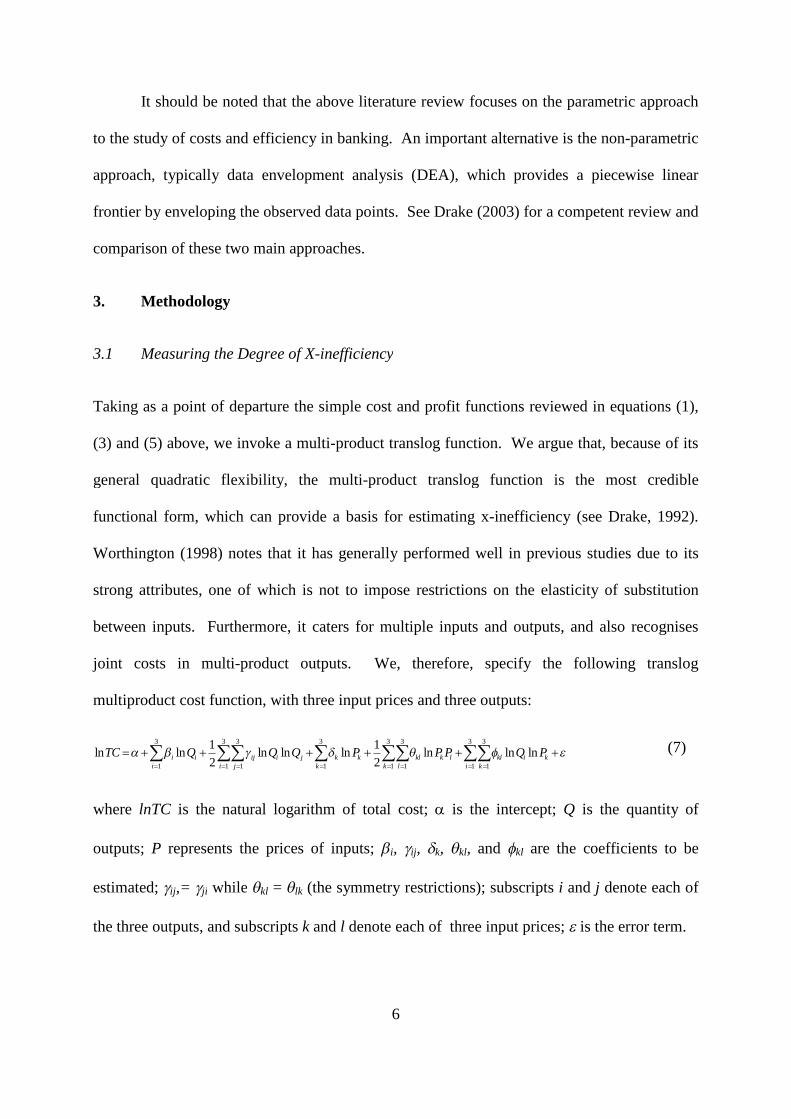
joint costs in multi-product outputs. We, therefore, specify the following translog
multiproduct cost function, with three input prices and three outputs:
3 3 3 3 3 3 3 3
1 1 1 1 1 1 1 1
1 1ln ln ln ln ln ln ln ln
2 2i i ij i j k k kl k l kl i k
i i j k k l i k
TC Q Q Q P P P Q P
(7)
where lnTC is the natural logarithm of total cost; is the intercept; Q is the quantity of
outputs; P represents the prices of inputs; i, ij, k, kl, and kl are the coefficients to be
estimated; ij,= ji while kl = lk (the symmetry restrictions); subscripts i and j denote each of
the three outputs, and subscripts k and l denote each of three input prices; is the error term.
7
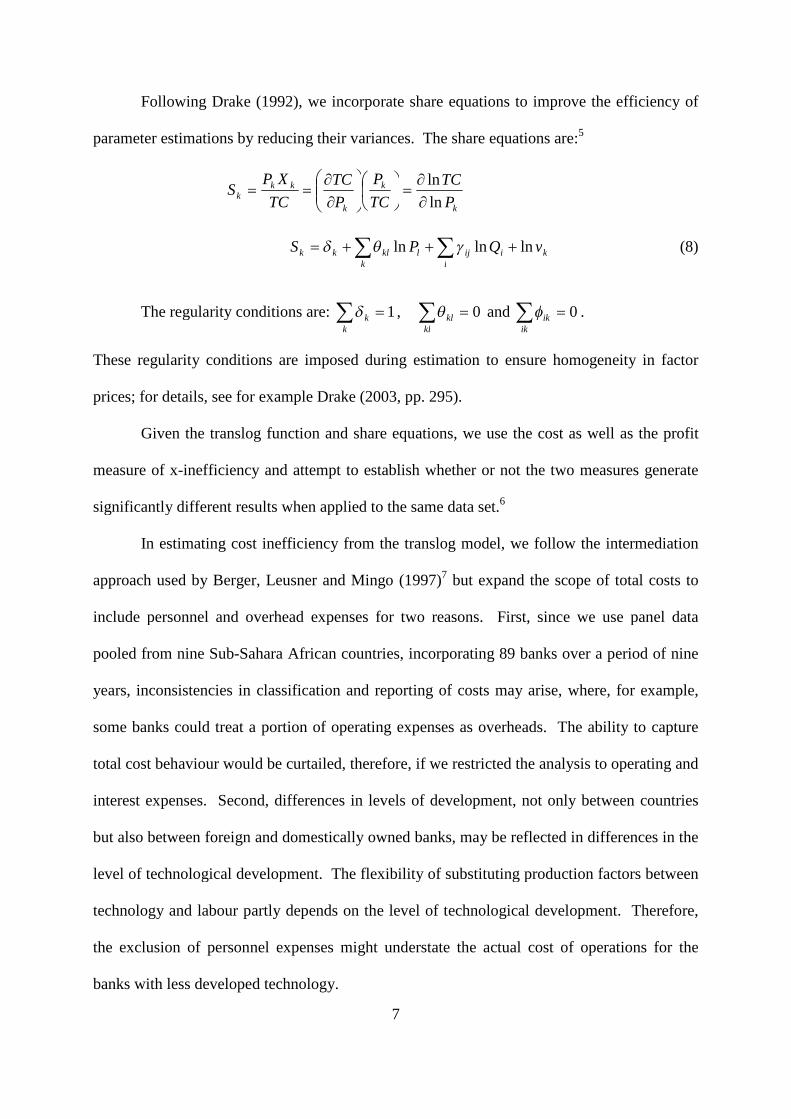
Following Drake (1992), we incorporate share equations to improve the efficiency of
parameter estimations by reducing their variances. The share equations are:5
k
k
k
kkk
P
TC
TC
P
P
TC
TC
XPS
ln
ln
i
kiijlk
klkk vQPS lnlnln (8)
The regularity conditions are: k
k 1 , kl
kl 0 and ik
ik 0 .
These regularity conditions are imposed during estimation to ensure homogeneity in factor
prices; for details, see for example Drake (2003, pp. 295).
Given the translog function and share equations, we use the cost as well as the profit
measure of x-inefficiency and attempt to establish whether or not the two measures generate
significantly different results when applied to the same data set.6
In estimating cost inefficiency from the translog model, we follow the intermediation
approach used by Berger, Leusner and Mingo (1997)7 but expand the scope of total costs to
include personnel and overhead expenses for two reasons. First, since we use panel data
pooled from nine Sub-Sahara African countries, incorporating 89 banks over a period of nine
years, inconsistencies in classification and reporting of costs may arise, where, for example,
some banks could treat a portion of operating expenses as overheads. The ability to capture
total cost behaviour would be curtailed, therefore, if we restricted the analysis to operating and
interest expenses. Second, differences in levels of development, not only between countries
but also between foreign and domestically owned banks, may be reflected in differences in the
level of technological development. The flexibility of substituting production factors between
technology and labour partly depends on the level of technological development. Therefore,
the exclusion of personnel expenses might understate the actual cost of operations for the
banks with less developed technology.

8
On the choice between the standard profit function and the alternative profit function
we select the alternative profit function, because our empirical analysis is based on panel data,
with wide variations in the quality of bank products across the nine countries.8 We use
parametric rather than non-parametric techniques9 to decompose the error term of the translog
function, in order to isolate x-inefficiency. Using the stochastic frontier approach (SFA), x-
inefficiency (X-INEFF) is calculated as follows:
i
i
iINEFFX)/(
)(
12
(9)
Where () is the density of the standard normal distribution, and () is the truncated
cumulative distribution. Hence, inefficiency is the mean or mode of the distribution.
We considered the fixed effects versus the random effects specification for our panel,
but given the unbalanced nature of our data across countries and banks, we follow
improvements suggested by Greene (1993) when using panel data, by applying the fixed
effects approach, where the error terms are treated as bank-specific. Fecher et al. (1993)
propose the following function with parameters that vary across countries:
it = 0 + xit + uit (10)
where 0 are country fixed effects; xit are country related variables; and uit is the residual
representing inefficiency, provided it is normalised to fulfil the non-negativity requirement.
3.2 Modelling the Determinants of X-inefficiency
We specify the following regression model to capture the main determinants of x-inefficiency
in commercial banks in Sub-Saharan Africa:
X-INEFF = f0 + f1 SHHI + f2 BASQ + f3 BCAP + f4 BSZE + f5 BLIQ + f6 BPR + f7 SFPA + f8
SINT + f9 SGDPC + (11)
9
where, X-INEFF = x-inefficiency; SHHI = market power variable, which represents the
market power hypothesis;10 BASQ = asset quality variable, which represents the bad loans
hypothesis; BCAP = capital ratio variable, which is a surrogate for regulatory pressure; BSZE
= bank size variable; BLIQ = bank liquidity variable; BPR = bank profitability variable; SFPA
= domestic versus foreign bank ownership variable; SINT = financial liberalisation variable;
SGDPC = average income of bank customers; and fi: i=0,…,10 are coefficients of the
explanatory variables including a constant; and = white noise error term.
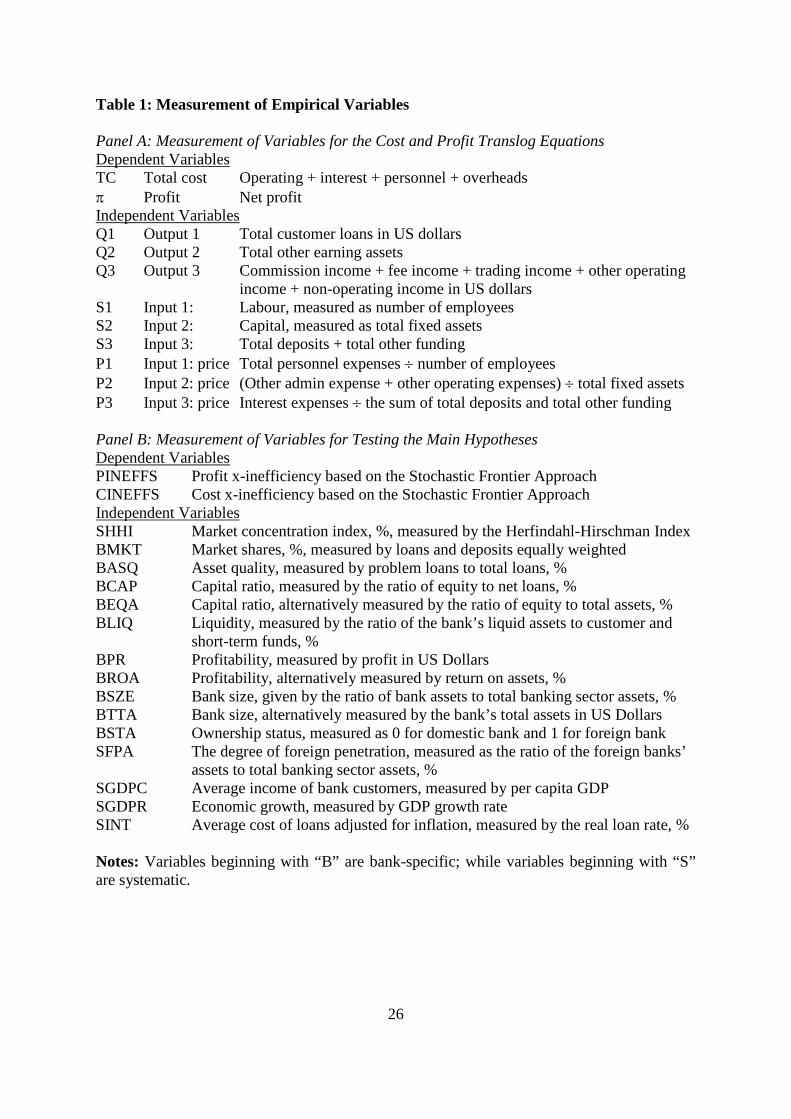
The measurement of the variables used in the empirical analysis is summarised in
Table 1. In panel B of the table, the corresponding variable for the dependent variable of
equation (11), X-INEFF, is measured by PINEFFS, which denotes profit x-inefficiency based
on the SFA, as well as CINEFFS, which represents cost x-inefficiency based on the SFA. The
independent variables with acronyms beginning with B are bank specific factors, while the
variables with acronyms beginning with S are systematic macroeconomic variables. The table
also presents alternative measures of some variables; for example, BMKT for SSHI, BEQA
for BCAP, BROA for BPR, BTTA for BSZE, BSTA for SFPA and SGDPR for SGDPC. The
alternative variables are used in estimation and testing.
[Table 1 about here]
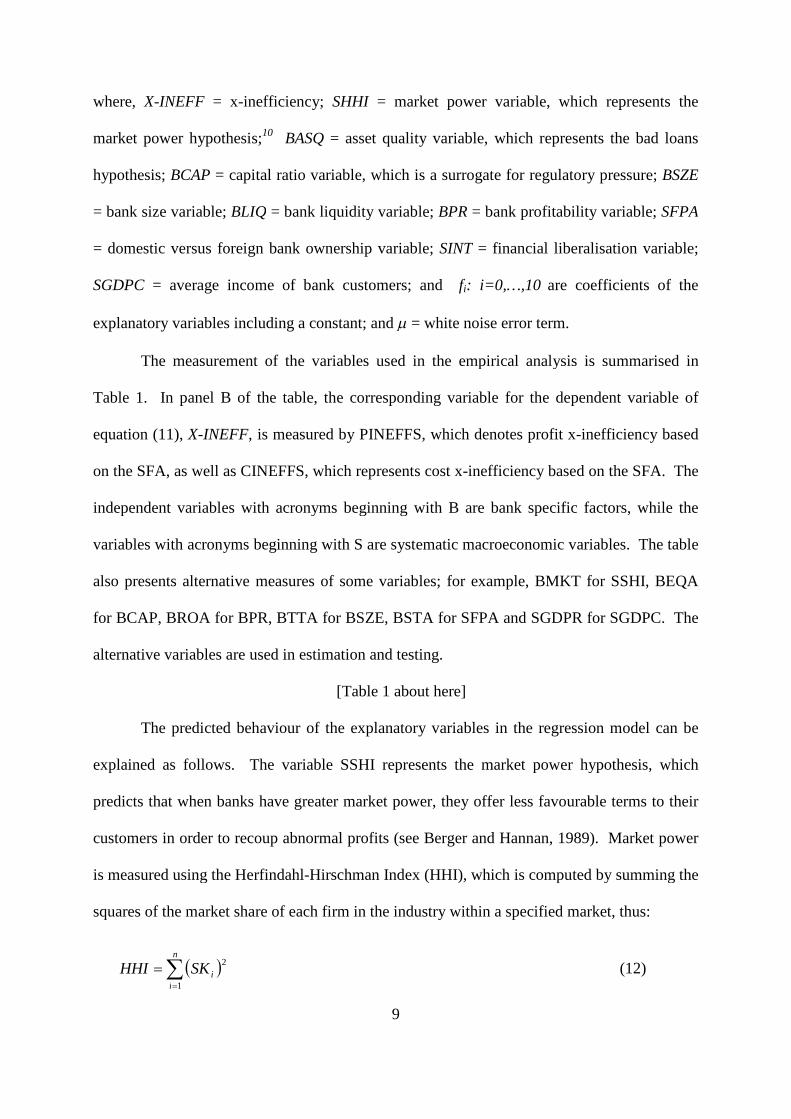
The predicted behaviour of the explanatory variables in the regression model can be
explained as follows. The variable SSHI represents the market power hypothesis, which
predicts that when banks have greater market power, they offer less favourable terms to their
customers in order to recoup abnormal profits (see Berger and Hannan, 1989). Market power
is measured using the Herfindahl-Hirschman Index (HHI), which is computed by summing the
squares of the market share of each firm in the industry within a specified market, thus:
n
iiSKHHI
1
2(12)
10
where SKi is the share (computed by using the percentage of turnover or assets, as appropriate)
of firm i; n is the number of firms. Hence, in the context of the market power hypothesis, it is
predicted that SSHI is positively related to x-inefficiency.
The variable BASQ represents the bad loans hypothesis. It is argued that inefficiency
mainly arises from bad loans, most often due to bad management of the bank. Hence,
consistent with the bad loans hypothesis, it is predicted that bad loan problems exacerbate x-
inefficiency.
The explanatory variable BCAP represents regulatory capital adequacy rules. As noted
by Berger and Mester (1997), high capital ratios force banks to keep high capital and reserves
at an opportunity cost, since such funds could earn higher returns if invested. Specifically,
maintaining high mandatory capital ratios and reserves increases costs and reduces potential
profits; hence capital ratios have a positive relationship with cost inefficiency as well as profit
inefficiency. However, it may be argued that conceptually, there is an optimum level of
capital ratios; as the bank’s capital ratio reaches the optimum level, the bank’s cost x-
inefficiency and profit x-inefficiency will fall, mainly because well capitalised banks may
obtain external finance at lower costs than do poorly capitalised banks. Hence, the impact of
capital ratios on x-inefficiency may be positive or negative.
Although the variable BSZE is typically associated with scale and scope inefficiencies,
Berger et al. (1993) find that larger firms tend to be closer to the efficient frontier than smaller
firms. Moreover, since x-inefficiency is a proxy of management quality (De Young, 1998),
larger banks have the resources to attract high calibre personnel, who may deliver superior
performance and lower x-inefficiencies. Hence, it is predicted that BSZE is inversely related
to cost x-inefficiency and profit x-inefficiency.
The explanatory variable BLIQ represents bank liquidity. It is argued that when banks
hold higher liquidity, they do so at the opportunity cost of some investment options which
11
could generate higher returns. Hence, it is predicted that the bank’s liquidity positively
influences cost x-inefficiency and profit x-inefficiency.
The bank profitability variable, BPR, is predicted to lead to an increase in cost x-
inefficiency. This is because, as Berger (1995) and Goldberg and Rai (1996) find, there is a
positive relationship between profitability and market structure measures, such that highly
profitable banks tend to consolidate their position in the market, even at the expense of cost
efficiency.
The variable SFPA is used as a proxy for the degree of foreign bank penetration,
measured as the ratio of foreign banks’ assets to total banking sector assets11. According to
agency theory, there are potential conflicts of interest between bank managers and other
stakeholders.12 Notwithstanding on-going reforms and privatisation of commercial banks in
Sub Sahara Africa, some banks are still government owned.13 Directors and top managers of
government owned banks are normally government appointees whose professional ethos are
subordinated by political allegiance. Brownbridge and Harvey (1998) point out that although
the performance of government owned banks in Sub-Sahara Africa varies due to several
factors, management is heavily influenced by political patronage. Therefore, agency related
costs are expected to be higher in government controlled banks, and thus increase inefficiency.
In the light of the foregoing, it is expected that the privatisation process reduces inefficiencies
in African commercial banks. Moreover, it may be argued that foreign bank ownership and
foreign bank penetration may lead to better corporate governance, mitigate agency costs and
enhance performance to reduce x-inefficiency.14 Hence, it is predicted that SFPA is inversely
related to x-inefficiency.
In the model, one main macroeconomic variable that has important implications for
bank performance in Sub-Saharan Africa is financial liberalisation. We use, as a proxy for
financial liberalisation, the variable SINT, measured by the real loan rate. As noted by
12
Hermes, Lensink and Murinde (1998), the average cost of loans adjusted for inflation may be
interpreted as a financial liberalisation measure; the idea is that financial repression is often
indicated by negative real loan rates, such that an increase in SINT represents financial
liberalisation as a remedial policy for financial repression. In terms of the predicted behaviour
of SINT, we note that existing studies regarding the impact of financial liberalisation on x-
inefficiency give mixed results. Berger and Humphrey (1997) conclude that “the conventional
wisdom which holds that deregulation always improves efficiency and productivity may be
incorrect. Industry conditions prior to deregulation and other incentives may intervene.”15 On
this basis, we argue that if it is comprehensive enough to foster competition in the banking
sector, financial liberalisation may reduce x-inefficiency, otherwise x-inefficiencies may
persist or be aggravated. Hence, in our regression model, the effect of financial liberalisation
is theoretically indeterminate.
The final explanatory variable in the model, SGDPC, is included to capture the
average income of bank customers, measured by per capita GDP. The variable represents
general economic performance, or business cycle behaviour, and as such the predicted impact
on x-inefficiency is theoretically indeterminate.
3.3 Data
The source of data is Bankscope, an international database covering over 10,000 banks
worldwide. We started with the population of all banks in all Sub-Saharan African countries,
for the period 1990-2002. After carefully checking the data for availability and completeness,
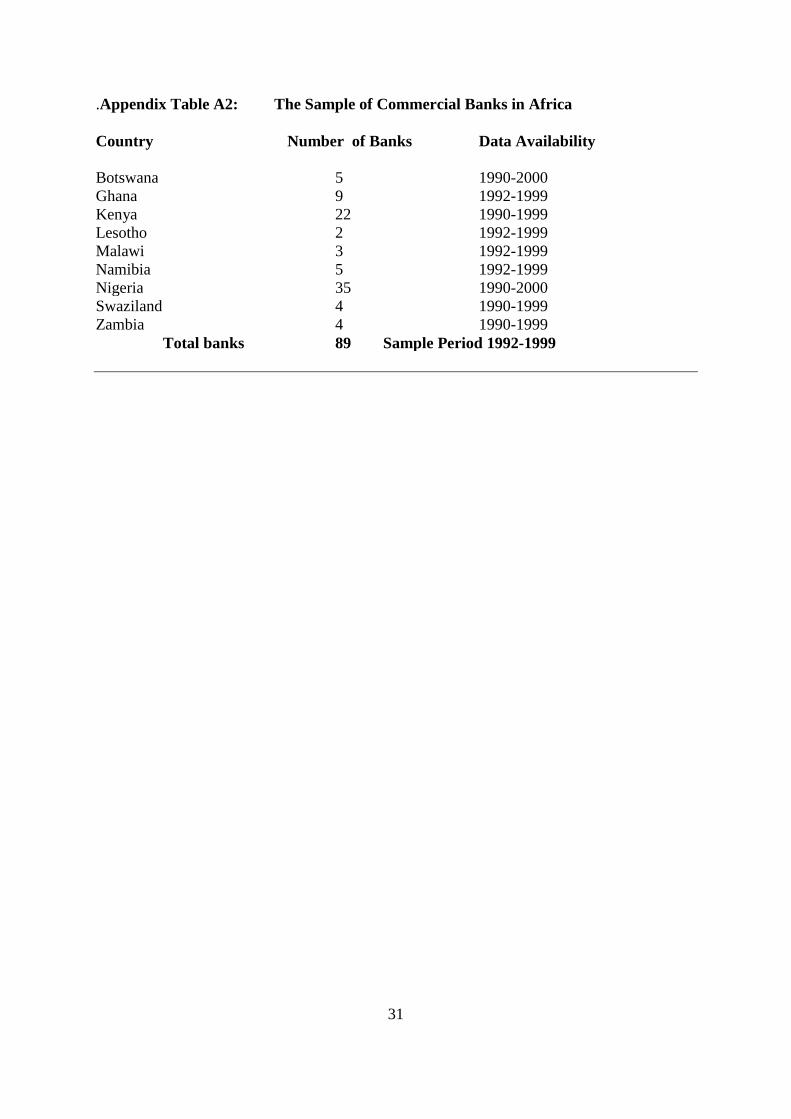
we ended up with a sample of 89 banks altogether for 1992-1999, from Botswana, Ghana,
Kenya, Lesotho, Malawi, Namibia, Nigeria, Swaziland, and Zambia.16 Specifically, the
composition of the 89 sample banks is such that Botswana has 5 banks for 1990-2000, Ghana
has 9 banks for 1992-1999, Kenya has 22 banks for 1990-1999, Lesotho has 2 banks for 1992-
13
1999, Malawi has 3 banks for 1992-1999, Namibia has 5 banks for 1992-1999, Nigeria has 35
banks for 1990-2000, Swaziland has 4 banks for 1990-1999 and Zambia has 4 banks for 1990-
1999; see Appendix Table A2. We therefore end up with a panel data set, which offers the
advantage of combining time series and cross-section dimensions of the data.
However, the sample is dominated by two countries, Nigeria and Kenya, which
have 35 and 22 banks, respectively, and thus represent 57 banks out of 89 banks (64 percent).
Hence, our analysis must be taken with caution in the sense that it is biased towards Nigeria
and Kenya.
4. Estimation and Testing Results
4.1 Results on the Degree of X-inefficiency
We first confirm that the descriptive statistics for the dependent and independent variables of
the multi-product translog model, on which basis we derive measures of x-inefficiency, reflect
normally distributed data.17 On the basis of the results from seemingly unrelated regressions
(SURE) of the cost and profit translog functions, incorporating the two share equations in each
case, it was possible to extract x-inefficiency from the error term, as earlier described, using
both the DFA and SFA methods.
[Table 2 about here]
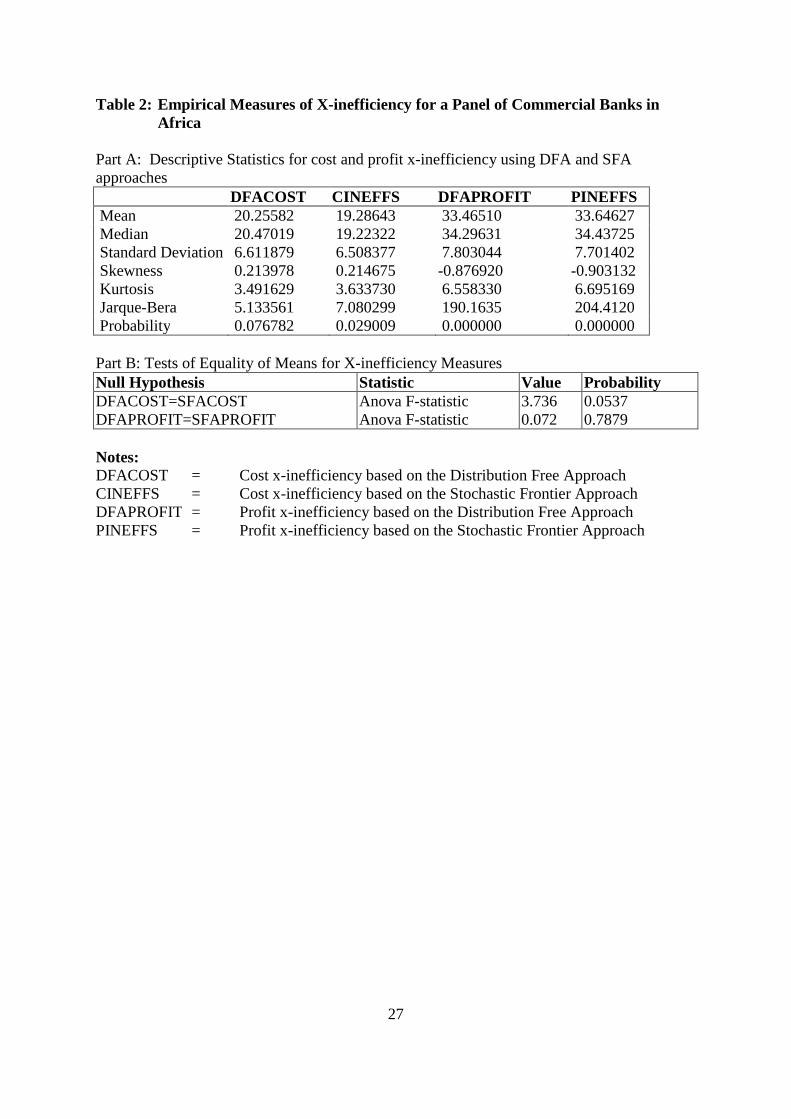
The descriptive statistics of x-inefficiency measures are reported in Table 2. The
results show that the mean value for cost x-inefficiency based on the DFA is 20.256 while a
similar measure based on the SFA method has a mean value of 19.286. These results suggest
that on average banks are 80 percent cost efficient, according to both the DFA and SFA
metrics. It is also reported that the mean value of profit x-inefficiency based on the DFA
method is 33.465 while the corresponding mean value based on the SFA method is 33.646.
14
These measures suggest that banks are on average 67 percent profit efficient. Overall, these
estimates are consistent with the results reported by Berger and Humphrey (1997) in their
comprehensive survey of bank efficiency estimates internationally. Our results add to the
body of evidence reported in Table 1 of the Berger-Humphrey survey by providing evidence
on banks in Sub-Saharan Africa.
Moreover, the results of our study reveal that profit x-inefficiency is generally higher
than cost x-inefficiency. This finding is not surprising, given that the former incorporates both
costs and revenue. What is striking, however, is that the estimates for cost x-inefficiency are
generally very high, which suggests that there is a greater potential for efficiency
improvement by better management and control of the cost side, compared to the revenue
side. The higher estimates for cost x-inefficiency also suggest possible agency theory
problems such that bank managers may not be acting in the best interests of their principals,
the shareholders. In terms of policy implications, these results suggest that the cost side of the
banks’ operations deserves greater monitoring not only through the internal corporate
governance mechanisms, but also through external regulation, for example by regularly
accessing and evaluating the banks’ internal budgetary performance reports generated for
internal management. This is particularly important because the “true and fair” philosophy
which guides the external auditors does not sufficiently cover inefficiencies in the internal use
of resources, provided such inadequacies are neither fraudulent nor misrepresented in the
books of accounts.
In Table 2, the test for equality of means of cost x-inefficiency based on the DFA
method and the cost x-inefficiency based on the SFA method yields an ANOVA F-Statistic of
3.736, with probability value of 0.0537, while the test for equality of means of profit x-
inefficiency based on the DFA method and that based on the SFA method yields an ANOVA
F-Statistic of 0.072 with probability value of 0.7879. Specifically, the test results for equality
15
of means between the cost x-inefficiency measures (DFACOST and CINEFFS) as well as the
profit measures (DFAPROFIT and PINEFFS) show that the F-statistic, in either case, is
insignificant at 1% and 5%. Hence, the null hypothesis, that the cost x-inefficiency estimates
obtained using DFA are not significantly different from those obtained using SFA, is not
rejected. Similarly, the null hypothesis, that the profit x-inefficiency estimates obtained using
DFA are not significantly different from those obtained using SFA, is upheld. These results
suggest that the cost x-inefficiency as well as profit x-inefficiency estimates derived using
DFA and SFA are not significantly different, and that both methods produce broadly
comparable results. Hence, we can draw similar inferences about cost x-inefficiency in the
sample of African banks, irrespective of whether we use the DFA or the SFA measurement
approach. The same is true for profit x-inefficiency for the sample of African banks.
4.2 Results from Regression Analysis
We first undertake diagnostic checking of the data, including the standard descriptive statistics
and the stationarity properties of the data. We also check the correlation of the main
explanatory variables in the regression. After confirming that the data are normally
distributed, according to the measures of distribution, we proceed to estimate and test the
model on panel data. We also control for country differences using country dummies.
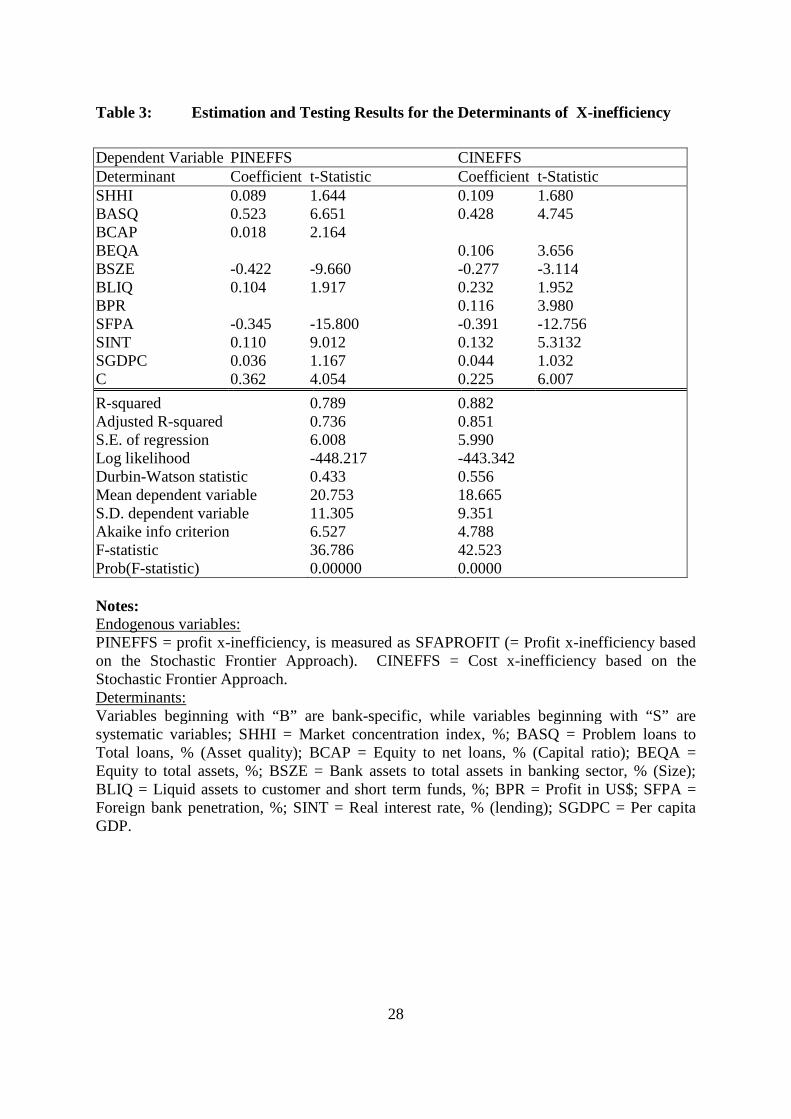
The estimation and testing results relating to the main determinants of cost x-
inefficiency, including the variables that capture the predictions of the main hypotheses, are
reported in Table 3.
[Table 3 about here]
In Table 3, the evidence suggests that the market power hypothesis cannot be strongly
supported. However, using the cost x-inefficiency measure as the dependent variable, market
16
concentration is statistically significant at the 10 percent level, which may be acceptable on a
one-tailed test and at least indicates weak support of the hypothesis.
The results also show that the asset quality explanatory variable, which represents the
bad loans hypothesis, bears a statistically significant positive impact on cost x-inefficiency as
well as profit x-inefficient. This result suggests that deterioration of asset quality, specifically
the bad loans syndrome, contributes to cost x-inefficiency as well as profit x-inefficiency.18
A plausible interpretation of this result is that, in the special case of Sub-Saharan Africa,
problem loans are very costly to recover and the whole effort amounts to “throwing good
money after bad”. Specifically, problem loans have preceded inefficiency when some weak
bank management (and possibly some exogenous factors beyond the control of bank
management) have led to the deterioration of asset quality, high loan recovery costs and
associated cost and profit x-inefficiency.
The impact of regulatory capital adequacy rules, as proxied by bank capital ratios, on
x-inefficiency is positive and statistically significant. It is shown that an increase in the ratio
of equity to net loans leads to an increase in profit x-inefficiency, while an increase in the ratio
of equity to total assets leads to an increase in cost x-inefficiency. These results suggest that
banks in Sub-Sahara Africa are maintaining high capital ratios, relative to an optimal level,
thereby eroding the banks’ cost and profit efficiencies. The finding is consistent with the
argument by Berger and Mester (1997) that banks keep high capital and reserves at an
opportunity cost of earning returns from investment. However, the argument with respect to
an optimum capital ration should be taken as tentative because, after allowing for a quadratic
term on the capital ratio variable following the procedures for threshold modelling as recently
applied in Lensink and Murinde (2006), we are unable to obtain a statistically significant
coefficient for the quadratic term, even after imposing some restrictions on the model.
17
The results for bank size show a statistically significant negative impact on x-
inefficiency, consistent with the theoretical prediction that bank size is inversely related to
cost x-inefficiency and profit x-inefficiency. Although in this study we do not control for the
size of the bank by partitioning the sample banks according to size, the evidence of an inverse
relationship between size and x-inefficiency is consistent with the results obtained by Berger
et al (1993), who find that not only do larger firms tend to be closer to the efficient frontier
than smaller firms, but also they are more likely to achieve an optimal mix of inputs. The
evidence is consistent with the argument by DeYoung (1998) that larger banks have the
resources to attract high calibre personnel and thus attain lower x-inefficiencies.
The results in Table 3 also show that bank liquidity bears a positive but weak
statistically significant impact on cost x-inefficiency as well as profit x-inefficiency. This
finding suggests that as banks in Sub-Saharan Africa increase their liquidity positions, they do
so at the opportunity cost of expanding their loan portfolios and thus suffer cost and profit x-
inefficiency. It is further shown that an increase in profitability has a positive statistically
significant impact on cost x-inefficiency; however, no impact on profit x-inefficiency is
detected. One possible interpretation of this evidence is that if the banking sector in Sub-
Saharan Africa is not competitive, the banks may manipulate prices in their favour and
increase their profitability without necessarily reducing costs or improving efficiency.
It is also shown in Table 3 that the degree of foreign bank penetration is inversely
related to x-inefficiency at a statistically significant level of 5% or higher, indicating that an
increase in the degree of foreign bank penetration, representing an increase in foreign bank
ownership, is associated with a reduction in profit and cost x-inefficiency. This result
suggests that where the corporate governance structure of banks in Africa is such that there is
substantial foreign ownership of the banks, there is greater scrutiny of the management of the
banks in order to mitigate agency-related problems and the pertinent agency costs, thus
18
enhancing performance and reducing x-inefficiency. This result reinforces the conclusion
drawn by Murinde and Ryan (2003) that banks in Africa have nothing to fear from opening
the sector to foreign bank entry.
The results for financial liberalisation show that the impact on x-inefficiency is
positive and statistically significant. We conclude that financial liberalisation has not
improved cost x-inefficiency and profit x-inefficiency. In this context, the experience is Sub-
Saharan Africa is consistent with that in other countries where financial liberalisation is
associated with increased x-inefficiency in the banking sector and vulnerability to financial
crises; see, for example, Williamson and Maher (1998) and Kaminsky and Reinhart (1998).
5. Conclusion
In this study, one main finding of interest is that irrespective of the measure of x-inefficiency,
profit x-inefficiency is higher than cost x-inefficiency across the board, from which we infer
that the revenue x-inefficiency is rather small. Given that bank managers have substantial
control on the cost side, this finding reflects the managers’ cost preference behaviour even
where it subjugates the shareholders’ best interests, thus increasing agency costs. There are
two policy perspectives to the cost-revenue fulcrum of x-inefficiency. The first one is that
regulators should take greater interest in internal controls and budgetary performance reports,
in addition to the traditional focus on the asset quality, capital adequacy and liquidity
indicators. Although regulators receive performance reports on a regular basis, and carry out
on-site and off-site surveillance, this could be reinforced by strict corporate governance codes
such as instituting audit committees composed of non-executive directors. Secondly, policy
makers should institute and enforce financial reporting standards, which are transparent, in
order to ameliorate the agency costs.
19
In terms of the regression model, the main evidence suggests five important findings.
First, consistent with what other researchers have reported, we find that deterioration of asset
quality, specifically the bad loans syndrome, contributes to cost x-inefficiency as well as profit
x-inefficiency. This finding supports the bad loans hypothesis. Second, we find that high
capital ratios increase costs and reduce profits, suggesting that bank managers in Sub-Sahara
Africa tend to maintain high capital ratios, relative to an optimal level, and thus erode the
banks’ cost and profit efficiency. However, this finding needs to be further investigated and
qualified by determining the optimum level of bank capital ratios. Third, we find that
financial liberalisation has not improved cost x-inefficiency and profit x-inefficiency in the
banking sector in Sub-Saharan Africa. This may be due to segmentation of the financial
sector and possible market imperfections. Fourth, we find that bank size matters: larger banks
are likely to have the resources to attract high calibre of personnel and thus attain lower x-
inefficiencies. Fifth, we find that the degree of foreign bank penetration is inversely related to
x-inefficiency, suggesting that foreign bank ownership in Africa has contributed to better
management and performance of commercial banks.
However, there is an important caveat regarding our data and sample. The sample is
dominated by two countries, Nigeria and Kenya, with 35 and 22 banks, respectively,
representing 57 banks out of 89 banks (64 percent). Hence, our findings must be taken with
caution in the sense that the relationships are being driven by commercial banks in Nigeria
and Kenya. Further research is necessary to address this limitation of our study. One way to
proceed is to extend the panel’s time dimension and thus increase the degrees of freedom for
estimating the translog stochastic cost and profit frontiers by dropping one of the two
countries in turn. Thus, the results would be generated for the entire sample, preferably
extended to 2005, then with the sub-sample that excludes Nigeria, and another sub-sample that
excludes Kenya. Further research is also required to map the possible link between bank x-
20
inefficiency and bank failure, after controlling for financial liberalisation and the dichotomy
between government ownership and private ownership of the banks in Africa. Nevertheless,
our research into the magnitude and determinants of bank x-inefficiency provides an important
first step to understanding the causes of systemic banking crises, and to the development of
more reliable diagnostic policy instruments in Sub-Saharan Africa.
Acknowledgements
We thank Chris Adcock, the Editor, Christopher J. Green and two anonymous referees of this
journal for constructive comments on a previous version of this paper. We also thank the
Department for International Development (DFID) for funding the research under the
“Finance and Development Research Programme”, Contract No. RSC106506. However, we
retain responsibility for surviving errors.
21
Notes
1 Broadly, the concept of x-inefficiency has been widely used in banking studies as a proxy for managerial
performance (Allen and Rai, 1996; Berger and DeYoung, 1997) i.e. inefficiencies that result from managerial
deficiencies, rather than sub-optimal output decisions.
2 Hence, the relevance of this research stems from the argument that the ultimate objective of regulatory
authorities is to minimise the inefficiency in the banking sector, in order to realise at least three benefits (Berger,
Hunter, and Timme, 1993). First, more efficient banks intermediate more funds, offer a wider range and better
quality of services to clients at competitive prices. Second, banks become more profitable and therefore investors
expect higher dividends. Third, banks are able to attract more capital and reserves, in order to increase safety and
soundness of the banks, and hence reduce the risk of bank failures.
3 Notable exceptions are the studies by Brownbridge (1998) and Maimbo (2002); however, neither do these
studies measure x-inefficiency nor do they use econometric methods to model the determinants of x-inefficiency.
4 Unlike econometric work that focuses on estimated coefficients, the coefficients become subordinate in the
process of computing the inefficiency measure (Greene, 1993). What is of primary concern is the error term.
5 The number of share equations = n-1, where n is the number of inputs.
6Worthington (1998) argues that the cost concept is more relevant in the determination of bank x-inefficiency
because banks are constrained from achieving maximum profits due to regulatory restrictions, such as the
minimum reserve and capital adequacy requirements. Moreover, it is argued that management has substantial
control on the cost of inputs, whereas the output side is beyond their control. On the other hand, it may be argued
that the profit concept is more appropriate because management performance involves controllable and non-
controllable variables, and any measure that excludes either of them does not fully capture management
performance. Given the arguments for and against the cost and profit measures of inefficiency, we use both.
7 Berger, Leusner and Mingo (1997) examine two approaches to estimating cost x-inefficiency, namely the
intermediation versus the production approach. For the intermediation approach, costs include both operating and
interest expenses, whereas the production approach is based on operating costs only.
8 Berger and Mester (1997) show that the alternative profit function offers some distinct advantages that make it
more applicable to panel data from different countries. Moreover, the alternative profit function takes into
account variations in the quality of bank outputs across countries.
22
9 The non-parametric approach lacks an a priori functional form, which makes hypothesis testing difficult.
Moreover, non-parametric techniques do not isolate the random error term and will therefore lead to inaccurate
estimates of inefficiency.
10 We also tried to measure market power using a market share variable, denoted as BMKT, measured by loans
and deposits equally weighted. However, the SHHI performed better than BMKT.
11 A bank is defined as foreign if at least 50 percent of its shares is foreign owned (see, among others, Lensink
and Murinde, 2006).
12 In most OECD countries, the corporate governance of banks has been subjected to greater scrutiny in order to
mitigate agency-related problems and the pertinent agency costs.
13 Berger, Hunter and Timme (1993) suggest that agency costs can be mitigated by adopting a corporate
governance structure that separates decision-control from decision-management.
14 Brownbridge and Harvey (1998) found that foreign links and ownership contributed to better management and
performance in the African commercial banking sector.
15 Williamson and Maher (1998) have indicated that almost their entire sample of 34 countries that undertook
financial liberalisation between the beginning of the 1980s and mid-1997 subsequently experienced some form of
systemic financial crisis. Moreover, Kaminsky and Reinhart (1998) have found that in 18 of the 26 banking
crises studied, the financial sector had been liberalised during the preceding five years.
16 Due to missing data problems, we dropped three countries from the first possible sample of 12, namely
Uganda, Tanzania and Zimbabwe.
17 For brevity, the estimation and testing results for the cost and profit translog function and share equations are
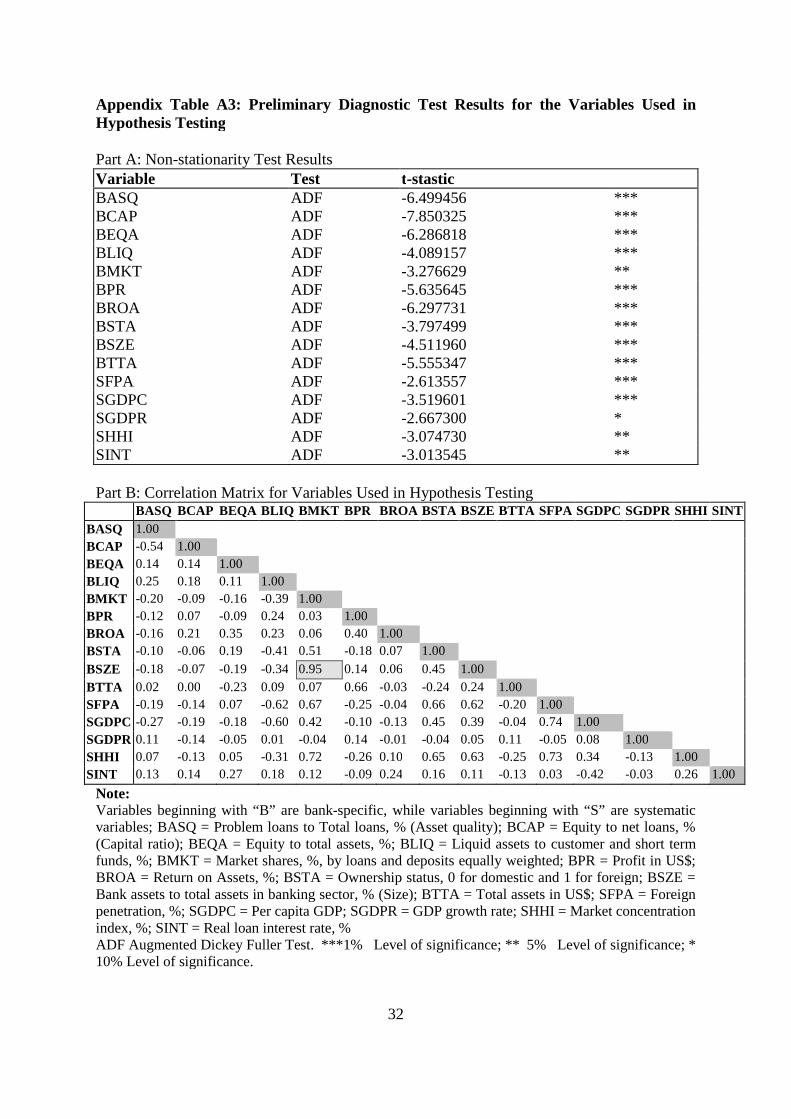
not reported here, but they are available from the authors. The diagnostic test results in Appendix Table A3 show
that each of the explanatory variables in the translog model is stationary on the basis of the Augmented Dickey-
Fuller (ADF) test.
18 This finding is consistent with earlier studies by Mester (1997), Berger and DeYoung (1997), and DeYoung
(1998), which indicate that inefficiency is exacerbated by bad loan problems.
23
References
Allen, L. and Rai, A. (1996) Operational efficiency in banking: an international comparison,
Journal of Banking and Finance, 20, pp. 655-672.
Altunbas, Y., Liu, M. H., Molyneux, P. and Seth, R. (2000) Risk and efficiency in Japanese
banking, Journal of Banking & Finance, 24, pp. 1605-1628.
Berger, A. N. (1995) The profit-structure relationship in banking: tests of market power and
efficient structure hypotheses, Journal of Money, Credit and Banking, 27, pp. 404-
431.
Berger, A. N. and DeYoung, R. (1997) Problem loans and cost efficiency in commercial
banks, Journal of Banking and Finance, 21, pp. 849-870.
Berger, A. N. and Hannan, T. H. (1989) The price concentration relationship in banking,
Review of Economics and Statistics, 71, pp. 291-299.
Berger, A. N. and Humphrey, B. C. (1997) Efficiency in financial institutions: International
survey and directions for future research, European Journal of Operational Research,
98, pp. 175-212.
Berger, A. N. and Mester, L. J. (1997) Inside the black box: What explains differences in the
efficiences of financial institutions?, Journal of Banking and Finance, 21, pp. 895-
947.
Berger, A. N., Hunter, W. C. and Timme, S. G. (1993) Efficiency in financial institutions: A
review and preview of research, past, present and the future, Journal of Banking and
Finance, 17, pp. 221-249.
Berger, A. N., Leusner, J. H. and Mingo, J. J. (1997) The efficiency of bank branches,
Journal of Monetary Economics, 40, pp. 141-162.
24
Brownbridge, M. (1998) Financial distress in local distress in local banks in Kenya, Nigeria,
Uganda and Zambia: Causes and implications for regulatory policy, Development
Policy Review, 16, pp. 173-188.
Brownbridge, M. and Harvey, C. (1998) Banking in Africa: the Impact of Financial Sector
Reform Since Independence (Oxford: James Currey).
DeYoung, R. (1998) Management quality and x-inefficiency in national banks, Journal of
Financial Services Research, 13, pp. 5-22.
Drake, L. (1992) Economies of scale and scope in UK building societies: An application of
the translog multi-product cost function, Applied Financial Economics, 2, pp. 211-
219.
Drake, L. (2003) Costs and efficiency in banking: A survey of the evidence from the US, the
UK and Japan, in: A. W. Mullineux and V. Murinde (Eds), Handbook of International
Banking (Cheltenham: Edward Elgar).
Fecher, F., Kessler, D., Perelman, S, and Pestieau, P. (1993) Productive performance of the
French insurance industry, Journal of Productivity Analysis, 4, pp. 77-93.
Goldberg, L. G. and Rai, A. (1996) The structure – performance relationship for European
banking, Journal of Banking and Finance, 20, pp. 745-771.
Greene, W. H. (1993) The econometric approach to efficiency analysis, in: H. O. Fried, C. A.
K. Lovell, and S. S. Schemidt (Eds) The Measurement of Productive Efficiency:
Techniques and Applications (Oxford: Oxford University Press).
Hermes, N., Lensink, R. and Murinde, V. (1998) The effect of financial liberalisation on
capital flight, World Development, 26, pp. 1349 – 1368.
Kaminsky, G. L. and Reinhart, C. M. (1998) The twin crises: The causes of banking and
balance of payments problems, International Finance Discussion Paper, No 544,
Board of Governors of the Federal Reserve System.
25
Lensink, R. and Murinde, V. (2006) Does foreign bank entry really stimulate gross domestic
investment? Applied Financial Economics, 16(8), pp. 569-582.
Lindgren, C. J., Garcia, G. and Saal, M. (1996) Bank Soundness and Macroeconomic Policy
(Washington DC: IMF).
Maimbo, S. M. (2002) Bank failures in Zambia, Development Policy Review, 20, pp. 261-
278.
Mehran, H., Ugolini, P., Brittaux, J. P., Iden, G., Lybell T., Swaray, S. and Hayward, P.
(1998) Financial sector developments in Sub-Saharan Africa, Occasional Paper No
169, IMF, Washington DC.
Mester, L. J. (1997) Measuring efficiency at US banks: Accounting for heterogeneity is
important, European Journal of Operational Research, 98, pp. 230-242.
Murinde, V. and Ryan, C. (2003) The implications of WTO and GATS for the banking sector
in Africa, The World Economy, 26, pp. 181-207.
Popiel, P. A. (1994) Financial systems in Sub-Sahara Africa: A comparative study’, World
Bank Discussion Paper No 260.
Sathye, M. (2001) X-efficiency in Australian banking: An empirical investigation, Journal of
Banking and Finance, 25, pp. 613-630.
Tefula, M. (2001) Evaluating the performance of commercial banks in Sub-Saharan Africa,
unpublished PhD thesis, University of Birmingham.
Williamson, J. and Maher, M. (1998) A Survey of Financial Liberalisation, Essays in
International Finance No 211, Princeton NJ, Department of Economics, Princeton
University.
Worthington, A. C. (1998) Efficiency in Australian building societies: An econometric cost
function approach using panel data, Applied Financial Economics, 8, pp. 459-467.
26
Table 1: Measurement of Empirical Variables
Panel A: Measurement of Variables for the Cost and Profit Translog EquationsDependent VariablesTC Total cost Operating + interest + personnel + overheads Profit Net profitIndependent VariablesQ1 Output 1 Total customer loans in US dollarsQ2 Output 2 Total other earning assetsQ3 Output 3 Commission income + fee income + trading income + other operating
income + non-operating income in US dollarsS1 Input 1: Labour, measured as number of employeesS2 Input 2: Capital, measured as total fixed assetsS3 Input 3: Total deposits + total other fundingP1 Input 1: price Total personnel expenses number of employeesP2 Input 2: price (Other admin expense + other operating expenses) total fixed assetsP3 Input 3: price Interest expenses the sum of total deposits and total other funding
Panel B: Measurement of Variables for Testing the Main HypothesesDependent VariablesPINEFFS Profit x-inefficiency based on the Stochastic Frontier ApproachCINEFFS Cost x-inefficiency based on the Stochastic Frontier ApproachIndependent VariablesSHHI Market concentration index, %, measured by the Herfindahl-Hirschman IndexBMKT Market shares, %, measured by loans and deposits equally weightedBASQ Asset quality, measured by problem loans to total loans, %BCAP Capital ratio, measured by the ratio of equity to net loans, %BEQA Capital ratio, alternatively measured by the ratio of equity to total assets, %BLIQ Liquidity, measured by the ratio of the bank’s liquid assets to customer and
short-term funds, %BPR Profitability, measured by profit in US DollarsBROA Profitability, alternatively measured by return on assets, %BSZE Bank size, given by the ratio of bank assets to total banking sector assets, %BTTA Bank size, alternatively measured by the bank’s total assets in US DollarsBSTA Ownership status, measured as 0 for domestic bank and 1 for foreign bankSFPA The degree of foreign penetration, measured as the ratio of the foreign banks’
assets to total banking sector assets, %SGDPC Average income of bank customers, measured by per capita GDPSGDPR Economic growth, measured by GDP growth rateSINT Average cost of loans adjusted for inflation, measured by the real loan rate, %
Notes: Variables beginning with “B” are bank-specific; while variables beginning with “S”are systematic.
27
Table 2: Empirical Measures of X-inefficiency for a Panel of Commercial Banks inAfrica
Part A: Descriptive Statistics for cost and profit x-inefficiency using DFA and SFAapproaches
DFACOST CINEFFS DFAPROFIT PINEFFSMean 20.25582 19.28643 33.46510 33.64627Median 20.47019 19.22322 34.29631 34.43725Standard Deviation 6.611879 6.508377 7.803044 7.701402Skewness 0.213978 0.214675 -0.876920 -0.903132Kurtosis 3.491629 3.633730 6.558330 6.695169Jarque-Bera 5.133561 7.080299 190.1635 204.4120Probability 0.076782 0.029009 0.000000 0.000000
Part B: Tests of Equality of Means for X-inefficiency MeasuresNull Hypothesis Statistic Value ProbabilityDFACOST=SFACOST Anova F-statistic 3.736 0.0537DFAPROFIT=SFAPROFIT Anova F-statistic 0.072 0.7879
Notes:DFACOST = Cost x-inefficiency based on the Distribution Free ApproachCINEFFS = Cost x-inefficiency based on the Stochastic Frontier ApproachDFAPROFIT = Profit x-inefficiency based on the Distribution Free ApproachPINEFFS = Profit x-inefficiency based on the Stochastic Frontier Approach
28
Table 3: Estimation and Testing Results for the Determinants of X-inefficiency
Dependent Variable PINEFFS CINEFFSDeterminant Coefficient t-Statistic Coefficient t-StatisticSHHI 0.089 1.644 0.109 1.680BASQ 0.523 6.651 0.428 4.745BCAP 0.018 2.164BEQA 0.106 3.656BSZE -0.422 -9.660 -0.277 -3.114BLIQ 0.104 1.917 0.232 1.952BPR 0.116 3.980SFPA -0.345 -15.800 -0.391 -12.756SINT 0.110 9.012 0.132 5.3132SGDPC 0.036 1.167 0.044 1.032C 0.362 4.054 0.225 6.007
R-squared 0.789 0.882Adjusted R-squared 0.736 0.851S.E. of regression 6.008 5.990Log likelihood -448.217 -443.342Durbin-Watson statistic 0.433 0.556Mean dependent variable 20.753 18.665S.D. dependent variable 11.305 9.351Akaike info criterion 6.527 4.788F-statistic 36.786 42.523Prob(F-statistic) 0.00000 0.0000
Notes:Endogenous variables:PINEFFS = profit x-inefficiency, is measured as SFAPROFIT (= Profit x-inefficiency basedon the Stochastic Frontier Approach). CINEFFS = Cost x-inefficiency based on theStochastic Frontier Approach.Determinants:Variables beginning with “B” are bank-specific, while variables beginning with “S” aresystematic variables; SHHI = Market concentration index, %; BASQ = Problem loans toTotal loans, % (Asset quality); BCAP = Equity to net loans, % (Capital ratio); BEQA =Equity to total assets, %; BSZE = Bank assets to total assets in banking sector, % (Size);BLIQ = Liquid assets to customer and short term funds, %; BPR = Profit in US$; SFPA =Foreign bank penetration, %; SINT = Real interest rate, % (lending); SGDPC = Per capitaGDP.
29
APPENDIX
APPENDIX TABLE A1: APPLICATIONS OF X-INEFFICIENCY ANALYSIS TO BANKS
Application Country Method Author (date)
Inform government policy:
Deregulation, financial disruption Norway DEA Berg et al. (1992)US DEA Elyasiani and Mehdian (1995)Japan DEA Fukuyama (1995)Spain TFA Lozano (1995)Turkey DEA Zaim (1995)US TFA Humphrey and Pulley (1997)Spain DEA Grifell-Tatje and Lovell (1997b)
Institution failure, US TFA Berger and Humphrey (1992a)risk, problem loans, US SFA Cebenoyan et al. (1993a)and management quality US DEA Barr et al. (1994)
US SFA Berger and De Young (1997)US SFA Mester (1996)US TFA De Young (1997c)
Market structure Norway TFA Berg and Kim (1994, 1996)and concentration US DEA Devaney and Weber (1995)
Spain SFA Maudos (1996b)US DFA Berger and Hannan (1997)
Mergers Norway DEA Berg (1992)US DFA Berger and Humphrey (1992b)US IN Fixler and Zieschang (1993)US TFA De Young (1997b)US DFA Peristiani (1997)
Address research issues:
Comparing different US DEA,SFA Ferrier and Lovell (1990)efficiency techniques Greece DEA,SFA Giokas (1991)or assumptions US SFA,DFA,TFA Bauer et al. (1993)
US DEA,SFA Eisenbeis et al. (1996)Spain SFA Maudos (1996a)US SFA Zhu et al. (1997)
Comparing different Norway DEA Berg et al. (1991)output measures Italy DEA Favero and Papi (1995)
US DFA Hunter and Timme (1995)Finland DEA Kuussaari and Vesala (1995)
Organizational form, US DEA Elyasiani and Mehdian (1992)corporate control issues US SFA Cebenoyan et al. (1993b)
30
US DEA Grabowski et al. (1993)US SFA Mester (1993)US DFA De Young and Nolle (1996)US TFA Mahajan et al. (1996)India DEA Bhattacharyya et al. (1997)US SFA,TFA Hasan and Hunter (forthcoming)
General level UK DEA Drake and Weyman-Jones (1992)of efficiency Tunisia SFA Chaffai (1993)
Japan DEA Fukuyama (1993)Switzerland DEA Sheldon and Haegler (1993)Denmark DEA Bukh (1994)US SFA Kaparakis et al. (1994)Spain DEA Perez and Quesada (1994)Germany TFA Lang and Welzel (1995)Italy DEA,SFA Resti (1995)Germany DFA Lang and Welzel (1996)US DEA Miller and Noulas (1996)
Intercountry comparisons 11 OECD SFA Fecher and Pestieau (1993)8 OECD DEA Pastor et al. (1997)Norway DEA Bukh et al. (1995)Sweden, Finland, Denmark15 OECD TFA Ruthenberg and Elias (1996)
Opportunity cost, US DEA Ferrier et al. (1993)output diversification France DFA Dietsch (1994)
France DFA Chaffai and Dietsch (1995)US TFA Clark (1996)
Profit, revenue US DFA Berger et al. (1993a)US DEA English et al. (1993)Spain TFA Lozano (1997)Spain DEA Grifell-Tatje and Lovell (1996)US SFA Ellinger et al. (1997)
Improve managerial performance:Bank branch Canada DEA Parkan (1987)
Turkey DEA Oral and Yolalan (1990)Greece DEA Vassiloglou and Giokas (1990)Saudi ArabiaDEA Al-Faraj et al. (1993)Belgium FDH Tulkens and Malnero (1994)UK DEA Athanassopoulos (1995)US DFA Berger et al. (1997)Cyprus DEA Zenios et al. (1996)UK DEA Athanassopoulos (1997)Canada DEA Schaffnit et al. (1997)UK DEA Drake and Howcroft (1997)
Note: References are incomplete; a full list is obtainable from the authors.
31
.Appendix Table A2: The Sample of Commercial Banks in Africa
Country Number of Banks Data Availability
Botswana 5 1990-2000Ghana 9 1992-1999Kenya 22 1990-1999Lesotho 2 1992-1999Malawi 3 1992-1999Namibia 5 1992-1999Nigeria 35 1990-2000Swaziland 4 1990-1999Zambia 4 1990-1999
Total banks 89 Sample Period 1992-1999
32
Appendix Table A3: Preliminary Diagnostic Test Results for the Variables Used inHypothesis Testing
Part A: Non-stationarity Test ResultsVariable Test t-stasticBASQ ADF -6.499456 ***BCAP ADF -7.850325 ***BEQA ADF -6.286818 ***BLIQ ADF -4.089157 ***BMKT ADF -3.276629 **BPR ADF -5.635645 ***BROA ADF -6.297731 ***BSTA ADF -3.797499 ***BSZE ADF -4.511960 ***BTTA ADF -5.555347 ***SFPA ADF -2.613557 ***SGDPC ADF -3.519601 ***SGDPR ADF -2.667300 *SHHI ADF -3.074730 **SINT ADF -3.013545 **
Part B: Correlation Matrix for Variables Used in Hypothesis TestingBASQ BCAP BEQA BLIQ BMKT BPR BROA BSTA BSZE BTTA SFPA SGDPC SGDPR SHHI SINT
BASQ 1.00
BCAP -0.54 1.00
BEQA 0.14 0.14 1.00
BLIQ 0.25 0.18 0.11 1.00
BMKT -0.20 -0.09 -0.16 -0.39 1.00
BPR -0.12 0.07 -0.09 0.24 0.03 1.00
BROA -0.16 0.21 0.35 0.23 0.06 0.40 1.00
BSTA -0.10 -0.06 0.19 -0.41 0.51 -0.18 0.07 1.00
BSZE -0.18 -0.07 -0.19 -0.34 0.95 0.14 0.06 0.45 1.00
BTTA 0.02 0.00 -0.23 0.09 0.07 0.66 -0.03 -0.24 0.24 1.00
SFPA -0.19 -0.14 0.07 -0.62 0.67 -0.25 -0.04 0.66 0.62 -0.20 1.00
SGDPC -0.27 -0.19 -0.18 -0.60 0.42 -0.10 -0.13 0.45 0.39 -0.04 0.74 1.00
SGDPR 0.11 -0.14 -0.05 0.01 -0.04 0.14 -0.01 -0.04 0.05 0.11 -0.05 0.08 1.00
SHHI 0.07 -0.13 0.05 -0.31 0.72 -0.26 0.10 0.65 0.63 -0.25 0.73 0.34 -0.13 1.00
SINT 0.13 0.14 0.27 0.18 0.12 -0.09 0.24 0.16 0.11 -0.13 0.03 -0.42 -0.03 0.26 1.00
Note:Variables beginning with “B” are bank-specific, while variables beginning with “S” are systematicvariables; BASQ = Problem loans to Total loans, % (Asset quality); BCAP = Equity to net loans, %(Capital ratio); BEQA = Equity to total assets, %; BLIQ = Liquid assets to customer and short termfunds, %; BMKT = Market shares, %, by loans and deposits equally weighted; BPR = Profit in US$;BROA = Return on Assets, %; BSTA = Ownership status, 0 for domestic and 1 for foreign; BSZE =Bank assets to total assets in banking sector, % (Size); BTTA = Total assets in US$; SFPA = Foreignpenetration, %; SGDPC = Per capita GDP; SGDPR = GDP growth rate; SHHI = Market concentrationindex, %; SINT = Real loan interest rate, %ADF Augmented Dickey Fuller Test. ***1% Level of significance; ** 5% Level of significance; *10% Level of significance.