Embed Size (px)
Citation preview
The Meaning of Spatial ThinkingThe Meaning of Spatial Thinking
Michael F. GoodchildUniversity of California
Santa Barbara
OutlineOutline
Spatial cognitionExamplesGIS representationsEmpirical laws of geographic informationBasic conceptsImplications for teaching
Spatial thinkingSpatial thinking
Spatial cognition– how we think about the world around us
Spatial reasoning– how we come to conclusions
Knowledge discovery– space in support of science
Spatial cognitionSpatial cognition
Fundamental ideas about how spatial skills develop– early childhood, Piaget– objects
• object permanence– containment
• Ontario is in Canada
Wayfinding skillsWayfinding skills
Landmark knowledge– a list of places– no spatial relationships
• no adjacency• "if this is Tuesday it must be Belgium"
– no spatial context• "how long is this flight?"
– no intervening places
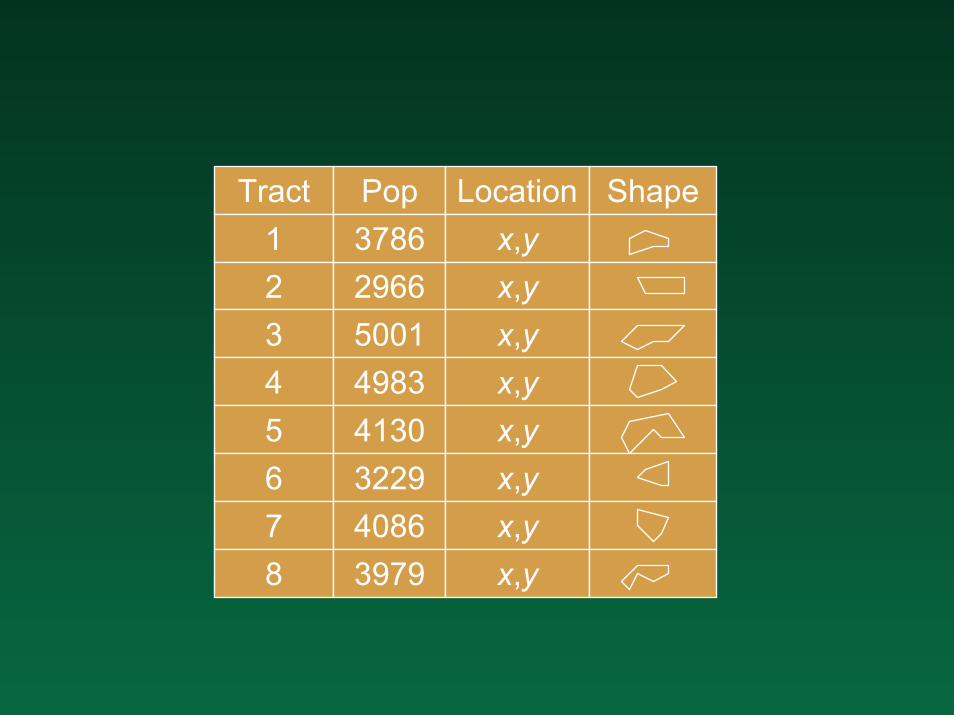
Tract12345678
Pop
2966500149834130322940863979
3786Location
x,yx,yx,yx,yx,yx,yx,yx,y
Shape
Route knowledgeRoute knowledge
Sequences of intervening places– no ability to short-cut– no directions, distances– context along the route but not off

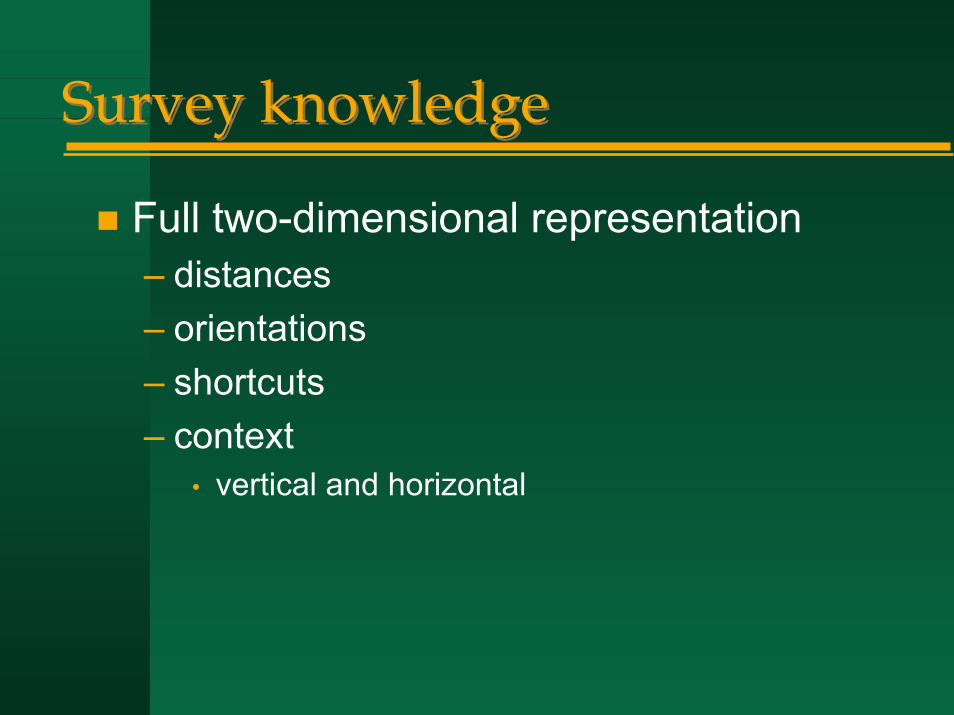
Survey knowledgeSurvey knowledge
Full two-dimensional representation– distances– orientations– shortcuts– context
• vertical and horizontal
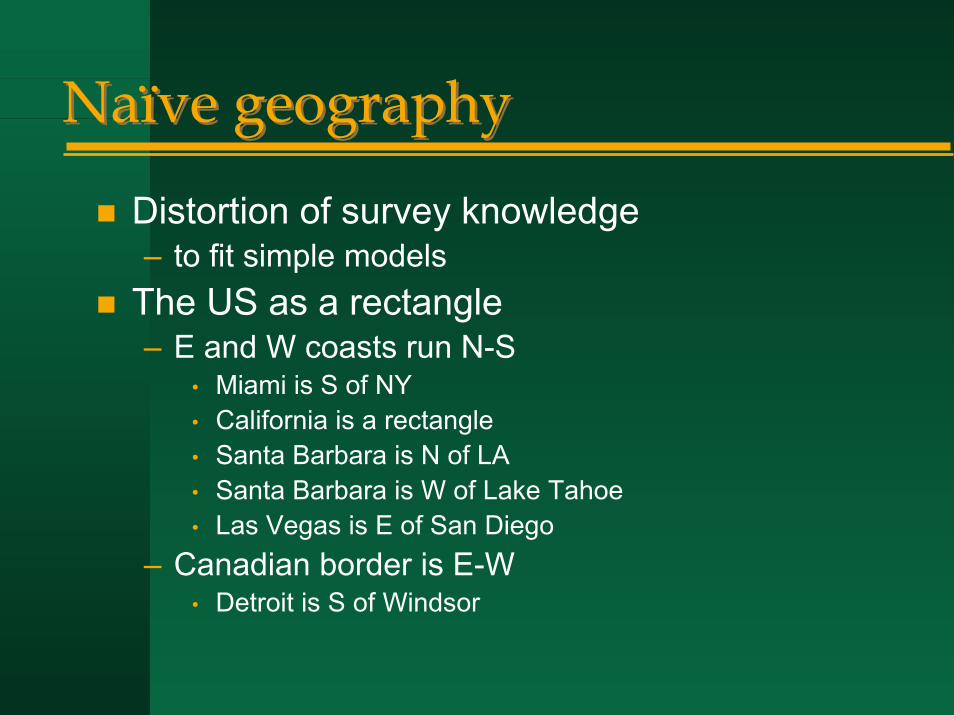
Naïve geographyNaïve geography
Distortion of survey knowledge– to fit simple models
The US as a rectangle– E and W coasts run N-S
• Miami is S of NY• California is a rectangle• Santa Barbara is N of LA• Santa Barbara is W of Lake Tahoe• Las Vegas is E of San Diego
– Canadian border is E-W• Detroit is S of Windsor
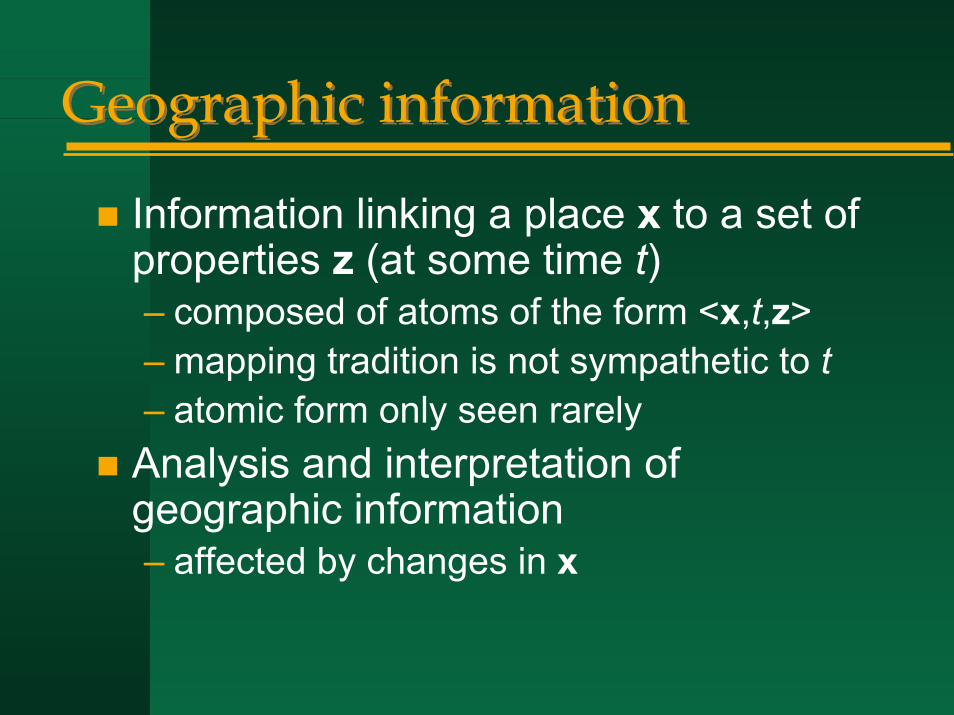
Geographic informationGeographic information
Information linking a place x to a set of properties z (at some time t)– composed of atoms of the form <x,t,z>– mapping tradition is not sympathetic to t– atomic form only seen rarely
Analysis and interpretation of geographic information– affected by changes in x
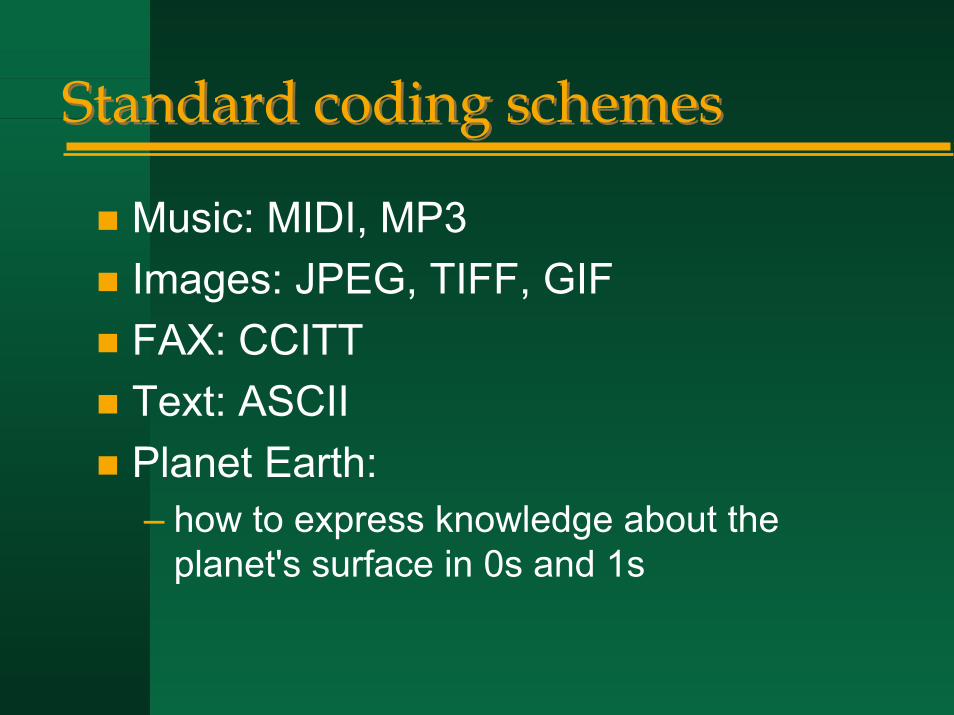
Standard coding schemesStandard coding schemes
Music: MIDI, MP3Images: JPEG, TIFF, GIFFAX: CCITTText: ASCIIPlanet Earth:– how to express knowledge about the
planet's surface in 0s and 1s

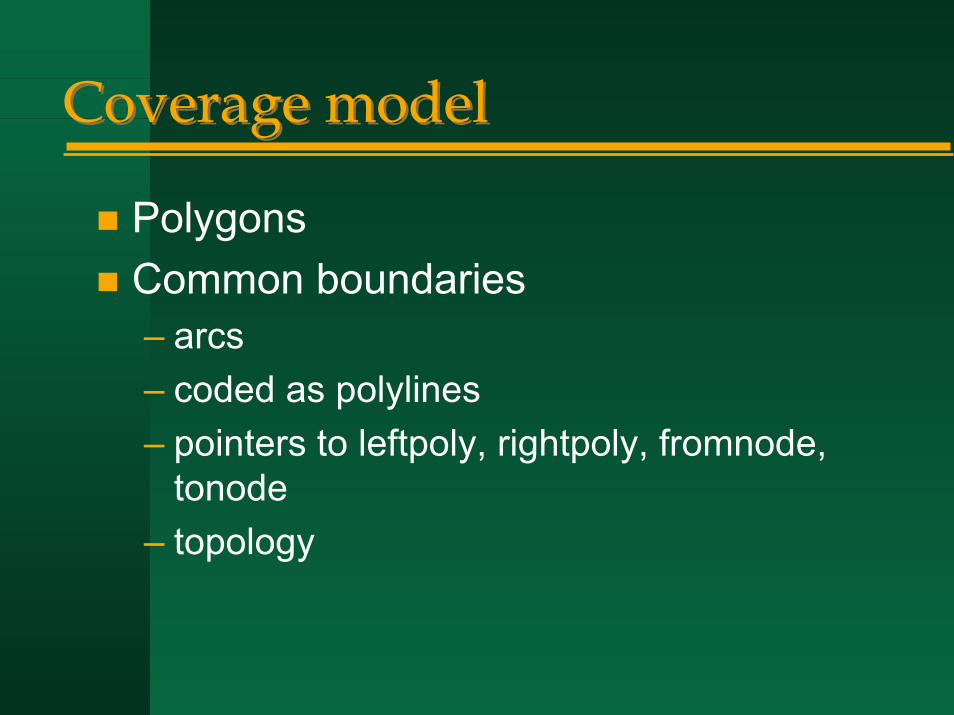
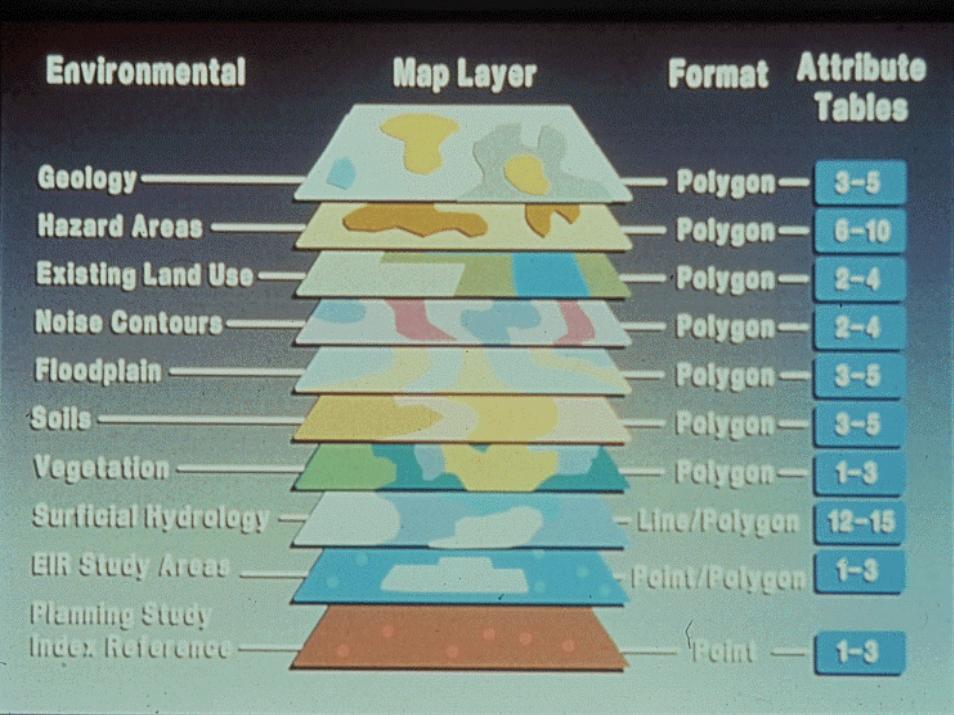
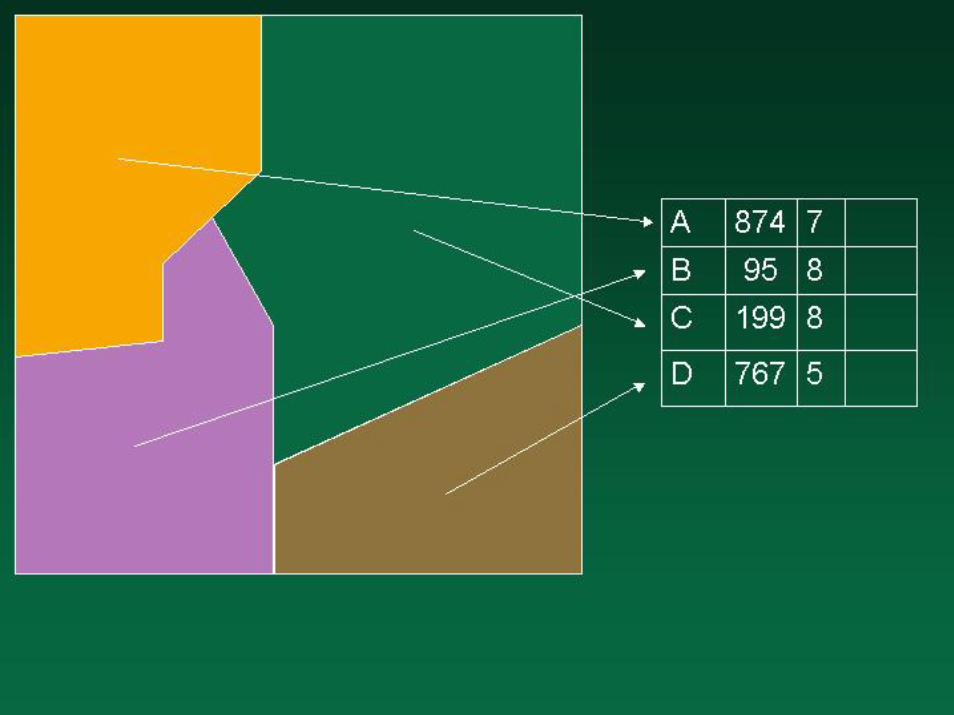
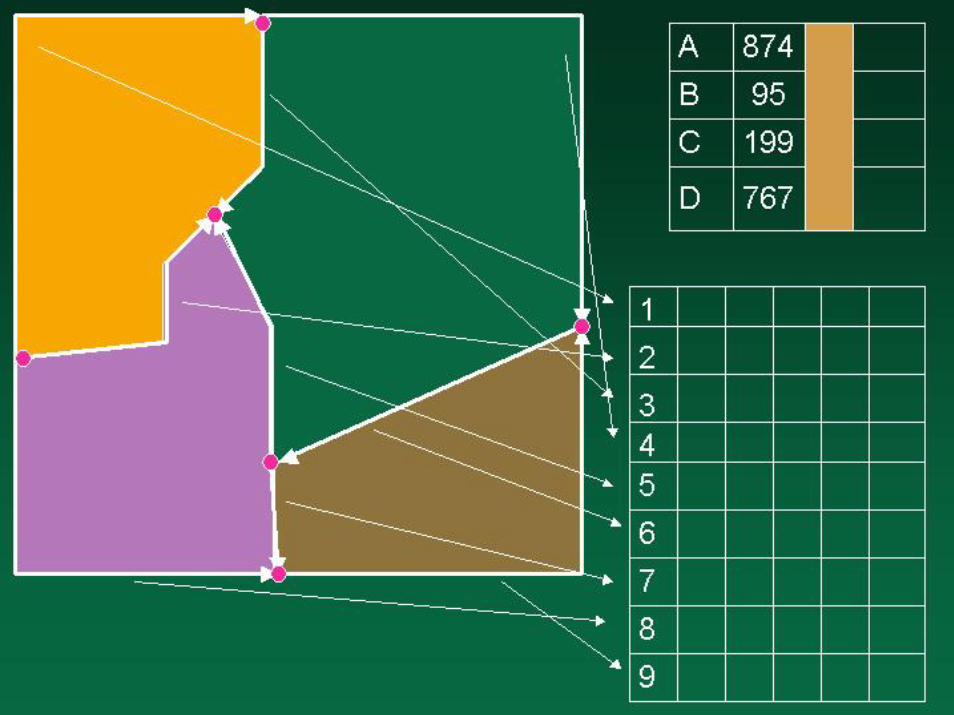
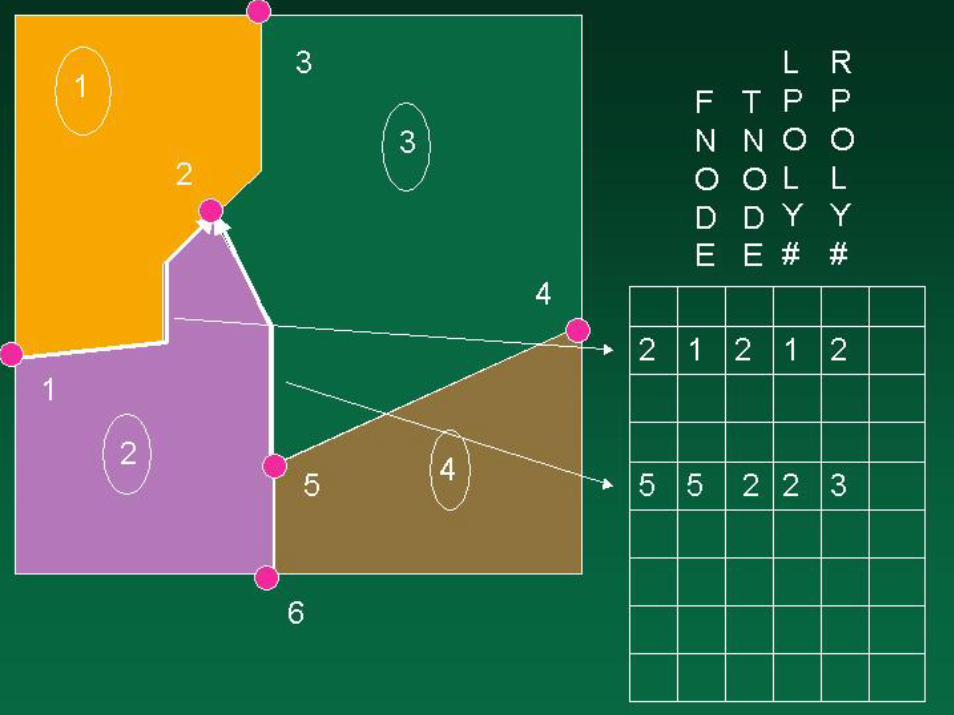
Coverage modelCoverage model
PolygonsCommon boundaries– arcs– coded as polylines– pointers to leftpoly, rightpoly, fromnode,
tonode– topology
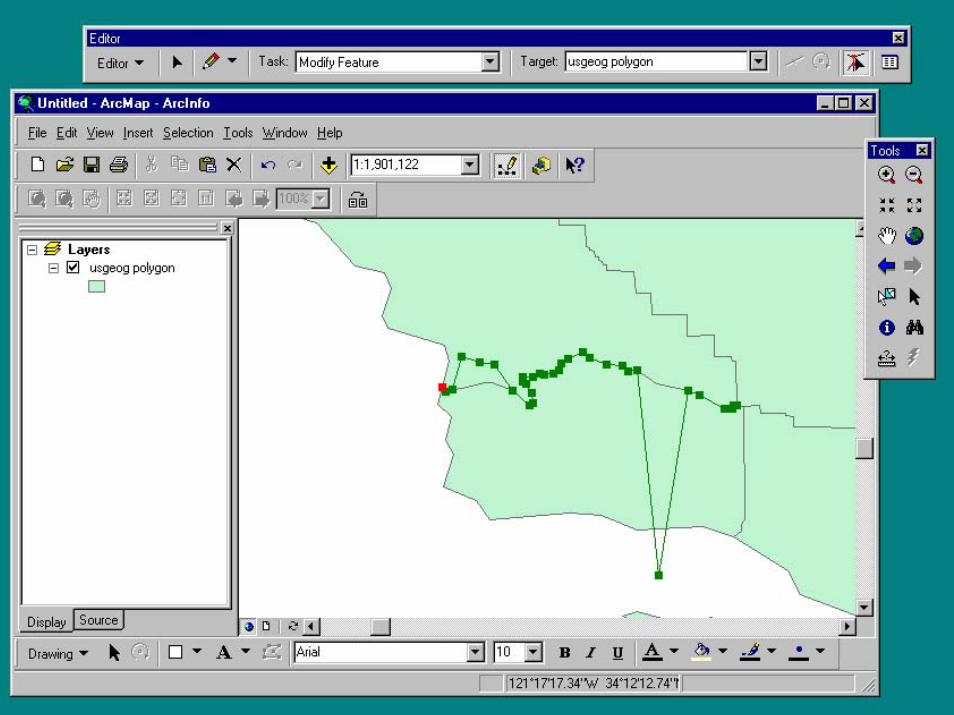
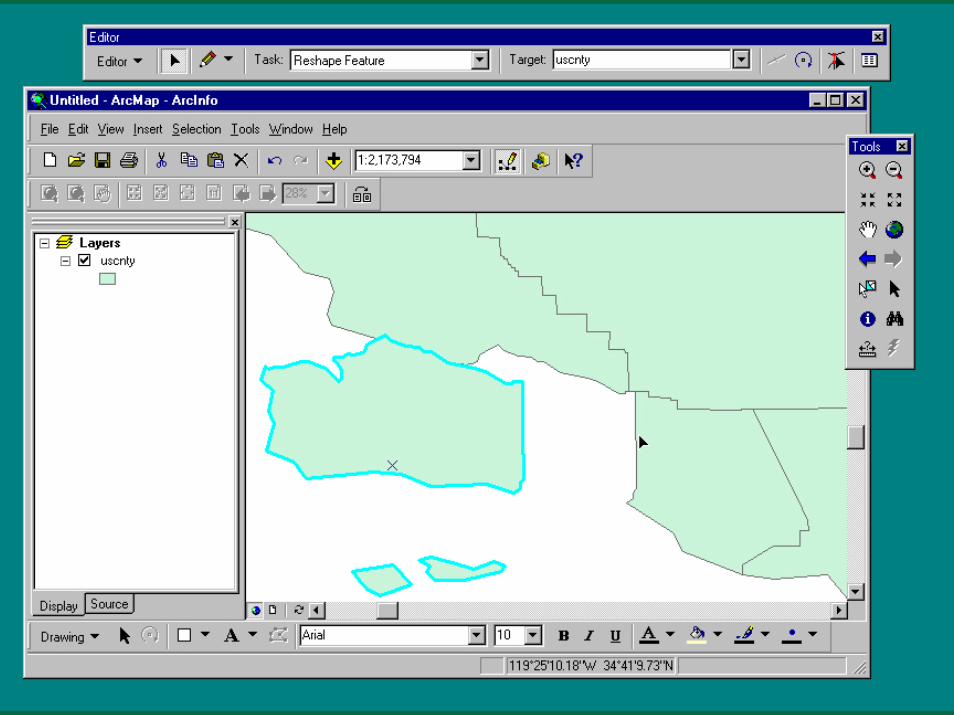
ShapefilesShapefiles
A data set is a collection of all points, all lines, or all areas– lines as polylines– areas as polygons
The features in a data set have associated attributes– stored in a table
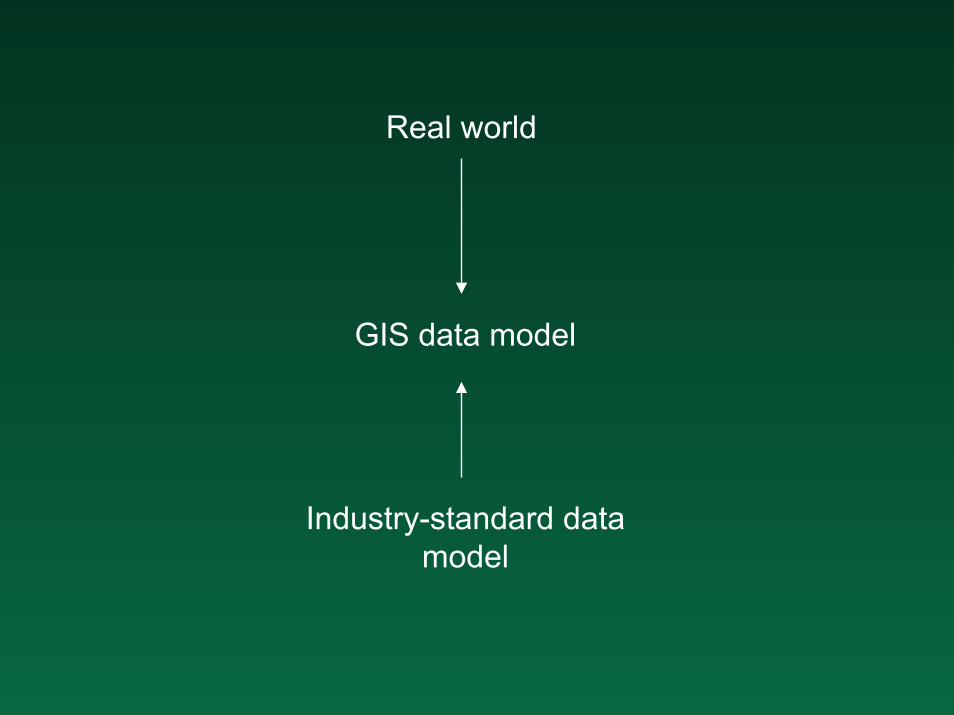
Real world
GIS data model
Industry-standard data model
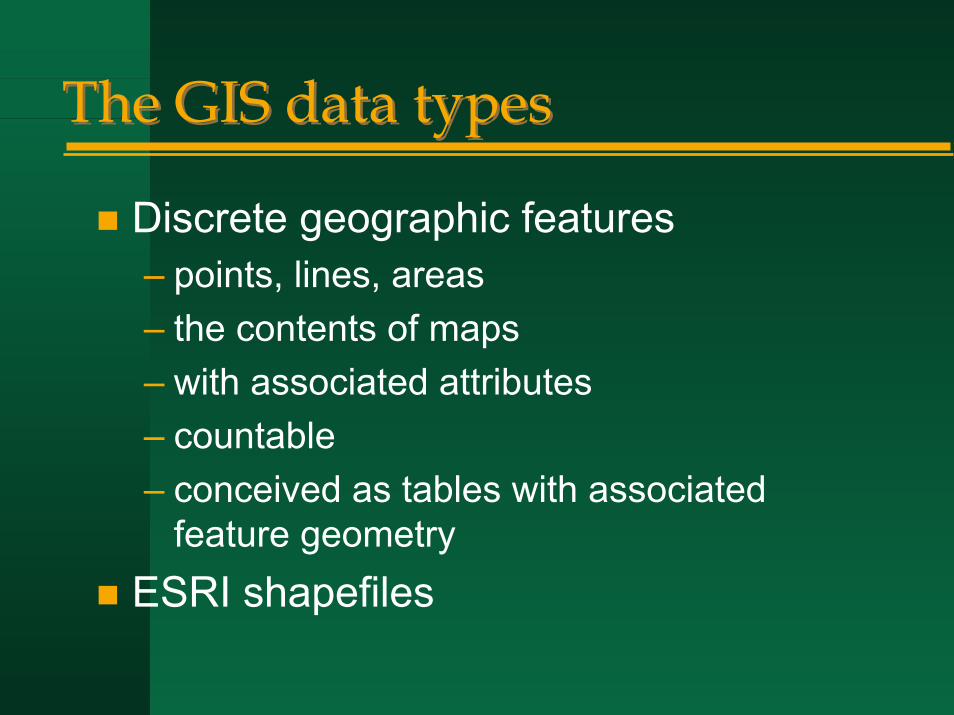
The GIS data typesThe GIS data types
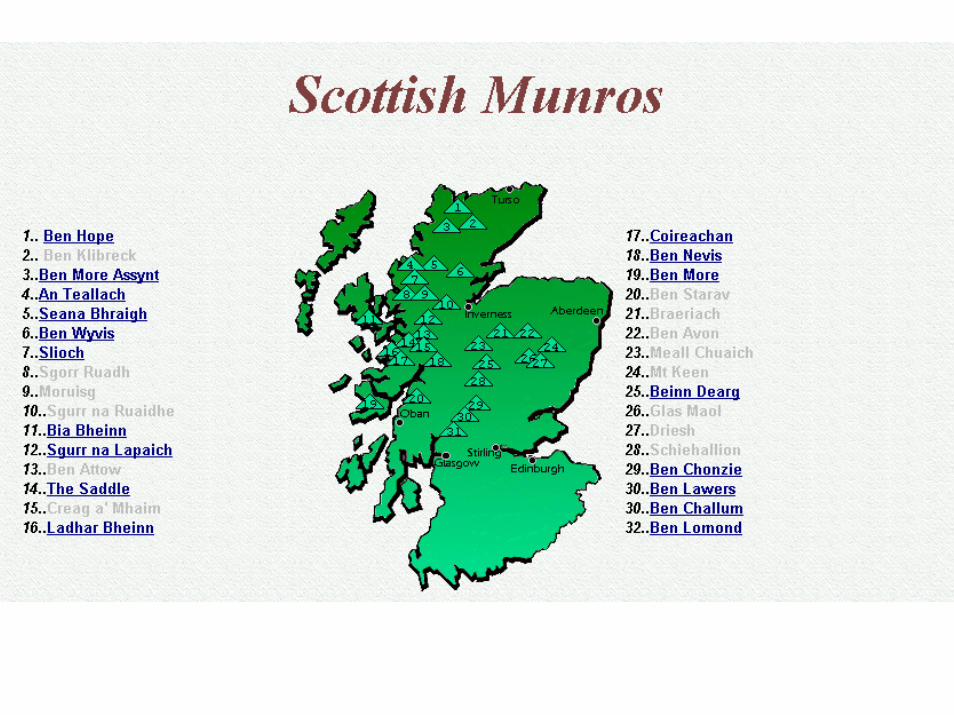
Discrete geographic features– points, lines, areas– the contents of maps– with associated attributes– countable– conceived as tables with associated
feature geometryESRI shapefiles

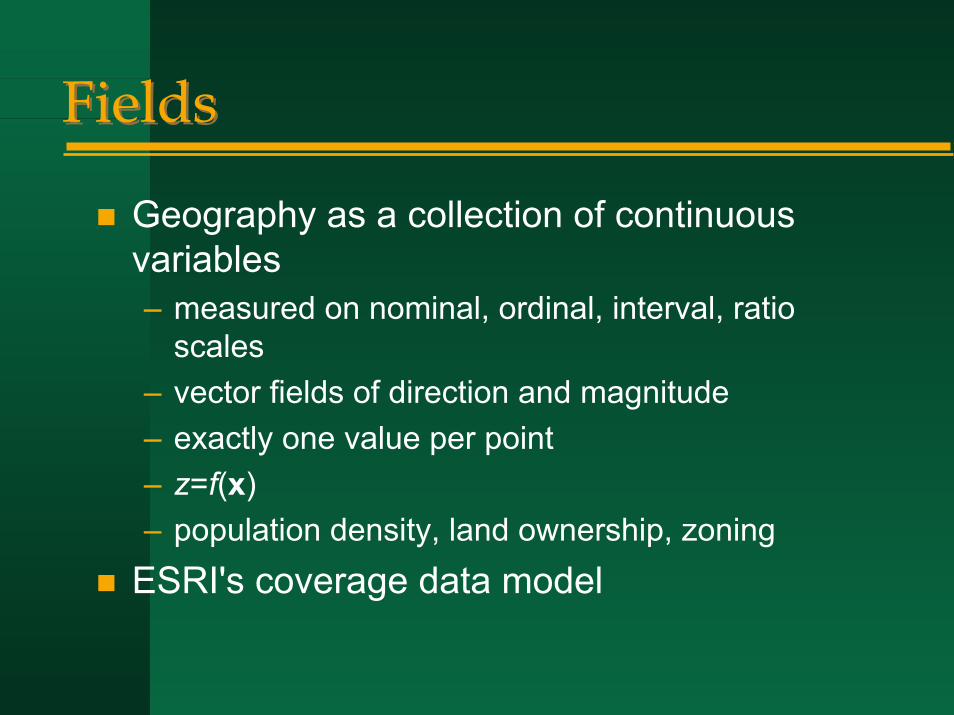
FieldsFields
Geography as a collection of continuous variables– measured on nominal, ordinal, interval, ratio
scales– vector fields of direction and magnitude– exactly one value per point– z=f(x)– population density, land ownership, zoning
ESRI's coverage data model
What can we say about geographic information?What can we say about geographic information?
Does it have general properties?– What's special about spatial?
Design principles for GIS
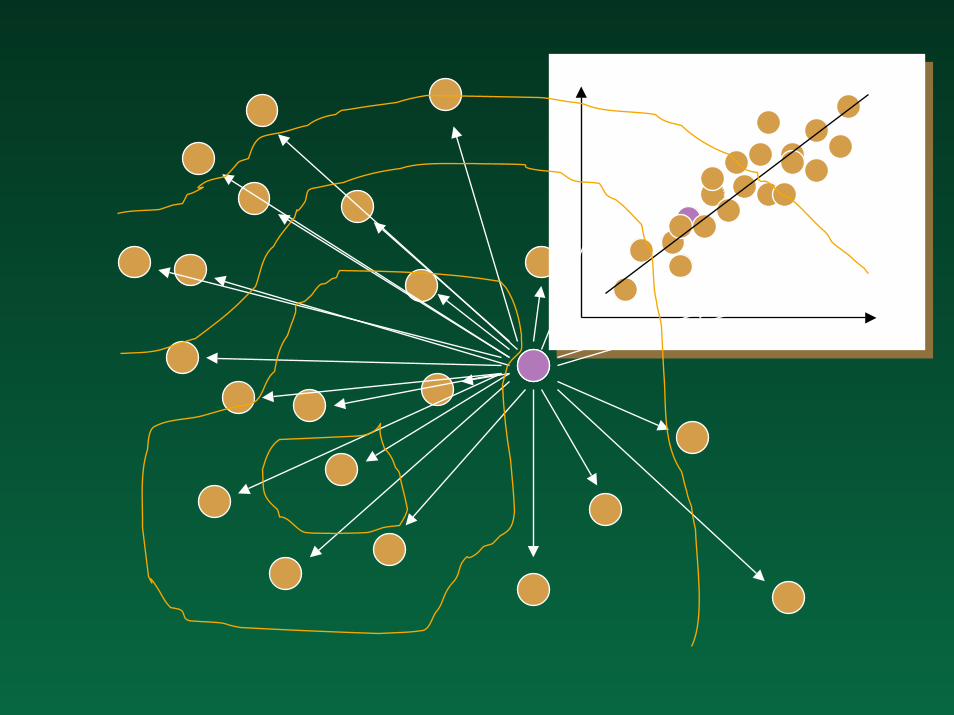
Tobler’s First LawTobler’s First Law
“All things are related, but nearby things are more related than distant things”– W.R. Tobler, 1970. A computer movie
simulating urban growth in the Detroit region. Economic Geography 46: 234-240
– implies process as much as form– “nearby things are more similar than
distant things”
ValidityValidity
“Nearby things are less similar than distant things”– negative spatial autocorrelation– possible at certain scales
• the checkerboard• retailing
– but negative a/c at one scale requires positive a/c at other scales
– smoothing processes dominate sharpening processes
FormalizationFormalization
Geostatistics– variogram, covariogram– measuring how similarity decreases with
distance– parameters vary by phenomenon
• does this make TFL less of a law?
UtilityUtility
Representation– GI is reducible to statements of the form
<x,z>– the atomic form of GI is unmanageable,
encountered only in point samples– all other GI data models assume TFL
Spatial interpolation– IDW and Kriging implement TFL
If TFL weren’t trueIf TFL weren’t true
GIS would be impossible– a point sample is useful only with
interpolationLife would be impossible
Expanding the horizonsExpanding the horizons
Other spaces– are there spaces for which TFL is not true?– digits of π– genome
Other laws of GIScience
Candidate lawsCandidate laws
All important places are at the corners of four map sheetsMontello and Fabrikant, “The First Law of Cognitive Geography”– “People think closer things are more
similar”
A second (first) lawA second (first) law
TFL describes a second-order effect– properties of places taken two at a time– a law of spatial dependence– is there a law of places taken one at a
time?Spatial heterogeneity– non-stationarity– uncontrolled variance
Corollaries of the second lawCorollaries of the second law
There is no average place on the Earth’s surfaceSampling is problematic– one must visit or map all of it to understand its full
complexityResults depend explicitly on the bounds of the studyThe Noah effect– there is a finite probability of an event of any
magnitude– to observe an event of a given magnitude it is
simply necessary to wait long enough
A GIScientist’s Noah effectA GIScientist’s Noah effect
The Eden effect– El Dorado– to find a feature of any magnitude it is sufficient to
look far enough• but unlike time, the Earth’s surface is limited
The Pareto distribution or rank-size rule– plot log rank against log size– a model of the extreme upper tail of distributions– fits well to the world’s largest:
• cities by population• lakes by area
– but not mountains by elevation
Practical implications of the second lawPractical implications of the second law
A state is not a sample of the nation– a country is not a sample of the world
Classification schemes will differ when devised by local jurisdictionsFigures of the Earth will differ when devised by local surveying agenciesGlobal standards will always compete with local standards
Implications for analysisImplications for analysis
Strong argument for place-based analysis, local statistics, geographically weighted regression– a middle ground in the
nomothetic/idiographic debate
Possible corollary of the heterogeneity lawPossible corollary of the heterogeneity law
For every conceivable pattern in two (three) dimensions there exists an instance on the Earth's surface– for every GIS algorithm/indexing scheme/data
model there exists a data set for which that algorithm/indexing scheme/data model is optimal
– "There are more things in Heaven and earth, Horatio, than are dealt with in your philosophy"
ScaleScale
A fundamental property of any geographic representation– defining what is included, what is left out
• 1:24,000• 1:100,000• 1:2,000,000
Two characteristics:– spatial resolution– spatial extent
Conflict over "large" and "small"
Scale and zScale and z
Many properties are scale-dependent– slope– land cover class– soil class– travel behavior
• daily• annual• lifetime
What does scale mean for digital data?
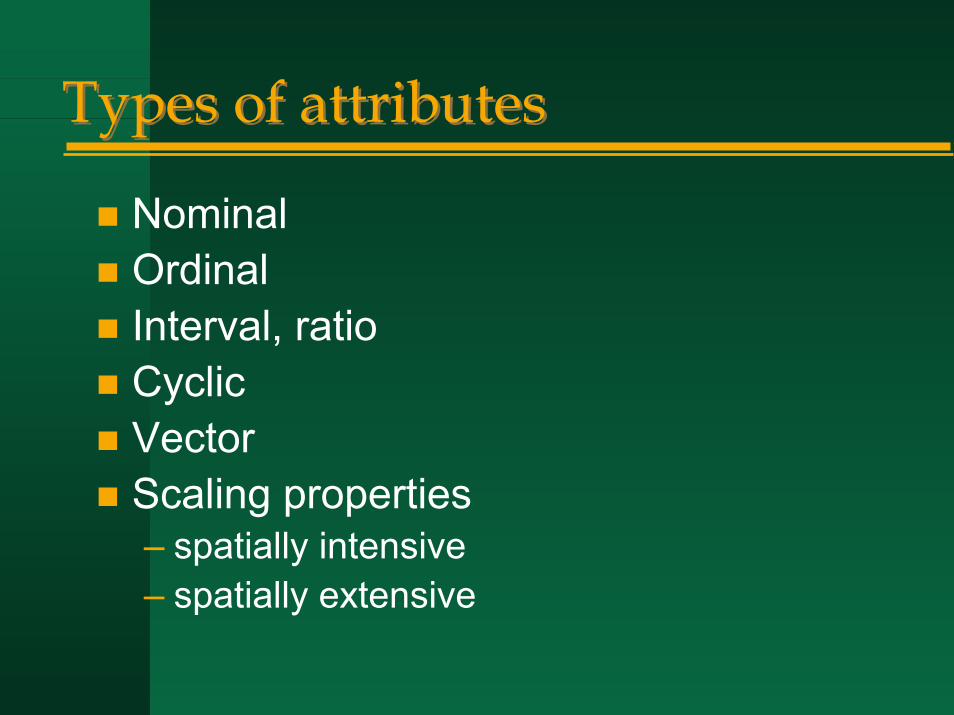
Types of attributesTypes of attributes
NominalOrdinalInterval, ratioCyclicVectorScaling properties– spatially intensive– spatially extensive
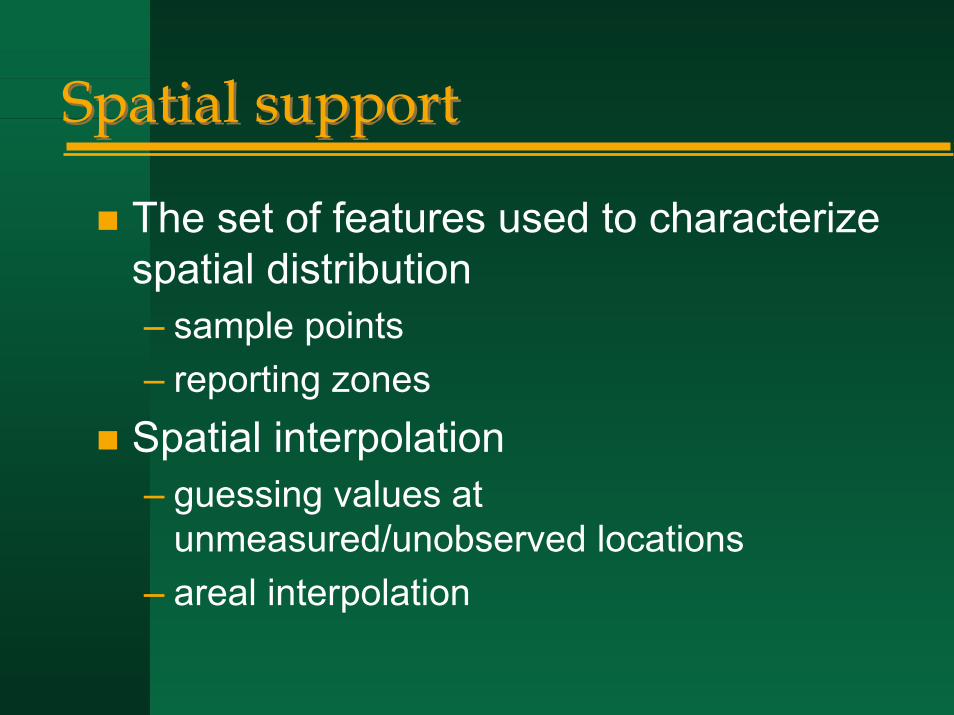
Spatial supportSpatial support
The set of features used to characterize spatial distribution– sample points– reporting zones
Spatial interpolation– guessing values at
unmeasured/unobserved locations– areal interpolation
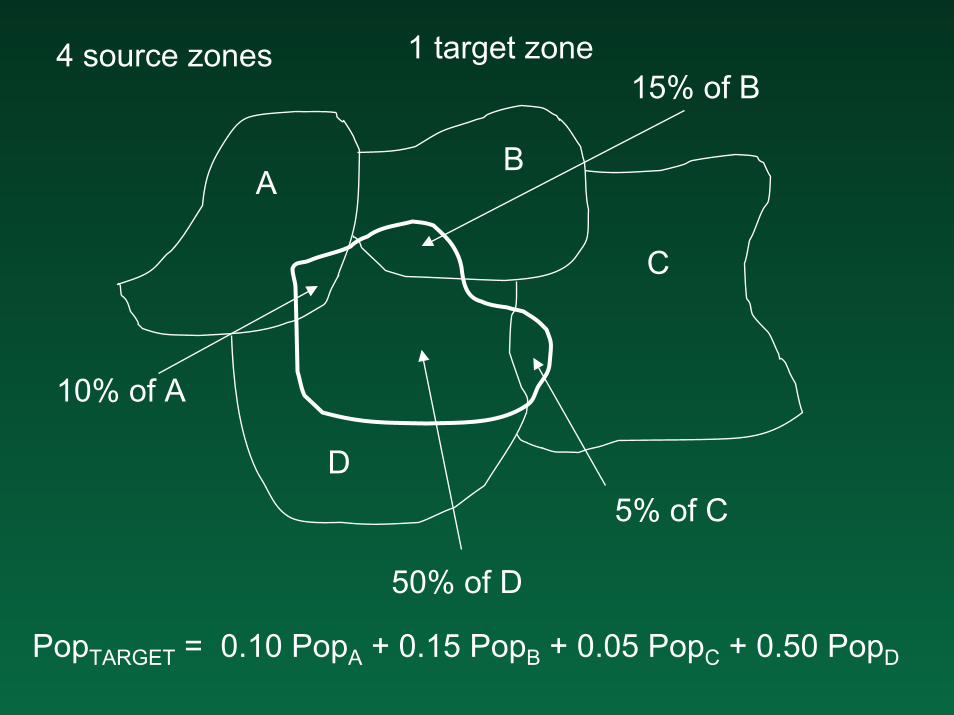
1 target zone4 source zones
AB
C
D
10% of A
15% of B
5% of C
50% of D
PopTARGET = 0.10 PopA + 0.15 PopB + 0.05 PopC + 0.50 PopD
Reasoning across support and scaleReasoning across support and scale
The ecological fallacy– reasoning from aggregate to individual– Gary King
The Modifiable Areal Unit Problem– reasoning across alternative support– an artifact of incomplete problem
conceptualization
SummarySummary
Spatial thinking is powerful– providing context– support for knowledge discovery
Geographic information is a unique information typeIts representation in digital form involves many options– the GIS data models
It has general properties– that are useful in system design
GIS education: past, present, futureGIS education: past, present, future
Thirty years of evolution– my own teaching
Continuing issuesA plan for the future
GIS education in 1974GIS education in 1974
Fragmented– cartography, remote sensing, geographical
analysis, planning– Tomlinson’s conferences (1970, 1972)– Harvard workshops (1967)– nobody talked about teaching
Government systems– Canada Geographic Information System– Census Bureau and DIME
University labs in 1974University labs in 1974
Harvard Laboratory for Computer Graphics and Spatial Analysis– SYMAP, CALFORM, SYMVU– William Warntz and theoretical geography
Experimental Cartography Unit in London
What to teach?What to teach?
No software– home-made– not integrated– Harvard lab– no COTS
No principlesNo applicationsNo text
Geography 300Geography 300
University of Western Ontario, 1975– Ross Newkirk
Texts:– Bruce MacDougall, Computer Programming for
Spatial Problems (1976)– Richard Baxter, Computer and Statistical
Techniques for Planners (1976)– John Davis and Michael McCullagh, Display and
Analysis of Spatial Data (1975)Software:– PlusX, Surface II, SYMAP, CALFORM
Principles circa 1975Principles circa 1975
Algorithms– point in polygon
Data structures– arcs and nodes
AccuracyAnalysis– overlay– location-allocation– political districting– spatial interpolation– corridor location
Significant milestonesSignificant milestones
Research community– Topological data structures conference, Boston,
1977COTS software– 1982
Peter Burrough’s text Principles of Geographical Information Systems– 1985
NCGIA Core Curriculum– 1989– http://www.ncgia.ucsb.edu, Education, Core
Curricula
The three-course sequence (UCSB)The three-course sequence (UCSB)
176A: Introduction to GIS– Keith Clarke, Getting Started with GIS
176B: Technical Issues in GIS– Mike Goodchild, Geographic Information
Systems and Science176C: Application Issues in GIS– Student projects

GIS education todayGIS education today
TextbooksCourses and programs in thousands of institutionsDistance learning– Virtual Campus, UNIGIS, Penn State, University of London– Intergraph's Online Education Training Program
• http://imgs.intergraph.com/training/online.asp
University Consortium for Geographic Information ScienceAlternative COTS solutions
Consensus on the principlesConsensus on the principles
RepresentationData modelsData structuresAlgorithmsVisualizationAnalysisUncertaintyMetadataData sharing
Projections and coordinate systemsGeodesyGIS design and implementationData managementSpatial decision supportDynamic modelingUser interfaces
Teaching more of...Teaching more of...
Database design and management– relational– object-oriented– CASE tools
Internet services– metadata– GIServices– location-based services, field GIS
Social context– privacy, surveillance– costs and benefits
Teaching less of...Teaching less of...
AlgorithmsAnalysisProgrammingOperating systems
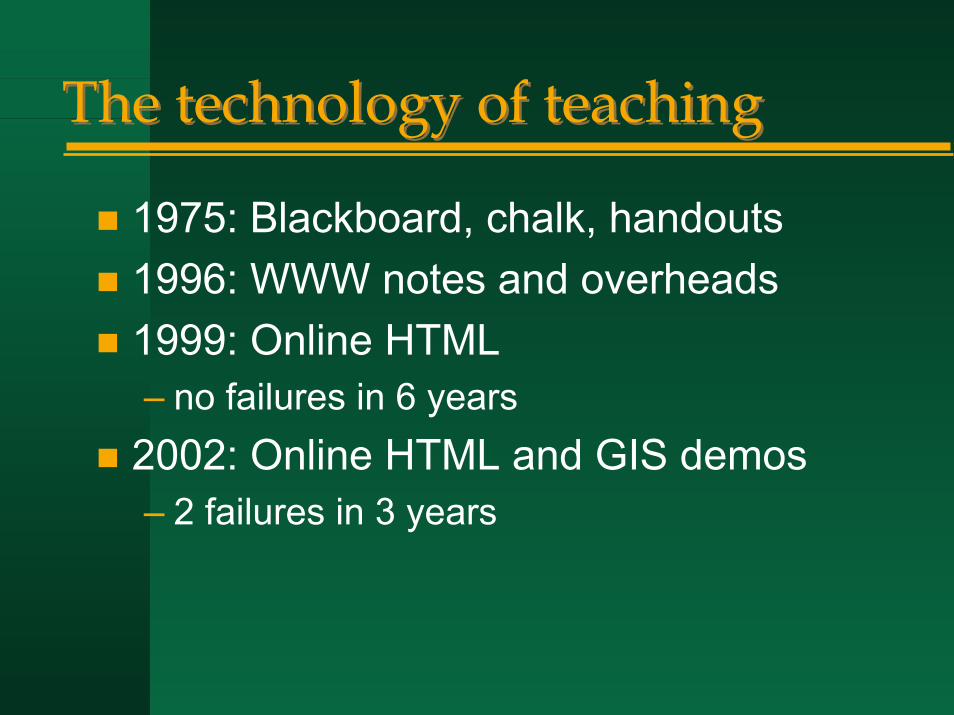
The technology of teachingThe technology of teaching
1975: Blackboard, chalk, handouts1996: WWW notes and overheads1999: Online HTML– no failures in 6 years
2002: Online HTML and GIS demos– 2 failures in 3 years
OnlineOnline
http://www.geog.ucsb.edu, Faculty,GoodchildLinked lab exercises
Continuing issuesContinuing issues
Balance of pedagogic style– lecture or hands-on lab?– adaptation to individual learning style
Balance of training and education– education in the persistent principles– training in today’s technology
Balance of computer science and geography– focus on computers– focus on the real world and its digital
representation
Continuing issues (2)Continuing issues (2)
GIS transparent or black box?– doing it by hand first– understanding what happens inside– educating the skeptical user– demanding better from the vendor– the rules of scientific reporting
Education for the workplace or for research?
Where next?Where next?
From geographic to spatial– geographic, spatial, geospatial– geographic data, spatial analysis
The importance of spatial thinking– in all sciences– in life– a picture is worth a thousand words– spatial information is more easily comprehended
Generalizing to spatialGeneralizing to spatial
Astronomy– information about the cosmos
Bioinformatics– the human genome– “BLACKSBURG, VA -- The merits of linking two
fields seemingly as disparate as geographic information systems (GIS) and bioinformaticsmight not seem obvious, but Virginia Tech's recent symposium linking the two and its roster of renowned participants from both fields raised expectations as well as eyebrows in national technology circles.” (June, 2001)
From geography to STEMFrom geography to STEM
Traditional support for geographic research– expanded to resource management,
geology, criminology, history, ecology, ...What about all of science, technology, engineering, math (STEM) education?
GIS as key to STEM educationGIS as key to STEM education
Student-centered learningMotivationa pathway to teachingSpatial thinkingvisualization and communication important in all
sciencesPrinciples of the scientific methodWorkplace skillsIntegration of technology in science and math educationGIS for good citizenship
Vertical integrationVertical integration
Upper division undergraduateLower division, 2-year collegeK-12Non-traditional learnersWhat to teach when?– tied development of conceptual and cognitive
skillsCurrent National Research Council study Support for Thinking Spatially: GIScience in the K-12 Curriculum
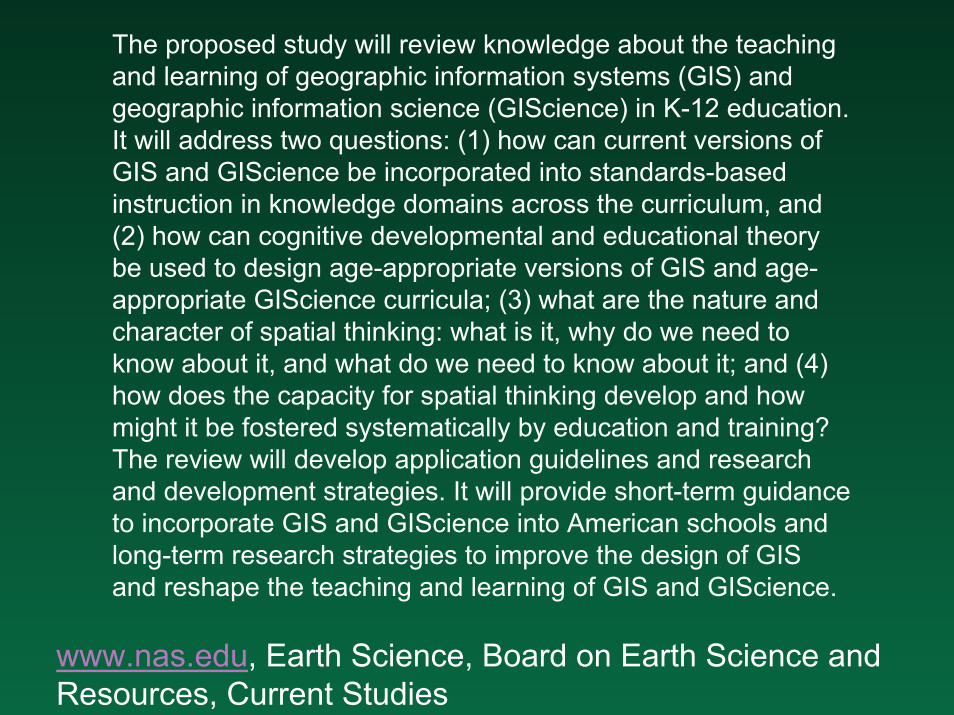
The proposed study will review knowledge about the teaching and learning of geographic information systems (GIS) and geographic information science (GIScience) in K-12 education. It will address two questions: (1) how can current versions of GIS and GIScience be incorporated into standards-based instruction in knowledge domains across the curriculum, and (2) how can cognitive developmental and educational theory be used to design age-appropriate versions of GIS and age-appropriate GIScience curricula; (3) what are the nature and character of spatial thinking: what is it, why do we need to know about it, and what do we need to know about it; and (4) how does the capacity for spatial thinking develop and how might it be fostered systematically by education and training? The review will develop application guidelines and research and development strategies. It will provide short-term guidance to incorporate GIS and GIScience into American schools and long-term research strategies to improve the design of GIS and reshape the teaching and learning of GIS and GIScience.
www.nas.edu, Earth Science, Board on Earth Science and Resources, Current Studies
A GIS for thinking spatially A GIS for thinking spatially
Capacity to:– Spatialize data sets– Visualize– Perform transformations and analysis
Design criteriaDesign criteria
Supportive of enquiry processEducationally appropriateAccessible to all learnersQuick to learn and useLearning across disciplinesRange of contextsCustomizableRobust and realistic
Child of 10 or concert pianist?Child of 10 or concert pianist?
Conventions that complicate– scale– projections– language– TLAs
• DEM, DOQ, DLG, DRG, DCW, DTM…
GIS adoptionGIS adoption
Approaching 100% in universities and collegesEarly adopters in K-12– teachers, schools, districts
Moving GIS beyond the early adopters– disadvantaged areas– learners with disabilities– gender issues
Infrastructure for GIS educatorsInfrastructure for GIS educators
Physical meetings– national or regional
Web resources– software, data, applications– online expertise
P2P resource sharingClassroom internships for college GIS students– NSF’s GK-12 program
GIS in credential programs– Schools of Education
ConclusionConclusion
30 years of progressA vision for the next level