Embed Size (px)
Citation preview
Un
it
ed
n
at
io
ns
e
nv
ir
on
me
nt
P
ro
gr
am
me
www.unep.orgUnited Nations Environment Programme
P.O. Box 30552 Nairobi, KenyaTel.: ++254-(0)20-62 1234Fax: ++254-(0)20-62 3927E-mail: [email protected]
The
ma
teria
lity o
f clim
ate
cha
ng
e
United Nations Environment Programme
Finance Initiative (UNEP FI)
UNEP FI is a strategic public-private
partnership between UNEP and the
global financial sector. UNEP works
with over 180 banks, insurers and
investment firms, and a range of
partner organisations, to understand
the impacts of environmental, social
and governance issues on financial
performance and sustainable
develop ment. Through a
comprehensive work programme
encompassing research, training,
events and regional activities,
UNEP FI carries out its mission to
identify, promote and realise the
adoption of best environmental and
sustainability practice at all levels of
financial institution operations.
International Environment House
15 Chemin des Anémones
1219 Chatelaine, Geneva, Switzerland
Tel: (41) 22 917 8178
Fax: (41) 22 796 9240
www.unepfi.org
UNEP job n° DTI/1205/GE
The materiality of climate changeHow finance copes with the ticking clockA report by theAsset Management Working Group of the United Nations Environment Programme Finance Initiative
The third iteration of the AMWG’s ‘Materiality Series’
October 2009

The materiality of climate change
How finance copes with the ticking clock
A report by the Asset Management Working Group of the United Nations Environment Programme Finance Initiative
The third iteration of the AMWG’s ‘Materiality Series’
Edited by Andlug Consulting
October 2009
Disclaimer notice
The information contained in the report is meant for informational purposes only and is subject to
change without notice. The content of the report is provided with the understanding that the authors
and publishers are not herein engaged to render advice on legal, economic, or other professional
issues and services.
Subsequently, UNEP FI is also not responsible for the content of websites and information resources
that may be referenced in the report. The access provided to these sites does not constitute an
endorsement by UNEP FI of the sponsors of the sites or the information contained therein. Unless
expressly stated otherwise, the opinions, findings, interpretations and conclusions expressed in the
report are those of the various contributors to the report and do not necessarily represent the views
of UNEP FI or the member institutions of the UNEP FI partnership, UNEP, the United Nations or its
Member States.
While we have made every attempt to ensure that the information contained in the report has been
obtained from reliable and up-to-date sources, the changing nature of statistics, laws, rules and
regulations may result in delays, omissions or inaccuracies in the information contained in this report.
As such, UNEP FI makes no representations as to the accuracy or any other aspect of information
contained in this report.
UNEP FI is not responsible for any errors or omissions, or for any decision made or action taken based
on information contained in this report or for any consequential, special or similar damages, even if
advised of the possibility of such damages.
All information in this report is provided ‘as is’, with no guarantee of completeness, accuracy,
timeliness or of the results obtained from the use of this information, and without warranty of any kind,
expressed or implied, including, but not limited to warranties of performance, merchantability and
fitness for a particular purpose. The information and opinions contained in the report are provided
without any warranty of any kind, either expressed or implied.
Copyright notice
The report and the content of the report remain the sole property of UNEP FI. None of the information
contained and provided in the report may be modified, reproduced, distributed, disseminated, sold,
published, broadcasted or circulated, in whole or in part, in any form or by any means, electronic
or mechanical, including photocopying, or the use of any information storage and retrieval system,
without the express written permission from the UNEP FI Secretariat based in Geneva, Switzerland,
or the appropriate affiliate or partner. The content of the report, including but not limited to the text,
photographs, graphics, illustrations and artwork, names, logos, trademarks and service marks, remain
the property of UNEP FI or its affiliates or contributors or partners and are protected by copyright,
trademark and other laws.
Design: Rebus, Paris
Published in 2009 by UNEP FI
Copyright © UNEP FI
UNEP Finance Initiative
International Environment House
15, Chemin des Anémones
1219 Châtelaine, Genève
Switzerland
Tel: (41) 22 917 8178 Fax: (41) 22 796 9240
www.unepfi.org
Printed in Switzerland by Instaprint using vegetable oil based inks on FSC (Forest Stewardship Council)
certified, elemental chlorine free paper. Permanent use of Stacatto random rastering enables an ink use
reduction of 25%, and a central water filtering plant reduces water and alcohol consumption by 75%.
Contents
1 Message from the Project Lead & AMWG Co-Chair 4
2 Executive summary 8
3 Methodology: Background—The AMWG’s Materiality Series 14 This report—Materiality III 15
4 List of featured research with AMWG commentary 16
5 Key messages on climate change 18
6 US engagement and the EU agenda 38
7 Carbon intensive sectors, carbon sequestration and energy efficiency 43
8 Climate change in the BRIC economies 62
9 Adaptation 81
10 Supply chain 90
11 A spectrum of recommendations by leading investment brokers 95
12 Acknowledgements 130
13 About UNEP FI and its Asset Management Working Group 131
Commonly used terms
AMWG UNEP FI Asset Management Working Group
CDM Clean Development Mechanism
ESG Environmental, social and governance (issues)
GHG Greenhouse gas
IPCC Intergovernmental Panel on Climate Change
UNEP FI United Nations Environment Programme Finance Initiative
UNFCCC United Nations Framework Convention on Climate Change
The materiality of climate change4
1 Message from the Project Lead & AMWG Co-Chair
There is incontrovertible scientific evidence that the Earth is warming. This will have progressively significant effects on economies, societies and markets. Yet financial markets, as well as politicians, tend to discount future events in favour of present concerns. Can financial markets take the profound effects of climate change into account soon enough to provide positive market signals encouraging low carbon economic development and competition? The aim of this report is to summarise scientific results on climate change, review authoritative opinions on its substantial effects on the economy, and showcase the financial markets’ analysis of its material impact on industry sectors and corporate value.
The 2007 Nobel Peace Prize shared by the Intergovernmental Panel on Climate Change and former US Vice President Al Gore established a milestone in human history, giving full recognition to two decades of scientific reports and to the work of thousands of scientists and officials from over one hundred countries.
The present climate change threatens the basic elements of human life on this planet—access to water, food production, health, and use of land and the environment. It is caused by the increase in greenhouse gas concentrations in the Earth’s atmosphere due to human activities. These risks prompted the creation of the United Nations Framework Convention on Climate Change, and then the launch of the Kyoto Protocol in 1997. At the same time, in the world of business, concern about climate change has grown from a fringe issue to a strategic topic for decision-making by executives, regulators and investors.
While the institutional world struggles to become adequately involved in this process, the majority of the world’s citizens and consumers seem to lack the knowledge and understanding of how to play their part. Climate change deniers may, at times, appear to have a stronger impact on people’s conscience than the years of scientific research that unfold what Al Gore called ‘an inconvenient truth.’ Their power stems from the fact that the truth of climate change is undeniably inconvenient—people are more comfortable with the familiar devil than with the prospect of change. A poet once said: ‘even if the fear of watching has made you look away… you are involved nonetheless.’1
At the same time, the hardships created by an economic downturn of the current proportions make it difficult for stakeholders from one region of the globe to sense a common cause with stakeholders from another region. This is reinforced by the tendency to address things that are within reach, rather than far distant in time or place.
What we need now is the will to change. Mankind has shown itself capable of surprising changes throughout history—sharing welfare, discarding centuries of preposterous habits in many countries such as slavery, disenfranchisement, and mutilation. Many of these shifts happened quite recently in historical terms. This is why we can be hopeful that we will find the courage and zeal to pursue our aims for a sustainable world.
1 Canzone del Maggio, Fabrizio De André 1973 ‘...se la paura di guardare vi ha fatto chinare il mento...siete lo stesso coinvolti’

How finance copes with the ticking clock 5
But can finance really make the difference? Yes, because finance turns belief into reality. If a critical mass in the financial markets believes that well-managed companies must take steps to manage their vulnerability to any of several types of climate risk, the companies that do so will be more prized by investors, and trade at higher multiples.
Finance is integral to every modern human action. We step into the waiting room of finance when we decide to save money to buy a house, when we choose one job over another because it is less risky or more lucrative, or when we decide on a course of study that will improve our workplace prospects.
We are entering a critical political period that will set the tone for the future of climate policies worldwide. Positive finance can be the catalyst that will enable these global decisions to flow through into local actions, reducing carbon and safeguarding assets against damage.
Gianluca MancaMateriality III Project Lead & Co-Chair, UNEP FI Asset Management Working GroupHead of Sustainability & Global Non-Profit Business Eurizon Capital Intesa Sanpaolo Group
The materiality of climate change6
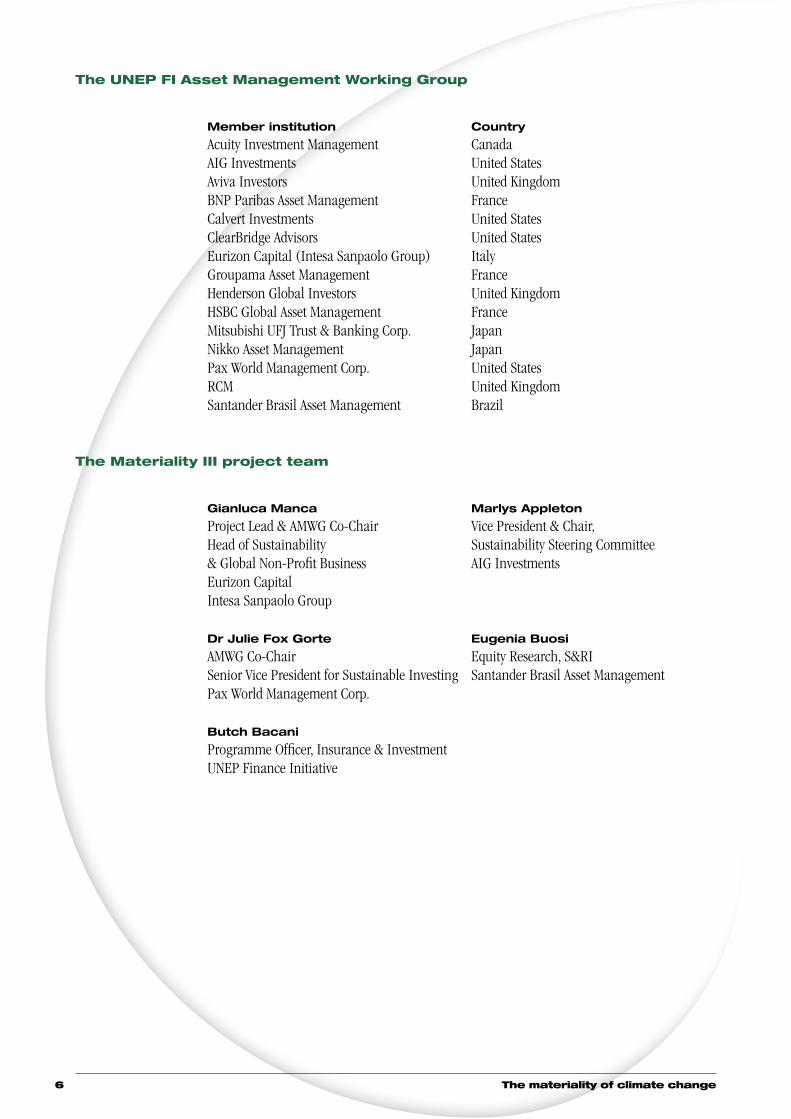
The UNEP FI Asset Management Working Group
Member institution Country
Acuity Investment Management CanadaAIG Investments United StatesAviva Investors United KingdomBNP Paribas Asset Management FranceCalvert Investments United StatesClearBridge Advisors United StatesEurizon Capital (Intesa Sanpaolo Group) ItalyGroupama Asset Management FranceHenderson Global Investors United KingdomHSBC Global Asset Management FranceMitsubishi UFJ Trust & Banking Corp. JapanNikko Asset Management JapanPax World Management Corp. United StatesRCM United KingdomSantander Brasil Asset Management Brazil
The Materiality III project team
Gianluca Manca Marlys Appleton Project Lead & AMWG Co-Chair Vice President & Chair, Head of Sustainability Sustainability Steering Committee & Global Non-Profit Business AIG InvestmentsEurizon CapitalIntesa Sanpaolo Group Dr Julie Fox Gorte Eugenia Buosi
AMWG Co-Chair Equity Research, S&RI Senior Vice President for Sustainable Investing Santander Brasil Asset ManagementPax World Management Corp.
Butch Bacani
Programme Officer, Insurance & InvestmentUNEP Finance Initiative
How finance copes with the ticking clock 7
The materiality of climate change8
2 Executive summary
I. A tipping point in the way we live and work
Information is critical to shaping beliefs. For investors, it can mean the creation of new market trends, in anticipation of real-world changes. In 2009, we are witnessing such a tipping point as evidence on the relevance of climate change pours in from every side. Politically, the G8 nations have committed themselves to a target of an 80% cut in their greenhouse gas emissions by 2050, which means a revolution in the way the future global economy will operate. Huge volumes of data are materialising on how climate change will affect the business world—from scientists on changes in the natural environment, from technologists on how to perform a fundamental ‘engine change’ to ensure that the flow of greenhouse gases is drastically curtailed, and from policymakers on the way they will shape behaviours and prices.
Responsible investors have been integrating climate change into their asset management for some time now, but mainstream investors still view the issue with some scepticism. This report brings together key reports from the investment world that demonstrate best practice on climate change, identifying the risks and opportunities, assessing how companies are dealing with them, and translating their performance and intentions into future financial returns. The emphasis is on corporate sector assets, but real estate is clearly an asset class sensitive to climate change and leading investors are active on this front as well.
II. Key messages for investors
The major conclusions from this report are:
1. There is now sufficient evidence on the materiality of climate change that all investors should routinely include climate change as a factor in asset management practice. Making the change to climate-friendly growth will require an infusion of tens of billions of dollars of private sector capital.
2. Investors must start serious dialogue with policymakers to ensure loud, long and clear mitigation policies that will harness the power of the markets. Furthermore, climate-friendly policies reinforce energy security, which will underpin economic stability.
3. Investors want greater intervention from regulators too—they can promote greater transparency and disclosure of corporate information for investors, support mitigation technologies through public procurement practices, and mandate operating standards in every walk of life that accelerate climate-friendly technologies and resilience to climatic stresses.
4. A significant impediment to action is that, in general, corporate management has not yet grasped the immediacy of the issue. They do not plan for it and therefore do not report on it either.
5. A minority of firms have grasped the nettle, which will improve their prospects in what is sure to be a time of transformation. Brand advantage could be enormous for companies which do not simply indulge in ‘greenwash’ but instead develop consumer-appealing and effective solutions to climate change.
6. Vanguard investors have developed tools and techniques for assessing qualitative risks such as climate change. These can assist companies and investors to manage the risks and seize the opportunities.
How finance copes with the ticking clock 9
7. Important areas where there is greater need for attention by investors include:
n The BRIC countries > Understanding these economies is crucial, but climate-relevant data is sparse
n Adaptation > Risks and opportunities here have been ignored compared to the research on carbon cost
n Supply chain > The implications of carbon embedded in raw materials, transport and products in use
8. It is in the general interest of investors to collaborate on researching these issues and gathering raw data. Scarce competitive skills can be best deployed in analysing the data once it exists. Equally, engagement with other stakeholders is most effective when it is done jointly.
III. Evidence enough
Recent observations confirm that the worst-case scientific trajectories presented by the Intergovernmental Panel on Climate Change are being realised—or even exceeded—for some key parameters such as global temperature, sea level, ice sheet shrinkage, ocean acidification and extreme climatic events. There is a significant risk that many of the trends will accelerate, leading to an increasing risk of abrupt or irreversible climatic shifts.
Temperature rises above 2ºC will be very difficult for contemporary societies to cope with and will increase the level of climate disruption through the rest of the century—yet we are on course for levels much higher than that.
There is no excuse for inaction. The Stern Review on the Economics of Climate Change pointed out that the two most effective strategies are reduced deforestation and better energy efficiency. These strategies do not require leaps of technology, simply acts of will. There will be many co-benefits such as job creation, clean air and vibrant ecosystems.
A preliminary survey commissioned from independent experts by the United Nations Framework Convention on Climate Change indicated that investment in the order of USD 300-400 billion per year will be required by 2030 to fund minimum requirements to reduce emissions and deal with the impacts of climate change. This amounts from 1% to 2% of anticipated global investment for all purposes, or less than 1% of global GDP at that date. This level of commitment is therefore doable, but the role of private sector investments is paramount as they comprise 86% of the future investment and financial flows.
IV. Loud, long and clear policies on carbon
Given the uncertain governance that surrounds international agreements, and the historical reluctance of some administrations to participate in the Kyoto Protocol or to undertake stringent domestic actions, the intentions of the EU and the US are critical for confidence. The EU has consistently taken a lead position on how tough emissions targets should be, and has backed this up with many domestic actions, most famously its Emissions Trading Scheme, and is also setting the pace for intermediate 2020 emissions targets. The fact that the US is now on the verge of adopting meaningful emissions targets through the Waxman-Markey Bill, with a cap-and-trade system similar to the EU, is enormously confidence-building.
The recent declaration by the G8 of a target 80% reduction in emissions from that bloc by 2050 is encouraging, but it needs to be defined precisely, with targets for intermediate years.
Investors need:
n A global framework that avoids distortions between regions due to different regimes
The materiality of climate change10
n Extension to all sectors with significant emissions including international transport and natural forests—the so-called Reduced Emissions from Deforestation and Forest Degradation (REDD) in developing countries
n Public sector funding of basic research & development in key technologies to bring them towards commercialisation, particularly carbon capture and storage, and solar and marine power
n Public sector support for technology transfer and adaptation projects in developing countries
It is vital that these measures establish a stable price trajectory for carbon emissions prices because this will guide investments in the direction of climate-friendly activities and assets. Investors should work together to advise policymakers on how best to achieve this. In two reports on the US, Goldman Sachs notes that there are many other interest groups trying to influence policy (Energy carbonomics, 2008) and EU (2020 vision, 2008). Deutsche Asset Management notes that aside from climate change being a mega-trend that will persist, the need for economic stimulus should help kick-start new technologies (Investing in climate change, 2009).
V. Regulation
A recurring theme in current investor research into climate change is the need for higher operational standards in key areas like energy efficiency, resilience to weather events, and information for risk management. Voluntary initiatives like the Carbon Disclosure Project (CDP) have made an impact, but they can take many years to extend and will not pick up small-scale activities. In other cases, lack of awareness (e.g. where extreme events occur rarely or energy costs are a small fraction of production costs) and multi-agent responsibility (e.g. for building usage) also make voluntary action impractical. A survey by the UNEP FI Climate Change Working Group noted that energy efficiency had not received the same attention as renewables from regulators, and was unlikely to accelerate without this (Energy efficiency and the finance sector, 2009). Finally, in the case of public goods such as infrastructure, there are competing demands for other non-climatic budgets.
It is important that investors collectively seek appropriate shifts in regulations and guidance through dialogue with the authorities concerned so that higher standards are introduced as soon as possible. At the tactical level, investors are alive to the impact that regulation can have, as shown in the report by CA Cheuvreux on windfall gains for utilities due to unused emissions permits in the recession (Carbon impact, 2009) and the work of WestLB on impending aviation regulations (More headwinds through CO2 costs, 2009).
VI. Corporate management (un)awareness of climate change
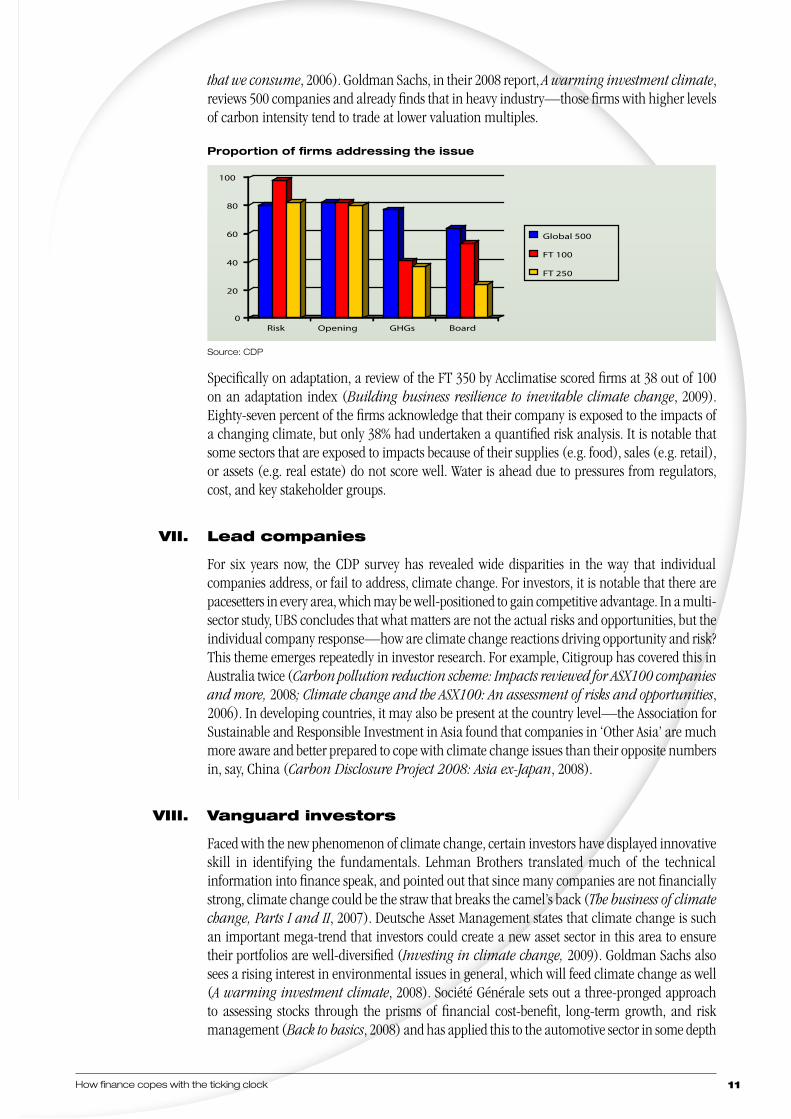
Most firms see climate change as a part of corporate social responsibility, not a core business issue. Large firms are better at understanding its importance, but as the size of a company diminishes, the inattention becomes widespread. Figure 1 shows that most companies in the Global 500 and FT 350 recognise that climate change is a risk and an opportunity. However, less than half of the FT 350 has plans to deal with their greenhouse gas emissions, and a mere 23% of the FT 250 assign responsibility for it at Board level.
UBS observes that carbon constraints will alter the relativities between activities, products and regions significantly (Reacting to climate change, 2007). For example, the Carbon Trust points out that two thirds of the carbon involved in the recreation & leisure sector is indirect, which lead to surprising impacts when carbon prices rise (The carbon emissions generated in all
How finance copes with the ticking clock 11
that we consume, 2006). Goldman Sachs, in their 2008 report, A warming investment climate, reviews 500 companies and already finds that in heavy industry—those firms with higher levels of carbon intensity tend to trade at lower valuation multiples.
Proportion of firms addressing the issue
Source: CDP
Specifically on adaptation, a review of the FT 350 by Acclimatise scored firms at 38 out of 100 on an adaptation index (Building business resilience to inevitable climate change, 2009). Eighty-seven percent of the firms acknowledge that their company is exposed to the impacts of a changing climate, but only 38% had undertaken a quantified risk analysis. It is notable that some sectors that are exposed to impacts because of their supplies (e.g. food), sales (e.g. retail), or assets (e.g. real estate) do not score well. Water is ahead due to pressures from regulators, cost, and key stakeholder groups.
VII. Lead companies
For six years now, the CDP survey has revealed wide disparities in the way that individual companies address, or fail to address, climate change. For investors, it is notable that there are pacesetters in every area, which may be well-positioned to gain competitive advantage. In a multi-sector study, UBS concludes that what matters are not the actual risks and opportunities, but the individual company response—how are climate change reactions driving opportunity and risk? This theme emerges repeatedly in investor research. For example, Citigroup has covered this in Australia twice (Carbon pollution reduction scheme: Impacts reviewed for ASX100 companies and more, 2008; Climate change and the ASX100: An assessment of risks and opportunities, 2006). In developing countries, it may also be present at the country level—the Association for Sustainable and Responsible Investment in Asia found that companies in ‘Other Asia’ are much more aware and better prepared to cope with climate change issues than their opposite numbers in, say, China (Carbon Disclosure Project 2008: Asia ex-Japan, 2008).
VIII. Vanguard investors
Faced with the new phenomenon of climate change, certain investors have displayed innovative skill in identifying the fundamentals. Lehman Brothers translated much of the technical information into finance speak, and pointed out that since many companies are not financially strong, climate change could be the straw that breaks the camel’s back (The business of climate change, Parts I and II, 2007). Deutsche Asset Management states that climate change is such an important mega-trend that investors could create a new asset sector in this area to ensure their portfolios are well-diversified (Investing in climate change, 2009). Goldman Sachs also sees a rising interest in environmental issues in general, which will feed climate change as well (A warming investment climate, 2008). Société Générale sets out a three-pronged approach to assessing stocks through the prisms of financial cost-benefit, long-term growth, and risk management (Back to basics, 2008) and has applied this to the automotive sector in some depth
0
20
40
60
80
100
Risk Opening GHGs Board
Global 500
FT 100
FT 250
The materiality of climate change12
(Auto & pollution: Size does matter, 2007; Auto & pollution: Not that bad after all, 2008; CREAM-ing carbon risk, 2008). Another in-depth study comes from Oddo Securities regarding carbon capture and storage (Climate change: To store or not to store? 2008), which faces many difficulties but seems an inevitable component of mitigation.
IX. Gaps in the analysis
While the issue of carbon intensity or energy intensity in ‘Annex I’ countries has received considerable attention from investor research, there are other aspects of climate change that are still not well explored.
1. The situation in BRIC (Brazil, Russia, India, China)
These are increasingly important markets, yet there is little by way of research that answers investors’ needs, which is complicated by the language barrier. We carried out our own research to provide some basis for future work, mainly using reports by non-investment institutions.
n Brazil > It seems clear that the issue of preserving carbon in forests is important, and could be an important commercial consideration. Renewable energy also seems likely to be even bigger in the future, building on Brazil’s experience with bio-energy
n Russia > We did not have time to investigate properly here. Potentially, climate change could be positive for the economy for the coming decades due to less severe winters
n India > This is the easiest of the four BRIC countries in terms of information. HSBC reported on the good prospects for a number of Indian companies, particularly in the renewables sector (Wide spectrum of choices: India’s climate investment opportunities revealed, 2008). Among the negatives is the fact that India is quite vulnerable to climatic impacts such as monsoon variability and the cessation of glacier-fed rivers. Also, the CDP found that corporate attention to climate change was low, which is not a good indication that companies are taking a strategic view (Carbon Disclosure Project 2008: India 200, 2008)
n China > The sparse information indicates that corporate management is inattentive to climatic risks in this country as well (Carbon Disclosure Project 2008: China 100, 2008). However, the stringent regulations aimed at improving energy efficiency and promoting renewables are well understood and are driving action on mitigation
2. Adaptation
Coping with the impacts of climate change requires separate attention since the data is quite different from emissions. The impacts often fall on different sectors and locations compared to the ones affected under emission reductions
n Real estate > Hermes carried out an exceptionally detailed study of the repercussions of climate change on real estate in the UK (Climate change: The risks for property in the UK, 2009). It sets the scene for work which we are sure will follow—more detailed technical research into physical responses, and equity analysis. The research identifies several critical problems that will become worse unless they are tackled in a determined way—heat stress for occupants, sewerage overflow, access problems in severe weather, and water shortages
n Managing the issue > Acclimatise, in collaboration with IBM, has produced a useful checklist that directors (and investors) can use to assess corporate preparedness to deal with climatic impacts, grouped under the headings of risks, opportunities, and response (Building business resilience to inevitable climate change, 2009)
How finance copes with the ticking clock 13
3. Supply chain
Understandably, the initial attention by financial analysts was targeted to the direct effects on companies of climatic events and carbon reduction policies, more so because the data even for that was lacking, whereas to investigate effects up and down the supply chain requires far more data. Research shows that such a simplistic approach is likely to lead to misjudgements by both companies and investors. The subject is fast gaining momentum, with the CDP’s Supply Chain Initiative worthy of an honourable mention. Again, most of the activity involves carbon intensity, but climatic impacts are a significant risk too
n China > There is growing reliance on China (and other developing countries) for manufacturing as well as raw materials. More than 90% of multinational companies say that China is important to their global strategies, with 52% calling it critical. There are serious threats from natural hazards, and potential logistical bottlenecks at ports, notes the Chartered Insurance Institute (Coping with climate change, 2009)
n Carbon tariffs > Countries with emissions targets might tax imports from other places. Trucost notes that such a move could have significant impacts on the bottom line for some multinationals (e.g. Alcoa) or steep increases in cost for their customers (Manufacturers: Profits at risk from carbon costs, 2008)
n Indirect emissions > For the recreation & leisure sector, the Carbon Trust reports that two-thirds of the carbon is embedded in the sector’s inputs (The carbon emissions generated in all that we consume, 2006). Getting to grips with this needs a methodical approach, focusing on the high impact areas and first level suppliers. The CDP provides guidance and workshops to raise standards (Shared value: Managing climate change in the supply chain, 2009)
4. Collaboration
Investors need to work together to tackle the issues involved in adaptation and mitigation for several reasons:
n Information is highly complex and may be expensive to obtain or generate. Cooperating to establish databases makes sense—the real skill comes in interpreting it. The CDP shows what can be done
n Engagement with stakeholders is imperative but would be impractical for individual investors to perform individually (and multiple approaches would be unwelcome)
n As an industry, investors have been tardy in communicating with policymakers and regulators on climate change. Given the financial implications of the enormous changes which are now going to take place in energy use and climatic patterns, it is surely time for investors to enter this arena so that funds can be deployed efficiently and effectively
The materiality of climate change14
3 Methodology
Background—The AMWG’s ‘Materiality Series’
Sustainable investment (SI), responsible investment (RI)—and sustainable and responsible investment (‘the new SRI’)—has gained so much recognition in the past few years that it is increasingly difficult to remember a time when financial analysts thought climate change was just a subject for tree huggers. Yet when the AMWG began to conceive its first materiality study2 (‘Materiality I’) in 2002, sustainability concerns were far distant from the world of mainstream finance. Several institutions and many thoughtful people played roles in bringing sustainability into the world of finance, but the role of the AMWG was seminal.
‘A graph charting the number of pages discussing climate change in reports by investment analysts from traditional brokerages would resemble the renowned “hockey stick” graph of temperatures over the last 1,000 years. The graph would be essentially flat at zero until about three years ago, when the United Nations Environment Programme Finance Initiative (UNEP FI) request for analyst research on environmental, social, and governance (ESG) issues sparked a sudden spike in coverage.’ SRI-adviser.com, 20073
Why? The AMWG was one of only a few financial initiatives then that had UN support, global membership and a commitment to using the tools of sustainability. The Carbon Disclosure Project was just beginning, and the UN-backed Principles for Responsible Investment (PRI) did not yet exist. With the exception of one or two specialists, there were no sell-side4 investment analysts routinely (or even occasionally) covering environmental, social and governance (ESG) issues, though sell-side and investor interest had picked up considerably following the governance scandals of 2001 and 2002. The term ESG, which is now the preferred term for a style of investing that integrates the consideration of sustainability factors, was made far more prominent by the Materiality Series, and quickly supplanted the earlier term, Socially Responsible Investment (‘the traditional SRI’). We are not certain whether the AMWG was actually the first to use the term ESG, but we have little doubt that the Materiality Series catalysed more rapid acceptance of it.
The evolution of the terms follows an evolution in thinking about sustainability that has broadened its appeal to many investors—retail, institutional, and individual. The distinction is clearer than much of the real-world practice, but SI, RI, the new SRI or ESG connotes the use of sustainability and governance variables as factors in portfolio construction, using the variables as indicators of management quality. The traditional SRI, on the other hand, more often conveys the application of ethical criteria, often in the form of industry or sector exclusions, without reference to their financial implications. What the Materiality Series was so effective in doing was to hold the coming-out ball for the idea that ESG (particularly environmental and social) factors have financial relevance, and are as useful in constructing a synthesis of management quality as strictly financial factors.
The Materiality Series also helped lay the groundwork for the inclusion of ESG into sell-side analysis, spearheaded by the Enhanced Analytics Initiative, which subsequently joined forces with the PRI under the PRI banner. Prior to Materiality I, sell-side coverage of ESG factors was
2 The first two materiality studies were: Materiality I: The Materiality of Social, Environmental, and Corporate Governance Issues to Equity Pricing (2004), UNEP FI Asset Management Working Group – http://www.unepfi.org/fileadmin/documents/amwg_materiality_equity_pricing_report_2004.pdf Materiality II: Show Me The Money: Linking Environmental, Social and Governance Issues to Company Value (2006), UNEP FI Asset Management Working Group – http://www.unepfi.org/fileadmin/documents/show_me_the_money.pdf
3 http://www.sri-adviser.com/article.mpl?sfArticleId=2237 4 Sell-side refers to the activity of providing services to those who buy or hold assets, such as pension funds.
How finance copes with the ticking clock 15
limited primarily to occasions when a corporation made a mistake large enough to cause or threaten a value collapse, or to occasions when new regulations imposed new requirements significant enough to change the competitive and financial landscapes—the best example is probably the entry into force of the EU Emissions Trading Scheme in 2005. Asset managers that take into account ESG factors, such as the members of the AMWG, had been aware that ESG-related disasters can often be foreseen by examining corporate policies and behaviour preceding the disaster, and that such examination could be an effective tool in avoiding risks that had not been widely recognised in financial markets. Most sell-side analysts took no notice of this, but after eleven institutions submitted ESG-themed analysis for Materiality I, many recognised that clients were interested in this research. The quality of the sell-side reports produced for Materiality II was significantly superior to that of most of the reports constructed for the first—a testament to the growing interest among asset managers and asset owners in sustainability.
It seems fairly obvious now that sell-side analysis had a pivotal role to play in broader financial market acceptance of ESG analysis, but that was far from plain when the AMWG conceived and produced Materiality I. ESG and sustainability are not yet routinely incorporated into mainstream finance, but we are well beyond the thin end of the wedge now—it is unusual to find sell-side reports covering competitiveness in sectors with high greenhouse gas emissions that do not take some account of the fast-changing climate regulatory regime, and governance factors are well accepted as part of any fundamental financial analysis.
This report—Materiality III
The third iteration of the AMWG’s Materiality Series focuses on climate change. The report mainly takes the form of a review of key financial analyst research on climate change, supplemented with AMWG commentary and other research in areas where these papers are lacking. All the views expressed in this report on specific security valuation, stock performance and market recommendations directly reflect the authors’ views.
As far as possible, despite their different approaches, the case studies and main considerations are presented in a summarised format for ease of reference. The content of the research may be partially represented.
Please note that the studies presented in this report appeared over the period 2006 until early 2009. Consequently, some of the rationales, strategies, and governmental references may be outdated. Nonetheless, this report represents the approaches of leading financial institutions and governing bodies, and provides a basis for further research and discussion.
The flow of the report follows the logic of examining the principal factors involved in climate change, before displaying a wide spectrum of analyses by leading investment brokers in Section 11. Section 5 looks at the most recent science, the financial implications of climate change policies, and key messages for asset management, while Section 6 discusses developments in two influential political blocs—the US and EU. Section 7 investigates the prospects for high-carbon industries, the potential for carbon capture and storage, and the barriers to more efficient use of energy. Next, Section 8 discusses the BRIC countries (Brazil, Russia, India, China) since they are increasingly important in the global economy and are key players in the climate change negotiations. Sections 9 and 10 briefly review the issues of adaptation and supply chain in the context of climate change—it is often wrongly assumed that in the corporate sector, climate change is just about reducing carbon in one’s own firm. Climatic impacts and the question of carbon intensity in one’s supply chain and product deployment are also vital.
The materiality of climate change16
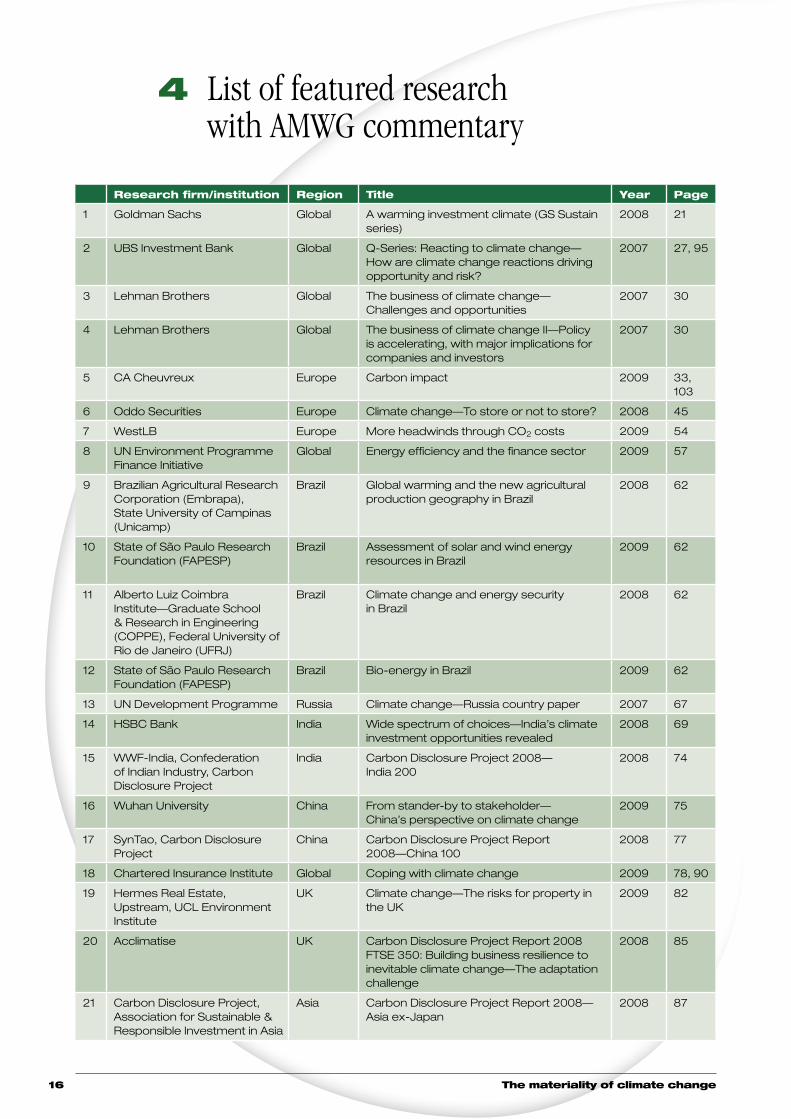
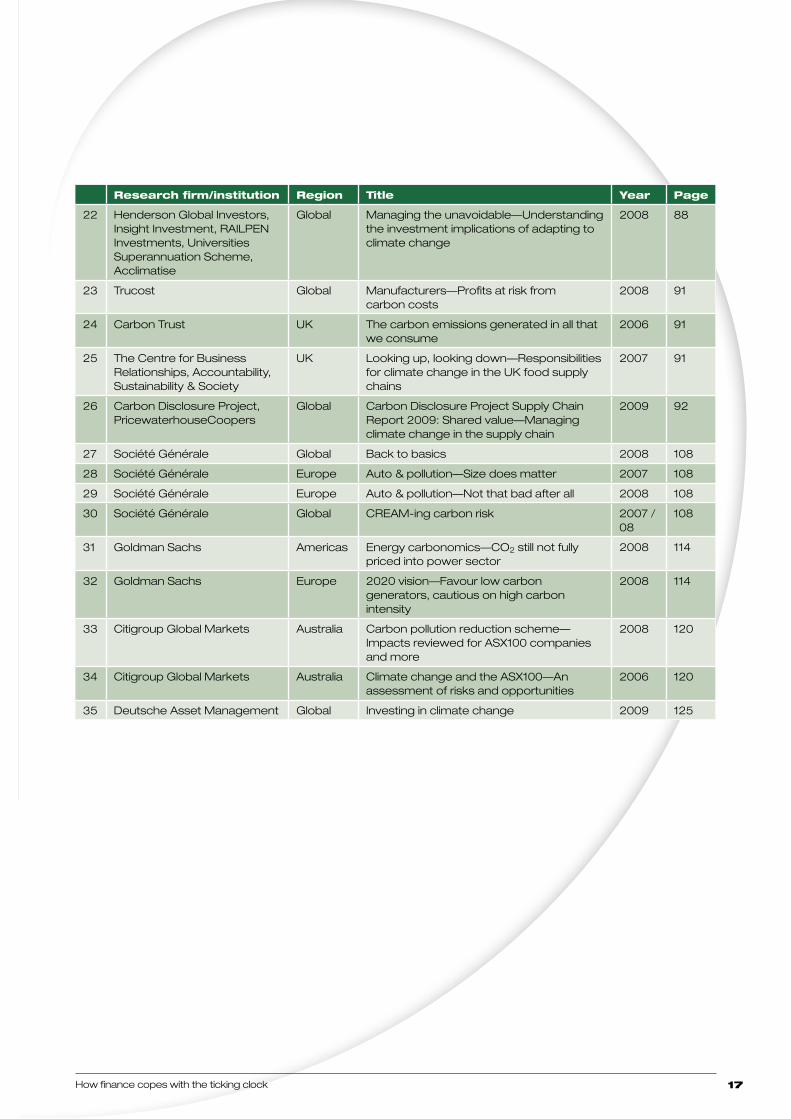
4 List of featured research with AMWG commentary
Research firm/institution Region Title Year Page
1 Goldman Sachs Global A warming investment climate (GS Sustain series)
2008 21
2 UBS Investment Bank Global Q-Series: Reacting to climate change—How are climate change reactions driving opportunity and risk?
2007 27, 95
3 Lehman Brothers Global The business of climate change—Challenges and opportunities
2007 30
4 Lehman Brothers Global The business of climate change II—Policy is accelerating, with major implications for companies and investors
2007 30
5 CA Cheuvreux Europe Carbon impact 2009 33, 103
6 Oddo Securities Europe Climate change—To store or not to store? 2008 45
7 WestLB Europe More headwinds through CO2 costs 2009 54
8 UN Environment Programme Finance Initiative
Global Energy efficiency and the finance sector 2009 57
9 Brazilian Agricultural Research Corporation (Embrapa), State University of Campinas (Unicamp)
Brazil Global warming and the new agricultural production geography in Brazil
2008 62
10 State of São Paulo Research Foundation (FAPESP)
Brazil Assessment of solar and wind energy resources in Brazil
2009 62
11 Alberto Luiz Coimbra Institute—Graduate School & Research in Engineering (COPPE), Federal University of Rio de Janeiro (UFRJ)
Brazil Climate change and energy security in Brazil
2008 62
12 State of São Paulo Research Foundation (FAPESP)
Brazil Bio-energy in Brazil
2009 62
13 UN Development Programme Russia Climate change—Russia country paper 2007 67
14 HSBC Bank India Wide spectrum of choices—India’s climate investment opportunities revealed
2008 69
15 WWF-India, Confederation of Indian Industry, Carbon Disclosure Project
India Carbon Disclosure Project 2008— India 200
2008 74
16 Wuhan University China From stander-by to stakeholder— China’s perspective on climate change
2009 75
17 SynTao, Carbon Disclosure Project
China Carbon Disclosure Project Report 2008—China 100
2008 77
18 Chartered Insurance Institute Global Coping with climate change 2009 78, 90
19 Hermes Real Estate, Upstream, UCL Environment Institute
UK Climate change—The risks for property in the UK
2009 82
20 Acclimatise UK Carbon Disclosure Project Report 2008 FTSE 350: Building business resilience to inevitable climate change—The adaptation challenge
2008 85
21 Carbon Disclosure Project, Association for Sustainable & Responsible Investment in Asia
Asia Carbon Disclosure Project Report 2008—Asia ex-Japan
2008 87
How finance copes with the ticking clock 17
Research firm/institution Region Title Year Page
22 Henderson Global Investors, Insight Investment, RAILPEN Investments, Universities Superannuation Scheme, Acclimatise
Global Managing the unavoidable—Understanding the investment implications of adapting to climate change
2008 88
23 Trucost Global Manufacturers—Profits at risk from carbon costs
2008 91
24 Carbon Trust UK The carbon emissions generated in all that we consume
2006 91
25 The Centre for Business Relationships, Accountability, Sustainability & Society
UK Looking up, looking down—Responsibilities for climate change in the UK food supply chains
2007 91
26 Carbon Disclosure Project, PricewaterhouseCoopers
Global Carbon Disclosure Project Supply Chain Report 2009: Shared value—Managing climate change in the supply chain
2009 92
27 Société Générale Global Back to basics 2008 108
28 Société Générale Europe Auto & pollution—Size does matter 2007 108
29 Société Générale Europe Auto & pollution—Not that bad after all 2008 108
30 Société Générale Global CREAM-ing carbon risk 2007 / 08
108
31 Goldman Sachs Americas Energy carbonomics—CO2 still not fully priced into power sector
2008 114
32 Goldman Sachs Europe 2020 vision—Favour low carbon generators, cautious on high carbon intensity
2008 114
33 Citigroup Global Markets Australia Carbon pollution reduction scheme—Impacts reviewed for ASX100 companies and more
2008 120
34 Citigroup Global Markets Australia Climate change and the ASX100—An assessment of risks and opportunities
2006 120
35 Deutsche Asset Management Global Investing in climate change 2009 125
The materiality of climate change18
5 Key messages on climate change
Introduction
While the Materiality Series made a meaningful contribution to the debate on the integration of ESG issues into asset management, there has been a significant augmentation of interest on climate change at the global level. In consequence, many of the top financial brokerage firms report on ESG issues periodically, while producing a series of very good publications on climate change. Questions of GHG emission reduction and energy security have risen up the political agenda. The massive involvement of world leaders, politicians, scientists and corporate executives potentially makes 2009 a landmark and transformational year for developments in global climate change because of the need to prepare a successor agreement to the Kyoto Protocol, which expires in 2012.
A. The science
Many experts believe that the IPCC Fourth Assessment Report in 2007 understated the dangers of climate change. The cut-off for the underlying research was December 2005, but knowledge had developed rapidly. The International Alliance of Research Universities convened the International Climate Change Congress in Copenhagen in March 2009 to address this issue and released an update report.5 The key findings were:
n Climatic trends > Recent observations confirm that the worst-case IPCC scenario trajectories are being realised—or even exceeded—for some key parameters such as global mean surface temperature, sea level rise, ocean and ice sheet dynamics, ocean acidification and extreme climatic events. There is a significant risk that many of the trends will accelerate, leading to an increasing risk of abrupt or irreversible climatic shifts
n Social disruption > Societies are highly vulnerable to even modest levels of climate change, with poor nations and communities particularly at risk. Temperature rises above 2ºC will be very difficult for contemporary societies to cope with and will increase the level of climate disruption through the rest of the century
n Long-term strategy > Rapid, sustained and effective mitigation based on coordinated global and regional action is required to avoid ‘dangerous climate change.’ Strong targets for 2020 will avoid the risk of crossing tipping points
n Solutions are available > There is no excuse for inaction. We already have many tools and approaches—economic, technological, behavioural, management—to deal with climate change. They must be vigorously and widely implemented to achieve the societal transformation required to decarbonise economies. There will be many co-benefits, including sustainable energy job growth, reductions in the health and economic costs of climate change and the restoration of ecosystems and revitalisation of ecosystem services
n Meeting the challenge > Success will mean overcoming inertia and vested interests, removing implicit and explicit subsidies, strengthening governance and institutions, and engaging business and civil society in the transition to sustainability
5 Synthesis report from the International Scientific Congress: Climate change – Global risks, challenges & decisions (2009), University of Copenhagen. www.climatecongress.ku.dk
How finance copes with the ticking clock 19
B. Finance
The UNFCCC commissioned a study on the funding implications of successful climate change policy. The study6 was done in 2007 to give policymakers an assessment of investment flows needed in 2030 to meet worldwide mitigation and adaptation requirements. Based on wide consultation and available research, the results should be seen as indicative.
The role of private sector investments is paramount as they comprise 86% of the future investment and financial flows. In addition, policies need to encourage investment and financial flows to developing countries where emissions can be cheaply reduced, and also because they will be particularly vulnerable to climate change impacts.
Given that there is a large funding gap, the UNFCCC could seek to generate more funds itself through expanded carbon markets and public sector funds, augmented by the private sector (e.g. for insurance pools). New sources of funds could include taxes (e.g. on international travel).
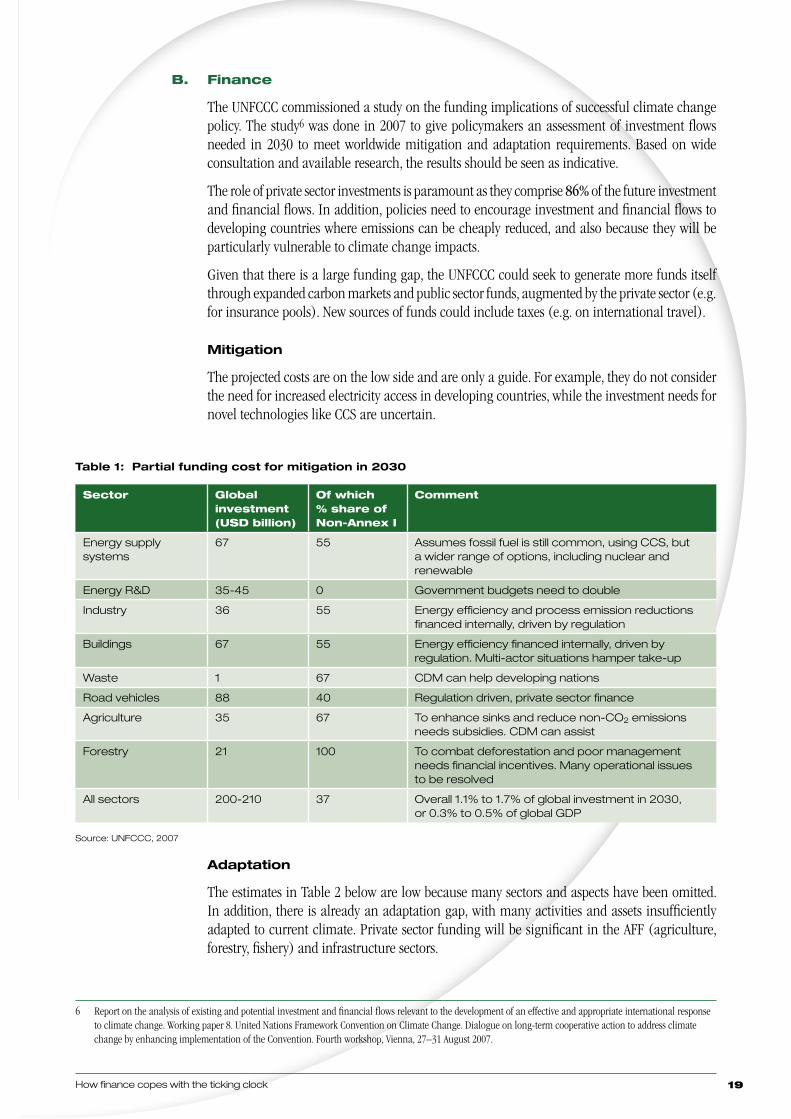
Mitigation
The projected costs are on the low side and are only a guide. For example, they do not consider the need for increased electricity access in developing countries, while the investment needs for novel technologies like CCS are uncertain.
Table 1: Partial funding cost for mitigation in 2030
Sector Global investment (USD billion)
Of which % share of Non-Annex I
Comment
Energy supply systems
67 55 Assumes fossil fuel is still common, using CCS, but a wider range of options, including nuclear and renewable
Energy R&D 35-45 0 Government budgets need to double
Industry 36 55 Energy efficiency and process emission reductions financed internally, driven by regulation
Buildings 67 55 Energy efficiency financed internally, driven by regulation. Multi-actor situations hamper take-up
Waste 1 67 CDM can help developing nations
Road vehicles 88 40 Regulation driven, private sector finance
Agriculture 35 67 To enhance sinks and reduce non-CO2 emissions needs subsidies. CDM can assist
Forestry 21 100 To combat deforestation and poor management needs financial incentives. Many operational issues to be resolved
All sectors 200-210 37 Overall 1.1% to 1.7% of global investment in 2030, or 0.3% to 0.5% of global GDP
Source: UNFCCC, 2007
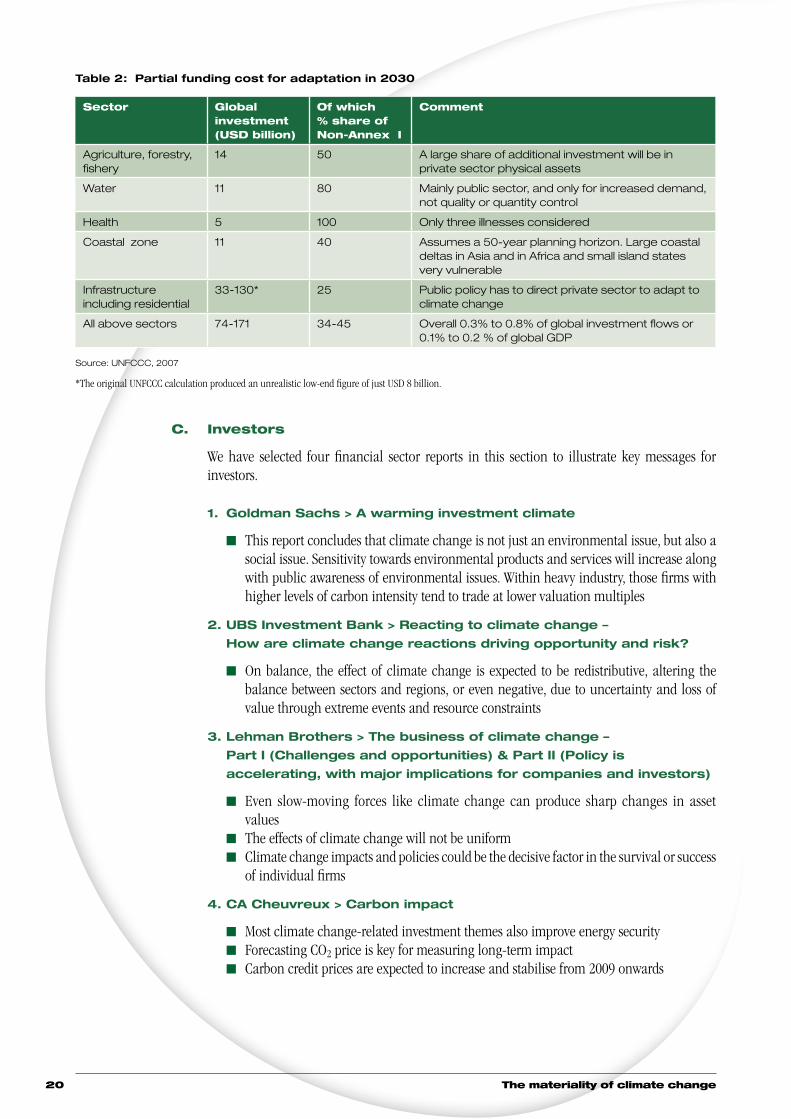
Adaptation
The estimates in Table 2 below are low because many sectors and aspects have been omitted. In addition, there is already an adaptation gap, with many activities and assets insufficiently adapted to current climate. Private sector funding will be significant in the AFF (agriculture, forestry, fishery) and infrastructure sectors.
6 Report on the analysis of existing and potential investment and financial flows relevant to the development of an effective and appropriate international response to climate change. Working paper 8. United Nations Framework Convention on Climate Change. Dialogue on long-term cooperative action to address climate change by enhancing implementation of the Convention. Fourth workshop, Vienna, 27–31 August 2007.
The materiality of climate change20
Table 2: Partial funding cost for adaptation in 2030
Sector Global investment (USD billion)
Of which % share of Non-Annex I
Comment
Agriculture, forestry, fishery
14 50 A large share of additional investment will be in private sector physical assets
Water 11 80 Mainly public sector, and only for increased demand, not quality or quantity control
Health 5 100 Only three illnesses considered
Coastal zone 11 40 Assumes a 50-year planning horizon. Large coastal deltas in Asia and in Africa and small island states very vulnerable
Infrastructureincluding residential
33-130* 25 Public policy has to direct private sector to adapt to climate change
All above sectors 74-171 34-45 Overall 0.3% to 0.8% of global investment flows or 0.1% to 0.2 % of global GDP
Source: UNFCCC, 2007
*The original UNFCCC calculation produced an unrealistic low-end figure of just USD 8 billion.
C. Investors
We have selected four financial sector reports in this section to illustrate key messages for investors.
1. Goldman Sachs > A warming investment climate
n This report concludes that climate change is not just an environmental issue, but also a social issue. Sensitivity towards environmental products and services will increase along with public awareness of environmental issues. Within heavy industry, those firms with higher levels of carbon intensity tend to trade at lower valuation multiples
2. UBS Investment Bank > Reacting to climate change –
How are climate change reactions driving opportunity and risk?
n On balance, the effect of climate change is expected to be redistributive, altering the balance between sectors and regions, or even negative, due to uncertainty and loss of value through extreme events and resource constraints
3. Lehman Brothers > The business of climate change –
Part I (Challenges and opportunities) & Part II (Policy is
accelerat ing, with major implications for companies and investors)
n Even slow-moving forces like climate change can produce sharp changes in asset values
n The effects of climate change will not be uniformn Climate change impacts and policies could be the decisive factor in the survival or success
of individual firms
4. CA Cheuvreux > Carbon impact
n Most climate change-related investment themes also improve energy securityn Forecasting CO2 price is key for measuring long-term impactn Carbon credit prices are expected to increase and stabilise from 2009 onwards
How finance copes with the ticking clock 21
5.1 A warming investment climate
Type Financial report
Region Global
Research firm Goldman Sachs
Analysts Anthony Ling, Andrew Howard, Sarah Forrest, Marc Fox
Title A warming investment climate (GS Sustain series)
Date October 2008
AMWG commentary
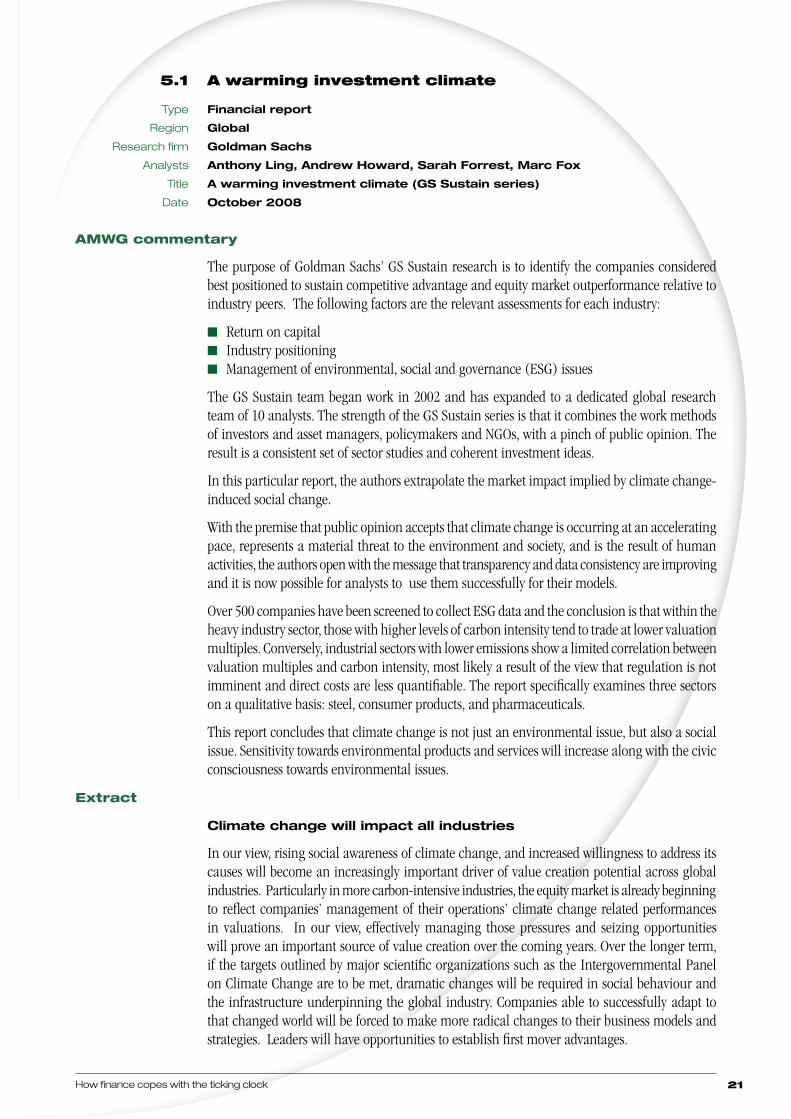
The purpose of Goldman Sachs’ GS Sustain research is to identify the companies considered best positioned to sustain competitive advantage and equity market outperformance relative to industry peers. The following factors are the relevant assessments for each industry:
n Return on capitaln Industry positioningn Management of environmental, social and governance (ESG) issues
The GS Sustain team began work in 2002 and has expanded to a dedicated global research team of 10 analysts. The strength of the GS Sustain series is that it combines the work methods of investors and asset managers, policymakers and NGOs, with a pinch of public opinion. The result is a consistent set of sector studies and coherent investment ideas.
In this particular report, the authors extrapolate the market impact implied by climate change-induced social change.
With the premise that public opinion accepts that climate change is occurring at an accelerating pace, represents a material threat to the environment and society, and is the result of human activities, the authors open with the message that transparency and data consistency are improving and it is now possible for analysts to use them successfully for their models.
Over 500 companies have been screened to collect ESG data and the conclusion is that within the heavy industry sector, those with higher levels of carbon intensity tend to trade at lower valuation multiples. Conversely, industrial sectors with lower emissions show a limited correlation between valuation multiples and carbon intensity, most likely a result of the view that regulation is not imminent and direct costs are less quantifiable. The report specifically examines three sectors on a qualitative basis: steel, consumer products, and pharmaceuticals.
This report concludes that climate change is not just an environmental issue, but also a social issue. Sensitivity towards environmental products and services will increase along with the civic consciousness towards environmental issues.
Extract
Climate change will impact all industries
In our view, rising social awareness of climate change, and increased willingness to address its causes will become an increasingly important driver of value creation potential across global industries. Particularly in more carbon-intensive industries, the equity market is already beginning to reflect companies’ management of their operations’ climate change related performances in valuations. In our view, effectively managing those pressures and seizing opportunities will prove an important source of value creation over the coming years. Over the longer term, if the targets outlined by major scientific organizations such as the Intergovernmental Panel on Climate Change are to be met, dramatic changes will be required in social behaviour and the infrastructure underpinning the global industry. Companies able to successfully adapt to that changed world will be forced to make more radical changes to their business models and strategies. Leaders will have opportunities to establish first mover advantages.
The materiality of climate change22
Our analysis outlines the mechanisms through which that structural shift will impact the sustainability of competitive advantage across sectors and introduces a framework to assess companies’ climate change-related strategies and performance relative to global peers.
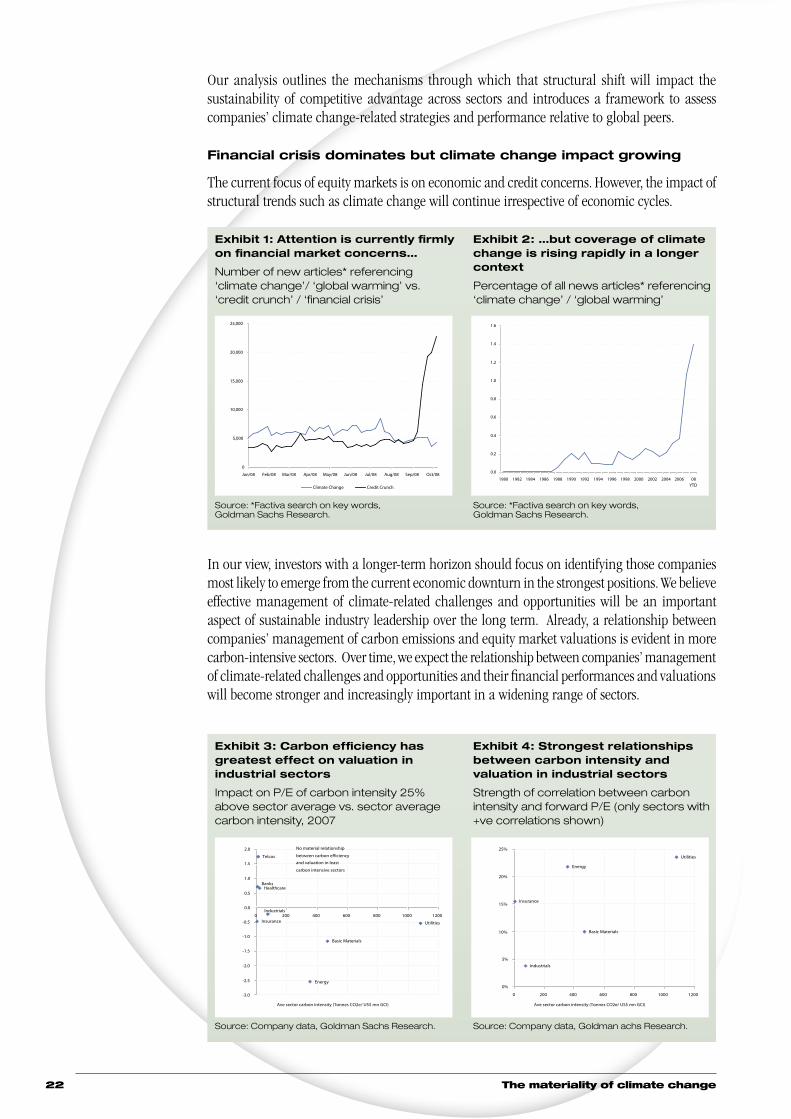
Financial crisis dominates but climate change impact growing
The current focus of equity markets is on economic and credit concerns. However, the impact of structural trends such as climate change will continue irrespective of economic cycles.
In our view, investors with a longer-term horizon should focus on identifying those companies most likely to emerge from the current economic downturn in the strongest positions. We believe effective management of climate-related challenges and opportunities will be an important aspect of sustainable industry leadership over the long term. Already, a relationship between companies’ management of carbon emissions and equity market valuations is evident in more carbon-intensive sectors. Over time, we expect the relationship between companies’ management of climate-related challenges and opportunities and their financial performances and valuations will become stronger and increasingly important in a widening range of sectors.
Exhibit 1: Attention is currently firmly on financial market concerns…
Number of new articles* referencing ‘climate change’/ ‘global warming’ vs. ‘credit crunch’ / ‘financial crisis’
Source: *Factiva search on key words, Goldman Sachs Research.
Exhibit 2: …but coverage of climate change is rising rapidly in a longer context
Percentage of all news articles* referencing ‘climate change’ / ‘global warming’
Source: *Factiva search on key words, Goldman Sachs Research.
Exhibit 3: Carbon efficiency has greatest effect on valuation in industrial sectors
Impact on P/E of carbon intensity 25% above sector average vs. sector average carbon intensity, 2007
Source: Company data, Goldman Sachs Research.
Exhibit 4: Strongest relationships between carbon intensity and valuation in industrial sectors
Strength of correlation between carbon intensity and forward P/E (only sectors with +ve correlations shown)
Source: Company data, Goldman achs Research.
0
5,000
10,000
15,000
20,000
25,000
Jan/08 Feb/08 Mar/08 Apr/08 May/08 Jun/08 Jul/08 Aug/08 Sep/08 Oct/08
#of articles
Climate Change Credit Crunch
Energy
Utilities
Basic Materials
Telcos
Insurance
Industrials
BanksHealthcare
-3.0
-2.5
-2.0
-1.5
-1.0
-0.5
0.0
0.5
1.0
1.5
2.0
0 200 400 600 800 1000 1200
Ave sector carbon intensity (Tonnes CO2e/ US$ mn GCI)
Impact on P/E of carbon intensity 25% above sector
average
No material relationship
between carbon efficiency
and valuation in least
carbon intensive sectors
0.0
0.2
0.4
0.6
0.8
1.0
1.2
1.4
1.6
1980 1982 1984 1986 1988 1990 1992 1994 1996 1998 2000 2002 2004 2006 08YTD
% of all articles
Industrials
Basic Materials
Insurance
Energy
Utilities
0%
5%
10%
15%
20%
25%
0 200 400 600 800 1000 1200
Ave sector carbon intensity (Tonnes CO2e/ US$ mn GCI)
Explanatory power (R-squared) of carbon intensity in
explaining multiple differences
How finance copes with the ticking clock 23
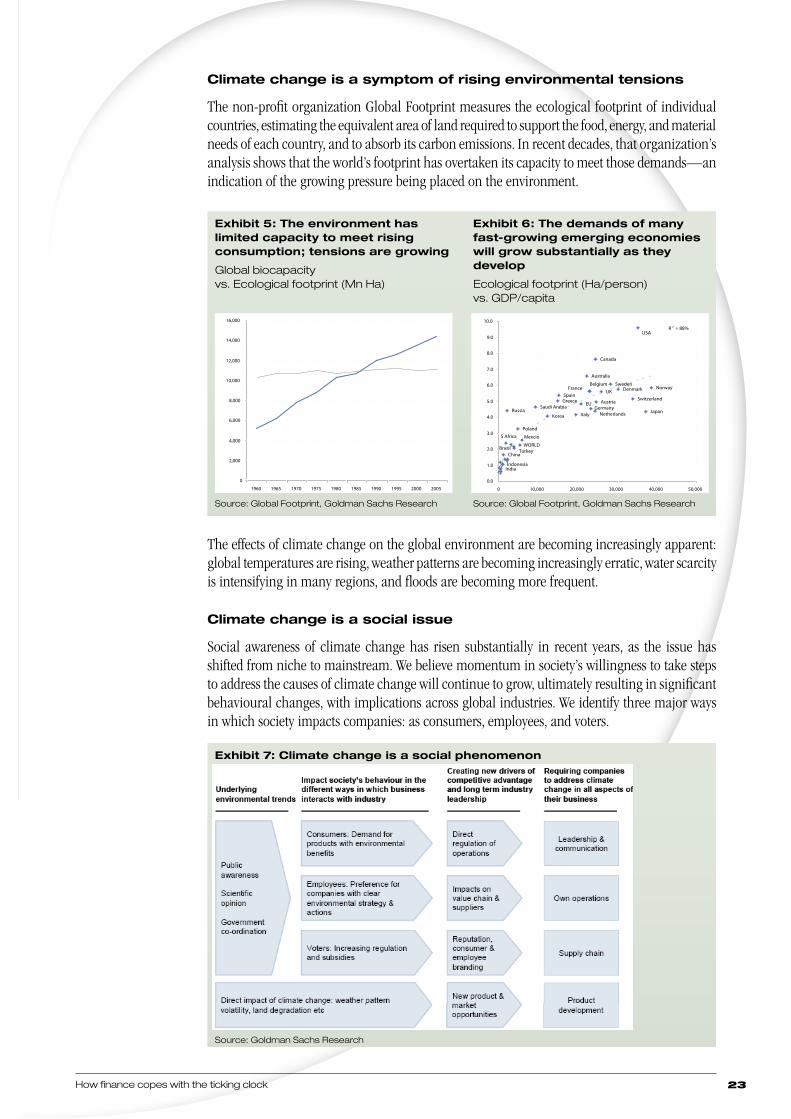
Climate change is a symptom of rising environmental tensions
The non-profit organization Global Footprint measures the ecological footprint of individual countries, estimating the equivalent area of land required to support the food, energy, and material needs of each country, and to absorb its carbon emissions. In recent decades, that organization’s analysis shows that the world’s footprint has overtaken its capacity to meet those demands—an indication of the growing pressure being placed on the environment.
The effects of climate change on the global environment are becoming increasingly apparent: global temperatures are rising, weather patterns are becoming increasingly erratic, water scarcity is intensifying in many regions, and floods are becoming more frequent.
Climate change is a social issue
Social awareness of climate change has risen substantially in recent years, as the issue has shifted from niche to mainstream. We believe momentum in society’s willingness to take steps to address the causes of climate change will continue to grow, ultimately resulting in significant behavioural changes, with implications across global industries. We identify three major ways in which society impacts companies: as consumers, employees, and voters.
Exhibit 5: The environment has limited capacity to meet rising consumption; tensions are growing
Global biocapacity vs. Ecological footprint (Mn Ha)
Source: Global Footprint, Goldman Sachs Research
Exhibit 6: The demands of many fast-growing emerging economies will grow substantially as they develop
Ecological footprint (Ha/person) vs. GDP/capita
Source: Global Footprint, Goldman Sachs Research
Exhibit 7: Climate change is a social phenomenon
Source: Goldman Sachs Research
0
2,000
4,000
6,000
8,000
10,000
12,000
14,000
16,000
1960 1965 1970 1975 1980 1985 1990 1995 2000 2005
Mn Ha
Biocapacity Footprint
IndiaIndonesia
China
S Africa
Brazil
Poland
Russia
SpainGreece
TurkeyWORLD
Mexcio
Saudi Arabia
Korea Italy NetherlandsGermany
EU Austria
UK
BelgiumFrance
Australia
Canada
SwedenDenmark
Switzerland
Japan
Norway
USAR 2 = 88%
0.0
1.0
2.0
3.0
4.0
5.0
6.0
7.0
8.0
9.0
10.0
0 10,000 20,000 30,000 40,000 50,000
GDP per capita (US$)
Per capita ecological footprint (ha/person)
The materiality of climate change24
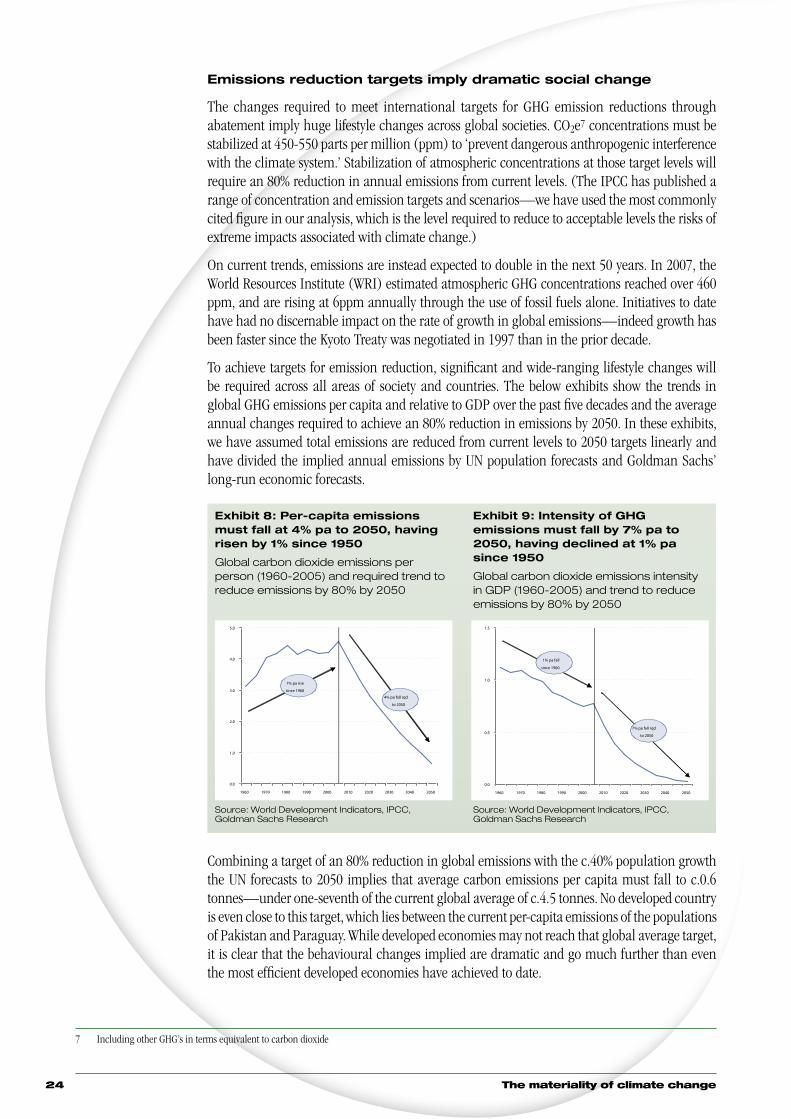
Emissions reduction targets imply dramatic social change
The changes required to meet international targets for GHG emission reductions through abatement imply huge lifestyle changes across global societies. CO2e7 concentrations must be stabilized at 450-550 parts per million (ppm) to ‘prevent dangerous anthropogenic interference with the climate system.’ Stabilization of atmospheric concentrations at those target levels will require an 80% reduction in annual emissions from current levels. (The IPCC has published a range of concentration and emission targets and scenarios—we have used the most commonly cited figure in our analysis, which is the level required to reduce to acceptable levels the risks of extreme impacts associated with climate change.)
On current trends, emissions are instead expected to double in the next 50 years. In 2007, the World Resources Institute (WRI) estimated atmospheric GHG concentrations reached over 460 ppm, and are rising at 6ppm annually through the use of fossil fuels alone. Initiatives to date have had no discernable impact on the rate of growth in global emissions—indeed growth has been faster since the Kyoto Treaty was negotiated in 1997 than in the prior decade.
To achieve targets for emission reduction, significant and wide-ranging lifestyle changes will be required across all areas of society and countries. The below exhibits show the trends in global GHG emissions per capita and relative to GDP over the past five decades and the average annual changes required to achieve an 80% reduction in emissions by 2050. In these exhibits, we have assumed total emissions are reduced from current levels to 2050 targets linearly and have divided the implied annual emissions by UN population forecasts and Goldman Sachs’ long-run economic forecasts.
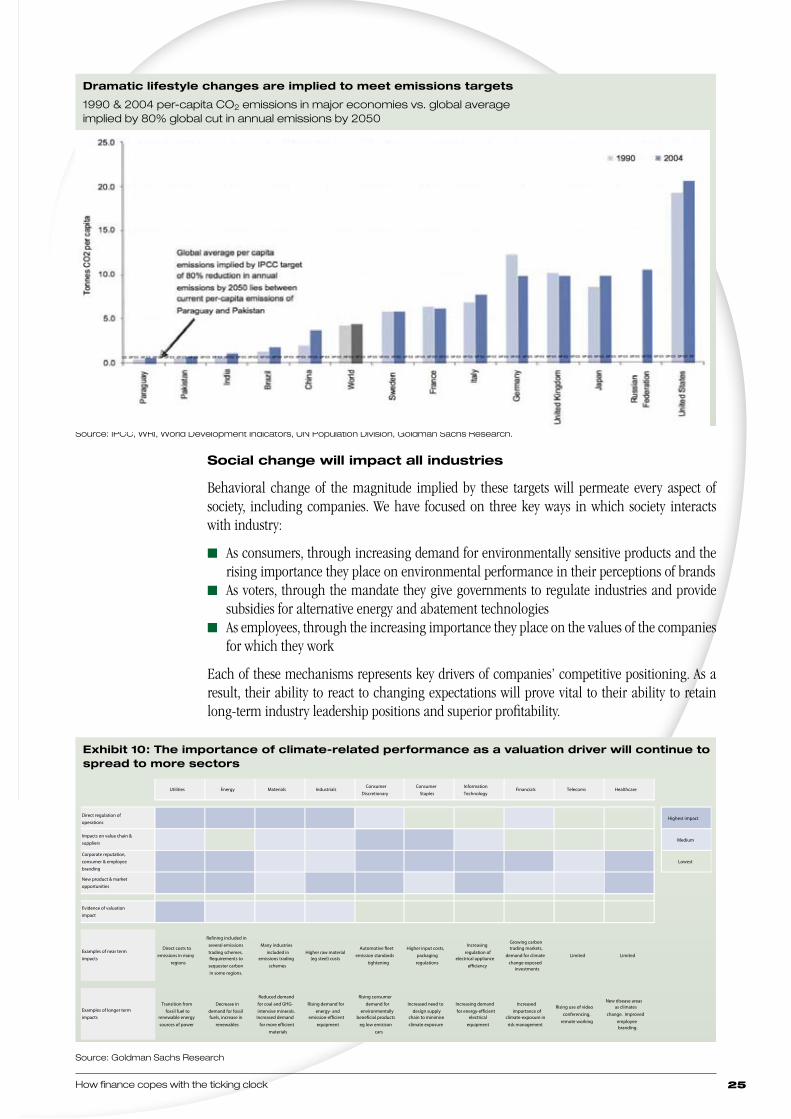
Combining a target of an 80% reduction in global emissions with the c.40% population growth the UN forecasts to 2050 implies that average carbon emissions per capita must fall to c.0.6 tonnes—under one-seventh of the current global average of c.4.5 tonnes. No developed country is even close to this target, which lies between the current per-capita emissions of the populations of Pakistan and Paraguay. While developed economies may not reach that global average target, it is clear that the behavioural changes implied are dramatic and go much further than even the most efficient developed economies have achieved to date.
7 Including other GHG’s in terms equivalent to carbon dioxide
Exhibit 8: Per-capita emissions must fall at 4% pa to 2050, having risen by 1% since 1950
Global carbon dioxide emissions per person (1960-2005) and required trend to reduce emissions by 80% by 2050
Source: World Development Indicators, IPCC, Goldman Sachs Research
Exhibit 9: Intensity of GHG emissions must fall by 7% pa to 2050, having declined at 1% pa since 1950
Global carbon dioxide emissions intensity in GDP (1960-2005) and trend to reduce emissions by 80% by 2050
Source: World Development Indicators, IPCC, Goldman Sachs Research
0.0
1.0
2.0
3.0
4.0
5.0
1960 1970 1980 1990 2000 2010 2020 2030 2040 2050
Tonnes CO2 per person
1% pa rise
since 1960
4% pa fall rqd
to 2050
0.0
0.5
1.0
1.5
1960 1970 1980 1990 2000 2010 2020 2030 2040 2050
Tonnes CO2 per $'000 GDP
1% pa fall
since 1960
7% pa fall rqd
to 2050
How finance copes with the ticking clock 25
Source: IPCC, WRI, World Development Indicators, UN Population Division, Goldman Sachs Research.
Social change will impact all industries
Behavioral change of the magnitude implied by these targets will permeate every aspect of society, including companies. We have focused on three key ways in which society interacts with industry:
n As consumers, through increasing demand for environmentally sensitive products and the rising importance they place on environmental performance in their perceptions of brands
n As voters, through the mandate they give governments to regulate industries and provide subsidies for alternative energy and abatement technologies
n As employees, through the increasing importance they place on the values of the companies for which they work
Each of these mechanisms represents key drivers of companies’ competitive positioning. As a result, their ability to react to changing expectations will prove vital to their ability to retain long-term industry leadership positions and superior profitability.
Source: Goldman Sachs Research
Dramatic lifestyle changes are implied to meet emissions targets
1990 & 2004 per-capita CO2 emissions in major economies vs. global average implied by 80% global cut in annual emissions by 2050
Exhibit 10: The importance of climate-related performance as a valuation driver will continue to spread to more sectors
Utilities Energy Materials IndustrialsConsumer
DiscretionaryConsumer
StaplesInformation Technology
Financials Telecoms Healthcare
Direct regulation of operations
Highest impact
Impacts on value chain & suppliers
Medium
Corporate reputation, consumer & employee branding
Lowest
New product & market opportunities
Evidence of valuation impact
Examples of near term impacts
Direct costs to emissions in many
regions
Refining included in several emissions trading schemes. Requirements to
sequester carbon in some regions.
Many industries included in
emissions trading schemes
Higher raw material (eg steel) costs
Automotive fleet emission standards
tightening
Higher input costs, packaging regulations
Increasing regulation of
electrical appliance efficiency
Growing carbon trading markets,
demand for climate change exposed
investments
Limited Limited
Examples of longer term impacts
Transition from fossil fuel to
renewable energy sources of power
Decrease in demand for fossil fuels, increase in
renewables
Reduced demand for coal and GHG-intensive minerals.
Increased demand for more efficient
materials
Rising demand for energy- and
emission-efficient equipment
Rising consumer demand for
environmentally beneficial products
eg low emisison cars
Increased need to design supply
chain to minimise climate exposure
Increasing demand for energy-efficient
electrical equipment
Increased importance of
climate-exposure in risk management
Rising use of video conferencing,
remote working
New disease areas as climates
change. Improved employee branding.
The materiality of climate change26
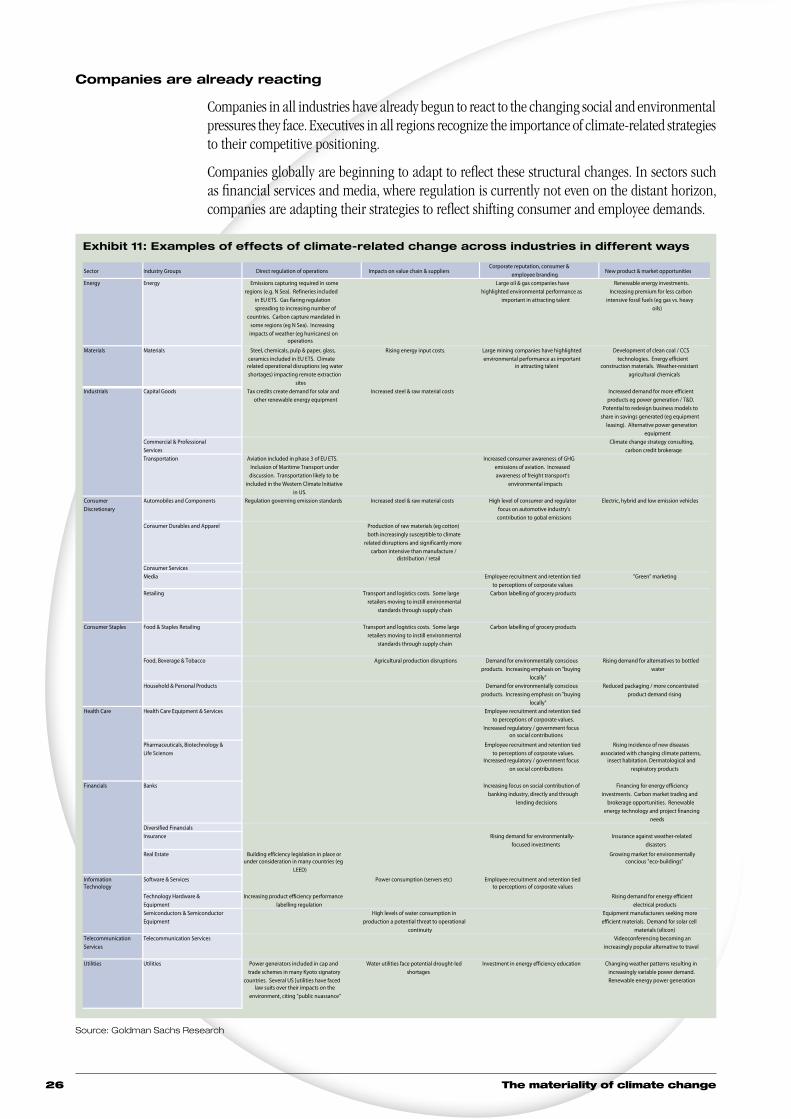
Companies are already reacting
Companies in all industries have already begun to react to the changing social and environmental pressures they face. Executives in all regions recognize the importance of climate-related strategies to their competitive positioning.
Companies globally are beginning to adapt to reflect these structural changes. In sectors such as financial services and media, where regulation is currently not even on the distant horizon, companies are adapting their strategies to reflect shifting consumer and employee demands.
Source: Goldman Sachs Research
Exhibit 11: Examples of effects of climate-related change across industries in different ways
Sector Industry Groups Direct regulation of operations Impacts on value chain & suppliersCorporate reputation, consumer &
employee branding New product & market opportunities
Energy Energy Emissions capturing required in some regions (e.g. N Sea). Refineries included
in EU ETS. Gas flaring regulation spreading to increasing number of
countries. Carbon capture mandated in some regions (eg N Sea). Increasing impacts of weather (eg hurricanes) on
operations
Large oil & gas companies have highlighted environmental performance as
important in attracting talent
Renewable energy investments. Increasing premium for less carbon
intensive fossil fuels (eg gas vs. heavy oils)
Materials Materials Steel, chemicals, pulp & paper, glass, ceramics included in EU ETS. Climate related operational disruptions (eg water shortages) impacting remote extraction
sites
Rising energy input costs. Large mining companies have highlighted environmental performance as important
in attracting talent
Development of clean coal / CCS technologies. Energy efficient
construction materials. Weather-resistant agricultural chemicals
Capital Goods Tax credits create demand for solar and other renewable energy equipment
Increased steel & raw material costs Increased demand for more efficient products eg power generation / T&D.
Potential to redesign business models to share in savings generated (eg equipment
leasing). Alternative power generation equipment
Commercial & Professional Services
Climate change strategy consulting, carbon credit brokerage
Transportation Aviation included in phase 3 of EU ETS. Inclusion of Maritime Transport under discussion. Transportation likely to be
included in the Western Climate Initiative in US.
Increased consumer awareness of GHG emissions of aviation. Increased awareness of freight transport's
environmental impacts
Automobiles and Components Regulation governing emission standards Increased steel & raw material costs High level of consumer and regulator focus on automotive industry's contribution to gobal emissions
Electric, hybrid and low emission vehicles
Consumer Durables and Apparel Production of raw materials (eg cotton) both increasingly susceptible to climate
related disruptions and significantly more carbon intensive than manufacture /
distribution / retail
Consumer ServicesMedia Employee recruitment and retention tied
to perceptions of corporate values"Green" marketing
Retailing Transport and logistics costs. Some large retailers moving to instill environmental
standards through supply chain
Carbon labelling of grocery products
Food & Staples Retailing Transport and logistics costs. Some large retailers moving to instill environmental
standards through supply chain
Carbon labelling of grocery products
Food, Beverage & Tobacco Agricultural production disruptions Demand for environmentally conscious products. Increasing emphasis on "buying
locally"
Rising demand for alternatives to bottled water
Household & Personal Products Demand for environmentally conscious products. Increasing emphasis on "buying
locally"
Reduced packaging / more concentrated product demand rising
Health Care Equipment & Services Employee recruitment and retention tied to perceptions of corporate values.
Increased regulatory / government focus on social contributions
Pharmaceuticals, Biotechnology & Life Sciences
Employee recruitment and retention tied to perceptions of corporate values.
Increased regulatory / government focus on social contributions
Rising incidence of new diseases associated with changing climate patterns,
insect habitation. Dermatological and respiratory products
Banks Increasing focus on social contribution of banking industry, directly and through
lending decisions
Financing for energy efficiency investments. Carbon market trading and
brokerage opportunities. Renewable energy technology and project financing
needsDiversified FinancialsInsurance Rising demand for environmentally-
focused investmentsInsurance against weather-related
disasters
Real Estate Building efficiency legislation in place or under consideration in many countries (eg
LEED)
Growing market for environmentally concious "eco-buildings"
Software & Services Power consumption (servers etc) Employee recruitment and retention tied to perceptions of corporate values
Technology Hardware & Equipment
Increasing product efficiency performance labelling regulation
Rising demand for energy efficient electrical products
Semiconductors & Semiconductor Equipment
High levels of water consumption in production a potential threat to operational
continuity
Equipment manufacturers seeking more efficient materials. Demand for solar cell
materials (silicon)Telecommunication Services
Telecommunication Services Videoconferencing becoming an increasingly popular alternative to travel
Utilities Utilities Power generators included in cap and trade schemes in many Kyoto signatory
countries. Several US ]utilities have faced law suits over their impacts on the
environment, citing "public nuassance"
Water utilities face potential drought-led shortages
Investment in energy efficiency education Changing weather patterns resulting in increasingly variable power demand. Renewable energy power generation
Financials
Information Technology
Industrials
Consumer Discretionary
Consumer Staples
Health Care
How finance copes with the ticking clock 27
5.2 Reacting to climate change
Type Financial report
Region Global
Research firm UBS Investment Bank
Analysts Julie Hudson, Paul Donovan, Shirley Knott, Per Lekander
Title Q-Series: Reacting to climate change—
How are climate change reactions driving opportunity and risk?
Date June 2007
AMWG commentary
This report is specifically designed to give a financial and economic answer to the many questions on climate change posed by the scientific community over the years. The variety of subjects examined and the innovative approach to sector valuation make it a distinguished publication and a useful tool for asset managers that need evidence of the materiality of environmental issues to company value. In this review, we consider the part of the report related to economics.
The chapter on the Stern Report8 facilitates the understanding of the economic factors that respond to climate change, examining both long-term and short-term potential effects. On balance, the effect of climate change is expected to be redistributive, altering the balance between sectors and regions, or even negative, due to uncertainty and loss of value through extreme events and resource constraints.
Extract
Climate change and economics—A view from the top
The critical change for financial markets in the past few years has been the shift in the political and popular perception of climate change. Climate change has both short-term and long-term effects. It is something that potentially reduces living standards through its destructive force, and can lower trend growth through shifts in perceptions of risk. However, we believe the immediate issue with climate change is that the policy response to it is likely to be redistributive.
When climate change is put in the context of economics, it is generally described in negative terms. The central conclusion of the Stern Report prepared for the UK government was that unchecked climate change would cost 5% of global GDP in perpetuity. However, offsetting the negative consequences of climate change will entail economic consequences—though these need not be negatives. In our opinion, in the near term it is this factor that is probably of more interest to financial markets. The critical change for financial markets in the past few years is the shift in the political and popular perception of climate change, and the ensuing prospect for a policy prescription (or at least a policy response, however ineffectual). This means that climate change presents both long-term and short-term economic consequences. The policy issue means that climate change is likely to be redistributive, which of course is negative for some areas of the world economy (which will tend to be the focus of media attention), but also more positive for other areas of the world economy.
Wealth negative (growth positive)
The Stern Report and similar surveys of the global economy have tended to concentrate on wealth effects. Climate change, as New Orleans has found to its cost9, can be a significant force for the destruction of economic wealth (wealth is simply stored economic value). This is something
8 The Stern Review on the Economics of Climate Change Oct 30, 2006, chaired by Lord Nicholas Stern, discusses the effect of climate change and global warming on the world economy.
9 It is not possible to ascribe the existence of Hurricane Katrina to climate change, but there is little doubt that climate change made it worse, due to the warmer and higher waters in the Gulf of Mexico in 2005.
The materiality of climate change28
that, ceteris paribus, lowers the economic standard of living. It generally entails physical wealth destruction (in storms, for instance), but it could also be financial wealth destruction (related to the changes in risk premiums, detailed in the following section). To the extent that climate change is physically destructive in parts of the global economy, it would appear obvious that the wealth of that geographic area will decline. Standards of living will go down as physical capital is lost. Considered in an economic sense as well as a humanitarian sense, this is of course an unambiguous negative. However, if there is a desire to rebuild in the wake of destruction, then the subsequent result would increase growth. GDP, it should be remembered, is a measure of economic activity. Replacing lost physical capital generates economic activity, even if the overall standard of living is lowered as a result of the lost infrastructure.
The clear case for a negative growth impact
The most obvious way in which climate change creates a negative effect on global growth rates (rather than wealth) is through the increase in uncertainty and the corresponding increase in risk premiums that it engenders. Climate change represents a structural break, at least with the recent economic past, and as such it disturbs accepted patterns of behaviour and economic reactions to those patterns. Uncertainty arises from the climate change itself (storms, weather patterns, and the like), but also from uncertainty about the policy response that may arise (taxation, regulation and associated costs, and shifts in consumption). This disruption inevitably creates uncertainty about the future, which will probably increase the risk premium that is demanded in compensation. This risk premium is not economically efficient (it could raise the cost of capital, for instance). As such, it is likely to reduce the rate of growth in the world economy. There is considerable difficulty in estimating the impact the increased uncertainty from climate change will have on financial risk. It seems likely that any increase in risk premiums will be unevenly distributed: risk in agriculture may increase, as may risk in tourism or the auto sector. It seems to us unlikely that any sector will experience a reduction in risk premiums as a result of climate change, however (at least, not to a meaningful degree), so there is likely to be a net increase in risk, with a net deleterious impact on trend growth in the global economy.
Resource constraints on growth
A long-term negative impact on growth is the potential for resource constraints. Economic development is a consequence of resource inputs combined with productivity. Constraining raw material inputs will almost inevitably impact economic output. The most immediate constraint on inputs is probably water. Already, the availability of water is a constraint on economic activity in some parts of the world; the Australian, U.S., and Chinese economies are experiencing growth constraints from water shortages, albeit to different degrees. Other constraints include agricultural output, which may be constrained by climate change. There is also the possibility that changing sea levels will reduce available land. Growth constraints from resource shortages are a complicated area of climate change. It is possible that they are redistributive rather than overall negative. El Niño—which is temporary climate change—is an example of this: the effect tends to be drought in the southern hemisphere, but abundant water in the northern hemisphere, thus creating an agricultural recession early in the year but more abundant harvests during the northern hemisphere summer. The extent to which resource constraints are a global growth negative depends on the balance of winners and losers, and of course the extent to which policy or technology can compensate for the constraints (Melbourne, for instance, is considering the recycling of sewage water in response to its water resource constraints).
The redistributive growth impact of policy
Much of the traditional media focus on climate change and economics centers on the costs to growth arising from climate change and the consequences of any policy response. Thus, increased taxation on air travel, or the negative impact of the weather on the Alpine tourism
How finance copes with the ticking clock 29
industry in Europe, are often cited. However, these policy consequences are more redistributive than outright negatives. Following through the example of taxing air travel, as already happens in most economies: this is not something that is an automatic negative for growth; nor is it something that is intended to be a negative for growth at either a global or local level. Instead, this should be seen as something that is redistributive. The aim of the policy is presumably not to slow economic activity, but to redirect economic activity away from those areas that are perceived to be causing negative environmental consequences. Taxing a good is not the end of the proces—taxation may deter consumption of that specific good, but that simply means that consumers have potential to spend elsewhere. Transferring consumption between sectors of an economy need not reduce total consumption. If the demand for that good is relatively price inelastic (and at low levels of taxation this seems to be the case with air travel) then the tax revenues raised do not represent ‘lost’ economic value—merely a transfer of economic value (from airline shareholders to the government as the tax-raising authority). The question then becomes one of what the government does with the revenues raised. If, for instance, tax revenues raised from a flight tax are used to support the forestry sector through government subsidy, then the taxation process is likely to be a negative for the airline industry and its growth rate, but a positive for the forestry sector and its growth rate. The growth question then simply comes down to whether the forestry industry is more or less productive than the airline industry. All else being equal, if forestry is more productive, then economic growth will actually increase as a result of a tax transfer from airlines to forestry. If forestry is less productive, then economic growth will decline. None of this is to dispute that sectors (economic or geographical) can experience negative growth from climate change and the policy response. However, from a high-level vantage point, redistribution is a different process from growth reduction, and most issues surrounding climate change are redistributive.
Climate change and economics—Physical effects
The world is already committed to some warming, and this can be expected to have an impact on growth and development. What impact it has is likely to depend to some extent on how people adapt to it, as well as on local conditions. The response, as measured in economic terms, can be expected to vary widely from one region to the next. In addition, sudden ‘shocks’ to the system should not be forgotten, since, with increased warming, the risk of such events is expected to increase. In modeling the impact of climate change on global economics, the Stern Review (Part 2, Chapter 6) takes both trend climate change and sudden shocks into account, so we think it useful to highlight its conclusions here. The impact of climate change on economic growth is modeled on the basis of an ‘integrated assessment model’, which produces estimates on the basis of a Monte Carlo simulation. The Stern Review writers ran the model under two different assumed levels of climatic response. The ‘baseline climate’ scenario was designed to give outputs consistent with the IPCC Third Assessment Report of 2001. They also ran a second scenario with amplifying natural feedbacks, also known as positive feedback loops, in the climate system. Significant change in developing countries (with Stern’s baseline case intact everywhere else) would in our view have knock-on effects for economies and firms elsewhere. It might also have implications for commodity markets, thereby having global impacts. Below, we cite several significant quotes from the Stern Review.
n ‘The cost of climate change in India and South East Asia could be as high as a 9-13% loss in GDP by 2100 compared with what could have been achieved in a world without climate change’
n ‘If rainfall—that arrives only in a single season in many tropical areas—fails, for example, a country will be left dry for over a year with powerful implications for their agricultural sector. This occurred in India in 2002 when the monsoon rains failed, resulting in a seasonal rainfall deficit of 19% and causing large losses of agricultural production and a drop of over 3% in India’s GDP’
The materiality of climate change30
n ‘From 1988 to 2004, China experienced economic losses from drought and flood equating to 1.2% and 0.8% of GDP, respectively’
n ‘Overall, a net decrease in agriculture production is anticipated, with seven provinces in the north and northwest of China particularly vulnerable (accounting for a quarter of total arable land and 14% of China’s total agricultural output by value)’
n ‘The La Niña drought in Kenya, for example, caused damage to the country amounting to 16% of GDP in each of 1998-99 and 1999-2000 financial years, with 26% of these damages due to hydropower losses and 58% due to shortfalls in industrial production’
5.3 The business of climate change
Type Financial report
Region Global
Research firm Lehman Brothers
Analysts John Llewellyn, Camille Chaix, Julia Giese
Title 1 The business of climate change—Challenges and opportunities
Date February 2007
Title 2 The business of climate change II—Policy is accelerating,
with major implications for companies and investors
Date September 2007
AMWG commentary
‘Global warming, we judge, is likely to prove one of those tectonic forces that—like globalization or the ageing of populations—gradually but powerfully changes the economic landscape in which our clients operate, and one that causes periodic sharp movements in asset prices.’ With this statement, Dr John Llewellyn, the primary author, shows the strong belief that led him to address climate change. The first publication was widely praised and a sequel came just seven months later. Both pieces are in-depth views of the business opportunities of climate change and are rich in scientific, political and economic information. Two publications of this quality and consistency from the same firm within seven months clearly indicate that climate change has become a fundamental subject for the financial community.
First publication
After an exhaustive introduction to climate regional scenarios and scientific considerations, the study goes on to economic outcomes, highlighting among other issues that:
n The consequences are globaln Impacts will persistn Uncertainties and risks are largen Even slow-moving forces like climate change can produce sharp changes in asset values
The succeeding chapters examine the involvement of various sectors: auto, aviation, banks, capital goods, chemicals, consumer, healthcare & pharmaceuticals, insurance, oil, media, mining & metals, real estate, retail, technology, telecommunications, utilities. Although the approach is not strictly related to valuation methods, this examination of a spectrum of sectors helps many types of readers understand the economic impact of environmental issues.
Second publication
The report recalls some of the scientific outcomes of the previous publication but expands further on the implications on economics and company value. A remarkable turning point is
How finance copes with the ticking clock 31
that it highlights how science is no longer the central point of discussion. Policy and investor expectations expressed in the stock markets are now centre stage.
It describes how the externalities of free and costless emissions will inevitably be internalised hence affecting firms’ valuation. The first tool used to determine the effect of policies is the measurement of the ‘social’ cost of carbon. Other elements taken into consideration are risk (specifically referred to the insurance coverage) and the discount rate (of future incomes or expenditures to express them as a present value).
The section that examines specific sectors concludes with renewables but probably understates the potential for change.
Key notes
n The effects of climate change will not be uniformn For the corporate sector, the influence of climate change impacts and policies could be the
decisive factor in the survival or success of individual firmsn Climate change is a global issue and requires an international approach
Extract
Climatology—Global and regional scenarios
Rising temperatures have already altered Earth’s climate, with consequences for: hydrology and water resources; agriculture and food security; terrestrial and freshwater ecosystems; coastal zones and marine ecosystems; and human health. Predictions of climate change are uncertain: they involve making projections outside the range of recorded experience. The scope and scale of effects will depend on the degree and speed of adaptation of countries, economies, and people; and will differ by region.
Business—Challenges and opportunities for sectors and firms
For firms, climate change, like globalization, technical change, and population ageing, is likely to be another powerful force that inexorably shapes the economic environment.
While climate change may well be a slow-moving force, asset prices will on occasion move sharply, when new evidence reaches the market, or policies are changed. Businesses are likely to be affected both by climate change itself and by policies to address it through: regulatory exposure; physical exposure; competitive exposure; and reputational—including litigational—exposure. Sectors particularly likely to be affected include: utilities; integrated oil and gas; mining and metals; insurance; pharmaceuticals; building and construction; and real estate. Within each sector, many firms will find ways of turning change to their advantage, while others will fail to adapt.
Already, with little impact yet felt from climate change, about 20% of firms enter and exit most markets each year, and only 60 to 70% survive their first two years of activity. The firms that will prosper in a climate-changed world will tend to be those that are: early to recognise its importance and its inexorability; foresee at least some of the implications for their industry; and take appropriate steps well in advance.
This is likely to involve, within an overall framework of good management practice:
n Inculcating in management a constructive culture of adaptation to a changing economic landscape
n Encouraging employees to embrace change, and equipping them to do so
n Undertaking the requisite research and development, which is often highly industry or even firm-specific
The materiality of climate change32
n Translating this research and development into appropriate investment in physical and human capital
The pace of a firm’s adaptation to climate change and related policy is thus likely to prove to be another of the forces that will influence whether, over the next several years, any given firm survives and prospers; or withers and, quite possibly, dies.
Climate change is an economic issue
In addition to being a scientific and an ethical issue, climate change is an important economic issue, given the scale of the costs that it may impose on society. Furthermore, the characteristics of the origin of this potential cost are well recognisable by the economist: climate change is a classic case of an ‘economic externality’.
It is therefore a recognised role of public policy to internalise such external costs into the cost structure of the polluter, so that the polluter becomes obliged to take into account the full economic costs of his or her actions, a policy often referred to as the ‘polluter pays’ principle.
How to quantify the economic costs of climate change
In principle, it is straightforward to understand why climate change could imply costs to a country’s gross domestic product (GDP). Typically, the volume of an economy’s output is considered to be a function of the quantity and quality of its capital stock, the size and quality of its labour force, and the economy’s overall level of technology. Both the quantity and the quality of capital and labour stand to be affected by damage inflicted by changes in climate: an extreme weather event stands to damage land, infrastructure, installations, and so on, while labour, too, stands to be negatively affected by adverse weather conditions, for example through an increase in diseases and heat stress.
Assessing the cost of abatement
The counterpart of the quantification of climate-change-related costs is the assessment of the costs implied by abatement policies, i.e. the costs implied by the actions taken to reduce carbon emissions. The estimated net cost or benefit of abating greenhouse gas emissions at the macro economic level is typically seen as depending on three principal factors:
The target level of atmospheric carbon concentration. Costs are generally considered to be a (rising) function of the target chosen. The discount rate applied. The present value of cost estimates depends considerably on the choice of discount rate. The choice of discount rate in multi-generational calculations is an ethical, as much as an economic, issue. The assumed pace of technological change. If the pace is rapid, and if it implies significant substitution opportunities, this will increase the cost/benefit ratio of near-term action, compared with a situation where technological development is slow.
There are perhaps four principal ways to achieve reductions in greenhouse gas emissions, relative to business as usual levels:
n Improving energy efficiency > The International Energy Agency (IEA) has shown that there is considerable room for adopting more efficient technologies in buildings, industry and transport. This is the main option for the manufacturing sector, and technical potential is substantial. The cost of investing in capital and equipment to increase energy efficiency differs considerably by sector
n Cutting non-fossil-fuel-related emissions > Agriculture and land-use currently account for around a third of global greenhouse gas emissions, and non-fossil fuel emissions in total account for about 40%. Three types of costs arise from ending deforestation: the
How finance copes with the ticking clock 33
opportunity cost of losing agricultural land; the cost of administering and enforcing effective action; and the cost of managing the transition
n Switching demand away from emissions-intensive goods and services >
As policy internalises the costs of the damages resulting from greenhouse gas emissions into firms’ costs, and thereby the prices paid by consumers who buy the emitting firms’ products, demand could shift towards less-emission-intensive products
n Switching to low-carbon technologies > There is already a wide range of technologies, and it is expanding rapidly. However, some are currently still much more expensive than traditional technologies. There are many possibilities to move towards the decarbonisation of the electricity and heat generation sector, the transport sector, and industry, including: wind energy; solar energy; carbon capture and storage for electricity generation; production of hydrogen for heat and transport fuels; nuclear power; hydroelectric power; and bioenergy
Adaptation versus abatement
Climate change abatement will, unavoidably, need to be supplemented by policies of adaptation to limit the damage, and hence cost, resulting from climate change. Conversely, costs of adaptation will rise exponentially if efforts to abate emissions are unsuccessful. The IPCC gives a broad definition of adaptation as any ‘… adjustment in ecological, social, or economic systems in response to actual or expected climatic stimuli and their effects or impacts’, and refers to ‘… changes in processes, practices and structures to moderate potential damage or to benefit from opportunities associated with climate change’. Some economists have tried to assess the costs of coastal protection against sea-level rise. According to one study, for most countries, protection costs are likely to be below 0.1% of GDP, at least for rises up to 0.5 metre. But for low-lying countries or regions, costs could reach 1%.
5.4 Carbon impact
Type Financial report
Region Europe
Research firm CA Cheuvreux
Analysts Erwan Créhalet, Stephane Voisin
Title Carbon impact
Date March 2009
AMWG commentary
CA Cheuvreux carbon research aims to make investors aware of the risks and changes involved in the climate challenge and measuring the impact of that challenge on European sectors and companies. The report’s objective is to better understand the impact of carbon constraints and to get a clear picture of companies’ climate change strategies.
The report opens with a snapshot of the situation in Europe. It gives insight into the carbon market by describing the drivers of emission rights prices and their effect on corporate strategies.
The study goes through the current market crisis to point out that:
n Public opinion is urging politicians to address the issue n Climate and energy issues are closely linked and share common solutions n Economics studies conclude that the cost of inaction would be much more than the cost
of actionn The recent involvement of the US is a positive driver to support momentum towards a new
agreement
The materiality of climate change34
Key notes
n Climate change would cost more in terms of GDP than the financial effort needed for supporting policies to switch to a low carbon economy
n Most climate change-related investment themes also improve energy securityn Forecasting CO2 price is key for measuring long-term impactn Carbon credit prices are expected to increase and stabilise from 2009 onwards
Extract
Climate change policies translate into substantial financial materiality: EUR 350 billion
The watering down of the final EU climate energy package and the failure of last Poznan conference, together with the current recession and the historical low in carbon prices, puts great pressure on the strengthening of the climate change policies momentum in the US and internationally with the Copenhagen deadline. While the efficiency of carbon markets can be questioned, our projection of the financial impact of the EU’s Climate and Energy Directives package over 2013-2020 is still an estimated EUR 350 billion, with + 80% borne by the power sector.
We now believe the long-term constraint points to a strong recovery
We estimate that a higher CO2 price signal is required to drive investments in low-carbon techno-logies. We have revised our long-term CO2 price assumption to EUR 30/tCO2 (vs. EUR 35/tCO2) and we believe in a rapid recovery starting in H2 2009 as we expect electricity utilities will take the advantage of the low CO2 price to start hedging their full post-2012 deficit of CO2 rights, hence pushing up the forward curve. Airlines will add to the demand side as of 2012. We consequently expect CO2 prices to almost double by 2012.
Negative environment for operating margins of electricity utilities
Low CO2 prices can be seen as a relief for short-term compliance costs of CO2-intensive players such as PPC. But a lower CO2 price also impacts electricity prices, and consequently weighs on the operating margins of power groups on deregulated markets. CO2-free (hydro, nuclear) capacities are the most adversely affected, but coal-based producers are not spared. These companies, i.e. Fortum and GDF Suez, are the best positioned to benefit from a recovery of carbon prices. CEZ is another possible player. The change in our long-term price forecast barely impacts RWE.
The climate change constraints reveal some surprises for heavy industries
Deep production cuts by heavy industries (steel, cement, pulp and paper) will exacerbate their surpluses of CO2 rights, with most CO2-intensive players perversely benefiting. Relative to our EBIT 2009E, we estimate that the impact of the potential sale of surpluses of CO2 rights might be the greatest for steelmakers ArcelorMittal (9% of EBIT 09E), Salzgitter (7%), and cement producers CPV (7%) and Cementir (6.5%).
Climate change policies in the crisis
In our view, political action to address climate change has been based on three key factors:
n Public opinion (citizens and NGOs) urging politicians to address the issue.n Energy security: climate and energy issues are closely linked and share common solutions.n Climate science and economics studies (e.g. the Stern report) concluding that the cost of
inaction would be much more than the cost of action.
We discuss below how the financial and economic crisis can shake these pillars.
How finance copes with the ticking clock 35
The energy security issue works as a back-up for clean energies
Energy security and climate change issues share common solutions such as energy efficiency and domestically available energy (e.g. renewable energy). Most climate change related investment themes also work on behalf of improving energy security.
The energy security issue is the strongest reason for getting the core measures of the EU energy and climate package passed. Energy market prices remain at historically high levels, while tensions with Russia (the gas provider for Europe) and the economic recession support the idea that energy security and energy independence will become a key theme for politics.
In the US and China, policies supporting the development of renewable energies have been developed for energy security reasons, not climate change.
This may leave more room for coal, which is more readily found over the globe than natural gas. The funding of carbon capture and storage R&D programmes could lead to a shortfall in funds expected for renewable energy.
Climate science—The economic impact of inaction would be worse
The global political consensus regarding the need to tackle the impact of human activity (greenhouse gas emissions) on climate has been built upon the recommendations and findings of the Intergovernmental Panel on Climate Change (IPCC) and on economics studies concluding that the effect of climate change would cost more in terms of GDP than the financial effort needed for supporting policies to switch to a low-carbon economy.
Copenhagen deal will be crucial for post-2012 visibility
The next key international negotiations on climate change are due to take place in Copenhagen in December 2009, where the conclusion of a post-Kyoto climate deal is possible.
Technology transfers (via Kyoto Clean Development Mechanisms) and adaptation funds are a cornerstone of the United Nations Framework Convention on Climate Change and a condition for a higher commitment of developing countries. The liquidity crisis is likely to hamper such investments and China has very recently denounced the lack of commitment of developed countries, expressing its pessimism about a future deal in Copenhagen. The crisis comes on the top of the collapse in July of the World Trade Organization’s Doha round, which tarnished international multipartite cooperation.
We believe that the economic environment will weigh on negotiations but also that governments remain committed to further tackling the now well-recognized climate change challenge.
US leadership to support momentum
The leadership of the EU and of the new US President will be crucial for a positive outcome for the Copenhagen negotiations.
In 2009, the US Congress will be working on legislation aimed at implementation of an emissions cap and trade system, and key international negotiations on climate change will be held in Copenhagen in December 2009. Both of these moves are likely to provide better visibility to features of a post-Kyoto agreement.
The US will play a leading role in the talks, but their delegation is unlikely to be allowed to commit to any binding greenhouse gas emission reduction targets as long as a federal cap and trade scheme has not been validated by the Congress (expected in early 2010).
The materiality of climate change36
Therefore, we would not expect a final comprehensive post-Kyoto agreement to come out of the Copenhagen session, even if substantial decisions can be taken, such as renewal of the use of Kyoto flexible mechanisms in a post-Kyoto framework for instance.
In any case, we see a bottom-up process of catching up the more formal UN-led top-down international regulation. The international negotiations are likely to be increasingly influenced by the bottom-up process of the creation of several regional cap and trade systems, and the will to connect them.
Analysing political momentum on climate change is key
We are entering a strong political period which will set the tone for the future of climate policies worldwide. The current crisis is due to damage the political momentum on climate change. However climate change issues related to stimulus plans and energy security concerns keep translating into substantial financial terms.
We provide a prospective analysis of the political forces driving climate change policies with a focus in Europe. At stake is a wealth transfer estimated at ~EUR 350bn over 2013-2020 from EU industries to governments, and taking the form of CO2 rights auctions.
Forecasting CO2 price is key for measuring long-term impact
The average EU CO2 price in 2008 was EUR 22.4/t, in line with our 2008 forecast of EUR 23/t set in May 2008. This was before the recession hit the market at a weak point and it again raises the spectre of over-allocation in the European carbon market. In this section, we explain why we do not believe in a Phase I crash scenario repeating itself, and highlight Kyoto carbon credits and the increasing allocation constraint in the long-term as key supports for carbon prices by 2012.
Exceptional conditions are currently putting pressure on CO2 prices
Since the beginning of 2009, spot CO2 contracts have lost another third of their value and reached an all-time low of EUR 8/tCO2 (Phase II contract). We estimate that part of this collapse was due to a rapidly worsening economic outlook for EU economies (materialising in announcements of idling capacity in CO2-intensive sectors) and the energy complex (oil, gas prices, fuel switching threshold) pointing to a bearish sentiment.
We believe that part of the current price weakness is due to unusual conditions creating selling pressure that will gradually dissipate once industrial groups in all EU-27 countries have received their CO2 rights allocation for 2008 and 2009. The current weakness of carbon prices radically contrasts with the political momentum around the world on the climate change issue. The emission reductions achieved by the current economic downturn are dwarfed by the required long-term greenhouse reduction targets.
Kyoto credits are solid price reference
We also believe that Kyoto carbon credits are a solid floor price reference, as the emission reduction constraints in the EU ETS system can be achieved through the use of Kyoto carbon credits alone. We review the fundamentals of the market of international carbon credits market and look at how the economic downturn is likely to change the balance on this market as well, with the idea of placing a fair price on CER credits. The Chinese unofficial price floor of between EUR 8-12/t is a good reference.
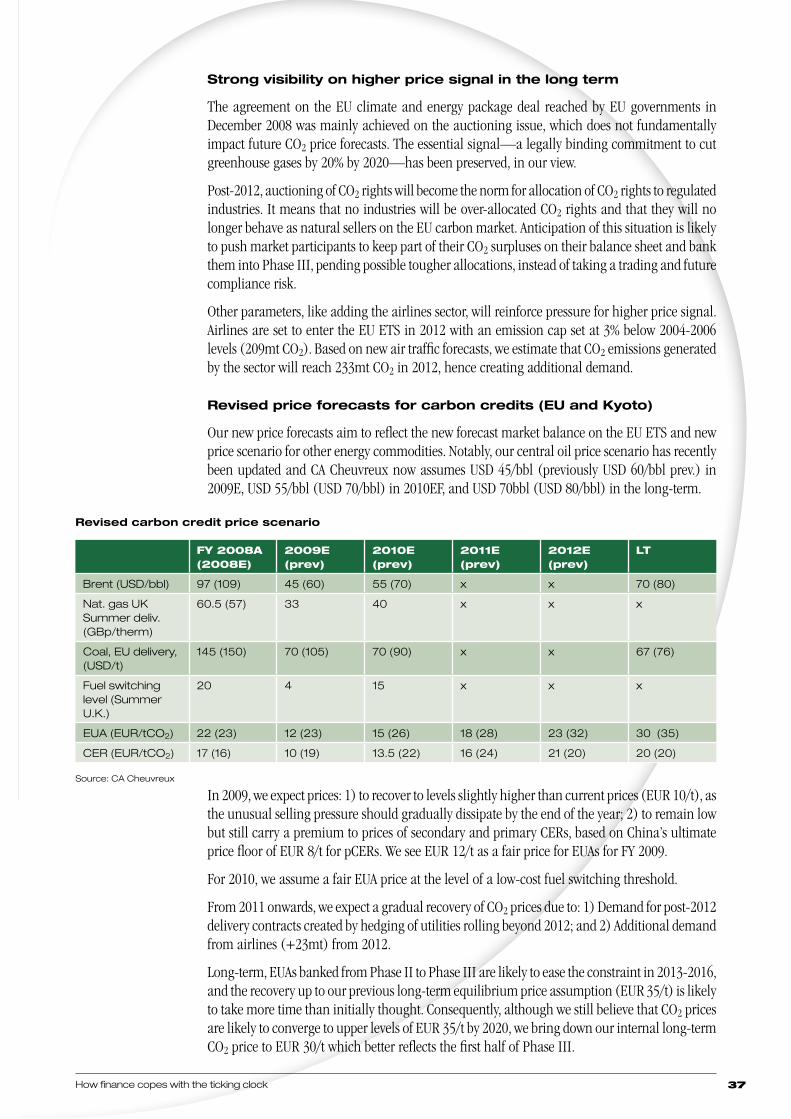
How finance copes with the ticking clock 37
Strong visibility on higher price signal in the long term
The agreement on the EU climate and energy package deal reached by EU governments in December 2008 was mainly achieved on the auctioning issue, which does not fundamentally impact future CO2 price forecasts. The essential signal—a legally binding commitment to cut greenhouse gases by 20% by 2020—has been preserved, in our view.
Post-2012, auctioning of CO2 rights will become the norm for allocation of CO2 rights to regulated industries. It means that no industries will be over-allocated CO2 rights and that they will no longer behave as natural sellers on the EU carbon market. Anticipation of this situation is likely to push market participants to keep part of their CO2 surpluses on their balance sheet and bank them into Phase III, pending possible tougher allocations, instead of taking a trading and future compliance risk.
Other parameters, like adding the airlines sector, will reinforce pressure for higher price signal. Airlines are set to enter the EU ETS in 2012 with an emission cap set at 3% below 2004-2006 levels (209mt CO2). Based on new air traffic forecasts, we estimate that CO2 emissions generated by the sector will reach 233mt CO2 in 2012, hence creating additional demand.
Revised price forecasts for carbon credits (EU and Kyoto)
Our new price forecasts aim to reflect the new forecast market balance on the EU ETS and new price scenario for other energy commodities. Notably, our central oil price scenario has recently been updated and CA Cheuvreux now assumes USD 45/bbl (previously USD 60/bbl prev.) in 2009E, USD 55/bbl (USD 70/bbl) in 2010EF, and USD 70bbl (USD 80/bbl) in the long-term.
Revised carbon credit price scenario
FY 2008A (2008E)
2009E (prev)
2010E (prev)
2011E (prev)
2012E (prev)
LT
Brent (USD/bbl) 97 (109) 45 (60) 55 (70) x x 70 (80)
Nat. gas UK Summer deliv. (GBp/therm)
60.5 (57) 33 40 x x x
Coal, EU delivery, (USD/t)
145 (150) 70 (105) 70 (90) x x 67 (76)
Fuel switching level (Summer U.K.)
20 4 15 x x x
EUA (EUR/tCO2) 22 (23) 12 (23) 15 (26) 18 (28) 23 (32) 30 (35)
CER (EUR/tCO2) 17 (16) 10 (19) 13.5 (22) 16 (24) 21 (20) 20 (20)
Source: CA Cheuvreux
In 2009, we expect prices: 1) to recover to levels slightly higher than current prices (EUR 10/t), as the unusual selling pressure should gradually dissipate by the end of the year; 2) to remain low but still carry a premium to prices of secondary and primary CERs, based on China’s ultimate price floor of EUR 8/t for pCERs. We see EUR 12/t as a fair price for EUAs for FY 2009.
For 2010, we assume a fair EUA price at the level of a low-cost fuel switching threshold.
From 2011 onwards, we expect a gradual recovery of CO2 prices due to: 1) Demand for post-2012 delivery contracts created by hedging of utilities rolling beyond 2012; and 2) Additional demand from airlines (+23mt) from 2012.
Long-term, EUAs banked from Phase II to Phase III are likely to ease the constraint in 2013-2016, and the recovery up to our previous long-term equilibrium price assumption (EUR 35/t) is likely to take more time than initially thought. Consequently, although we still believe that CO2 prices are likely to converge to upper levels of EUR 35/t by 2020, we bring down our internal long-term CO2 price to EUR 30/t which better reflects the first half of Phase III.
The materiality of climate change38
6 US engagement and the EU agenda
A prerequisite for the financial sector to engage on climate change is sound public policy.10 Given the uncertain governance that surrounds international agreements, and the reluctance of some administrations to participate in the Kyoto Protocol or to undertake stringent domestic actions, the intentions of the United States and European Union are critical for confidence. True, the recent declaration by the G8 of a target of an 80% reduction in emissions from that bloc by 2050 is encouraging, but it needs to be defined precisely, with targets for intermediate years. It is unsatisfactory that there is no agreement on the baseline year, simply a reference to ‘efforts must be comparable.’
6.1 US approach and policies on climate change
The US domestic response to climate change and efforts to reduce GHG emissions prior to 2009 have been largely voluntary activities at the federal, state, local, and corporate levels. The most positive development was that individual states banded together (sometimes with Canadian provinces) to set up three emissions trading schemes based on a ‘cap-and-trade’ model:
n The Eastern US 10-state Regional Greenhouse Gas Initiative11
n The Midwestern Greenhouse Gas Reduction Accord12, which joined six US states with Canada’s Manitoba
n The 11-state-and-4-Canadian-province Western Climate Initiative13
These schemes will likely be replaced by a federal system (see below).
Despite progress by some companies that have cut emissions by 10% or more, overall emissions growth in the US has not been curbed and emissions increased roughly 12% over the past decade. Inaction by the US—the world’s largest economy and largest historic greenhouse gas emitter—has been a drag on the global playing field of climate change. The US now has the opportunity to drive the global climate effort through renewed leadership at home and abroad.14
Internationally, US negotiators under the Obama administration have already struck a more positive note. Aside from an international treaty, bilateral arrangements are important to build confidence and generate momentum. Of all its bilateral relationships, perhaps the most complex for the US is the one with China. Close collaboration on clean coal technology and other energy and climate challenges can produce benefits for both countries and help move towards a multilateral agreement. The Pew Center on Global Climate Change recently released a proposed, forward-looking US-China roadmap15 for collaborative ways of reducing emissions.
2009: President Obama’s initiative
President Barack Obama is expected to make good on a commitment to proactively address climate change across a range of activities and functions in the US. President Obama’s economic stimulus package (American Recovery and Reinvestment Act of 2009) will include various ‘green’ provisions. Among those relating to climate change are the following three areas:
10 The future of climate policy – The financial sector perspective, CEO Briefing for COP13 (2005), UNEP FI Climate Change Working Group11 See http://www.rggi.org 12 See http://www.midwesternaccord.org 13 See http://www.westernclimateinitiative.org 14 Pew Center on Global Climate Change15 See http://www.pewclimate.org/US-China
How finance copes with the ticking clock 39
n Renewable portfolio standards (RPS) for electric generation and promoting
clean technologies and practices
RPS exists now in approximately 28 states; others are following the lead by setting informal goals. The consensus view is that RPS will be passed by Congress within 6 to 12 months and will standardise and expand the end-market for renewable energy sources, with a renewable capacity of 4GW to 6GW being added each year.
In 2007, renewable generation, excluding existing hydro plants, accounted for 2% of total GW capacity and 2% of total electric energy (WMh) generated. Legislation could include multiple targets, with the first being in 2012 or 2015 and with incremental, more stringent targets beyond that date. A ‘first target’ might be 12.5% of total mega-watt hours (MWh) generated from renewables by 2015 (excluding current hydro generation), with tighter requirements for 2020 and 2025.
A federally-mandated standard will do much to increase the level of renewable generation plants in the US. However, the current lack of a centralised market for renewable energy credits (RECs) hinders development of renewable energy. The forecasting of requirements is challenging, but the huge scale of any federal mandates has the potential to create significant tailwinds for suppliers and ensure more certainty that the US end-markets will grow.
The US power sector16
Electric utilities account for approximately one-third of the total GHG emissions in the US. Implementation of carbon regulations will reduce uncertainty for utility regulators and business managers regarding future additions of coal and nuclear generation.
Short-term improvements in technologies can significantly enhance energy efficiency and expand use of lower carbon fuels. In the long-term, new technologies will be needed to develop non-fossil energy sources. Coordinated and sustained incentives and direct investment can be used to promote technological innovation (e.g. targeted tax credits or low-interest loans to encourage development). However, while the impact of carbon regulation is significant, the most important variable for the power sector under a base case scenario will be natural gas prices, which often drive power prices. Lower natural gas and power prices may negate incentives meant to spur development and implementation of lower carbon energy sources.
The regional impact on the cost of power is significant, especially where companies maintain the bulk of their coal, nuclear, or other base load generation assets, and in regions where coal generation sets the clearing price for power. According to Goldman Sachs, in the first year of a carbon regime, power costs increase 10% to 25%, compared to existing 2012 wholesale price forecasts that exclude the impact of carbon regulation. Electricity costs could increase dramatically beyond this, as the increased costs of carbon credits for coal and gas-fired facilities flow through to end users. Across the US, by 2020, power prices could increase anywhere within the range of 15% to 40%.
n Road transport energy usage17
Changes to fuel economy standards or the gasoline tax will have a marginal near-term impact on oil companies. A modest fuel economy bill would have a limited impact on global oil demand and pricing, since standards would only apply to new cars. However, even a modest bill would be likely to help reduce long-term US dependence on overseas sources of oil. Increased infrastructure (highway) spending in the upcoming 2009 highway bill drives larger end-markets for select industrial companies, creating long-term increases in the potential revenue streams.
A gasoline tax would affect miles traveled while an increase in federal fuel economy standards would cause those miles to be traveled using fewer gallons of gasoline. The primary driver of oil demand growth remains non-OECD demand growth, primarily from China, Latin America, India, and the Middle East.
16 GS Sustain, America: Utilities – Power (26 May 2008)17 GS Sustain, United States Energy (16 January 2009)
The materiality of climate change40
n Renewable energy tax credits and finance
The bill extends tax credits for a wide range of industrial-scale and residential renewable energy installations, as well as energy efficiency equipment. In the face of the credit drought, it also authorises an additional USD 1.6 billion of new clean renewable energy bonds to finance facilities that generate such electricity, with a further USD 2.4 billion of to finance state, municipal and tribal government programmes.
2009: The Waxman-Markey bill
More formally titled The American Clean Energy and Security Act of 2009, the bill has now passed through Congress, and will be presented to the Senate. It has many provisions, but at its core is a cap-and-trade plan.
n The bill requires a 17% emissions reduction from 2005 levels by 2020; and 80% by 2050
n It includes a renewable electricity standard (almost identical to a renewable portfolio standard), requiring each major electricity provider to produce 20% of its electricity from renewable sources (such as wind) by 2020
n It provides for expanded production of electric vehicles
n It mandates significant increases in energy efficiency in buildings, home appliances, and electricity generation
The bill’s cap-and-trade programme allocates 85% of allowances to industry for free, auctioning the remainder. Fifteen percent will be auctioned, the revenue from which shall be redistributed to low-income households. Thirty percent of the allowances will be allocated directly to local distribution companies who are mandated to use them exclusively for the benefit of customers. Five percent will go to merchant coal generators and others with long-term power purchase agreements.
Some environmental organisations have criticised the proposed fuel efficiency standards because new cars would only need to get 22 MPG to be considered fuel efficient. New SUVs and pick-up trucks would only need to get 18 MPG to be considered fuel efficient. Another criticism is that too many emission permits are distributed free. However, the same was true of the EU’s Emissions Trading Scheme.
6.2 The EU and climate change18
A bit of history
The EU, responsible for around 14% of global GHG emissions today, has been in the vanguard of international efforts to tackle climate change. As early as 1990, the EU voluntarily committed to stabilising its emissions of CO2 at the 1990 level by 2000, a target it succeeded in achieving. It was also instrumental in negotiating and implementing the 1992 UN Framework Convention on Climate Change and its 1997 Kyoto Protocol.
Under the Kyoto Protocol, the 15 countries that made up the EU at that time took on a particularly ambitious target—to reduce their collective greenhouse gas emissions by 8% below 1990 levels until 2012. This overall target has been translated into a specific legally binding target for each member state based on its capacity to curb emissions. As of 2006 (the latest available data), emissions from the EU-15 were 2.7% below 1990 levels. The balance will be achieved through further cuts from the measures already in force, reforestation, and purchasing emissions allowances through the flexible mechanisms of the Kyoto Protocol, In fact, the EU may outperform given the current slackening in economic growth.
18 Source: European Commission website: http://ec.europa.eu/environment/climat/campaign/actions/euinitiatives_en.htm (March 2009)
How finance copes with the ticking clock 41
A variety of climate-related initiatives have been implemented at EU and national levels since the early 1990s. The European Commission launched the European Climate Change Programme (ECCP) in 2000, working with industry, environmental organisations, and other stakeholders to identify cost-effective measures to reduce emissions.
The cornerstone of EU climate change policies is the EU’s Emissions Trading Scheme (ETS), which was launched in 2005. EU governments have set limits on how much CO2 some 10,500 power plants and energy-intensive factories are allowed to emit each year, accounting for almost half of the EU’s total CO2 emissions.
The EU ETS gives a financial incentive to reduce emissions by establishing a market-based trading system. Plants that emit less CO2 than their limits can sell their unused emission quotas to other companies that have emissions higher than their allowances. Companies that exceed their emission limits and do not cover them with emission rights bought from others have to pay hefty penalties. The result is that emissions are cut where it is cheapest, lowering the overall costs of reducing emissions.
Other ECCP measures include improving the fuel efficiency of cars and the energy efficiency of buildings (better insulation can reduce heating costs by 90%); increasing the use of renewable energy sources such as wind, sun, tidal power, biomass (organic material such as wood, mill residues, plants or animal droppings), and geothermal power (heat from hot springs or volcanoes); and reducing methane emissions from landfills.
The strategy is to extend and strengthen the measures in place. Proposals to include airlines in the EU ETS and reduce CO2 emissions from new cars through design changes have now been agreed upon, and a start has been made on developing carbon capture and storage technology, as well as funding measures to adapt to climate change.
Going forward
European leaders adopted a climate and energy package in December 2008 with a series of proposals for concrete actions and a set of ambitious targets. Europe is now committed to cutting overall greenhouse gas emissions to at least 20% below 1990 levels by 2020, a commitment that will rise to 30% if other industrialised countries agree on similar action. (Note: Individual countries, such as the UK and France, have committed to targets in the region of 80% by 2050.)
To achieve this level of reduction, other targets have been set—to boost energy efficiency by 20% by 2020, to increase the share of renewable energy in energy consumption to an average of 20% by 2020 across the EU, and to derive 10% of transport fuels from biofuels by 2020.
The package strengthens the ETS to cover all major industrial emitters and mandates auctioning. In sectors not covered by the ETS (e.g. buildings, transport, agriculture, waste), emissions are to be reduced by 10% below 2005 levels by 2020. Other measures boost carbon capture and storage technologies, cut CO2 from cars, and will introduce tighter fuel quality standards.
The EU is militating for a new international agreement to stabilise greenhouse gas emissions before 2020, then cutting global emissions by at least half of their 1990 levels by 2050, which means around 80% for Annex I countries.
This means concentrating on increasing energy efficiency, which can substantially reduce emissions at zero or even negative cost, accelerating the development and deployment of new, clean energy technologies, reversing the decline of tropical forests, and ensuring that the necessary funding mechanisms are in place.
Over half of the investment required will be in developing countries, so the EU is an active user of the CDM and is looking to create innovative international sources of finance based on countries’ emission levels and their ability to pay.

The materiality of climate change42
The EU is also cooperating internationally on low carbon technologies with India and China. For example, the European Commission and the UK are funding the first phase of work on a near-zero emission coal plant in China using carbon capture and storage technology. This technology allows the CO2 emitted when power stations burn coal or other fossil fuels to be captured and stored in underground geological formations where it cannot escape back to the atmosphere.
How finance copes with the ticking clock 43
7 Carbon intensive sectors, carbon sequestration and energy efficiency
7.1 Introduction
As the world moves towards decarbonisation, carbon intensive sectors will be disproportionately affected. These industries will face issues with short-term competitiveness and long-term paradigm changes.
Demand for energy can be influenced by a number of means, including fiscal measures and changes in human behaviour. Technological improvements and changes will provide distinct options for reducing emissions by improving energy efficiency, switching to low or no-carbon fuels, and preventing CO2 produced by fossil fuel combustion from building up in the atmosphere.19
Given the present heavy dependence on fossil fuels, technology that will allow for the continued use of fossil fuels without substantial emissions should be pursued.
Growing natural carbon sinks (systems that are net absorbers of CO2 emissions) by enhancing the growth of terrestrial biomass (e.g. forests) or ocean-based biomass could also result in significant contributions towards curbing the growth of CO2 in the atmosphere. Given the quantities of CO2 involved, a combination of these measures is undoubtedly necessary.20
Expected impacts of climate policy and regulation on carbon-intensive sectors
Climate policies aimed at reducing and curbing future carbon emissions by imposing a cost on GHG emissions will likely increase downstream costs. It is widely expected that consumers will face these pass-through costs as regulation is put in place to curb and/or attach direct or indirect costs on emitters. However, the costs of mitigation will not be felt uniformly across countries and sectors. Climate policy should be structured to avoid the risk of these industries relocating to countries with less stringent regulations.21
This section of the report outlines the main geopolitical factors which financial analysts consider, using authoritative studies such as those of the IPCC as the basis. The technical (i.e. operational) factors are often covered in great detail by analysts in their studies. Here we focus on three issues in depth—carbon capture and storage, aviation, and finance for energy efficiency.
Power generation is the largest source of global CO2 emissions, but there are many other carbon-intensive sectors that emit significant amounts of CO2 and other greenhouse gases directly and through their products or inputs—agriculture, chemicals & pharmaceuticals, construction & building products (e.g. cement), oil & gas, raw materials (e.g. metals), mining, paper, forest products and packaging, transport, and utilities.
19 http://www.ieagreen.org.uk/emissions.html 20 http://www.ieagreen.org.uk/emissions.html 21 Leveling the carbon playing field: International competition and U.S. climate policy design (May 2008), Peterson Institute for International Economics and
World Resources Institute http://www.wri.org/publication/leveling-the-carbon-playing-field
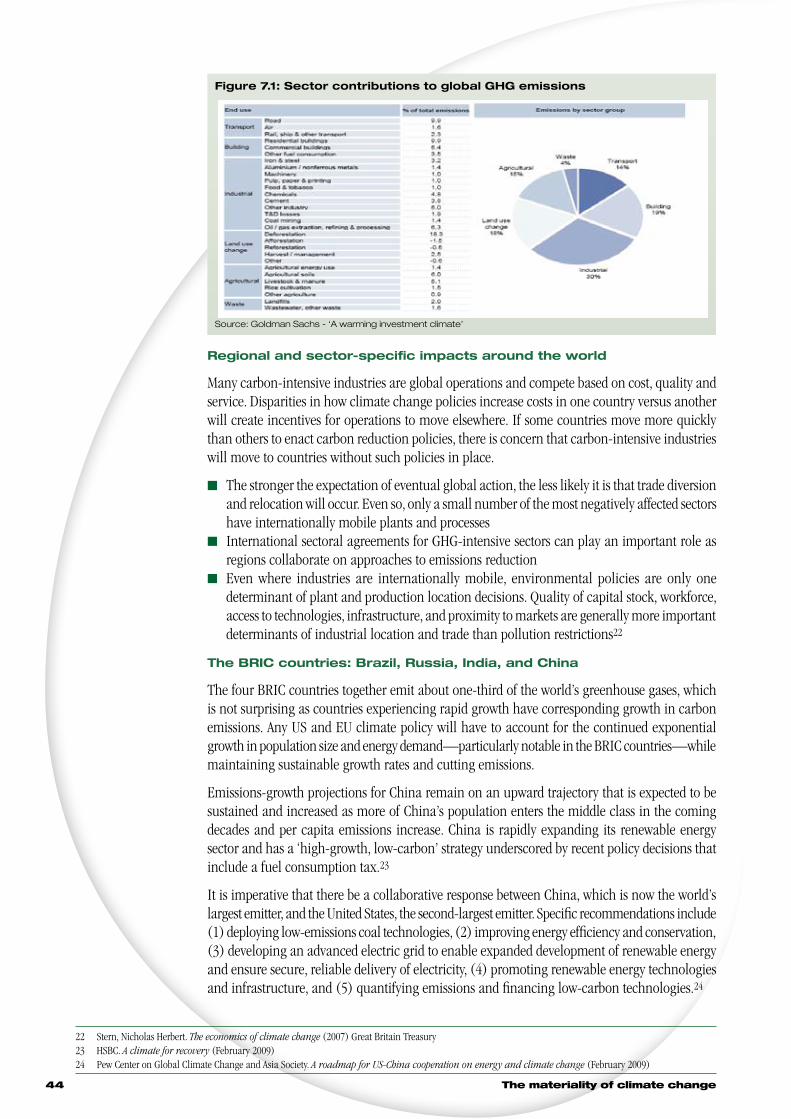
The materiality of climate change44
Regional and sector-specific impacts around the world
Many carbon-intensive industries are global operations and compete based on cost, quality and service. Disparities in how climate change policies increase costs in one country versus another will create incentives for operations to move elsewhere. If some countries move more quickly than others to enact carbon reduction policies, there is concern that carbon-intensive industries will move to countries without such policies in place.
n The stronger the expectation of eventual global action, the less likely it is that trade diversion and relocation will occur. Even so, only a small number of the most negatively affected sectors have internationally mobile plants and processes
n International sectoral agreements for GHG-intensive sectors can play an important role as regions collaborate on approaches to emissions reduction
n Even where industries are internationally mobile, environmental policies are only one determinant of plant and production location decisions. Quality of capital stock, workforce, access to technologies, infrastructure, and proximity to markets are generally more important determinants of industrial location and trade than pollution restrictions22
The BRIC countries: Brazil, Russia, India, and China
The four BRIC countries together emit about one-third of the world’s greenhouse gases, which is not surprising as countries experiencing rapid growth have corresponding growth in carbon emissions. Any US and EU climate policy will have to account for the continued exponential growth in population size and energy demand—particularly notable in the BRIC countries—while maintaining sustainable growth rates and cutting emissions.
Emissions-growth projections for China remain on an upward trajectory that is expected to be sustained and increased as more of China’s population enters the middle class in the coming decades and per capita emissions increase. China is rapidly expanding its renewable energy sector and has a ‘high-growth, low-carbon’ strategy underscored by recent policy decisions that include a fuel consumption tax.23
It is imperative that there be a collaborative response between China, which is now the world’s largest emitter, and the United States, the second-largest emitter. Specific recommendations include (1) deploying low-emissions coal technologies, (2) improving energy efficiency and conservation, (3) developing an advanced electric grid to enable expanded development of renewable energy and ensure secure, reliable delivery of electricity, (4) promoting renewable energy technologies and infrastructure, and (5) quantifying emissions and financing low-carbon technologies.24
22 Stern, Nicholas Herbert. The economics of climate change (2007) Great Britain Treasury23 HSBC. A climate for recovery (February 2009)24 Pew Center on Global Climate Change and Asia Society. A roadmap for US-China cooperation on energy and climate change (February 2009)
Figure 7.1: Sector contributions to global GHG emissions
Source: Goldman Sachs - ‘A warming investment climate’
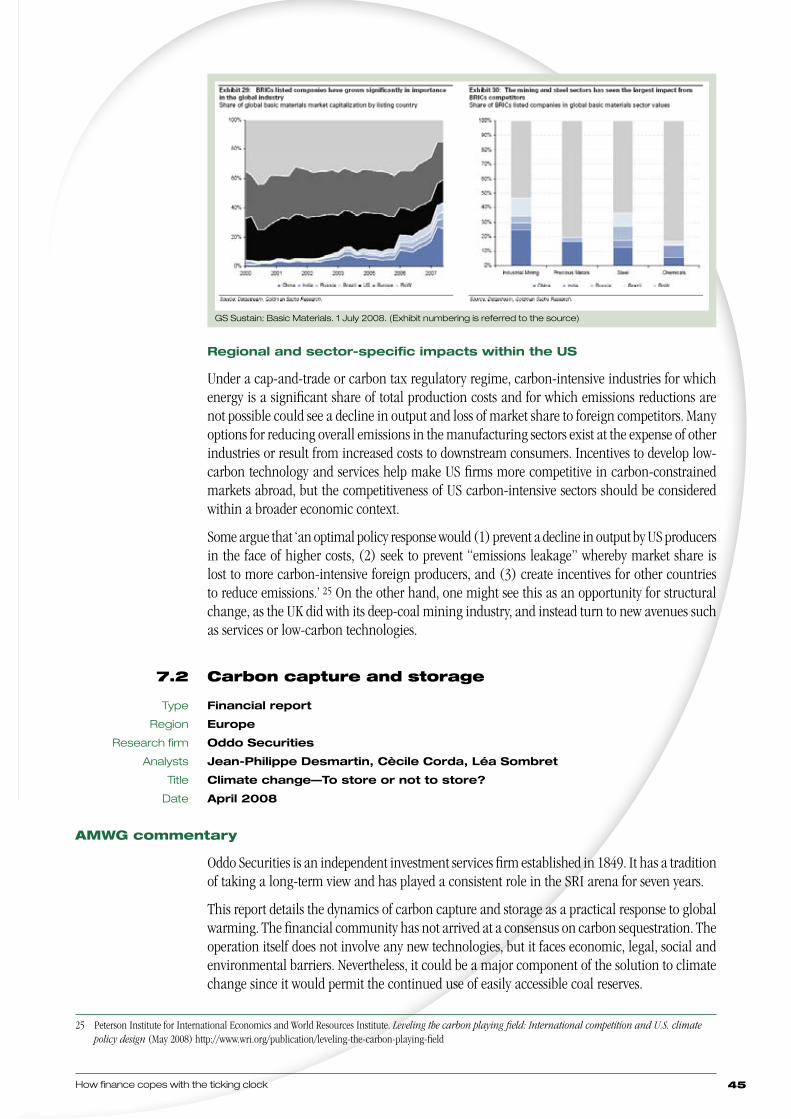
How finance copes with the ticking clock 45
Regional and sector-specific impacts within the US
Under a cap-and-trade or carbon tax regulatory regime, carbon-intensive industries for which energy is a significant share of total production costs and for which emissions reductions are not possible could see a decline in output and loss of market share to foreign competitors. Many options for reducing overall emissions in the manufacturing sectors exist at the expense of other industries or result from increased costs to downstream consumers. Incentives to develop low-carbon technology and services help make US firms more competitive in carbon-constrained markets abroad, but the competitiveness of US carbon-intensive sectors should be considered within a broader economic context.
Some argue that ‘an optimal policy response would (1) prevent a decline in output by US producers in the face of higher costs, (2) seek to prevent “emissions leakage” whereby market share is lost to more carbon-intensive foreign producers, and (3) create incentives for other countries to reduce emissions.’ 25 On the other hand, one might see this as an opportunity for structural change, as the UK did with its deep-coal mining industry, and instead turn to new avenues such as services or low-carbon technologies.
7.2 Carbon capture and storage
Type Financial report
Region Europe
Research firm Oddo Securities
Analysts Jean-Philippe Desmartin, Cècile Corda, Léa Sombret
Title Climate change—To store or not to store?
Date April 2008
AMWG commentary
Oddo Securities is an independent investment services firm established in 1849. It has a tradition of taking a long-term view and has played a consistent role in the SRI arena for seven years.
This report details the dynamics of carbon capture and storage as a practical response to global warming. The financial community has not arrived at a consensus on carbon sequestration. The operation itself does not involve any new technologies, but it faces economic, legal, social and environmental barriers. Nevertheless, it could be a major component of the solution to climate change since it would permit the continued use of easily accessible coal reserves.
25 Peterson Institute for International Economics and World Resources Institute. Leveling the carbon playing field: International competition and U.S. climate policy design (May 2008) http://www.wri.org/publication/leveling-the-carbon-playing-field
GS Sustain: Basic Materials. 1 July 2008. (Exhibit numbering is referred to the source)
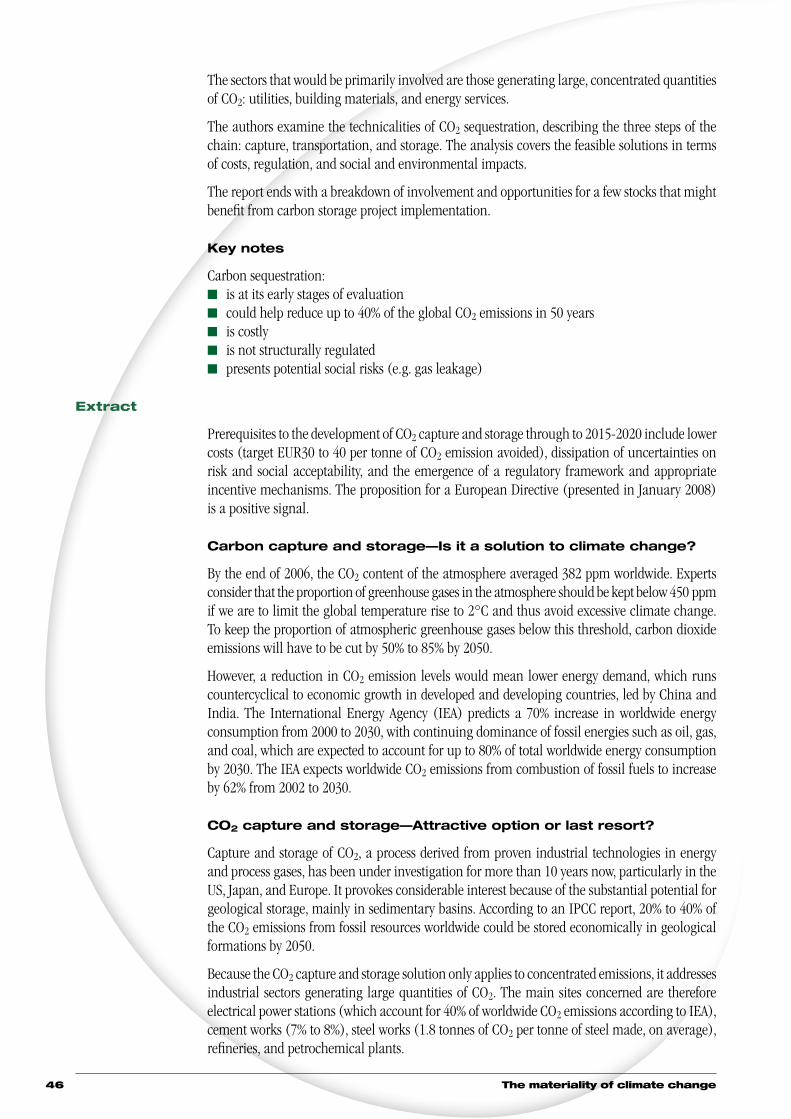
The materiality of climate change46
The sectors that would be primarily involved are those generating large, concentrated quantities of CO2: utilities, building materials, and energy services.
The authors examine the technicalities of CO2 sequestration, describing the three steps of the chain: capture, transportation, and storage. The analysis covers the feasible solutions in terms of costs, regulation, and social and environmental impacts.
The report ends with a breakdown of involvement and opportunities for a few stocks that might benefit from carbon storage project implementation.
Key notes
Carbon sequestration:n is at its early stages of evaluationn could help reduce up to 40% of the global CO2 emissions in 50 yearsn is costlyn is not structurally regulatedn presents potential social risks (e.g. gas leakage)
Extract
Prerequisites to the development of CO2 capture and storage through to 2015-2020 include lower costs (target EUR30 to 40 per tonne of CO2 emission avoided), dissipation of uncertainties on risk and social acceptability, and the emergence of a regulatory framework and appropriate incentive mechanisms. The proposition for a European Directive (presented in January 2008) is a positive signal.
Carbon capture and storage—Is it a solution to climate change?
By the end of 2006, the CO2 content of the atmosphere averaged 382 ppm worldwide. Experts consider that the proportion of greenhouse gases in the atmosphere should be kept below 450 ppm if we are to limit the global temperature rise to 2°C and thus avoid excessive climate change. To keep the proportion of atmospheric greenhouse gases below this threshold, carbon dioxide emissions will have to be cut by 50% to 85% by 2050.
However, a reduction in CO2 emission levels would mean lower energy demand, which runs countercyclical to economic growth in developed and developing countries, led by China and India. The International Energy Agency (IEA) predicts a 70% increase in worldwide energy consumption from 2000 to 2030, with continuing dominance of fossil energies such as oil, gas, and coal, which are expected to account for up to 80% of total worldwide energy consumption by 2030. The IEA expects worldwide CO2 emissions from combustion of fossil fuels to increase by 62% from 2002 to 2030.
CO2 capture and storage—Attractive option or last resort?
Capture and storage of CO2, a process derived from proven industrial technologies in energy and process gases, has been under investigation for more than 10 years now, particularly in the US, Japan, and Europe. It provokes considerable interest because of the substantial potential for geological storage, mainly in sedimentary basins. According to an IPCC report, 20% to 40% of the CO2 emissions from fossil resources worldwide could be stored economically in geological formations by 2050.
Because the CO2 capture and storage solution only applies to concentrated emissions, it addresses industrial sectors generating large quantities of CO2. The main sites concerned are therefore electrical power stations (which account for 40% of worldwide CO2 emissions according to IEA), cement works (7% to 8%), steel works (1.8 tonnes of CO2 per tonne of steel made, on average), refineries, and petrochemical plants.
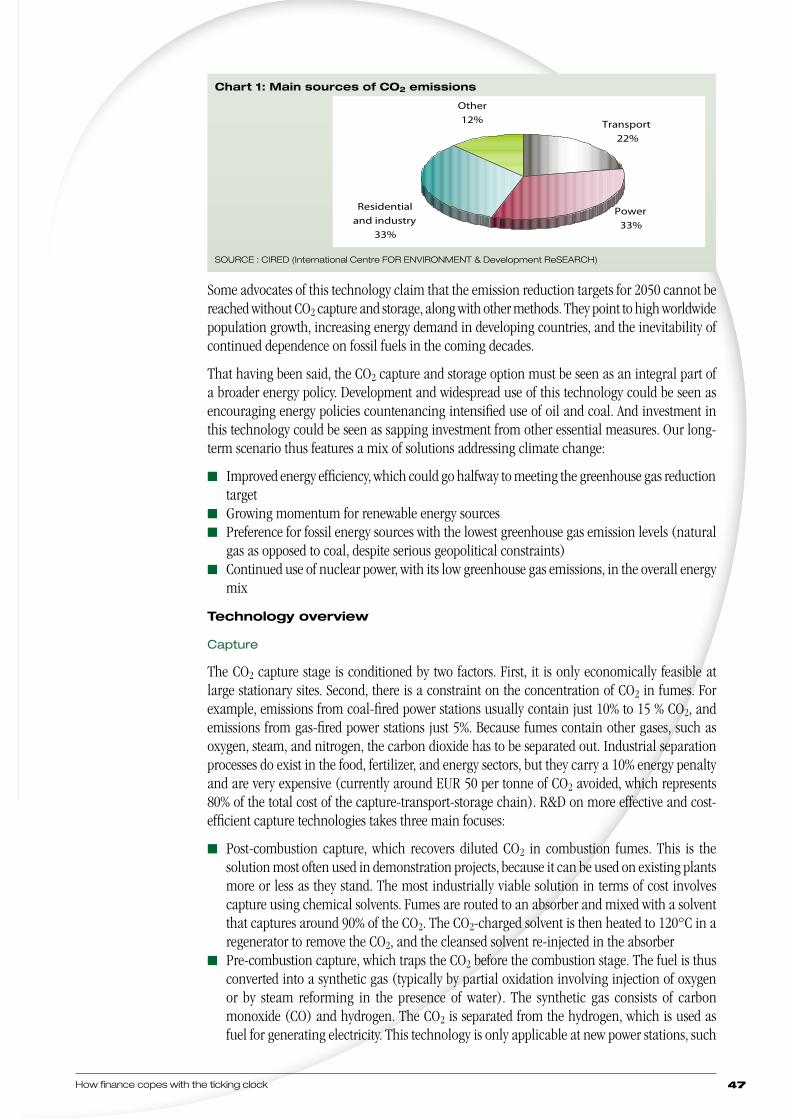
How finance copes with the ticking clock 47
Some advocates of this technology claim that the emission reduction targets for 2050 cannot be reached without CO2 capture and storage, along with other methods. They point to high worldwide population growth, increasing energy demand in developing countries, and the inevitability of continued dependence on fossil fuels in the coming decades.
That having been said, the CO2 capture and storage option must be seen as an integral part of a broader energy policy. Development and widespread use of this technology could be seen as encouraging energy policies countenancing intensified use of oil and coal. And investment in this technology could be seen as sapping investment from other essential measures. Our long-term scenario thus features a mix of solutions addressing climate change:
n Improved energy efficiency, which could go halfway to meeting the greenhouse gas reduction target
n Growing momentum for renewable energy sourcesn Preference for fossil energy sources with the lowest greenhouse gas emission levels (natural
gas as opposed to coal, despite serious geopolitical constraints)n Continued use of nuclear power, with its low greenhouse gas emissions, in the overall energy
mix
Technology overview
Capture
The CO2 capture stage is conditioned by two factors. First, it is only economically feasible at large stationary sites. Second, there is a constraint on the concentration of CO2 in fumes. For example, emissions from coal-fired power stations usually contain just 10% to 15 % CO2, and emissions from gas-fired power stations just 5%. Because fumes contain other gases, such as oxygen, steam, and nitrogen, the carbon dioxide has to be separated out. Industrial separation processes do exist in the food, fertilizer, and energy sectors, but they carry a 10% energy penalty and are very expensive (currently around EUR 50 per tonne of CO2 avoided, which represents 80% of the total cost of the capture-transport-storage chain). R&D on more effective and cost-efficient capture technologies takes three main focuses:
n Post-combustion capture, which recovers diluted CO2 in combustion fumes. This is the solution most often used in demonstration projects, because it can be used on existing plants more or less as they stand. The most industrially viable solution in terms of cost involves capture using chemical solvents. Fumes are routed to an absorber and mixed with a solvent that captures around 90% of the CO2. The CO2-charged solvent is then heated to 120°C in a regenerator to remove the CO2, and the cleansed solvent re-injected in the absorber
n Pre-combustion capture, which traps the CO2 before the combustion stage. The fuel is thus converted into a synthetic gas (typically by partial oxidation involving injection of oxygen or by steam reforming in the presence of water). The synthetic gas consists of carbon monoxide (CO) and hydrogen. The CO2 is separated from the hydrogen, which is used as fuel for generating electricity. This technology is only applicable at new power stations, such
Chart 1: Main sources of CO2 emissions
SOURCE : CIRED (International Centre FOR ENVIRONMENT & Development ReSEARCH)
Transport22%
Power33%
Residential and industry
33%
Other12%
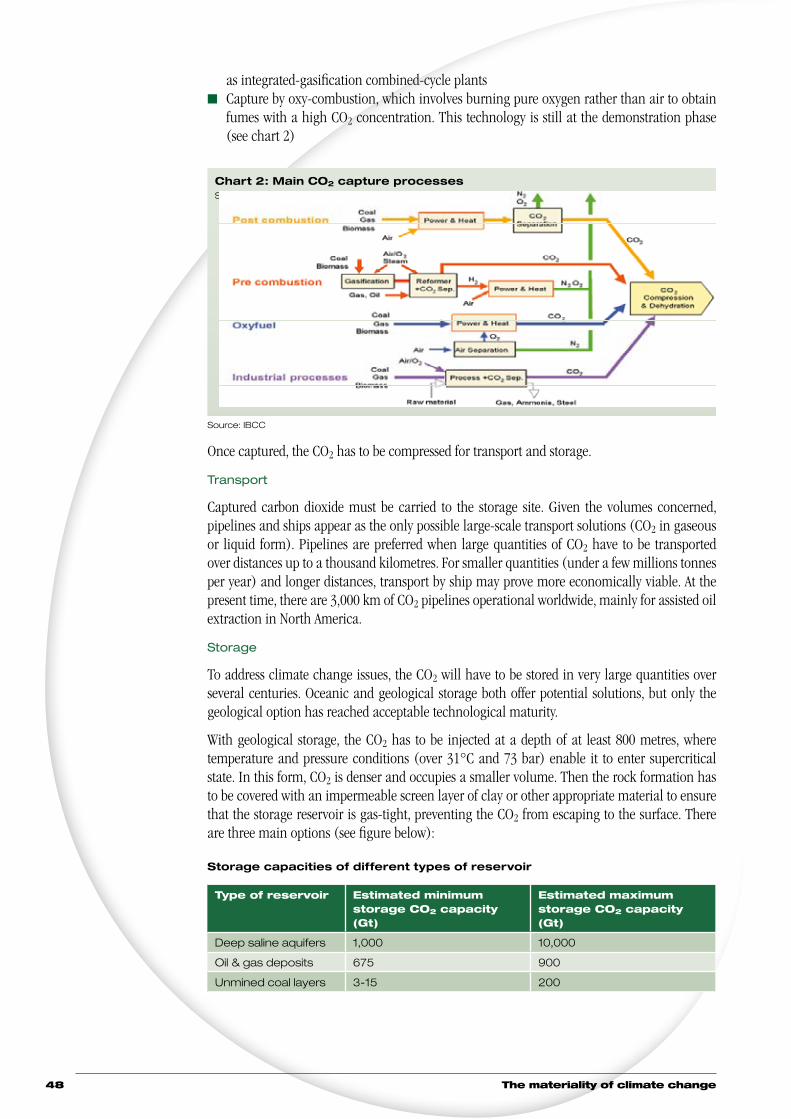
The materiality of climate change48
as integrated-gasification combined-cycle plantsn Capture by oxy-combustion, which involves burning pure oxygen rather than air to obtain
fumes with a high CO2 concentration. This technology is still at the demonstration phase (see chart 2)
Source: IBCC
Once captured, the CO2 has to be compressed for transport and storage.
Transport
Captured carbon dioxide must be carried to the storage site. Given the volumes concerned, pipelines and ships appear as the only possible large-scale transport solutions (CO2 in gaseous or liquid form). Pipelines are preferred when large quantities of CO2 have to be transported over distances up to a thousand kilometres. For smaller quantities (under a few millions tonnes per year) and longer distances, transport by ship may prove more economically viable. At the present time, there are 3,000 km of CO2 pipelines operational worldwide, mainly for assisted oil extraction in North America.
Storage
To address climate change issues, the CO2 will have to be stored in very large quantities over several centuries. Oceanic and geological storage both offer potential solutions, but only the geological option has reached acceptable technological maturity.
With geological storage, the CO2 has to be injected at a depth of at least 800 metres, where temperature and pressure conditions (over 31°C and 73 bar) enable it to enter supercritical state. In this form, CO2 is denser and occupies a smaller volume. Then the rock formation has to be covered with an impermeable screen layer of clay or other appropriate material to ensure that the storage reservoir is gas-tight, preventing the CO2 from escaping to the surface. There are three main options (see figure below):
Storage capacities of different types of reservoir
Type of reservoir Estimated minimum storage CO2 capacity (Gt)
Estimated maximum storage CO2 capacity (Gt)
Deep saline aquifers 1,000 10,000
Oil & gas deposits 675 900
Unmined coal layers 3-15 200
Chart 2: Main CO2 capture processesSource : IPCC
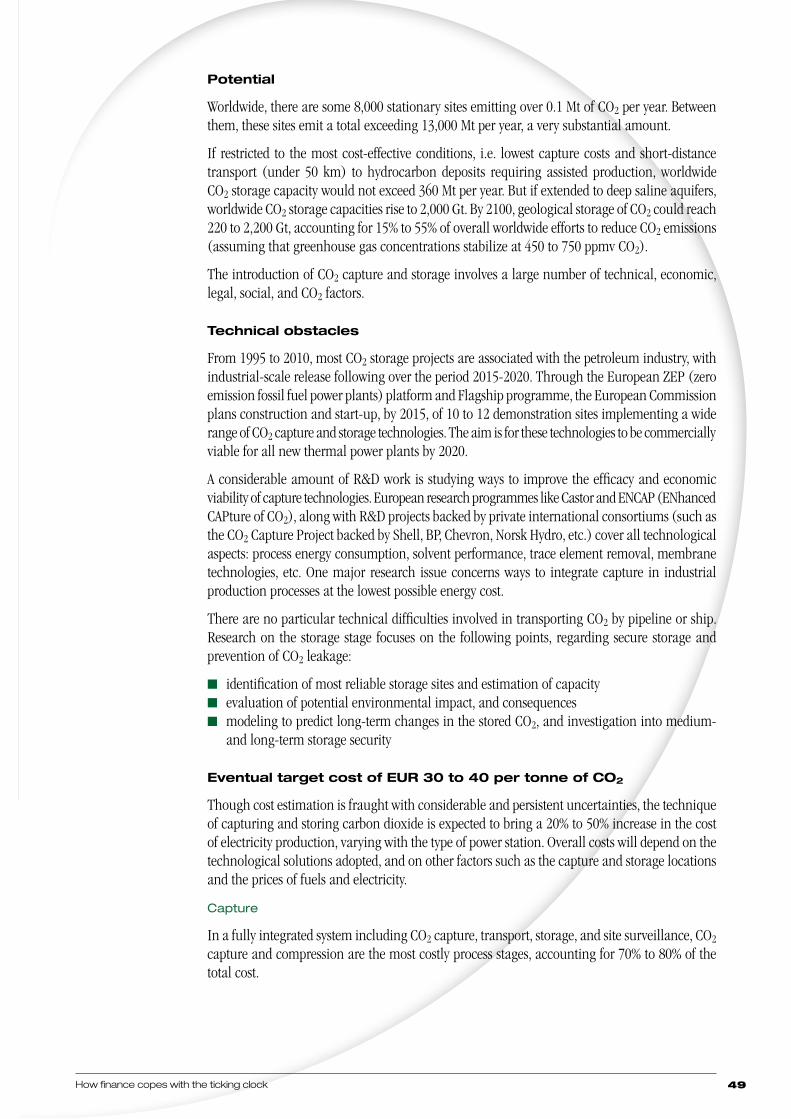
How finance copes with the ticking clock 49
Potential
Worldwide, there are some 8,000 stationary sites emitting over 0.1 Mt of CO2 per year. Between them, these sites emit a total exceeding 13,000 Mt per year, a very substantial amount.
If restricted to the most cost-effective conditions, i.e. lowest capture costs and short-distance transport (under 50 km) to hydrocarbon deposits requiring assisted production, worldwide CO2 storage capacity would not exceed 360 Mt per year. But if extended to deep saline aquifers, worldwide CO2 storage capacities rise to 2,000 Gt. By 2100, geological storage of CO2 could reach 220 to 2,200 Gt, accounting for 15% to 55% of overall worldwide efforts to reduce CO2 emissions (assuming that greenhouse gas concentrations stabilize at 450 to 750 ppmv CO2).
The introduction of CO2 capture and storage involves a large number of technical, economic, legal, social, and CO2 factors.
Technical obstacles
From 1995 to 2010, most CO2 storage projects are associated with the petroleum industry, with industrial-scale release following over the period 2015-2020. Through the European ZEP (zero emission fossil fuel power plants) platform and Flagship programme, the European Commission plans construction and start-up, by 2015, of 10 to 12 demonstration sites implementing a wide range of CO2 capture and storage technologies. The aim is for these technologies to be commercially viable for all new thermal power plants by 2020.
A considerable amount of R&D work is studying ways to improve the efficacy and economic viability of capture technologies. European research programmes like Castor and ENCAP (ENhanced CAPture of CO2), along with R&D projects backed by private international consortiums (such as the CO2 Capture Project backed by Shell, BP, Chevron, Norsk Hydro, etc.) cover all technological aspects: process energy consumption, solvent performance, trace element removal, membrane technologies, etc. One major research issue concerns ways to integrate capture in industrial production processes at the lowest possible energy cost.
There are no particular technical difficulties involved in transporting CO2 by pipeline or ship. Research on the storage stage focuses on the following points, regarding secure storage and prevention of CO2 leakage:
n identification of most reliable storage sites and estimation of capacityn evaluation of potential environmental impact, and consequencesn modeling to predict long-term changes in the stored CO2, and investigation into medium-
and long-term storage security
Eventual target cost of EUR 30 to 40 per tonne of CO2
Though cost estimation is fraught with considerable and persistent uncertainties, the technique of capturing and storing carbon dioxide is expected to bring a 20% to 50% increase in the cost of electricity production, varying with the type of power station. Overall costs will depend on the technological solutions adopted, and on other factors such as the capture and storage locations and the prices of fuels and electricity.
Capture
In a fully integrated system including CO2 capture, transport, storage, and site surveillance, CO2 capture and compression are the most costly process stages, accounting for 70% to 80% of the total cost.
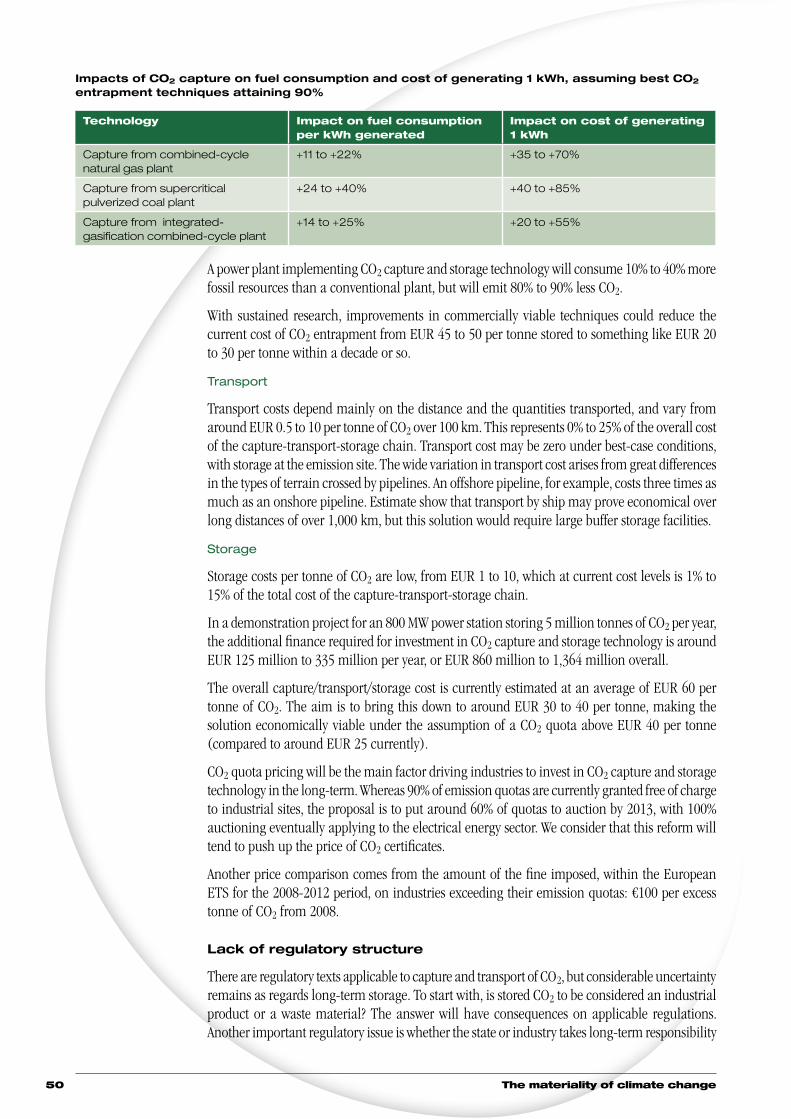
The materiality of climate change50
Impacts of CO2 capture on fuel consumption and cost of generating 1 kWh, assuming best CO2 entrapment techniques attaining 90%
Technology Impact on fuel consumption per kWh generated
Impact on cost of generating 1 kWh
Capture from combined-cycle natural gas plant
+11 to +22% +35 to +70%
Capture from supercritical pulverized coal plant
+24 to +40% +40 to +85%
Capture from integrated-gasification combined-cycle plant
+14 to +25% +20 to +55%
A power plant implementing CO2 capture and storage technology will consume 10% to 40% more fossil resources than a conventional plant, but will emit 80% to 90% less CO2.
With sustained research, improvements in commercially viable techniques could reduce the current cost of CO2 entrapment from EUR 45 to 50 per tonne stored to something like EUR 20 to 30 per tonne within a decade or so.
Transport
Transport costs depend mainly on the distance and the quantities transported, and vary from around EUR 0.5 to 10 per tonne of CO2 over 100 km. This represents 0% to 25% of the overall cost of the capture-transport-storage chain. Transport cost may be zero under best-case conditions, with storage at the emission site. The wide variation in transport cost arises from great differences in the types of terrain crossed by pipelines. An offshore pipeline, for example, costs three times as much as an onshore pipeline. Estimate show that transport by ship may prove economical over long distances of over 1,000 km, but this solution would require large buffer storage facilities.
Storage
Storage costs per tonne of CO2 are low, from EUR 1 to 10, which at current cost levels is 1% to 15% of the total cost of the capture-transport-storage chain.
In a demonstration project for an 800 MW power station storing 5 million tonnes of CO2 per year, the additional finance required for investment in CO2 capture and storage technology is around EUR 125 million to 335 million per year, or EUR 860 million to 1,364 million overall.
The overall capture/transport/storage cost is currently estimated at an average of EUR 60 per tonne of CO2. The aim is to bring this down to around EUR 30 to 40 per tonne, making the solution economically viable under the assumption of a CO2 quota above EUR 40 per tonne (compared to around EUR 25 currently).
CO2 quota pricing will be the main factor driving industries to invest in CO2 capture and storage technology in the long-term. Whereas 90% of emission quotas are currently granted free of charge to industrial sites, the proposal is to put around 60% of quotas to auction by 2013, with 100% auctioning eventually applying to the electrical energy sector. We consider that this reform will tend to push up the price of CO2 certificates.
Another price comparison comes from the amount of the fine imposed, within the European ETS for the 2008-2012 period, on industries exceeding their emission quotas: €100 per excess tonne of CO2 from 2008.
Lack of regulatory structure
There are regulatory texts applicable to capture and transport of CO2, but considerable uncertainty remains as regards long-term storage. To start with, is stored CO2 to be considered an industrial product or a waste material? The answer will have consequences on applicable regulations. Another important regulatory issue is whether the state or industry takes long-term responsibility
How finance copes with the ticking clock 51
for storage sites. If responsibility lies with the emitting company, the storage duration, over hundreds or even thousands of years, raises serious problems.
On 23 January 2008 the European Commission put forward a draft directive under the energy-climate package, setting out a legal framework for CO2 entrapment and storage techniques. The position of CO2 capture and storage under ETS is also clarified, since CO2 that is captured and safely stored (compliant with the legal framework defined by the EU) would be considered non-emitted. In the event of CO2 leakage, allocated emission quotas would be taken back to allow for the fact that stored CO2 is considered non-emitted for ETS purposes. The directive also places long-term responsibility for storage sites with the state once all available information indicates that the CO2 will remain in indefinite storage.
CO2 capture and storage is not yet recognized as an emissions-reduction measure under the Kyoto Protocol because of the lack of guarantees on permanent underground CO2 storage. The technology could be included under the Kyoto mechanisms once proven and validated.
Without a full legal and regulatory framework by 2014, implementation of CO2 capture and storage technology will not be possible by 2020.
Social and environmental impacts
The main risk facing stored CO2 concerns leakage and the ensuing local pollution caused by excessive CO2 concentrations. Because CO2 is lighter than water, it will tend to rise to the surface if the cover is not gas-tight. Because release of large quantities of CO2 would be a serious hazard for local populations, the scientific community gives priority attention to studying leakage risks. Another important issue concerns prediction of CO2 behaviour in geological reservoirs, the aim being to avoid pollution of drinking water aquifers.
One open question concerns seismic risks and the potential impact of seismic activity on carbon dioxide in deep storage. China (responsible for most CO2 emissions by 2030) and India (third-biggest CO2 emitter by 2030) have little seismic-risk-free potential for underground CO2 storage.
Risk control around geological storage areas is therefore a priority safety issue, and long-term site surveillance a key point.
Getting a licence to operate
A Cired-TNS Sofres survey in April 2007 across a representative sample of the French population found that only around 13% of the public had an idea of what it involved. This technology will have to earn social acceptance, especially if implemented in heavily populated regions.
Which companies to go with if uncertainties are lifted?
Alstom well-placed
Growing environmental constraints: support for CO2 capture market
Environmental constraints have a direct impact on investment decisions, in areas such as energy efficiency improvements, renewable energies, possible revival for nuclear power, and the emergence of new technologies.
Unless new technological solutions are found, we believe that environmental constraints may well restrict medium- and long-term development of coal-fired power stations, especially in Europe. Supercritical coal-fired plants emit twice as much CO2 as combined-cycle gas-fired plants. Power station construction requires government authorization, which may not be granted systematically, especially if construction is seen as compromising the fulfilment of objectives on reducing greenhouse gas emissions.
The materiality of climate change52
Market worth EUR 18 billion to EUR 29 billion for new facilities
n According to IEA, new coal-fired power stations totalling 739 GW will be built over the period 2015 to 2030 worldwide
n We estimate the total cost of CO2 capture, transport, and storage at EUR 30 to 40 per tonne from 2015 (with transport and storage accounting for EUR 10 to 15 per tonne)
n An IEA report (ETP model—Energy Technology Perspectives) indicates that classic thermal power stations equipped with CO2 capture technology could account for up to 22% of worldwide electricity production capacity by 2030
n A 500 MW coal-fired power plant produces around 3 million tonnes of CO2 per year (MIT Coal Study)
Potential market of EUR 31 billion to 42 billion for installed base
The market directly derived from the currently installed base looks potentially more attractive to Alstom, whose post-combustion technology is suitable for equipping existing plants (see release dated 30 March 2007 ‘Major agreement on release of CO2 capture technology’).
The key question is whether government measures to reduce CO2 emissions will apply to the installed base. Without an answer to this question, attempts to estimate the market size will remain highly theoretical.
Assumptions
n We assume that only some existing plants (one third) will be eligible for this technology, with others considered too old and liable for closure. Power plant age is shown in the two graphs below
n We also assume that only developed countries (Europe and US, for our calculations) will be subject to the underlying constraints initially
Alstom should be able to claim a higher share (50%?) of this market, since its two main rivals, GE and Siemens, do not develop post-combustion technology.
To sum up, Alstom could potentially reap additional revenues of EUR 1.3 billion to 1.9 billion per year if we total both markets. This values the business somewhere between EUR 1.6 billion (DCF, WACC at 9.5%, operating margin at 13%) and EUR 2.2 billion (multiples), i.e. EUR 11 to 15 per share (EUR 6 to 8 in 2008 value).
Analysis comes from the ‘Citius, Altius, Fortius’ study of July 2007, which we invite investors to review for more detailed information on Alstom.
Air Liquide, another important player
Expertise in production of gases (such as oxygen, hydrogen, nitrogen, argon, and rare gases) makes Air Liquide well-placed to benefit from development of CO2 capture and storage technologies. For tests on oxy-combustion processes in CO2 capture demonstration projects, Air Liquide supplies oxygen, expertise in engineering and combustion, and equipment for safe, efficient use of oxygen during tests.
A number of major projects have been launched. To start with, Air Liquide formed a technological partnership with the Total group to supply new oxy-combustion technologies for France’s first industrial pilot site (30 MW) on CO2 capture and storage (at the Lacq basin). Air Liquide is providing Total with burners specially developed for the project, along with oxygen (around 240 tonnes per day), from an on-site production unit.
Air Liquide is also involved in the Canadian 300 MW SaskPower project for a coal-fired power station capturing 8,000 tonnes of CO2 emissions per day. This gas will be used for assisted extraction of oil, and the facility is scheduled for start-up in 2011.
How finance copes with the ticking clock 53
Babcock & Wilcox Power Generation Group (B&W PGG) and Air Liquide have been running tests on a 30 MW plant in Ohio, using pure oxygen combustion. The next test phase will involve the use of different types of coal (bituminous sand, lignite, and coal) and original plant designs. On completion of tests, Air Liquide and B&W PGG plan to implement this technology at a larger demonstration plant capturing over a million tonnes of CO2 per year.
In April 2008, Air Liquide completed a world-première project at the MEFOS (Metallurgical Research Institute) site in Luleå, Sweden, involving development, construction, and testing of a pilot system for separating CO2 from blast furnace fumes and utilizing residual gases. The work, conducted under the European ULCOS (Ultra Low CO2 Steelmaking) project, was coordinated by ArcelorMittal and involved Europe’s main steel companies. Tests demonstrated feasibility of the process and validated improvements in blast furnace energy efficiency. ULCOS phase two, beginning in 2010, will take the form of an industrial-scale demonstration project.
Air Liquide is also a partner on other CO2 capture research projects, in Poland, the US, and Canada. And it is a partner on a CO2 storage research project backed by the US Energy Department. Since 2003, the Air Liquide R&D centre in Countryside (Illinois) has been working on a pace-setting CO2 sequestration project, the latest phase in which involves six full-scale CO2 injection tests, running through to 2009. Air Liquide will be injecting 19,000 tonnes of liquid CO2 during these tests, supplying CO2 storage tanks, and providing expert input on the injection system plus assistance in the analysis of test results to confirm that the CO2 remains entrapped in deep geological layers.
Total involved in various projects
Lacq: Benchmark pilot project for Total
On a project funded mainly by Total without public finance, tests are to be run, for the first time in France, on the whole CO2 sequestration chain, from the plant emitting CO2 (a boiler) through to underground storage. The project, which costs around EUR 60 million, has three main objectives: first, improve control over the oxy-combustion process; second, halve the capture cost with respect to existing processes; and, third develop a surveillance methodology and tools with a view to a larger-scale demonstration of the reliability and durability of long-term CO2 storage.
The project involves converting one of the five existing steam boilers at the Lacq power station site to oxy-combustion, then capturing and compressing CO2 emissions for transport by gas pipeline over 27 km, for injection into an exhausted gas deposit at Rousse, 4,500 m deep. The pilot plant (to produce around 40 t/h of steam used by the industries at the site) will emit up to 150,000 t of CO2 over two years, and this will be captured and stored. The Rousse well site will be covered by special surveillance, with surface and well-bottom sensors measuring injection, pressure, temperature, and CO2 concentration.
Initial CO2 injections were to start in late 2008. Administrative authorizations have been requested for a trial period of two years. If tests prove satisfactory, the results will be used to optimize process design with a view to wider-scale implementation. Subsequent project stages have not been determined. Long-term surveillance of CO2 storage will continue in any case. Extended injection is possible because the deposit has a theoretical capacity at least four times larger than the amount of CO2 injected during the initial test period.
In December 2007, Total signed an agreement on CO2 capture and storage with the Indonesian Minister for Energy and Mining Resources, who will be given access to the main findings from the Lacq pilot project.
Partner on various industrial and research projects
Along with the Lacq pilot project, Total is also a partner on two industrial demonstration projects:
The materiality of climate change54
n Sleipner gas field operated by Statoil in Norway (injection in saline aquifer of 1 Mt of CO2 per year, bringing CO2 content in natural gas down from 9% to 2.5%)
n Snohvit project run by Statoil in Barents Sea (separation of CO2 in LNG plant for transport by pipeline and injection into aquifer located under the gas deposit)
Total is also a partner on several R&D programmes:
n CO2ReMoVe: European project to develop tools for designing and monitoring CO2 storage sites
n ENCAP (ENhanced CAPture of CO2): Project designed by and for the European electric power industry to contribute to the development of CO2 capture techniques for plants burning various types of fuel
n Géocarbone-Picoref: Project run by French national research agency to identify possible underground storage sites in France
Genuine opportunity for E.ON and RWE
The first pilot and demonstration projects were run by oil and gas companies, harnessing knowledge and experience in underground management and operations. In the last few years these companies have been joined by other industries emitting large amounts of CO2 (utility companies, for example), aware of the economic impact of regulations on CO2 emissions. In Germany, coal and lignite account for 45% of the energy mix of the utility E.ON, and 68% of the mix of the utility RWE. Both companies are developing pilot projects for powerplants, including CO2 capture units.
E.ON has announced its intention to test a pilot CO2 capture plant in 2008, then to build a demonstration plant scheduled for start-up in 2014. E.ON is opting for post-combustion capture, the technology most readily adaptable to existing plants.
RWE will also be setting up a post-combustion capture unit at the Tilbury coal-fired plant by 2016. It also plans to start up an integrated-gasification combined-cycle plant (450 MW) with pre-combustion CO2 capture and storage (2.3 million tonnes of CO2 per an) for 2014. The project began in 2007, with site selection.
E.ON plans a similar project in the UK for 2011, with construction of an integrated-gasification combined-cycle plant (450 MW) with pre-combustion CO2 capture.
In 2007, RWE Power joined forces with the Linde and BASF groups on the development of new CO2 capture techniques for coal-fired power stations. A pilot unit is to be set up at the RWE Power lignite plant in Niederaussem (near Cologne). Linde will take charge of plant design and construction, and BASF solvents will be used. The aim is to remove more than 90% of the CO2 in the combustion gas emitted by a coal-fired power plant, and store it underground. If tests prove positive, the three groups hope to develop commercial applications by 2020.
7.3 Aviation and emission trading / Extension of EU ETS
Type Financial report
Region Europe
Research firm WestLB
Analysts Hendrik Garz, Natasa Nikolic, Claudia Volk
Title More headwinds through CO2 costs
Date March 2009
AMWG commentary
This report is admirably clear and speaks for itself.
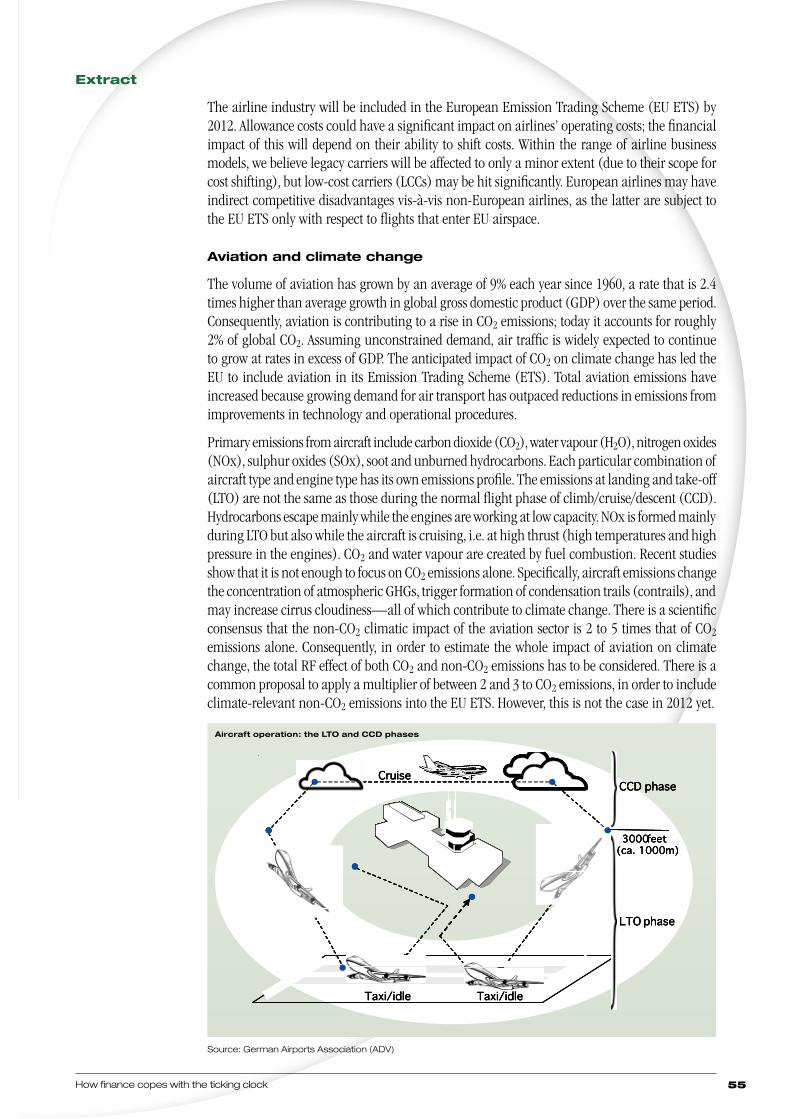
How finance copes with the ticking clock 55
Extract
The airline industry will be included in the European Emission Trading Scheme (EU ETS) by 2012. Allowance costs could have a significant impact on airlines’ operating costs; the financial impact of this will depend on their ability to shift costs. Within the range of airline business models, we believe legacy carriers will be affected to only a minor extent (due to their scope for cost shifting), but low-cost carriers (LCCs) may be hit significantly. European airlines may have indirect competitive disadvantages vis-à-vis non-European airlines, as the latter are subject to the EU ETS only with respect to flights that enter EU airspace.
Aviation and climate change
The volume of aviation has grown by an average of 9% each year since 1960, a rate that is 2.4 times higher than average growth in global gross domestic product (GDP) over the same period. Consequently, aviation is contributing to a rise in CO2 emissions; today it accounts for roughly 2% of global CO2. Assuming unconstrained demand, air traffic is widely expected to continue to grow at rates in excess of GDP. The anticipated impact of CO2 on climate change has led the EU to include aviation in its Emission Trading Scheme (ETS). Total aviation emissions have increased because growing demand for air transport has outpaced reductions in emissions from improvements in technology and operational procedures.
Primary emissions from aircraft include carbon dioxide (CO2), water vapour (H2O), nitrogen oxides (NOx), sulphur oxides (SOx), soot and unburned hydrocarbons. Each particular combination of aircraft type and engine type has its own emissions profile. The emissions at landing and take-off (LTO) are not the same as those during the normal flight phase of climb/cruise/descent (CCD). Hydrocarbons escape mainly while the engines are working at low capacity. NOx is formed mainly during LTO but also while the aircraft is cruising, i.e. at high thrust (high temperatures and high pressure in the engines). CO2 and water vapour are created by fuel combustion. Recent studies show that it is not enough to focus on CO2 emissions alone. Specifically, aircraft emissions change the concentration of atmospheric GHGs, trigger formation of condensation trails (contrails), and may increase cirrus cloudiness—all of which contribute to climate change. There is a scientific consensus that the non-CO2 climatic impact of the aviation sector is 2 to 5 times that of CO2 emissions alone. Consequently, in order to estimate the whole impact of aviation on climate change, the total RF effect of both CO2 and non-CO2 emissions has to be considered. There is a common proposal to apply a multiplier of between 2 and 3 to CO2 emissions, in order to include climate-relevant non-CO2 emissions into the EU ETS. However, this is not the case in 2012 yet.
Source: German Airports Association (ADV)
Aircraft operation: the LTO and CCD phases
Climb
Cruise
Taxi/idle Taxi/idle
Landing
Descent
LTO phase
CCD phase
3000 feet(ca. 1000m)
Take
-off
Climb
Cruise
Taxi/idle Taxi/idle
Landing
DescentClimb
Cruise
Taxi/idle Taxi/idle
Landing
Descent
LTO phase
CCD phase
3000 feet(ca. 1000m)
LTO phase
CCD phase
3000 feet(ca. 1000m)
Take
-off
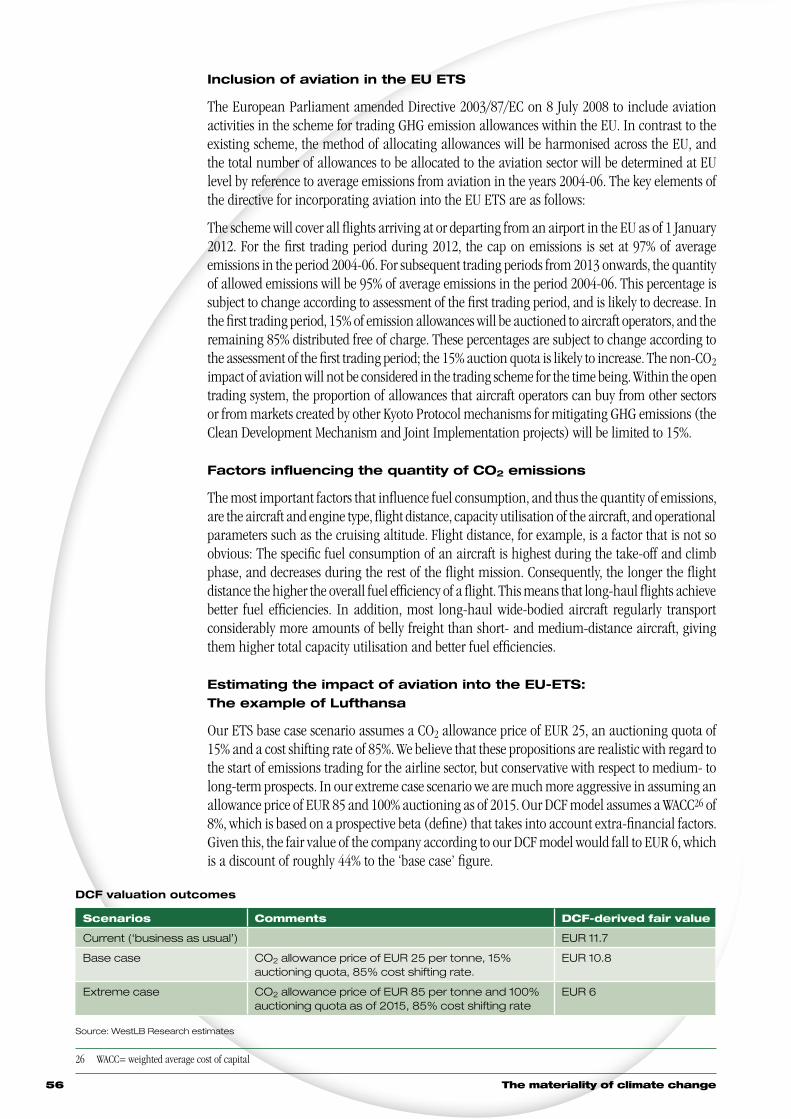
The materiality of climate change56
Inclusion of aviation in the EU ETS
The European Parliament amended Directive 2003/87/EC on 8 July 2008 to include aviation activities in the scheme for trading GHG emission allowances within the EU. In contrast to the existing scheme, the method of allocating allowances will be harmonised across the EU, and the total number of allowances to be allocated to the aviation sector will be determined at EU level by reference to average emissions from aviation in the years 2004-06. The key elements of the directive for incorporating aviation into the EU ETS are as follows:
The scheme will cover all flights arriving at or departing from an airport in the EU as of 1 January 2012. For the first trading period during 2012, the cap on emissions is set at 97% of average emissions in the period 2004-06. For subsequent trading periods from 2013 onwards, the quantity of allowed emissions will be 95% of average emissions in the period 2004-06. This percentage is subject to change according to assessment of the first trading period, and is likely to decrease. In the first trading period, 15% of emission allowances will be auctioned to aircraft operators, and the remaining 85% distributed free of charge. These percentages are subject to change according to the assessment of the first trading period; the 15% auction quota is likely to increase. The non-CO2 impact of aviation will not be considered in the trading scheme for the time being. Within the open trading system, the proportion of allowances that aircraft operators can buy from other sectors or from markets created by other Kyoto Protocol mechanisms for mitigating GHG emissions (the Clean Development Mechanism and Joint Implementation projects) will be limited to 15%.
Factors influencing the quantity of CO2 emissions
The most important factors that influence fuel consumption, and thus the quantity of emissions, are the aircraft and engine type, flight distance, capacity utilisation of the aircraft, and operational parameters such as the cruising altitude. Flight distance, for example, is a factor that is not so obvious: The specific fuel consumption of an aircraft is highest during the take-off and climb phase, and decreases during the rest of the flight mission. Consequently, the longer the flight distance the higher the overall fuel efficiency of a flight. This means that long-haul flights achieve better fuel efficiencies. In addition, most long-haul wide-bodied aircraft regularly transport considerably more amounts of belly freight than short- and medium-distance aircraft, giving them higher total capacity utilisation and better fuel efficiencies.
Estimating the impact of aviation into the EU-ETS: The example of Lufthansa
Our ETS base case scenario assumes a CO2 allowance price of EUR 25, an auctioning quota of 15% and a cost shifting rate of 85%. We believe that these propositions are realistic with regard to the start of emissions trading for the airline sector, but conservative with respect to medium- to long-term prospects. In our extreme case scenario we are much more aggressive in assuming an allowance price of EUR 85 and 100% auctioning as of 2015. Our DCF model assumes a WACC26 of 8%, which is based on a prospective beta (define) that takes into account extra-financial factors. Given this, the fair value of the company according to our DCF model would fall to EUR 6, which is a discount of roughly 44% to the ‘base case’ figure.
DCF valuation outcomes
Scenarios Comments DCF-derived fair value
Current (‘business as usual’) EUR 11.7
Base case CO2 allowance price of EUR 25 per tonne, 15% auctioning quota, 85% cost shifting rate.
EUR 10.8
Extreme case CO2 allowance price of EUR 85 per tonne and 100% auctioning quota as of 2015, 85% cost shifting rate
EUR 6
Source: WestLB Research estimates
26 WACC= weighted average cost of capital
How finance copes with the ticking clock 57
This is quite a substantial discount that does not even take into account the indirect effects of such developments on global competition. Neither does it take into account that inclusion of non-CO2 emissions into the calculation of the volume of allowances to be purchased after 2012 is highly likely. The proposal to apply a multiplier of 2 to CO2 emissions, in order to include climate-relevant non-CO2 emissions, would imply a doubling of ETS costs for Lufthansa. Of course this needs to be seen against the background of the global economic crisis, which might put some brakes on regulators’ efforts to increase ETS costs.
Options for reducing emissions
As aviation will be included in the ETS from 2012 onwards, the industry faces the challenge of substantially improving the environmental efficiency of its product in order to reduce emissions and secure sustainable growth. The aim of each airline will be to avoid emissions at a reasonable price, or to acquire emission rights from other parties. Options for reducing emissions include technological, operational and regulatory measures.
One example in the area of operational measures is the optimisation of flight routes. Research shows that there is significant potential for avoiding contrails and reducing the climatic impact of aviation through optimising flight routes, and that this can for the most part be realised at reasonable cost. Flight route optimisation basically means a trade-off between a reduction in contrails and cirrus clouds by flying at lower altitudes and an increase in emissions due to the deterioration of the aerodynamics of aircraft at lower altitudes due to denser air masses. The avoidance potential, according to the results of the EU TRADEOFF project, amounts to around 41m t CO2 equivalents for contrails and up to 470m t CO2 for cirrus clouds alone, annually.
7.4 Finance for energy efficiency
Type Industry survey
Region Global
Research institution UNEP FI Climate Change Working Group
Author Kirsty Hamilton
Title Energy efficiency and the finance sector
Date January 2009
AMWG commentary
We are pleased to present a substantial extract from a recent study by our sister working group, the UNEP FI Climate Change Working Group. While the study does not investigate the prospects for any individual technologies or firms, it gives a good description of the difficulties that are preventing a faster roll-out of energy efficiency, which is potentially a major strategy for cutting emissions.
Extract
Key findings
Current market activities
Public sector financial institutions
Public sector FIs are leading efforts to mainstream energy efficiency (EE) into their institutions, and to develop financing tools and options for a specific range of energy efficiency activities. This is primarily due to the government mandate and resources that enable these institutions to offer,
The materiality of climate change58
for example, lower interest rate finance, grant finance for technical services—both internally within the FI and externally—such as energy efficiency audits, and other forms of assistance to private and public sector clients. The scale of effort varies across institutions, as does the level of experience and focus to date. Activities are not limited to developing countries; Germany and France, for example, have public sector FI programmes aimed at stimulating national EE activities in specific domestic market segments.
Private sector financial institutions
Private sector FIs are very interested in EE (‘perhaps the next goldmine’), which is consistent with existing sustainability commitments or renewable energy lending programs, yet find it difficult to get the level of scale and financing opportunity required to make specific energy efficiency activities commercially attractive, particularly in the context of project finance. In general, there was little evidence of dedicated activities by private sector FIs in this area. The exception, in this survey, is in the USA, where state and federal regulation has provided conditions for the development of business models based around energy service performance contracting. On the other hand, funding for EE activities may be folded into more general borrowing activities—e.g. corporate, consumer, or municipal finance—or be described as ‘modernization’ or ‘refurbishment’, and may therefore not be visible as energy efficiency efforts by the lender. This makes it difficult to assess the scale of activity or demand and, more broadly, raises important questions about definitions.
Innovators
Innovative financing methods are being developed, amongst others, by specialised commercial finance providers. These include new models to enable significantly scaled-up financing opportunities for energy service providers in developing countries, and integrated ‘single contract’ financing for energy efficiency and renewable energy in the US.
Key external and internal drivers
Energy prices and power shortages
High and volatile oil and energy prices, as well as severe power shortages in some countries, are generally important drivers for energy efficiency, particularly noted in energy intensive parts of the industrial sector where energy expenditure can be a very significant part of operational costs. These drivers are creating an increased general interest in taking commercial advantage of EE opportunities. However, as confirmed by survey participants, the groundswell of general interest observed does not in itself produce specific, bankable EE options, without other factors being in place.
Demand for energy efficiency
Despite high (2008) and volatile energy prices, energy security issues, and awareness of climate change policy drivers, there is a mixed picture of actual demand for energy efficiency both from private and public sector clients.
Where grant finance and/or subsidized EE services and finance are available, public sector FIs still require external marketing to clients and internal marketing to other parts of the financial institution in order to create interest and demand for those products and services. This may reflect the relative lack of track record of many FIs in the area, although it should be noted that some FIs, notably in the public sector, have made extensive, market leading efforts to mainstream EE throughout the financing activities of their institutions.
Private sector FIs found that energy intensive sectors are leading demand; this was, however, not a uniform picture as many FIs have not seen demand increase for EE-related lending at all. This could be due to the FI’s particular client base, or the sections of the FI involved in the survey,
How finance copes with the ticking clock 59
such as project finance or ‘sustainability’ departments, and whether they would be in a position to observe actual increased client interest for energy efficiency finance. In contrast, when clients are tackling EE improvements through general corporate finance, as described further below, on the lender’s side these are unlikely to show up as energy efficiency related efforts. However, this mixed picture may also indicate that energy efficiency improvements simply remain a relatively low priority in many parts of the economy.
Internally, the trend for private sector FIs is to give increased priority to sustainability and climate change, and many have begun to assess how these factors can be mainstreamed into business activities. This, however, takes time to operationalise and does not, per se, include efforts to offer energy efficiency finance. Internally, most institutions interviewed already have in place corporate energy use targets.
Financing issues
Energy service companies
In the field of dedicated energy efficiency finance via energy service companies (ESCOs), a range of well-documented challenges are encountered. ESCOs are generally companies which offer energy demand reduction services, often financed through so-called ‘performance contracting’, where the energy savings generate cash flow which pays for the installation of the equipment and a margin. Highlighted in this survey were the following challenges:
n Scale > Individual projects are considered to be too small to be commercially ‘interesting’ for mainstream private-sector FIs. However, one FI specialised in energy services is developing methods to streamline and aggregate individual EE projects to enable project finance scale. Another FI highlighted the need for a stronger policy environment to establish the conditions that will attract large-scale ESCO activity
n The ‘asset’ problem > Energy savings, which underpin the usual ESCO business pro po-si tion, are not a conventional ‘asset’ against which a bank will lend. In other words, cash-flow from energy savings is not a familiar form of revenue or collateral to back lending (although clearly any additional equipment provided would be an asset). This means that FIs, particularly local FIs, need to become familiar with the nature, as well as the performance and credit risks of energy savings financed projects in order to be comfortable with providing debt. Despite not being uniformly available, partial-risk loan guarantees aimed at reducing these risks and facilitating finance, particularly in developing countries, represent an effective approach
n Lack of loan/credit guarantee mechanisms > Linked to the above, loan/credit guarantee mechanisms can play a key role in facilitating finance, particularly for smaller scale ESCOs. Experience from some actors, however, indicates that the guarantee schemes that exist today are for larger amounts and involve a ‘tedious and long process for approval’. Developing lean credit guarantee mechanisms tailored to smaller-scale projects would help address this deterrent to EE lending activities
Carbon finance
Linked to carbon savings achieved through emissions reduction projects, carbon finance has played a mixed role in stimulating EE projects so far. While some of the FIs closely or increasingly link EE with carbon finance, or have carbon emissions as a primary motivation (structurally within the institution, or at project level), others establish no such link, even where the institution may have dedicated carbon activities, such as trading. New possibilities of generating carbon credits at larger scale are opening up, notably through programmatic approaches under the Kyoto Protocol’s Clean Development Mechanism (CDM), thus enabling larger scale activities beyond the current project-by-project structure; at least one private sector FI in the survey was developing options for energy efficiency using this avenue.
The materiality of climate change60
Local financial institutions
Local FIs have a key role to play in EE financing, particularly in developing countries but also in OECD countries at regional bank or retail level (e.g. mortgage finance and property). Ensuring that these institutions are able to understand the characteristics of different parts of the EE market, and that options for engagement are commercially attractive, will be crucial to rolling out financing at scale.
Time and resources
Time and resources are required to assess opportunities and to develop appropriate financing products across FIs. For public sector FIs, mandates to do this are mostly in place and generally include a basket of issues alongside activities related to sustainable energy and carbon finance, reflecting broad external drivers for energy efficiency; let us note, however, that resolution around EE specifically is advised. On the other hand, for private sector FIs, board level policies needed to enable the mobilization of resources are generally not in place. The dedication of time and other resources is, however, essential to examine and understand new EE opportunities, in the context of FIs’ activities, and to (re)develop relevant financial products and due diligence procedures across FIs’ divisions.
Policy and regulation
Serious market failures exist in most jurisdictions. The perception is that governments are not providing a clear and compelling set of targeted policies and incentives to pursue EE options across the economy at a meaningful scale. The rapid, policy-led growth in renewable energy (RE) investment in many countries was highlighted as a positive example that should be emulated. EE targets alone, even if stringent, however, are insufficient if they are not incentivised appropriately, implemented on the ground effectively or integrated with other parts of a sustainable energy policy to ensure policy signals are not conflicting. Reliance solely on high energy prices is equally insufficient. This is one of the fundamental findings from survey participants: prices alone are not sufficient to overcome barriers. In a policy context, there is no ‘silver bullet’ or new single policy that could do the job alone; what is required is the development of systematic EE targeted policies, incentives and implementation efforts across different sectors.
Public sector financial institutions
For public sector FIs the government mandate has been at the helm of the development of EE activities, although the ability to roll out services, generate projects or accelerate demand will also be governed by the external regulatory environment. Several positive examples were given of public sector finance being used, often in combination with private sector finance, to develop the underpinnings of a dedicated EE market, including: the development and offering of risk reducing tools, the promotion of increased local financial institution capacity as well as the introduction of standardised monitoring and evaluation systems for EE which reduce transaction costs and facilitate the use of carbon finance. Albeit innovative and of high value, such ‘public-private’ activities are so far not operating at a significant scale.
Private sector financial institutions
For private sector FIs, the policy and regulatory environment remains a key aspect of stimulating investment activity in this area. Government policy will play a central role in bringing to the attention of FI boards the seriousness of EE activities as part of the energy landscape, and creating the conditions such that the resulting value can be captured commercially.
Government—‘Lead with own estate’
Governments, arguably, have the most immediate interest in EE and are in a position to take early and thorough action in relation to their own estate, facilities, institutions and funds.
How finance copes with the ticking clock 61
Additionally, the specificity of the mandate they provide to public sector FIs, the incorporation of energy productivity into broad macroeconomic goals and policy, as well as the ‘demand’ for EE services from the public sector are all important avenues for furthersignaling the priority of EE, and creating an environment conducive to increased EE efforts.
Key recommendations
For the finance sector
n Establish explicit board level recognition of energy efficiency within the core business strategy of the FI, as well as within sustainable energy or climate change strategies
n Formulate a board-level mandate to establish dedicated EE resources and competence, in order to:– analyse the institutional opportunity across the range of relevant operational divisions
(corporate, retail/mortgage, project finance, etc.)– develop options for financial products – further these options internally
n More specifically, assess the opportunity to institutionalise a systematic ‘energy efficiency audit’ process on loans to projects or clients in key energy-using sectors in order to systematically capture EE gains at the very outset of operations and to deepen client offerings
n Create the opportunity for FIs to work together on the development of technology EE standards and benchmarks in order to standardise approaches and facilitate financing and technology transfer
For policymakers
n Ensure policy consistency towards EE through an integrated sustainable energy policy framework explicitly designed to incentivise bankable EE opportunities, at meaningful scale, and targeted to relevant sectors. The development of such frameworks will require a thorough audit of EE barriers and perverse regulatory structures
n Formulate clear board-level mandates in public sector finance institutions and equivalent entities at local and sub-national level. Such mandates must aim to internally establish dedicat ed EE competence and resources and to systematically pursue EE efforts across financial operations by means of, for instance, mandatory energy efficiency audits on all relevant transactions and spending
n As relevant, explicitly include EE in economic development strategies being discussed with public sector FIs. Particularly, focus on leveraging EE into specific policy and regulations governing energy and infrastructure development, but also into broader policy on overall economic development
n Examine whether an amendment to OECD guidelines for export credit agencies would facilitate appropriate loan offerings to energy savings technologies or services, in light of the recent decisions in the area of renewable energy
n Induce a meaningful demand for EE services and finance by targeting public institutions and facilities for large-scale retrofit programs to kick-start market activity. As a second step, further develop the private sector market for EE services and products, through, for example, specific incentives or regulations around performance contracting, or programs supporting commercial utility activities in this area
The materiality of climate change62
8 Climate change in the BRIC economies
The BRIC economies will one day be larger than the OECD economies, and are already a major source of GHG emissions. Until recently, they have not been a prime focus of analyst attention, being seen more as providers of inputs rather than market drivers. Furthermore, attention to environmental issues has lagged behind in those nations. For these reasons, there are not many investment reports on climate change here. Because of their growing importance, the AMWG has attempted to fill this gap itself as appropriate, by its own analysis, and the use of sector-oriented academic studies.
8.1 Brazil
Type Academic report
Research institutions Brazilian Agricultural Research Corporation (Embrapa), State University of
Campinas (Unicamp)
Title Global warming and the new agricultural production geography in Brazil
Date August 2008
Type Academic report
Research institution State of São Paulo Research Foundation (FAPESP)
Author Enio B Pereira
Title Assessment of solar and wind energy resources in Brazil
Date 2009
Type Academic report
Research institution Alberto Luiz Coimbra Institute – Graduate School & Research in Engineering
(COPPE), Federal University of Rio de Janeiro (UFRJ)
Title Climate change and energy security in Brazil
Date June 2008
Type Academic report
Research institution State of São Paulo Research Foundation (FAPESP)
Author Carlos H de Brito Cruz
Title Bio-energy in Brazil
Date 2009
AMWG commentary
Brazil is known for its wealth of natural resources, especially its tropical forests. Because of this, it plays a very important role in climate change, being responsible not only for reducing its emissions in industrial activities, but also for preserving its forests and restoring areas that have already been degraded.
Climate change presents both risks and opportunities for Brazil’s economy. There are significant gains yet to be realised by implementing energy efficiency measures in different industries. At the same time, Brazil is a pioneer in the development of renewable fuels such as the sugarcane ethanol. On the other hand, the impacts of a most severe climate change scenario can cause huge losses in agriculture and cattle ranching; for example, activities that represent an important part of the country’s GDP.
How finance copes with the ticking clock 63
So far, the Brazilian government appears to have presented ambiguous statements on climate change. The National Plan for Climate Change, launched in September 2008, contains important information on how the government intends to preserve the native forests and reduce GHG emissions, even though it does not offer any quantitative targets. However, in the energy sector, the 2007 publication of the Brazilian government’s Decennial Plan for Energy Expansion for 2008-2017 forecasts the construction of more than 50 plants powered by fossil fuels, such as diesel, coal or natural gas. Moreover, recently, Brazil has continued its opposition to take on GHG emissions targets.
Brazilian companies are increasingly aware of the risks and opportunities, and are paying more attention to the measurement and reporting of climate risks. The 60 companies that responded to the 2008 Brazilian CDP cover 83% of the requirements, an increase of 28% in relation to the 57 respondents in 2007. The mining company, Vale, also entered the CDP index with one of the best answers globally—an important achievement for a national company.
For this paper, we will analyse the impacts of climate change in the agriculture and energy sectors in Brazil based on the research of universities and government agencies, also commenting on the public policies for these sectors.
The importance of forestry to Brazil and climate change
One of the most important issues regarding Brazil and climate change is forestry, especially the preservation of the country’s remaining native forests. Unlike developed countries, which have retained only about 3% of their native vegetation, Brazil still has 63% of its forests intact. However, the change in the use of this land for agriculture and cattle ranching threatens this statistic, and also has an impact on climate change. (Most trees in the devastated areas are either burned or sold illegally to the real estate and furniture markets in Brazil and internationally.)
In addition to the carbon that is trapped in the trees, the carbon in the soil is released to the atmosphere in the preparation of the land for agriculture. In forests, only 30% of the total carbon is above the land, while 70% lies in the soil structure. When degraded, the soil releases the carbon to the atmosphere. As the preparation of the soil is necessary to growing soybeans, grass for cattle, and other crops, the forests go from being carbon sinks to carbon sources.
If multilateral agreements can guarantee the protection of the remaining forests, there are many other benefits (e.g. biodiversity and the potential for new discoveries in healthcare research). In particular, the Amazonian forest is a key component in the global weather system, regulating temperatures and rain patterns not only in Brazil, but also in the Caribbean. Potentially, these forests could be a source of finance under REDD (see Box).
Reduced emissions from deforestation and forest degradation(REDD) in developing countries
At COP 13 in Bali, there was agreement that there is an urgent need to take meaningful action, that parties should be encouraged to take actions, including demonstration emissions reduction projects, and that formal work on methods should be implemented.
Protecting forests adequately, including for their role in the climate system, is clearly a crucial issue. It may be possible to include ‘avoided deforestation’ in carbon markets, but this area has many issues: n methodological issues (e.g. how to measure the value of services from ‘forests’)n deforestation or degradation activity and rates among othersn prevent leakage (protection in one area leading to deforestation in another)n sovereignty (land-use related)n indigenous peoples’ rights liabilityn compliance/enforcementn the underlying causes of deforestation itself
For these reasons, REDD is a complex topic and rather more controversial than might be assumed at first.
The materiality of climate change64
The impacts of climate change on Brazilian agribusiness
Agribusiness in Brazil represents almost 24% of the country’s economy, responsible for 33 million direct and indirect jobs according to the 2006 data of Fundação Getulio Vargas.
The sector is also responsible for the largest portion of the country’s GHG emissions. The change in land use accounts for 75% of the CO2 emissions according to the Environment Ministry. If we look at other GHG emissions, cattle ranching activity in Brazil is responsible for an amazing 76% of the CH4 and 36% of the N2O emissions.
It is important to pay attention to the emissions caused by changes in land use. Brazil has the largest tropical forest in the world, and recent statistics point out that about 17% of the entire Amazon forest has already been devastated. Other Brazilian native forests have suffered even more severe impacts, particularly those in the centre of the country. For example, the Cerrado has had more than 40% of its area devastated by the increase in land devoted to feeding cattle.
In 2008, a study published by Embrapa27 (Brazilian Farming and Cattle Raising Research Institute) and Unicamp (State University of Campinas), with support from the British Embassy, calculated the impacts of two scenarios of climate change (IPCC A2 and B2) in the production of the eight major crops in Brazil—soybeans, sugarcane, manioc, rice, beans, cotton, corn, and sunflower. The calculations consider productivity, the necessity of irrigation, and infertile areas in which only the most resilient crops will grow well, known as the ‘low risk for growth’ areas.
The study showed that even in the more optimistic scenario, losses start at BRL 7.4 billion in 2020, but could reach BRL 14 billion in 2070 when considering the more pessimistic scenario.
With global warming, grains would be the most affected crop in Brazil. Soy would lead the losses, which could account for up to 40% of the current production in 2070, under the IPCC A2 scenario. The effects of climate change go from the reduction of the low risk for growth areas to the change of the agricultural borders in the south of the country, which is also going to be more challenged by strong storms and changes in rain patterns.
The only crops that may benefit from the effects of climate change are sugarcane and manioc. Nonetheless, manioc crops will be severely impacted by the desertification of the northeast of Brazil where it is most intensively cultivated and plays an important role in food security.
Due to its resistance to temperature variations, sugarcane may thrive in the low risk for growth areas with rising temperatures, according to the study. However, the change in rain patterns could create a negative impact on costs due to the greater need for irrigation.
Climate change may result in fewer agricultural products raised in Brazil, as well as negative impacts in the food industry. Increased costs and risks in grain production, which represent a significant share of the costs of the cattle and poultry industry, can affect the performance of these and other aspects of agribusiness.
Climate change and the Brazilian energy sector
Climate change is expected to impact both energy production and demand over the coming decades. Rising temperatures generate more energy consumption because of the more intensive use of air-conditioning systems. The residential segment is expected to increase energy consumption by 19% in 2030.
As in agribusiness, the energy sector in Brazil is likely to suffer the impacts of climate change. Brazil has 85% of its electric energy powered by hydroelectric plants28. Rising temperatures and
27 Aquecimento Global e a Nova Geografia da Produção Agrícola no Brasil (Global warming and the new agricultural production geography in Brazil) (August 2008) Embrapa, Unicamp
28 Pereira, Dr Enio B; Assessment of solar and wind energy resources in Brazil; presented at the Workshop of Physics and Chemistry of Climate Change in Brazil (2009), FAPESP
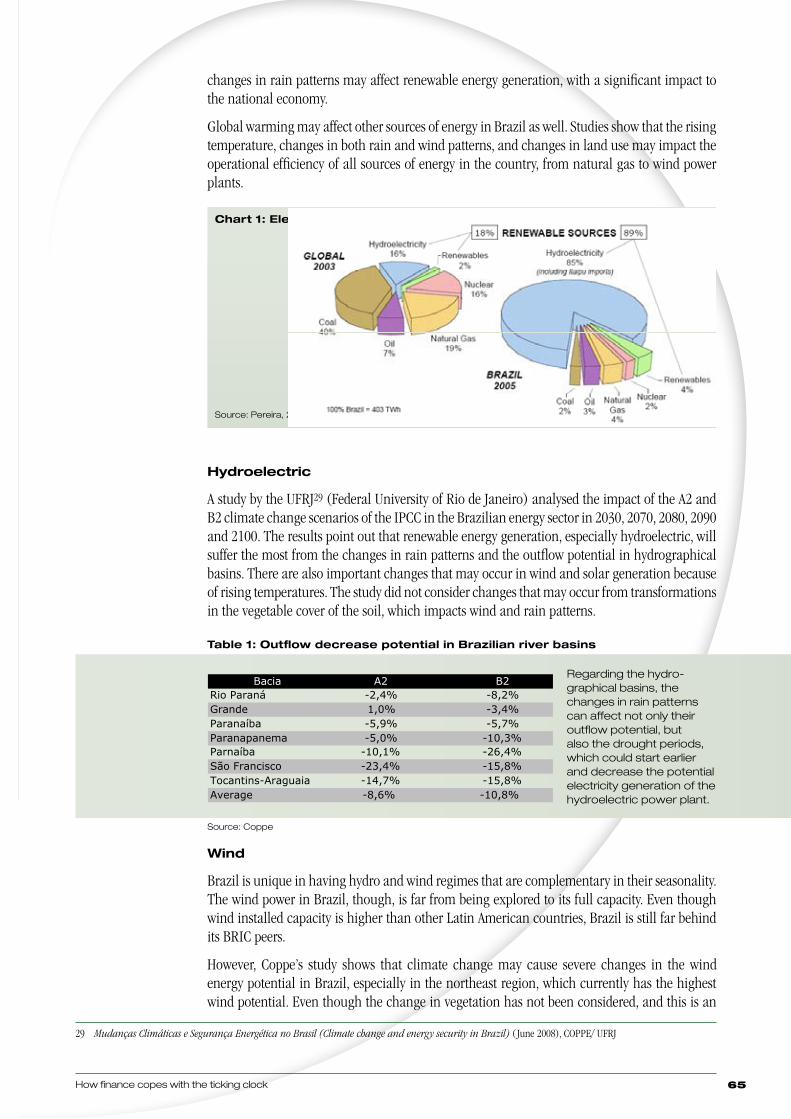
How finance copes with the ticking clock 65
changes in rain patterns may affect renewable energy generation, with a significant impact to the national economy.
Global warming may affect other sources of energy in Brazil as well. Studies show that the rising temperature, changes in both rain and wind patterns, and changes in land use may impact the operational efficiency of all sources of energy in the country, from natural gas to wind power plants.
Hydroelectric
A study by the UFRJ29 (Federal University of Rio de Janeiro) analysed the impact of the A2 and B2 climate change scenarios of the IPCC in the Brazilian energy sector in 2030, 2070, 2080, 2090 and 2100. The results point out that renewable energy generation, especially hydroelectric, will suffer the most from the changes in rain patterns and the outflow potential in hydrographical basins. There are also important changes that may occur in wind and solar generation because of rising temperatures. The study did not consider changes that may occur from transformations in the vegetable cover of the soil, which impacts wind and rain patterns.
Table 1: Outflow decrease potential in Brazilian river basins
Source: Coppe
Wind
Brazil is unique in having hydro and wind regimes that are complementary in their seasonality. The wind power in Brazil, though, is far from being explored to its full capacity. Even though wind installed capacity is higher than other Latin American countries, Brazil is still far behind its BRIC peers.
However, Coppe’s study shows that climate change may cause severe changes in the wind energy potential in Brazil, especially in the northeast region, which currently has the highest wind potential. Even though the change in vegetation has not been considered, and this is an
29 Mudanças Climáticas e Segurança Energética no Brasil (Climate change and energy security in Brazil) ( June 2008), COPPE/ UFRJ
Chart 1: Electric energy
Source: Pereira, 2009
Regarding the hydro-graphical basins, the changes in rain patterns can affect not only their outflow potential, but also the drought periods, which could start earlier and decrease the potential electricity generation of the hydroelectric power plant.
Bacia A2 B2Rio Paraná -2,4% -8,2%Grande 1,0% -3,4%Paranaíba -5,9% -5,7%Paranapanema -5,0% -10,3%Parnaíba -10,1% -26,4%São Francisco -23,4% -15,8%Tocantins-Araguaia -14,7% -15,8%Average -8,6% -10,8%
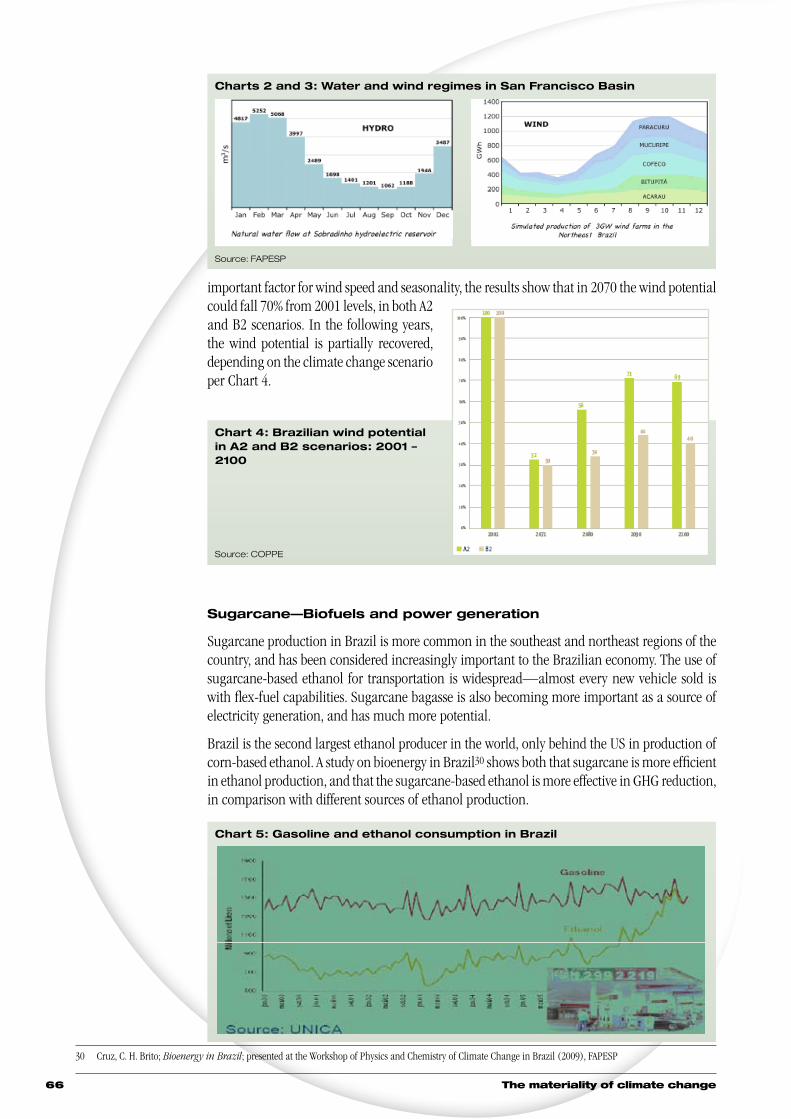
The materiality of climate change66
important factor for wind speed and seasonality, the results show that in 2070 the wind potential could fall 70% from 2001 levels, in both A2 and B2 scenarios. In the following years, the wind potential is partially recovered, depending on the climate change scenario per Chart 4.
Sugarcane—Biofuels and power generation
Sugarcane production in Brazil is more common in the southeast and northeast regions of the country, and has been considered increasingly important to the Brazilian economy. The use of sugarcane-based ethanol for transportation is widespread—almost every new vehicle sold is with flex-fuel capabilities. Sugarcane bagasse is also becoming more important as a source of electricity generation, and has much more potential.
Brazil is the second largest ethanol producer in the world, only behind the US in production of corn-based ethanol. A study on bioenergy in Brazil30 shows both that sugarcane is more efficient in ethanol production, and that the sugarcane-based ethanol is more effective in GHG reduction, in comparison with different sources of ethanol production.
30 Cruz, C. H. Brito; Bioenergy in Brazil; presented at the Workshop of Physics and Chemistry of Climate Change in Brazil (2009), FAPESP
Chart 4: Brazilian wind potential in A2 and B2 scenarios: 2001 – 2100
Source: COPPE
Chart 5: Gasoline and ethanol consumption in Brazil
Charts 2 and 3: Water and wind regimes in San Francisco Basin
Source: FAPESP
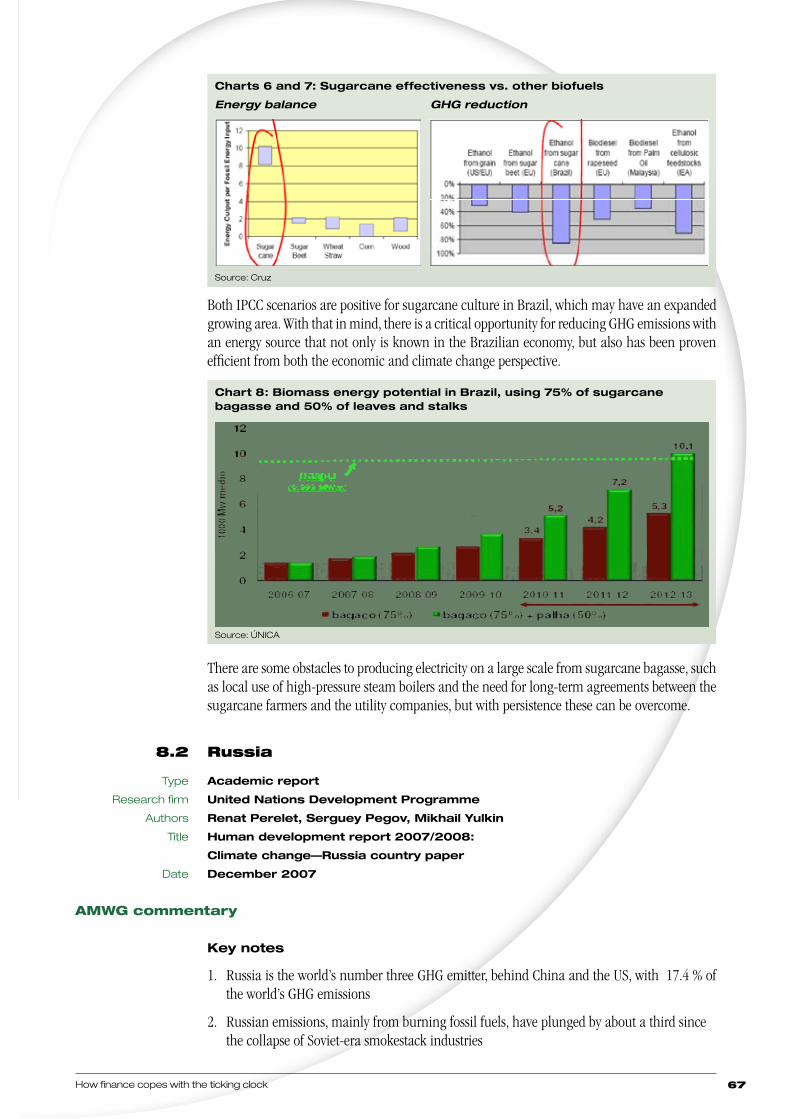
How finance copes with the ticking clock 67
Both IPCC scenarios are positive for sugarcane culture in Brazil, which may have an expanded growing area. With that in mind, there is a critical opportunity for reducing GHG emissions with an energy source that not only is known in the Brazilian economy, but also has been proven efficient from both the economic and climate change perspective.
There are some obstacles to producing electricity on a large scale from sugarcane bagasse, such as local use of high-pressure steam boilers and the need for long-term agreements between the sugarcane farmers and the utility companies, but with persistence these can be overcome.
8.2 Russia
Type Academic report
Research firm United Nations Development Programme
Authors Renat Perelet, Serguey Pegov, Mikhail Yulkin
Title Human development report 2007/2008:
Climate change—Russia country paper
Date December 2007
AMWG commentary
Key notes
1. Russia is the world’s number three GHG emitter, behind China and the US, with 17.4 % of the world’s GHG emissions
2. Russian emissions, mainly from burning fossil fuels, have plunged by about a third since the collapse of Soviet-era smokestack industries
Charts 6 and 7: Sugarcane effectiveness vs. other biofuels
Energy balance GHG reduction
Source: Cruz
Chart 8: Biomass energy potential in Brazil, using 75% of sugarcane bagasse and 50% of leaves and stalks
Source: ÚNICA
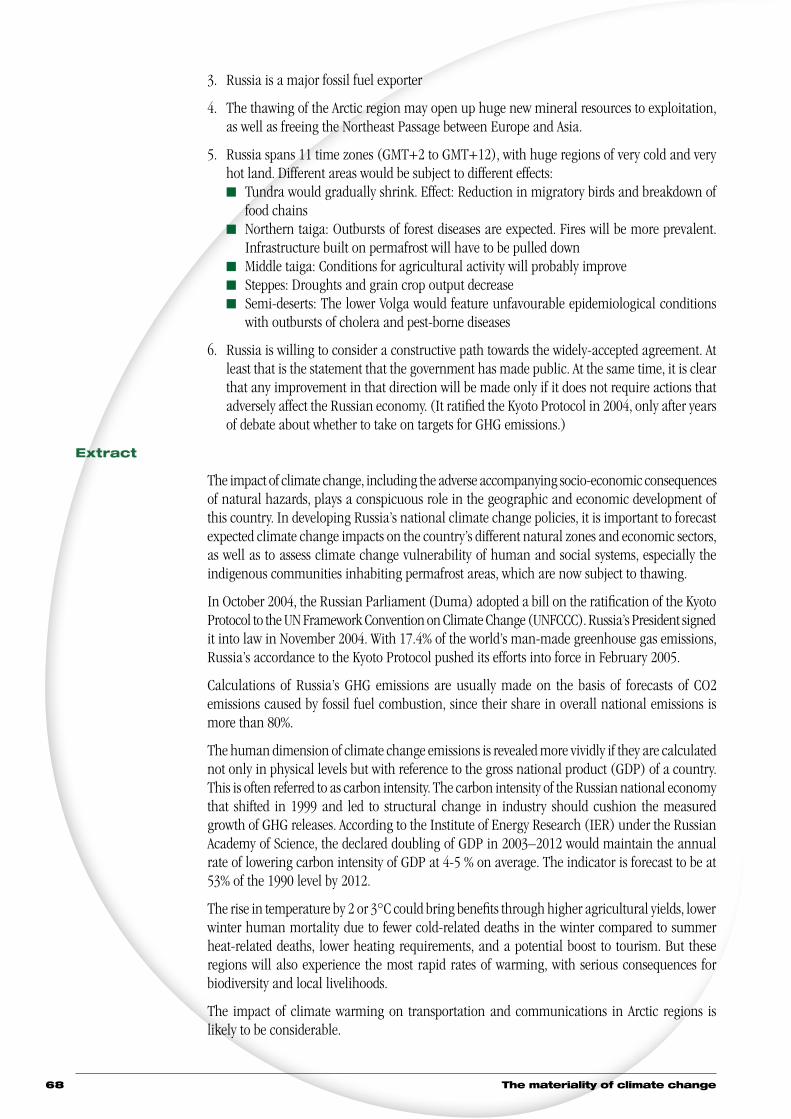
The materiality of climate change68
3. Russia is a major fossil fuel exporter
4. The thawing of the Arctic region may open up huge new mineral resources to exploitation, as well as freeing the Northeast Passage between Europe and Asia.
5. Russia spans 11 time zones (GMT+2 to GMT+12), with huge regions of very cold and very hot land. Different areas would be subject to different effects: n Tundra would gradually shrink. Effect: Reduction in migratory birds and breakdown of
food chainsn Northern taiga: Outbursts of forest diseases are expected. Fires will be more prevalent.
Infrastructure built on permafrost will have to be pulled downn Middle taiga: Conditions for agricultural activity will probably improven Steppes: Droughts and grain crop output decreasen Semi-deserts: The lower Volga would feature unfavourable epidemiological conditions
with outbursts of cholera and pest-borne diseases
6. Russia is willing to consider a constructive path towards the widely-accepted agreement. At least that is the statement that the government has made public. At the same time, it is clear that any improvement in that direction will be made only if it does not require actions that adversely affect the Russian economy. (It ratified the Kyoto Protocol in 2004, only after years of debate about whether to take on targets for GHG emissions.)
Extract
The impact of climate change, including the adverse accompanying socio-economic consequences of natural hazards, plays a conspicuous role in the geographic and economic development of this country. In developing Russia’s national climate change policies, it is important to forecast expected climate change impacts on the country’s different natural zones and economic sectors, as well as to assess climate change vulnerability of human and social systems, especially the indigenous communities inhabiting permafrost areas, which are now subject to thawing.
In October 2004, the Russian Parliament (Duma) adopted a bill on the ratification of the Kyoto Protocol to the UN Framework Convention on Climate Change (UNFCCC). Russia’s President signed it into law in November 2004. With 17.4% of the world’s man-made greenhouse gas emissions, Russia’s accordance to the Kyoto Protocol pushed its efforts into force in February 2005.
Calculations of Russia’s GHG emissions are usually made on the basis of forecasts of CO2 emissions caused by fossil fuel combustion, since their share in overall national emissions is more than 80%.
The human dimension of climate change emissions is revealed more vividly if they are calculated not only in physical levels but with reference to the gross national product (GDP) of a country. This is often referred to as carbon intensity. The carbon intensity of the Russian national economy that shifted in 1999 and led to structural change in industry should cushion the measured growth of GHG releases. According to the Institute of Energy Research (IER) under the Russian Academy of Science, the declared doubling of GDP in 2003–2012 would maintain the annual rate of lowering carbon intensity of GDP at 4-5 % on average. The indicator is forecast to be at 53% of the 1990 level by 2012.
The rise in temperature by 2 or 3°C could bring benefits through higher agricultural yields, lower winter human mortality due to fewer cold-related deaths in the winter compared to summer heat-related deaths, lower heating requirements, and a potential boost to tourism. But these regions will also experience the most rapid rates of warming, with serious consequences for biodiversity and local livelihoods.
The impact of climate warming on transportation and communications in Arctic regions is likely to be considerable.
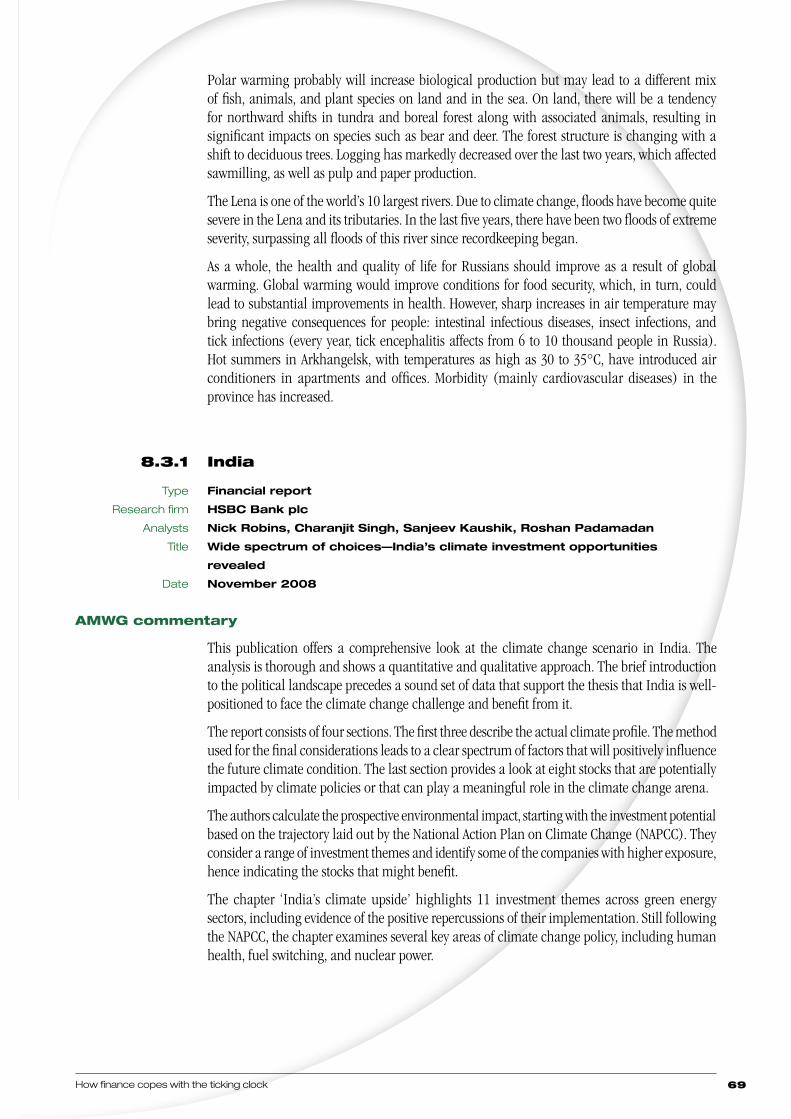
How finance copes with the ticking clock 69
Polar warming probably will increase biological production but may lead to a different mix of fish, animals, and plant species on land and in the sea. On land, there will be a tendency for northward shifts in tundra and boreal forest along with associated animals, resulting in significant impacts on species such as bear and deer. The forest structure is changing with a shift to deciduous trees. Logging has markedly decreased over the last two years, which affected sawmilling, as well as pulp and paper production.
The Lena is one of the world’s 10 largest rivers. Due to climate change, floods have become quite severe in the Lena and its tributaries. In the last five years, there have been two floods of extreme severity, surpassing all floods of this river since recordkeeping began.
As a whole, the health and quality of life for Russians should improve as a result of global warming. Global warming would improve conditions for food security, which, in turn, could lead to substantial improvements in health. However, sharp increases in air temperature may bring negative consequences for people: intestinal infectious diseases, insect infections, and tick infections (every year, tick encephalitis affects from 6 to 10 thousand people in Russia). Hot summers in Arkhangelsk, with temperatures as high as 30 to 35°C, have introduced air conditioners in apartments and offices. Morbidity (mainly cardiovascular diseases) in the province has increased.
8.3.1 India
Type Financial report
Research firm HSBC Bank plc
Analysts Nick Robins, Charanjit Singh, Sanjeev Kaushik, Roshan Padamadan
Title Wide spectrum of choices—India’s climate investment opportunities
revealed
Date November 2008
AMWG commentary
This publication offers a comprehensive look at the climate change scenario in India. The analysis is thorough and shows a quantitative and qualitative approach. The brief introduction to the political landscape precedes a sound set of data that support the thesis that India is well-positioned to face the climate change challenge and benefit from it.
The report consists of four sections. The first three describe the actual climate profile. The method used for the final considerations leads to a clear spectrum of factors that will positively influence the future climate condition. The last section provides a look at eight stocks that are potentially impacted by climate policies or that can play a meaningful role in the climate change arena.
The authors calculate the prospective environmental impact, starting with the investment potential based on the trajectory laid out by the National Action Plan on Climate Change (NAPCC). They consider a range of investment themes and identify some of the companies with higher exposure, hence indicating the stocks that might benefit.
The chapter ‘India’s climate upside’ highlights 11 investment themes across green energy sectors, including evidence of the positive repercussions of their implementation. Still following the NAPCC, the chapter examines several key areas of climate change policy, including human health, fuel switching, and nuclear power.
The materiality of climate change70
Key notes
1. India:
n is the world’s fifth largest emitter of CO2
n is already spending 2.6% of GDP on adaptation to climate vulnerabilityn has the fourth largest wind energy basen is among the top 10 producers of solar cells and modules in the worldn is ranked fifth in the world in terms of its usable hydropowern has an estimated 540 million tonnes of biomass produced each year
2. On 30 June 2008, India launched the National Action Plan on Climate Change
3. India has the fourth largest coal reserves in the world and coal-fired power accounts for more than half of the energy mix, followed by hydro electricity at 25%, with renewable contributing 8%, 75% of which is wind
4. Prime Minister Manmohan Singh has pledged to keep India’s per capita emissions below the developed world average
5. IPCC Fourth Assessment Report confirmed that India is particularly vulnerable to the impacts of climate change
6. The risks identified are primarily linked to prospects of declining global growth in the credit crunch
Extract
India is the world’s fifth largest emitter of CO2, after China, the US, the EU, and Russia. But in relative terms, India is a low carbon economy, with per capita emissions about a quarter of the global average. In spite of projected growth in emissions, these are likely to remain below the developed country average.
But India is one of the countries most exposed to the projected impacts of climate change, particularly on food production, water availability, and coastal cities. Already 2.6% of GDP is spent each year on adapting to climate change.
Compared with the industrialised world, India has a wider spectrum of choices as it confronts the global threat of climate change, with a large potential for technological leap-frogging.
The Government of India has started to intensify its response to this strategic issue. On the basis of its National Action Plan on Climate Change (NAPCC), launched in June, and a range of existing policies to promote low carbon power and energy efficiency, we have identified an initial set of investable themes focusing on the mitigation potential from curbing carbon emissions. These include wind, solar, hydro, bio-power, biofuels, buildings efficiency, industrial efficiency, power efficiency, cleaner coal, fuel switching, and nuclear.
We estimate that around INR7.6trn (cUSD150bn) in investments will be made in these themes in FY2008-17, yielding annual emission cuts 18% below ‘business as usual’ projections by 2017.
Awakening to climate change
The publication of India’s NAPCC1 on 30 June 2008 marked an important stage in the evolution of the country’s approach to climate change. It highlighted India’s role as a pivotal country in terms of the ongoing global negotiations, but also in its attractiveness to investors seeking growth opportunities. The plan has eight action areas:
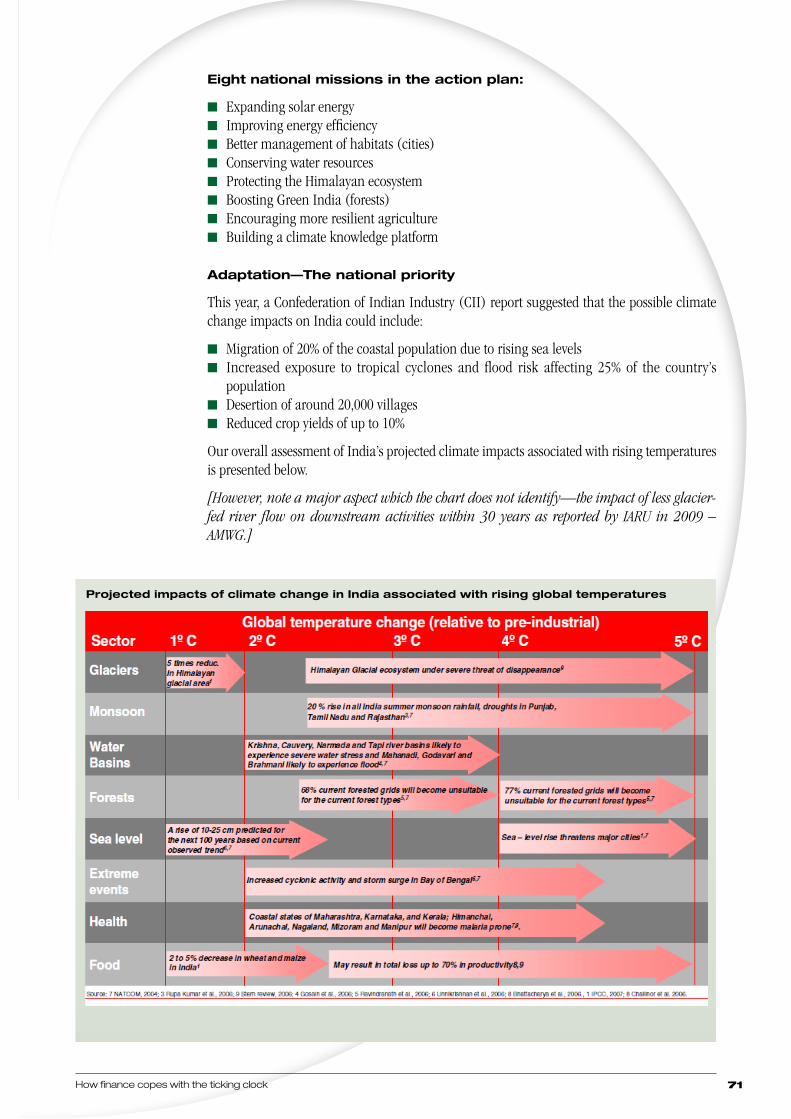
How finance copes with the ticking clock 71
Projected impacts of climate change in India associated with rising global temperatures
Eight national missions in the action plan:
n Expanding solar energyn Improving energy efficiencyn Better management of habitats (cities)n Conserving water resourcesn Protecting the Himalayan ecosystemn Boosting Green India (forests)n Encouraging more resilient agriculturen Building a climate knowledge platform
Adaptation—The national priority
This year, a Confederation of Indian Industry (CII) report suggested that the possible climate change impacts on India could include:
n Migration of 20% of the coastal population due to rising sea levelsn Increased exposure to tropical cyclones and flood risk affecting 25% of the country’s
populationn Desertion of around 20,000 villagesn Reduced crop yields of up to 10%
Our overall assessment of India’s projected climate impacts associated with rising temperatures is presented below.
[However, note a major aspect which the chart does not identify—the impact of less glacier-fed river flow on downstream activities within 30 years as reported by IARU in 2009 – AMWG.]
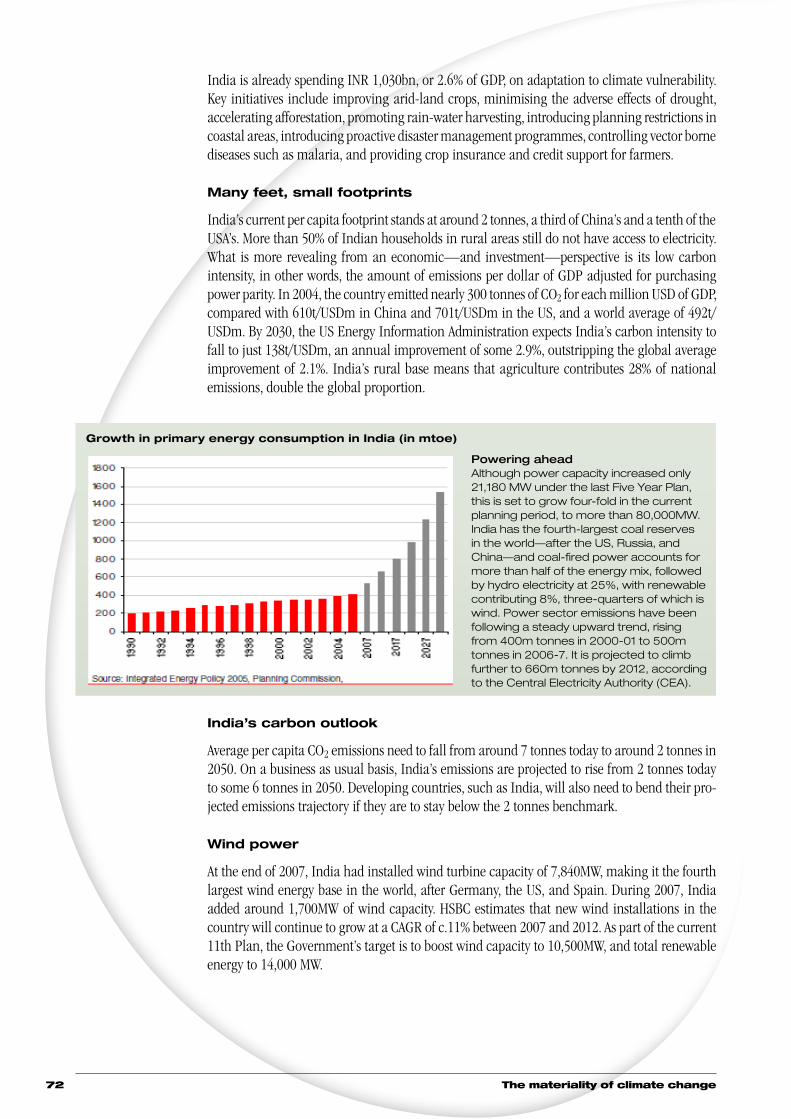
The materiality of climate change72
India is already spending INR 1,030bn, or 2.6% of GDP, on adaptation to climate vulnerability. Key initiatives include improving arid-land crops, minimising the adverse effects of drought, accelerating afforestation, promoting rain-water harvesting, introducing planning restrictions in coastal areas, introducing proactive disaster management programmes, controlling vector borne diseases such as malaria, and providing crop insurance and credit support for farmers.
Many feet, small footprints
India’s current per capita footprint stands at around 2 tonnes, a third of China’s and a tenth of the USA’s. More than 50% of Indian households in rural areas still do not have access to electricity. What is more revealing from an economic—and investment—perspective is its low carbon intensity, in other words, the amount of emissions per dollar of GDP adjusted for purchasing power parity. In 2004, the country emitted nearly 300 tonnes of CO2 for each million USD of GDP, compared with 610t/USDm in China and 701t/USDm in the US, and a world average of 492t/USDm. By 2030, the US Energy Information Administration expects India’s carbon intensity to fall to just 138t/USDm, an annual improvement of some 2.9%, outstripping the global average improvement of 2.1%. India’s rural base means that agriculture contributes 28% of national emissions, double the global proportion.
India’s carbon outlook
Average per capita CO2 emissions need to fall from around 7 tonnes today to around 2 tonnes in 2050. On a business as usual basis, India’s emissions are projected to rise from 2 tonnes today to some 6 tonnes in 2050. Developing countries, such as India, will also need to bend their pro-jec ted emissions trajectory if they are to stay below the 2 tonnes benchmark.
Wind power
At the end of 2007, India had installed wind turbine capacity of 7,840MW, making it the fourth largest wind energy base in the world, after Germany, the US, and Spain. During 2007, India added around 1,700MW of wind capacity. HSBC estimates that new wind installations in the country will continue to grow at a CAGR of c.11% between 2007 and 2012. As part of the current 11th Plan, the Government’s target is to boost wind capacity to 10,500MW, and total renewable energy to 14,000 MW.
Growth in primary energy consumption in India (in mtoe)
Powering aheadAlthough power capacity increased only 21,180 MW under the last Five Year Plan, this is set to grow four-fold in the current planning period, to more than 80,000MW. India has the fourth-largest coal reserves in the world—after the US, Russia, and China—and coal-fired power accounts for more than half of the energy mix, followed by hydro electricity at 25%, with renewable contributing 8%, three-quarters of which is wind. Power sector emissions have been following a steady upward trend, rising from 400m tonnes in 2000-01 to 500m tonnes in 2006-7. It is projected to climb further to 660m tonnes by 2012, according to the Central Electricity Authority (CEA).

How finance copes with the ticking clock 73
Wind beneficiaries
The major beneficiaries of wind energy growth are likely to be wind turbine manufacturers, such as Shriram EPC and Suzlon, as well as wind farm developers, such as Indowind.
Solar power
India receives solar energy equivalent to 5,000 trillion kWh per year—and the dedication of just 1% of India’s land area to solar power could meet the country’s entire electricity requirements up to 2030. The NAPCC seeks to promote two different types of solar power—photovoltaic (PV) and solar thermal electricity generation (STEG), often known as concentrated solar power (CSP).
Solar beneficiaries
Today, India is among the top 10 producers of solar cells and modules in the world, and its solar-tech industry continues to attract higher investment. Listed players, such as Moser Baer, XL Telecom & Energy, and Webel Solar, derive considerable proportions of their revenues from the solar segment. Large industrial groups, such as BHEL and Reliance Industries, have also made moves into this arena.
Small hydropower
India is endowed with a rich hydropower potential, ranking fifth in the world in terms of its usable potential.
Small hydropower beneficiaries
Major beneficiaries are likely to include companies such as BHEL, GMR, Gammon, HCC, Jaiprakash Associates, L&T, and Maytas Infrastructure Ltd.
Biomass power
An estimated 540 million tonnes per year of biomass is produced each year in India as residues from agriculture, agro-industrial activities, forestry, and plantations. The MNES estimates that 70-75% of this waste is used as fodder, fuel for domestic cooking, and other economic purposes, leaving behind 120-150m tonnes of usable agro-industrial and agricultural residues that can be made available for power generation. With the available technologies, this surplus agricultural residue can be used to generate more than 16,000MW of grid quality power.
Bio-power beneficiaries
Biomass power generation is an unorganised sector with many small players across the country. Companies like Gammon, Shriram EPC, Suryachakra Power, along with Thermax and Triveni Engineering and Industries, are set to benefit.
Bio-ethanol and bio-diesel
Bio-ethanol in India is derived from sugar cane. Currently, bio-ethanol blending with gasoline stands at 5% in nine States and four Union Territories. The government’s target was expected to be increased to 10% by October 2008, but this has been deferred to October 2009. The National Mission on Bio-diesel has spurred the development of bio-diesel plantations in 26 states. Beyond this, the target is to produce sufficient biodiesel for 20% blending with vehicle diesel by 2017.
Biofuels beneficiaries
Likely beneficiaries of the programme include Alfa Laval (India), Bajaj Hindusthan, Balrampur Chini, Praj Industries, and Shree Renuka Sugars.
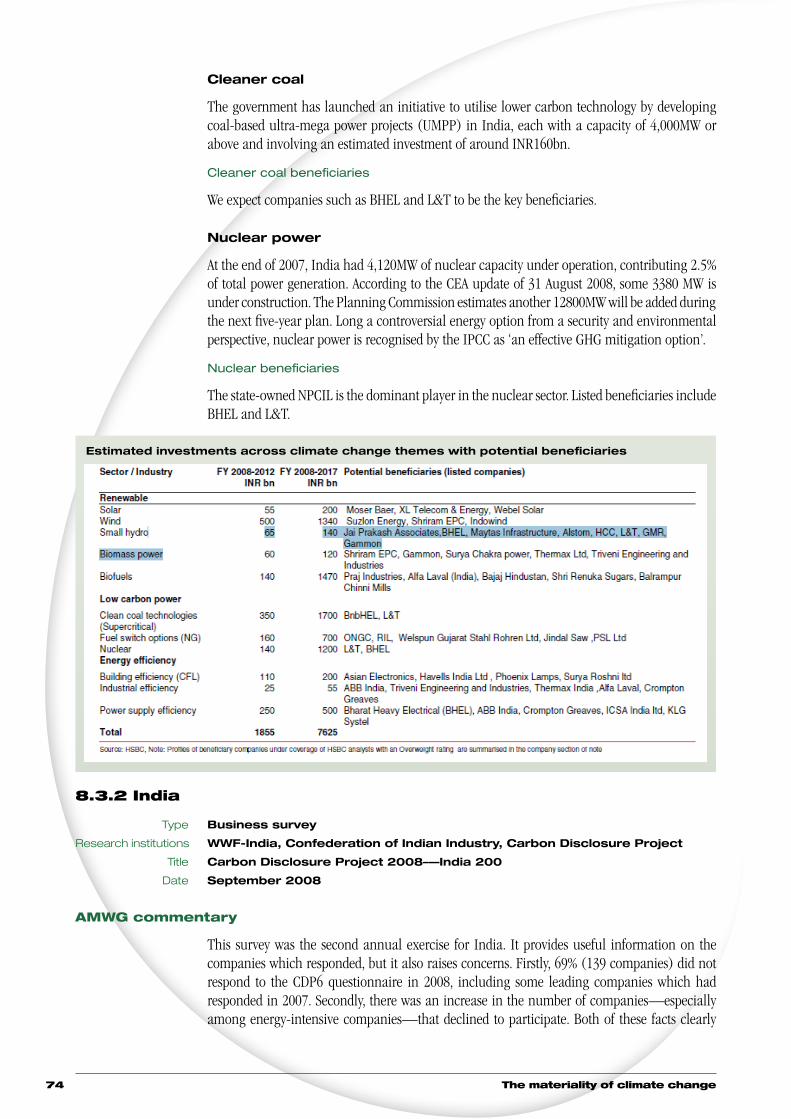
The materiality of climate change74
Cleaner coal
The government has launched an initiative to utilise lower carbon technology by developing coal-based ultra-mega power projects (UMPP) in India, each with a capacity of 4,000MW or above and involving an estimated investment of around INR160bn.
Cleaner coal beneficiaries
We expect companies such as BHEL and L&T to be the key beneficiaries.
Nuclear power
At the end of 2007, India had 4,120MW of nuclear capacity under operation, contributing 2.5% of total power generation. According to the CEA update of 31 August 2008, some 3380 MW is under construction. The Planning Commission estimates another 12800MW will be added during the next five-year plan. Long a controversial energy option from a security and environmental perspective, nuclear power is recognised by the IPCC as ‘an effective GHG mitigation option’.
Nuclear beneficiaries
The state-owned NPCIL is the dominant player in the nuclear sector. Listed beneficiaries include BHEL and L&T.
8.3.2 India
Type Business survey
Research institutions WWF-India, Confederation of Indian Industry, Carbon Disclosure Project
Title Carbon Disclosure Project 2008–—India 200
Date September 2008
AMWG commentary
This survey was the second annual exercise for India. It provides useful information on the companies which responded, but it also raises concerns. Firstly, 69% (139 companies) did not respond to the CDP6 questionnaire in 2008, including some leading companies which had responded in 2007. Secondly, there was an increase in the number of companies—especially among energy-intensive companies—that declined to participate. Both of these facts clearly
Estimated investments across climate change themes with potential beneficiaries
How finance copes with the ticking clock 75
demonstrate that there is still an enormous amount of work to be undertaken to raise the awareness and capacities of Indian companies in connection with climate change.
Respondent companies agree that GHG emissions present business opportunities (e.g. related to clean energy, energy efficient products, and emissions trading; and companies have made investments or are planning investments to tap this potential). However, when it comes to the actual accounting of their GHG emissions, only few companies are actively engaged, and this remains a cause for concern.
8.4.1 China (general)
Type Academic report31
Research institution School of Law & Research Institute of Environmental Law, Wuhan University
Author Tianbao Qin
Title From stander-by to stakeholder—China’s perspective on climate change
Date January 2009
AMWG commentary
The author of this paper contends that China has already made the shift from a position characterised as reactive, passive, and ‘somewhat of a bystander’, to that of a true stakeholder in the global policy arena on climate change. This transformation can be attributed to several factors:
n China is more vulnerable than most developed nations to significant damage as a result of climate change. China’s capacity to ‘tackle’ climate change is relatively low, and it has an enormous population
n Climate has exacerbated tensions over access to water. Water availability has decreased in north China, and shortages have also been observed in the south. Chinese glaciers are shrinking, and melt-water resources are dwindling, threatening water supplies, particularly in the western regions
n Climate change can threaten China’s agricultural production in several ways, through such things as increased instability in yields of wheat, rice, and maize; changes in production conditions that would mean dramatically increased production costs; and physical changes such as desertification, shrinking grassland, and increased incidence and severity of drought
n Rising sea levels are likely to destroy coastal wetlands, mangroves, and reefs that protect populations and infrastructure in coastal areas. Several cities with large populations, including those on the Yangtze delta, are increasingly vulnerable to flooding, sea water intrusion, and tropical storms
n Greater frequency and intensity of heat waves increase the threats to public health from malaria, dengue fever, and cardiovascular diseases, particularly in areas with high population density
While China’s economy has developed rapidly, its GDP per capita is only one quarter of the world average; many parts of China have ‘crisis’ conditions in economic development. Although it is poor, its carbon intensity is relatively high because of its heavy reliance on coal. It will be uniquely challenging for China to continue its economic development and concurrently reduce its greenhouse gas emissions.
Despite the challenges, however, there is significant international pressure on China to undertake commitments to reduce greenhouse gas emissions. The author expects that China will be an
31 The full report is available at http://papers.ssrn.com/sol3/papers.cfm?abstract_id=1325152
The materiality of climate change76
‘intense focus’ in the Kyoto Protocol negotiations regarding emissions reduction regimes post-2012.
China’s legal and policy regime has responded in many ways to the facts of its increased vulnerability and international pressure regarding climate change. China set up a National Coordination Committee on Climate Change in 1998, with a mandate to develop and harmonize climate change policies and activities among the different ministries of its government, and to submit to the State Council for decision-making those questions of great importance upon which there is significant difference of opinion. More recently, China established a National Leading Group on Addressing Climate Change and Managing Energy Conservation and Pollution Reduction. This group is responsible for determining the means for China to respond to climate change, including a target of cutting energy consumption by 20 percent per unit of GDP.
The paper discusses the many effective specific mechanisms and actions already undertaken to reduce energy and carbon intensity of China’s economy, and goes over some of China’s achievements in controlling energy consumption and mitigating climate change over the past decade. The author reports that China has become much more serious in the past several years about the importance of climate change to China’s economy and economic plans, and much more committed to reducing China’s contributions to climate change.
Extract
General law and policy after the [Kyoto Protocol] came into force
With the Kyoto Protocol in force, China insists on sustainable development strategy as always and promotes energy conservation and industrial adjustment. In the next decades, China will change the pattern of economic development; insist on economical, clean, and secure development; and achieve sustainability. One important goal of all these strategies is to improve environmental quality and control GHG emission.
A. Taking energy conservation as one of the basic national policies
In order to better implement a sustainable development strategy and promote energy conservation, the 11th Five-Year Plan mandates China to accelerate transformation of the economic growth pattern. It requires China to take energy conservation as a basic national policy. Furthermore the Outline sets forth that the target of energy conservation and pollution reduction.
B. Promoting climate-favorable industrial policy
In order to fulfill the binding requirements set out by the 11th Five-Year Plan, China has also promulgated several regulations, and has undertaken many activities to optimize the energy consumption structure and cut down redundant production capacity in order to reduce energy consumption and mitigate GHG emissions.
For example, China requires that 399 kinds of manufacturing techniques and products should be phased out, specifically small mines in the area of state-owned mine fields, thermal generator sets with unit capacity under 50,000 KW, blast furnaces less than 100 m3, and so on. Meanwhile, key energy conservation projects aimed at economizing and substituting oil, co-generation, and surplus heat utilization, etc., have also become a breakthrough for industrial energy conservation in the period of the 11th Five-Year Plan. Further, China strengthened the management of investment access for construction projects, strictly controlling newly-initiated projects, especially high energy-consuming enterprises related to steel, electrolytic aluminum, copper smelting, alloy iron, calcium carbide, coke, cement, and coal. In addition, in January 2007, China decided to close down over 50 million KW of small thermal power sets and 7 to 10 million KW of oil-electric generator sets, and will no longer authorize new thermal power sets.
How finance copes with the ticking clock 77
In this way, China would save more than 50 million tonnes SCE (Standard Coal Equivalent) and reduce over 1.6 million tons emission of SO2 each year.
C. Developing climate-specific laws and regulations
In 2005, China promulgated the Renewable Energy Law to encourage and support the renewable energy-generated electricity connection to the grid; support the development of independent power system construction in those areas which are not covered by power networks to service the local production and inhabitants; set up a specific fund for renewable energy development; support science and technology research and standards development; provide preferential loans and the reduction of and exemptions from taxes for projects included in a guide for the development of renewable energy industry. In addition, China’s Legislature has made a draft amendment to the Energy Conservation Law in 2008, which aims at enhancing energy conservation management and improving the energy utilization efficiency. The amendment will be the core of the legal energy conservation system.
In order to promote the development of CDM projects, China issued the Measures for Operation and Management Clean Development Mechanism Projects aiming at accelerating the achievement of the final goal of the UNFCCC and sustainable development of China. Meanwhile, China is accelerating the draft of the (Basic) Energy Law and the Regulations on Energy-Saving Buildings which has started to solicit public opinions. Furthermore, the first draft version of the Law on Promotion of Circular Economy has been finished. All these laws and regulations would play important roles in mitigating GHG emissions.
D. Actively enhancing international cooperation on climate change
In recent years, in addition to participating in the activities under UNFCCC and KP, China attaches both bilaterally and multilaterally greater importance to international cooperation for addressing climate change.
At the bilateral level, China has established cooperative relations with many other countries, and has established working groups on climate change with Australia, Canada, Japan, the US, and even some developing countries, such as Brazil and India. In 2005, China and EU issued a Joint Declaration on Climate Change. China and EU have agreed to manage climate change jointly and promote substantial cooperation, including technology cooperation on CCS and the near Zero Emissions Coal Initiative (nZEC), supporting clean energy and energy efficiency technology, and promoting energy protection and renewable energy exploration.
At the multilateral level, in January 2006, the Asia-Pacific Partnership on Clean Development and Climate (AP6) was established by Australia, China, India, Japan, Republic of Korea, and the United States in Sydney. The AP6 is a ground-breaking climate change approach bringing together key developed and developing countries on practical, pro-growth, technology-driven efforts involving environmental protection and energy conservation technologies such as clean coal, nuclear energy, renewable energy, etc.
8.4.2 China (corporate)
Type Business survey
Research institutions SynTao, Carbon Disclosure Project
Title Carbon Disclosure Project Report 2008—China 100
Date September 2008
AMWG commentary
n The Chinese business sector is still getting up to speed on climate change. There was just
The materiality of climate change78
a 23% response rate to the CDP survey, with a mere 5% completing the questionnaire. The most aware sectors are financial companies (mainly banks) and energy companies
n Though suffering from extreme weather events more frequently in recent years, Chinese companies have not seen natural disasters as a climate change risk, but an accidental event. They are more concerned with their obligation of ‘energy efficiency and emission control’ assigned by the government. Large companies are establishing internal carbon management systems, but the data collection is weak
n Investors are interested in equities related to energy efficiency and emission control, in new energy investment and in Clean Development Mechanism (CDM) projects
8.4.3 China (risk management)
Type Industry study
Research institution Chartered Insurance Institute
Title Coping with climate change
Date February 2009
AMWG commentary
This large study contains an excellent review of China and climate change from the insurer’s perspective. The Chinese economy is dynamic, but the business community is unsophisticated in risk management, which is reflected in the local insurance market. This means that the potential for catastrophic losses is underplayed, which could adversely affect not just companies and consumers in China, but also the whole of the subsequent supply chain.
Extract
China is now the largest consumer and producer in the world of many different commodities. It is the second largest consumer of primary energy after the US, and the top global producer of coal, steel and cement. Its increasing appetite for commodities is driving global demand for everything from oil and steel to copper and aluminium. And up to 2015, half of the world’s new buildings will be constructed in China (Hanson and Martin, 2006). This strong position could evolve in a number of ways, depending upon the pace of internal reform and the degree of collaboration with The West, but there is little doubt that China will be a major economic player this century (World Economic Forum, 2006).
However, there are obstacles. There is a growing gap between richer people in cities, and the majority of hundreds of millions of poorly educated rural dwellers. The domestic market is relatively small, and the country has limited resources, with some, especially water, well below world averages. China’s complex topography and various climates also render the country extremely vulnerable to hydrological hazards including floods and storms, as well as earthquakes. Major rivers like the Yangtze originate in the high mountains in the west. Most portions of the east and middle portions are governed by the monsoon climate which brings significant rainfall in summer, concentrated along the Yangtze River basin, and often associated with typhoons. Climate change will exacerbate the natural hazards (NDRC, 2007). At the same time, the need to abate emissions means major changes for an economy based on coal.
Natural hazards and climate change
The most serious threat from climate change is water scarcity, characterized by less precipitation in Central Asia and the shrinking of glaciers, some of which may vanish by the year 2035. (However, the accelerated melting of glaciers will initially cause more flooding and landslides). Figure C2 shows the trend of rainfall in China over the past 50 years. The red symbols are decreases, the blue indicate increases; the larger the symbol, the greater the change.
How finance copes with the ticking clock 79
Floods can arise in three ways:
n River floods have been major hazards in China for more than 3,000 years. The defences are generally designed to a 10-20 year return period giving very low levels of real protection, and are often in a poor state of repair. The expected increased frequency of extreme rains in southern parts will result in more flooding. (IPCC, 2007)
n Climate change induced sea level rise would cause large-scale inundation and erosion. The projected relative sea level rise from all factors including climate change is 40-60cm, 50-70cm and 70-90cm in the Pear River, Yangtze and Yellow River Deltas respectively by 2050. Current defences are insufficient to deal with high sea level rise (IPCC, 2007)
n Even weak typhoons deliver large quantities of rain inland, and this is a major source of damage. Vulnerability has increased due to poor development policies: deforestation, drainage of lakes, building on floodplains, and the proliferation of hard surfaces have all contributed to make flood risk much worse. In coastal areas this is exacerbated by subsidence due to construction and water extraction, and the loss of river-borne silt when dams are constructed upstream
Economic vulnerability to climatic disasters
Natural disasters, including earthquakes, cost 3-6% of China’s GDP. In China statistics showed an 18.2% average annual growth rate of government relief funds for natural disaster from 1962 to 2003, as compared to an average growth rate of 6.9% in the country’s GDP during the same period (ADB, 2007). The main reasons for the growth over time are economic development, which increases the exposure, and poor development planning, which increases the vulnerability (Ye, 2006; Ju, 2006). The majority of multinational investments and assets at risk are in coastal regions prone to damaging floods, tsunamis, typhoons, earthquakes, and land subsidence. The high concentration of physical assets and employees in these areas increases the potential cost of any one catastrophe (Marsh, 2006).
The GDP of the Yangtze delta in 2003 was 19.5% of China’s total. It is expected that the total GDP of the 3 metropolitan cities located in the Pearl River delta, Yangtze delta and Yellow River delta will represent 80% of Chinas GDP by 2050, from around 33% in 2003 (IPCC, 2007). As Table C1 shows, these areas are exposed to flood and storm.
Water scarcity could become a serious issue for industry—firstly from lack of water for processing, and secondly from lack of power—either hydropower due to lower river flow, or
Figure C2: Change in precipitation in second half twentieth century
Source: Ye, 2006
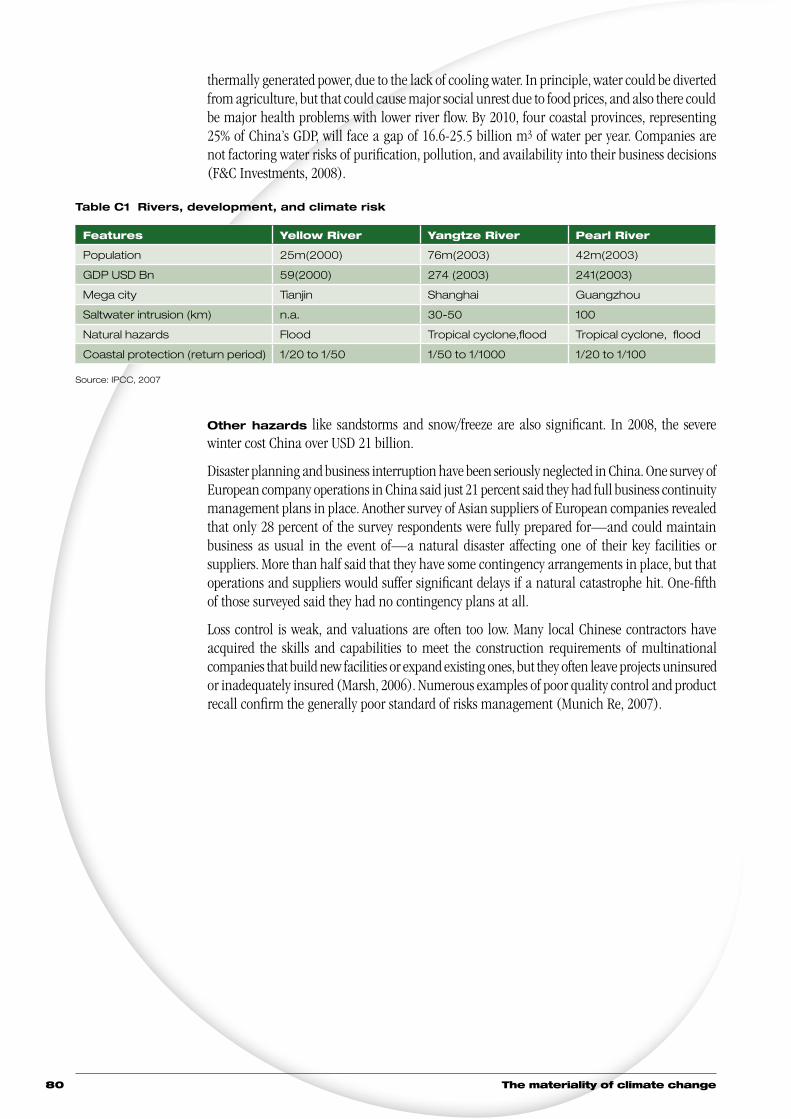
The materiality of climate change80
thermally generated power, due to the lack of cooling water. In principle, water could be diverted from agriculture, but that could cause major social unrest due to food prices, and also there could be major health problems with lower river flow. By 2010, four coastal provinces, representing 25% of China’s GDP, will face a gap of 16.6-25.5 billion m3 of water per year. Companies are not factoring water risks of purification, pollution, and availability into their business decisions (F&C Investments, 2008).
Table C1 Rivers, development, and climate risk
Features Yellow River Yangtze River Pearl River
Population 25m(2000) 76m(2003) 42m(2003)
GDP USD Bn 59(2000) 274 (2003) 241(2003)
Mega city Tianjin Shanghai Guangzhou
Saltwater intrusion (km) n.a. 30-50 100
Natural hazards Flood Tropical cyclone,flood Tropical cyclone, flood
Coastal protection (return period) 1/20 to 1/50 1/50 to 1/1000 1/20 to 1/100
Source: IPCC, 2007
Other hazards like sandstorms and snow/freeze are also significant. In 2008, the severe winter cost China over USD 21 billion.
Disaster planning and business interruption have been seriously neglected in China. One survey of European company operations in China said just 21 percent said they had full business continuity management plans in place. Another survey of Asian suppliers of European companies revealed that only 28 percent of the survey respondents were fully prepared for—and could maintain business as usual in the event of—a natural disaster affecting one of their key facilities or suppliers. More than half said that they have some contingency arrangements in place, but that operations and suppliers would suffer significant delays if a natural catastrophe hit. One-fifth of those surveyed said they had no contingency plans at all.
Loss control is weak, and valuations are often too low. Many local Chinese contractors have acquired the skills and capabilities to meet the construction requirements of multinational companies that build new facilities or expand existing ones, but they often leave projects uninsured or inadequately insured (Marsh, 2006). Numerous examples of poor quality control and product recall confirm the generally poor standard of risks management (Munich Re, 2007).
How finance copes with the ticking clock 81
9 Adaptation
The investment community has given a growing amount of attention to reducing greenhouse gases, but the investor implications of the physical impacts of climate change have been largely ignored. This mirrors attitudes in political and other circles—impacts are (wrongly) seen as rather far-off, perhaps because of the tendency by scientists to make projections many decades ahead; and also, sadly, because the worst impacts will happen in regions with little economic power.
In this section, we highlight four pieces of work. The first is an exceptionally detailed study of the repercussions of climate change on real estate in the UK, covering vulnerability to a wide range of climatic factors, five categories of real estate, five types of infrastructure and 14 different UK cities. It sets the scene for work which we are sure will follow—more detailed technical research into physical responses, and also equity analysis.
The research identifies several critical problems that will grow worse unless they are tackled in a determined way. A key impact for occupiers of buildings will be heat stress, particularly in the urban heat island setting. This could add considerably to upgrading costs and reduce asset value in these high value concentrations. This could be compounded by increased risk of flash flooding as the runoff from hard surfaces overwhelms the capacity of urban drainage systems. Naturally, the vital urban transport links will also be at risk to heat waves and flash flooding, which could make traditional business centres less attractive. Changing rainfall and growing populations could mean water shortages in key areas, leading to increased supply charges. Southern coastal cities like Southampton could, by the end of the 21st century, face severe storm surge events 20 times more frequently.
The study concludes that the property sector must update itself regularly on the impacts of future climate change as the scientific evidence in this area is continually evolving. However, techniques for adaptation (e.g. natural cooling with ‘green roofs’) are being constantly refined in the UK and elsewhere, which could substantially reduce the impacts. The public sector has a vital role through investment in services and infrastructure, and by strengthening regulations on drainage and resilient design, all of which would assist in preserving the quality of real estate assets, so investors need to make their concerns clear.
Finally, the availability and price of weather insurance are important. Higher insurance premiums will feed through to occupiers and then to owners of property. Withdrawal of insurance will have a more significant impact on the rental and capital value of affected property, and again investors and developers should open a dialogue here.
The second and third cases are associated with the Carbon Disclosure Project. A review of the FTSE 350 by Acclimatise finds that the corporate sector is still not up to speed on adaptation, though there are examples of best practice in every sector. Such firms may be well-positioned to gain competitive advantage. Most firms see climate change as a variant on CSR. There is very limited use of analytical techniques such as scenarios or technology (e.g. smart metres, remote sensors). The report distills its analysis into a comprehensive checklist which directors (and investors) can use to assess their preparedness to deal with climatic impacts, grouped under the headings of risks, opportunities, and response. The situation in ‘Other Asia’ is considered in the third report, which concludes that companies there are much more aware and better prepared to cope with climate change issues than their opposite numbers in, say, China.
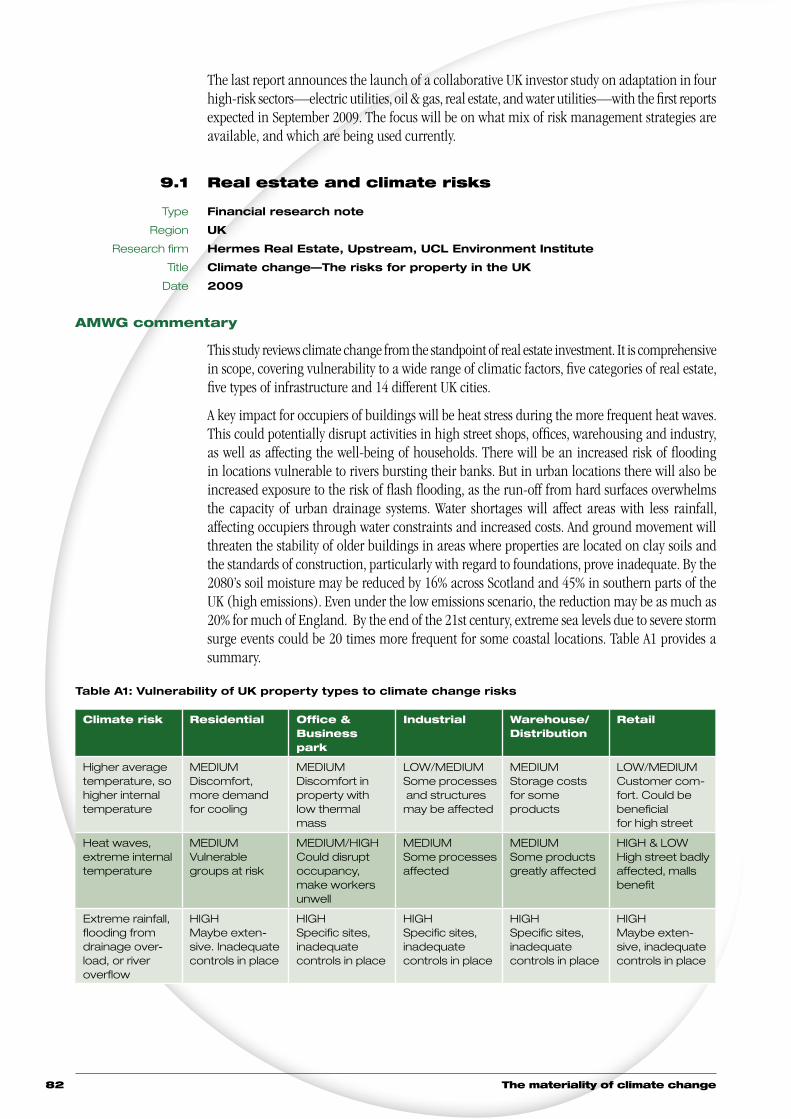
The materiality of climate change82
The last report announces the launch of a collaborative UK investor study on adaptation in four high-risk sectors—electric utilities, oil & gas, real estate, and water utilities—with the first reports expected in September 2009. The focus will be on what mix of risk management strategies are available, and which are being used currently.
9.1 Real estate and climate risks
Type Financial research note
Region UK
Research firm Hermes Real Estate, Upstream, UCL Environment Institute
Title Climate change—The risks for property in the UK
Date 2009
AMWG commentary
This study reviews climate change from the standpoint of real estate investment. It is comprehensive in scope, covering vulnerability to a wide range of climatic factors, five categories of real estate, five types of infrastructure and 14 different UK cities.
A key impact for occupiers of buildings will be heat stress during the more frequent heat waves. This could potentially disrupt activities in high street shops, offices, warehousing and industry, as well as affecting the well-being of households. There will be an increased risk of flooding in locations vulnerable to rivers bursting their banks. But in urban locations there will also be increased exposure to the risk of flash flooding, as the run-off from hard surfaces overwhelms the capacity of urban drainage systems. Water shortages will affect areas with less rainfall, affecting occupiers through water constraints and increased costs. And ground movement will threaten the stability of older buildings in areas where properties are located on clay soils and the standards of construction, particularly with regard to foundations, prove inadequate. By the 2080’s soil moisture may be reduced by 16% across Scotland and 45% in southern parts of the UK (high emissions). Even under the low emissions scenario, the reduction may be as much as 20% for much of England. By the end of the 21st century, extreme sea levels due to severe storm surge events could be 20 times more frequent for some coastal locations. Table A1 provides a summary.
Table A1: Vulnerability of UK property types to climate change risks
Climate risk Residential Office &Business park
Industrial Warehouse/Distribution
Retail
Higher average temperature, so higher internal temperature
MEDIUMDiscomfort,more demand for cooling
MEDIUMDiscomfort inproperty withlow thermal mass
LOW/MEDIUMSome processes and structures may be affected
MEDIUMStorage costs for some products
LOW/MEDIUMCustomer comfort. Could be beneficialfor high street
Heat waves,extreme internal temperature
MEDIUMVulnerable groups at risk
MEDIUM/HIGHCould disrupt occupancy, make workers unwell
MEDIUMSome processesaffected
MEDIUMSome products greatly affected
HIGH & LOWHigh street badly affected, malls benefit
Extreme rainfall,flooding from drainage overload, or river overflow
HIGHMaybe extensive. Inadequatecontrols in place
HIGHSpecific sites,inadequate controls in place
HIGHSpecific sites,inadequate controls in place
HIGHSpecific sites,inadequate controls in place
HIGHMaybe extensive, inadequate controls in place

How finance copes with the ticking clock 83
Climate risk Residential Office &Business park
Industrial Warehouse/Distribution
Retail
Drought, poorwater supply
MEDIUMCertain areas
LOW/MEDIUMCertain areas
MEDIUMCertain processesas
LOWLimited water use
MEDIUMCertain areas, moreaffected than offices
Reduced soil moisture, so subsidence in clay areas
MEDIUMCertain areas.Particularly older buildings.
LOWCertain areas, not much vulnerable stock
LOWCertain areas, not much vulnerable stock
LOWCertain areas, not much vulnerable stock
LOW/MEDIUMCertain areas.Older high street stock
Stronger winds, structural damage
MEDIUM*More loose debris, treefall
LOWLess chance for collateral damage
LOWMany buildings built to purpose
LOWGenerally not in high-hazard sites
LOW/MEDIUMOlder, high street stock at risk
Storm surge** MEDIUM/HIGHCertain areas
MEDIUM/HIGHCertain areas
MEDIUM/HIGHCertain areas
MEDIUM/HIGHCertain areas
MEDIUM/HIGHCertain areas
* In the original, this is ranked LOW, but it is already a significant risk for the reasons given in the table.** This was not tabulated in the original
The infrastructure systems that underpin all urban activities will also be affected. Transport, energy supply, water supply, sewerage and urban drainage systems will all struggle to cope with heat waves, higher wind speeds, increased rainfall and consequent flooding. Investment will be required to ensure that property occupiers are not affected by severe and costly disruptions to these essential services. In this case the profile is different, with the main vulnerability being transport and water supply, and the key hazards being drought, heavy rainfall, and drought. (see Table A2).
The main concern from the perspective of urban drainage infrastructure is the capacity to cope with urban run-off during intense rain episodes. In coastal locations, this may be exacerbated by tidal surges locking-out urban drainage systems. This requires investment to overcome such problems. An associated concern is that reduced soil moisture will affect the permeability of the soil and exacerbate urban run-off. This highlights the significance of sustainable urban drainage systems (SUDS) in urban areas. Changing rainfall patterns create problems for water management with greater fluctuation in water supply over time and space, and, in some locations, periodic droughts. Reduced soil moisture during drought periods may reduce the penetration of subsequent rainfall into the water table, with water instead contributing to greater run-off; potentially exacerbating problems of water management. These features are likely to lead to increased water supply costs.
Forty percent of manufacturing industry is located within the coastal zone. The run-off of water during intense rain episodes will be affected by the substantial areas of hard surfacing that surround industrial premises. SUDS have not traditionally been incorporated into industrial estates to mitigate such risks. Many industrial processes are heavy users of water and these will be particularly affected by drought conditions and future rising costs for water.
Heat waves will particularly affect public transport systems, when temperatures may become untenable, especially in rail and underground rolling stock that has no natural ventilation. However, roads may become vulnerable to heat waves if temperatures cause surfaces to melt; increased incidents of rails buckling will also occur. Flooding could overrun roads and rail networks at multiple locations. In addition, heavy rainfall may increase the risk of landslip affecting both road and rail networks. Coastal networks are clearly at risk, particularly in the south and east. While wind speeds are not predicted to increase with any certainty, more frequent winter storms may lead to key links in the road and rail infrastructure being closed more often.

The materiality of climate change84
Table A2: Vulnerability of UK infrastructure to climate change risks
Climate risk Transport Energy supply
Water supply
Sewerage Urban drainage
Higher average temperature LOW/MEDIUM LOW LOW LOW LOW
Heat waves HIGH MEDIUM HIGH LOW LOW
Extreme rainfall, flooding from drainage system overload, or river overflow
HIGH HIGH HIGH HIGH HIGH
Drought LOW LOW HIGH MEDIUM LOW
Reduced soil moisture, so subsidence in clay areas
LOW/MEDIUM LOW MEDIUM LOW MEDIUM
Stronger winds, structural damage MEDIUM MEDIUM LOW LOW LOW
The southern parts of the UK will be most affected by climate change. Of the 14 cities, Southampton is most likely to be adversely affected. London, Bristol, Cardiff and Cambridge will also suffer negative impacts.
The study concludes that the property sector must update itself regularly on the impacts of future climate change as the scientific evidence in this area is continually evolving. Also, techniques for adaptation are being constantly refined in the UK and elsewhere, which could substantially reduce the impacts. Failure to adapt appropriately could be costly.
Examples of where research is ongoing include:
n Glass curtain walling with the masonry mass in the centre of the building (as with many office buildings) is less thermally effective in hot conditions than having thermal mass in the roof and ceilings with natural ventilation to remove stored heat
n Increased UV radiation on paintwork and exterior finishes will mean more frequent maintenance of properties
n Higher temperatures may increase aggressive insect infestation, such as wood-boring and other invasive insects
n Cavity wall insulation (recommended for thermal efficiency) may render buildings more vulnerable to rain penetration in conditions of driving rain
n The capacity of guttering is a key issue in preventing water damage
n Milder winters with higher absolute humidity are likely to favour mould growth, with consequent health impacts
n Building regulations calculate wind loads on the basis of certain assumptions about the directionality of wind. If this directionality changes, then the current regulations may be under-designing for resilience against wind by up to 50%
n To keep residential property cool, shading, ventilation and (for modern property) increasing the thermal mass of the building may be needed. In older commercial property, extended use of air conditioning systems will increase their failure rate since they are not engineered to operate at such high temperatures. Again the mass of the buildings is a key factor in coping with higher temperatures
Effects can be very localised, particularly flood risk and the urban heat island (UHI), so the projections need to be more granular. During the heat wave in August 2003, night time temperatures in central London were as much as 9°C higher than those recorded in Surrey, approximately 50 km to the west. There also more subtle effects, such as likely changes in tourism and leisure patterns due to different weather in the UK and overseas.
How finance copes with the ticking clock 85
Collaboration with other stakeholders is necessary. In Manchester, for example, an extra 10% of green space in the city would maintain temperatures at or below current levels until 2080. The greening of all roofs in Manchester city centre and the surrounding residential areas, may keep surface temperatures below the 20th century baseline level. A further benefit from the development of green roofs and the use of SUDS would be to reduce the effects of flash flooding.
Finally, the availability and price of weather insurance are important. Higher insurance premiums will feed through to occupiers and then to owners of property. Withdrawal of insurance will have a more significant impact on the rental and capital value of affected property.
9.2 An agenda for corporate action
Type Industry survey
Region UK
Research institutions Acclimatise
Title Carbon Disclosure Project Report 2008 FTSE 350: Building business
resilience to inevitable climate change—The adaptation challenge
Date April 2009
AMWG commentary
This report prepared by Acclimatise analysed the responses to the Carbon Disclosure Project 2008 (CDP 6) from the UK FTSE 350, concerned with actions being taken by companies to adapt and build resilience to climate change. The issue was reviewed in 2006 and little progress has occurred since, other than in the water and insurance industries. It may be that the crunch will come with stakeholder litigation to recover costs incurred due to inadequate products or services that proved inadequate in the face of changing climatic conditions.
On average, firms score 38 out of 100 on an adaptation index devised by Acclimatise. Eighty-seven percent of the FTSE 350 firms acknowledge that their company is exposed to the impacts of a changing climate and 69% report some action, but it is limited, not comprehensive. Only 38% indicated that a quantified risk analysis may have been undertaken. It is notable that some sectors that are exposed to impacts because of their supplies (e.g. food), sales (e.g. retail), or assets (e.g. real estate) do not score well. Water is ahead due to pressures from regulators, cost, and key stakeholder groups.
For investors, it is notable that there are pacesetters in every area, because the scores on the index vary greatly within sector. They may be well-positioned to gain competitive advantage. Most firms see climate change as a part on CSR. There is very limited use of analytical techniques such as scenarios or technology (e.g. smart metres, remote sensors).
To aid directors, Acclimatise, in collaboration with IBM, drafted a set of questions on adaptation for self-reference. They are grouped under risk, opportunity, and response. These can also be used by investors also to judge how seriously a company is addressing the issues (see below).
Extract
Your risks
01 What are the operational impacts of climate change on your company?
n How are your supply chains and suppliers’ operations affected?n What are the implications for the price, supply and demand for commodities (e.g. agriculture,
minerals), and services (e.g. water, energy, telecommunications and IT)?n How will international and internal security threats due to climate change affect your local
labour and supply chains?
The materiality of climate change86
02 Which of your company’s key operating assets are located in areas
vulnerable to climate change impacts and what are the implications?
n How long would it take and what costs would be involved to relocate and reconfigure key operating assets?
n What are the implications of depreciating, abandoning or writing-off assets before normal end-of-life?
n How will the value of your asset portfolio change over time?
03 How sensitive is demand for your products and services to climate
change impacts?
n How will customer needs, behaviour and ability to pay, change and over what timescale? n What steps have you taken to ensure that your current products and services remain
viable? n What are the implications arising from changes in the demographics of your customer
base?
04 How could current and future regulations and industry standards
aimed at lessening climatic changes affect your organisation and its
reputation?
n What is your level of regulatory and financial exposure to the introduction of prescriptive legislation on adaptation, together with further legislation on urgent mitigation action as the reality of climate change becomes more pressing?
n How effective and auditable is your process for reporting regulatory and policy compliance?
n Which areas of your business are sensitive to media, NGO and local community concerns?
Your opportunities
05 What new and enhanced existing products and services can you offer
your customers?
n What steps are you taking to develop new or enhanced business opportunities that will provide competitive leadership?
n How will you develop brand stretch to take advantage of changes in customer behaviours and develop climate related markets?
n Can you provide products and services that will help customers predict, monitor, adapt, insure or recover from climate change?
06 What operational benefits could you enjoy from managing your
response to climate change?
n How can you improve the attractiveness of your company to investors, banks, credit rating agencies, employees and potential recruits?
n How will you use the current economic crisis as an opportunity and an incentive to revisit your business model and respond to the growing social, environmental and economic challenges?
n What are the cost advantages if you can secure more favourable insurance cover by demonstrating strong operational risk management processes and a responsible climate-aware business?
Your response
07 How clear and effective are your company’s internal management
responsibilities for climate change and your engagement with
stakeholders?
n To what extent are your climate change leadership and management roles clearly defined, supported and empowered?
n How are you sharing knowledge with and informing governments, regulatory bodies, NGOs, and the media to manage and forecast exposure?

How finance copes with the ticking clock 87
n What actions are you taking to ensure that the investment community, your bankers and insurers understand and support the steps you are taking regarding climate risk?
08 How well structured is your company’s approach for managing climate
change?
n How effective is your planning process for exploring longer-term scenarios, identifying risks and opportunity signals as they emerge, and acting accordingly?
n How are you assessing the vulnerability of your suppliers, assets, operations, workforce and markets to changing risks?
n What steps are you taking to ensure that climate-driven business risks and opportunities are embedded into your capital investment and operational expenditure decision- making processes?
09 How can you ensure your company’s approach is based on robust
information and assumptions?
n How have you integrated the latest available climate science and climate change scenarios to inform your business planning and decisions?
n Are your management information systems for assets, supply chains, operations, markets and customers reporting on and monitoring climate change KPIs using realtime, interconnected and intelligent data?
n Can your information systems provide an early warning of operational risk?
10 How can you demonstrate that your company’s climate business
resilience plans are realistic and financially viable?
n What actions have you taken to understand and manage future liquidity and ensure sufficient contingency funding?
n How do your business continuity and crisis management plans reflect the changing risk profiles due to climate change and are they well-rehearsed?
n What steps are you taking to involve your employees, implement new technologies, and develop new skills, expertise and cultural change?
9.3 Other Asia—Starting to face up to the issue
Type Industry survey
Region Asia
Research institutions Carbon Disclosure Project, Association for Sustainable & Responsible
Investment in Asia (ASrIA)
Title Carbon Disclosure Project Report 2008—Asia ex-Japan
Date September 2008
AMWG commentary
This survey focuses on Korea, Singapore, and China. Companies there are well ahead of their competitors in other parts of Asia and low-wage economies in their understanding of climate change issues, which is a plus for investors since it means that these companies are more savvy about forthcoming carbon regulations and climatic hazards.
Extract
The most distinctive findings in the 2008 sample highlight the extent to which Asian companies critically affected by climate change are moving rapidly from a basic understanding of the issues to the implementation of practical corporate policies. Asia’s traditional ESG leaders are pushing hard to experiment with targets and the metrics which will define carbon leadership in Asia. New elements of the Asian context for dialogue about climate change are also emerging. For example,
The materiality of climate change88
natural disasters caused by extreme weather have long been a part of Asia’s seasonal weather patterns. Now, however, Asian companies are viewing weather risks from a climate change lens and are reporting a pattern of unmistakable risk which will require mitigation and adaptation. We are also seeing tangible proof of the power of global brands in encouraging Asian supply chain companies to begin reporting on carbon emissions. Taken together, these developments serve to reinforce the business case for carbon reporting and investor engagement.
Extreme weather events > The 2008 responses showed a sharp increase in the acknowledgement of extreme weather events, particularly flooding and typhoons, as a material business risk to facilities and supply chains. Just as scandals often draw corporate attention to ESG issues, it would seem that natural disasters may be having a similar effect in raising awareness of climate change risks in Asia. A handful of respondents specifically cite individual weather events, most notably the snow storms in China earlier this year. This body of Asian reference points has typically included seasonal flooding, the annual haze which covers parts of Singapore, Malaysia, and Indonesia due to fires set to clear land, and airborne dust from spring sand storms in China which affect China, Korea, and Japan. Indeed, in an unusually specific disclosure, Hynix indicates that yellow sand from China has increased because of climate change induced desertification, and the sand is able to permeate its operational processes, damaging products and plant.
Taiwan [China] supply chain > Taiwan [China] recorded the largest number of new respondents and the highest response rate of the samples, thanks to a set of new responses by a number of Taiwan’s leading electronics manufacturers. Taiwanese companies [appear] to be at the forefront of GHG emissions disclosure in the region. Many companies are predicting a cap and trade scheme and also recognize the financial benefits of reducing emissions via energy efficiency and life cycle management of products. As a result, Taiwan’s companies are now more focused on carbon management and thus able to provide meaningful information.
Regulatory uncertainty inhibits > While many Asian companies are forging ahead with carbon reporting and mitigation, regulatory risk remains high and companies with more limited policy resources struggle to detect policy direction.
Operational data > CDP6 has good news for Asian investors in the form of new data disclosures on operational metrics linked to carbon emissions which make it possible to begin identifying the operational and financial decisions which companies will need to make as they address climate change.
9.4 High-risk sectors—Coming soon
Type Briefing paper
Region Global
Research institutions Henderson Global Investors, Insight Investment, RAILPEN Investments,
Universities Superannuation Scheme, Acclimatise
Title Managing the unavoidable—Understanding the investment implications of
adapting to climate change
Date January 2008
AMWG commentary
This collaborative research project aims to identify how companies and their investors are likely to be affected by the physical impacts of climate change. The scope will include identifying for selected sectors the following:
n Major direct, physical climate change and weather-related risks (and associated opportunities) faced by companies in the sector

How finance copes with the ticking clock 89
n Potential implications for cash flows and balance sheetsn Disclosures required by investors to enable them to evaluate corporate exposures to climate
change risks
Companies’ response strategies could be grouped under six main risk control options:
n Avoid the risk, or example, by closing or moving operationsn Reduce the risk, or example, by climate-proofing buildings and infrastructuren Transfer the risk through, for example, purchasing insurance or outsourcing certain activities
to third partiesn Accommodate the risk, or example, through better contingency planningn Accept the risk, where the costs of addressing the risk may be disproportionate relative to the
benefitsn Identify opportunities associated with a changing climate
The project will focus initially on four sectors—electric utilities, oil & gas, real estate, and water utilities. Although the focus of the project will be largely on UK-listed companies, the method should be transportable to other sectors (e.g. tourism) and markets. The benefits for investors will be a more sustainable outcome, based on deeper research, improved asset valuation and portfolio management, and well-informed engagement with companies and dialogue with policymakers. The first outputs are expected in September 2009.
The materiality of climate change90
10 Supply chain
Understandably, the initial attention by financial analysts was directed to the direct effects on companies of climatic events and carbon reduction policies, more so because the data even for that was lacking, whereas to investigate effects up and down the supply requires far more data. Research shows that such a simplistic approach is likely to lead to misjudgements, by both companies and investors, and the subject is fast gaining momentum, with the Carbon Disclosure Project’s Supply Chain Project worthy of an honourable mention. Here we present information from five very varied sources to illustrate the potential value of this avenue of research.
10.1 Risks in China—The insurer’s view
Type Industry study
Region Global
Research institution Chartered Insurance Institute
Title Coping with climate change
Date February 2009
AMWG commentary
This wide-ranging study presents a light-hearted case study on the importance of China as a supplier, with the message that climate change could cause serious supply chain problems for Western markets.
Extract
More than 90 percent of multinational companies say that China is important to their global strategies, with 52 percent calling it critical. The promise of low-cost manufacturing remains one of the primary reasons companies look to China as a sourcing base (Marsh, 2006). As noted earlier, there are serious threats from natural hazards, and potential logistical bottlenecks at ports.
An amusing but nevertheless important insight into the EU’s dependence on China came to light in 2005. In this case the interruption of supplies was due to a trade quota, the sector that was affected was retail and clothing, and the supply was restored by some nifty redrafting of regulations. However, the same problem might occur as a result of natural disasters closing major Chinese ports, or reducing the supply of water for manufacturing, with much more serious consequences.
In August 2005, leading retailers including H&M, Marks & Spencer, BHS, Debenhams and John Lewis—which rely increasingly on inexpensive clothing imports from China—warned that with new import quotas blocking pre-paid shipments, prices could rise and stocks might be affected. Concern was expressed over a serious knock-on effect for the Christmas shopping period, with significant effects on turnover and profits.
As reports multiplied of ‘trouser mountains’ and huge stocks of pants, bras, dresses and other garments languishing in European ports, and retailers frantically sought alternative suppliers, the European Trade Commissioner Peter Mandelson criticised the ‘shrill and hysterical’ response, but he was forced to revise the terms of the controversial textile-quota deal he had negotiated with China to avert a possible trade war (source: Observer, 2005).
How finance copes with the ticking clock 91
10.2 What if? A level playing field for carbon
Type Financial research note
Region Global
Research institution Trucost
Title Manufacturers—Profits at risk from carbon costs
Date July 2008
AMWG commentary
This short note considers the implications of ‘carbon tariffs’ for exports from countries that do not undertake emission targets. Effectively, this would be the equivalent of very large energy price increases in India and China, with significant impacts on the bottom line for some multinationals (e.g. Alcoa, or steep increases in cost for their customers).
10.3 Hidden carbon—The whole footprint
Type Research report
Region UK
Research institution Carbon Trust
Title The carbon emissions generated in all that we consume
Date January 2006
AMWG commentary
UK consumers use products and services with a combined carbon footprint of 176.4 MtC (millions tonnes carbon per annum). This is 7% greater than the emissions from all UK production, which means that the UK is a net importer of carbon-intensive products and services from abroad. Recreation & leisure, space heating, and food & catering are the three consumer needs with the highest carbon emissions—together, they account for almost half of the total UK carbon emissions. For recreation & leisure, two-thirds of the carbon is ‘embedded’ in the sector’s inputs, whereas the bulk of carbon emissions in space heating are obviously direct. This type of analysis shows that carbon constraints may have strong effects on what are perceived of as low-intensity sectors.
10.4 The food chain
Type Research report
Region UK
Research institutions The Centre for Business Relationships, Accountability,
Sustainability & Society
Title Looking up, looking down—Responsibilities for climate change
in the UK food supply chains
Date 2007
AMWG commentary
Modern ‘consumerist’ foods are sourced globally, rely on energy-intensive storage, and are increasingly consumed as processed or ready meals. Too often, the energy and climate change impacts of the food sector have been minimised by concentrating analysis upon particular activities in the food chain (e.g. production).
The materiality of climate change92
There has been a preference to rely upon the private interest model in food safety regulation (i.e. relatively light control). This study, which consulted a range of stakeholders (e.g. consumers, producers, manufactures, retailers, regulators and policymakers), indicates that at this stage, climate change issues in the food and drink industry may need more attention. While there is a small number of socially aware companies already showing high level of awareness regarding climate change issues and disseminating this along the supply chain, there is a much larger group of actors for whom the process is yet to begin.
10.5 Supply chain guidance on climate change
Type Industry survey
Region Global
Research institutions Carbon Disclosure Project, PricewaterhouseCoopers
Title Carbon Disclosure Project Supply Chain Report 2009: Shared value—
Managing climate change in the supply chain
Date 2009
AMWG commentary
This new initiative by the CDP has already produced valuable results. The guidance will be useful for firms wishing to control their carbon footprint, and can also be used by financial analysts to ascertain how well companies are addressing this issue.
Extract
The need to manage carbon and climate change in the supply chain
Research with the CDP Supply Chain member companies and their suppliers who took part in the process found that there are four key elements to effectively managing carbon and climate change in the supply chain including:
n Improving suppliers’ emissions management, reporting and accuracy of datan Influencing and supporting decreases in suppliers’ actual emissions and impactsn Reducing own emissions by considering ‘carbon costs’ in procurement decisionsn Managing supply risks related to future climate change impacts
The research with member companies also identified a number of key actions for companies wishing to engage and manage their supply chain on carbon and climate change.
Understand the market
n Maturity of the supply chain market > Although some examples of leading practice do exist, few businesses are very far along the path of fully managing carbon and climate change in their organisation. Many are just starting out and some are still trying to work out where to start
n Understand the regulatory environment > Businesses need to identify which regu-la tory frameworks apply to relevant procurement categories and markets and then share this knowledge with suppliers. As the cost of carbon becomes internalised through regulation companies will have to work closely with their suppliers to minimise potential cost increases. Where impacts are greatest companies should get actively involved in regulatory developments to help shape new legislation
n Long-term supply risks > Businesses need to understand the risks posed to their sources
How finance copes with the ticking clock 93
of supply from the impacts of climate change such as; sea level rises, extreme weather events, water scarcity and associated cost
n Volatility > Procurement teams need to understand which procurement categories may be exposed, and then develop sourcing strategies which mitigate these risks at a category level. Done well, businesses can help secure future supplies and ultimately their long term viability
Prioritise categories of spend
n Identify the highest impact areas in the supply chain first > Some companies spend too much time carrying out in depth analysis across their entire supply chain. It is better to first prioritise those areas where the greatest difference can be made, so that resources are deployed in an effective way to maximise their impacts
n Understand suppliers positioning to identify areas for collaboration > Many of the CDP Supply Chain member companies are hoping to use their suppliers’ responses to the 2008 questionnaire to identify the strengths, weaknesses and climate change adaptation strategies in their supply base. This will help them further prioritise their activities and identify suppliers to approach for possible collaboration on joint emissions reduction projects in the high impact procurement categories selected
n Knowing when to use Lifecycle Assessment (LCA) > LCA is a very valuable tool for establishing carbon intensive areas for a particular product, process or service, but given the complexity and resource involved with completing a detailed LCA, it is not a tool that is easy to apply across an entire product portfolio or supply chain. LCA is best used after having prioritised; where to focus, which suppliers to work with, and validating the time and resources it will demand
Prepare internally
n Management buy-in > Having internal Board level ownership and understanding of climate change risks and opportunities is vital to make real progress. It is also important to feed back the findings and results of activities to maintain momentum
n Align procurement and sustainability teams > Sustainability teams hold expertise in understanding carbon and climate change and procurement teams know what will work in practice when it comes to managing their suppliers. Aligning objectives along the supply chain and clearly communicating the challenges and opinions of each team means workable and practical processes can be designed
n Provide training and tailored tools > Procurement teams do not need to become sustainability professionals, but they do need to understand some key carbon impacts in their supply chain and the strategic implications of climate change on their sourcing strategies. Toolkits can be simple templates or knowledge sources
Engage suppliers
n Clearly communicate what, why and how > Suppliers need to know why customers want them to provide data and how they plan to use it both now and in the long term. Communicating to suppliers that the data provided will not be used against them – to terminate contracts or demand cost reductions or shared savings – greatly increases supplier support and opens the door to suppliers bringing savings opportunities to member companies
n Select the right supplier management strategy > Benefits have been realised from developing a relationship management strategy that learns from the leaders and encourages and informs the rest

The materiality of climate change94
n Using carbon as procurement decision criteria > Member companies agreed that the most important priority is to create criteria that can also take into account the actions suppliers are taking to improve their climate change performance, and not just their emissions record alone. The impact of carbon and climate change on business in the future may be an important screening factor as to who the company does business with. Those companies that embed this into their procurement functions are ultimately more likely to gain the greatest benefit
Plan practically for projects
n Create an action plan of projects > Projects for each of the four elements (suppliers’ emissions reporting, emissions reductions, procurement consideration, and risk management) will need to be covered. To maintain support and results, projects need to be followed up appropriately. Taking on a small number of focused initial activities, means results are often delivered faster, giving credence to investments made and demonstrating value early on
n Collaborate > One approach being used by member companies is to work collaboratively with one supplier on a pilot project in a focus area, then using the findings to develop self informing ‘roll out packs’ for all other suppliers in that industry to implement themselves
n Factor in savings measurement to project design > Consider how the results of projects and achievements will be reported and where. The true value of managing carbon and climate change in the su pply chain can then be clear and visible to all stakeholders concerned
How finance copes with the ticking clock 95
11 A spectrum of recommendations by leading investment brokers
This section presents six different approaches to climate change by investment professionals. They range from strategic reviews of every sector, using proprietary valuation techniques to incorporate ESG factors (UBS and Société Générale) to a country specific review of every sector (Citigroup), to sector-specific studies concerned with regulatory or tactical issues (CA Cheuvreux, Goldman Sachs), to a portfolio perspective from Deutsche Asset Management.
Sometimes, the findings are surprising—windfall profits for utilities in the recession, or the (apparent?) ability to ignore ESG for luxury products. But in every case, they confirm that climate change is an issue which can have important financial implications, and which therefore the investment community can no longer ignore.
11.1 Reacting to climate change (sector review)
Type Financial report
Region Global
Research firm UBS Investment Bank
Analysts Julie Hudson, Paul Donovan, Shirley Knott, Per Lekander
Title Q-Series: Reacting to climate change—How are climate change reactions
driving opportunity and risk?
Date June 2007
AMWG commentary
The authors face the challenge of discussing in economic and financial terms a subject that has long been treated as a moral and scientific matter. The first task is to deal with the adoption of a valuation framework that easily connects to formal existing models used by the financial community.
This report approaches the ways in which each sector is affected at different levels of risk. The strength of its conclusion depends on the depth of industry knowledge in the UBS database.
The authors refer to each industry in terms of its strategic response to offsetting the risk exposure to climate change.
It may never be possible to come up with a ‘climate change model.’ Nonetheless, the valuation model used to approach the integration of climate issues is the UBS’s proprietary VCAM (Value Creation Analysis Model), which is a useful platform scenario analysis. This uses four variables Return On Invested Capital, Invested Capital, Cost of Capital, and Value Creation Horizon to assess corporate value. This is applied here, identifying five climate change effects—changes in sales growth, changes in market share, changes in profit margins, changes in productivity of invested capital, and government regulation.
The report thoroughly defines the list of stocks that are positively and negatively exposed to climate change-related reactions, detailing the main valuation multiples, target price, and rationale (relevance to the exposure).
Each UBS analyst has contributed a section on a specific sector/country combination. The contributions are:
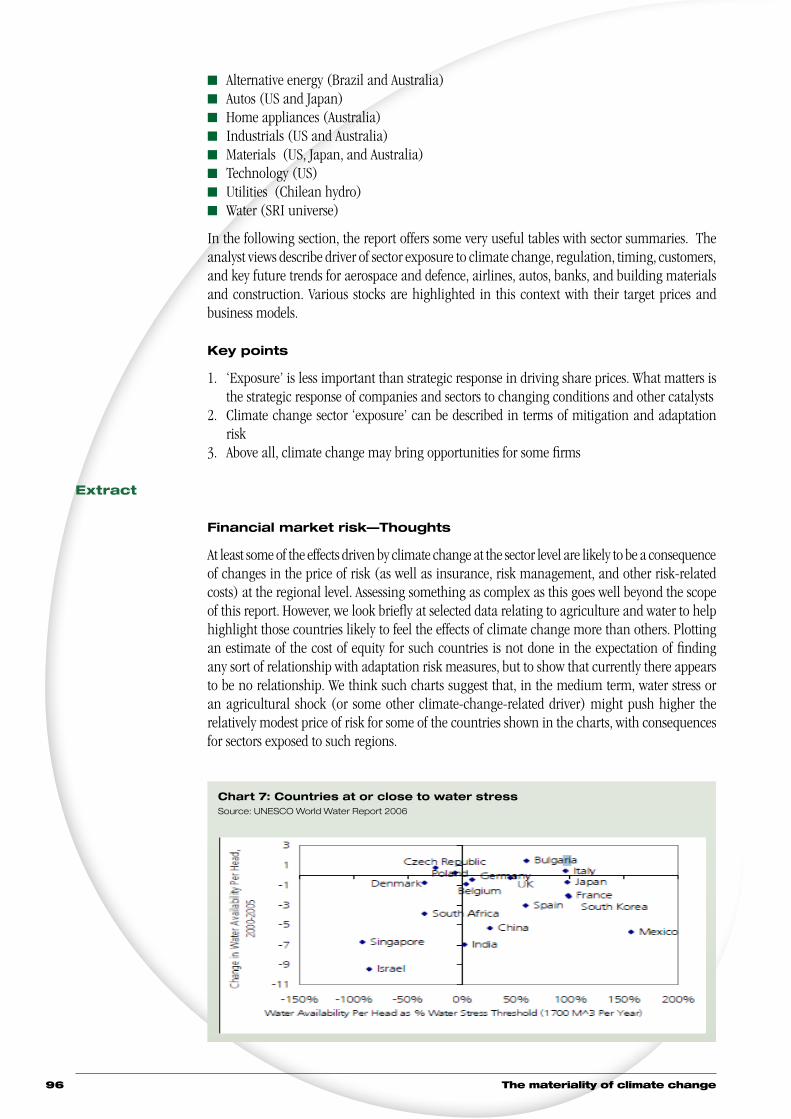
The materiality of climate change96
n Alternative energy (Brazil and Australia)n Autos (US and Japan)n Home appliances (Australia)n Industrials (US and Australia)n Materials (US, Japan, and Australia)n Technology (US)n Utilities (Chilean hydro)n Water (SRI universe)
In the following section, the report offers some very useful tables with sector summaries. The analyst views describe driver of sector exposure to climate change, regulation, timing, customers, and key future trends for aerospace and defence, airlines, autos, banks, and building materials and construction. Various stocks are highlighted in this context with their target prices and business models.
Key points
1. ‘Exposure’ is less important than strategic response in driving share prices. What matters is the strategic response of companies and sectors to changing conditions and other catalysts
2. Climate change sector ‘exposure’ can be described in terms of mitigation and adaptation risk
3. Above all, climate change may bring opportunities for some firms
Extract
Financial market risk—Thoughts
At least some of the effects driven by climate change at the sector level are likely to be a consequence of changes in the price of risk (as well as insurance, risk management, and other risk-related costs) at the regional level. Assessing something as complex as this goes well beyond the scope of this report. However, we look briefly at selected data relating to agriculture and water to help highlight those countries likely to feel the effects of climate change more than others. Plotting an estimate of the cost of equity for such countries is not done in the expectation of finding any sort of relationship with adaptation risk measures, but to show that currently there appears to be no relationship. We think such charts suggest that, in the medium term, water stress or an agricultural shock (or some other climate-change-related driver) might push higher the relatively modest price of risk for some of the countries shown in the charts, with consequences for sectors exposed to such regions.
Chart 7: Countries at or close to water stress Source: UNESCO World Water Report 2006
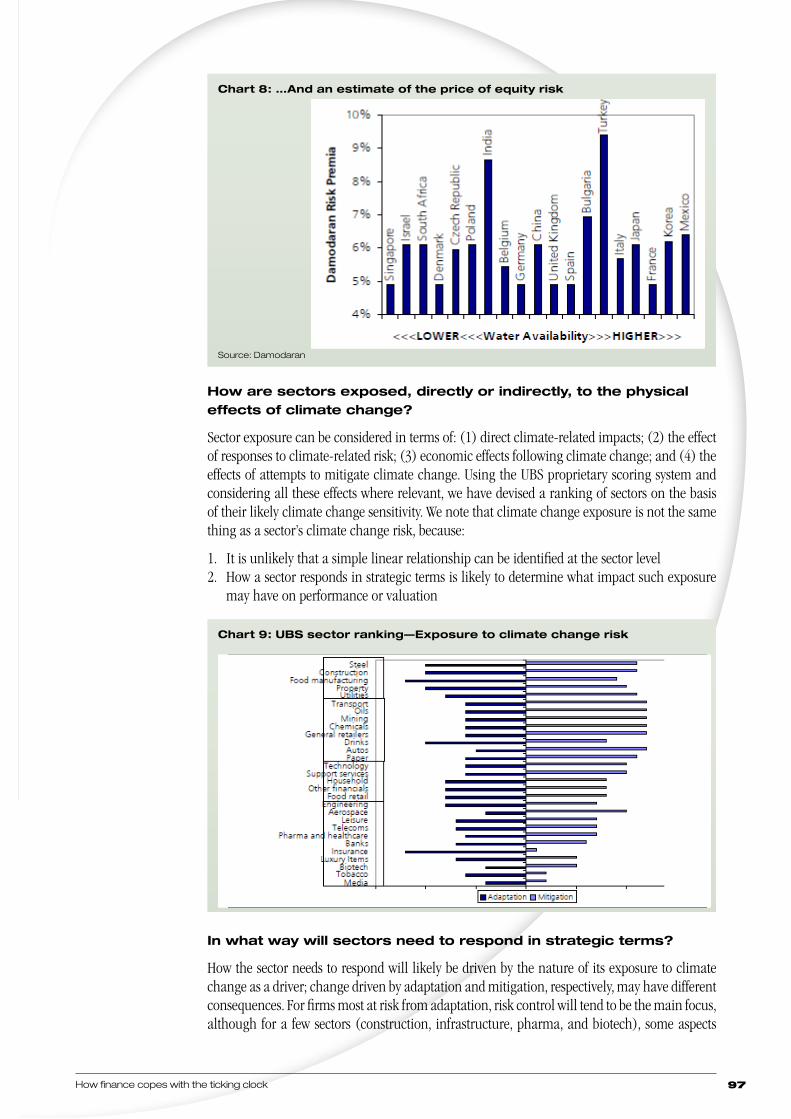
How finance copes with the ticking clock 97
How are sectors exposed, directly or indirectly, to the physical effects of climate change?
Sector exposure can be considered in terms of: (1) direct climate-related impacts; (2) the effect of responses to climate-related risk; (3) economic effects following climate change; and (4) the effects of attempts to mitigate climate change. Using the UBS proprietary scoring system and considering all these effects where relevant, we have devised a ranking of sectors on the basis of their likely climate change sensitivity. We note that climate change exposure is not the same thing as a sector’s climate change risk, because:
1. It is unlikely that a simple linear relationship can be identified at the sector level2. How a sector responds in strategic terms is likely to determine what impact such exposure
may have on performance or valuation
In what way will sectors need to respond in strategic terms?
How the sector needs to respond will likely be driven by the nature of its exposure to climate change as a driver; change driven by adaptation and mitigation, respectively, may have different consequences. For firms most at risk from adaptation, risk control will tend to be the main focus, although for a few sectors (construction, infrastructure, pharma, and biotech), some aspects
Chart 8: ...And an estimate of the price of equity risk
Source: Damodaran
Chart 9: UBS sector ranking—Exposure to climate change risk
Source: UBS
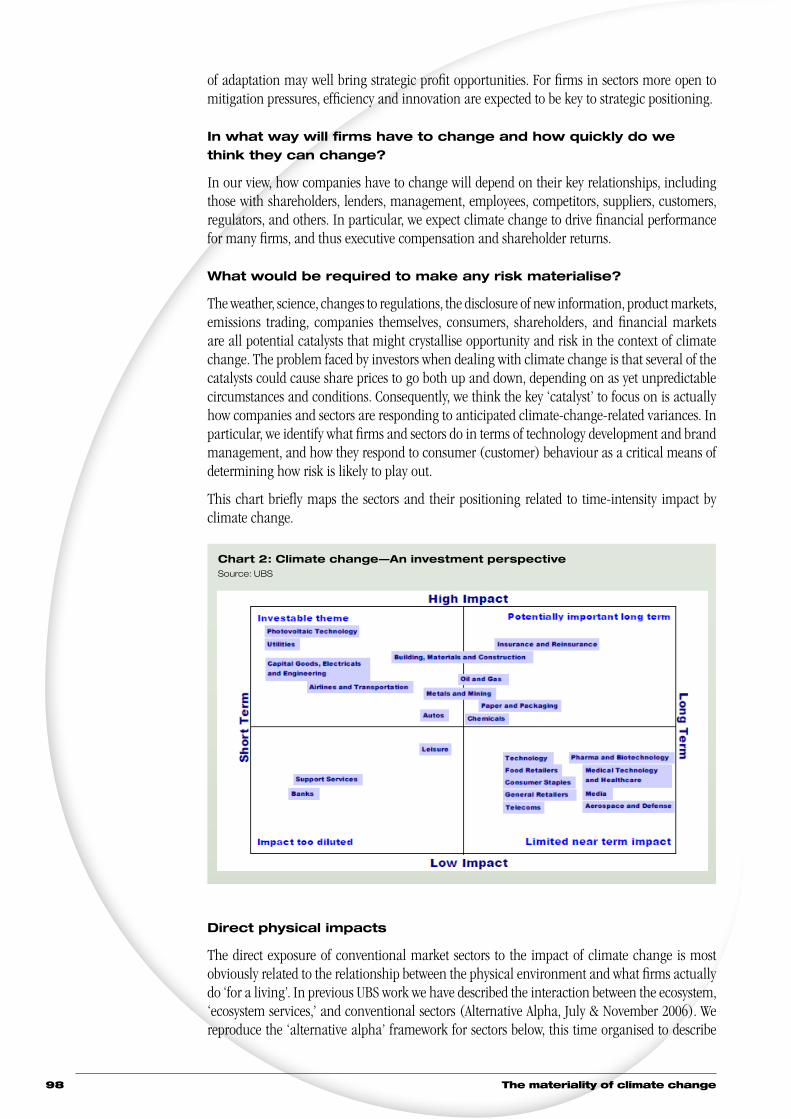
The materiality of climate change98
of adaptation may well bring strategic profit opportunities. For firms in sectors more open to mitigation pressures, efficiency and innovation are expected to be key to strategic positioning.
In what way will firms have to change and how quickly do we think they can change?
In our view, how companies have to change will depend on their key relationships, including those with shareholders, lenders, management, employees, competitors, suppliers, customers, regulators, and others. In particular, we expect climate change to drive financial performance for many firms, and thus executive compensation and shareholder returns.
What would be required to make any risk materialise?
The weather, science, changes to regulations, the disclosure of new information, product markets, emissions trading, companies themselves, consumers, shareholders, and financial markets are all potential catalysts that might crystallise opportunity and risk in the context of climate change. The problem faced by investors when dealing with climate change is that several of the catalysts could cause share prices to go both up and down, depending on as yet unpredictable circumstances and conditions. Consequently, we think the key ‘catalyst’ to focus on is actually how companies and sectors are responding to anticipated climate-change-related variances. In particular, we identify what firms and sectors do in terms of technology development and brand management, and how they respond to consumer (customer) behaviour as a critical means of determining how risk is likely to play out.
This chart briefly maps the sectors and their positioning related to time-intensity impact by climate change.
Direct physical impacts
The direct exposure of conventional market sectors to the impact of climate change is most obviously related to the relationship between the physical environment and what firms actually do ‘for a living’. In previous UBS work we have described the interaction between the ecosystem, ‘ecosystem services,’ and conventional sectors (Alternative Alpha, July & November 2006). We reproduce the ‘alternative alpha’ framework for sectors below, this time organised to describe
Chart 2: Climate change—An investment perspective Source: UBS

How finance copes with the ticking clock 99
potential interaction in the context of climate change. It would affect raw materials directly, for instance, depleting natural resources such as groundwater, rendering some raw materials such as minerals less accessible, and rendering the resources for food unavailable in some locations (but also more readily available in others). It would affect natural infrastructures, preventing or impeding delivery of key resources even where available (for instance, rainfall might be greater, but the natural infrastructure that would normally store and deliver it might no longer be functioning). Conventional industries might be directly affected, in their own right, by the physical effects of climate change, but also by disruptions to ecosystem services and the infrastructure supporting or delivering them. In the absence of extreme events, we can expect to observe the same process, but more slowly.
The sectors and firms most vulnerable to the ‘physical’ (directly weather-related) impacts of climate change will tend to be those relying directly on physical inputs to the business, as well as those relying on human capital, which could be physically affected by climate change. Physical inputs and human capital may not necessarily be affected at the same time or in the same place.
Adaptation to physical change, whether reactive or pre-emptive, is expected to most affect sectors and firms involved in risk management. Action taken in the area of land use planning, infrastructure, natural resource protection, and other risk management such as insurance is, in our view, likely to be most relevant to firms involved in any way in infrastructure or development, but possibly also those dependent upon agriculture or forestry.The sectors most vulnerable to behavioural change arising from mitigation efforts, whether consumer or regulation driven, would tend to be CO2-intensive industries perceived to be responsible for the problem and therefore vulnerable to regulatory or other behavioural change, such as shifts in consumer preferences.
Table 12: Direct and indirect exposure to the physical effects of climate change Source: UBS

The materiality of climate change100
How do we envision climate change driving the sector’s performance?
A VCAM perspective on climate change effects
Climate change impacts. A flexible approach to modeling is required, and this is just what we believe VCAM permits at the stock level. By focusing on key inputs—ROIC32, IC33, the weighted average cost of capital (WACC34), and the value creation horizon (VCH), which drive the EGQ (economic growth quotient)—VCAM permits scenario analysis that incorporates changes to the competitive landscape directly. In the short term, we believe this to be one of the most significant likely effects of mitigation- and adaptation-related change for industries and firms.
Earlier in this report we noted that we see no ‘silver bullet’, or single approach, leading to the best climate change-related ideas. Climate change impacts are numerous and varied. Many of them could go either way. So we think the answer for now is to leverage off generic models that allow the analyst a flexible response to the issue. To recap, sectors and companies may be affected by climate change in many ways, including the following:
n The direct physical impacts of environmental change
n The effects of governments or other organisations’ actions to adapt to physical changes, either pre-emptively, or in reaction to a specific event
n Economic impacts, direct or indirect, following on from (1) and/or (2) above
n Mitigation > Energy demand management > Carbon pricing > Low carbon energy technology policy-induced development and switching > Market reform > Economic impacts, direct or indirect, following mitigation measures > Financial markets
As discussed, the way a sector or firm responds strategically to the climate change-related impacts is likely to significantly affect the outcome for the firm, whether the issue is positive or negative for share prices. Furthermore, we believe ‘there is considerable difficulty in estimating the impact of increased uncertainty from climate change on financial risk. It seems likely that any increase in risk premiums will be unevenly distributed: risk in agriculture may increase, as may risk in tourism or the auto sector. It seems unlikely that any sector will experience a reduction in risk premiums as a result of climate change, however (at least, not to a meaningful degree), and therefore there is likely to be a net increase in risk, with a net deleterious impact on trend growth in the global economy’ (see Paul Donovan, Climate change and economics – a view from the top in this publication).
Value dynamic No 1: ROIC
As a profitability measure that considers a company’s profit per sales dollar and the capital required to generate each sales dollar, ROIC is well designed to capture key impacts of climate change on company profitability. ROIC comprises two components: NOPAT and invested capital.
ROIC = NOPAT35/invested capital
In the presence of climate change effects, we can expect to see:
32 ROIC = Return on invested capital, is a financial measure that quantifies how well a company generates cash flow relative to the capital it has invested in its business
33 IC = Invested capital34 WACC = Weighted average cost of capital, is the rate that a company is expected to pay to finance its assets35 Net operating profit after tax

How finance copes with the ticking clock 101
n Changes in sales growthn Changes in market sharen Changes in profit margins, driven by changes in pricing power or changes in input costsn Changes in the productivity of invested capitaln Government regulation designed to support new technology would, other things being
equal, be expected to be positive for NOPAT (and therefore ROIC). However, this assumes that government regulation would affect all firms in the industry equally. In a global industry, this would not necessarily be the case
Value dynamic No 2: Invested capital
‘Changes in invested capital are just as important as changes in ROIC’, comments David Bianco in his VCAM guide. In our view, the value (or otherwise) generated by size may change as conditions change. The optimum size for companies in a given industry may also change, as climate change affects competitive conditions. Step changes in regulation or climate might lead to ‘stranded assets,’ reducing the value of IC. In addition, the impacts of climate change-related mitigation and adaptation may reduce or increase reinvestment rates, affecting IC over the mid-term.
Value dynamic No 3: WACC
Estimation of the WACC can be subjective. Therefore, commenting that climate-change effects may be observable through changes in WACC is just as subjective. However, scenario analysis around a range of WACCs might at least be informative with respect to sector sensitivity to changes in sentiment.
In our view, a significant probable change in the cost of funds is likely to be at the regional or country level, relating to the potential vulnerability of the region to the direct impacts of climate change as well as its ability to adapt, whether pre-emptively or in reaction to climate-induced changes.
Value dynamic No 4: Value creation horizon
In the context of climate change, we consider the following to be a critical paragraph in the VCAM user guide: ‘In theory, the competitive advantage period, or what we usually refer to in the VCAM as the value creation horizon (VCH), is the number of future years economic profits are expected to increase from changes in the first three dynamics. [Any circumstance where EGQ would rise or fall would represent a change in those expectations]. The VCH is thus also an estimate of the market’s willingness to be farsighted and consider such continued economic profit growth as being visible. This practical from theoretical distinction means that the VCH does not decay merely from the passing of years. Rather, changes in the VCH only occur from shifts in a company’s competitive positioning and long-term growth prospects, as assessed from the current moment in time.’
In our view, one of the most important climate change effects companies are likely to experience is a change in the competitive landscape, and for CO2-intensive Industries this is likely to happen in the near term. Firms that manage to establish a lead in new energy technologies or efficiency (however defined) should increase their value creation horizon. Those that do not could experience the reverse.
In the context of climate change-related mitigation, we would expect the VCH to change, in particular, for energy, and some technology, industrials, materials and IT sectors, potentially bringing about changes in the above charts. For those CO2-intensive technologies that markets are likely to move away from, we would expect the VCH to shorten.
n For low-carbon technologies with higher barriers to entry after a change in the industry, the VCH should theoretically extend. For low-carbon technologies without barriers to entry,

The materiality of climate change102
increased competition might even reduce the VCH
n Where a government is likely to support innovation, we might expect it to take action that would extend the VCH, but only if this happened to seal in an advantage for companies in a given (global) industry in one jurisdiction.
n We would also, perhaps more importantly, expect VCH positioning to change for firms relative to each other within the sector.
At the stock level, VCAM can be used to calculate the impact of a change in a firm’s share price on the basis of a change in a given VCH. For instance, for Honda Motor, we calculate a five-year change in the VCH would change the estimated fair value of the share price by about 8%.
VCAM examples
Paper sector
In the Paper and Forestry section below, Myles Allsop writes ‘Stora Enso … has recently established joint ventures with energy companies to explore the possibility of biofuel generation on a commercial scale’.
Hypothetically speaking, what happens if Stora’s energy company JV turns out to establish a competitive advantage for the firm—p erhaps by being in some way exclusive to the firm, within the sector? Were this to be the case, then the hypothesis might be an extension of the value creation horizon (VCH) for Stora.
In the following simulation, we plot EV36/NOPAT against the economic growth quotient (EGQ) for a small number of firms. Stora is shown twice: the EGQ calculated with the sector assumed VCH, and with an extended VCH. The scenario analysis based on the relationship between EV/NOPAT and EGQ for these stocks suggests that if this should indeed play out in such a way as to establish a lead for Stora then, other things being equal, this could be positive for Stora’s valuation relative to the sector. In reality, we know from the same comment below that Weyerhaeuser also has such a joint venture, and UPM is investing heavily in biomass boilers, indicating that further analysis would be required, to understand whether Stora’s JV could in fact shift the competitive playing field as described in the analysis. If, instead, it was assumed that the entire sector stood to gain from developments in bioenergy, then this might be more likely to show up for the sector, and stocks in the sector, through sales growth or the EBIT margin, in which case VCAM could be used to run sensitivities as appropriate.
36 Enterprise Value (EV) is an economic measure reflecting the market value of the whole business
Chart 41: Simulation – extended VCH
Source: UBS – VCAM

How finance copes with the ticking clock 103
11.2 Sector analysis
Type Financial report
Region Europe
Research firm CA Cheuvreux
Analysts Erwan Créhalet, Stephane Voisin
Title Carbon impact
Date March 2009
AMWG commentary
CA Cheuvreux carbon research aims to make investors aware of the risks and opportunities presented by climate change and measuring the impact of that research on European sectors and companies. The objective is to better understand the impact of carbon constraints and to get a clear picture of companies’ climate change strategies.
This highly relevant report calls for better corporate disclosure on climate change issues and research. The challenge the authors face is identifying and interpreting information that is neither readily available nor commonly used by mainstream analysts, while aiming at the integration of such information into mainstream financial models. In this context, it is necessary to start the analysis by examining how each government is exposed to climate issues, and studying the legislative will to act.
The current crisis has produced sharp production cuts in the steel, cement, and pulp & paper sectors, significantly exacerbating the surpluses of CO2 rights that they can now sell for cash on the spot carbon market. The report analyses these sectors, presenting in tables the cash impact of CO2 exposure in terms of emissions, costs, and carbon rights sales.
Extract
Evaluating carbon impact on sectors
The table below outlines our effort to anticipate how the carbon burden is allocated to various industries. It analyses how governments hope to speed up the process of deciding which industries could be spared in order to avoid the regulatory uncertainty that freezes investment decisions. The outcome of such analyses is based on this data:
The winners sectors: Heavy industries
It pays to be depressed: Industrial sectors overall have been over-allocated with CO2 emission rights again in Phase II, in order to avoid competitive distortion. The sharp production cuts in the steel, cement, and pulp and paper sectors thus significantly exacerbate the surpluses of CO2 rights that they can now selling for cash on the spot carbon market.
Based on allocations of CO2 allowances for 2008 and our forecasts for production and emissions trends in each sector for 2008, 2009, and 2010, we estimate that:
n The power sector (electricity utilities) will be short of ~257m tonnes of CO2 rights in 2009E, and will consequently have to buy an equivalent amount of carbon credits on the market for its compliance
n Refiners are expected to receive just enough CO2 rights to cover their emissions
n Iron and steel, cement and other building materials, and pulp and paper producers are, in our view, likely to receive, respectively, 52m (28%), 38m (20%), and 16m (64%) more CO2 rights than needed

The materiality of climate change104
Summary table: Direct CO2 emissions and compliance costs at stake for 2013-2020
Emissions 2006 (mt)
Emissions 2007 (mt)
Trend 07/06, %
Phase III – estimated CO2 cost (EUR bn)
Exposure to non-EU trade / Comment
Power & Heat sector
1 470 1 526 4% 375 Very low
Large power plants (667 installations)
1 275 1 338 5% 375 Very low, CO2 price signal is already integrated in free electricity markets
Small plants (6,915 inst.)
195 189 -3% 0 Cogeneration and waste to energy efficient plants likely to be exempted from auctioning
o/w 11 east. European countries
311.8 361 58 An exemption for Eastern Europe would avoid a ~EUR43bn cost for the sector
Oil refineries 149 153 3% 25 Structural imports of diesel cover the shortage of EU capacities on these product grades.
Steel 168 171 1% 0 High exposure, powerful unions, and high job loss concerns.
Cement 182 192 6% 31 Low exposure. Spain is the most open market. Local markets due to high transportation costs.
Other building materials (e.g. clay, glass.)
35 35 0% 6
Pulp & paper 30 29 -3% 0 High exposure. Auctioning unlikely. No direct CO2 costs expected.
Aluminium and chemicals
180 (estimate)
0 Inclusion planned in 2013, highest exposure due to a combination of high value at stake and openness to non-EU trade
Total 2 468 436
Source: Cheuvreux
CO2 surpluses give a helping hand to groups striving to de-leverage
Refinancing needs and lack of easy access to the credit market have increased the cash needs of some companies in the heavy industries segments. Surpluses of CO2 rights are a good way to raise cash rapidly, and the allocation of CO2 rights is carried out so that companies always have a year of allocation ahead of them (CO2 rights for Y are handed out to installations two months before they have to surrender CO2 rights consumed for Y-1). Companies facing particularly tough balance sheet positions, such as cement producer Cemex, have clearly decided to sell the forecast surpluses of CO2 rights over the entire 2008-2012 period.
Cement: Potential to cash in ~EUR1.7bn from CO2 sales
The EU cement industry was expected to receive CO2 rights almost in par with the level of emissions in 2007, leaving cement players with a fairly neutral position on the CO2 market.

How finance copes with the ticking clock 105
However, with at least two consecutive years of tough cuts in production volumes (by 8% in 2008E, by 10% in 2009E) due to depressed construction markets, cement producers will also benefit from significant surpluses of CO2 rights.
We estimate that surpluses corresponding to 2009 will allow cement makers to sell at least ~30m in emission rights in 2009, and generate ~EUR360m from of these CO2 sales. This is more than the 2008E surplus of 12mt CO2, valued at EUR22/t (average price in 2008).
CO2 sales: Improving cash positions?
Emissions 2009E
CO2 surpluses 2009E
4-yrs sold at EUR12/tCO2
4-yrs sold at EUR18/tCO2
Net debt at end 08 (EUR m)
Gearing (%), at end 2008
Potential impact of CO2 sales on net debt
Buzzi Unicem
8.9 1.3 64 97 925 32% -10%
Cementir 3.7 0.6 27 40 465 39% -9%
Italcementi 13.0 1.9 94 140 2 690 53% -5%
Titan 5.1 0.8 37 55 1 119 78% -5%
Vicat 2.2 0.3 16 23 592 31% -4%
CPV 6.4 1.0 46 69 1 946 142% -4%
CRH 7.8 1.2 56 84 6 254 73% -1%
Lafarge 20.6 3.1 148 223 17 030 116% -1%
Holcim 11.0 1.7 79 119 9 244 68% -1%
Cemex 217 12 604 109% -2%
Source: CA Cheuvreux
Pulp and Paper: CO2 sales barely rescuing depressed EBIT
n Pulp and Paper: CO2 sales barely rescuing depressed EBIT
n The pulp and paper industry is responsible only for a tiny proportion of CO2 emissions regulated under the EU ETS (1.4% in 2007) and the direct CO2-intensity of the production process is relatively limited compared to other sectors (~0.34t CO2/tonne of paper)
n However, the impact of the EU carbon market is likely to be significant and visible in some companies in this sector, as we estimate that the sector is massively over-allocated in relative terms. CO2 sales will add to EBIT forecasts based on depressed (or even negative) operating margins
Estimated CO2 rights surpluses in 2009E and potential impact on 2009E EBIT
Emissions 2007 (mt)
Emissions 2009E
Allowances 2009E
Surplus of CO2 rights (mt, 2009E)
Cash raised from CO2 sales (at EUR12/tCO2)
EBIT 2009E (EUR m)
As % of EBIT
M-REAL 2.0 1.7 2.4 0.7 8.2 (93.4) N/A
Stora Enso 3.2 2.7 3.8 1.1 13.1 (826.9) N/A
UPM Kymmene
2.1 1.8 2.3 0.7 8.6 (694.5) N/A
Norske Skog
0.5 0.4 0.6 0.2 2.0 25.0 8.2%
Ence 0.5 0.4 0.6 0.2 2.0 39.4 5.0%
Ahlstrom 0.5 0.4 0.6 0.2 2.0 48.6 4.1%
SCA 1.4 1.2 1.7 0.5 5.7 588.6 1.0%

The materiality of climate change106
Emissions 2007 (mt)
Emissions 2009E
Allowances 2009E
Surplus of CO2 rights (mt, 2009E)
Cash raised from CO2 sales (at EUR12/tCO2)
EBIT 2009E (EUR m)
As % of EBIT
Holmen 0.4 0.3 0.5 0.1 1.6 168.6 1.0%
Source: CA Cheuvreux
Impact on electricity utilities
The lower CO2 price is clearly set to reduce expectations of CO2 compliance costs for most CO2-intensive electricity utilities such as PPC, RWE, and Edison. However, it also drives a deflationary effect on electricity prices that often outweighs the impact on the bottom line. We estimate that electricity utilities selling their production at electricity prices on free markets with a high share of CO2-free (hydro and nuclear) capacities (such as Fortum and GDF-Suez), or with CO2-cost-free thermal capacities (CEZ has no CO2 rights deficit by 2013) are the most negatively exposed to an environment with lower CO2 prices. This means that, in our view, they are the best positioned to recover their operating margins along with a recovery of CO2 prices. We have a 1/Selected List rating on Fortum, 3/Underperform on GDF-Suez, and 2/Outperform on CEZ.
Our research analyses the 2008 cost structure of electricity utilities due to the scissor effect of: 1) more stringent emission caps for the Phase II of the EU ETS (cut by roughly 20% in average compared to 2007); 2) a stronger CO2 price (EUR22.4/t for 2008). It requires a country approach, as shown in the following table:
CO2 costs of the main EU electricity utilities
(EUR m) Emissions 2007 (mt)
Emissions 2008 (mt)
CO2 cost 2007E
CO2 cost 2008E
As % of EBITDA07
Underlying deficit (mt)
Deficit (%)
RWE 187 172 -85 -1 400 -18% -67.5 -39%
E.ON
EDF 90 84 -397 -3% -18 -21%
Iberdrola – Scott.Power
ND 26.5 -12 -170 -3% -8 -30%
Union Fenosa 18.5 13.2 -8.1 -60.8 -3% -2.7 -20%
Fortum 9.8 7.2 < - 30 -2% -1.3 -18%
Source: Companies, CA Cheuvreux
RWE faces the greatest shortage (due to lignite-fired power plants relatively penalised by the allocation methodology in Germany) with a deficit of 39%, despite the decreases in its CO2
emissions in 2008. Conversely, other groups such as Fortum have managed to mitigate their deficit thanks to a cleaner energy mix.
In the short-term, lower CO2 prices will reduce these CO2 costs even if this effect is likely to lag due to hedging strategies. RWE, for instance, has already fully hedged 2009 and 70% of 2010. The new environment is thus unlikely to have a significant impact before 2011.
Evaluating long-term carbon impact for utilities
The EU Climate & Energy package provides long-term visibility, with phased-in full auctioning of CO2 rights for the power sector as early as 2013 (no more free CO2 rights). The exceptions are some Eastern European countries, which were offered a transitional regime (gradual phase-in of auctioning from 30% in 2013 up to 100% by 2020) after meeting certain conditions (GDP/capita that is 50% below the EU average, a coal-dependent energy mix, low interconnections) established in order to leave give them more time to adapt to the CO2 constraint. We estimate that 10 Eastern European countries will be eligible for this transitional regime.

How finance copes with the ticking clock 107
We believe the end of free CO2 rights as early as 2013 remains most likely, and we consequently expect no CO2 relief for most CO2-intensive players, as public subsidies to new coal-fired power plants remained infrequent according to the terms of the deal.
Projected CO2 costs of EU electricity utilities in Phase III
(EUR m) CO2 intensity, 2007 (kgCO2/MWh)
Absolute emissions, mtCO2 2007
EBITDA 2007
CO2 exposure (CO2 cost at EUR30/t full-auctioning, as % of EBITDA 07)
CO2 cost / MWh (EUR)
Fortum 64 3.3 1 774 6% 2
EDF 145 84 (2008) 15 210 17% 4
Iberdrola-Scott. Power
303 (2008) 26.5 (2008) 5 538 14% 9
(GDF-Suez) Electrabel
300 42.3 12 517 10% 9
E.ON 403 87.5 12 450 21% 12
EDP 495 23.4 2 628 27% 15
Enel 496 46.7 10 023 14% 15
Endesa 530 64 7 485 26% 16
Union Fenosa 535 18.2 2 062 26% 16
CEZ(full costs not before 2020 - transitional regime)
635 46.9 5407 26% 19
RWE 848 187.1 7 915 71% 25
PPC 984 53 819 194% 30
Source: Company data, PwC, CA Cheuvreux
Carbon intensity materialising in companies’ valuation?
Our research has tracked the relationship between carbon intensity and market valuation over recent years. Introducing exposure to free electricity markets is key to assessing how the carbon footprint in the power sector can potentially affect market performance.
.
.
Edison Dra
x
PPC
RWE
CEZ
E.ON
Enel
GD FSue z
EDP
Iberdr ola
EDFFor tu
m
y = -0.002x +7 R2 =
0.7
4.0
4.5
5.0
5.5
6.0
6.5
7.0
0 200
400
600
800
1000C
O2-intens ity 2007(kgC O
2/MWh)
EV/EB ITDA2010E
Slope, as bef orecrashof ener gy com modities(07/2008)

The materiality of climate change108
11.3 Valuation methods (automotive sector)
Type Financial report
Research firm Société Générale
Region Global
Analysts Valéry Lucas-Leclin, Sarj Nahal
Title 1 Back to basics
Date April 2008
Region Europe
Analysts Eric Michelis, Valéry Lucas-Leclin
Title 2 Auto & pollution—Size does matter
Date April 2007
Region Europe
Analysts Eric Michelis, Valéry Lucas-Leclin
Title 3 Auto & pollution—Not that bad after all
Date February 2008
Region Global
Analysts Valéry Lucas-Leclin, Sarj Nahal
Title 4 CREAM-ing carbon risk
Date June 2007 (revised December 2008)
AMWG commentary
This excerpt reflects ideas and concepts from four different publications. The first part describes the SocGen approach to valuation methods that incorporate ESG factors using the β (beta37) as a decisive factor.
The core section, related to sector valuations, is a comprehensive report on the European automobile industry that examines the impact of various scenarios for the regulation of CO2 emissions. Road transport accounts for nearly one-quarter of carbon dioxide emissions in Europe, and passenger cars account for almost half of that share.
The report briefly discusses the regulatory proposals that were presented, the consequences of non-compliance, and the context in which CO2 emission regulation was set. To estimate the costs of reducing emissions, the authors use a defined set of technological and behavioural alternatives, which are ranked by cost effectiveness for CO2 abatement. The authors conclude that reductions are best addressed through an integrated approach employing both new vehicle technology and behavioural, infrastructure, and technical adjustments such as ecologically-oriented driving, proper tire pressure, improved road systems, and alternative fuels. Cost breakdowns are provided for each solution.
The authors then apply an average cost calculation to each of four scenarios involving different targets for fleet and segment emissions, and examine how each scenario affects luxury and mass market automakers, as well as individual companies.
This report provides an excellent background for readers not familiar with the issue of GHG emissions and their regulation, as well as considerable detail for those interested in effects on the value of both sub-sectors of the automobile industry and specific companies.
37 A measure of the volatility, or systematic risk, of a security or a portfolio in comparison to the market as a whole.

How finance copes with the ticking clock 109
Extract
SRI in financial perspective
Since 2005, SG has proposed integrating an SRI effect into risk assessment. We have based our model on correlations drawn between historic or implicit beta (the market risk factor, or the sensitivity to market reactions) and SRI ratings as we can infer them from various external, recognized sources (SRI rating agencies), so as to find some meaningful deviations of up to +/-8% of beta. More recently, an examination of auto and CO2 emissions constraints, as well as the analysis of interferences between ESG/SRI performance and profitability—e.g. analysis of Danone, Porsche, luxury goods, and utilities—seemed to indicate that SRI eventually matters for financially needy companies. The link between SRI ratings and the level of risk, as measured by our implicit beta indicator, becomes important when we consider sectors with “low” profitability as measured by EBIT margins (<15%). The link is much less meaningful and even sometimes reversed when we consider sectors with profitability above 15%. In other words, SRI/ESG is no longer a luxury when profitability is low and constrained. Strategic decisions and behavioural patterns towards stakeholders are important for staying in the market.
Following are two examples, one regarding the SRI risk adjustment of financial valuation, the second about what carbon emissions could cost in terms of profitability.
Stakeholder pressure—Ignore it at your peril
Our findings were derived using the SG SRI Ratings, which helps understand which part of CSR management might be explained by stakeholder pressure (industrial sector, size of the company, country of origin, percentage of free-floated market capitalisation, etc.).
We believe that companies face ever-growing stakeholder pressure. Increasingly, this pressure is manifested in the form of different sets of formal and informal rules and standards put forward by a wide range of stakeholders. Each company, depending on its level of exposure, is under different pressure to abide by them:
n Legal pressure > National, regional, and international laws and regulations and related jurisprudence (i.e. EU, OECD, UN, Kyoto, FCPA, etc.)
n Professional pressure > Professional and sector guidelines and rules, ISO certifications, widely accepted business practices;
n Best practice pressure > Non-binding national, regional, and international standards and guidelines (i.e. Global Compact, GRI, Carbon Disclosure Project, Extractive Industries Transparency Initiative, Equator Principles, Responsible Care, etc.);
n Ethical pressure > Campaigns and pressure applied by stakeholders such as NGOs, local associations, and communities and individuals, as well as the growing force of public opinion and its long-term influence on legal standards; and
n Investor pressure > SRI and mainstream investors’ growing interest and activity in long-term extra-financial issues from a risk reduction perspective (i.e. EAI, IIGCC, Marathon Club, etc.)
Materiality of extra-financial factors
From an investor’s viewpoint (SRI or mainstream) the key question is whether extra-financial factors are material—in other words, whether they impact financial valuation. There are a number of possible ways to try to make this link:
n A cost-benefit approach works in cases such as asbestos-related provisions, CO2 emission quotas, and outsourcing to lower cost countries

The materiality of climate change110
n A long-term growth approach works in cases such as growing demand for hydrogen or changing demographics and retirement-related services
Cost-benefit and long-term growth cannot explain everything. The ability of either method to capture financial impact is extremely limited when it comes to such issues as human resources and human capital, corporate governance practices, environmental management systems, community involvement, and dialogue with stakeholders.
We believe that the materiality and financial impact of extra-financials can best be made by a complementary approach with the focus on risk and risk management and ultimately via potential deviations in fair value assessment.
A cost of capital and beta approach makes it possible to evaluate the financial impact of extra-financials on the basis of an evaluation of risk reduction efforts based on SRI ratings (all else being equal). Materiality can be indirectly calculated as the potential deviation in fair value. For the time being, our preference is for this beta-based method. This method is both systematic and systemic and, therefore, should more accurately reflect the routine risks associated with corporate behaviour over the long term.
Our proposal—Mixing up risk management, level of profitability, and beta approach
Different ways of addressing financial materiality of extra-financial issues
Cost-benefit analysis Long-term growth analysis Risk mitigation approach
Environmental provisions Sustainability themes (water scarcity, food scarcity, waste management, energy needs, etc.)
Internal policies and processes (quality, productivity, adaptability)
Cost of litigation and fines Demographics (i.e. aging population)
Human resources and human capital practices (staff motivation, retention, recruitment, training)
Cost of product withdrawals Eating patterns (i.e. obesity) Environmental management system
Internalised externalities (CO2) Renewables (i.e. hydrogen demand) Corporate governance practices
Layoffs and staff reductions Developing world market growth Stakeholder dialogue
Costs associated with complying with new regulations
New services designed for new emerging needs (niche markets at the beginning)
R&D and product and service design
Legal costs Customer orientation
Taxes
Source: SG Equity Research
How to calculate an SRI β?
If we accept the principle that it is appropriate to marginally adjust β, the level and extent of the modulation still has to be determined. In this respect, scoring techniques would appear relevant. If all the good practice data can be put on a one-way scale from the worst performer to the best, it must surely be possible to attribute scores to each and then, by samples, logically deduce the averages and standard deviations from which to center and standardise the variables obtained. This would gives us the percentage variation from the average for the practices observed (framework of best-in-class approach), which could then serves as an inverse governance β(1 for the sample average, > 1 for those bottom of the class, < 1 those at the top). What will be the scope and extent of the governance β? It is still too early to say.
Yet our first sets of tests at SG showed that our best rated stocks (A+) compare very favourably with our worst rated stocks (D-) based on beta levels and their fluctuation over a four year period (2002-2006). Over the long term, we believe that the beta variation gap between best and worst

How finance copes with the ticking clock 111
rated stocks could widen as stakeholder expectations increase and more pressure is placed on companies regarding SRI issues.
CO2 and profitability: When the going gets tough…
In our Auto and Pollution reports (April 2007 and Feb 2008), we have analysed for all the European OEMs the potential impact of the draft EU legislation on cars’ CO2 emissions. We noted with interest that after taking in account the cost of CO2 fines, or more accurately the cost of technologies to abate CO2 emissions, but also current level of profitability (measured by EBIT margin) and pricing power, it becomes very clear that the best-in-class companies (the mass makers, the closer to their biding CO2 target) might very well face the highest cost in proportion of their level of profitability. On environmental issues, despite having one of the worst CO2 profiles in terms of g CO2/km for its fleet, Porsche was very likely to be the OEM least impacted by the draft European CO2 regulations, which discussed the financial impacts of Porsche’s impending 49% cut in emissions.
SG scenario: Potential impact on 2012e PBT of additional costs + possible penalty Source: SG Equity Research Feb 2008
As % of PBT 2012e Additional costs not passed on
Possible penalty Total potential impact
BMW 3% 3% 6%
Daimler 2% 2% 4%
Porsche 1% 1% 2%
Fiat 5% 2% 7%
Peugeot SA 5% 5% 10%
Renault 4% 2% 6%
Volkswagen 8% 3% 11%
Moving forward, our analysis of carbon intensity (carbon per unit of sales) and carbon costs also reveals that current level of profitability can greatly soften the financial impacts. Utilities, the most important source of emissions, came in well below transportation, auto, and food and staples retailing when it comes to profitability exposure, due to the capacity to pay or transfer costs associated with supply chain, production, or use of the products/services.
Sector carbon intensity
Source: SG Equity Research (2008), Datastream and IBES consensus for EBIT, centre Info (envimpact).
0
500
1000
1500
2000
2500
3000
3500
UTIL
ITIE
SE
NE
RG
YR
EA
L E
STA
TE
CA
PIT
AL G
OO
DS
BA
NK
S
DIV
ER
SIF
IED
FIN
AN
CIA
LS
AU
TO
MO
BIL
ES
& C
OM
P.
MA
TE
RIA
LS
TR
AN
SP
OR
TA
TIO
N
FO
OD
& S
TA
PLE
S R
ETA
ILIN
GIN
SU
RA
NC
E
SE
MIC
ON
DU
CTO
RS
& E
QU
IP.
CO
NS
UM
ER
DU
RA
BLE
S &
AP
P.
RE
TA
ILIN
G
CO
MM
ER
CIA
L S
ER
V. &
SU
PP
LIE
S
FO
OD
BE
VE
RA
GE
& T
OB
AC
CO
TE
CH
NO
LO
GY
HO
US
EH
OLD
& P
ER
S. P
RO
DU
CTS
CO
NS
UM
ER
SE
RV
ICE
S
HE
ALTH
CA
RE
EQ
UIP
& S
ER
V
PH
AR
MA
CE
UTIC
ALS
ME
DIA
TE
LE
CO
M S
ER
VIC
ES
SO
FTW
AR
E &
SE
RV
ICE
S
Supply chain Prod use
0%
10%
20%
30%
40%
50%
60%
70%
80%
90%
100%
AU
TO
MO
BIL
ES
& C
OM
P.
EN
ER
GY
CA
PIT
AL G
OO
DS
UTIL
ITIE
S
FO
OD
& S
TA
PLE
S R
ETA
ILIN
G
TR
AN
SP
OR
TA
TIO
NM
ATE
RIA
LS
RE
TA
ILIN
G
DIV
ER
SIF
IED
FIN
AN
CIA
LS
RE
AL E
STA
TE
INS
UR
AN
CE
TE
CH
NO
LO
GY
CO
MM
ER
CIA
L S
ER
V. &
SU
PP
LIE
S
FO
OD
BE
VE
RA
GE
& T
OB
AC
CO
BA
NK
S
TE
LE
CO
M S
ER
VIC
ES
SE
MIC
ON
DU
CTO
RS
& E
QU
IP.
HE
ALTH
CA
RE
EQ
UIP
& S
ER
V
HO
US
EH
OLD
& P
ER
S. P
RO
DU
CTS
CO
NS
UM
ER
SE
RV
ICE
S
ME
DIA
CO
NS
UM
ER
DU
RA
BLE
S &
AP
P.
PH
AR
MA
CE
UTIC
ALS
SO
FTW
AR
E &
SE
RV
ICE
S
EB
IT
Supply chain Prod Use

The materiality of climate change112
Porsche: EBIT margins not ESG matter to investors
Going further and analysing the risk premium attached to Porsche, we found out that historically the market has so far attached a low level of risk to Porsche despite what we see as its very poor record on ESG issues.
Our SRI ratings show that Porsche consistently ranks at the bottom of its class regarding management of SRI issues. There is a clear relation between high levels of EBIT margins and low levels of risk as measured by our risk assessment using implicit beta or cost of equity (based on PER evolution).
SRI is a luxury for some, a necessity for others. At the end of the day, in the auto sector at least, managing SRI issues is only an absolute necessity for the most financially needy companies; for companies with sky-rocketing profitability such as Porsche, SRI is a luxury.
Carbon potential impact on EBIT
Source: SG Equity Research (2008), Datastream and IBES consensus for EBIT, centre Info (envimpact)
Porsche—Beta higher than the sector but risk premium lower!Source: SG Equity Research, Datastream and IBES consensus for (COE-g) over 2003-2008
0
500
1000
1500
2000
2500
3000
3500
UTIL
ITIE
SE
NE
RG
YR
EA
L E
STA
TE
CA
PIT
AL G
OO
DS
BA
NK
S
DIV
ER
SIF
IED
FIN
AN
CIA
LS
AU
TO
MO
BIL
ES
& C
OM
P.
MA
TE
RIA
LS
TR
AN
SP
OR
TA
TIO
N
FO
OD
& S
TA
PLE
S R
ETA
ILIN
GIN
SU
RA
NC
E
SE
MIC
ON
DU
CTO
RS
& E
QU
IP.
CO
NS
UM
ER
DU
RA
BLE
S &
AP
P.
RE
TA
ILIN
G
CO
MM
ER
CIA
L S
ER
V. &
SU
PP
LIE
S
FO
OD
BE
VE
RA
GE
& T
OB
AC
CO
TE
CH
NO
LO
GY
HO
US
EH
OLD
& P
ER
S. P
RO
DU
CTS
CO
NS
UM
ER
SE
RV
ICE
S
HE
ALTH
CA
RE
EQ
UIP
& S
ER
V
PH
AR
MA
CE
UTIC
ALS
ME
DIA
TE
LE
CO
M S
ER
VIC
ES
SO
FTW
AR
E &
SE
RV
ICE
S
Supply chain Prod use
0%
10%
20%
30%
40%
50%
60%
70%
80%
90%
100%A
UTO
MO
BIL
ES
& C
OM
P.
EN
ER
GY
CA
PIT
AL G
OO
DS
UTIL
ITIE
S
FO
OD
& S
TA
PLE
S R
ETA
ILIN
G
TR
AN
SP
OR
TA
TIO
NM
ATE
RIA
LS
RE
TA
ILIN
G
DIV
ER
SIF
IED
FIN
AN
CIA
LS
RE
AL E
STA
TE
INS
UR
AN
CE
TE
CH
NO
LO
GY
CO
MM
ER
CIA
L S
ER
V. &
SU
PP
LIE
S
FO
OD
BE
VE
RA
GE
& T
OB
AC
CO
BA
NK
S
TE
LE
CO
M S
ER
VIC
ES
SE
MIC
ON
DU
CTO
RS
& E
QU
IP.
HE
ALTH
CA
RE
EQ
UIP
& S
ER
V
HO
US
EH
OLD
& P
ER
S. P
RO
DU
CTS
CO
NS
UM
ER
SE
RV
ICE
S
ME
DIA
CO
NS
UM
ER
DU
RA
BLE
S &
AP
P.
PH
AR
MA
CE
UTIC
ALS
SO
FTW
AR
E &
SE
RV
ICE
S
EB
IT
Supply chain Prod Use
Porsche – beta higher than the sector but risk premium lower!
6%
8%
10%
12%
14%
16%
18%
Apr-03 Oct-03 Apr-04 Oct-04 Apr-05 Oct-05 Apr-06 Oct-06 Apr-07 Oct-07 Apr-08
0.5
0.6
0.7
0.8
0.9
1
1.1
1.2
1.3
1.4
1.5
(Cost Eqy - g) Porsche (Cost Eqy - g) Auto average
(Cost Eqy - g) DJ Stoxx 600 Beta Porsche / DJ Auto
Source: SG Equity Research, Datastream and IBES consensus for (COE-g) over 2003-2008

How finance copes with the ticking clock 113
Financial indicators SG SRI ratings*
Average EBIT margin
Sector average EBIT margin
Distance to sector EBIT margin average
Cost of equity average
Cost of equity average
Distance to sector average
Rating Ratings n-1
Ratings n-2
BMW (XET) 7.5% 9.1% -1.6% 10.3% 11.8% -1.5% B B B
DAIMLER (XET) 8.6% 9.1% -0.5% 9.8% 11.8% -2.0% C C C
FIAT 6.4% 9.1% -2.7% ns ns ns B C B
PEUGEOT 3.9% 9.1% -5.2% 14.7% 11.8% 2.9% B C C
PORSCHE HLD (XET) PREF
23.0% 9.1% 13.8% 8.7% 11.8% -3.2% D D D
RENAULT 5.5% 9.1% -3.7% 16.7% 11.8% 4.9% B A A
VOLKSWAGEN (XET)
6.3% 9.1% -2.9% 10.7% 11.8% -1.1% C B B
Source: SG Equity Research (published in Feb 2008), Datastream and IBES consensus for average EBIT margins estimates (2008-2010) and (COE-g) over 2003-2008. * SG SRI ratings were published in March 2008, October 2007 (n-1) and August 2007 (n-2).
The link between profitability (EBIT margins) and cost of equity
Using our model, we found evidence that there was a solid correlation between profitability (measured in terms of EBIT margin) and the level of equity risk (measured by the cost of equity and then the implicit beta). The following chart combines average cost of equity over April 2003 to April 2008 as well as the average expected EBIT margins for the next three years from 2008 to 2011 (correlation factor of 42%, using all sub-sectors with at least five stocks, and excluding banks and real estate due to non-meaningful EBIT margins).
The relation between risk and profitability
Source: SG Equity Research (April 2008), Datastream and IBES consensus for EBIT margins estimates (2008-2010) and (COE-g) over 2003-2008
Relation between risk and profitability
SPECIALITY CHEMICALS
ELECTRICITY
PHARMACEUTICALS
BROADCASTING &
ENTERTAINMENT
FOOD RETAILERS &
WHOLESALERS
AUTOMOBILES
GENERAL MINING
INDUSTRIAL SUPPLIERS
MEDICAL EQUIPMENT
RESTAURANTS & BARS
STEEL
INDUSTRIAL MACHINERY
FOOD PRODUCTS
PUBLISHING
FIXED LINE
TELECOMMUNICATIONS
HEAVY CONSTRUCTION
LIFE INSURANCE
BUILDING MATERIALS &
FIXTURES
INTEGRATED OIL & GAS
OIL EQUIPMENT & SERVICES
BUSINESS SUPPORT
SERVICESCLOTHING & ACCESSORIES
AEROSPACEDIVERSIFIED INDUSTRIALS
5.0%
6.0%
7.0%
8.0%
9.0%
10.0%
11.0%
12.0%
4.0% 9.0% 14.0% 19.0% 24.0% 29.0% 34.0%
EBIT Margin
Co
st
of
Eq
uity -
g
Source: SG Equity Research (April 2008), Datastream and IBES consensus for EBIT margins estimates (2008-2010) and (COE-g) over 2003-2008

The materiality of climate change114
SRI-financial risk link only matters for companies with low profitability
Using only the top and the bottom of the class from our SG SRI ratings (i.e. top-rated companies with A’s and bottom-rated companies with D’s), we observe that the link between SRI ratings and the level of risk (as measured by our implicit beta) is only realised when we consider sectors with ‘low’ profitability as measured by EBIT margins (<15%). The link is much less meaningful and even sometimes reversed when we consider sectors with profitability above 15%.
Average COE-g by class of SRI rating / sector EBIT margin
SRI ratings Distance to sector EBIT margin average
Average sector EBIT margin
b) 5%-10% c) 10% - 15% d) 15% - 20% e) >20% Grand Total
A (best rated companies on SRI)
a) <-2.5% 8.8% 7.7% 11.1% 8.7 9.3
b) -2.5% / +2.5%
8.3% 7.6 7.4 6.8% 8.0
c) >2.5% 7.3% 8.1% 10.2 6.4% 8.3
Total 8.1% 7.7% 10.0% 7.3% 8.5%
D (worst rated companies on SRI)
a) <-2.5% 9.4 8.3% 9.4% 7.1% 8.1%
b) -2.5% / +2.5%
8.6 8.1% 7.6 6.6% 8.1%
c) >2.5% 8.7% 8.7 7.7 9.2 8.4%
Total 8.7% 8.3% 8.1% 7.4 8.2%
Total General (all ratings) 8.8% 8.4% 8.8% 7.4% 8.4%
Source: SG Equity Research (SRI ratings – released March 2008 – excluding Banks, Financial Services and Real Estate),Datastream/IBES consensus for average EBIT margins estimates (2008-2010)
11.4 Utilities
Type Financial report
Research firm Goldman Sachs
Region Americas
Analyst Michael Lapides
Title 1 Energy carbonomics—CO2 still not fully priced into power sector
Date May 2008
Region Europe
Analyst Andrew Mead
Title 2 2020 vision—Favour low carbon generators, cautious on high
carbon intensity
Date January 2008
AMWG commentary
Goldman Sachs’ utilities research teams have undertaken detailed assessments of the impacts of climate change policies on companies in both Europe and the US. Both reports outline the political environment in which legislation is being set, draw conclusions on probable outcomes and highlight investment implications at a stock level. Generators with gearing to new ‘clean’ generation capacity are naturally preferred.
In the US, it is difficult to estimate the date for the adoption of greenhouse gas legislation and many wrong moves are possible. That is why the author hopes for a less aggressive bill which

How finance copes with the ticking clock 115
might pass the Congress by next year. With carbon credit costs increasing, nuclear plants are going to benefit.
In Europe, the EU’s environmental and energy objectives for 2020 will be significant in shaping the future investments of the utility sector in power generation and the outlook for CO2 prices. To meet a target of a 20% reduction in GHG emissions, the EU will have to cut emissions by 530 mn tonnes CO2e (c.10% of 2005 emissions).
Extract 1
Energy carbonomics: CO2 still not fully priced into power sector
The politics of carbon matter
A middle ground between the competing carbon legislative proposals – is needed to attract the filibuster-proof 60 votes required in the US Senate to enact carbon legislation. Cost containment is still a critical path item to getting a deal done, with allocation levels and funding of various projects part of the eventual deal-making likely in Congress. Investors should recognize how complex and challenging passing greenhouse gas (GHG) legislation is, given the battle lines include: (1) debates along partisan as well as regional factions, (2) intra-party disagreement within key constituent groups, such as organized labor and environmental groups and (3) 2008 election year politics creating an overhang. Senate negotiators must navigate both partisan and regional differences to pass a carbon emissions scheme, while also balancing various interest groups. Democrats may face a unique challenge, as the carbon issue could pit two key constituencies—organized labor and environmental groups—on opposite sides and create intra-party turmoil. Generally, we believe a middle ground is necessary, one that can draw votes from Southern or Midwestern Congressional leaders, states where coal generation or mining has a significant presence.
We believe a bill slightly less aggressive than Lieberman-Warner has a good chance of passing Congress. The Lieberman-Warner bill, which targets setting a cap in 2012 using 2005 emissions levels, also includes: (1) 10% - 20% reductions in emissions levels in each decade through 2050, leveling off at 70% below 2005 levels and (2) approximately 19% of allocations given to power plants, declining to 0% by 2035. With a weakened US economy and with some estimates of the expected economic impact of this bill reaching near USD 160bn-250bn by 2015, we believe a less aggressive bill is likely to pass Congress in 2009/2010. As occurred in Europe, rules changes after initial implementation are possible and getting legislation passed in the next 2-3 years remains one of the more important policy decisions facing the US government.
Our USD/ton credit costs grow 5%/year and are relatively close to EIA/EPA base case 2020E – 2030E
Source: EIA, EPA, Goldman Sachs Research estimates.
Carbon credit costs increase as allocation levels decline Estimated allocation levels and USD/ton credit costs, 40 year outlook, beginning in 2014E
Source: Goldman Sachs Research estimates.
$0
$20
$40
$60
$80
$100
$120
$140
$160
$180
2020 2021 2022 2023 2024 2025 2026 2027 2028 2029 2030
Credit cost ($/ton) EPA - base
EIA - high
GS Est
EPA - high
EIA - base
0%
5%
10%
15%
20%
25%
30%
35%
40%
45%
50%
55%
60%
65%
2014 2018 2022 2026 2030 2034 2038 2042 2046 2050 2054
Allocation levels (%)
$0
$20
$40
$60
$80
$100
$120
$140
$160
$/ton credit cost
Allocation Level Cost Containment $/ton

The materiality of climate change116
Key assumptions the carbon regime outlined
in this Carbon Compromise include:
An initial ‘cap’ of USD 20/ton, with prices increasing beyond this after a cap expires. Analyses by the Environmental Protection Agency and Energy Information Administration, as shown in Exhibit 1 below forecast emission credit costs to rise to levels relatively near our assumptions in their base cases and significantly higher in other sensitivity analyses for years 30-50.
Allocation levels for fossil fuel plants could start at 60%, declining gradually. The initial target of emissions levels in 2012 for the power sector in the Bingaman-Specter bill implies allocation or allowance levels of ~80%, compared to 2006 emissions levels, while Lieberman-Warner proposed a much lower level. In our analysis, we simply assume a middle ground is reached on this issue. Mandated emissions reductions of 2% per year, beginning after a short ‘grace’ period. The Bingaman-Specter bill targets reductions of 1% - 2% per year through 2025, while the Lieberman-Warner package more aggressively incorporates average annual reductions of 2% - 3% per year through 2025 and increasing thereafter through 2050.
For modeling purposes, we conservatively estimate implementation of a carbon regime in 2014, although legislation is possible by YE 2010. We analyze a Carbon Compromise scenario that focuses on the existing merchant baseload coal and nuclear generation, as well as existing and planned merchant renewables.
We hold many other core factors constant. This enabled us to model the region-by-region impact on power prices for an extended time period and the impact of carbon on the existing asset bases for companies we cover. Critical items embedded in our analysis include:
The increase in power prices is likely greater in regions where coal generation currently sets the clearing price. We assume that the existing coal generation plants on the dispatch curve set the clearing price of power less frequently over time, with an annual decline of 1.5%. We utilize normalized natural gas and coal prices in this initial analysis.
Nuclear generators clearly benefit, while the downside for most coal
generators is less than many expect
Our analysis of a potential Carbon Compromise clearly shows the nuclear generators benefit, with significant uplifts to long-term EBITDA and a sizable NPV impact. As outlined below, the large nuclear generators in our coverage universe, Exelon and Entergy, both receive sizable long-term EBITDA benefits from implementation of the Carbon Compromise regime in 2014. The EBITDA impact, assuming normalized natural gas prices of USD 7/MMBtu, is modest in the near-term but expands significantly as: (1) the cost of the carbon credit increases by 5% annually, and (2) existing coal assets set the clearing price less frequently.
EBITDA improves significantly for nuclear merchant operators Entergy and Exelon Percent uplift from baseline 2012E EBITDA, assuming USD 7/MMBtu natural gas prices
Source: Company data, Goldman Sachs Research estimates.
Entergy (ETR, Neutral) Exelon (EXC, Conviction Buy)
0%
20%40%60%80%
100%120%140%
160%180%200%
2014 2017 2020 2023 2026 2029 2032 2035 2038 2041 2044 2047 2050 2053
Year
EBITDA impact
NPV = ~$22/sh
Palisades contract rolls off
0%
20%
40%
60%
80%
100%
120%
140%
160%
180%
2014 2017 2020 2023 2026 2029 2032 2035 2038 2041 2044 2047 2050 2053
Year
EBITDA impact
NPV = ~$26/sh

How finance copes with the ticking clock 117
Carbon will provide an uplift of ~25% from our current 2012 outlook for Entergy Nuclear’s EBITDA. Assuming USD 7/MMBtu gas prices and our carbon scenario, Entergy Nuclear would benefit from a ~25% uplift in EBITDA, from our 2012 forecast of USD 1.3bn to 1.7bn in year 1 (2014) of a carbon regime. In later years, the impact is greater, as the uplift is closer to 30% and 60% in 2020/2030 versus 2012 estimated levels.
Under this Carbon Compromise scenario, the NPV impact for merchant nuclear generators is dramatic. Assuming an ~8% cost of capital for Entergy and Exelon, and a tax rate of approximately 38%, we estimate the NPV of our base-case carbon outcome is roughly worth USD 22/sh for Entergy and USD 26/sh for Exelon, as detailed in Exhibit 8 below.
In our initial carbon scenario, coal generators actually benefit in the first 10-15 years due to higher power prices and allocations, but long-term EBITDA declines as allocations decrease, while emissions reductions and carbon costs rise. In the near-term, companies with coal generation may benefit from higher power prices and allocations. Assuming 60% allocation levels and other variables in our Carbon Compromise scenario, EBITDA is positively impacted in the near-term for many companies, as allocations enable these generators to capture the higher prices in the market without incurring higher costs on ~60% of their generation, while ~40% of MWh’s are negatively impacted initially. Over time, we expect the existing fleet of coal generation will remain economical until increasing costs of carbon credits, higher mandated emissions reductions and lower allocations force retirement, as outlined in the exhibit below.
Assuming constant USD 7/MMBtu gas prices, the impact of carbon regulation is likely greater on NRG Energy’s EBITDA, since natural gas more frequently sets the clearing price of power, especially in Texas. Even though NRG, in the Carbon Compromise, starts with similar allocations as the other merchant coal generators in our coverage universe, the negative impact on EBITDA occurs earlier and is larger. This is profound, especially in Texas, where gas sets the clearing price and therefore the higher market clearing price only partially offsets the cost of the carbon credit.
Coal generators expected to benefit initially, but EBITDA decline over time compared to 2012E levels Percentage improvement or decline from baseline 2012E EBITDA
Source: Goldman Sachs Research estimates.
Ameren (AEE, Neutral) Edison International (EIX, Neutral)
NRG Energy (NRG, Not Rated) Reliant (RRI, Buy)
-80%
-60%
-40%
-20%
0%
20%
40%
2014 2017 2020 2023 2026 2029 2032 2035 2038 2041 2044 2047 2050 2053
Year
EBITDA impact
NPV = ~($1)/sh
-80%
-70%-60%
-50%-40%
-30%-20%
-10%0%
10%20%
2014 2017 2020 2023 2026 2029 2032 2035 2038 2041 2044 2047 2050 2053
Year
EBITDA impact
NPV = ~($1)/sh
-80%
-60%
-40%
-20%
0%
20%
40%
2014 2017 2020 2023 2026 2029 2032 2035 2038 2041 2044 2047 2050 2053
Year
EBITDA impact
NPV = ~$(5)/sh
-80%
-60%
-40%
-20%
0%
20%
40%
2014 2017 2020 2023 2026 2029 2032 2035 2038 2041 2044 2047 2050 2053
Year
EBITDA impact
NPV = ~$(2)/sh
All plants shut down
PJM - NIHub plants shut down
Homer City shuts down
All plants shut down
Coal plants shut down
Nuclear plant uplift continues

The materiality of climate change118
NRG’s expected EBITDA, from our 2012 levels which excludes the impact of carbon regulation, declines faster, even as we assume the South Central contracts enable a pass-through during the current tenure of the contracts.
Extract 2
2020 vision: Favour low carbon generators, cautious on high carbon intensity
We believe the EU’s environmental and energy objectives for 2020 will be significant in shaping the future investments of the utility sector in power generation and the outlook for CO2 prices. We estimate that the current CO2 price is sufficient to achieve substantial reductions in the power sector’s emissions. On our estimates, policy support and favourable economics for renewable and nuclear investment should enable the power sector to cut its emissions by over 20% by 2020 (from 2005 levels).
EU policies support clean generation investment rather than CO2
price
EU’s objectives could mean a 15%-23% targeted cut in CO2 power sector emissions by 2020. The European Commission has set out its broad energy and environmental policy objectives for 2020: these targets have important implications for utilities, particularly the power generators. The EU has defined three main objectives:
n Emissions > 20%* reduction in green house gas emissions by 2020 vs 1990n Sustainability > 20% of energy consumption to come from renewable sources by 2020n Consumption > 20% increase in energy efficiency by 2020*Emissions reduction could be 30% if international agreement on GHG emission reductions can be reached
Policy changes will have material impacts on industry economics
EU polices combined with high power prices will lead to substantial new investment in low carbon generation such as renewables (principally wind) and nuclear, in our view. Policy support and the potential for proceeds from government auction of CO2 permits (in phase III of the ETS) to be used to subsidise clean generation could lead to sizeable investments by 2020 in renewables
Clean (nuclear) generators would benefit from higher CO2 prices and negatively impact the coal-fired operators % change to our price targets under a EUR 25/tonne CO2 price scenario (note Drax and BGY not based on price targets and live oil prices)
All price targets are 12-month, except for British Energy and DRAX, which are three-month. Source: Goldman Sachs Research estimates.
-15%
-10%
-5%
0%
5%
10%
Drax - GS assumptions
PPC RWE
Rokas Centrica
Scottish & Southern International Power
EDF Energies Nouvelles
Gas Natural
E.ON
Union Fenosa
CEZ A2A
EDP
Iberdrola Verbund
British Energy - GS
assumptions
Fortum
EDF
Coal-fired generators exposed to higher CO2 price
Nuclear generators benefit from higher CO2 price

How finance copes with the ticking clock 119
(estimated potential of EUR 245 bn) and nuclear power plants (EUR 60 bn); it could also be used to kick-start investment in CCS (carbon capture and storage). This change in the fuel mix by 2020 plus more efficient thermal plants (coal to gas switch and improved technologies on efficiencies) could help more than offset any increase in emissions caused by continued demand growth. We estimate that a 295 mn tonne (22%) reduction in power sector emissions could be achieved by 2020, from 2005 levels. This is before considering any impact from CO2 permits being imported from outside the EU (CERs), which could dampen the price further. Hence, we maintain our assumption of a CO2 price of EUR 20/tonne long term. More aggressive requirements to cut CO2 emissions by the EU could push CO2 prices higher.
We estimate that power sector investments in low carbon generation could meet the CO2 targets for 2020. However, as these projects will take time to commission, the market is likely to apply some risk aversion to this scenario until project commissioning is nearer. We believe shorter-term CO2 abatement costs, reflected by fuel switching from coal-fired generation to cleaner gas-fired output, would support a higher CO2 price of up to EUR 30/tonne, given current short-term gas and coal prices. In assessing the risk of a higher CO2 price, relative to our EUR 20/tonne assumption, the chart below illustrates the impact on our price targets for the impacted utilities from a EUR 5/tonne increase in the CO2 price from our assumption of EUR 20/tonne. As expected, the clean generators, mainly the nuclear power stocks such as EDF, Fortum, and British Energy are the most positively exposed to higher CO2 prices. The coal-fired generators, such as Drax, PPC and RWE are at risk from higher CO2 prices. Overall, the sector price targets do not change materially for a EUR 5/tonne move in the CO2 price as there are the offsetting impacts of higher CO2 emission costs versus a higher power price reflecting the increase in marginal generation costs.
Clean generation investment strategies may offer upside
Aside from the exposure of the existing clean generators to the EU policy, the impact could also be significant on the companies’ future investment strategies. We have estimated the companies’ investment profiles in new generation over the 15 years to 2020, given existing strategies, management comments and historic investment trends. Given the potential high IRRs from investments in renewables (wind projects) and new nuclear plants under our longer-term power price assumptions (EUR 60/MWh), our analysis suggests valuation upside in the potential investments in these low carbon generation assets. It may be here that there is upside to market expectations on longer-term returns from those investing in new nuclear assets. Potential new nuclear builders British Energy, CEZ, Enel, EDF and Fortum may have potential upside currently not reflected in share prices from these projects.
As a result of our analysis of the companies’ ability to generate investment upside and given individual exposure to higher CO2 prices, we would highlight British Energy (Conviction Buy List) and EDF (Buy) among the nuclear generators and Iberdrola (Conviction Buy List) as the renewable investment. We believe that EDP and Fortum are fairly valued relative to our price targets, but have potential upside if higher CO2 prices result in the short term. These companies also have a large exposure to future clean generation investments. Other utilities such as Acciona (NR), EDF EN (Neutral) and Rokas (Buy) also have significant investment strategies in renewable capacity. In our view, RWE, PPC and Drax have downside risk to higher CO2 prices and uncertainty as to whether the companies will be able to cut their emissions relative to the sector by 2020. We rate RWE Sell, PPC Neutral and Drax Buy.

The materiality of climate change120
11.5 Carbon impact (Australian stocks)
Type Financial report
Research firm Citi—Citigroup Global Markets Equity Research
Analyst Elaine Prior
Title 1 Carbon pollution reduction scheme—Impacts reviewed for ASX100
companies and more
Date July 2008
Analyst Elaine Prior
Title 2 Climate change and the ASX100—An assessment of risks and opportunities
Date November 2006
AMWG commentary
The first report reviews key aspects of the proposed Australian Carbon Pollution Reduction Scheme (CPRS), and implications for various industries and activities. The author examines the main characteristics of different sectors to identify those most affected by the Scheme. The outcome is a well-organised map of the investment risks and opportunities in the Australian stock market.
This paper’s focus is on the energy intensive trade exposed industries. In order to quantify potential impacts on companies, it has been generally assumed that they acquire emission permits to fulfill their CRPS obligations, whereas the real expectation is that companies will make investments or change operating practices to physically reduce emissions.
The second report interestingly selects the winners in four different scenarios determined by carbon policies on the one side, mild or severe weather impact on the other.
Extract 1
Carbon pollution reduction scheme
We present emissions data and scoping analysis for about 60 mainly ASX100 companies. We conclude that scheme detail is materially important to perhaps a quarter of these companies. For the others, the potential impact appears to be <2% of valuation, often < 1% of value.
n We conduct detailed analysis of several companies that are trade exposed and may also qualify as emissions intensive
n We list potential scheme application to each ASX100 company, plus several other companies that are likely to be particularly exposed to the nature of the regulation, and/or have provided greenhouse emissions data
Analysing energy intensive trade exposed (EITE) companies
For each company, we have:
n Estimated the quantity of Australian emissions attributable to trade exposed activitiesn Estimated the quantity of these emissions that may qualify for free permits under EITE criteria,
either 90% or 60% initial free allocationn Estimated a rate of decline of free permit allocation, based on an assumed trajectory for the
overall scheme cap—assuming that free allocations decline in line with scheme capn Calculated the quantity of emissions attributable to trade exposed activities that must be
purchasedn Assumed that carbon prices increase steadily between 2011 and 2020n Calculated the permit purchase cost for each year 2011 to 2020; and an after tax cost (assuming
a 30% tax rate)n Discounted after tax cost of these permits to mid 2008, using a discount rate of 10%

How finance copes with the ticking clock 121
The three carbon price and scheme trajectory scenarios are set out in Figure 1. The findings are summarised in Figure 2.
Figure 1. Scenarios investigated—2020 emissions targets and corresponding carbon prices
Carbon price 2011 (AUD/t)
Carbon price 2020 (AUD/t)
Target 2020, % of 1990 level
Base case 20 50 90
Lenient scheme 10 30 100
Stringent scheme 20 80 80
Source: Citi Investment Research
Figure 2. Potential cost impact of CPRS as percentage of market capitalisationSource: Citi Investment Research and Analysis
Figure 3. Winners and companies most ‘at risk’
Source: Citi Investment Research and Analysis
-4%
-2%
0%
2%
4%
6%
8%
AluminaBoral
Bluescope Steel
Iluka (60% assistance)Iluka (90% assistance)
Newcrest
Orica (60% assistance)Orica (90% assistance)
Orica (90% assistance & N2O redn)
OneSteel (B/f only qualifies)OneSteel (B/f & EAF qualify)Oxiana (OXR+ZFX-smelters)
Paperlinx (Aust paper only) (60% assist)Paperlinx (Aust paper only) (90% assist)
Woodside
Lenient Case Base Case Stringent Case
Potential Cost Impact of CPRS as Percent of Market Capitalisation
-8 -6 -4 -2 0 2 4 6 8
RIO TintoOneSteel
IlukaCaltex
Bluescope SteelBHP
ZinifexWoodside
TransurbanToll Holdings
SantosQBE Insurance
Centro PropertiesWesfarmers
Telstra Lihir Gold
Leighton HoldingsFosters
DCA GroupAluminaOxiana
Lion NathanInsurance Australia Group
Goodman FielderCoca-Cola Amatil
TabcorpSymbion
ComputershareBoral
Billabong Sonic Health Care
NABSigma Pharmaceuticals
ANZ BankCFS RetailWestpac
MirvacAMP
StocklandMacquarie Office
DB RREEFCommonwealth Property
GPT GroupAGL
Lend LeaseSims Group
Origin EnergyInvesta Property
WINNERS
AT RISK

The materiality of climate change122
Extract 2
Climate change and the ASX100
Key findings
Winners include alternative energy, sustainable property, recycling, innovative financial institutions and, in the longer term, some healthcare companies.
Those at risk include emissions-intensive companies, facilities particularly exposed to severe weather damage, agriculture, and water-intensive industry exposed to drought and, in the longer term, insurers that may misprice catastrophe risk.
The chart includes those companies with sufficient information for overall ranking. Positive scores indicate winners; negative scores indicate those at risk. A zero score is neutral.
Figure 4. Winners and companies at risk under different scenarios
Winners At risk
Carbon scenarios AGL Energy AMP ANZ Bank Babcock & Brown Infr Boral (C1) CFS Retail Property Commonwealth Property CSR (C1) DB RREEF Trust Futuris GPT Group Investa Property Lend Lease Lihir Gold (C1) Macquarie Office Mirvac Group National Aust Bank Origin Energy Sims Group (C2) Stockland Westpac Bank WorleyParsons (C2)
Alumina (C2) BHP Billiton (C2) Bluescope Steel (C2) Caltex Australia (C2) Iluka Resources (C2) Leighton Holdings (C2) OneSteel (C2) Qantas Airways (C2) Rio Tinto (C2) Toll Holdings (C2) Transurban (C2) Zinifex (C2)
Physical scenarios AGL Energy Boral (P2) Insurance Australia (P1) Origin Energy (P2) Sigma Pharmaceutical (P2) Sonic Healthcare (P2)
ANZ Bank (P2) BHP Billiton (P2) Centro Properties (P2) CFS Retail Property (P2) Coca-Cola Amatil (P2) Commonwealth Bank (P2) CSR (P2) Fosters (P2) Futuris (P1) Goodman Fielder (P2) GPT Group (P2) Insurance Australia (P2) Lihir Gold (P2) Lion Nathan (P2) Mirvac Group (P2) National Aust Bank (P2) QBE Insurance (P2) Santos Wesfarmers (P2) Westpac (P2) Woodside Petroleum

How finance copes with the ticking clock 123
Carbon scenarios
n Scenario Carbon-1 > Australia adopts a limited carbon trading scheme that is not onerous to trade-exposed industries. It remains outside the Kyoto system. Some existing Australian state-based schemes coexist with this new national scheme and others are merged into it
n Scenario Carbon-2 > A widespread global cost of carbon. Australia adopts a trading scheme with wider coverage
Physical impact scenarios
n Scenario Physical-1 > Physical impacts are relatively gradual, including more frequent drought, heatwaves, and severe weather events. This is broadly in line with CSIRO’s projected impacts for temperature increases of less than 2°C, tabled later in this report
n Scenario Physical-2 > Severe weather events, drought, floods, and spread of disease accelerate faster than expected. A multitude of companies could be affected, so we have been selective in our assessment of those most affected
Potential winners under Scenario Carbon-1
n Banks and financial services companies that assess and manage carbon risk while embracing new loan, carbon trading and advisory, or SRI investment opportunities (AMP, Westpac, ANZ, NAB)
n Energy companies exposed to gas and renewables (Origin, AGL, Babcock & Brown). n Several property trusts that proactively manage building sustainability (Investa, Lend
Lease, Commonwealth Property, DB RREEF, Macquarie Office, Stockland, GPT, CFS Retail, Mirvac). Mirvac also has forestry exposure
n Sims Group due to the lower emissions intensity of recycled products n Forestry businesses with sequestration benefits (Futuris) n Companies able to earn carbon credits by cutting industrial emissions (Boral, potentially
Wesfarmers, Orica, Bluescope) or alternative power initiatives (Lihir)
Figure 5. Theoretical annual CO2 liability as % of market Capitalisation @ AUD 20/tonne pretax, Net AUD 14/tonne post tax
Figure 1. Theoretical Annual CO2 Liability as % of Market Capitalisation @ $20/Tonne Pretax, Net
A$14/Tonne Post Tax
0%
1%
2%
3%
4%
Blue
scop
e St
eel
Iluka
OneSt
eel
AGL
Alum
ina
(e)
Bora
l
Orica
Origin E
nerg
y
Sant
os (e
)
BHPCa
ltex
Leight
on H
olding
s (e
)
Zinife
x
Rio
Tint
o
Wes
farm
ers
Newcr
est
Goodm
an F
ielder
(e)
Lihir G
old
Sim
s Gro
up
Toll Hol
ding
s (e
)
Woo
dside
Oxiana
Com
mon
wealth
Pro
perty
(e)
Lion
Nat
han
(e)
Mac
quar
ie O
ffice
(e)
Telst
ra
GPT G
roup
(e)
CFS
Reta
il (e
)
Tabc
orp
(e)
Inve
sta
Prop
erty
DCA G
roup
Fost
ers
Mirv
ac
Coca
-Cola
Amat
il
Stoc
kland
Pape
rlinx
(e)
Tran
surb
an (e
)
Insu
ranc
e Aus
tralia G
roup
Bram
bles
(e)
NAB
ANZ Ba
nk (e
)
Wes
tpac
Com
mon
wealth
Ban
k (e
)
AMP
Source: Citigroup Investment Research

The materiality of climate change124
At risk under Scenario Carbon-1
n Coal exporters that may see falling demand or downwards price pressure due to carbon restrictions in customer markets (BHP, Rio Tinto)
Potential winners under Scenario Carbon-2
n The winners under Scenario Carbon-1n Companies that supply uranium or engineering services to a growing nuclear power
industry (BHP, Rio Tinto, WorleyParsons)n Companies that successfully implement carbon sequestration or low emissions
tech nologies, or whose customers implement these technologies, to support their fossil fuels businesses (potentially BHP, Rio Tinto, Santos, Woodside)
n Renewable fuel producers (CSR, potentially Caltex)
At risk under Scenario Carbon-2
n Coal producers, unless sequestration or other clean coal technologies are implemented (BHP, Rio Tinto)
n Emissions intensive industry that might be penalised under a severe emissions trading scheme (Bluescope, OneSteel, AGL, Iluka, Alumina, Boral, Orica, Santos, BHP, Caltex, Leighton, Zinifex, Wesfarmers, Rio Tinto)
n Aluminium companies reliant on fossil fuel energy, particularly coal, that may rise higher on the cost curve. Anticipated strong aluminium demand for lightweight transport solutions is an offsetting positive (Alumina, Rio Tinto, BHP)
n Exposure to higher fuel costs (Toll Holdings) n Reduced demand for air travel by individuals and corporate seeking to reduce their
greenhouse footprint, or carbon cost imposts on airlines (Qantas)n Companies exposed to potential cuts in vehicle use due to higher fossil fuel costs (Transurban,
Caltex)n Companies apparently less able to reduce building energy costs (Centro Properties,
DCA Group)
In reality, we expect that companies will not have to pay for all their carbon, as scheme design is likely to have various exclusions.
Physical climate related risks and opportunities
Near-term impacts appear likely to relate to drought, warmer average weather, heatwaves, and occasional severe weather events. In the longer term, severe weather events pose risks to property and facilities, with potential spread of tropical disease. Increasing flood risk in various major coastal cities and delta regions around the world, including China, could reduce economic growth and demand for imports of commodities
Potential winners under Scenario Physical-1
n Companies benefiting from higher energy demand for air conditioning (Origin, Santos, AGL).
At risk under Scenario Physical-1
n Companies dependent on processing water including many basic manufacturing, mining, and some consumer products companies (Iluka, Boral, CC Amatil, Lion Nathan, Fosters)
n Companies dependent on agricultural inputs or demand from agricultural sector (Lion Nathan, Fosters, Wesfarmers). However, these companies are likely to adapt or pass on higher input prices.

How finance copes with the ticking clock 125
n Rural services business that could suffer from a weaker agricultural sector (Futuris)
Potential winners under Scenario Physical-2
n Health care companies that benefit from increasing tropical disease (Sigma, Sonic)
n Companies that produce heavier building materials (Boral)
At risk under Scenario Physical-2
n Insurers exposed if the industry fails to adequately price increasing catastrophe risks (IAG, QBE). However, these companies may successfully adapt their businesses to mitigate against climate risks
n Companies with facilities exposed to severe weather risk—e.g. offshore oil rigs, tropical mines, infrastructure (BHP, Transurban, Woodside, Santos, Telstra, Lihir)
n Companies with property interests in higher risk geographies of Queensland, or assets that may suffer from disruption to Queensland tourism (Mirvac, Centro Properties, CFS Retail, GPT Group)
n Companies particularly exposed to spread of disease in developing countries (BHP)
n Banks exposed to asset value deterioration, or that ease usual terms of business to maintain reputation in times of disaster (ANZ, CBA, NAB, Westpac)
11.6 Investing in climate change—A portfolio approach
Type Financial report
Region Global
Research firm Deutsche Asset Management
Analyst Mark Fulton
Title Investing in climate change
Date April 2009
AMWG commentary
Key notes
n In the long run, climate change is a mega trend which will persist.
n In the short run, climate-friendly stocks may lead the economic recovery due to the support of governmental regulations and fiscal stimuli
n Institutional investors may simply add climate change-based investments to their portfolio to enhance the diversification of their investments
Extract
Climate change strategies give the investor a concentrated exposure to a major economic force. Government regulation, economic and market trends, and the development of new technologies are acting in concert as drivers of adaptation to, and mitigation of, the impacts of climate change. The confluence of these factors has resulted in a broad and deep investment universe that not only takes advantage of these trends, but reflects a necessary shift in the organization of the global economy.
By investing across many asset classes, including alternatives, a diversified portfolio may reduce overall portfolio volatility and correlation to the broad public markets. Including climate change sectors in an investment portfolio through proper asset allocation can improve the risk/return

The materiality of climate change126
profile for investors while giving them exposure to a transformation of the economy that has the potential to be on the level of the Industrial Revolution.
Market demand and supply
According to the International Energy Agency (IEA), renewable energy sources have the potential to comprise 46% of total electricity supply by 2050. The IEA finds that USD 45 trillion of investment will be needed from present day through 2050 to meet growing renewable energy demand, and a GHG reduction target of 50% from 2005 levels by 2050. Capital would need to be heavily deployed into the development of next-generation technologies to create energy efficiency and low carbon options. The world population is also expected to grow to over 9 billion in 2050, causing significant effects on food and energy resources. Driven by higher inevitable demand, water, agriculture and other resource depletion will lead to carbon emissions and climate change as key consequences. Therefore the need for further investment into climate change sectors is critical.
In 2008, the clean technology sector saw approximately USD 155 billion of new worldwide investment, a 5% increase from 2006 levels, according to New Energy Finance. Investment capital was allocated across a number of markets: research & development, VC/PE, project/asset financing and public markets. The rise in clean technology investment over the past year depicts a greater interest in the advancement of next-generation technologies and renewable energy capacity in areas outside developed nations. While this is a good start for deploying capital into climate change markets, it falls short of the funds needed to avert catastrophic climate change. As investors, we will continue to deploy capital into these sectors and therefore expect significant growth to continue.
Fundamental attributes of the climate change universe
Climate change sectors—Economic and financial attributes
Many sectors of the economy that give rise to significant investment opportunities often have low correlation to the broader economy. This is true for climate change-related sectors
Broadly speaking, we have recently witnessed three key periods of development in climate change markets
1. The time period from Jan 2006-Nov 2007 mostly saw a bull market in commodity and equity

How finance copes with the ticking clock 127
markets and a sharp rise in the climate change universe, as measured by the HSBC Climate Change Index. The outperformance by the climate change universe indicates that markets were responding to the broader economic demand of adapting to and mitigating climate change, generating excess returns.
2. From Nov 2007-May 2008, there was a correction and then a recovery for both climate change and equity markets in general. During this period, the correlation with oil and commodities broke down, as the latter exploded in price.
3. In relative terms, the climate change universe suffered a severe correction from May 2008-Sept 2008. This correction has elements of a “liquidity squeeze” and a number of hedge funds that held renewable stocks liquidated early in Sept 2008. In this period, however, most of the market became highly correlated with the broad sell-off.
The climate change sector that was most influenced by energy and oil prices is the renewable energy sector. We would expect that prices for renewable energy stocks are positively correlated with oil prices. However, as oil prices begin to drop, that correlation should break down as prices for renewables are buffered by the subsidies that support these companies. Any changes in the view on subsidies would of course affect this correlation.
Applying climate change to different asset classes
The climate change universe has different attributes that lend themselves to certain asset classes. The risk/return profile as well as investment time horizon vary for each asset class. Key asset classes are associated with a set of climate change attributes to match their suitability. Investment attributes provide background for different asset classes, and climate change sectors offer opportunities across all stages of the investment spectrum from venture capital through to listed equities.
Listed equities
Listed equities offer investment opportunities in established and new companies across a broad range of sectors and market capitalizations, and are for the most part highly liquid. In the DWS Climate Change Alpha Pool, which is the global pool of investable stocks used by the DWS Climate Change mutual funds, we have identified and tracked over 1,000 companies that fall within the scope of climate change-related themes. In terms of alpha generation, we have already looked at the 2006-2007 bull run where climate change generated out-performance. The out-performance by the climate change universe indicated that markets were responding to the broader economic demand of adapting to and mitigating climate change, and this was a source of excess return. In 2008 about 40% of the excess returns generated by climate change in 2006/2007 were lost on the downside. However, the regulatory support, along with the longer term need for the products and services responding to climate change, indicates to us that as the dust settles, even with a period of weaker energy prices, climate change investments have the potential to outperform.
Measuring carbon’s role in portfolios
In addition to investing in companies active in mitigation and adaptation, integrating climate change parameters such as carbon risk into the overall investment process in listed equities has emerged as a new opportunity. Investors in listed equities can assess the degree to which portfolios are subject to climate change risk by addressing carbon intensity of different industry sector exposures, individual company risk positioning and carbon financials (e.g., the costs of compliance). Going further and explaining the “risk” scale of the equation, investors could enhance climate change investments by including carbon leaders in the portfolio and avoiding or shorting carbon laggards.

The materiality of climate change128
Private capital (private equity / venture capital)
Private equity (PE) and venture capital (VC) have other attributes that are attractive for climate change investors. First, this asset class is the first sector to pick up emerging technology cycles. VCs typically invest in innovations around specific technologies, and they ultimately seek to be invested in disruptive technologies that can change whole industries. For example, many VCs have been investing in cellulosic biofuel technologies, thin-film solar and smart grid technologies. As technologies mature, private equity investors step in and provide expansion capital in order for start-up companies to take their products to market.
Infrastructure investing
Changing demographics and economic development are driving demand for improved infrastructure. Climate change enhances this growing demand and therefore the risk/return profile of any investment. Demand for energy will continue to increase, driven by fundamentals like a growing population and rapid development. Due to historical under-spending on public infrastructure in energy, water, and transportation, climate change regulations will make the supply/demand imbalance more acute.
Climate change portends new constraints and opportunities for infrastructure developers and therefore investors. For example, electric utilities are now faced with Renewable Portfolio Standards, and new efficiency standards are leading to smart grid installations. Parking garages and storage facilities are now being outfitted with solar cells in order to feed energy back onto the grid. Constraints on water resources as a result of climate change will challenge water infrastructure developers. Successful infrastructure fund managers will have a unique understanding of potential regulatory arbitrage across jurisdictions, as well as a keen understanding of the global interplay between traditional energy generating sources, renewable energy sources, and the impact of a future price for carbon.
Clean energy in particular offers investment opportunities that will fit well with infrastructure funds’ risk/reward investment profiles. Clean energy developments can offer investors a fixed income stream, as they typically sell their generated energy through attractive power purchase agreements with established creditable counterparties. Another area in which climate change investors are interested is transmission and distribution (T&D). T&D assets provide many of the investment characteristics desired by infrastructure investors. The opportunities for climate change investors are widespread, including all-encompassing electricity grids and power generation, energy storage, and water infrastructure.
Sustainable timberland and forestry investing—Reforestation
Forests offer the climate change investor the opportunity to sequester carbon and even potentially derive valuable and tradable carbon credits. The key to this is using a sustainable approach to managing the forest and ensuring that the end use of the timber reduces carbon emissions (e.g. second generation biofuels, housing, furniture). Reforestation of degraded lands would be particularly positive for carbon sequestration. Therefore, from a climate change perspective, forestry and timberlands offer a tremendous opportunity for investing.
Timberland investing offers uncorrelated returns with financial assets historically, and also has served as an inflation hedge. Like real estate, timberland investors are able to invest in both timberland focused funds, pure play timber companies, and in the actual timberland itself. Timberland is generally differentiated from basic real estate investments, insofar as it is focused on the production of timber, a saleable asset. Unlike farmland, owners of timberland can choose to delay harvesting the wood on their land. The long-term nature of timberland investing often matches the investment goals of the long-term pension liabilities it serves. Moreover, the biological growth of the forest of 5-15% per year and the harvest decision as a valuable option are also advantages of this investment. Over the long run, both inflation and timberland returns have

How finance copes with the ticking clock 129
been positively correlated, and the class is often cited as an inflation hedge, especially against unexpected levels of inflation.
The key takeaway for institutional investors is that climate change investing is a mega trend, will persist and may lead the economic recovery due to support of governmental regulations and fiscal stimulus. Secondly, while many opportunities for investments are necessary, financing of projects may prove challenging until lending returns to the market place. Additionally, there are stand-alone opportunities for investments and an institutional investor may simply add climate change-based investments to their portfolio to enhance the diversification of their investments.

The materiality of climate change130
12 Acknowledgements
Project team
UNEP Finance Initiative
Paul Clements-Hunt Butch Bacani
Head Programme Officer, UNEP Finance Initiative Insurance & Investment UNEP Finance Initiative
UNEP FI Asset Management Working Group
Gianluca Manca Marlys Appleton
Project Lead & AMWG Co-Chair Vice President & Chair,Head of Sustainability & Global Non-Profit Business Sustainability Steering CommitteeEurizon Capital AIG InvestmentsIntesa Sanpaolo Group
Dr Julie Fox Gorte Eugenia Buosi
AMWG Co-Chair Equity Research, S&RISenior Vice President for Sustainable Investing Santander Brasil Asset ManagementPax World Management Corp.
The AMWG is indebted to the following institutions for granting us permission to feature their financial analyst research in this publication:
The AMWG also extends its sincere appreciation to the following institutions and individuals for their important contribution and support:
n Barclays Capital and Nomura International, for giving us full authorisation on the intellectual property of the two Lehman Brothers reports featured in this publication
n Attorney Carlo Ilmari Cremonesi, Founding Partner of Lead Law Office in Italy, for helping us better understand the functioning of international copyrights; Attorney Alberto
Longo of Studio Avvocati Longo in Milan, Italy for his dedicated assistance and support
n Edizioni Ambiente Milano, for contributing text from their book, Clima istruzioni per l’uso
n Anna Mudeva, journalist at Reuters Thompson, for the authorisation to use parts of their publications and articles
n Dr John Llewellyn of Llewellyn Consulting and Andrew Howard of Goldman Sachs, for providing much enthusiasm and support for this publication
n Finally, Dr Andrew Dlugolecki of Andlug Consulting ([email protected]), for assisting greatly with the final shaping and updating of this publication
n CA Cheuvreux
n Citigroup Global Markets
n Deutsche Asset Management
n Goldman Sachs—GS Sustain
n HSBC Bank plc
n Oddo Securities
n Société Générale
n UBS Investment Bank
n WestLB

How finance copes with the ticking clock 131
13 About UNEP FI and its Asset Management Working Group
United Nations Environment Programme Finance Initiative
UNEP FI is a strategic public-private partnership between UNEP and the global financial sector. UNEP works with over 180 banks, insurers and investment firms, and a range of partner organisations, to understand the impacts of environmental, social and governance issues on financial performance and sustainable development. Through a comprehensive work programme encompassing research, training, events and regional activities, UNEP FI carries out its mission to identify, promote and realise the adoption of best environmental and sustainability practice at all levels of financial institution operations.
Learn more at: www.unepfi.org E-mail: [email protected]
UNEP FI Asset Management Working Group
The UNEP FI Asset Management Working Group is a global platform of asset managers that collaborate to understand the ways that environmental, social and governance (ESG) issues can affect investment value, and to advance the integration of ESG issues into investment decision-making and ownership practices.
Member institutions Country
Acuity Investment Management CanadaAIG Investments United StatesAviva Investors United KingdomBNP Paribas Asset Management FranceCalvert Investments United StatesClearBridge Advisors United StatesEurizon Capital (Intesa Sanpaolo Group) ItalyGroupama Asset Management FranceHenderson Global Investors United KingdomHSBC Global Asset Management FranceMitsubishi UFJ Trust & Banking Corp. JapanNikko Asset Management JapanPax World Management Corp. United StatesRCM United KingdomSantander Brasil Asset Management Brazil
Co-Chairs
Gianluca Manca Dr Julie Fox Gorte
Head of Sustainability & Senior Vice President for Global Non-Profit Business Sustainable InvestingEurizon Capital Pax World Management Corp.Intesa Sanpaolo Group
Advisor
Carlos Joly
Former AMWG Co-Chair

The materiality of climate change132
Members
Rachel Davies CFA Martin Grosskopf
Investment Analyst Portfolio Manager & Director,Acuity Investment Management Sustainability Research Acuity Investment Management
Marlys Appleton Dr Steve Waygood
Vice President & Chair, Head of Sustainability Research Sustainability Steering Committee & EngagementAIG Investments Aviva Investors
Jacky Prudhomme Paul Hilton CFA
Senior Analyst, SRI Director, Advanced Equities Research BNP Paribas Asset Management Calvert Investments
Mary Jane McQuillen Olivier Rayrole
Director & Portfolio Manager SRI AnalystSocially Aware Investment Groupama Asset ManagementClearBridge Advisors
Antony Marsden Xavier Desmadryl
Manager, Corporate Governance Global Head of SRI ResearchHenderson Global Investors HSBC Global Asset Management
Masahiro Kato Yoshitaka Akamatsu Senior Manager Managing Director Investment Research & Planning Division & Chief Operating OfficerMitsubishi UFJ Trust & Banking Corp. Nikko Asset Management
Akitsugu Era Lawrence Prager Analyst, Equity Research Group Head of Equity Research Nikko Asset Management Nikko Asset Management
Barbara Evans Eugenia Buosi
Sustainability Research Analyst Equity Research, S&RI RCM Santander Brasil Asset Management
Pedro Angeli Villani
RI Equities, Portfolio ManagerSantander Brasil Asset Management
Learn more at: www.unepfi.org/work_streams/investment/amwgE-mail: [email protected]

How finance copes with the ticking clock 133

Un
it
ed
n
at
io
ns
e
nv
ir
on
me
nt
P
ro
gr
am
me
www.unep.orgUnited Nations Environment Programme
P.O. Box 30552 Nairobi, KenyaTel.: ++254-(0)20-62 1234Fax: ++254-(0)20-62 3927E-mail: [email protected]
The
ma
teria
lity o
f clim
ate
cha
ng
e
United Nations Environment Programme
Finance Initiative (UNEP FI)
UNEP FI is a strategic public-private
partnership between UNEP and the
global financial sector. UNEP works
with over 180 banks, insurers and
investment firms, and a range of
partner organisations, to understand
the impacts of environmental, social
and governance issues on financial
performance and sustainable
develop ment. Through a
comprehensive work programme
encompassing research, training,
events and regional activities,
UNEP FI carries out its mission to
identify, promote and realise the
adoption of best environmental and
sustainability practice at all levels of
financial institution operations.
International Environment House
15 Chemin des Anémones
1219 Chatelaine, Geneva, Switzerland
Tel: (41) 22 917 8178
Fax: (41) 22 796 9240
www.unepfi.org
UNEP job n° DTI/1205/GE
The materiality of climate changeHow finance copes with the ticking clockA report by theAsset Management Working Group of the United Nations Environment Programme Finance Initiative
The third iteration of the AMWG’s ‘Materiality Series’
October 2009


![Climate Finance Gaps and Challenges - UNESCAP 5. Climate finance gaps...Climate Finance Gaps and Challenges ... protection, disaster risk reduction) ... Lending interest rate [%] OECD](https://img.pdfslide.us/doc/110x75/5ab54ce47f8b9a156d8ca701/climate-finance-gaps-and-challenges-5-climate-finance-gapsclimate-finance.jpg)